Embed Size (px)
Citation preview
Lachat Applications in Standard Methods 21st Edition
December 2008
Data Pack

Lachat Standard Methods Datapack Page 1 of 69 lme rev1 01/07/09
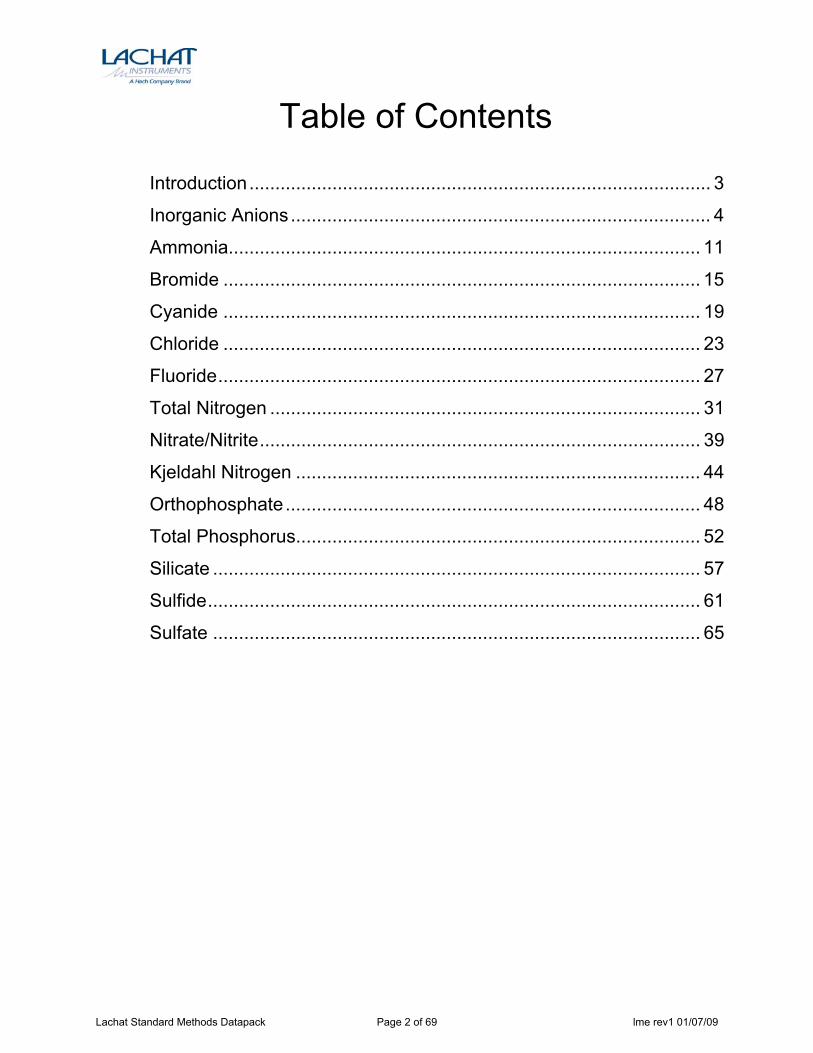
Table of Contents
Introduction......................................................................................... 3
Inorganic Anions................................................................................. 4
Ammonia........................................................................................... 11
Bromide ............................................................................................ 15
Cyanide ............................................................................................ 19
Chloride ............................................................................................ 23
Fluoride............................................................................................. 27
Total Nitrogen ................................................................................... 31
Nitrate/Nitrite..................................................................................... 39
Kjeldahl Nitrogen .............................................................................. 44
Orthophosphate................................................................................ 48
Total Phosphorus.............................................................................. 52
Silicate .............................................................................................. 57
Sulfide............................................................................................... 61
Sulfate .............................................................................................. 65
Lachat Standard Methods Datapack Page 2 of 69 lme rev1 01/07/09
Introduction The Lachat Instruments Applications team has developed many methods contained in Standard Methods, 21st Edition. Lachat recognizes Standard Methods as an important regulatory consensus body and has actively worked with this organization to develop methods that meet the standards of APHA, AWWA, WEF, and other internationally recognized authorities on water and wastewater quality. This Data Pack provides an example of the available application information for each of the parameters in which Lachat has developed methods contained in Standard Methods, 21st Edition. A comprehensive list of all Lachat Methods is available upon request (see contact information below). Lachat recommends that users always check with their local regulatory authority to ensure a method meets their individual reporting requirements. For technical assistance, custom method development requests, price information, and ordering, please contact Lachat Instruments: In the US: (800) 247-7613 International: (970) 669-3050 On the Web: www.lachatinstruments.com E-mail for Support [email protected] E-mail for Sales [email protected]
Lachat Standard Methods Datapack Page 3 of 69 lme rev1 01/07/09
Inorganic Anions by Ion Chromatography
Lachat QuikChem method number 10-510-00-1-A
(SM 4110 B) Ion Chromatography with Chemical Suppression of Eluent Conductivity
Inorganic Anions in Waters and Solid Extracts USEPA 300.0 Part A
0.05 to 5 mg F-/L
0.50 to 50 mg Cl-/L 0.05 to 5 mg NO2
--N/L 0.05 to 5 mg Br-/L
0.05 to 5 mg NO3--N/L
0.05 to 5 mg HPO42--P/L
1.0 to 100 mg SO42-/L
– Principle – This is a chemically-suppressed, ion chromatography (IC) method. The anions are separated based on their affinities toward the stationary phase in the column. A suppressor cartridge, packed with high-capacity cation exchange resin, chemically suppresses the background conductance of the eluent and, at the same time, converts the anionic species into species of higher conductance. The method provides results that are equivalent to those of USEPA method 300.0 Part A, Standard Methods 4110 B, and those of ISO methods 10304-1 and 10304-2.
– Interferences – See Section 4 of the method for information on interferences.
– QuikChem Method 10-510-00-1-A – DETERMINATION OF ANIONS IN WATERS AND SOLID EXTRACTS
1. SCOPE AND APPLICATION 1.1 The method covers the determination of the following inorganic anions:
Bromide Nitrite-N Chloride Ortho-Phosphate-P Fluoride Sulfate Nitrate-N
1.2 The matrices applicable to this method are as follows: Drinking water, surface water, mixed domestic and industrial wastewaters, groundwater, reagent waters, solids (using the extraction procedure given in section 8.5), and leachates (when no acetic acid is used).
Lachat Standard Methods Datapack Page 4 of 69 lme rev1 01/07/09
1.3 The single laboratory Method Detection Limits (MDL defined in Section 3.10) for the above analytes
are listed in Table 1, Section 17.3.1 of this method. The MDL for a specified matrix may differ from those listed, depending upon the nature of the sample.
1.4 The range tested for each anion is as follows: Analyte Range, mg/L bromide, fluoride, nitrite-N, nitrate-N, σ-phosphate-P
0.05 to 5
chloride 0.5 to 50 sulfate 1 to 100
Note: The calibrated range for this method is two orders of magnitude. These ranges were based on a 100 μL sample loop. 1.5 This method is recommended for use only by analysts experienced in the use of ion chromatography
and in the interpretation of the resulting ion chromatogram. 1.6 When this method is used to analyze unfamiliar samples for any of the above anions, anion
identification should be supported by the use of a fortified sample matrix covering the anions of interest. The fortification procedure is described in Section 9.
1.7 Bromide and nitrite react with most oxidants employed as disinfectants for drinking waters. The utility of measuring these anions in treated water should be considered prior to conducting the analysis.
1.8. Users of the method data should state the data-quality objectives prior to analysis. Users of the method must demonstrate the ability to generate acceptable results with this method, using the procedures described in Section 9, Quality Control.
– Support Data for USEPA method 300.0 Part A – Table 1. Method Detection Limits for Inorganic Anions in Reagent Water
Analyte Known Conc. (mg/L)
Determined Conc. (mg/L)
Std. Dev. (mg/L)
MDL (mg/L)
PQL (mg/L)
Fluoride 0.02 0.023 0.001 0.004 0.01 Chloride 0.025 0.038 0.001 0.004 0.01 Nitrite-N 0.02 0.026 0.002 0.008 0.02 Bromide 0.05 0.050 0.006 0.018 0.05 Nitrate-N 0.02 0.025 0.001 0.004 0.01 Phosphate-P 0.04 0.046 0.004 0.012 0.04 Sulfate 0.05 0.074 0.004 0.012 0.04 Note: The instrument was calibrated by including the MDL standard in the calibration model (Section 7.11). Seven replicates of a
standard were analyzed. The MDL equals the standard deviation of the determined values for seven replicate runs multiplied by 3.142, corresponding to a 99% confidence value. The PQL (practical quantitation limit) equals the standard deviation multiplied by 10.
Table 2. Single-Operator Accuracy and Precision of Standard Anions (Seven replicates of each sample were analyzed) Sample Mean Standard Analyte Type Spike Recovery Deviation mg/L -- % -- - mg/L -
Bromide RW 0.5 100 0.006 DW 0.5 96 0.007 SW 0.5 96 0.031 WW 0.5 101 0.006 GW 0.5 97 0.021 SD 0.9 97 0.022
Chloride RW 5.0 92 0.061 DW 5.0 102 0.285
Lachat Standard Methods Datapack Page 5 of 69 lme rev1 01/07/09
SW 5.0 103 2.295 WW 5.0 101 0.544 GW 5.0 98 0.440 SD 9.1 92 0.329
Fluoride RW 0.5 100 0.006 DW 0.5 101 0.022 SW 0.5 100 0.036 WW 0.5 100 0.010 GW 0.5 91 0.029 SD 0.9 91 0.029
Nitrate-N RW 0.5 99 0.007 DW 0.5 99 0.011 SW 0.5 100 0.058 WW 0.5 99 0.006 GW 0.5 96 0.023 SD 0.9 100 0.029
Nitrite-N RW 0.5 98 0.006 DW 0.5 92 0.006 SW 0.5 90 0.028 WW 0.5 88 0.007 GW 0.5 94 0.020 SD 0.9 101 0.027
O-Phosphate-P RW 0.5 98 0.009 DW 0.5 94 0.009 SW 0.5 98 0.054 WW 0.5 98 0.008 GW 0.5 98 0.034 SD 0.9 99 0.041
Sulfate RW 10.0 93 0.152 DW 10.0 103 0.576 SW 10.0 98 1.034 WW 10.0 103 0.291 GW 10.0 101 3.340 SD 18.2 100 0.558 RW; Reagent Water, WW; Wastewater, DW; Drinking Water, GW; Groundwater, SW; Surface Water, and SD; Solid (soil sample was used; soil-water extract prepared using the procedure described in USEPA method 300.0).
Lachat Standard Methods Datapack Page 6 of 69 lme rev1 01/07/09
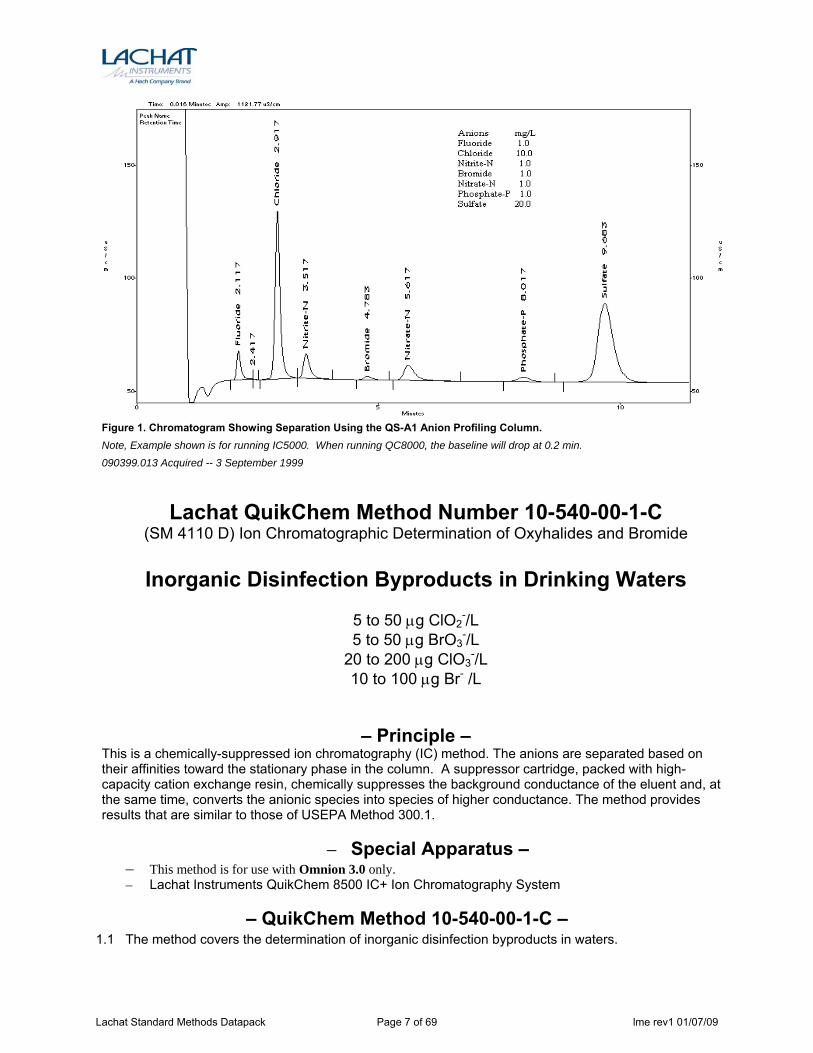
Figure 1. Chromatogram Showing Separation Using the QS-A1 Anion Profiling Column. Note, Example shown is for running IC5000. When running QC8000, the baseline will drop at 0.2 min.
090399.013 Acquired -- 3 September 1999
Lachat QuikChem Method Number 10-540-00-1-C (SM 4110 D) Ion Chromatographic Determination of Oxyhalides and Bromide
Inorganic Disinfection Byproducts in Drinking Waters
5 to 50 μg ClO2
-/L 5 to 50 μg BrO3
-/L 20 to 200 μg ClO3
-/L 10 to 100 μg Br- /L
– Principle – This is a chemically-suppressed ion chromatography (IC) method. The anions are separated based on their affinities toward the stationary phase in the column. A suppressor cartridge, packed with high-capacity cation exchange resin, chemically suppresses the background conductance of the eluent and, at the same time, converts the anionic species into species of higher conductance. The method provides results that are similar to those of USEPA Method 300.1.
– Special Apparatus – – This method is for use with Omnion 3.0 only. – Lachat Instruments QuikChem 8500 IC+ Ion Chromatography System
– QuikChem Method 10-540-00-1-C –
1.1 The method covers the determination of inorganic disinfection byproducts in waters.
Lachat Standard Methods Datapack Page 7 of 69 lme rev1 01/07/09
1.2 The matrices applicable to this method are as follows: Finished and raw drinking waters.
1.3 The single laboratory Method Detection Limits (MDL defined in Section 3.11) for chlorite, bromate, chlorate, and bromide in reagent water are 2.61, 1.15, 5.00, and 2.01 μg/L respectively. The MDL for a specified matrix may differ from those listed, depending upon the nature of the sample.
1.4 The range tested for this anion is as follows: Analyte Range, μg/L Analyte Range, μg/L
Chlorite 5 to 50 Chlorate 20 to 200 Bromate 5 to 50 Bromide 10 to 100
Note: The calibrated range for this method is 10-fold. These ranges were based on a 200 μL sample loop. 1.5 This method is recommended for use only by analysts experienced in the use of ion
chromatography and in the interpretation of the resulting ion chromatogram. 1.6 When this method is used to analyze unfamiliar samples, peak identification should be supported by
the use of a fortified sample matrix covering the anions of interest. The fortification procedure is described in Section 9.4.
1.8 Users of the method data should state the data-quality objectives prior to analysis. Users of the method must demonstrate the ability to generate acceptable results with this method, using the procedures described in Section 9.
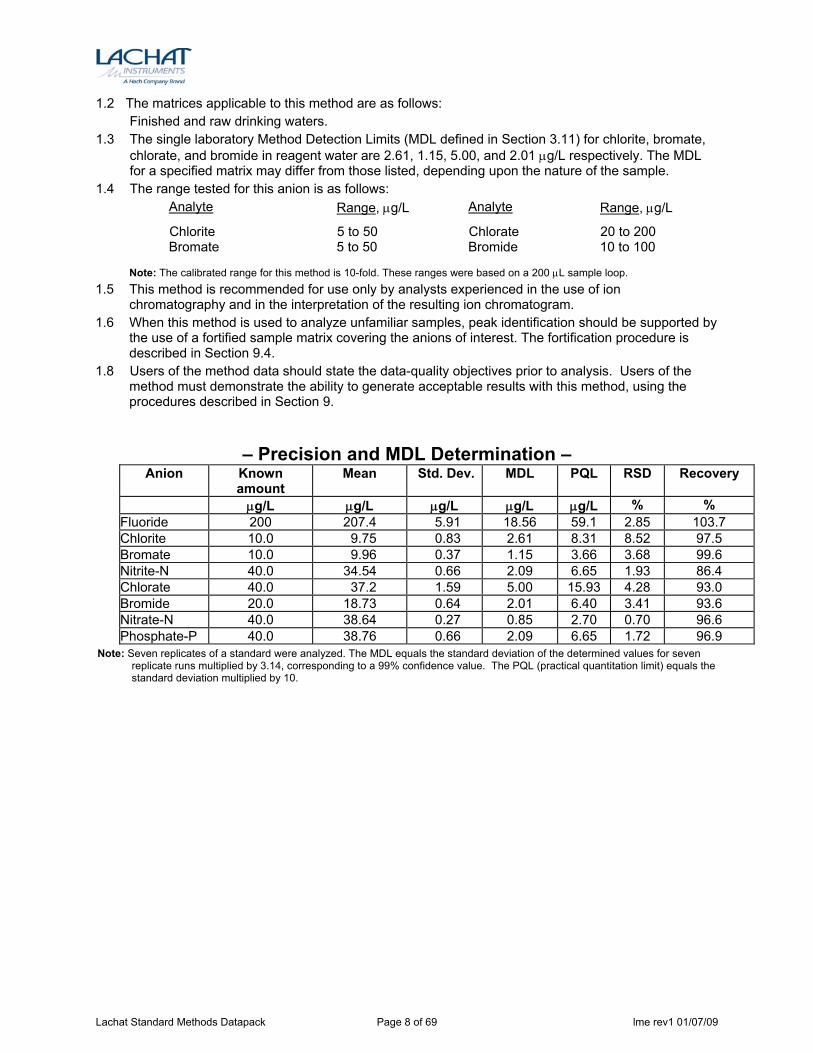
– Precision and MDL Determination – Anion Known
amount Mean Std. Dev.
MDL PQL RSD Recovery
μg/L μg/L μg/L μg/L μg/L % % Fluoride 200 207.4 5.91 18.56 59.1 2.85 103.7 Chlorite 10.0 9.75 0.83 2.61 8.31 8.52 97.5 Bromate 10.0 9.96 0.37 1.15 3.66 3.68 99.6 Nitrite-N 40.0 34.54 0.66 2.09 6.65 1.93 86.4 Chlorate 40.0 37.2 1.59 5.00 15.93 4.28 93.0 Bromide 20.0 18.73 0.64 2.01 6.40 3.41 93.6 Nitrate-N 40.0 38.64 0.27 0.85 2.70 0.70 96.6 Phosphate-P 40.0 38.76 0.66 2.09 6.65 1.72 96.9
Note: Seven replicates of a standard were analyzed. The MDL equals the standard deviation of the determined values for seven replicate runs multiplied by 3.14, corresponding to a 99% confidence value. The PQL (practical quantitation limit) equals the standard deviation multiplied by 10.
Lachat Standard Methods Datapack Page 8 of 69 lme rev1 01/07/09
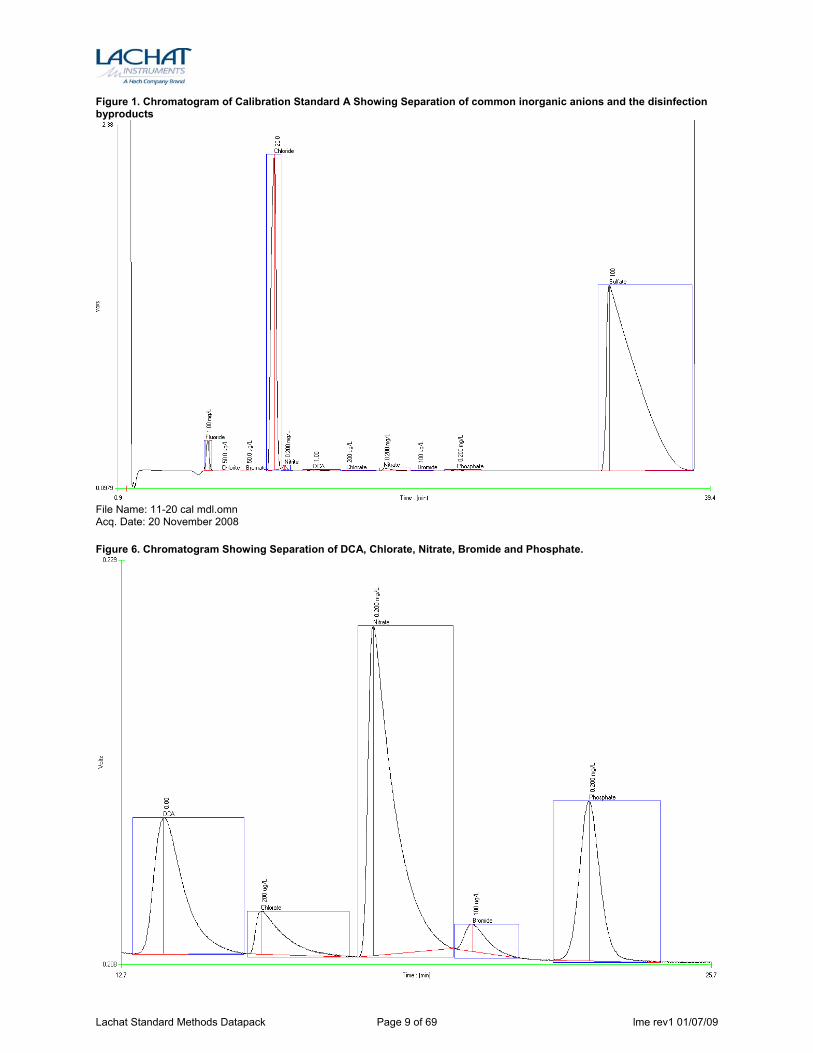
Figure 1. Chromatogram of Calibration Standard A Showing Separation of common inorganic anions and the disinfection byproducts
File Name: 11-20 cal mdl.omn Acq. Date: 20 November 2008 Figure 6. Chromatogram Showing Separation of DCA, Chlorate, Nitrate, Bromide and Phosphate.
Lachat Standard Methods Datapack Page 9 of 69 lme rev1 01/07/09
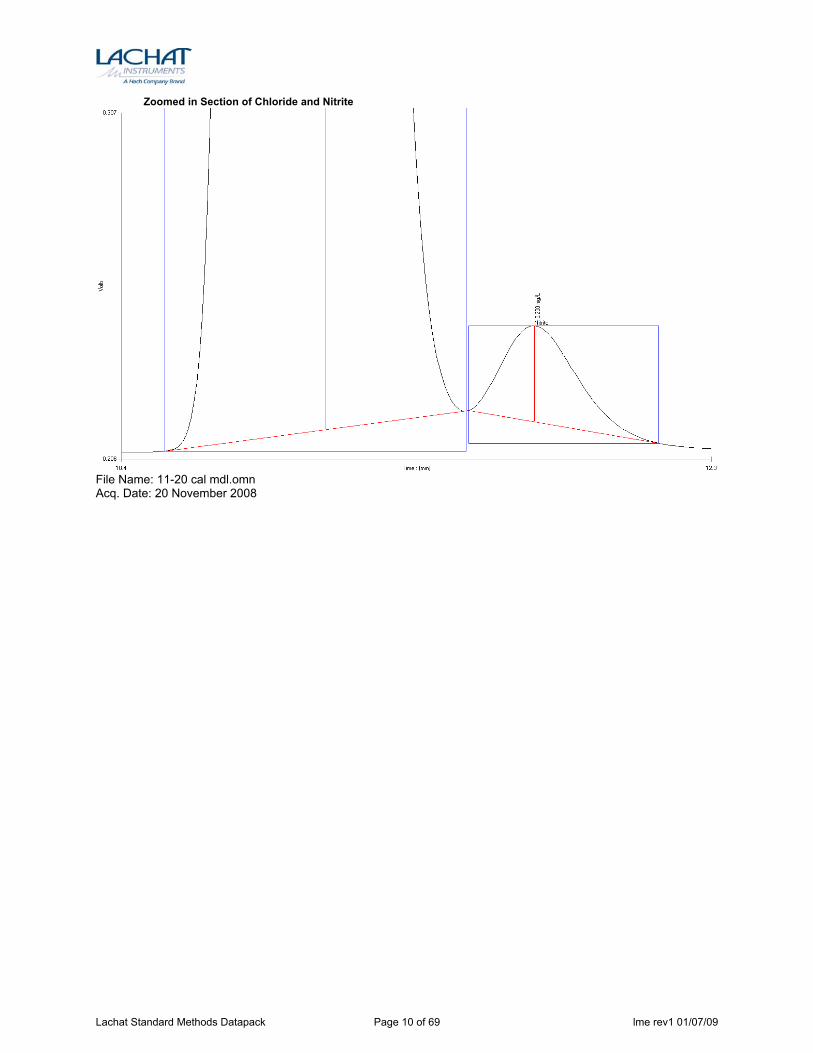
Zoomed in Section of Chloride and Nitrite
File Name: 11-20 cal mdl.omn Acq. Date: 20 November 2008
Lachat Standard Methods Datapack Page 10 of 69 lme rev1 01/07/09
Ammonia
Lachat QuikChem® Method 10-107-06-1-J SM 4500 NH3 H. Flow Injection Analysis
Ammonia (Phenolate) in Potable and Surface Waters
0.01 to 2.0 mg N/L as NH3
– Principle – This method is based on the Berthelot reaction. Ammonia reacts with alkaline phenol, and sodium hypochlorite to form indophenol blue. Sodium nitroprusside (nitroferricyanide) is added to enhance sensitivity. The absorbance of the reaction product is measured at 630 nm, and is directly proportional to the original ammonia concentration in the sample. If distillation is required the sample is buffered at a pH of 9.5 with a borate buffer to decrease hydrolysis of cyanates and organic nitrogen compounds, and is distilled into a solution of boric acid.
– Interferences – 1. Calcium and magnesium ions may precipitate if present in sufficient concentration. Tartrate or
EDTA is added to the sample in-line in order to prevent this. 2. Color, turbidity, and certain organic species may interfere. Turbidity is removed by manual
filtration. Sample color may be corrected for by running the samples through the manifold without color formation.
3. Cyanate, which may be encountered in certain industrial effluents, will hydrolyze to some extent even at a pH of 9.5 at which distillation is carried out.
4. Residual chlorine must be removed by pretreatment of the sample with sodium thiosulfate or other reagents before distillation.
5. Method interference may be caused by contaminants in the reagent water, reagents, glassware, and other sample processing apparatus that bias analyte response.
6. Eliminate any marked variation in acidity or alkalinity among samples because intensity of measured color is pH – dependent. Likewise, ensure that pH of standard ammonia solutions approximates that of sample.
– Special Apparatus –
Please contact Lachat Technical Support for Ordering Information
1. Heating Unit Lachat Part No. A85X00 (X=1 for 110V, X=2 for 220V) 2. PVC PUMP TUBES MUST BE USED FOR THIS METHOD
Lachat Standard Methods Datapack Page 11 of 69 lme rev1 01/07/09
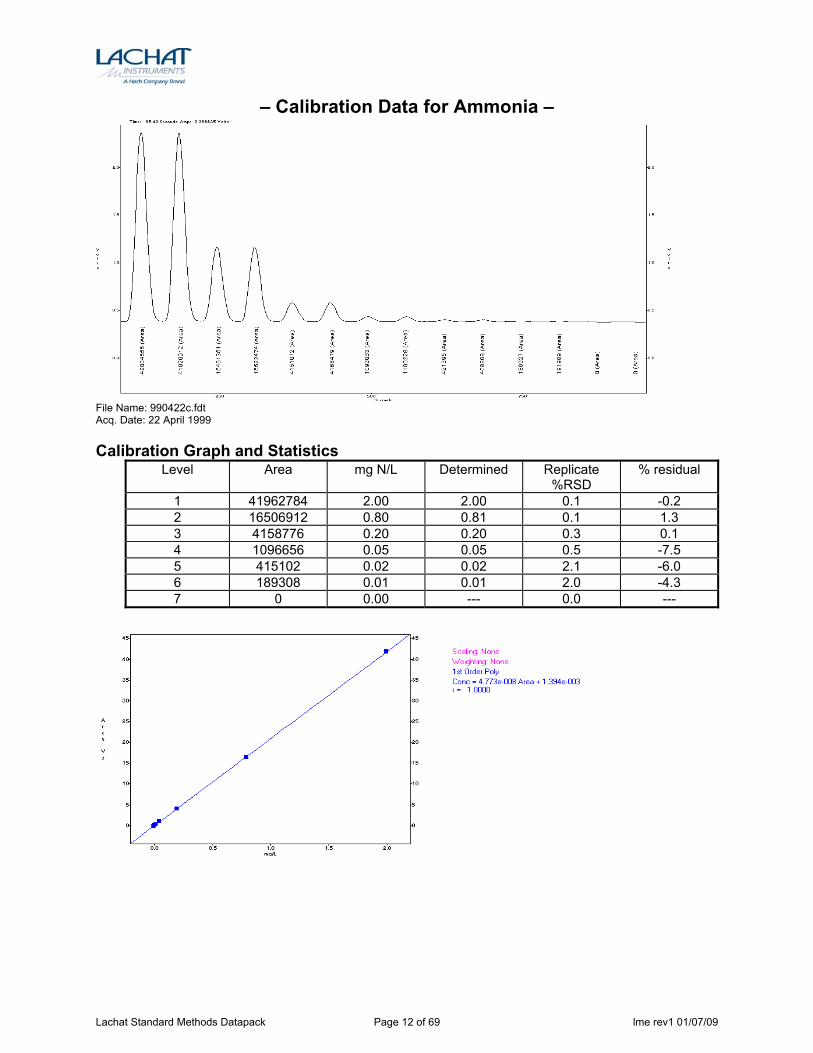
– Calibration Data for Ammonia –
File Name: 990422c.fdt Acq. Date: 22 April 1999 Calibration Graph and Statistics
Level Area mg N/L Determined Replicate %RSD
% residual
1 41962784 2.00 2.00 0.1 -0.2 2 16506912 0.80 0.81 0.1 1.3 3 4158776 0.20 0.20 0.3 0.1 4 1096656 0.05 0.05 0.5 -7.5 5 415102 0.02 0.02 2.1 -6.0 6 189308 0.01 0.01 2.0 -4.3 7 0 0.00 --- 0.0 ---
Lachat Standard Methods Datapack Page 12 of 69 lme rev1 01/07/09
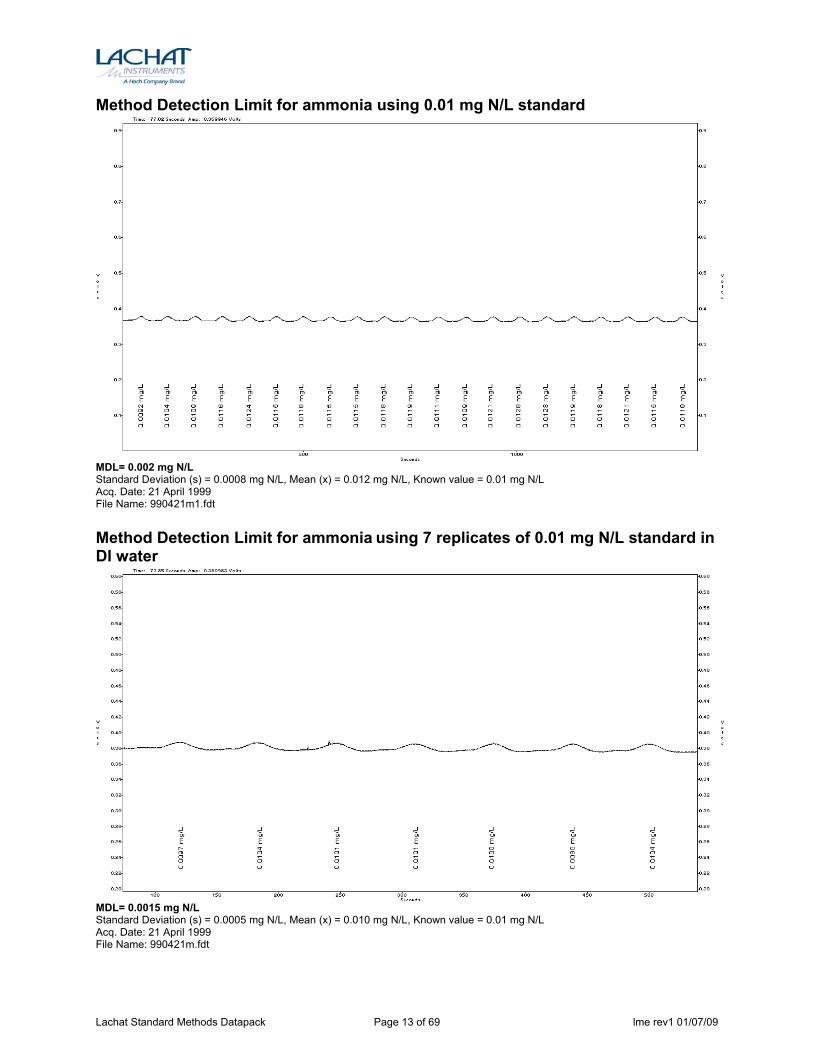
Method Detection Limit for ammonia using 0.01 mg N/L standard
MDL= 0.002 mg N/L Standard Deviation (s) = 0.0008 mg N/L, Mean (x) = 0.012 mg N/L, Known value = 0.01 mg N/L Acq. Date: 21 April 1999 File Name: 990421m1.fdt Method Detection Limit for ammonia using 7 replicates of 0.01 mg N/L standard in DI water
MDL= 0.0015 mg N/L Standard Deviation (s) = 0.0005 mg N/L, Mean (x) = 0.010 mg N/L, Known value = 0.01 mg N/L Acq. Date: 21 April 1999 File Name: 990421m.fdt
Lachat Standard Methods Datapack Page 13 of 69 lme rev1 01/07/09
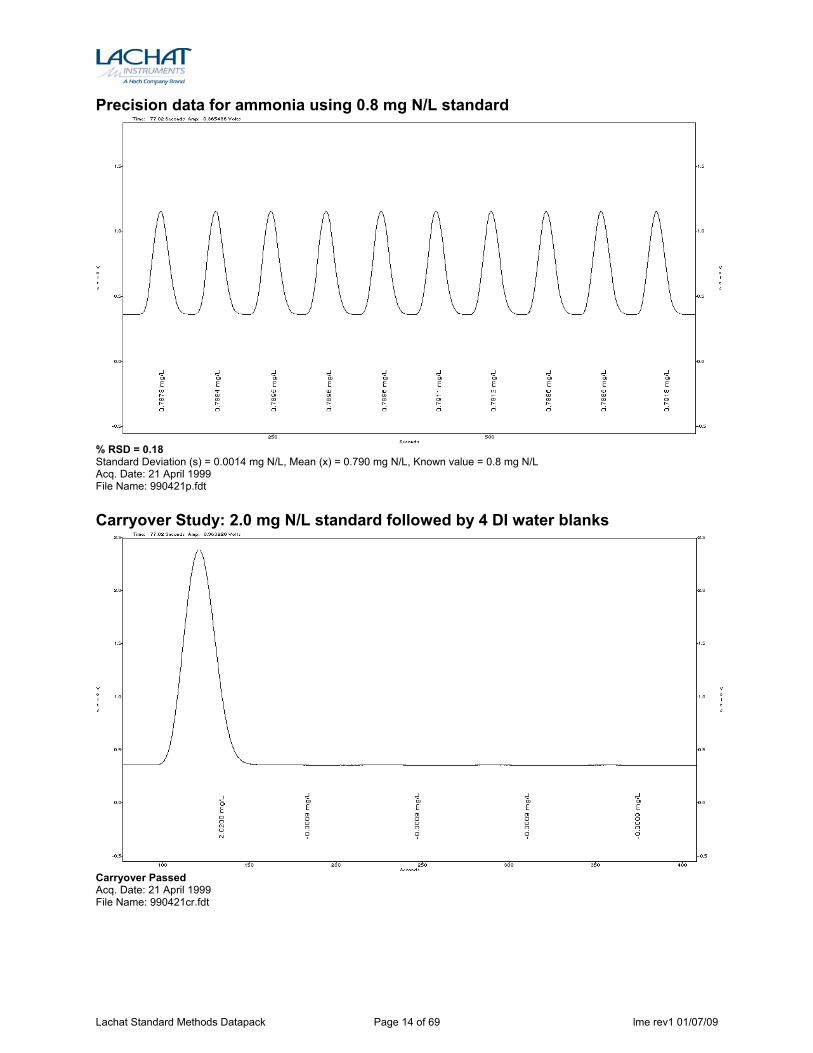
Precision data for ammonia using 0.8 mg N/L standard
% RSD = 0.18 Standard Deviation (s) = 0.0014 mg N/L, Mean (x) = 0.790 mg N/L, Known value = 0.8 mg N/L Acq. Date: 21 April 1999 File Name: 990421p.fdt Carryover Study: 2.0 mg N/L standard followed by 4 DI water blanks
Carryover Passed Acq. Date: 21 April 1999 File Name: 990421cr.fdt
Lachat Standard Methods Datapack Page 14 of 69 lme rev1 01/07/09
Bromide
Lachat QuikChem® Method 30-135-21-1-A SM 4500 Br- D. Flow Injection Analysis
Bromide in Brackish Waters
Low Flow Method
0.5 to 10.0 mg Br/L
– Principle – Bromide is oxidized to bromine by chloramine-T, followed by substitution of bromine on phenol red to produce bromophenol blue. The absorbance measured at 590 nm is proportional to the concentration of bromide in the sample. Sodium thiosulfate is added to reduce interference from chloride.
– Interferences – 1. Choride interference is reduced by the addition of sodium thiosulfate. Chloramine-T dissociates
in aqueous solution to form hypochlorous acid. The hypochlorous acid can then react with chloride, causing substitution of chloride at positions ortho to the hydroxy groups on phenol red, just as bromination. Sodium thiosulfate reacts with chlorine to reduce this interferent. 5000 mg Cl/L gave a positive inferference of 0.15 mg Br/L (See Method Support Data, Section 11.3).
–QuikChem® Method 30-135-21-1-A –
1. This method covers the determination of bromide in waters containing up to 20,000 mg Cl/L. 2. This includes drinking, ground, and surface waters, as well as domestic and industrial wastes.
This method determines total bromide or if the sample is filtered through a 0.45 micron pore size filter, the result is termed dissolved bromide. The difference between the result of a sample determined directly and filtered is termed insoluble bromide.
3. The applicable range is 0.5 to 10.0 mg Br/L. The method detection limit is 0.005 mg Br/L. The method throughput is 72 injections per hour.
4. Choride interference is reduced by the addition of sodium thiosulfate. Chloramine-T dissociates in aqueous solution to form hypochlorous acid. The hypochlorous acid can then react with chloride, causing substitution of chloride at positions ortho to the hydroxy groups on phenol red, just as bromination. Sodium thiosulfate reacts with chlorine to reduce this interferent. 5000 mg Cl/L gave a positive interference of 0.15 mg Br/L. (See Method Support Data)
5. Samples must be free of turbidity. Filtration through paper or a 0.45 uM membrane is recommended for turbid samples.
Lachat Standard Methods Datapack Page 15 of 69 lme rev1 01/07/09
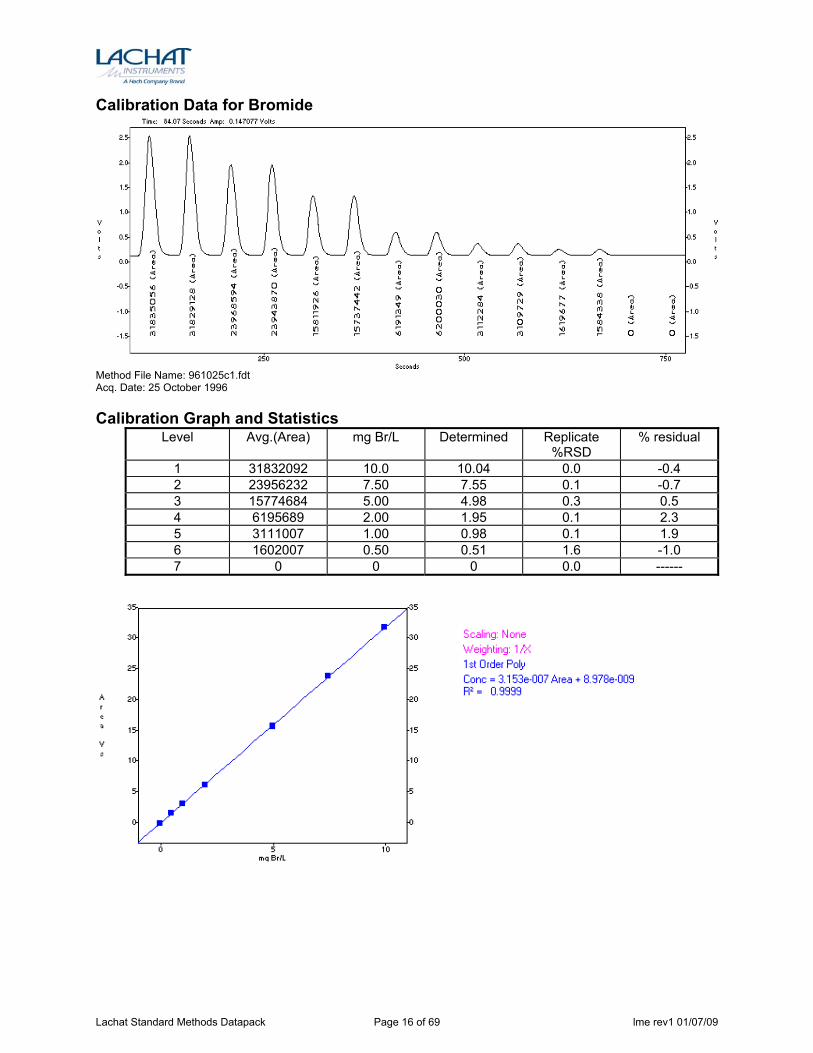
Calibration Data for Bromide
Method File Name: 961025c1.fdt Acq. Date: 25 October 1996 Calibration Graph and Statistics
Level Avg.(Area) mg Br/L Determined Replicate %RSD
% residual
1 31832092 10.0 10.04 0.0 -0.4 2 23956232 7.50 7.55 0.1 -0.7 3 15774684 5.00 4.98 0.3 0.5 4 6195689 2.00 1.95 0.1 2.3 5 3111007 1.00 0.98 0.1 1.9 6 1602007 0.50 0.51 1.6 -1.0 7 0 0 0 0.0 ------
Lachat Standard Methods Datapack Page 16 of 69 lme rev1 01/07/09
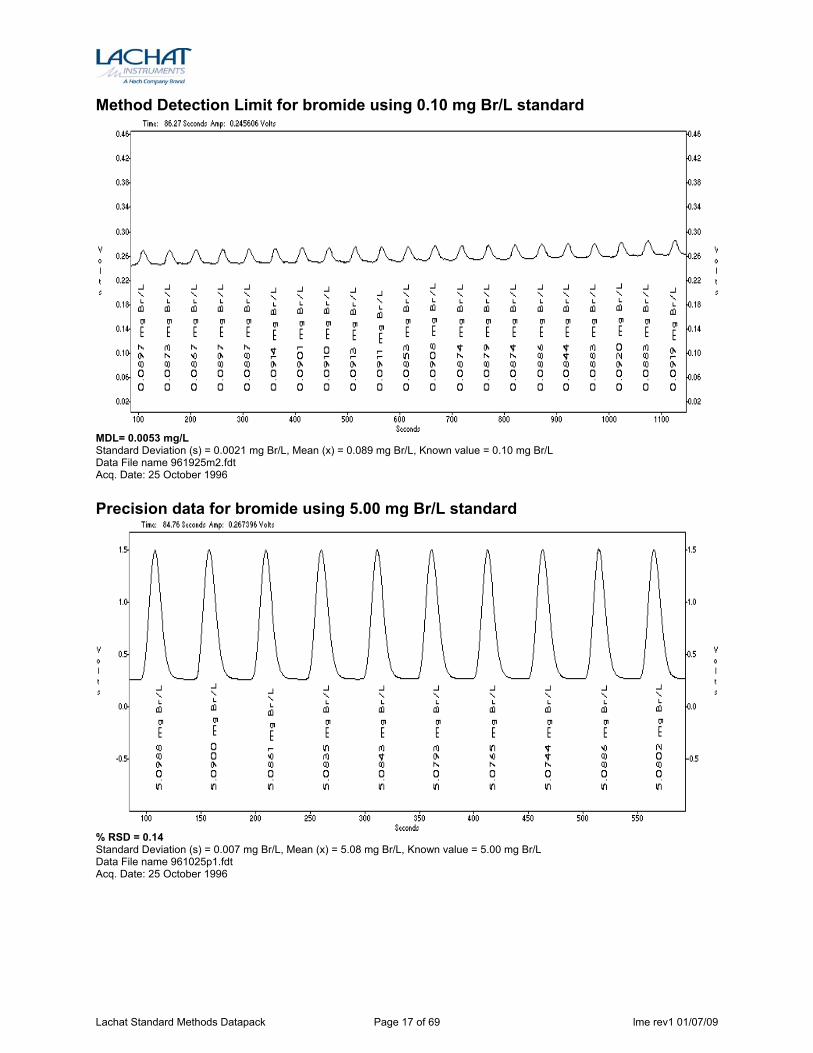
Method Detection Limit for bromide using 0.10 mg Br/L standard
MDL= 0.0053 mg/L Standard Deviation (s) = 0.0021 mg Br/L, Mean (x) = 0.089 mg Br/L, Known value = 0.10 mg Br/L Data File name 961925m2.fdt Acq. Date: 25 October 1996 Precision data for bromide using 5.00 mg Br/L standard
% RSD = 0.14 Standard Deviation (s) = 0.007 mg Br/L, Mean (x) = 5.08 mg Br/L, Known value = 5.00 mg Br/L Data File name 961025p1.fdt Acq. Date: 25 October 1996
Lachat Standard Methods Datapack Page 17 of 69 lme rev1 01/07/09
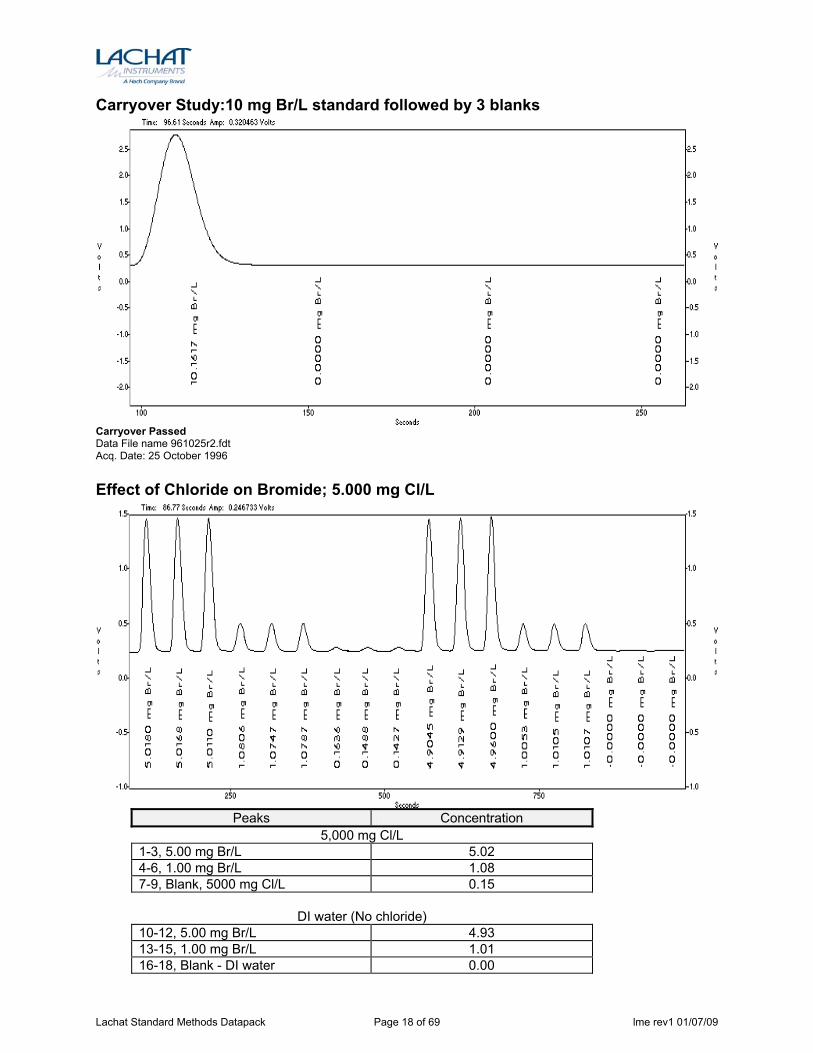
Carryover Study:10 mg Br/L standard followed by 3 blanks
Carryover Passed Data File name 961025r2.fdt Acq. Date: 25 October 1996 Effect of Chloride on Bromide; 5.000 mg Cl/L
Peaks Concentration
5,000 mg Cl/L 1-3, 5.00 mg Br/L 5.02 4-6, 1.00 mg Br/L 1.08 7-9, Blank, 5000 mg Cl/L 0.15
DI water (No chloride) 10-12, 5.00 mg Br/L 4.93 13-15, 1.00 mg Br/L 1.01 16-18, Blank - DI water 0.00
Lachat Standard Methods Datapack Page 18 of 69 lme rev1 01/07/09
Cyanide
Lachat QuikChem® Method 10-204-00-1-A SM 4500 CN- Total Cyanide after distillation, by Flow Injection Analysis
Determination of Cyanide (Macro Distillation Method) in
Waters
0.005 to 0.500 mg CN-/L
– Principle – The cyanide as hydrocyanic acid (HCN) is released from cyanide complexes by means of a manual reflux-distillation operation and absorbed in a scrubber containing sodium hydroxide solution. The cyanide ion in the absorbing solution is converted to cyanogen chloride by reactions with Chloramine-T that subsequently reacts with pyridine and barbituric acid to give a red-color complex. Absorbance of this at 570 nm complex is proportional to cyanide concentration in the sample.
– Interferences – 1. For strong acid dissociable and weak acid dissociable cyanide, non-volatile interferences are
eliminated or minimized by the distillation procedure. 2. Some of the known interferences are aldehydes, nitrate-nitrite, and oxidizing agents, such as
chlorine, thiocyanide, thiosulfate, and sulfide. Multiple interferences may require the analysis of a series of laboratory fortified sample matrices (LFM) to verify the suitability of the chosen treatment. See Standard Methods section 412A referenced in Section 16. for details of preliminary sample treatment to remove volatile interferences.
– Special Apparatus –
Please contact Lachat Technical Support for Ordering Information
1. Heater Module (Lachat Part No. A85100/A85200) 2. Macro Distillation setup
Lachat Standard Methods Datapack Page 19 of 69 lme rev1 01/07/09
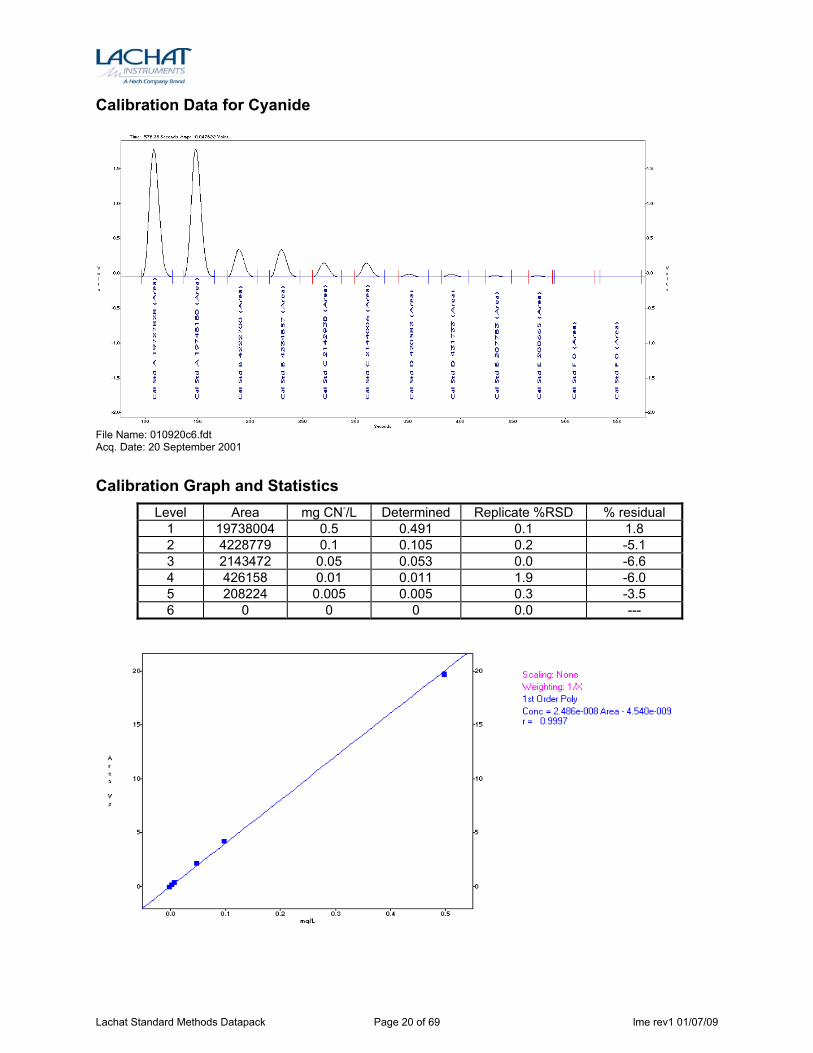
Calibration Data for Cyanide
File Name: 010920c6.fdt Acq. Date: 20 September 2001
Calibration Graph and Statistics Level Area mg CN-/L Determined Replicate %RSD % residual
1 19738004 0.5 0.491 0.1 1.8 2 4228779 0.1 0.105 0.2 -5.1 3 2143472 0.05 0.053 0.0 -6.6 4 426158 0.01 0.011 1.9 -6.0 5 208224 0.005 0.005 0.3 -3.5 6 0 0 0 0.0 ---
Lachat Standard Methods Datapack Page 20 of 69 lme rev1 01/07/09
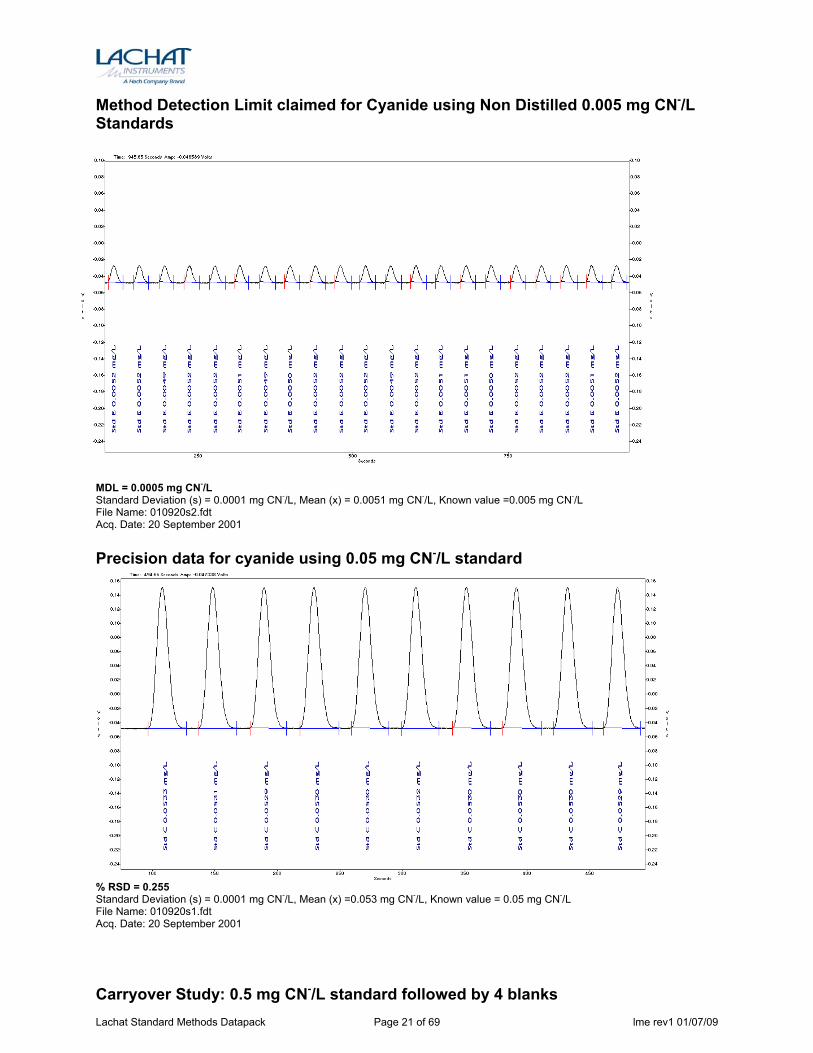
Method Detection Limit claimed for Cyanide using Non Distilled 0.005 mg CN-/L Standards
MDL = 0.0005 mg CN-/L Standard Deviation (s) = 0.0001 mg CN-/L, Mean (x) = 0.0051 mg CN-/L, Known value =0.005 mg CN-/L File Name: 010920s2.fdt Acq. Date: 20 September 2001 Precision data for cyanide using 0.05 mg CN-/L standard
% RSD = 0.255 Standard Deviation (s) = 0.0001 mg CN-/L, Mean (x) =0.053 mg CN-/L, Known value = 0.05 mg CN-/L File Name: 010920s1.fdt Acq. Date: 20 September 2001 Carryover Study: 0.5 mg CN-/L standard followed by 4 blanks Lachat Standard Methods Datapack Page 21 of 69 lme rev1 01/07/09
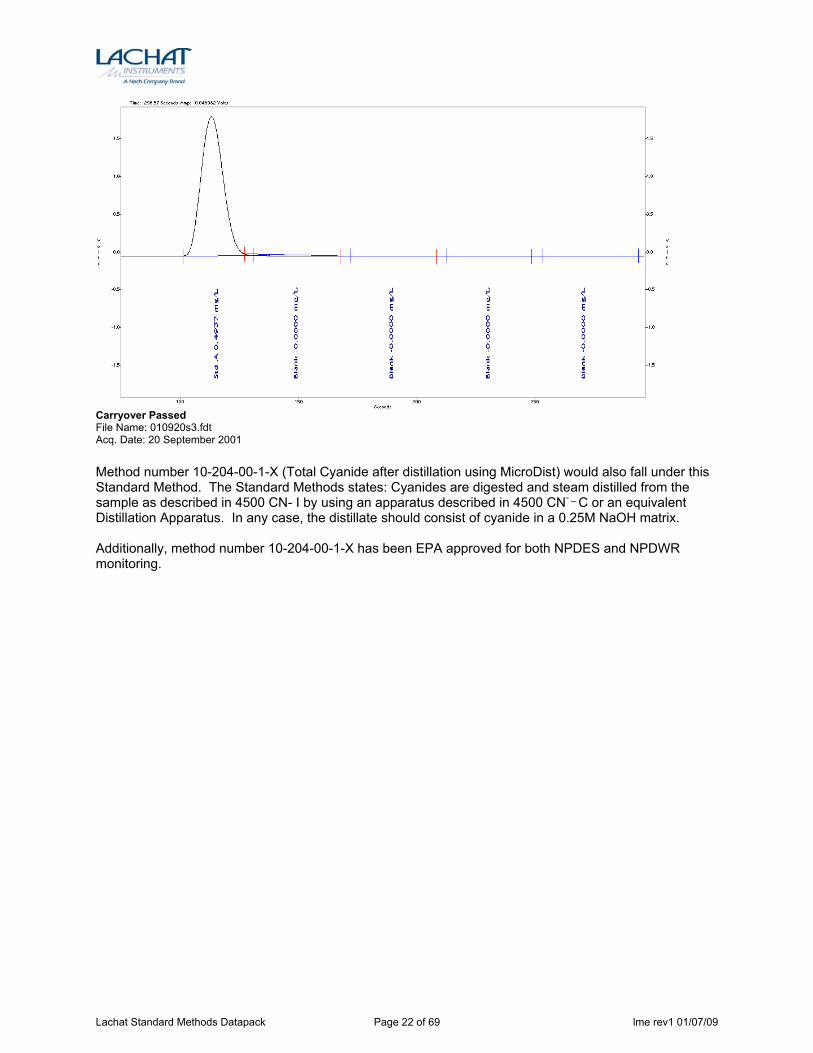
Carryover Passed File Name: 010920s3.fdt Acq. Date: 20 September 2001 Method number 10-204-00-1-X (Total Cyanide after distillation using MicroDist) would also fall under this Standard Method. The Standard Methods states: Cyanides are digested and steam distilled from the sample as described in 4500 CN- I by using an apparatus described in 4500 CN- _ C or an equivalent Distillation Apparatus. In any case, the distillate should consist of cyanide in a 0.25M NaOH matrix. Additionally, method number 10-204-00-1-X has been EPA approved for both NPDES and NPDWR monitoring.
Lachat Standard Methods Datapack Page 22 of 69 lme rev1 01/07/09
Chloride
QuikChem® Method 10-117-07-1-A SM 4500 Cl- G. Mercuric Thiocyanate Flow Injection Analysis
Chloride in Waters
6.0 to 300.0 mg Cl/L
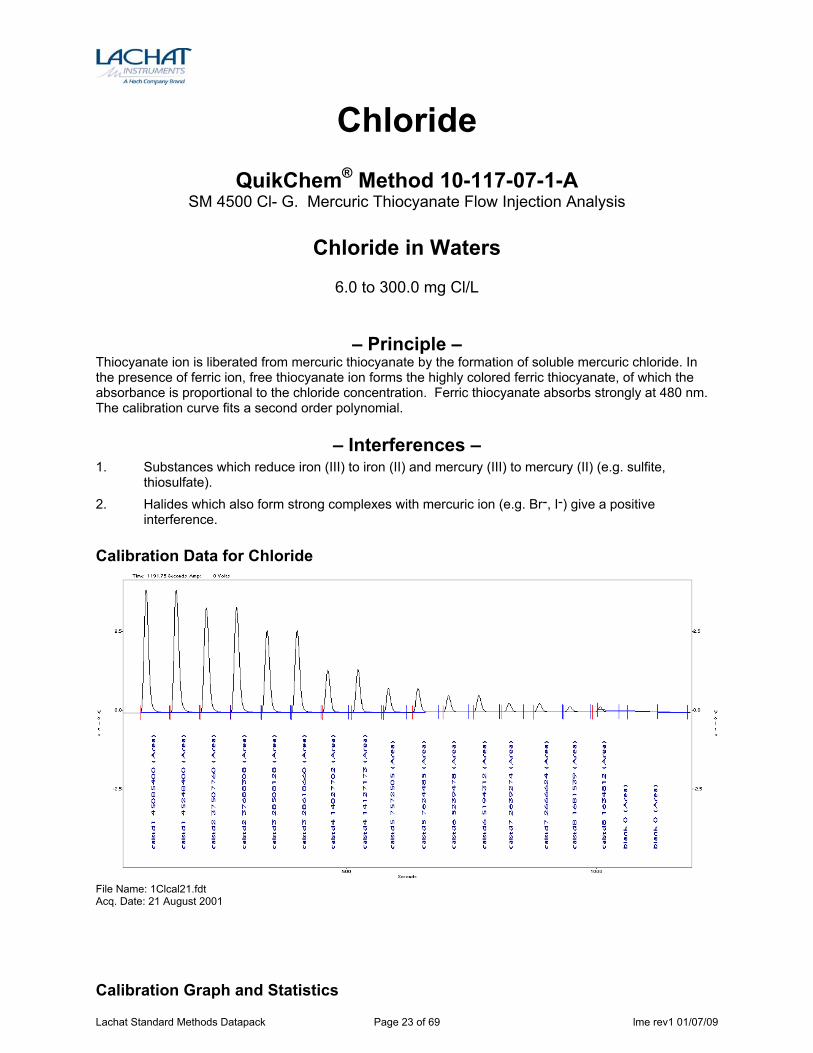
– Principle – Thiocyanate ion is liberated from mercuric thiocyanate by the formation of soluble mercuric chloride. In the presence of ferric ion, free thiocyanate ion forms the highly colored ferric thiocyanate, of which the absorbance is proportional to the chloride concentration. Ferric thiocyanate absorbs strongly at 480 nm. The calibration curve fits a second order polynomial.
– Interferences – 1. Substances which reduce iron (III) to iron (II) and mercury (III) to mercury (II) (e.g. sulfite,
thiosulfate). 2. Halides which also form strong complexes with mercuric ion (e.g. Br-, I-) give a positive
interference. Calibration Data for Chloride
File Name: 1Clcal21.fdt Acq. Date: 21 August 2001 Calibration Graph and Statistics
Lachat Standard Methods Datapack Page 23 of 69 lme rev1 01/07/09
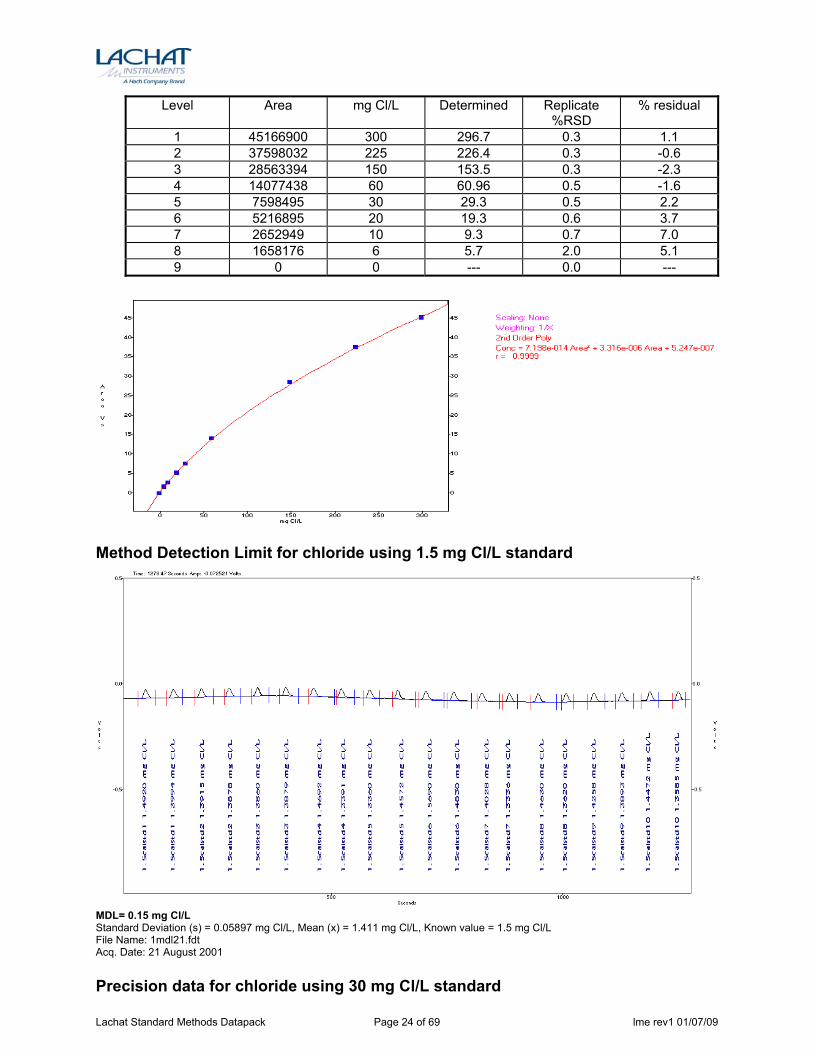
Level Area mg Cl/L Determined Replicate %RSD
% residual
1 45166900 300 296.7 0.3 1.1 2 37598032 225 226.4 0.3 -0.6 3 28563394 150 153.5 0.3 -2.3 4 14077438 60 60.96 0.5 -1.6 5 7598495 30 29.3 0.5 2.2 6 5216895 20 19.3 0.6 3.7 7 2652949 10 9.3 0.7 7.0 8 1658176 6 5.7 2.0 5.1 9 0 0 --- 0.0 ---
Method Detection Limit for chloride using 1.5 mg Cl/L standard
MDL= 0.15 mg Cl/L Standard Deviation (s) = 0.05897 mg Cl/L, Mean (x) = 1.411 mg Cl/L, Known value = 1.5 mg Cl/L File Name: 1mdl21.fdt Acq. Date: 21 August 2001 Precision data for chloride using 30 mg Cl/L standard
Lachat Standard Methods Datapack Page 24 of 69 lme rev1 01/07/09
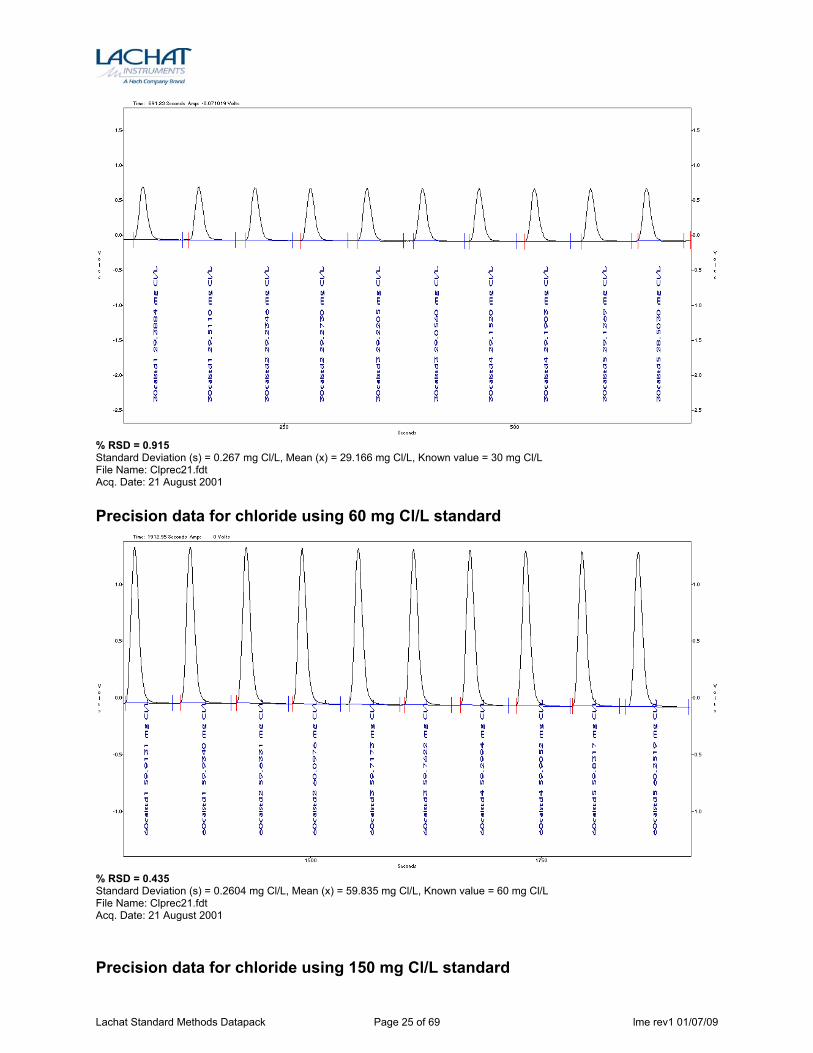
% RSD = 0.915 Standard Deviation (s) = 0.267 mg Cl/L, Mean (x) = 29.166 mg Cl/L, Known value = 30 mg Cl/L File Name: Clprec21.fdt Acq. Date: 21 August 2001 Precision data for chloride using 60 mg Cl/L standard
% RSD = 0.435 Standard Deviation (s) = 0.2604 mg Cl/L, Mean (x) = 59.835 mg Cl/L, Known value = 60 mg Cl/L File Name: Clprec21.fdt Acq. Date: 21 August 2001 Precision data for chloride using 150 mg Cl/L standard
Lachat Standard Methods Datapack Page 25 of 69 lme rev1 01/07/09
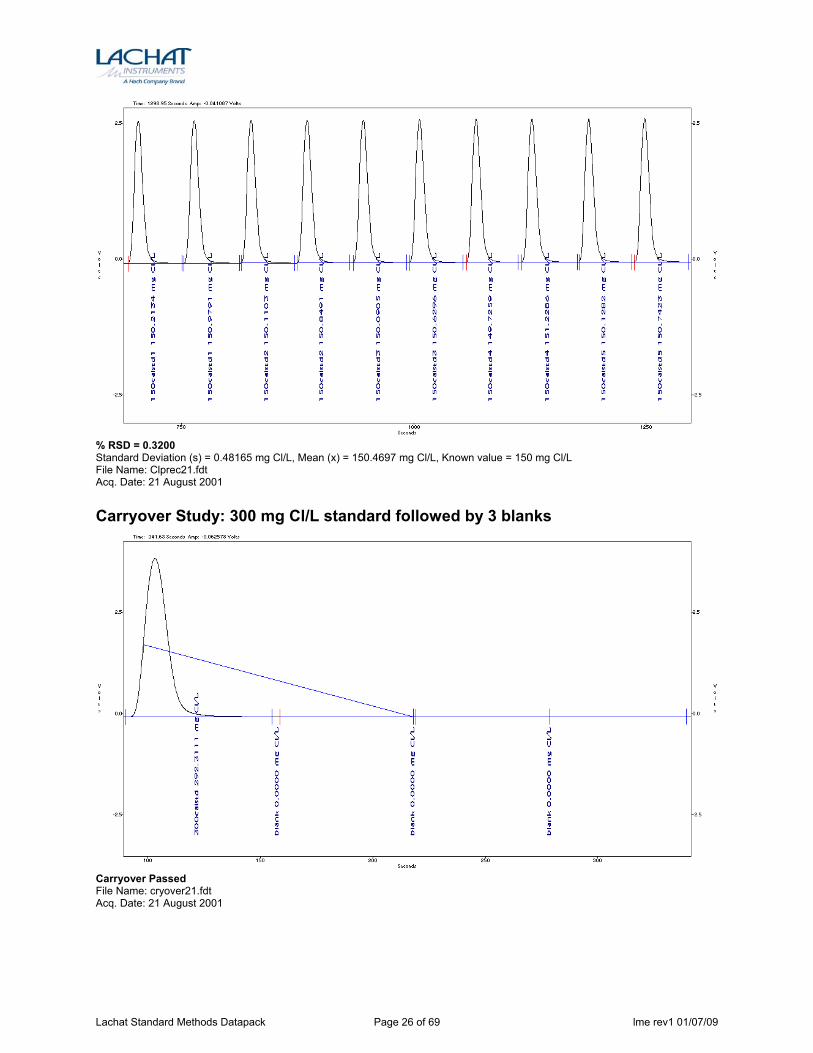
% RSD = 0.3200 Standard Deviation (s) = 0.48165 mg Cl/L, Mean (x) = 150.4697 mg Cl/L, Known value = 150 mg Cl/L File Name: Clprec21.fdt Acq. Date: 21 August 2001 Carryover Study: 300 mg Cl/L standard followed by 3 blanks
Carryover Passed File Name: cryover21.fdt Acq. Date: 21 August 2001
Lachat Standard Methods Datapack Page 26 of 69 lme rev1 01/07/09
Fluoride
QuikChem® Method 10-109-12-2-A SM 4500 F- G. Ion Selective Electrode Flow Injection Analysis
Fluoride in Water and Wastewater
0.1 to 5.0 mg F/L
– Principle – Fluoride is determined potentiometrically using a combination fluoride electrode and the Lachat QuikChem Flow Injection Analyzer. The fluoride electrode consists of a lanthanum fluoride crystal across which a potential is developed by fluoride ions. The reference cell is a Ag/AgCl/Cl- cell. The reference junction is of the annular liquid-junction type and encloses the fluoride-sensitive crystal.
– Interferences – 1. The polyvalent cations, Si4+, Al3+, and Fe3+, interfere by forming complexes with fluoride.
CDTA (1,2-cyclohexylene dinitrilotetracetic acid) is added to preferentially complex these cations and eliminate this interference when these concentrations do not exceed 3.0 mg Al3+/L and 20 mg Fe3+/L.
2 For US users determining Total or Total Dissolved Fluoride, the Bellack distillation (see Standard Methods in Sources below) is required for NPDES monitoring but is not required for SDWA monitoring.
– Special Apparatus –
Please contact Lachat Technical Support for Ordering Information
1. Lachat Fluoride Module (Lachat Part No. 84964) Calibration Data for Fluoride Lachat Standard Methods Datapack Page 27 of 69 lme rev1 01/07/09
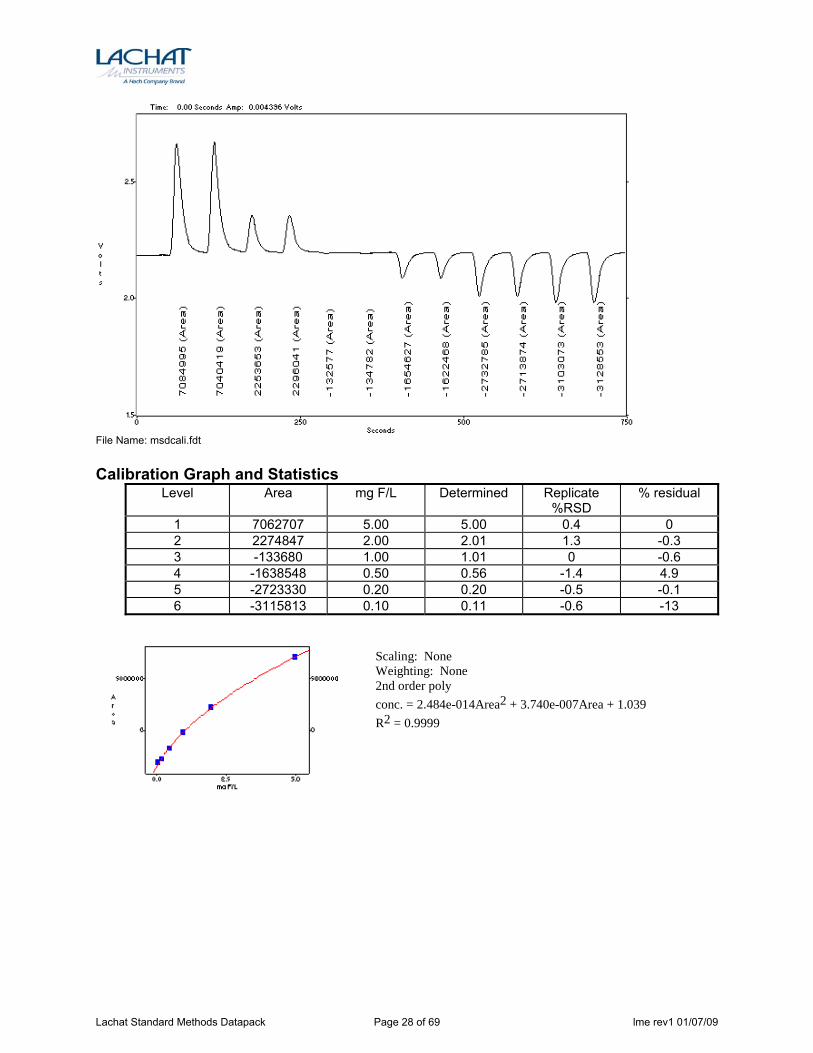
File Name: msdcali.fdt Calibration Graph and Statistics
Level Area mg F/L Determined Replicate %RSD
% residual
1 7062707 5.00 5.00 0.4 0 2 2274847 2.00 2.01 1.3 -0.3 3 -133680 1.00 1.01 0 -0.6 4 -1638548 0.50 0.56 -1.4 4.9 5 -2723330 0.20 0.20 -0.5 -0.1 6 -3115813 0.10 0.11 -0.6 -13
Scaling: NoneWeighting: None2nd order polyconc. = 2.484e-014Area2 + 3.740e-007Area + 1.039R2 = 0.9999
Lachat Standard Methods Datapack Page 28 of 69 lme rev1 01/07/09
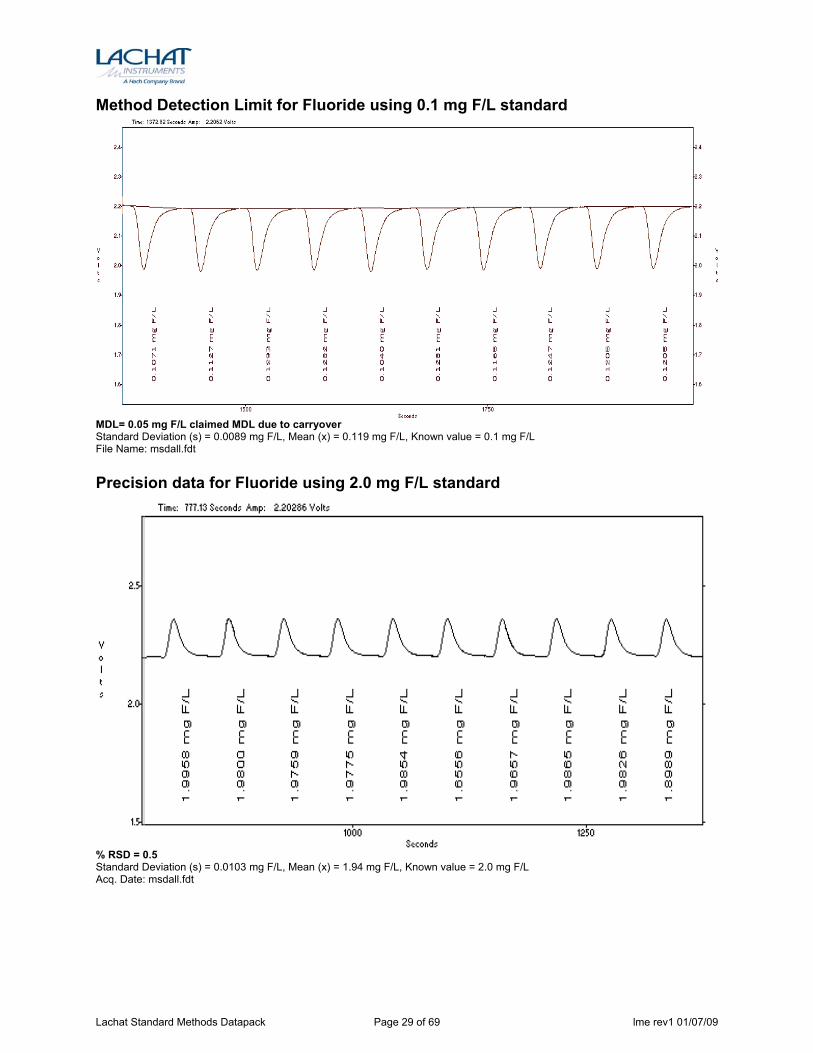
Method Detection Limit for Fluoride using 0.1 mg F/L standard
MDL= 0.05 mg F/L claimed MDL due to carryover Standard Deviation (s) = 0.0089 mg F/L, Mean (x) = 0.119 mg F/L, Known value = 0.1 mg F/L File Name: msdall.fdt Precision data for Fluoride using 2.0 mg F/L standard
% RSD = 0.5 Standard Deviation (s) = 0.0103 mg F/L, Mean (x) = 1.94 mg F/L, Known value = 2.0 mg F/L Acq. Date: msdall.fdt
Lachat Standard Methods Datapack Page 29 of 69 lme rev1 01/07/09
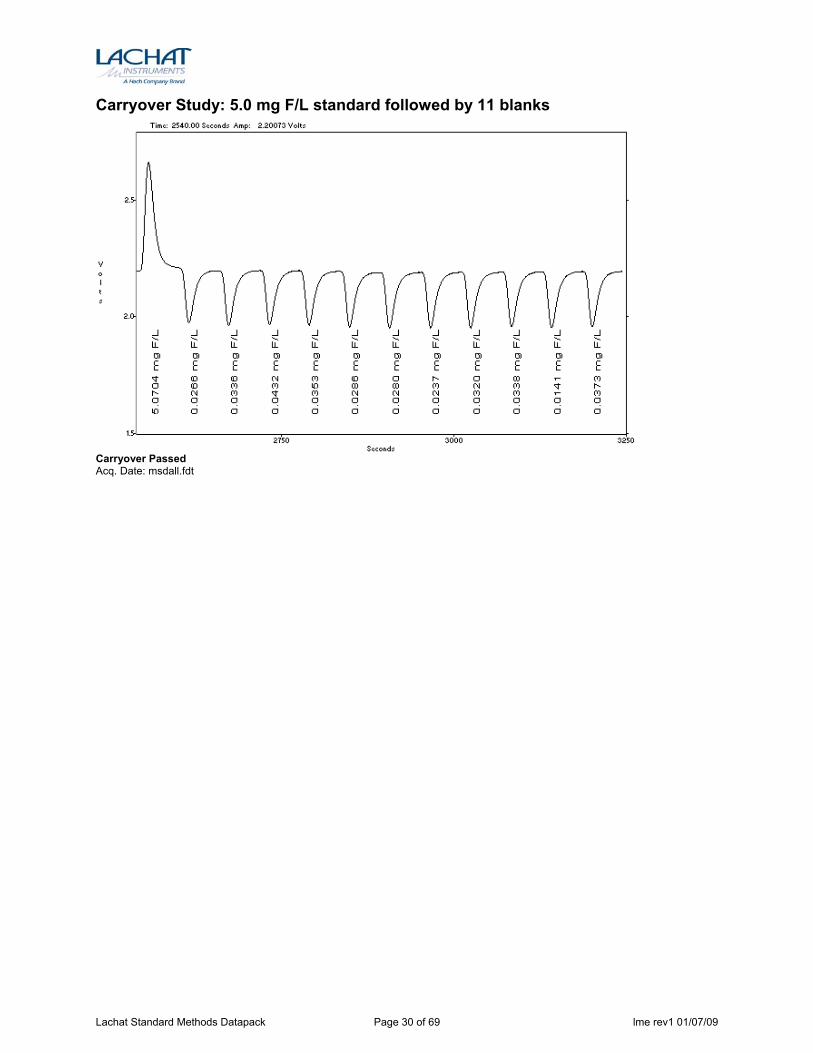
Carryover Study: 5.0 mg F/L standard followed by 11 blanks
Carryover Passed Acq. Date: msdall.fdt
Lachat Standard Methods Datapack Page 30 of 69 lme rev1 01/07/09
Total Nitrogen by In-Line UV/Persulfate Digestion
and Oxidation with Flow Injection Analysis
QuikChem® Method 10-107-04-3-P
SM 4500-N B.
Total Nitrogen, In-line Persulfate Digestion
0.2 to 10.0 mg N/L
– Principle – Nitrogen compounds are oxidized in-line to nitrate using alkaline persulfate/UV digestion. Oxidation of nitrogen containing compounds to nitrate is achieved at 105°C with additional energy supplied by exposure to UV light. The digestion occurs prior to the injection valve. Results for wastewater influent may be up to 30% low when compared with a rigorous TKN digestion because of sediment in the sample test tube. If effluent samples are preserved and filtered, in-line digestion results will match the manual off-line digestion. If samples are not filtered, in-line results will be 1-15% low compared with off-line digestion. Surface water samples may not require filtration but this should be verified with a sample containing high levels of solids. After digestion nitrate is quantitatively reduced to nitrite by passage of the sample through a copperized cadmium column. The nitrite (reduced nitrate plus original nitrite) is then determined by diazotization with sulfanilamide under acidic conditions to form a diazonium ion. The diazonium ion is coupled with N-(1-naphthyl)ethylenediamine dihydrochloride. The resulting pink dye absorbs at 540 nm and is proportional to total nitrogen.
– Interferences – 1. Chloride is a suspected interference. Seawater, when spiked at 5 mg N/L as ammonia, gave <
5% recovery.
– Special Apparatus – Please contact Lachat Technical Support for Ordering Information
1. Lachat Sample Preparation Module, A30X11 (X=1 for 110V, x=2 for 220V) with UV-254 lamp. 2. PVC PUMP TUBES MUST BE USED FOR THIS METHOD
Lachat Standard Methods Datapack Page 31 of 69 lme rev1 01/07/09
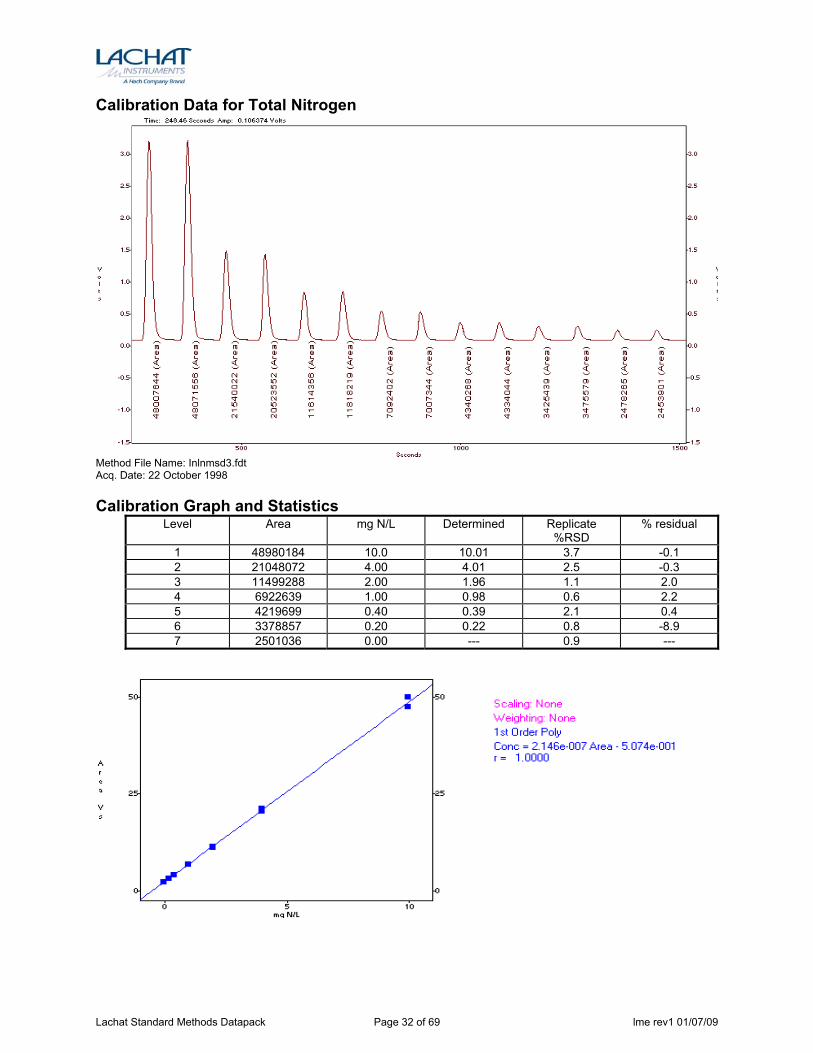
Calibration Data for Total Nitrogen
Method File Name: Inlnmsd3.fdt Acq. Date: 22 October 1998 Calibration Graph and Statistics
Level Area mg N/L Determined Replicate %RSD
% residual
1 48980184 10.0 10.01 3.7 -0.1 2 21048072 4.00 4.01 2.5 -0.3 3 11499288 2.00 1.96 1.1 2.0 4 6922639 1.00 0.98 0.6 2.2 5 4219699 0.40 0.39 2.1 0.4 6 3378857 0.20 0.22 0.8 -8.9 7 2501036 0.00 --- 0.9 ---
Lachat Standard Methods Datapack Page 32 of 69 lme rev1 01/07/09
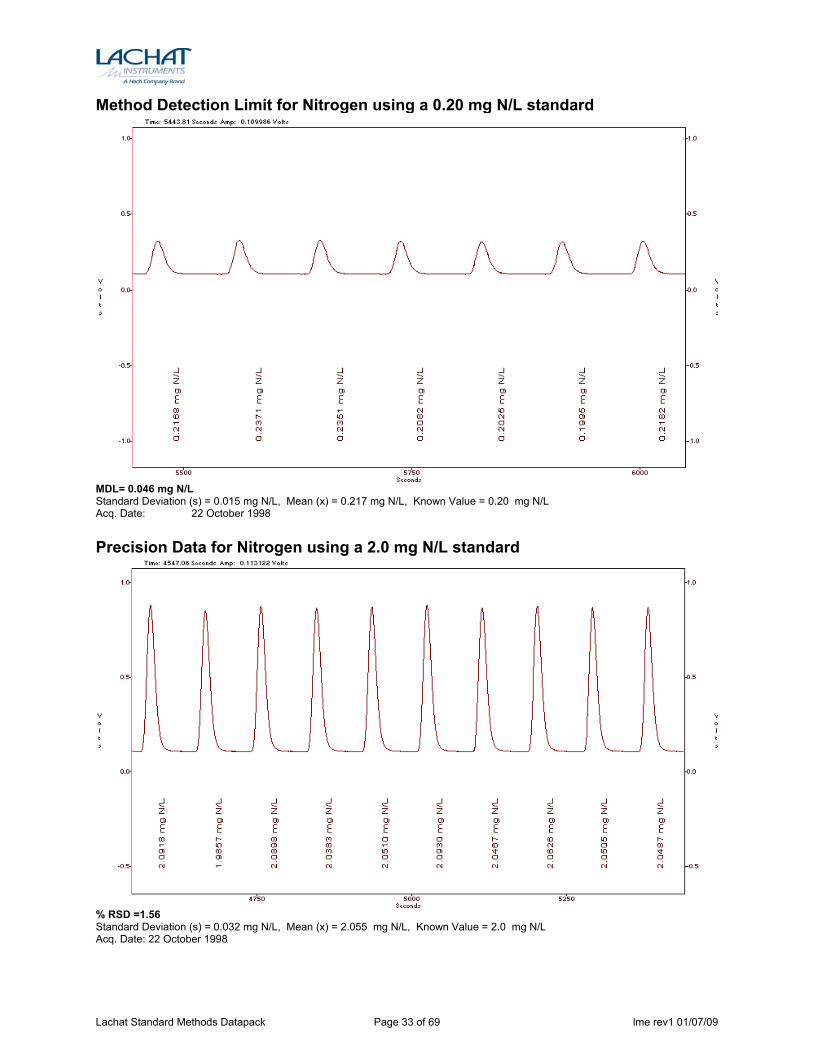
Method Detection Limit for Nitrogen using a 0.20 mg N/L standard
MDL= 0.046 mg N/L Standard Deviation (s) = 0.015 mg N/L, Mean (x) = 0.217 mg N/L, Known Value = 0.20 mg N/L Acq. Date: 22 October 1998 Precision Data for Nitrogen using a 2.0 mg N/L standard
% RSD =1.56 Standard Deviation (s) = 0.032 mg N/L, Mean (x) = 2.055 mg N/L, Known Value = 2.0 mg N/L Acq. Date: 22 October 1998
Lachat Standard Methods Datapack Page 33 of 69 lme rev1 01/07/09
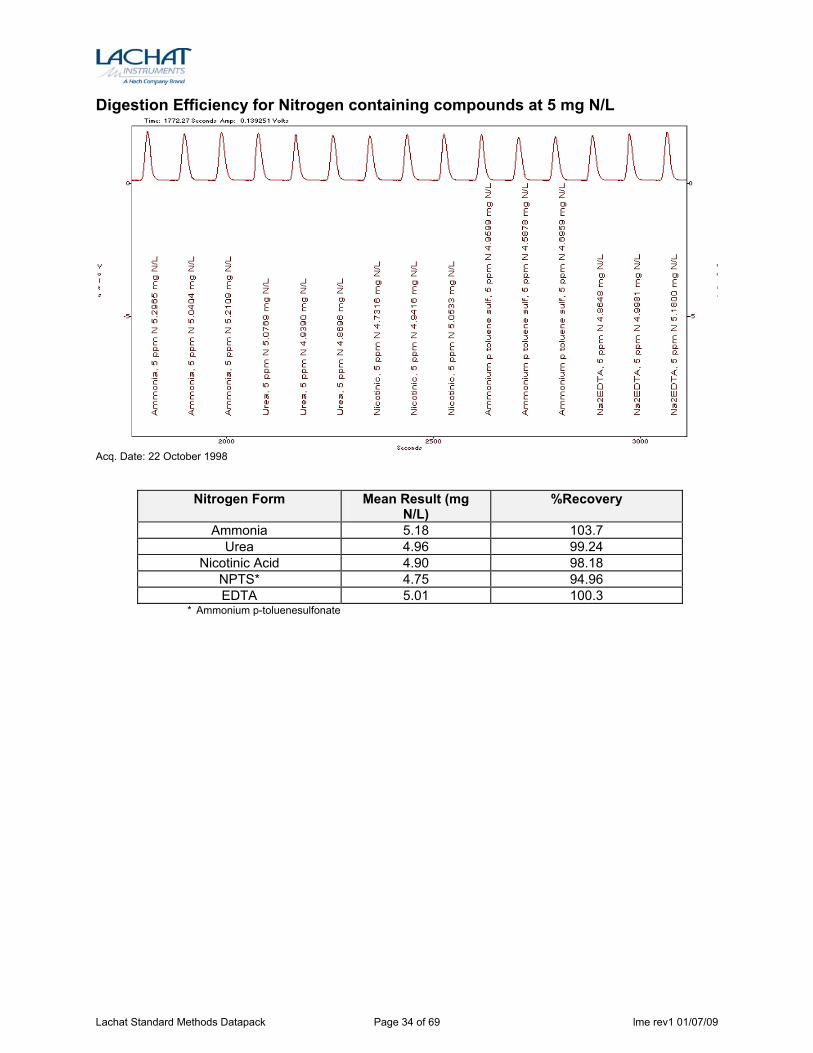
Digestion Efficiency for Nitrogen containing compounds at 5 mg N/L
Acq. Date: 22 October 1998
Nitrogen Form Mean Result (mg N/L)
%Recovery
Ammonia 5.18 103.7 Urea 4.96 99.24
Nicotinic Acid 4.90 98.18 NPTS* 4.75 94.96 EDTA 5.01 100.3
* Ammonium p-toluenesulfonate Lachat Standard Methods Datapack Page 34 of 69 lme rev1 01/07/09
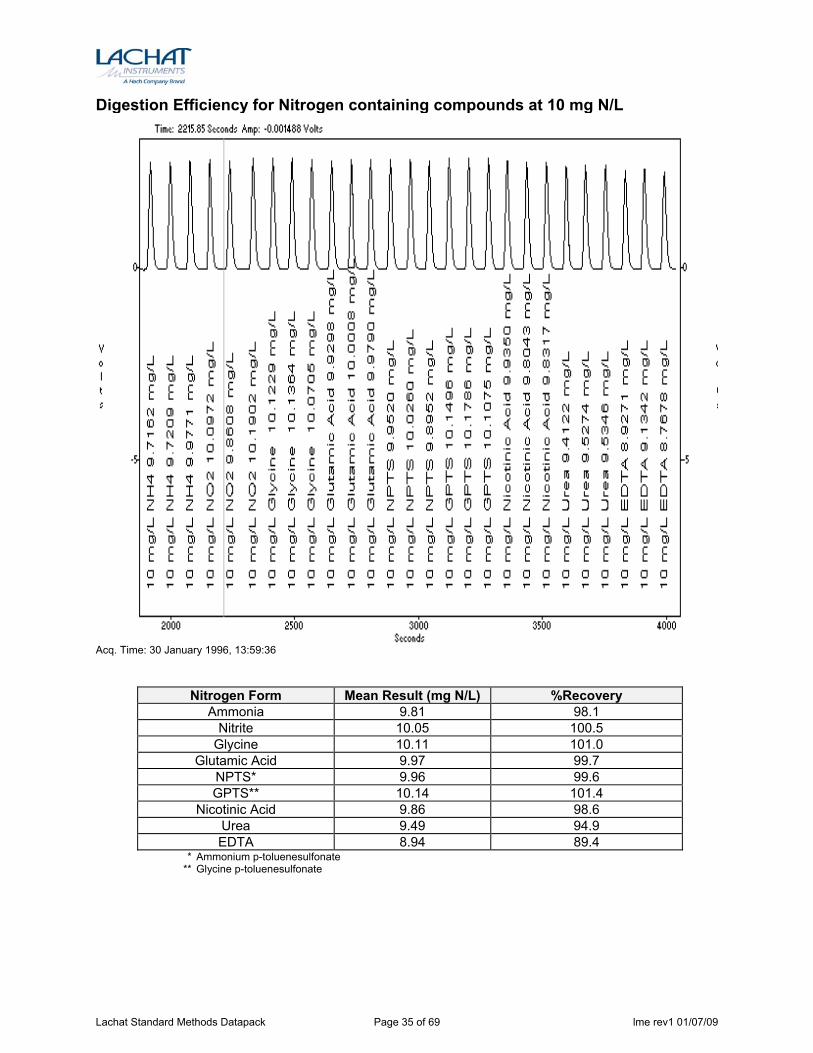
Digestion Efficiency for Nitrogen containing compounds at 10 mg N/L
Acq. Time: 30 January 1996, 13:59:36
Nitrogen Form Mean Result (mg N/L) %Recovery Ammonia 9.81 98.1
Nitrite 10.05 100.5 Glycine 10.11 101.0
Glutamic Acid 9.97 99.7 NPTS* 9.96 99.6 GPTS** 10.14 101.4
Nicotinic Acid 9.86 98.6 Urea 9.49 94.9 EDTA 8.94 89.4
* Ammonium p-toluenesulfonate ** Glycine p-toluenesulfonate Lachat Standard Methods Datapack Page 35 of 69 lme rev1 01/07/09
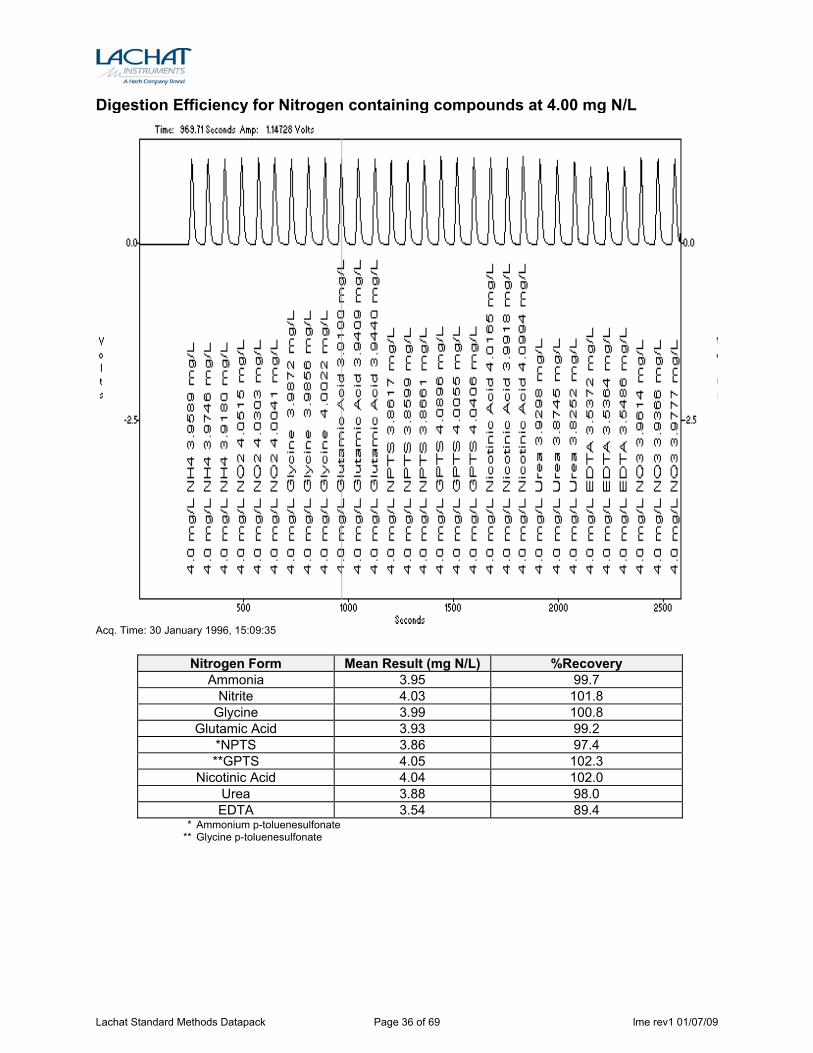
Digestion Efficiency for Nitrogen containing compounds at 4.00 mg N/L
Acq. Time: 30 January 1996, 15:09:35
Nitrogen Form Mean Result (mg N/L) %Recovery Ammonia 3.95 99.7
Nitrite 4.03 101.8 Glycine 3.99 100.8
Glutamic Acid 3.93 99.2 *NPTS 3.86 97.4 **GPTS 4.05 102.3
Nicotinic Acid 4.04 102.0 Urea 3.88 98.0 EDTA 3.54 89.4
* Ammonium p-toluenesulfonate ** Glycine p-toluenesulfonate
Lachat Standard Methods Datapack Page 36 of 69 lme rev1 01/07/09
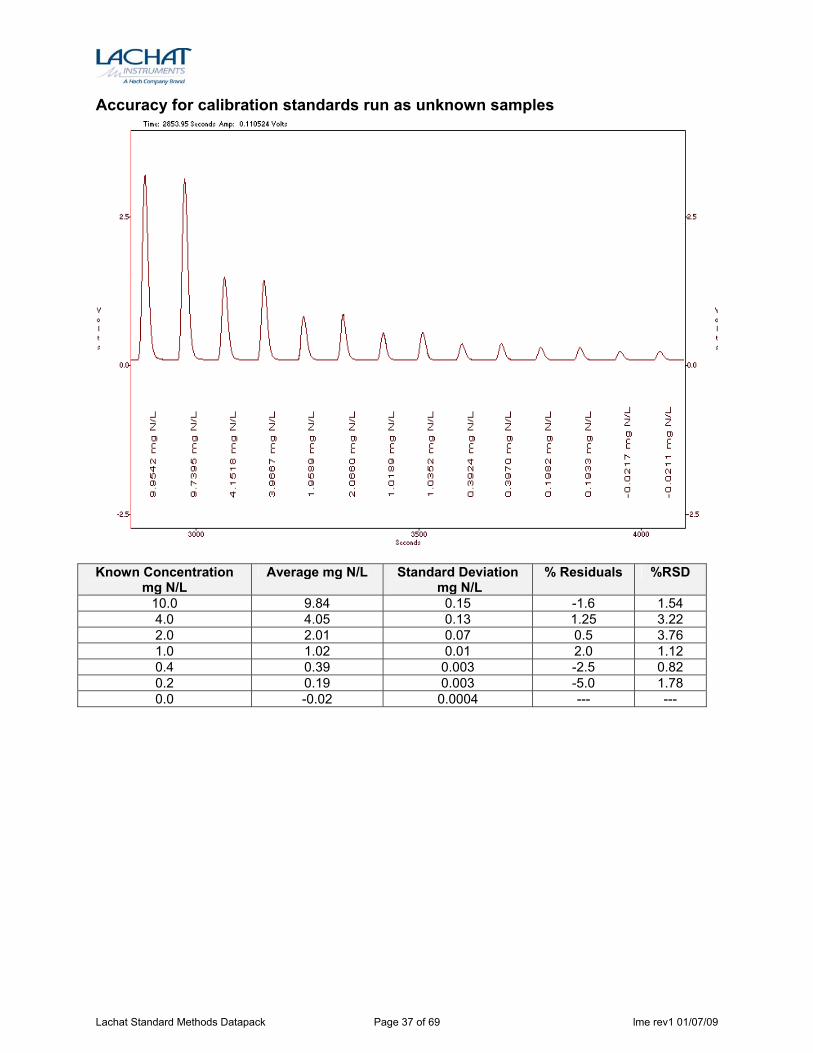
Accuracy for calibration standards run as unknown samples
Known Concentration
mg N/L Average mg N/L Standard Deviation
mg N/L % Residuals %RSD
10.0 9.84 0.15 -1.6 1.54 4.0 4.05 0.13 1.25 3.22 2.0 2.01 0.07 0.5 3.76 1.0 1.02 0.01 2.0 1.12 0.4 0.39 0.003 -2.5 0.82 0.2 0.19 0.003 -5.0 1.78 0.0 -0.02 0.0004 --- ---
Lachat Standard Methods Datapack Page 37 of 69 lme rev1 01/07/09
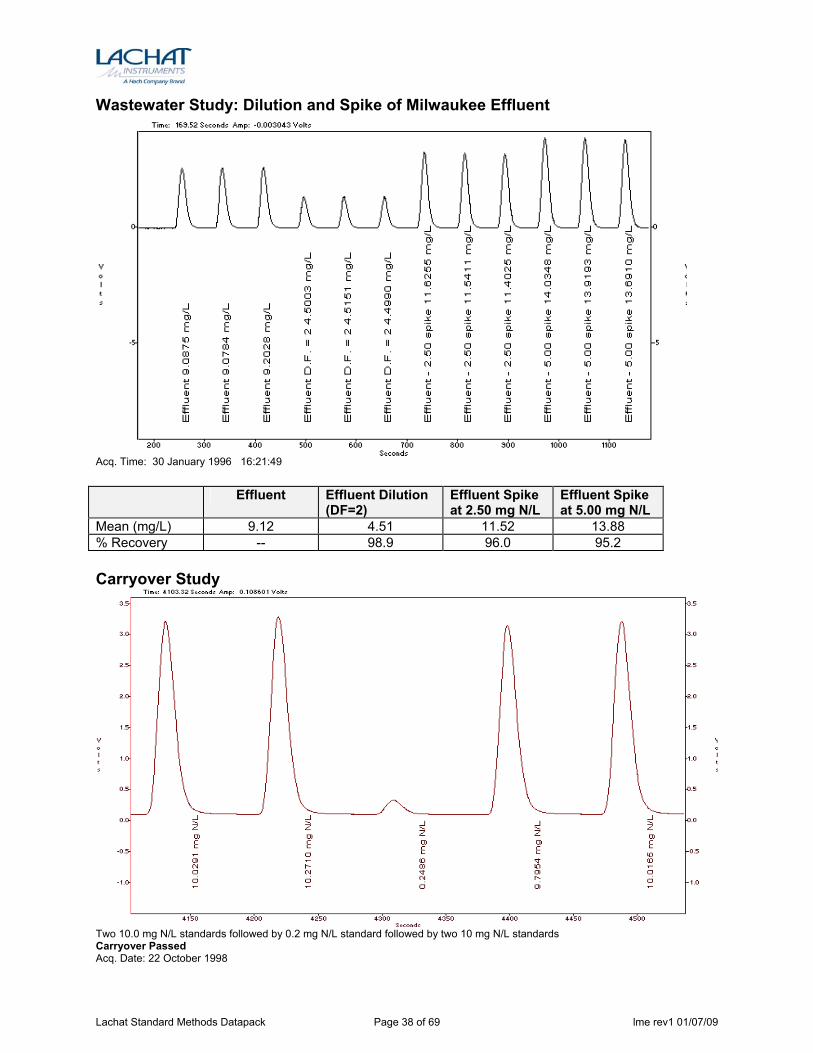
Wastewater Study: Dilution and Spike of Milwaukee Effluent
Acq. Time: 30 January 1996 16:21:49 Effluent Effluent Dilution
(DF=2) Effluent Spike at 2.50 mg N/L
Effluent Spike at 5.00 mg N/L
Mean (mg/L) 9.12 4.51 11.52 13.88 % Recovery -- 98.9 96.0 95.2 Carryover Study
Two 10.0 mg N/L standards followed by 0.2 mg N/L standard followed by two 10 mg N/L standards Carryover Passed Acq. Date: 22 October 1998
Lachat Standard Methods Datapack Page 38 of 69 lme rev1 01/07/09
Nitrate/Nitrite by Cadmium Reduction in Flow
Injection Analysis
QuikChem® Method 10-107-04-1-C SM 4500-NO3- I.
DETERMINATION OF NITRATE/NITRITE IN DRINKING, SURFACE AND WASTEWATERS BY FLOW INJECTION
ANALYSIS High Throughput Method
0.01 to 2.0 mg N/L as NO3- + NO2-
or NO2-
– Principle –
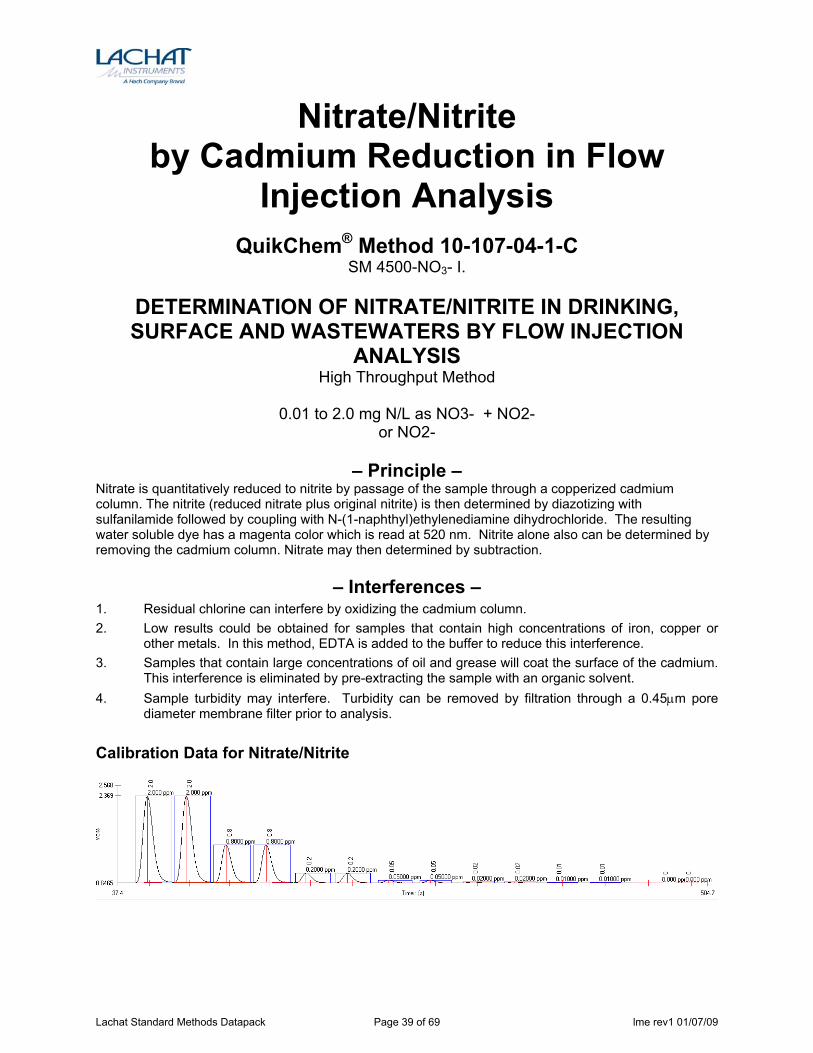
Nitrate is quantitatively reduced to nitrite by passage of the sample through a copperized cadmium column. The nitrite (reduced nitrate plus original nitrite) is then determined by diazotizing with sulfanilamide followed by coupling with N-(1-naphthyl)ethylenediamine dihydrochloride. The resulting water soluble dye has a magenta color which is read at 520 nm. Nitrite alone also can be determined by removing the cadmium column. Nitrate may then determined by subtraction.
– Interferences – 1. Residual chlorine can interfere by oxidizing the cadmium column. 2. Low results could be obtained for samples that contain high concentrations of iron, copper or
other metals. In this method, EDTA is added to the buffer to reduce this interference. 3. Samples that contain large concentrations of oil and grease will coat the surface of the cadmium.
This interference is eliminated by pre-extracting the sample with an organic solvent. 4. Sample turbidity may interfere. Turbidity can be removed by filtration through a 0.45μm pore
diameter membrane filter prior to analysis.
Calibration Data for Nitrate/Nitrite
Lachat Standard Methods Datapack Page 39 of 69 lme rev1 01/07/09
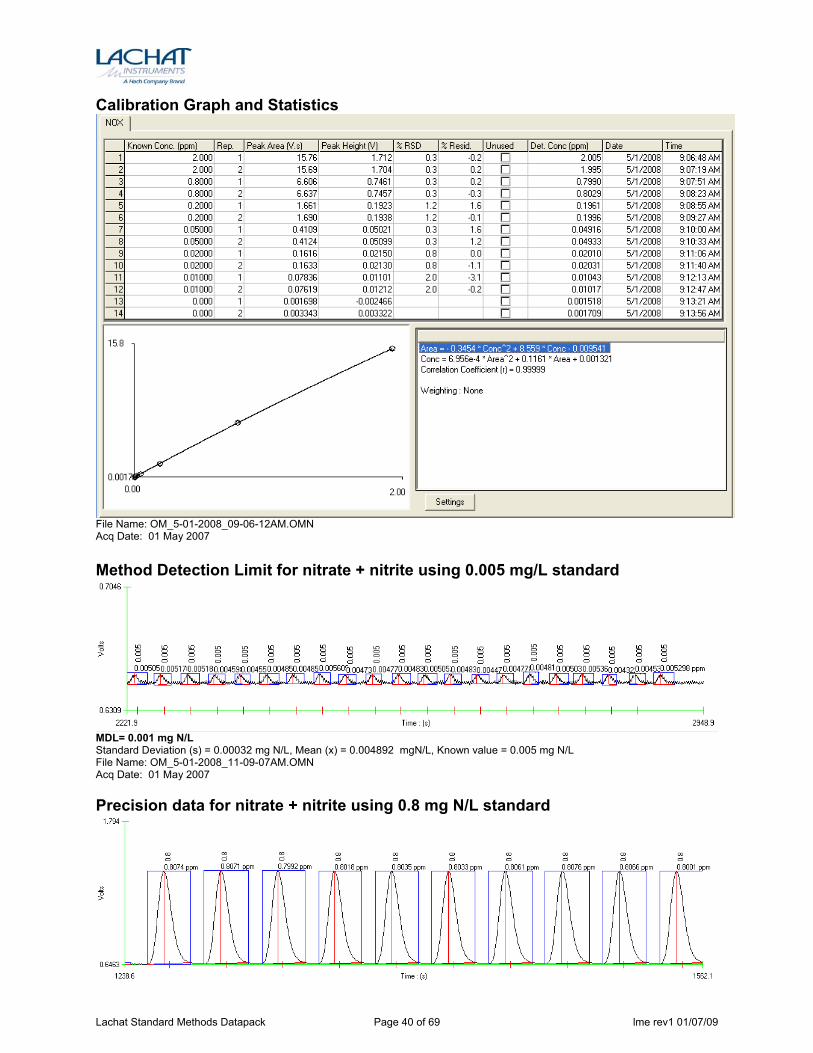
Calibration Graph and Statistics
File Name: OM_5-01-2008_09-06-12AM.OMN Acq Date: 01 May 2007 Method Detection Limit for nitrate + nitrite using 0.005 mg/L standard
MDL= 0.001 mg N/L Standard Deviation (s) = 0.00032 mg N/L, Mean (x) = 0.004892 mgN/L, Known value = 0.005 mg N/L File Name: OM_5-01-2008_11-09-07AM.OMN Acq Date: 01 May 2007 Precision data for nitrate + nitrite using 0.8 mg N/L standard
Lachat Standard Methods Datapack Page 40 of 69 lme rev1 01/07/09
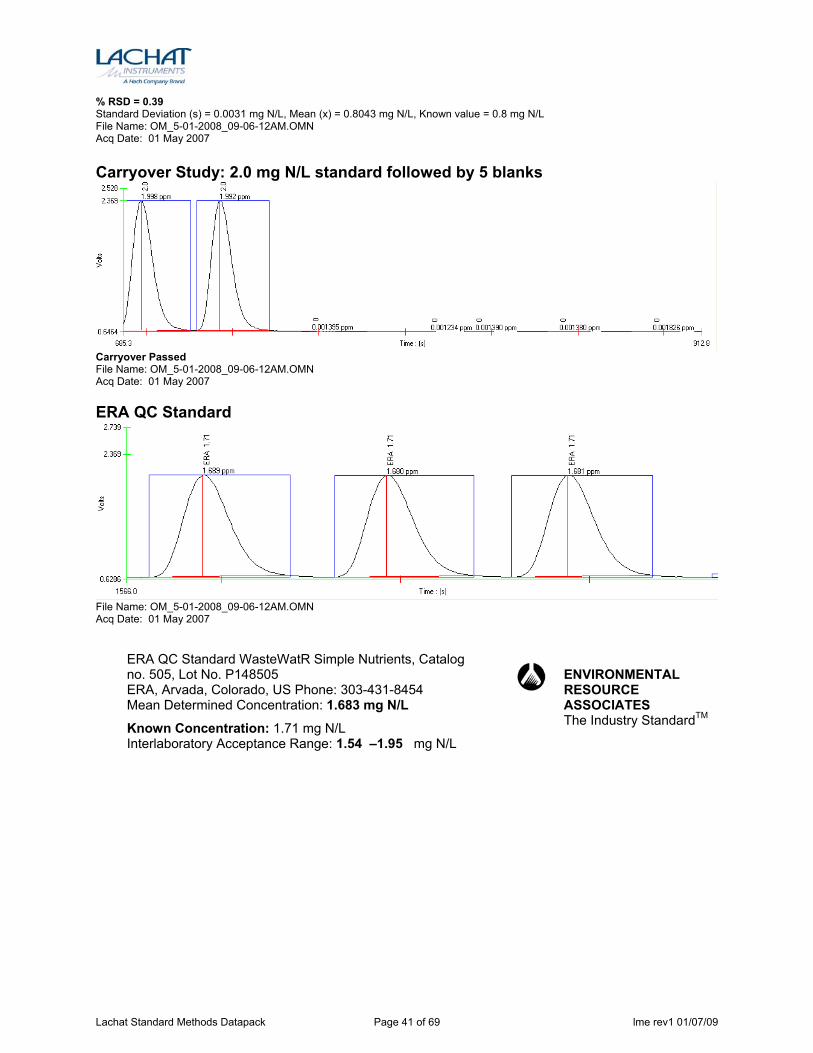
% RSD = 0.39 Standard Deviation (s) = 0.0031 mg N/L, Mean (x) = 0.8043 mg N/L, Known value = 0.8 mg N/L File Name: OM_5-01-2008_09-06-12AM.OMN Acq Date: 01 May 2007 Carryover Study: 2.0 mg N/L standard followed by 5 blanks
Carryover Passed File Name: OM_5-01-2008_09-06-12AM.OMN Acq Date: 01 May 2007 ERA QC Standard
File Name: OM_5-01-2008_09-06-12AM.OMN Acq Date: 01 May 2007
ERA QC Standard WasteWatR Simple Nutrients, Catalog no. 505, Lot No. P148505 ERA, Arvada, Colorado, US Phone: 303-431-8454 Mean Determined Concentration: 1.683 mg N/L
Known Concentration: 1.71 mg N/L Interlaboratory Acceptance Range: 1.54 –1.95 mg N/L
ENVIRONMENTAL RESOURCE ASSOCIATES The Industry StandardTM
Lachat Standard Methods Datapack Page 41 of 69 lme rev1 01/07/09
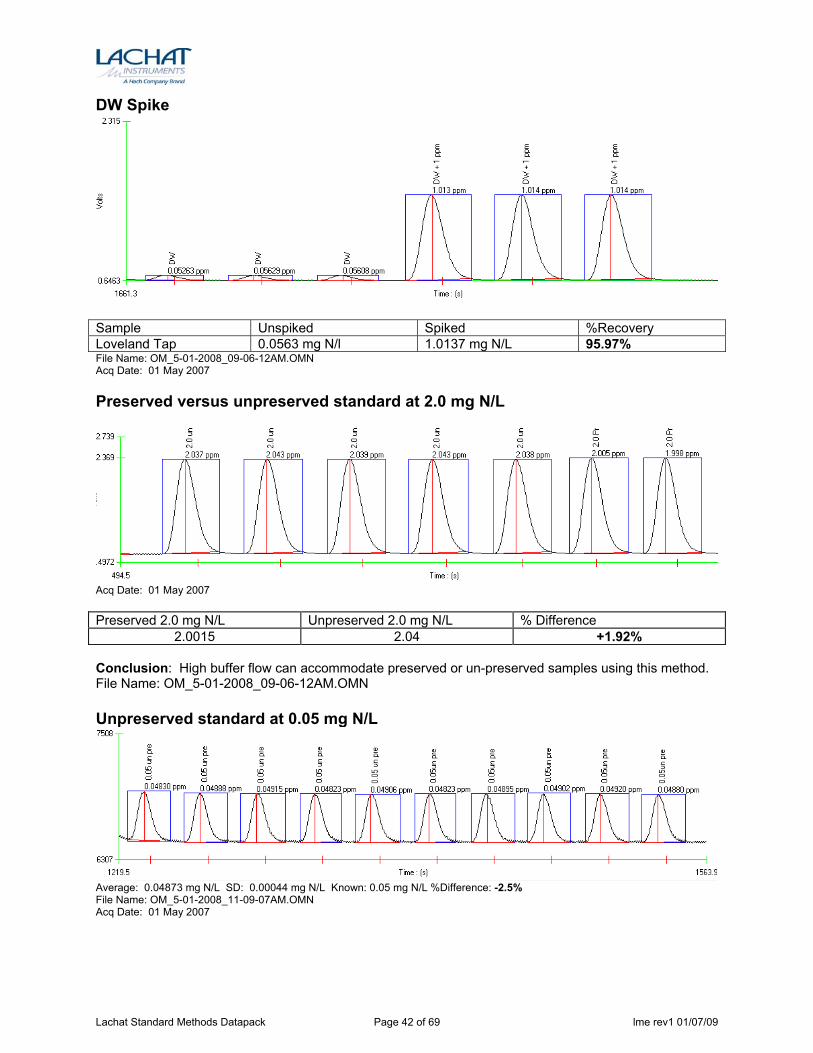
DW Spike
Sample Unspiked Spiked %Recovery Loveland Tap 0.0563 mg N/l 1.0137 mg N/L 95.97% File Name: OM_5-01-2008_09-06-12AM.OMN Acq Date: 01 May 2007 Preserved versus unpreserved standard at 2.0 mg N/L
Acq Date: 01 May 2007 Preserved 2.0 mg N/L Unpreserved 2.0 mg N/L % Difference
2.0015 2.04 +1.92% Conclusion: High buffer flow can accommodate preserved or un-preserved samples using this method. File Name: OM_5-01-2008_09-06-12AM.OMN Unpreserved standard at 0.05 mg N/L
Average: 0.04873 mg N/L SD: 0.00044 mg N/L Known: 0.05 mg N/L %Difference: -2.5% File Name: OM_5-01-2008_11-09-07AM.OMN Acq Date: 01 May 2007
Lachat Standard Methods Datapack Page 42 of 69 lme rev1 01/07/09
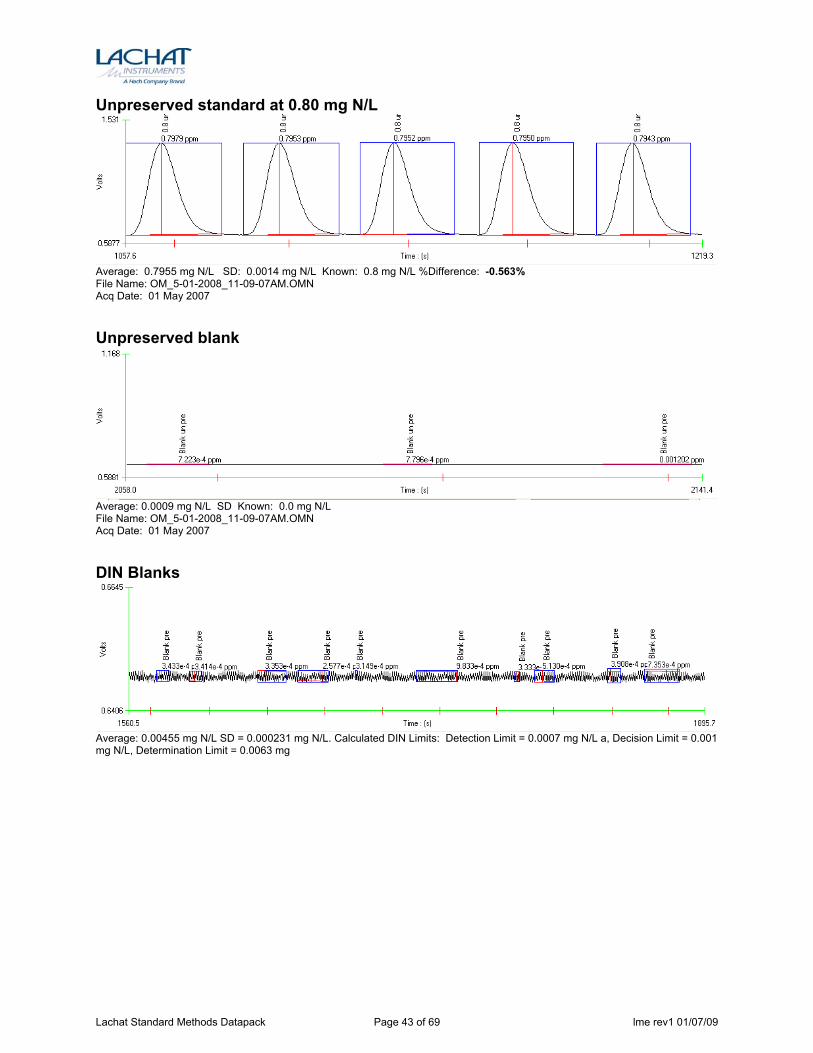
Unpreserved standard at 0.80 mg N/L
Average: 0.7955 mg N/L SD: 0.0014 mg N/L Known: 0.8 mg N/L %Difference: -0.563% File Name: OM_5-01-2008_11-09-07AM.OMN Acq Date: 01 May 2007 Unpreserved blank
Average: 0.0009 mg N/L SD Known: 0.0 mg N/L File Name: OM_5-01-2008_11-09-07AM.OMN Acq Date: 01 May 2007 DIN Blanks
Average: 0.00455 mg N/L SD = 0.000231 mg N/L. Calculated DIN Limits: Detection Limit = 0.0007 mg N/L a, Decision Limit = 0.001 mg N/L, Determination Limit = 0.0063 mg
Lachat Standard Methods Datapack Page 43 of 69 lme rev1 01/07/09
Kjeldahl Nitrogen by Block Digestion and Flow
Injection Analysis
QuikChem® Method 10-107-06-2-H SM 4500 Norg D.
Total Kjeldahl Nitrogen in Waters
Copper Catalyst/Block Digester Method
0.1 to 5.0 mg N/L
– Principle – This method covers the determination of Kjeldahl nitrogen using copper sulfate as the digestion catalyst. The method determines nitrogen in drinking water, ground water, and surface waters, as well as domestic and industrial wastes. The digestion procedure converts nitrogen compounds of biological origin such as amino acids, proteins and peptides to ammonia. Nitrogenous compounds of some industrial wastes such as amines, nitro compounds, hydrazones, oximes, semicarbazones and some refractory tertiary amines may not be recovered. Nitrate is not recovered.
The colorimetric method is based on the formation of chloramine, followed by a coupling reaction which forms indophenol blue at pH >10.5. Nitroprusside is added as a catalyst.
– Interferences – 1. Samples must not consume more than 10% of the sulfuric acid during the digestion. The buffer
will accommodate a small range of H2SO4 concentrations in the digested, diluted samples with no change in signal intensity.
– Special Apparatus –
Please contact Lachat Technical Support or Ordering Information
1. Heating Unit, Lachat Part No. A85X00 (X=1 for 110V, X=2 for 220V) 2. Block Digestor/75 mL/BD46 Lachat Part No. A18206 3. PVC PUMP TUBES MUST BE USED FOR THIS METHOD
Lachat Standard Methods Datapack Page 44 of 69 lme rev1 01/07/09
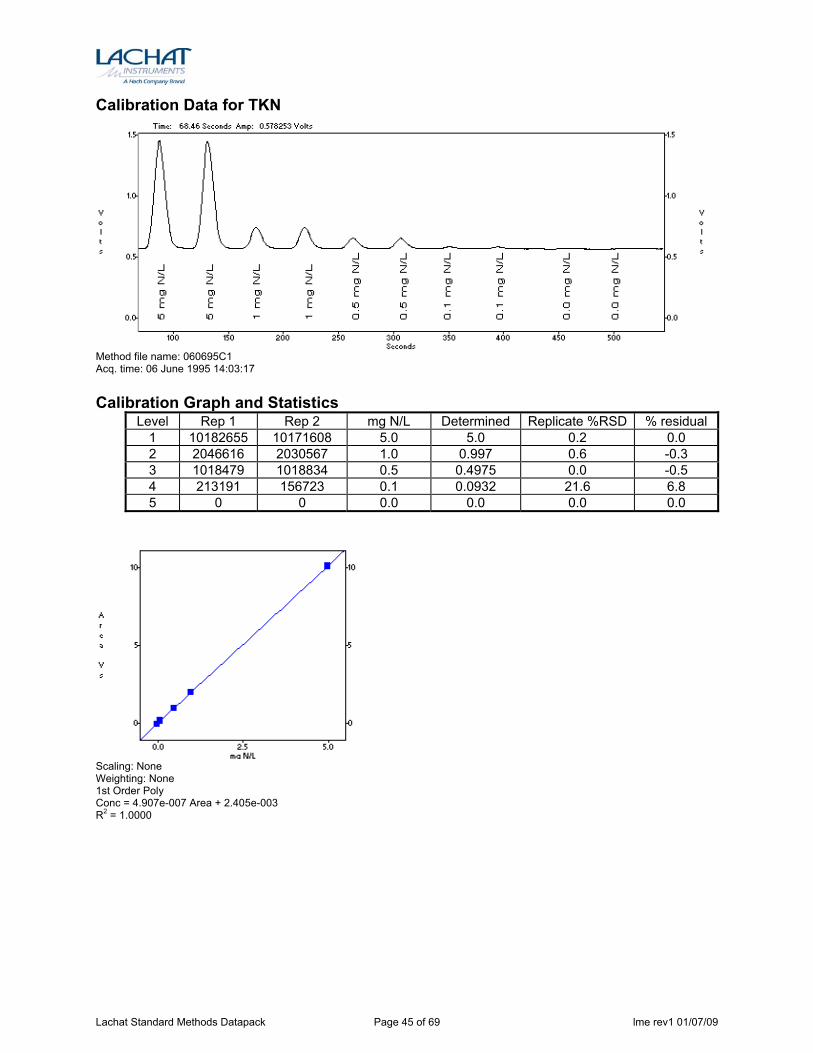
Calibration Data for TKN
Method file name: 060695C1 Acq. time: 06 June 1995 14:03:17 Calibration Graph and Statistics
Level Rep 1 Rep 2 mg N/L Determined Replicate %RSD % residual 1 10182655 10171608 5.0 5.0 0.2 0.0 2 2046616 2030567 1.0 0.997 0.6 -0.3 3 1018479 1018834 0.5 0.4975 0.0 -0.5 4 213191 156723 0.1 0.0932 21.6 6.8 5 0 0 0.0 0.0 0.0 0.0
Scaling: None Weighting: None 1st Order Poly Conc = 4.907e-007 Area + 2.405e-003 R2 = 1.0000
Lachat Standard Methods Datapack Page 45 of 69 lme rev1 01/07/09
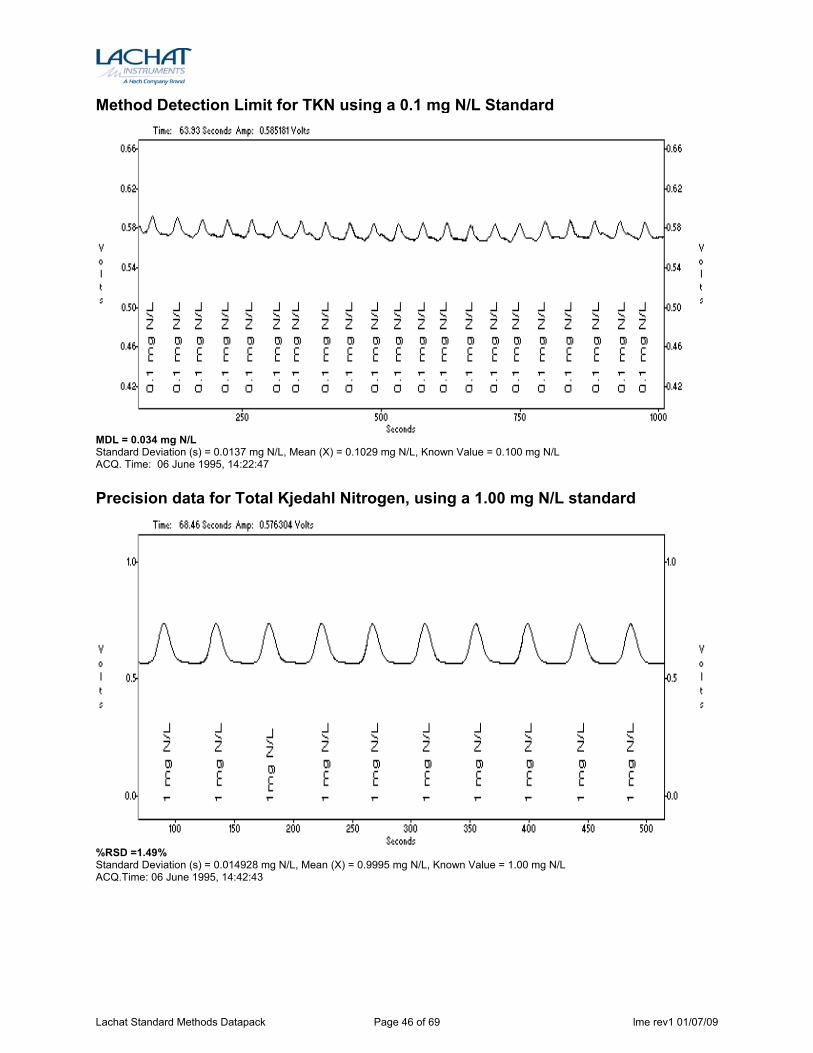
Method Detection Limit for TKN using a 0.1 mg N/L Standard
MDL = 0.034 mg N/L Standard Deviation (s) = 0.0137 mg N/L, Mean (X) = 0.1029 mg N/L, Known Value = 0.100 mg N/L ACQ. Time: 06 June 1995, 14:22:47 Precision data for Total Kjedahl Nitrogen, using a 1.00 mg N/L standard
%RSD =1.49% Standard Deviation (s) = 0.014928 mg N/L, Mean (X) = 0.9995 mg N/L, Known Value = 1.00 mg N/L ACQ.Time: 06 June 1995, 14:42:43
Lachat Standard Methods Datapack Page 46 of 69 lme rev1 01/07/09
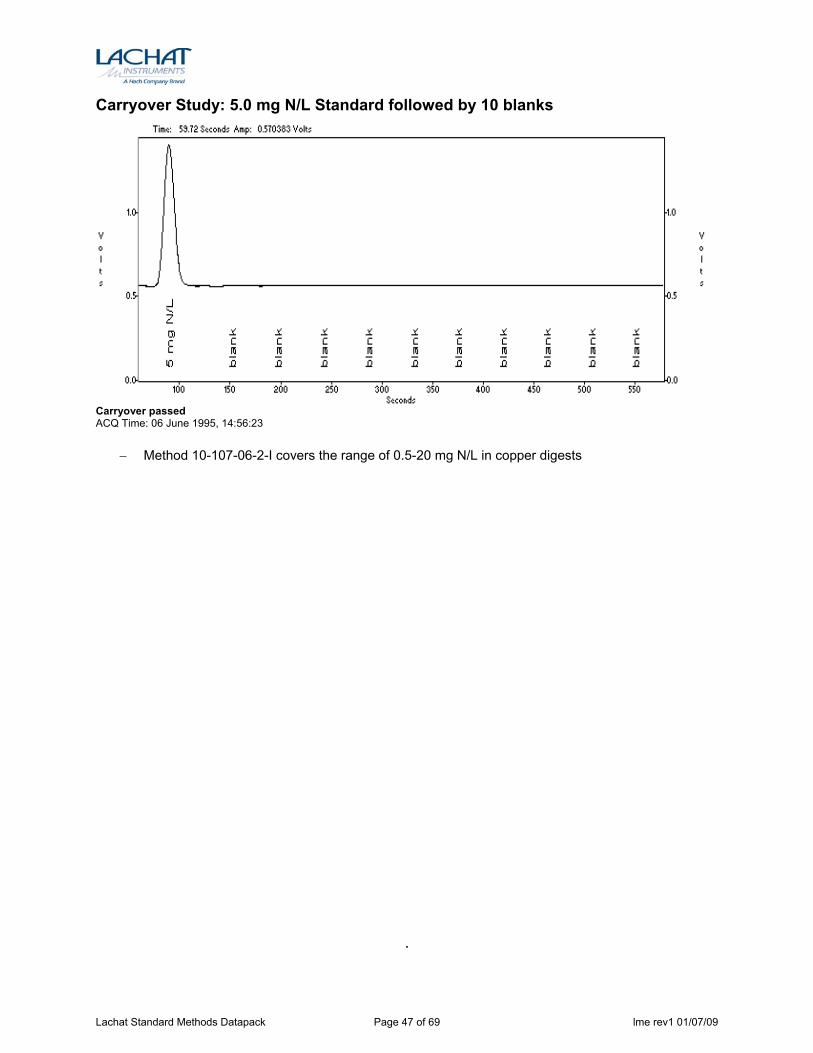
Carryover Study: 5.0 mg N/L Standard followed by 10 blanks
Carryover passed ACQ Time: 06 June 1995, 14:56:23
– Method 10-107-06-2-I covers the range of 0.5-20 mg N/L in copper digests
.
Lachat Standard Methods Datapack Page 47 of 69 lme rev1 01/07/09
Orthophosphate
QuikChem® Method 10-115-01-1-A SM 4500-P G.
Orthophosphate in Waters
0.01 to 2.00 mg P/L
– Principle – The orthophosphate ion (PO4
3-) reacts with ammonium molybdate and antimony potassium tartrate under acidic conditions to form a complex. This complex is reduced with ascorbic acid to form a blue complex which absorbs light at 880 nm. The absorbance is proportional to the concentration of orthophosphate in the sample.
– Interferences – 1. Silica forms a pale blue complex which also absorbs at 880 nm. This interference is generally
insignificant as a silicate concentration of approximately 30 mg SiO2/L would be required to produce a 0.005 mg P/L positive error in orthophosphate.
2. Concentrations of ferric iron (Fe3-) greater than 50 mg/L will cause a negative error due to precipitation of, and subsequent loss, of orthophosphate. Samples high in iron can be pretreated with sodium bisulfite to eliminate this interference. Treatment with bisulfite will also remove the interference due to arsenates.
3. Glassware contamination is a problem in low level phosphorus determinations. Glassware should be washed with 1:1 HCl and rinsed with deionized water. Commercial detergents should rarely be needed but, if they are used, use special phosphate-free preparations for lab glassware.
– Special Apparatus –
Please contact Lachat Technical Support for Ordering Information
1. Heating Unit, Lachat Part No. A85X00 (X=1 for 110V, X=2 for 220V)
Lachat Standard Methods Datapack Page 48 of 69 lme rev1 01/07/09
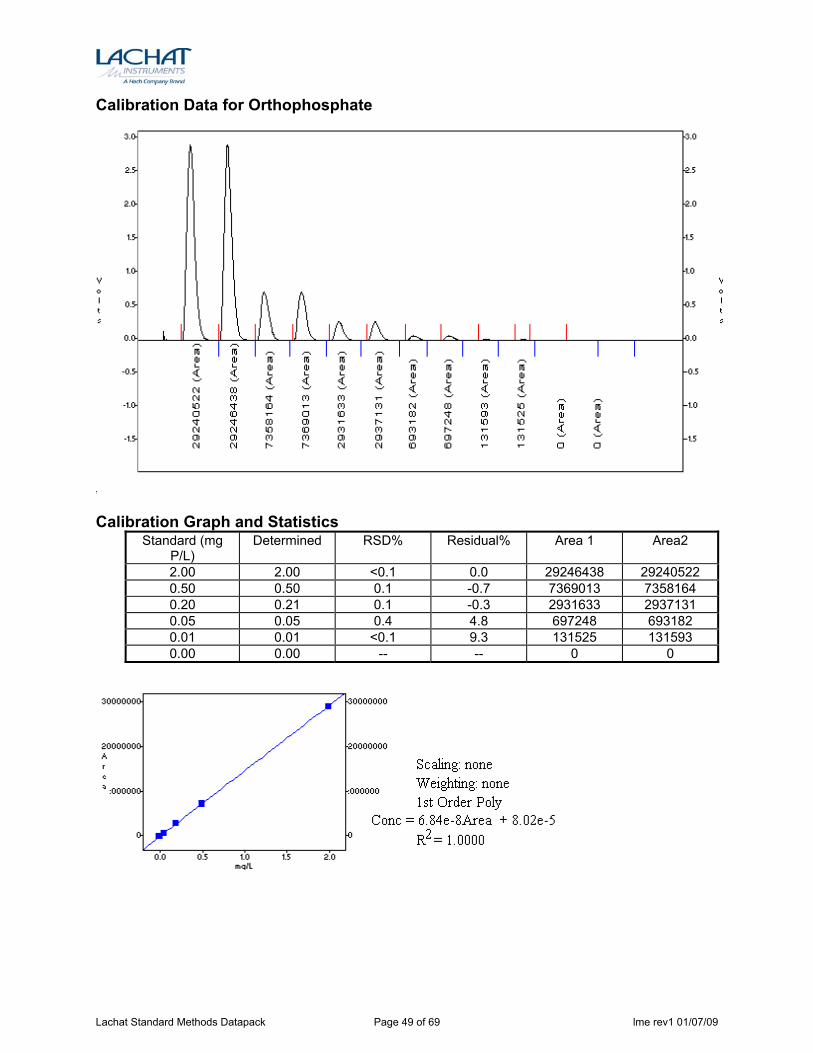
Calibration Data for Orthophosphate
Calibration Graph and Statistics
Standard (mg P/L)
Determined RSD% Residual% Area 1 Area2
2.00 2.00 <0.1 0.0 29246438 29240522 0.50 0.50 0.1 -0.7 7369013 7358164 0.20 0.21 0.1 -0.3 2931633 2937131 0.05 0.05 0.4 4.8 697248 693182 0.01 0.01 <0.1 9.3 131525 131593 0.00 0.00 -- -- 0 0
Lachat Standard Methods Datapack Page 49 of 69 lme rev1 01/07/09
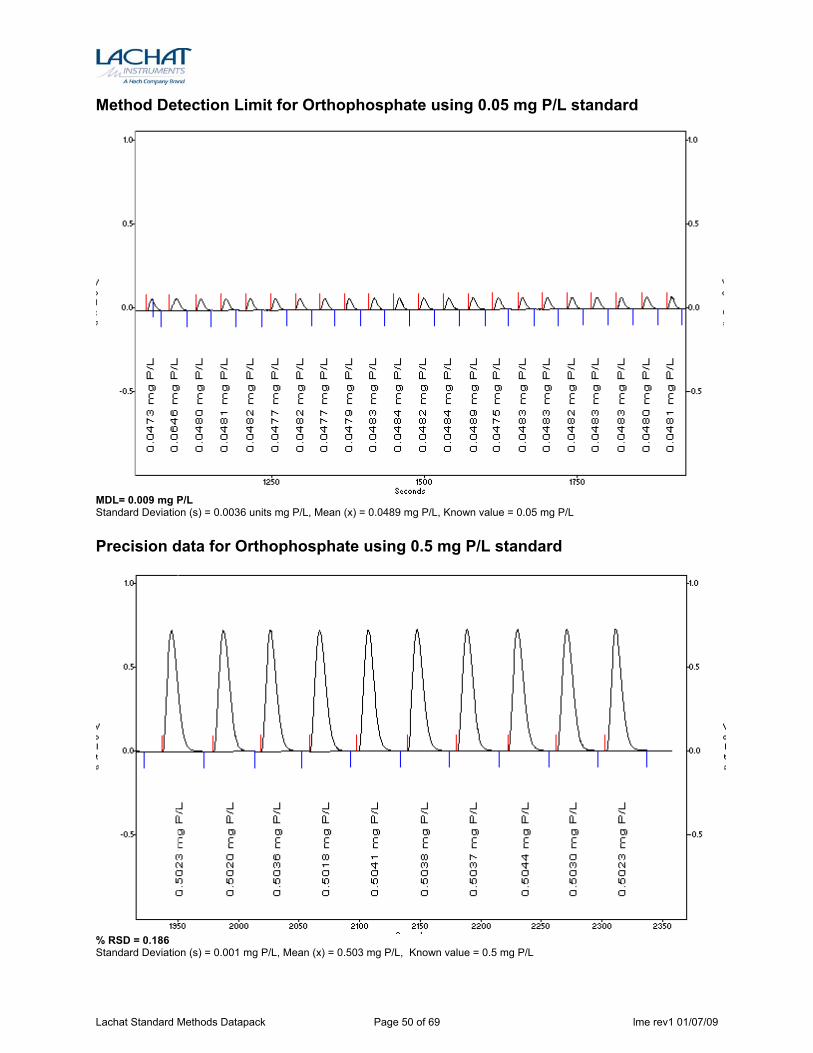
Method Detection Limit for Orthophosphate using 0.05 mg P/L standard
MDL= 0.009 mg P/L Standard Deviation (s) = 0.0036 units mg P/L, Mean (x) = 0.0489 mg P/L, Known value = 0.05 mg P/L Precision data for Orthophosphate using 0.5 mg P/L standard
% RSD = 0.186 Standard Deviation (s) = 0.001 mg P/L, Mean (x) = 0.503 mg P/L, Known value = 0.5 mg P/L
Lachat Standard Methods Datapack Page 50 of 69 lme rev1 01/07/09
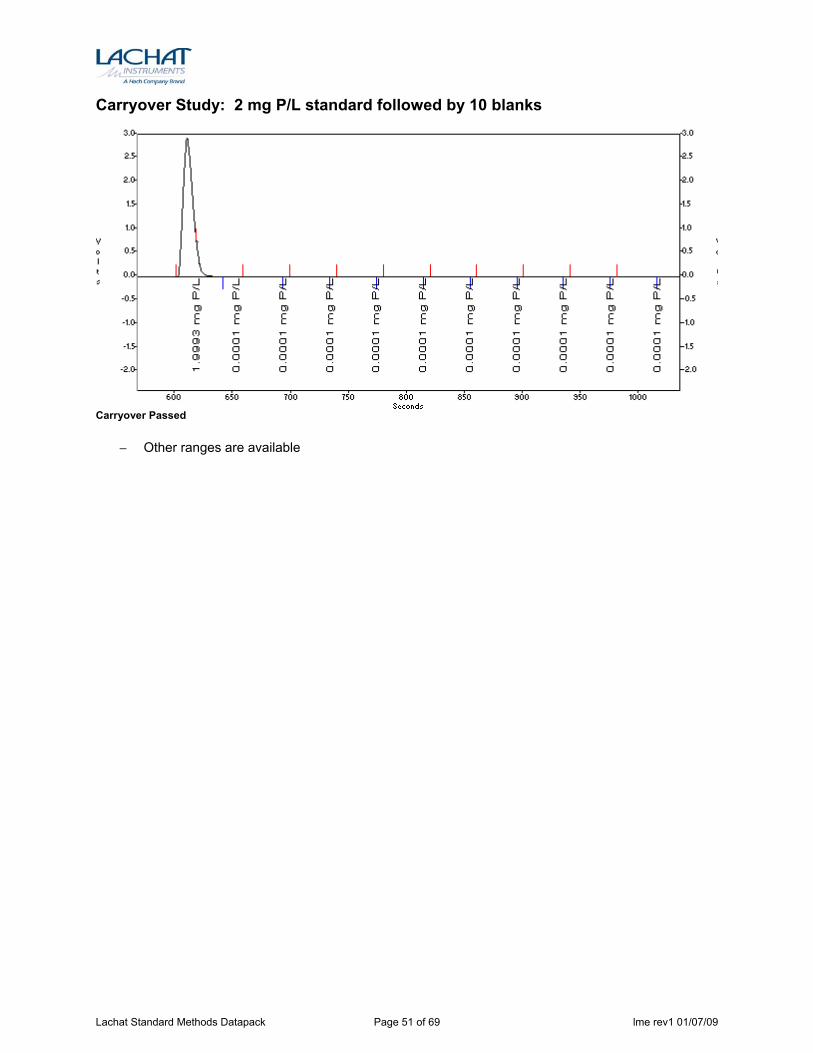
Carryover Study: 2 mg P/L standard followed by 10 blanks
Carryover Passed
– Other ranges are available
Lachat Standard Methods Datapack Page 51 of 69 lme rev1 01/07/09
Total Phosphorus by In-line UV/Persulfate Digestion
and Flow Injection Analysis
QuikChem® Method 10-115-01-3-A SM 4500-P I.
Total Phosphorous (In-Line Persulfate Digests)
0.10 to 10.0 mg P/L
– Principle – The method is based on the digestion of various phosphorous forms and conversion to phosphate by peroxodisulfate with an in-line UV digestion. Organic phosphorus is converted to orthophosphate by UV catalyzed persulfate digestion. Polyphosphates are converted to orthophosphate by sulfuric acid digestion. The digestion process occur prior to the sample valve. A portion of the digested sample is then injected and phosphate is determined by FIA.
Wastewater samples are acid preserved and filtered. When this is the case, in-line digestion results match the manual off-line digestion. If samples are not filtered, in-line results will be 1-15% low compared with off-line digestion. Surface water samples may not require filtration but this should be verified with a sample containing high levels of solids.
After digestion the orthophosphate ion (PO43-) reacts with ammonium molybdate and antimony potassium
tartrate to form a phosphomolybdate complex. This complex is reduced with ascorbic acid to form a blue complex which absorbs light at 880 nm. The absorbance is proportional to the concentration of orthophosphate in the sample.
– Special Apparatus – Please contact Lachat Technical Support for Ordering Information
1. Lachat sample preparation module, A30X11 (x=1 for 110V, x=2 for 220V) with UV-254 nm lamp. 2. PVC PUMP TUBES MUST BE USED FOR THIS METHOD.
Lachat Standard Methods Datapack Page 52 of 69 lme rev1 01/07/09
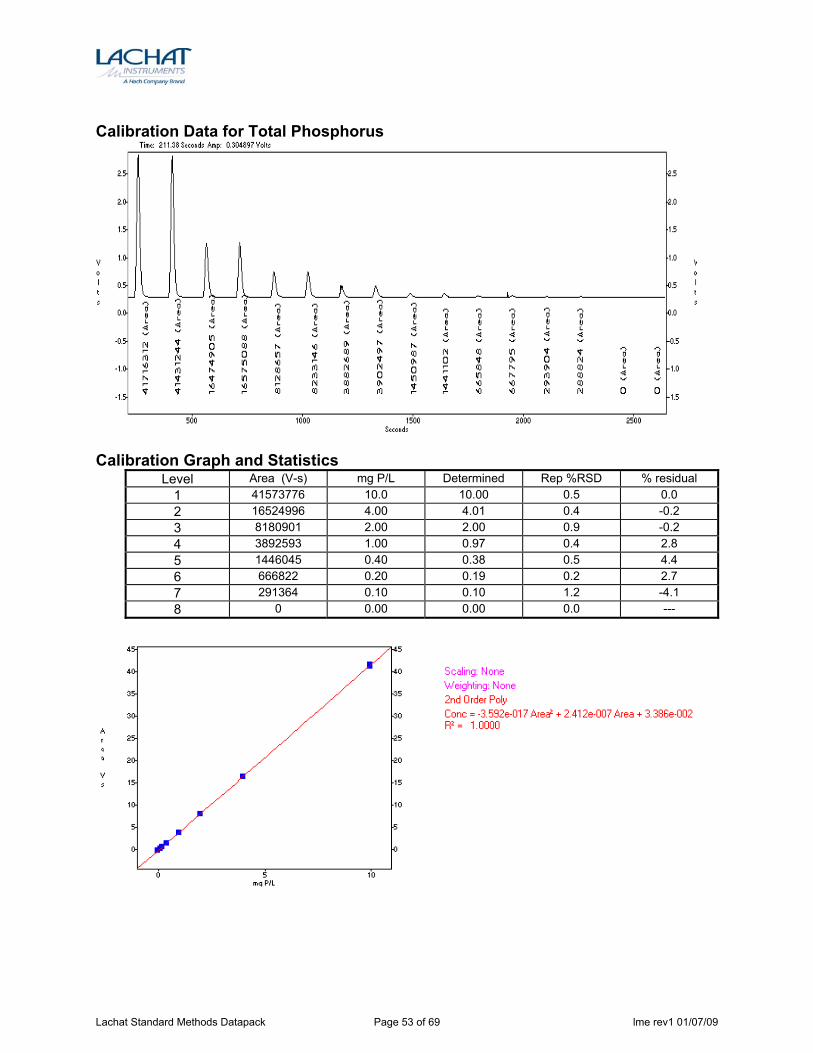
Calibration Data for Total Phosphorus
Calibration Graph and Statistics
Level Area (V-s) mg P/L Determined Rep %RSD % residual 1 41573776 10.0 10.00 0.5 0.0 2 16524996 4.00 4.01 0.4 -0.2 3 8180901 2.00 2.00 0.9 -0.2 4 3892593 1.00 0.97 0.4 2.8 5 1446045 0.40 0.38 0.5 4.4 6 666822 0.20 0.19 0.2 2.7 7 291364 0.10 0.10 1.2 -4.1 8 0 0.00 0.00 0.0 ---
Lachat Standard Methods Datapack Page 53 of 69 lme rev1 01/07/09
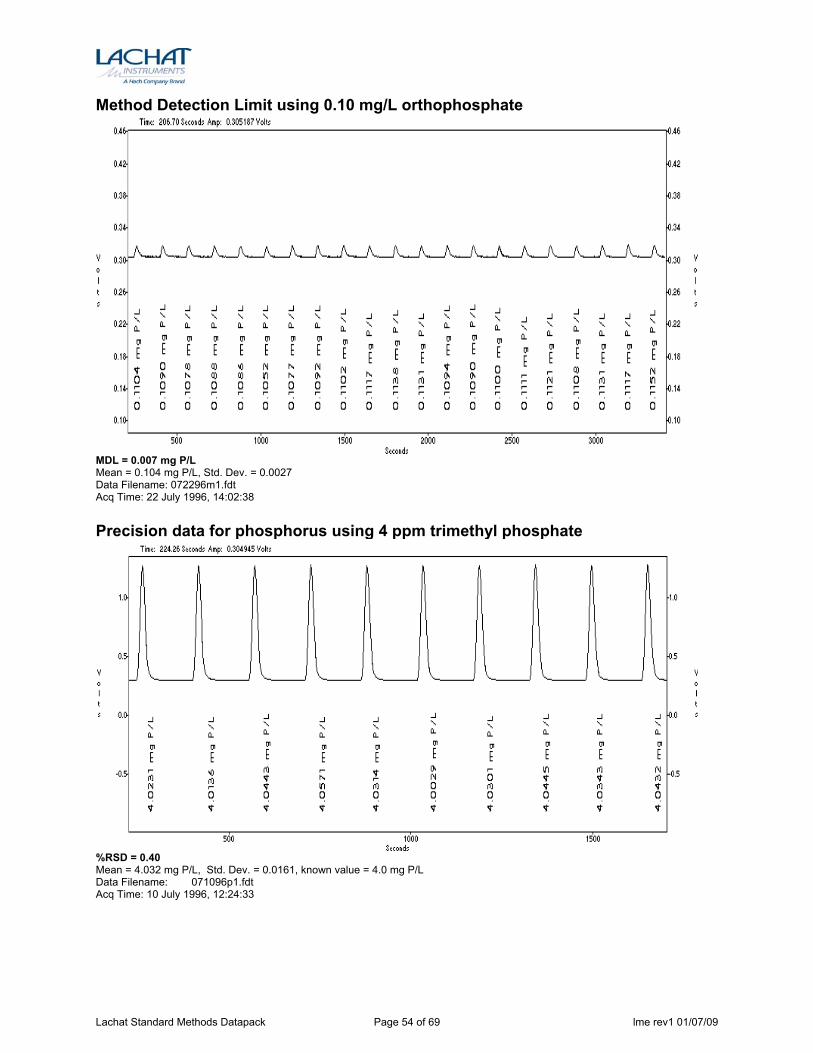
Method Detection Limit using 0.10 mg/L orthophosphate
MDL = 0.007 mg P/L Mean = 0.104 mg P/L, Std. Dev. = 0.0027 Data Filename: 072296m1.fdt Acq Time: 22 July 1996, 14:02:38 Precision data for phosphorus using 4 ppm trimethyl phosphate
%RSD = 0.40 Mean = 4.032 mg P/L, Std. Dev. = 0.0161, known value = 4.0 mg P/L Data Filename: 071096p1.fdt Acq Time: 10 July 1996, 12:24:33
Lachat Standard Methods Datapack Page 54 of 69 lme rev1 01/07/09
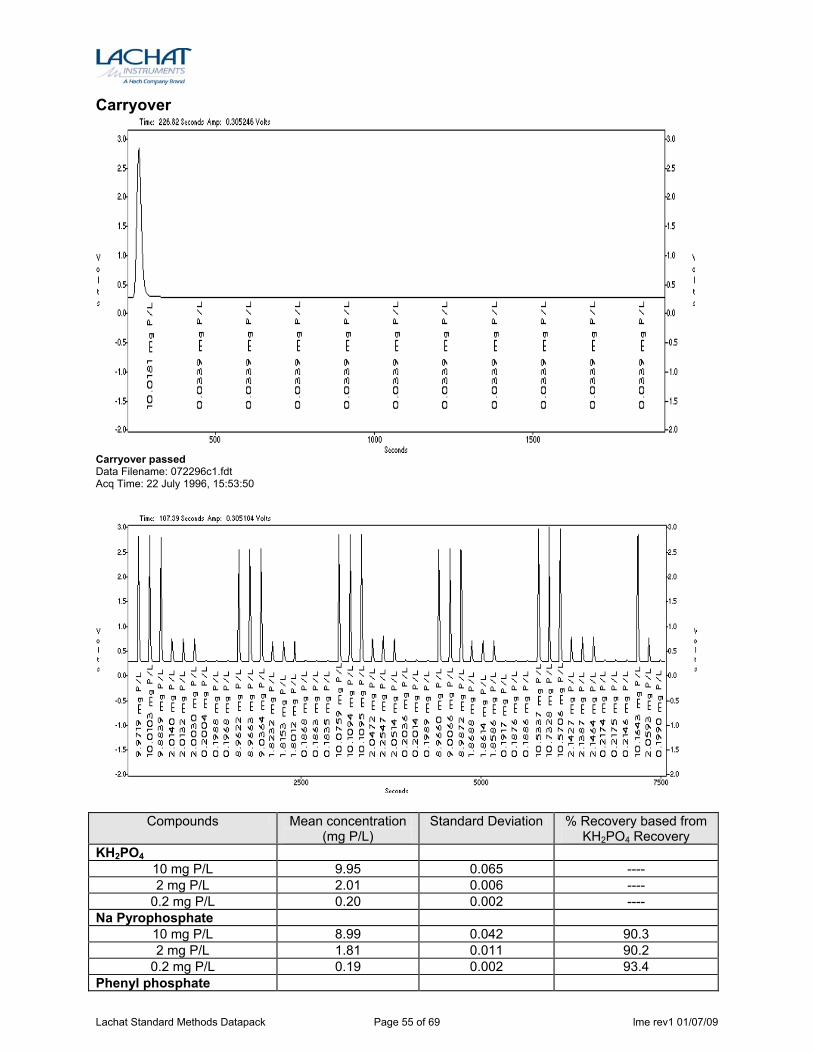
Carryover
Carryover passed Data Filename: 072296c1.fdt Acq Time: 22 July 1996, 15:53:50
Compounds Mean concentration (mg P/L)
Standard Deviation % Recovery based from KH2PO4 Recovery
KH2PO4 10 mg P/L 9.95 0.065 ---- 2 mg P/L 2.01 0.006 ----
0.2 mg P/L 0.20 0.002 ---- Na Pyrophosphate
10 mg P/L 8.99 0.042 90.3 2 mg P/L 1.81 0.011 90.2
0.2 mg P/L 0.19 0.002 93.4 Phenyl phosphate
Lachat Standard Methods Datapack Page 55 of 69 lme rev1 01/07/09
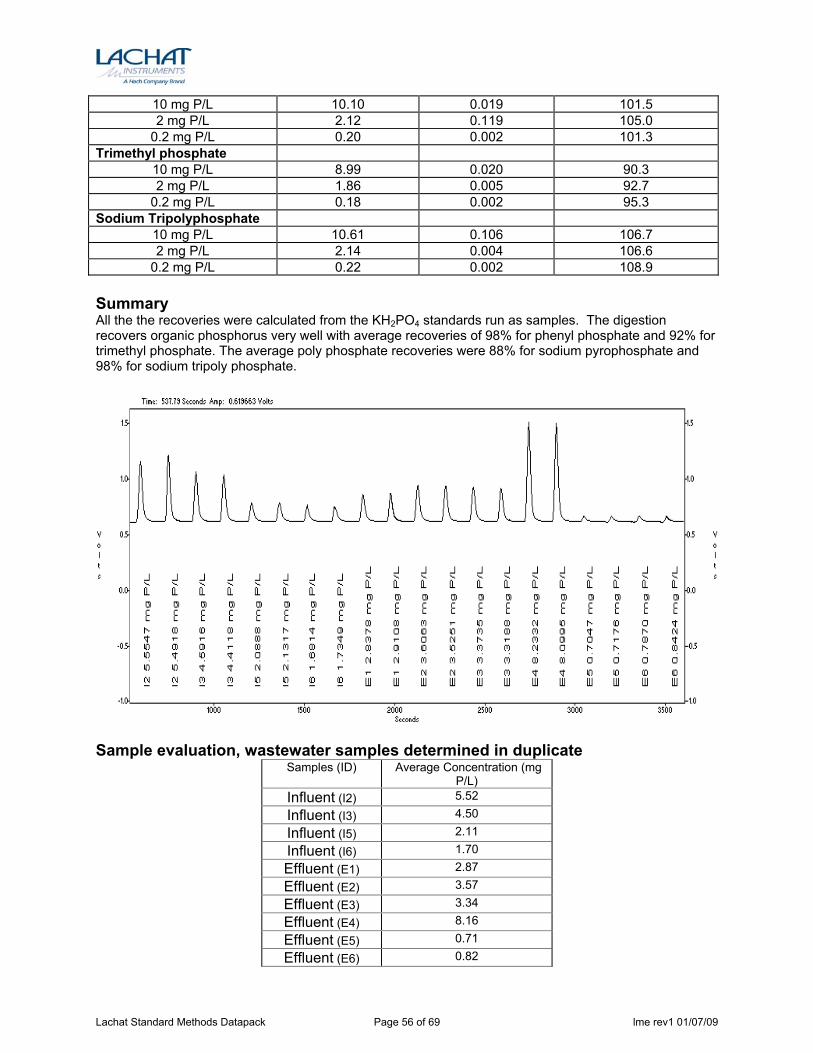
10 mg P/L 10.10 0.019 101.5 2 mg P/L 2.12 0.119 105.0
0.2 mg P/L 0.20 0.002 101.3 Trimethyl phosphate
10 mg P/L 8.99 0.020 90.3 2 mg P/L 1.86 0.005 92.7
0.2 mg P/L 0.18 0.002 95.3 Sodium Tripolyphosphate
10 mg P/L 10.61 0.106 106.7 2 mg P/L 2.14 0.004 106.6
0.2 mg P/L 0.22 0.002 108.9 Summary All the the recoveries were calculated from the KH2PO4 standards run as samples. The digestion recovers organic phosphorus very well with average recoveries of 98% for phenyl phosphate and 92% for trimethyl phosphate. The average poly phosphate recoveries were 88% for sodium pyrophosphate and 98% for sodium tripoly phosphate.
Sample evaluation, wastewater samples determined in duplicate
Samples (ID) Average Concentration (mg P/L)
Influent (I2) 5.52
Influent (I3) 4.50
Influent (I5) 2.11
Influent (I6) 1.70
Effluent (E1) 2.87
Effluent (E2) 3.57
Effluent (E3) 3.34
Effluent (E4) 8.16
Effluent (E5) 0.71
Effluent (E6) 0.82
Lachat Standard Methods Datapack Page 56 of 69 lme rev1 01/07/09
Silicate by Flow Injection Analysis
QuikChem® Method 10-114-27-1-B
SM 4500 SiO2 F.
Molybdate-Reactive Silicate in Waters
5.0 to 100 μg SiO2/L
– Principle – Silicate reacts with molybdate under acidic conditions to form yellow beta molybdosilicic acid. This acid is subsequently reduced with stannous chloride to form a heteropoly blue complex which has an absorbance maximum at 820 nm. Oxalic acid is added to reduce the interference from phosphate.
– Interferences – 1. The interference due to phosphate is reduced by the addition of oxalic acid. A solution of 1000 μg
P/L was determined as 20 μg SiO2/L. The extent of phosphate interference should be verified by determining a solution of phosphate at the highest concentration that is expected to be encountered. If the 7 cm reaction coil after the oxalic acid does not sufficiently reduce phosphate interference, a longer coil can be used.
2. Tannin and large amounts of iron or sulfides are interferences. Sulfides can be removed by boiling and acidifying the sample. Addition of disodium EDTA will eliminate the interference due to iron. Treatment with oxalic acid decreases interference from tannin.
3. Sample color and turbidity can interfere. The presence of these interferences can be determined by analyzing samples without the presence of molybdate.
4. Silica contamination may be avoided by storing samples, standards, and reagents in plastic. Deionize glass-distilled water before use to remove silica.
– Special Apparatus –
Please contact Lachat Technical Support for Ordering Information
1. Heating Unit Lachat Part No. A85X00 (X=1 for 110V, X=2 for 220V) 2. Plastic sample (PN 21042) and calibration vials (PN 21409) must be used with this method. 3. Glass line weights must NOT be used with this method.
Lachat Standard Methods Datapack Page 57 of 69 lme rev1 01/07/09
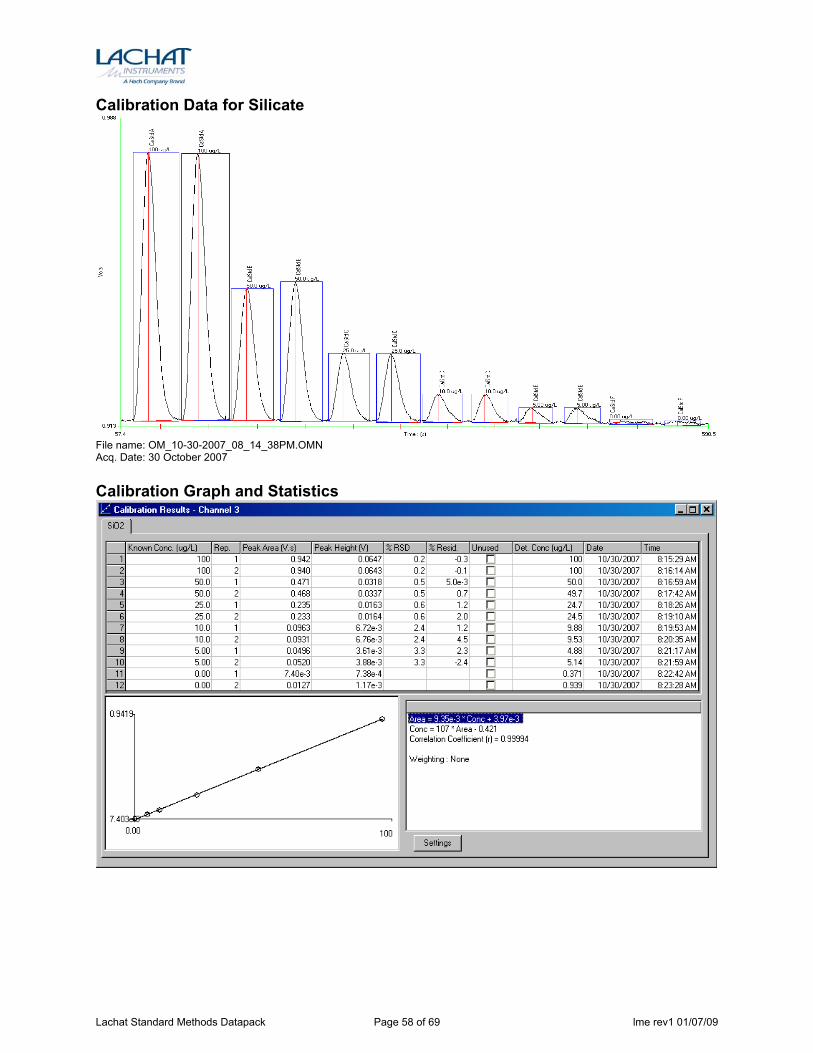
Calibration Data for Silicate
File name: OM_10-30-2007_08_14_38PM.OMN Acq. Date: 30 October 2007 Calibration Graph and Statistics
Lachat Standard Methods Datapack Page 58 of 69 lme rev1 01/07/09
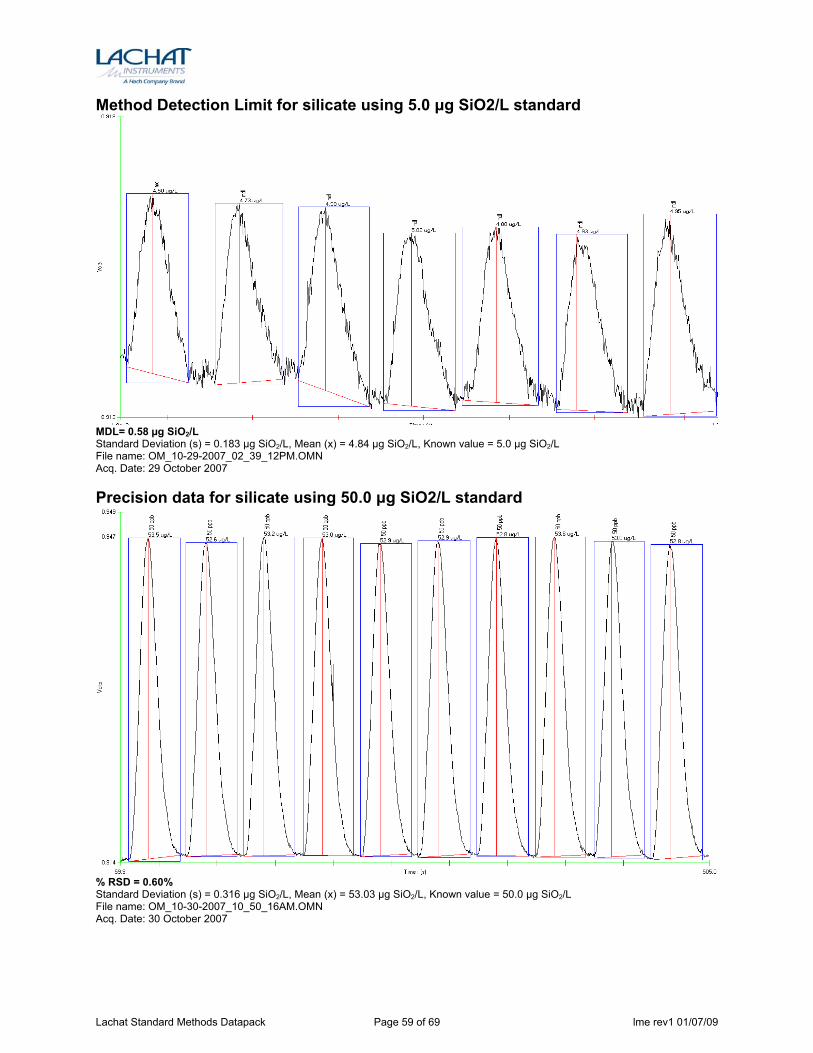
Method Detection Limit for silicate using 5.0 μg SiO2/L standard
MDL= 0.58 µg SiO2/L Standard Deviation (s) = 0.183 μg SiO2/L, Mean (x) = 4.84 μg SiO2/L, Known value = 5.0 μg SiO2/L File name: OM_10-29-2007_02_39_12PM.OMN Acq. Date: 29 October 2007 Precision data for silicate using 50.0 μg SiO2/L standard
% RSD = 0.60% Standard Deviation (s) = 0.316 μg SiO2/L, Mean (x) = 53.03 μg SiO2/L, Known value = 50.0 μg SiO2/L File name: OM_10-30-2007_10_50_16AM.OMN Acq. Date: 30 October 2007
Lachat Standard Methods Datapack Page 59 of 69 lme rev1 01/07/09
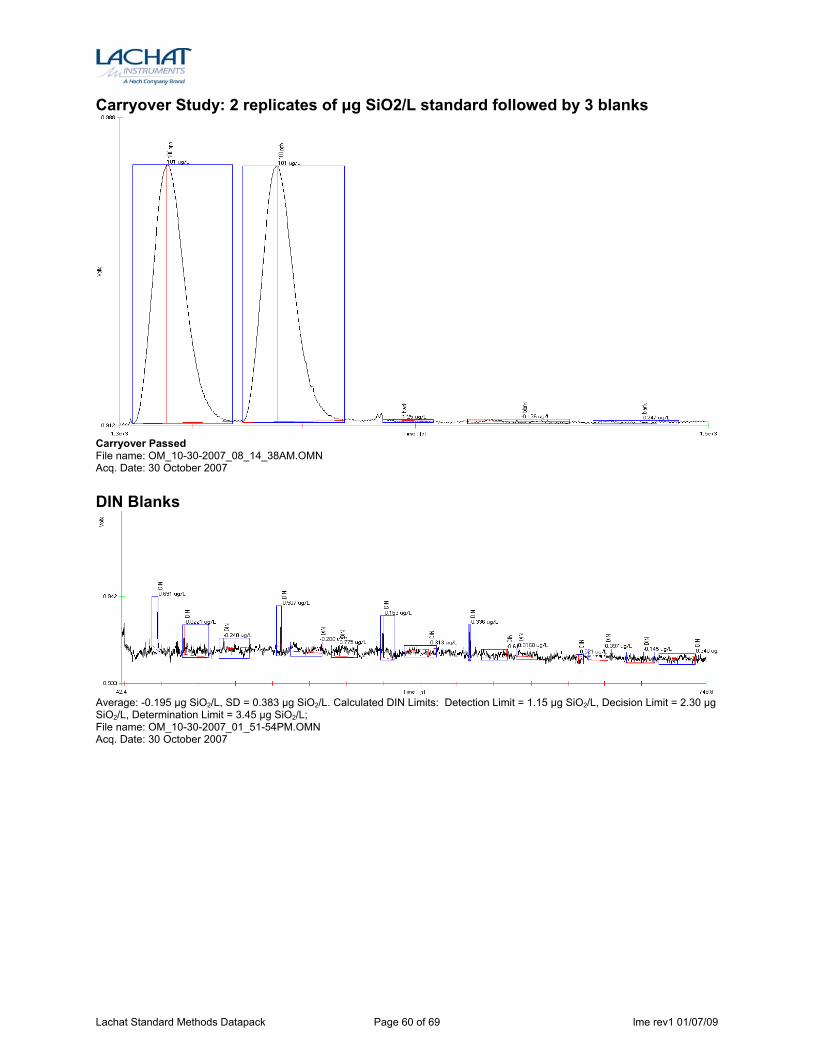
Carryover Study: 2 replicates of μg SiO2/L standard followed by 3 blanks
Carryover Passed File name: OM_10-30-2007_08_14_38AM.OMN Acq. Date: 30 October 2007 DIN Blanks
Average: -0.195 μg SiO2/L, SD = 0.383 μg SiO2/L. Calculated DIN Limits: Detection Limit = 1.15 μg SiO2/L, Decision Limit = 2.30 μg SiO2/L, Determination Limit = 3.45 μg SiO2/L; File name: OM_10-30-2007_01_51-54PM.OMN Acq. Date: 30 October 2007
Lachat Standard Methods Datapack Page 60 of 69 lme rev1 01/07/09
Sulfide by MicroDIST
Methylene Blue Flow Injection Analysis Method
QuikChem® Method 10-116-29-1-A
(SM 4500-S2- I.)
Sulfide by MICRODIST®
0.02 to 2.0 mg S/L
– Principle – Water and wastewater samples are distilled into a sodium hydroxide trapping solution and the distillate is then sampled. Hydrogen sulfide (H2S) reacts in acid media and in the presence of ferric chloride with two molecules of N,N-dimethyl-p-phenylenediamine to form methylene blue. The resulting color is read at 660 nm.
– Interferences – 1. Strong reducing agents inhibit color formation at levels of several hundred ppm. 2. Iodide interferes at levels greater than 2 mg/L.
– Special Apparatus – Please contact Lachat Technical Support for Ordering Information
1. Heating Unit Lachat Part No. A85X00 (X=1 for 110V, X=2 for 220V) 2. MICRO DIST® (Lachat Part No. A17102) and MICRO DIST® tubes (Lachat Part No. A17009)
Lachat Standard Methods Datapack Page 61 of 69 lme rev1 01/07/09
Calibration Data for Sulfide
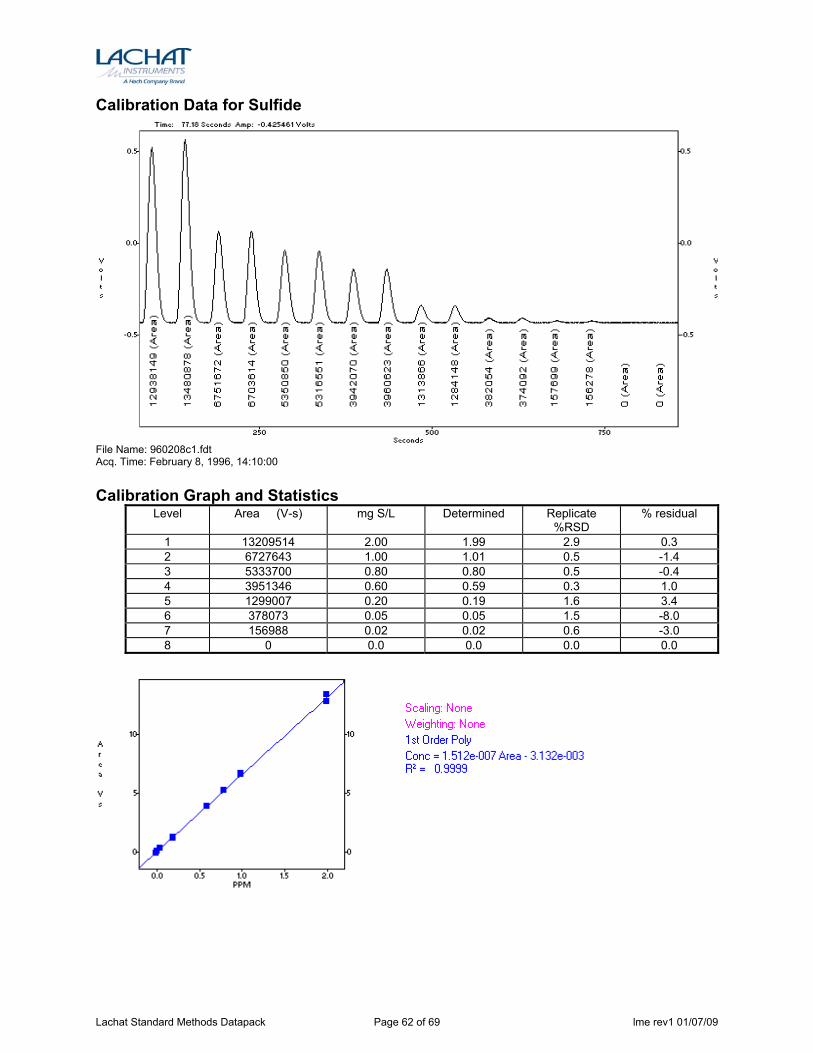
File Name: 960208c1.fdt Acq. Time: February 8, 1996, 14:10:00 Calibration Graph and Statistics
Level Area (V-s) mg S/L Determined Replicate %RSD
% residual
1 13209514 2.00 1.99 2.9 0.3 2 6727643 1.00 1.01 0.5 -1.4 3 5333700 0.80 0.80 0.5 -0.4 4 3951346 0.60 0.59 0.3 1.0 5 1299007 0.20 0.19 1.6 3.4 6 378073 0.05 0.05 1.5 -8.0 7 156988 0.02 0.02 0.6 -3.0 8 0 0.0 0.0 0.0 0.0
Lachat Standard Methods Datapack Page 62 of 69 lme rev1 01/07/09
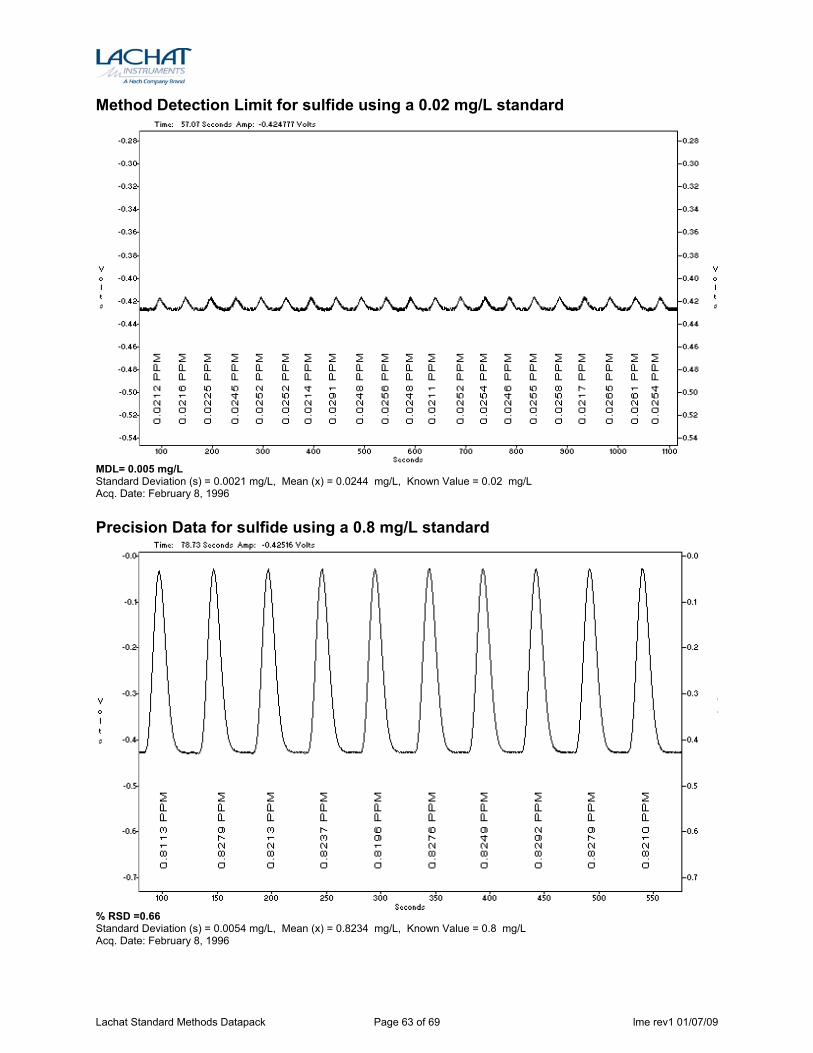
Method Detection Limit for sulfide using a 0.02 mg/L standard
MDL= 0.005 mg/L Standard Deviation (s) = 0.0021 mg/L, Mean (x) = 0.0244 mg/L, Known Value = 0.02 mg/L Acq. Date: February 8, 1996 Precision Data for sulfide using a 0.8 mg/L standard
% RSD =0.66 Standard Deviation (s) = 0.0054 mg/L, Mean (x) = 0.8234 mg/L, Known Value = 0.8 mg/L Acq. Date: February 8, 1996
Lachat Standard Methods Datapack Page 63 of 69 lme rev1 01/07/09
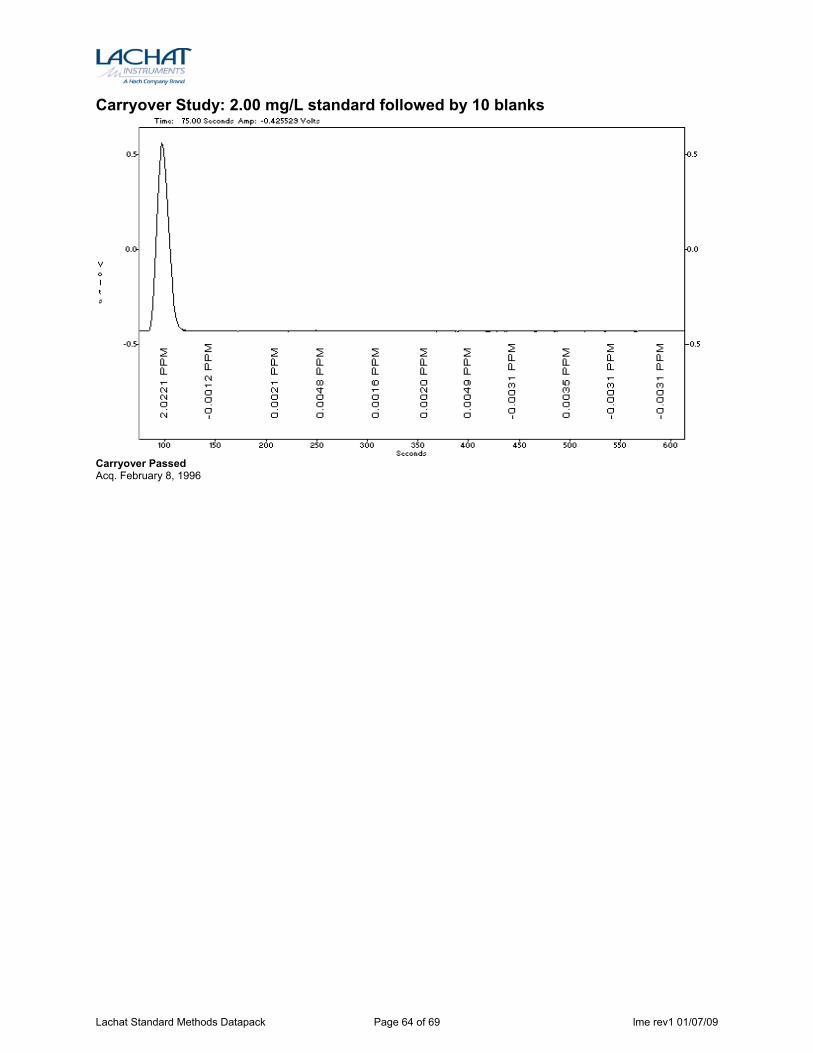
Carryover Study: 2.00 mg/L standard followed by 10 blanks
Carryover Passed Acq. February 8, 1996
Lachat Standard Methods Datapack Page 64 of 69 lme rev1 01/07/09
Sulfate Methylthymol Blue Flow Injection
Analysis
QuikChem® Method 10-116-10-2-A SM 4500-SO4
2- G.
Sulfate (Methylthymol Blue) in Waters
5 to 100 mg SO42-/L
– Principle – At pH 13.0 barium forms a blue complex with methythymol blue (MTB). This gives a dark blue baseline. The sample is injected into a low, but known, concentration of sulfate. The sulfate from the sample then reacts with the ethanolic barium-MTB solution and displaces the MTB from the barium to give barium sulfate and uncomplexed MTB. Uncomplexed MTB has a gray color. The pH is raised and the gray color of uncomplexed MTB is measured at 460 nm.
– Interferences – 1. Multivalent cations: A cation exchange column removes multivalent cations such as Ca2+ and
Mg2+. A midrange sulfate standard containing a typical level of hardness as CaCO3 can be run periodically to check the performance of the column. Any decrease in peak height from that of a sulfate standard without added CaCO3 indicates the need to regenerate or replace the resin.
2. Strongly acidic samples: Samples with pH less than 2 must be neutralized. High acid concentrations can displace multivalent cations from the column.
3. Turbidity: Turbid samples may be filtered or centrifuged. 4. Orthophosphate: Orthophosphate forms a precipitate with barium at high pH. If samples are known
to be high in orthophosphate, a recovery study, using added amounts of sulfate, should be done, or a sample blank containing only orthophosphate should be run.
Lachat Standard Methods Datapack Page 65 of 69 lme rev1 01/07/09
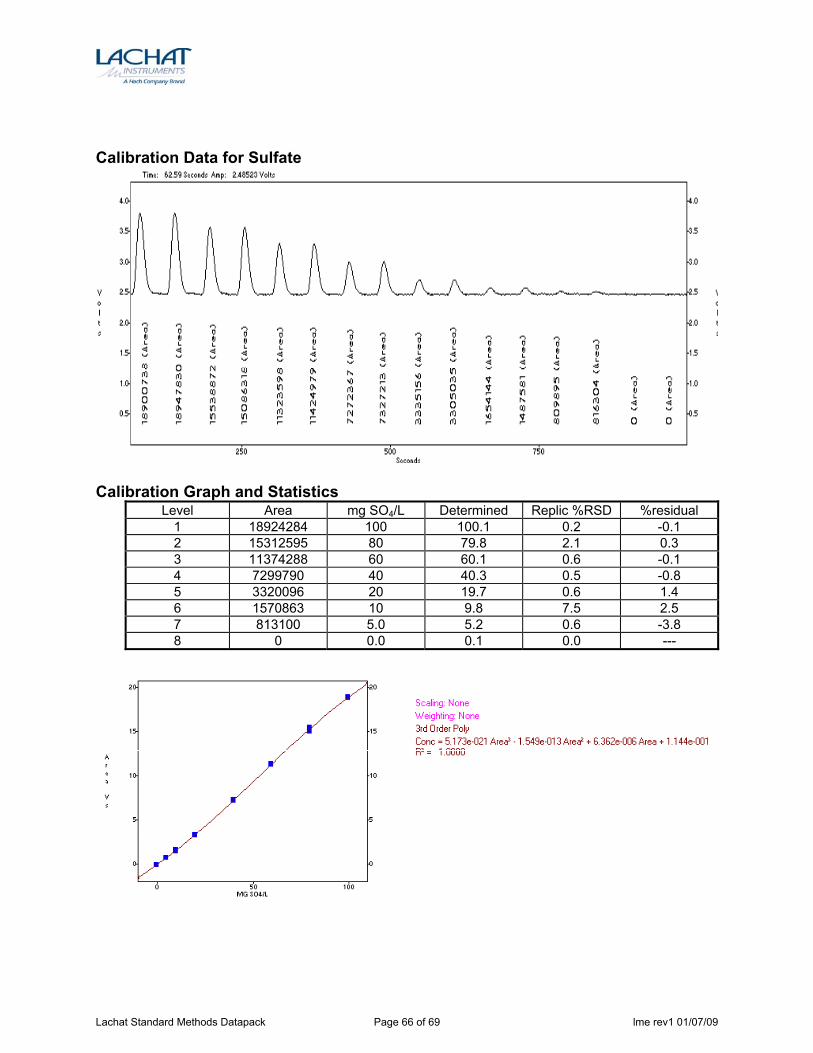
Calibration Data for Sulfate
Calibration Graph and Statistics
Level Area mg SO4/L Determined Replic %RSD %residual 1 18924284 100 100.1 0.2 -0.1 2 15312595 80 79.8 2.1 0.3 3 11374288 60 60.1 0.6 -0.1 4 7299790 40 40.3 0.5 -0.8 5 3320096 20 19.7 0.6 1.4 6 1570863 10 9.8 7.5 2.5 7 813100 5.0 5.2 0.6 -3.8 8 0 0.0 0.1 0.0 ---
Lachat Standard Methods Datapack Page 66 of 69 lme rev1 01/07/09
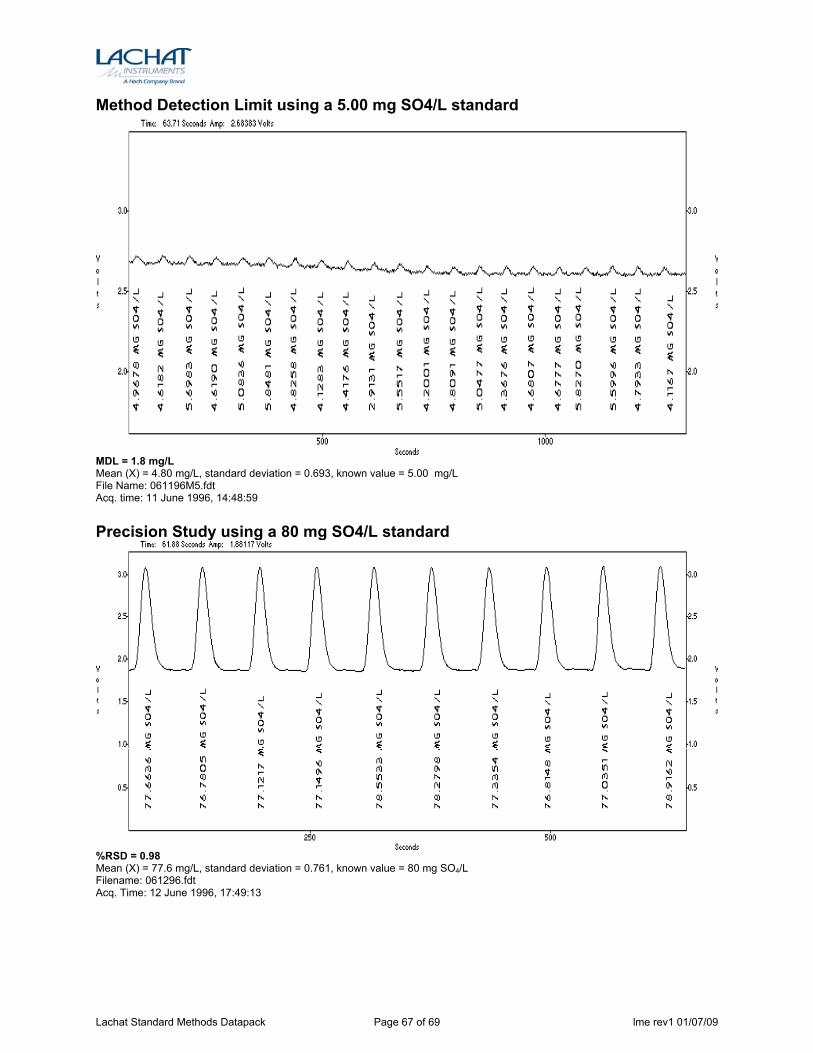
Method Detection Limit using a 5.00 mg SO4/L standard
MDL = 1.8 mg/L Mean (X) = 4.80 mg/L, standard deviation = 0.693, known value = 5.00 mg/L File Name: 061196M5.fdt Acq. time: 11 June 1996, 14:48:59 Precision Study using a 80 mg SO4/L standard
%RSD = 0.98 Mean (X) = 77.6 mg/L, standard deviation = 0.761, known value = 80 mg SO4/L Filename: 061296.fdt Acq. Time: 12 June 1996, 17:49:13
Lachat Standard Methods Datapack Page 67 of 69 lme rev1 01/07/09
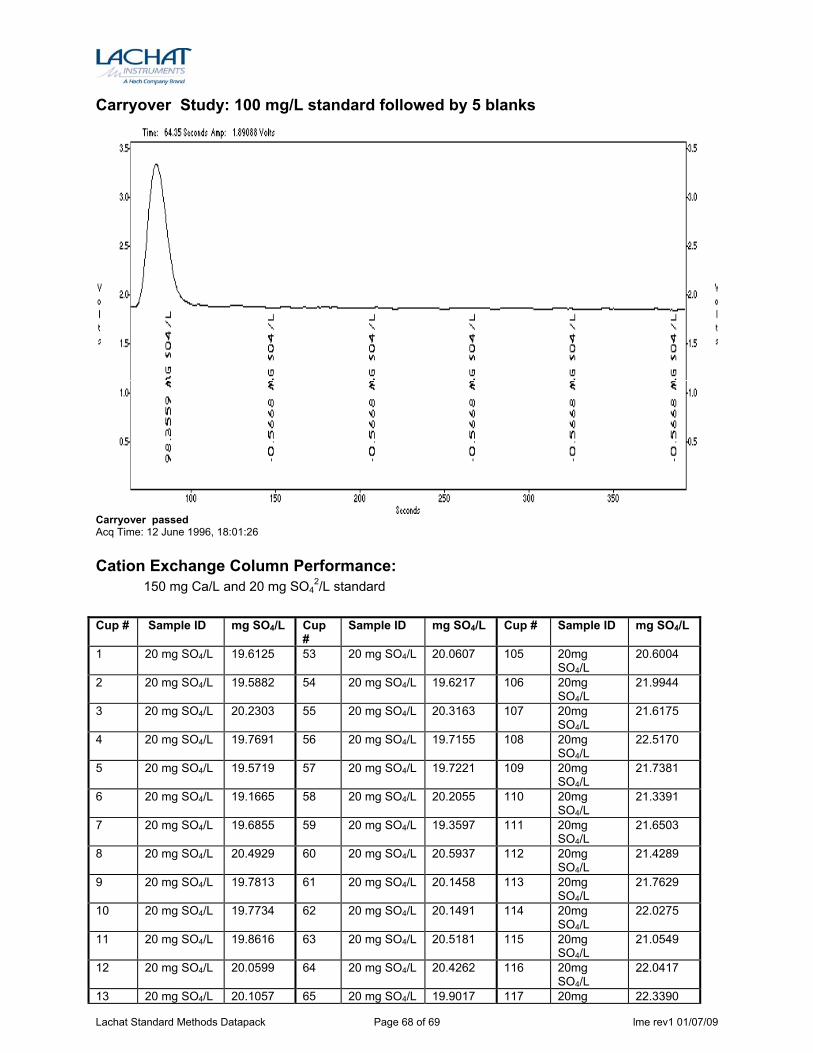
Carryover Study: 100 mg/L standard followed by 5 blanks
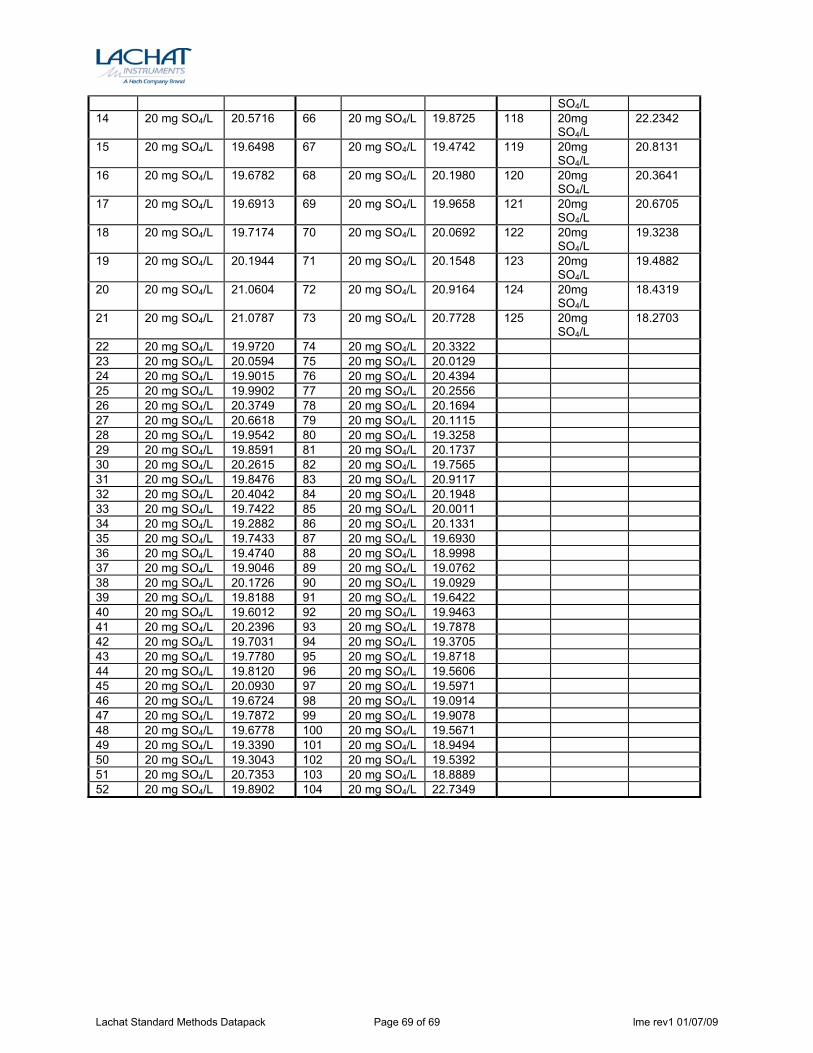
Carryover passed Acq Time: 12 June 1996, 18:01:26 Cation Exchange Column Performance:
150 mg Ca/L and 20 mg SO42/L standard
Cup # Sample ID mg SO4/L Cup
# Sample ID mg SO4/L Cup # Sample ID mg SO4/L
1 20 mg SO4/L 19.6125 53 20 mg SO4/L 20.0607 105 20mg SO4/L
20.6004
2 20 mg SO4/L 19.5882 54 20 mg SO4/L 19.6217 106 20mg SO4/L
21.9944
3 20 mg SO4/L 20.2303 55 20 mg SO4/L 20.3163 107 20mg SO4/L
21.6175
4 20 mg SO4/L 19.7691 56 20 mg SO4/L 19.7155 108 20mg SO4/L
22.5170
5 20 mg SO4/L 19.5719 57 20 mg SO4/L 19.7221 109 20mg SO4/L
21.7381
6 20 mg SO4/L 19.1665 58 20 mg SO4/L 20.2055 110 20mg SO4/L
21.3391
7 20 mg SO4/L 19.6855 59 20 mg SO4/L 19.3597 111 20mg SO4/L
21.6503
8 20 mg SO4/L 20.4929 60 20 mg SO4/L 20.5937 112 20mg SO4/L
21.4289
9 20 mg SO4/L 19.7813 61 20 mg SO4/L 20.1458 113 20mg SO4/L
21.7629
10 20 mg SO4/L 19.7734 62 20 mg SO4/L 20.1491 114 20mg SO4/L
22.0275
11 20 mg SO4/L 19.8616 63 20 mg SO4/L 20.5181 115 20mg SO4/L
21.0549
12 20 mg SO4/L 20.0599 64 20 mg SO4/L 20.4262 116 20mg SO4/L
22.0417
13 20 mg SO4/L 20.1057 65 20 mg SO4/L 19.9017 117 20mg 22.3390
Lachat Standard Methods Datapack Page 68 of 69 lme rev1 01/07/09
SO4/L 14 20 mg SO4/L 20.5716 66 20 mg SO4/L 19.8725 118 20mg
SO4/L 22.2342
15 20 mg SO4/L 19.6498 67 20 mg SO4/L 19.4742 119 20mg SO4/L
20.8131
16 20 mg SO4/L 19.6782 68 20 mg SO4/L 20.1980 120 20mg SO4/L
20.3641
17 20 mg SO4/L 19.6913 69 20 mg SO4/L 19.9658 121 20mg SO4/L
20.6705
18 20 mg SO4/L 19.7174 70 20 mg SO4/L 20.0692 122 20mg SO4/L
19.3238
19 20 mg SO4/L 20.1944 71 20 mg SO4/L 20.1548 123 20mg SO4/L
19.4882
20 20 mg SO4/L 21.0604 72 20 mg SO4/L 20.9164 124 20mg SO4/L
18.4319
21 20 mg SO4/L 21.0787 73 20 mg SO4/L 20.7728 125 20mg SO4/L
18.2703
22 20 mg SO4/L 19.9720 74 20 mg SO4/L 20.3322 23 20 mg SO4/L 20.0594 75 20 mg SO4/L 20.0129 24 20 mg SO4/L 19.9015 76 20 mg SO4/L 20.4394 25 20 mg SO4/L 19.9902 77 20 mg SO4/L 20.2556 26 20 mg SO4/L 20.3749 78 20 mg SO4/L 20.1694 27 20 mg SO4/L 20.6618 79 20 mg SO4/L 20.1115 28 20 mg SO4/L 19.9542 80 20 mg SO4/L 19.3258 29 20 mg SO4/L 19.8591 81 20 mg SO4/L 20.1737 30 20 mg SO4/L 20.2615 82 20 mg SO4/L 19.7565 31 20 mg SO4/L 19.8476 83 20 mg SO4/L 20.9117 32 20 mg SO4/L 20.4042 84 20 mg SO4/L 20.1948 33 20 mg SO4/L 19.7422 85 20 mg SO4/L 20.0011 34 20 mg SO4/L 19.2882 86 20 mg SO4/L 20.1331 35 20 mg SO4/L 19.7433 87 20 mg SO4/L 19.6930 36 20 mg SO4/L 19.4740 88 20 mg SO4/L 18.9998 37 20 mg SO4/L 19.9046 89 20 mg SO4/L 19.0762 38 20 mg SO4/L 20.1726 90 20 mg SO4/L 19.0929 39 20 mg SO4/L 19.8188 91 20 mg SO4/L 19.6422 40 20 mg SO4/L 19.6012 92 20 mg SO4/L 19.9463 41 20 mg SO4/L 20.2396 93 20 mg SO4/L 19.7878 42 20 mg SO4/L 19.7031 94 20 mg SO4/L 19.3705 43 20 mg SO4/L 19.7780 95 20 mg SO4/L 19.8718 44 20 mg SO4/L 19.8120 96 20 mg SO4/L 19.5606 45 20 mg SO4/L 20.0930 97 20 mg SO4/L 19.5971 46 20 mg SO4/L 19.6724 98 20 mg SO4/L 19.0914 47 20 mg SO4/L 19.7872 99 20 mg SO4/L 19.9078 48 20 mg SO4/L 19.6778 100 20 mg SO4/L 19.5671 49 20 mg SO4/L 19.3390 101 20 mg SO4/L 18.9494 50 20 mg SO4/L 19.3043 102 20 mg SO4/L 19.5392 51 20 mg SO4/L 20.7353 103 20 mg SO4/L 18.8889 52 20 mg SO4/L 19.8902 104 20 mg SO4/L 22.7349
Lachat Standard Methods Datapack Page 69 of 69 lme rev1 01/07/09