Embed Size (px)
Citation preview
Azma amira bt mohamadNoor asyikin bt kamarazaman
Syanawiyyah bt Md ZinWan norfarhah bt wan harun.
The intensity of light is a factor which affects the rate of photosynthesis. Low light intensity would
produce a low rate of photosynthesis. An increase in light leads to a higher rate of
photosynthesis. Once the light intensity reaches 10 000 lux, the photosynthesis rate becomes
constant.
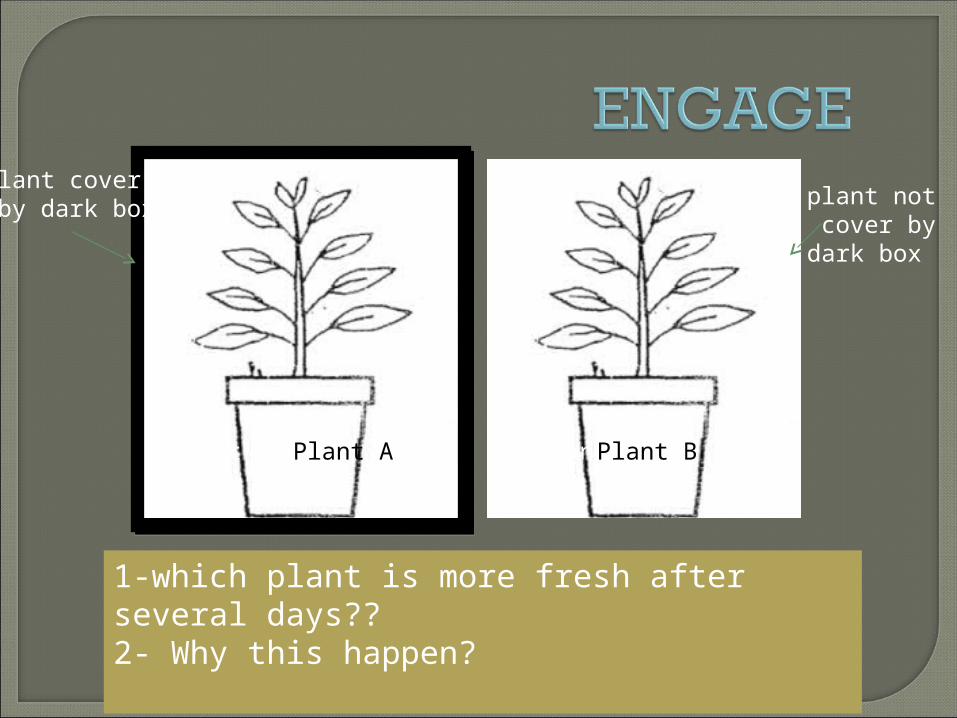
1-which plant is more fresh after several days??2- Why this happen?
plant cover by dark box plant not
cover by dark box
Plant A Plant BPlant A Plant B
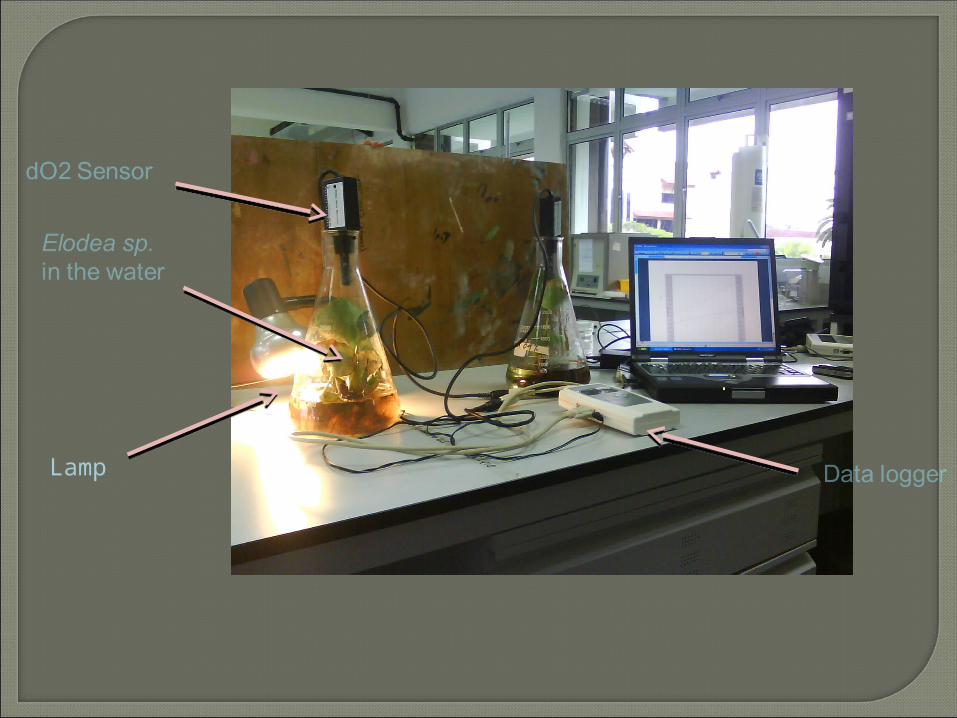
Lamp

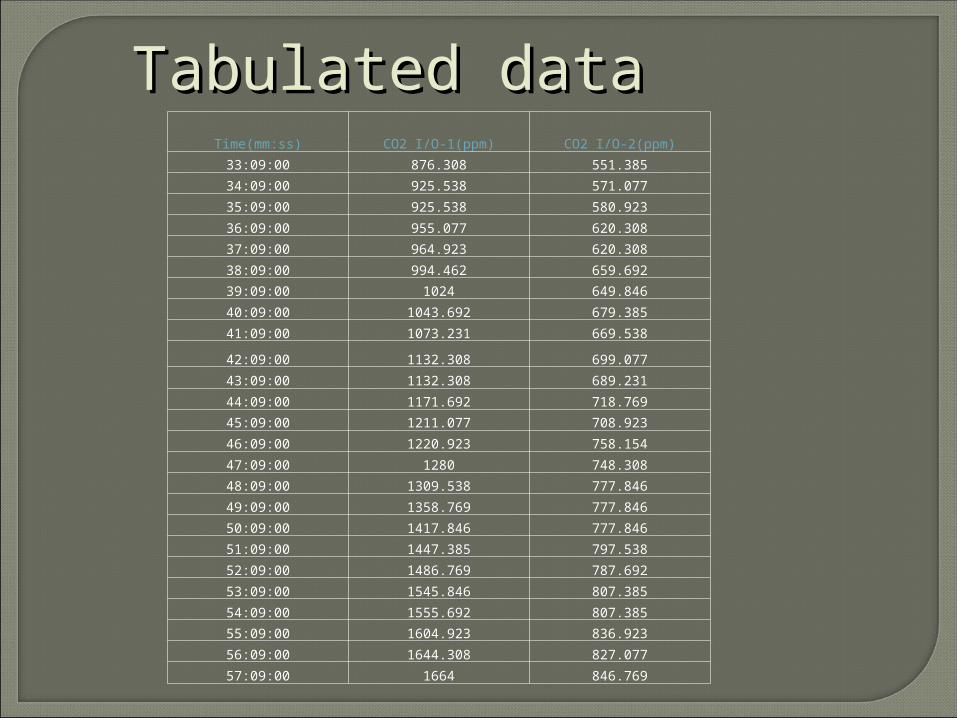
Time(mm:ss) CO2 I/O-1(ppm) CO2 I/O-2(ppm)
33:09:00 876.308 551.385
34:09:00 925.538 571.077
35:09:00 925.538 580.923
36:09:00 955.077 620.308
37:09:00 964.923 620.308
38:09:00 994.462 659.692
39:09:00 1024 649.846
40:09:00 1043.692 679.385
41:09:00 1073.231 669.538
42:09:00 1132.308 699.077
43:09:00 1132.308 689.231
44:09:00 1171.692 718.769
45:09:00 1211.077 708.923
46:09:00 1220.923 758.154
47:09:00 1280 748.308
48:09:00 1309.538 777.846
49:09:00 1358.769 777.846
50:09:00 1417.846 777.846
51:09:00 1447.385 797.538
52:09:00 1486.769 787.692
53:09:00 1545.846 807.385
54:09:00 1555.692 807.385
55:09:00 1604.923 836.923
56:09:00 1644.308 827.077
57:09:00 1664 846.769
Tabulated dataTabulated data
Time(mm:ss)33:09 38:09 43:09 48:08 53:08
0
100
200
300
400
500
600
700
800
900
1000
1100
1200
1300
1400
1500
1600
1700
1800
0
100
200
300
400
500
600
700
800
900
1000
1100
1200
1300
1400
1500
1600
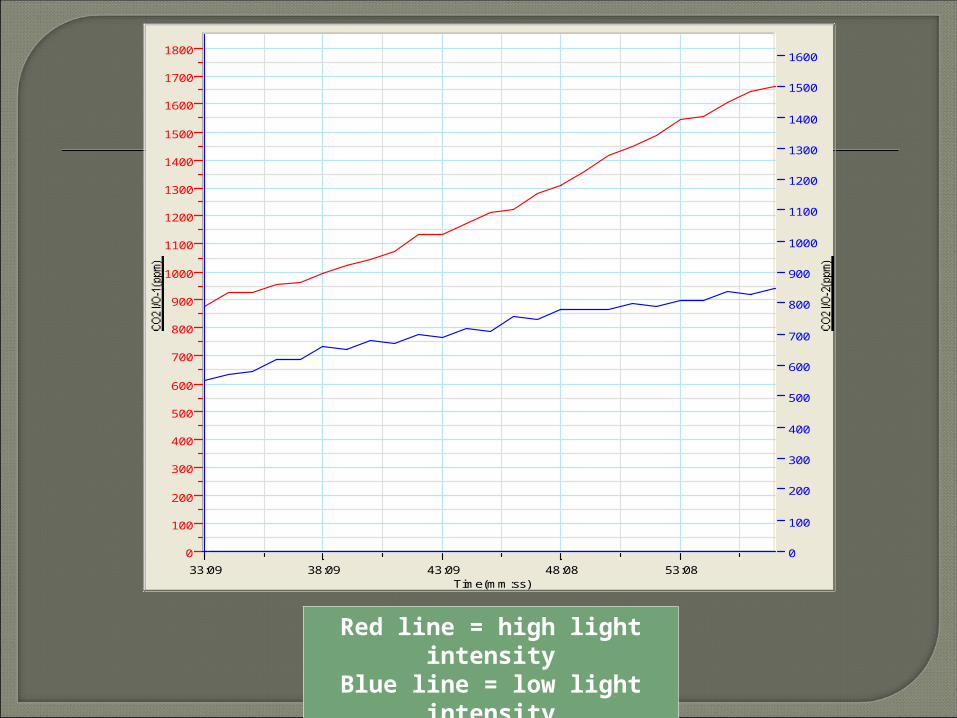
Red line = high light intensity
Blue line = low light intensity
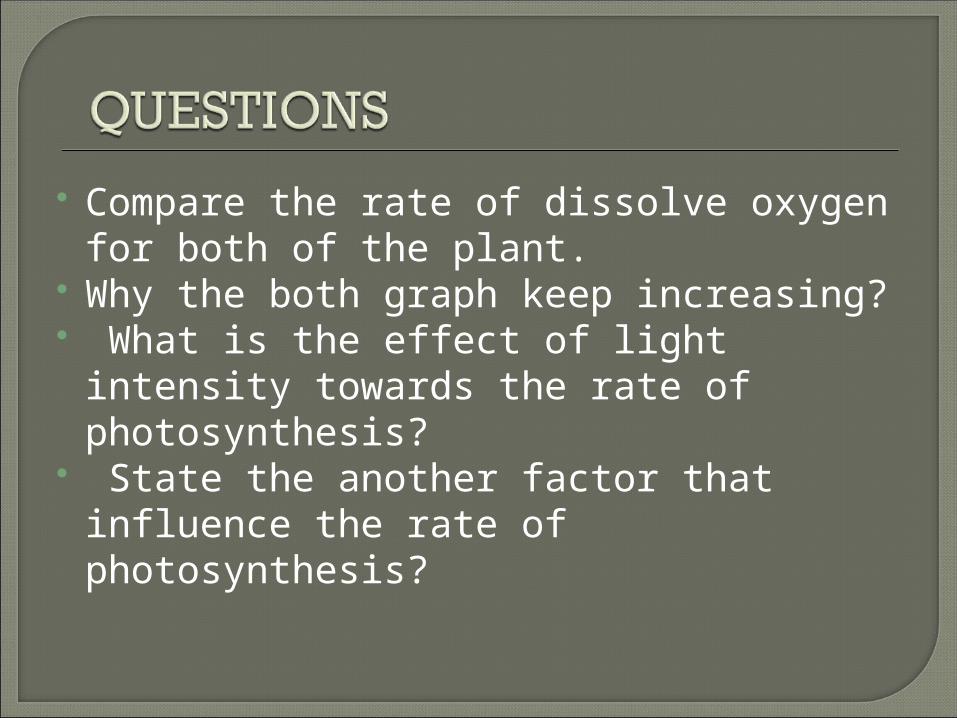
Compare the rate of dissolve oxygen for both of the plant.
Why the both graph keep increasing? What is the effect of light intensity
towards the rate of photosynthesis? State the another factor that
influence the rate of photosynthesis?
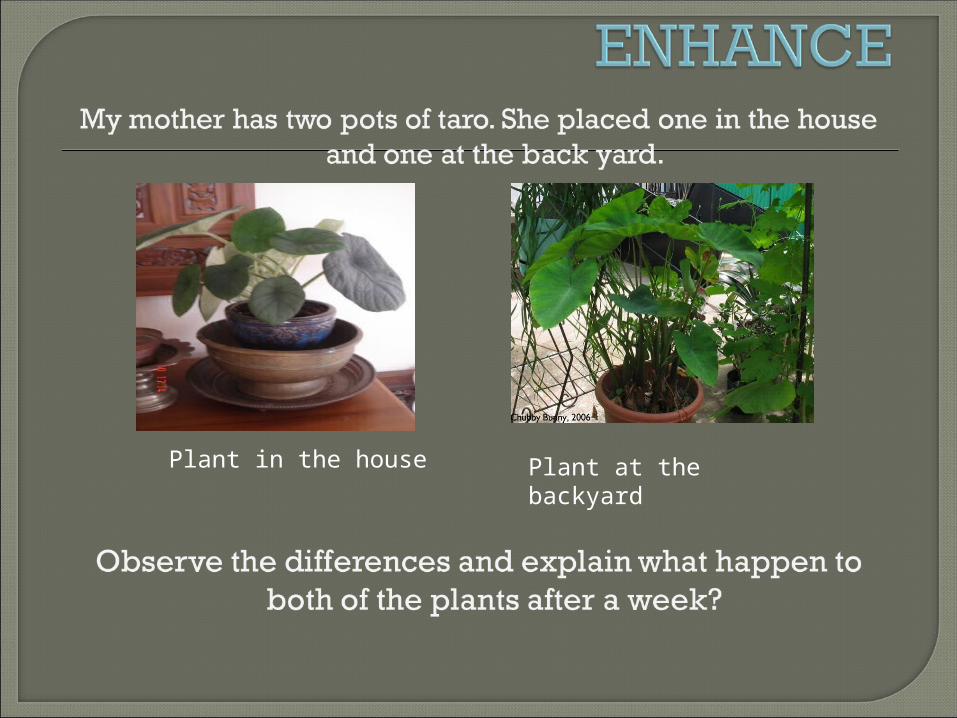
Plant in the house Plant at the backyard
The plant in the house is wilt while the plant in the backyard is healthy.
The color of the leaves of taro in the house turned to brownish after a few weeks while the taro in the backyard maintains its green color.
The stem of taro in the backyard is bigger and taller than the stem of taro in the house.
The results gain is more accurate rather than using manual method due to the same time interval
The experiment can be continued for many hours until the rate of photosynthesis reaching its optimum level. This experiment is almost impossible done by traditional method because students have to sit for many hours to count the O2 bubbles released by the elodea plant.
The change in photosynthesis cannot be detected by naked eyes but by using data logger, we can record the rate of photosynthesis every one minute per half an hour.
Using data logging, we can save the time by setting up more than one apparatus can be done simultaneously at the same time.