Embed Size (px)
Citation preview

Data insights in civil justice:
NSW Local Court
Suzie Forell and Catriona Mirrlees-Black
With assistance from Sarah A. Williams, Christine Coumarelos,
Hugh McDonald, Geoff Mulherin, Danka Prodanovic,
Amanda Wilson, Zhigang Wei and Chloe Zhang
Law and Justice Foundation of New South Wales
November 2016
This report is published by the Law and Justice Foundation of New South Wales, an independent, not-for-profit organisation that seeks to advance the fairness and equity of the justice system, and to improve access to justice, especially for socially and economically disadvantaged people.
This report was prepared by the Law and Justice Foundation of NSW with the financial support of the Department of Justice NSW and the practical assistance of Court Services NSW.
National Library of Australia Cataloguing-in-Publication entry Authors: Suzie Forell & Catriona Mirrlees-Black Title: Data insights in civil justice: NSW Local Court ISBN: 978 0 9873643 5 7 Subjects: NSW Local Court Other Authors/ Contributors:
Sarah Williams, Christine Coumarelos, Hugh McDonald, Geoff Mulherin, Danka Prodanovic, Amanda Wilson, Zhigang Wei & Chloe Zhang
Publisher Law and Justice Foundation of New South Wales Level 13, 222 Pitt Street, Sydney NSW 2000 PO Box A109 Sydney South NSW 1235 Ph: +61 2 8227 3200 Email: [email protected] Web: www.lawfoundation.net.au © Law and Justice Foundation of New South Wales, November 2016 This publication is copyright. It may be reproduced in part or in whole for educational purposes as long as proper credit is given to the Foundation. Any opinions expressed in this publication are those of the authors and do not necessarily reflect the views of the Foundation’s Board of Governors.
Data insights in civil justice: New South Wales Local Court
Law and Justice Foundation of NSW November 2016 1
Contents
Key messages .................................................................................................................. 5 Data quality and improvements .............................................................................................. 5 Findings .................................................................................................................................. 6 The particular story of unpaid council rates ........................................................................... 9 Next steps ............................................................................................................................. 10 Introduction ...................................................................................................................... 1 Background............................................................................................................................. 1 Scope of the task .................................................................................................................... 3 Key questions addressed: report ........................................................................................... 3 An overview of the methodology ............................................................................................ 3 Factors affecting data quality ................................................................................................. 4 The data reported in this report .............................................................................................. 6 1. Who is suing whom in the NSW Local Court? .......................................................... 7 Scope and quality of plaintiff and defendant data .................................................................. 7 Plaintiff and defendants in Local Court civil claims: JusticeLink categories ........................ 10 Plaintiff and defendants in Local Court civil claims: detailed analyses ................................ 11 Who is suing whom in the Local Court? ............................................................................... 12 Improving the quality of information about Local Court plaintiffs and defendants ............... 14 2. What types of claims are litigated in the Local Court? .........................................15 Scope and quality of type of claim data ............................................................................... 15 Types of claims in the Local Court ....................................................................................... 16 Do different plaintiffs bring different actions in the Local Court? ......................................... 17 The particular story about unpaid council rates ................................................................... 19 Improving information about types of claim ......................................................................... 20 3. What are Local Court claims worth? .......................................................................21 Claim amounts ...................................................................................................................... 21 Interest and costs claimed .................................................................................................... 24 Claim amounts compared to awards .................................................................................... 25 4. Which claims are defended in the Local Court and by whom? ..........................29 Actions defended by claim type............................................................................................ 29 Actions defended by entity type ........................................................................................... 30 5. Who is represented in the Local Court and for what claims? ...............................31 The scope and quality of data on representation ................................................................. 31 Different pictures of representation ...................................................................................... 32 Representation at different points in a matter ...................................................................... 33 Representation by type of plaintiff and defendant................................................................ 33
Data insights in civil justice: New South Wales Local Court
Law and Justice Foundation of NSW November 2016 2
Factors relevant to representation status ............................................................................. 34 Representation and outcome ............................................................................................... 36 6. How are claims finalised in the Local Court? ........................................................37 Pathways to finalisation in the Local Court .......................................................................... 37 How claims were finalised in the Local Court ...................................................................... 39 Plaintiffs and defendants in determined (non-lapsed) cases ............................................... 42 7. How long does it take to reach certain outcomes? .............................................43 Data quality and caveats ...................................................................................................... 43 Time to finalisation – all claims............................................................................................. 43 Factors related to length of time to finalise claims ............................................................... 44 Time taken to finalise determined (non-lapsed) claims ....................................................... 45 Next steps ........................................................................................................................48 Appendices ....................................................................................................................49 Appendix 1: Methodology ..................................................................................................... 49 Appendix 2: Certificate matters ............................................................................................ 51 Appendix 3: Additional tables ............................................................................................... 53
Data insights in civil justice: New South Wales Local Court
Law and Justice Foundation of NSW November 2016 3
Acknowledgements
This work was undertaken with the financial support of the Department of Justice NSW and the practical assistance of Court Services NSW. The Foundation acknowledges and thanks Maureen Tangney, Executive Director, Department of Justice NSW, for her vision and guidance; Kylie Nicholls, Acting Assistance Director, Court Services, for her assistance and support; Registry Managers and staff for facilitating access to casefiles from around the state; and Chris Clarke and Sanjay Kumar for providing the JusticeLink data in such an accessible format.
Data insights in civil justice: New South Wales Local Court
Law and Justice Foundation of NSW November 2016 4
Shortened forms
ABN Australian Business Number
ABR Australian Business Register
ACN Australian Company Number
CALD culturally and linguistically diverse
Foundation Law and Justice Foundation of New South Wales
LAW Survey Legal Australia-Wide Survey
LGA Local Government Area
MI management information
NCAT New South Wales Civil and Administrative Tribunal
NPA National Partnership Agreement on Legal Assistance Services
SEIFA Socioeconomic Indexes for Areas
SOC statement of claim
UCPR Uniform Civil Procedure Rules
Data insights in civil justice: New South Wales Local Court
Law and Justice Foundation of NSW November 2016 5
Key messages
Data quality and improvements The JusticeLink dataset is a rich and comprehensive, but currently underutilised, resource that, in our preliminary assessment, adequately represents many aspects of the business of the Local Court. The dataset also has the potential to illustrate how the court is being used by different entities – and the impact of this on access to justice, particularly for individuals and small businesses.
We have already identified a number of changes which could improve the reliability and utility of the data for policy development, court management and administration. We detail two areas for change below.
Entity type The first area of change relates to better capturing the nature of the entities using the Local Court. JusticeLink currently only identifies entities as ‘individual’ or ‘organisation’ and ‘corporate’ or ‘non-corporate’, both used for the purpose of calculating fees. As the categories of individual and organisation do not appear well defined, there is a lack of clarity about what types of entities belong – and are actually recorded – in each category. The use of the individual/organisation categorisation (in addition to corporate and non-corporate) for calculating fees further complicates the range of entities included within each description. For instance, our analysis of a sample of claims suggests that 28% of plaintiffs identified as individual on JusticeLink, may in fact be businesses or other organisations (such as councils, government bodies or utilities), many of which are not required to pay the corporate fee.
To better understand the types of plaintiffs and defendants involved in Local Court civil cases we suggest collecting data on ‘entity type’ using more detailed and well defined categories. We further suggest this data should be collected to primarily reflect entity type and should be collected separately from information to inform fee type. This would enable the ready identification of entities such as government, local councils, insurers, small businesses, micro-businesses and sole traders, and may also better identify plaintiffs that could potentially be liable for the corporate rate for court fees.
Another way to better identify entity type may be to require Australian Business Numbers (ABNs) and/or Australian Company Numbers (ACNs) where applicable (as is the case with e-filing), and to investigate the feasibility of linking this information to entity types already defined on the Australian Business Register (ABR).
Data insights in civil justice: New South Wales Local Court
Law and Justice Foundation of NSW November 2016 6
Claim type The second change concerns the capture of types of claim which currently are not consistently understood or, in many cases, not accurately recorded. For instance, in our review of 200 claims classified on JusticeLink as Mercantile law – other, 56 files (28% of the sample) were actually misclassified as Unpaid council rate matters. A more reliable picture of the profile of claims is necessary, for instance, to support robust demand forecasting. This would require revising the list of claim types to provide mutually exclusive, plain language and intuitive categories.1
Examples might include, but are not limited to, changing:
• Torts – motor vehicle accident – driver to a category such as Motor vehicle accident – no injury, and
• Mercantile law – statutory obligation of debt recovery – strata levies to Unpaid strata levies.
Further analyses and use of the data To generally support improved evidence-based management and decision-making, we also recommend that consideration is given to:
• investing in a comprehensive data dictionary for all items captured by JusticeLink • investing in the regular reporting of key data analysis to increase the visibility of the work
of the Local Court to court users and potential court users • analysing historical years of data to identify those findings which are stable and those
that fluctuate to assist in identifying the drivers of fluctuating demand (statewide and at a regional level)
• investigating ways to improve the quality of data entry (particularly through e-filing and bulk filing) and ongoing audits of data quality
• systematically investigating samples of casefile data to identify patterns in the types of civil actions brought in the Local Court, for example, further exploring the: – timing and use of the Local Court by local councils to recover unpaid council debts – impact of costs associated with the recovery of debt through the court, particularly on
disadvantaged people.
Findings Who is suing whom in the NSW Local Court? Data in this report was drawn from JusticeLink directly and specifically for the purpose of these analyses.2 However, due to limitations in the data currently available directly from JusticeLink, a number of the following analyses have relied on more detailed categorisation and analyses of samples of data. Key observations include:
1 The existing categories have been created as part of a national civil classification scheme for civil litigation. Any revised categories would need to align to existing categories for the purpose of national consistency. One option may be to make a plain English list of categories available to the front-end user (including court staff and e-registry users), that maps to the national classification categories in the back-end of JusticeLink.
2 For this reason the figures quoted here will not necessarily align with those reported elsewhere.
Data insights in civil justice: New South Wales Local Court
Law and Justice Foundation of NSW November 2016 7
• most (85%) plaintiffs in all civil claims finalised in the NSW Local Courts during 2014 were recorded as ‘organisations’, while more than three-quarters (77%) of all defendants were recorded as ‘individuals’. However, a sample of 1,000 cases (952 claims) finalised in the Local Court during 2014 provides a more detailed picture of these parties.
Specifically:
– nearly half (47%) of all plaintiffs were businesses, 39% were local councils and 10% were individuals
– by contrast, nearly three-quarters of defendants were individuals (73%) and one-quarter (26%) were businesses
– State and Commonwealth government agencies together with utilities (largely water and gas) comprised less than 4% of all plaintiffs and did not appear as defendants.
• in this sample, the most common Local Court claims finalised involved:
– local councils suing individuals (35% of cases) – businesses suing individuals (25% of cases) – businesses suing other businesses (22% of cases). Over one-third of matters within
this category were claims against businesses by the workers compensation nominal insurer.
What types of civil claims are litigated and what are they worth? • More than a third of all claims in the Local Court were local councils pursuing unpaid
council rates. The average value of these claims was $1,600. These findings are discussed in the section below ‘the particular story of unpaid council rates’.
• Two-thirds of all claims in the Local Court during 2014 were for amounts of $5,000 or less. Nearly 47% were for amounts of less than $2,000. The average (mean) claim amount for claims in the Local Court during 2014 was $6,500.
• Excluding costs, the average amount awarded was less than the amount claimed. However, a comparison of the award amount, inclusive of costs, to the base claim amount indicates that, on average, the process of pursuing the matter through the court adds 16% to the original claim in interest, service fees, filing fees and solicitor fees claimed.
What actions are being defended and by whom? • Overall, only 7% of claims lodged in the Local Court were defended, but this varied from
less than 1% for unpaid council rates claims to 57% for employment related claims. It also varied by plaintiff type. In our sample of 952 claims, one-third of those with an individual plaintiff were defended, compared to 6% with a business plaintiff and less than 1% with a local council plaintiff.
Who is represented and for what claims? • Most plaintiffs (88%) have legal representation at some point in a claim. As most claims
are not defended, it is no surprise that only a small proportion of all defendants (5%) are recorded as having legal representation. The remaining 95% primarily comprises those claims where the defendant had no involvement with the court, but also those where the claim was defended without legal assistance.
Data insights in civil justice: New South Wales Local Court
Law and Justice Foundation of NSW November 2016 8
• Looking at defended claims only, three-quarters of all plaintiffs and 58% of defendants were recorded on JusticeLink as being represented. In the remainder of cases the claim was litigated (25%) or defended (42%) without legal assistance.
• Representation rates also varied by the plaintiff and defendant types in the claim and by the claim type. For instance, while local council, government and utility plaintiffs were always represented, individual plaintiffs were represented in only 65% of claims, and business plaintiffs in 87% of claims.
• However, returning to the issue of data quality, our casefile analysis suggests that JusticeLink data on representation may undercount the full number of plaintiffs and defendants that have some representation at some point in the process.
How are claims finalised? • More than half of all matters finalised in the Local Court during 2014 were lapsed for
inactivity and another 37% were finalised through default judgment. Less than 2% of matters were settled (including consent judgment) or finalised by judgment after trial. Again, this varied by claim type and the parties involved.
• For instance, a higher proportion of matters involving business-to-business litigation resulted in default judgment compared to matters which did not involve businesses as both plaintiff and defendants (43% compared to 37%).
How long does it take to reach certain outcomes? • With all claims included in the analysis, claims finalised in the Local Court during 2014
took, on average, 200 days (28.5 weeks) from start to finalisation. • A multivariate analysis indicated that the claim amount, a defence being filed, the
defendant being represented, and, to a lesser extent, the plaintiff being represented were all independently related to claims taking longer to reach an outcome.
• The figure varied considerably depending upon how the claim was finalised. Excluding claims which were administratively lapsed after nine months, claims:
– were resolved by default judgment in an average of 86 days (12 weeks) – were settled (including consent orders) in an average of 157 days (22.4 weeks) – reached judgment (following trial) in an average 197 days (28 weeks).
• For determined claims (i.e. any claim which has not lapsed or closed), the average number of days until claims were first determined was longer when:
– the plaintiff was not represented (122 days compared to 111 days) – the defendant was represented (200 days compared 102 days) – when a defence was filed (202 days compared to 98 days).
To illustrate how all these factors together provide a picture of how the court is used, we take the example of unpaid council rates.
Data insights in civil justice: New South Wales Local Court
Law and Justice Foundation of NSW November 2016 9
The particular story of unpaid council rates The analyses tell a particular story about the use of the Local Court by local councils.
• Adjusting for claims with the incorrect claim type of Mercantile law – other, more than one-third (34.1%) of all civil claims finalised in the Local Court during 2014 involved local councils pursuing unpaid council rates.3
• Overall, 82% of unpaid council rates claims were for amounts of $2,000 or less. The average claim amount was $1,600. The modest amount may indicate that councils were quick to pursue these debts through the court.
• While, overall, 7% of all claims finalised in the Local Court during 2014 were defended, less than 1% of all unpaid council rates claims were defended.
• Nearly three-quarters (74%) of all claims concerning unpaid council rates lapsed and a further 24% were finalised by default judgment. Less than 0.1% of all unpaid council rates claims were finalised by judgment or recorded by the court as settled.
• For the claims finalised through default judgment, the interest, service fees, filing fees and solicitors awarded added on average 27% to the value of the original claim.4
• All but 3 of the 152 local councils in NSW had at least one claim for unpaid council rates (including those incorrectly filed as Mercantile law – other).
• 10 councils (together covering 21% of the adult NSW population) brought one-third of all claims for unpaid council rates during 2014.
– 6 of these councils represented suburban Sydney local government areas (LGAs) and 4 were in regional or rural areas. Four of the 10 LGAs are identified as disadvantaged or very disadvantaged on Socioeconomic Indexes for Areas (SEIFA) ratings.
• 20 councils (together covering 37% of the NSW adult population) brought half of all unpaid council rates claims.
– 11 of these councils were in rural or regional LGAs and 7 were in Western Sydney LGAs with 9 of the 20 councils representing LGAs which are disadvantaged or very disadvantaged on SEIFA ratings.
• 30 councils (covering 51% of the NSW adult population) brought 64% of such claims. • Taking account of the adult population size, we examined the rate of litigation for
unpaid council rates per 1,000 residents. The 20 councils with the highest rates of filing for unpaid council rates were in rural and remote LGAs. Of note, 14 of these 20 LGAs are disadvantaged or very disadvantaged, based on SEIFA ratings.
Overall, these figures raise questions about how appropriate it is for local councils to so readily pursue these debts through the Local Court, particularly where disadvantage is likely implicated in the failure to pay rates in the first place. More effective administrative arrangements, including time to pay arrangements and hardship provisions, may provide a more appropriate alternative.
3 Preliminary analyses indicated that some councils also filed unpaid council rates as Real property – other, which would further increase the overall proportion of matters that were actually related to unpaid council rates.
4 Based on 6,042 claims, of which nine were settled or went to trial and the remainder were finalised by default judgment.
Data insights in civil justice: New South Wales Local Court
Law and Justice Foundation of NSW November 2016 10
Next steps In this report we have answered a series of questions about matters in the Local Court. Where we could answer questions using the full dataset, we have done so. To answer other questions, we have gathered additional information on small samples of data. However, this report has only skimmed the surface of questions and answers that may be found in this data. With appropriate investment and the application of quality research, civil court data across the jurisdictions is potentially a rich source of evidence to inform the development of justice sector policy and practice.
Data insights in civil justice: New South Wales Local Court
Law and Justice Foundation of NSW November 2016 1
Introduction
The Department of Justice is seeking to optimise the use of civil court and tribunal data for evidence-based decision-making, specifically the civil Divisions of the Local, District and the Supreme Court, the Land and Environment Court and the NSW Civil and Administrative Tribunal (NCAT).
To facilitate this process, the Law and Justice Foundation of NSW (the Foundation) has been engaged by the Department to investigate the utility of JusticeLink data on civil law cases in the Local Court, for the purpose of informing decision-making. This report provides findings and observations from this analysis.
Background In reviewing this data, bear in mind that only a proportion of all civil law matters experienced in NSW are dealt with through the Local Court. Civil law matters may also be heard in NCAT, the NSW District and Supreme Courts. The proportion of matters heard in each jurisdiction is identified in Table 1.
Table 1: Finalisations for civil matters, by jurisdiction in NSW, 2014
NSW civil jurisdictions Finalisations
N %
NCAT finalisations (2014–15 FY) 72,781 38.8
Local Court finalisations 2014 100,132# 53.3
District Court finalisations 2014 4,740 2.5
Supreme Court finalisations 2014+ 10,167 5.4
Total 187,820 100.0
Sources: NCAT Annual Report, 2014–15, p. 27; Local Court of NSW Annual Review, 2014; District Court of NSW Annual Review, 2014 p. 15, Supreme Court of NSW Annual Review 2014, pp. 49 & 51. + Common law civil and equity Divisions. # This figure differs from the number of cases reported in this report probably due to differences in the way that finalised matters are selected for reporting.
To put these figures in context it is helpful to consider both the number and range of civil legal issues which are experienced by people in NSW in a given year, and if and how these matters are resolved. Importantly, civil law issues may also be resolved outside of the tribunal and court system – between the parties directly; through administrative arrangements (e.g. pay by instalment arrangements with local councils) and through Ombudsmen’s offices, the Office of the NSW Small Business Commissioner and other avenues. As indicated by the Foundation’s Legal Australia-wide Survey (LAW Survey (NSW)), a proportion of civil law issues will not be dealt with at all.5
5 Coumarelos, C, Macourt, D, People, J, McDonald, HM, Wei, Z, Iriana, R & Ramsey, S 2012, Legal Australia-Wide Survey: legal need in New South Wales, Law and Justice Foundation of NSW, Sydney, Figure 5.7 p. 101.
Data insights in civil justice: New South Wales Local Court
Law and Justice Foundation of NSW November 2016 2
For instance, the LAW Survey asked a random sample of individuals about legal problems they had experienced in the previous 12 months and what they had done about those problems. Noting that these problems would have varied in seriousness, NSW respondents did nothing about 19% of the civil law issues experienced.
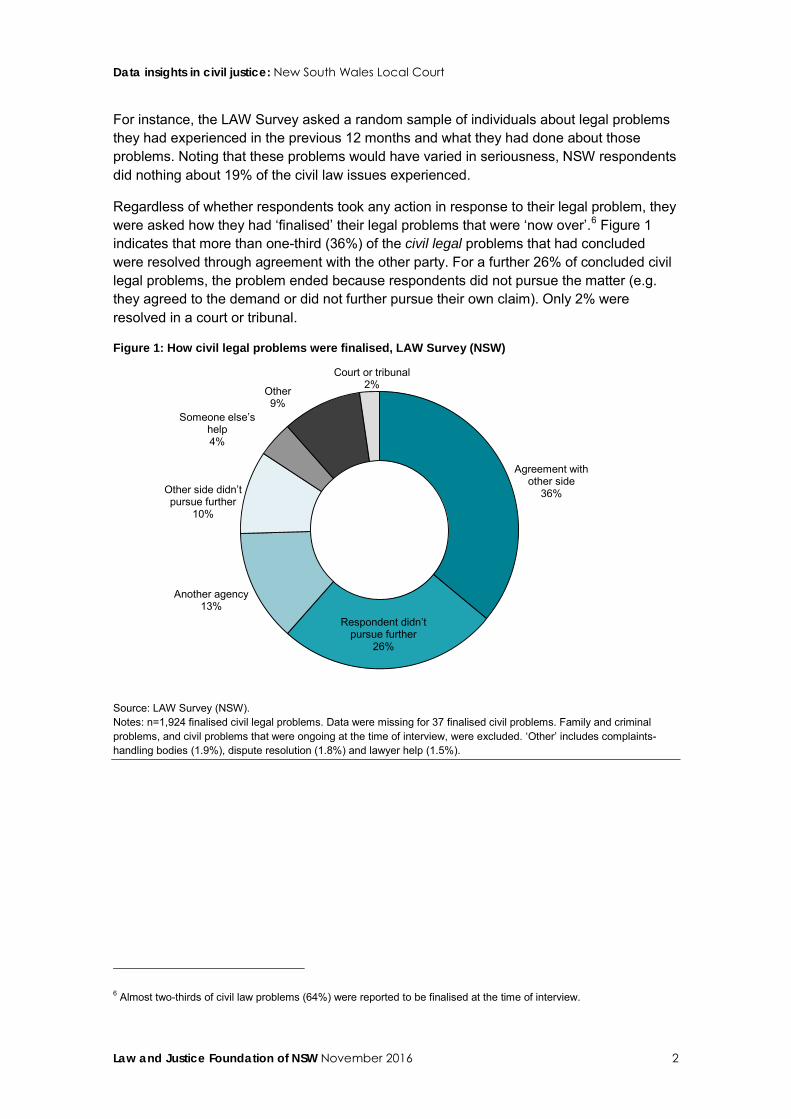
Regardless of whether respondents took any action in response to their legal problem, they were asked how they had ‘finalised’ their legal problems that were ‘now over’.6 Figure 1 indicates that more than one-third (36%) of the civil legal problems that had concluded were resolved through agreement with the other party. For a further 26% of concluded civil legal problems, the problem ended because respondents did not pursue the matter (e.g. they agreed to the demand or did not further pursue their own claim). Only 2% were resolved in a court or tribunal.
Figure 1: How civil legal problems were finalised, LAW Survey (NSW)
Source: LAW Survey (NSW). Notes: n=1,924 finalised civil legal problems. Data were missing for 37 finalised civil problems. Family and criminal problems, and civil problems that were ongoing at the time of interview, were excluded. ‘Other’ includes complaints-handling bodies (1.9%), dispute resolution (1.8%) and lawyer help (1.5%).
6 Almost two-thirds of civil law problems (64%) were reported to be finalised at the time of interview.
Agreement with other side
36%
Respondent didn’t pursue further
26%
Another agency 13%
Other side didn’t pursue further
10%
Someone else’s help 4%
Other 9%
Court or tribunal 2%
Data insights in civil justice: New South Wales Local Court
Law and Justice Foundation of NSW November 2016 3
Scope of the task The Foundation was asked to:
1. answer a set of questions about civil law cases in the NSW Local Court that were finalised for the first time during the 2014 calendar year
2. assess the reliability and utility of Local Court data held on JusticeLink to answer these policy questions
3. suggest changes to improve the quality and utility of the data for this purpose.
Key questions addressed: report Noting the very short timeframe for this project, this report outlines preliminary insights into the content and quality of NSW Local Court data. It is framed around the following key questions:
1. Who is suing whom in the NSW Local Court?
2. What types of civil claims are litigated in the Local Court?
3. What are Local Court claims worth?
4. What actions are defended in the Local Court and by whom?
5. Who is represented in the Local Court and for what claims?
6. How are claims finalised in the Local Court?
7. How long does it take to reach certain outcomes in the Local Court?
In each case we provide a snapshot of data analysed to date, and raise key issues that impact upon the reliability and validity of that data.
An overview of the methodology The Foundation drew data and information from four main sources:
1. Data held on JusticeLink for all Local Court civil cases finalised for the first time in 2014, including information on plaintiffs and defendants, representation status, claim types and amounts, court processes, outcomes and their amounts, and all relevant dates
2. Five randomly selected samples of electronic and paper casefiles held by the Local Court Registries, to verify the accuracy of JusticeLink data, and to collect details not available on JusticeLink (154 files from the whole dataset (all cases), as well as 50 cases which reached judgment, 50 which were settled, 100 which were defended, and 200 with the claim type Mercantile law – other)
3. Relevant documents, including legislation, court rules and regulations, JusticeLink user guides and instructions for e-filing
4. Court and JusticeLink staff.
Details of the methodology are provided in Appendix 1.
Data insights in civil justice: New South Wales Local Court
Law and Justice Foundation of NSW November 2016 4
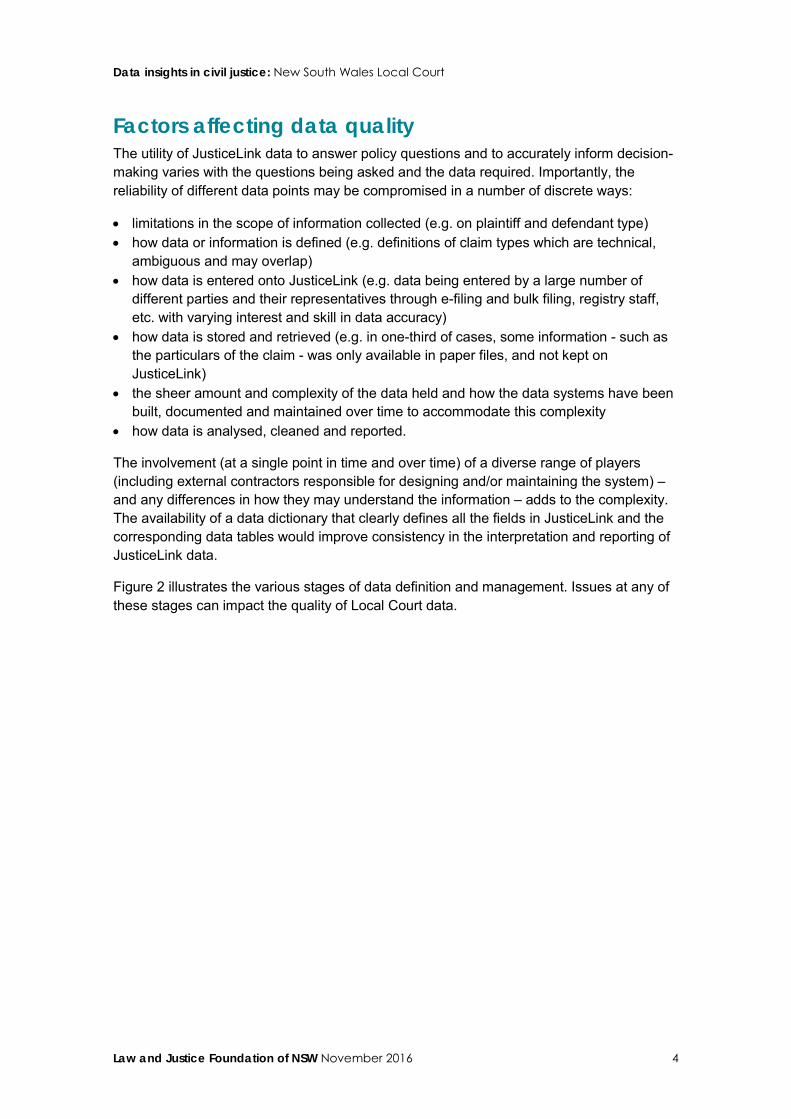
Factors affecting data quality The utility of JusticeLink data to answer policy questions and to accurately inform decision-making varies with the questions being asked and the data required. Importantly, the reliability of different data points may be compromised in a number of discrete ways:
• limitations in the scope of information collected (e.g. on plaintiff and defendant type) • how data or information is defined (e.g. definitions of claim types which are technical,
ambiguous and may overlap) • how data is entered onto JusticeLink (e.g. data being entered by a large number of
different parties and their representatives through e-filing and bulk filing, registry staff, etc. with varying interest and skill in data accuracy)
• how data is stored and retrieved (e.g. in one-third of cases, some information - such as the particulars of the claim - was only available in paper files, and not kept on JusticeLink)
• the sheer amount and complexity of the data held and how the data systems have been built, documented and maintained over time to accommodate this complexity
• how data is analysed, cleaned and reported.
The involvement (at a single point in time and over time) of a diverse range of players (including external contractors responsible for designing and/or maintaining the system) – and any differences in how they may understand the information – adds to the complexity. The availability of a data dictionary that clearly defines all the fields in JusticeLink and the corresponding data tables would improve consistency in the interpretation and reporting of JusticeLink data.
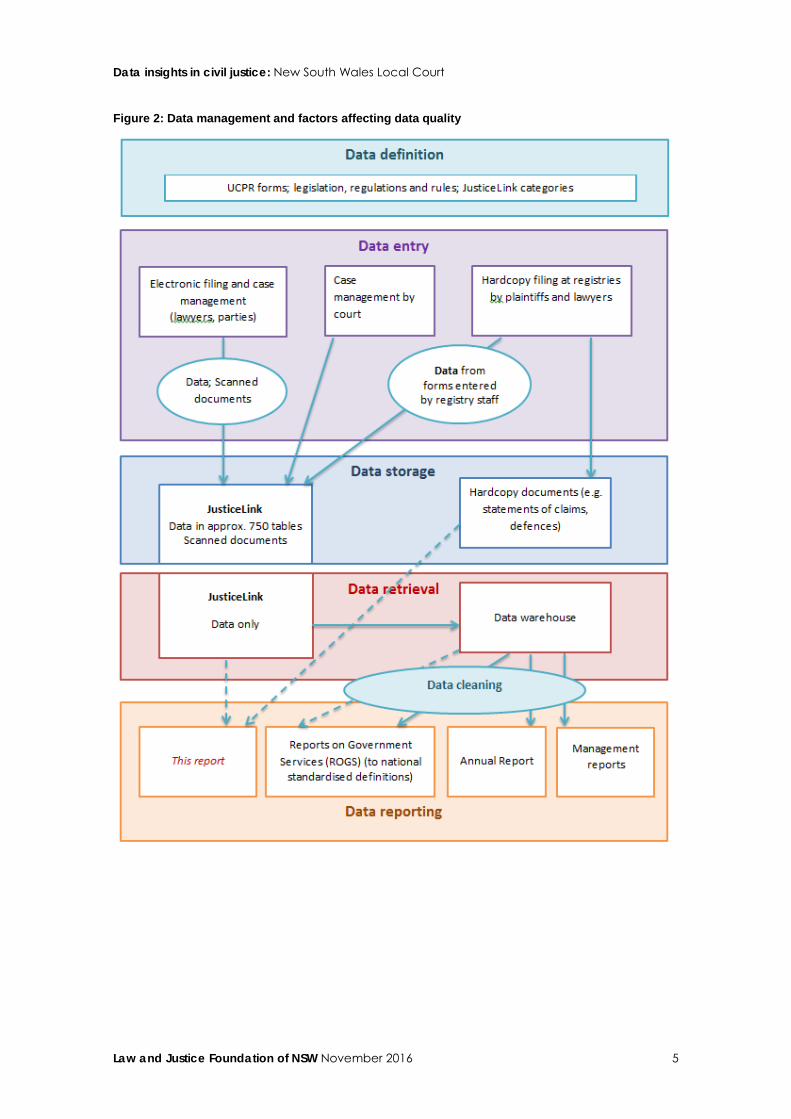
Figure 2 illustrates the various stages of data definition and management. Issues at any of these stages can impact the quality of Local Court data.
Data insights in civil justice: New South Wales Local Court
Law and Justice Foundation of NSW November 2016 5
Figure 2: Data management and factors affecting data quality
Data insights in civil justice: New South Wales Local Court
Law and Justice Foundation of NSW November 2016 6
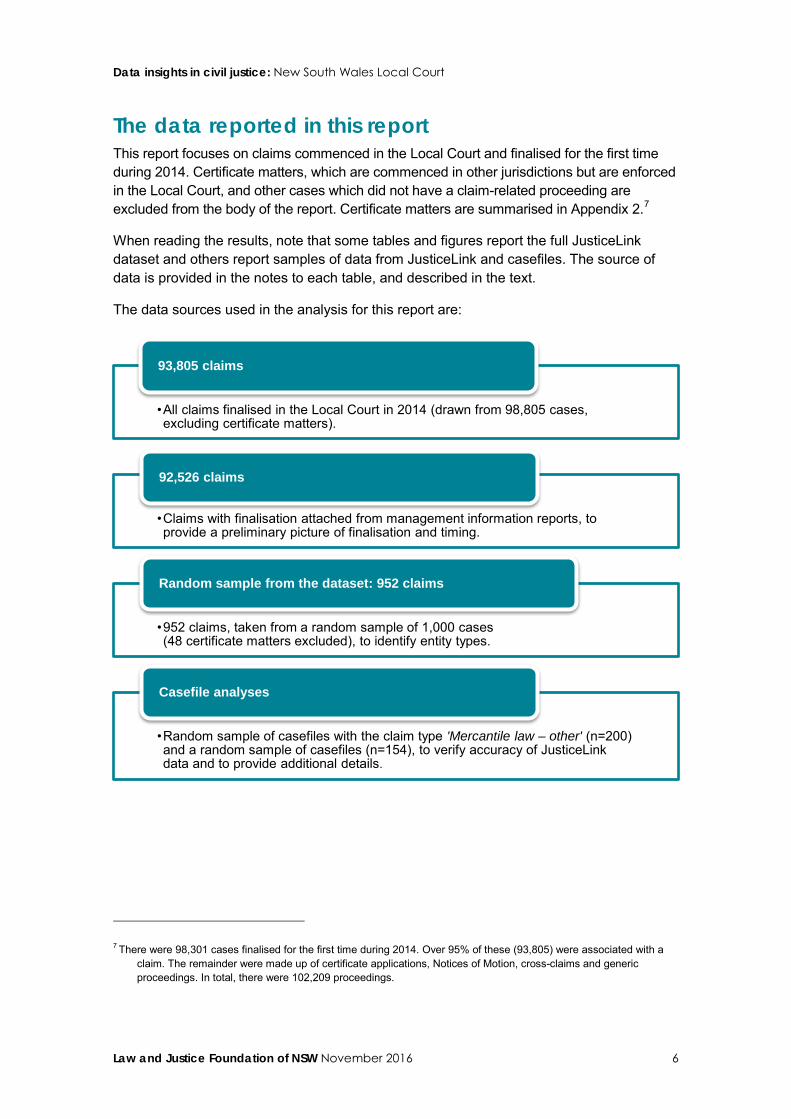
The data reported in this report This report focuses on claims commenced in the Local Court and finalised for the first time during 2014. Certificate matters, which are commenced in other jurisdictions but are enforced in the Local Court, and other cases which did not have a claim-related proceeding are excluded from the body of the report. Certificate matters are summarised in Appendix 2.7
When reading the results, note that some tables and figures report the full JusticeLink dataset and others report samples of data from JusticeLink and casefiles. The source of data is provided in the notes to each table, and described in the text.
The data sources used in the analysis for this report are:
7 There were 98,301 cases finalised for the first time during 2014. Over 95% of these (93,805) were associated with a claim. The remainder were made up of certificate applications, Notices of Motion, cross-claims and generic proceedings. In total, there were 102,209 proceedings.
•All claims finalised in the Local Court in 2014 (drawn from 98,805 cases, excluding certificate matters).
93,805 claims
•Claims with finalisation attached from management information reports, to provide a preliminary picture of finalisation and timing.
92,526 claims
•952 claims, taken from a random sample of 1,000 cases (48 certificate matters excluded), to identify entity types.
Random sample from the dataset: 952 claims
•Random sample of casefiles with the claim type 'Mercantile law – other' (n=200) and a random sample of casefiles (n=154), to verify accuracy of JusticeLink data and to provide additional details.
Casefile analyses
Data insights in civil justice: New South Wales Local Court
Law and Justice Foundation of NSW November 2016 7
1. Who is suing whom in the NSW Local Court?
Scope and quality of plaintiff and defendant data Information on JusticeLink about plaintiffs and defendants is limited to:
• names (person or business) and trading name • Australian Business Number (ABN) and/or Australian Company Number (ACN) (only
required if e-filing) • addresses and postcodes (24% of plaintiffs provide a lawyer’s address or no address)8 • whether each party is recorded as an individual or an organisation and whether each
party is considered corporate or non-corporate.
The completeness and quality of data in these fields varies.
Individual or organisation? JusticeLink contains two data fields which primarily relate to the calculation of fees: the entity status (individual or organisation) and a field of corporate/non-corporate. When filing in the Local Court, plaintiffs are classified as ‘individual’ or ‘organisation’. If plaintiffs file on paper, parties are classified by court staff entering data onto JusticeLink.9
When e-filing, the plaintiff (or their representative) is asked to identify each plaintiff and defendant as an individual or organisation. There appears to be little guidance in the e-filing process itself as to a) what types of entities should be classified as individual and which as organisation and b) the purpose for collecting this information.10 On the basis of the entity status of each party and the party details entered in e-filing, parties are then identified as corporate or non-corporate, for the purpose of calculating the filing fees. Those e-filing are specifically asked if the ‘action is being commenced by a corporation in the name of an individual (for example, an insurance company)’, so that the corporate fee rate can then be applied.
In reviewing the data, there appeared to be a lack of clarity around exactly which types of entities belong – and are actually recorded – in each category. For instance, our analysis of a sample of 952 claims indicated that 28% of plaintiffs who were identified as being an individual on JusticeLink, appeared in fact to be businesses or other organisations (such as councils, government bodies or utility services) (Table 2).
8 Based on random sample of 154 casefiles. 9 The Uniform Civil Procedure Rules (UCPR) forms do not request this information from the plaintiff. 10 However, there is advice in a YouTube instructional video that “if the defendant is an organisation or business, select
‘Organisation’ here; you will then need to enter either their Australian Business Number (ABN) or Australian Company Number (ACN)”.
Data insights in civil justice: New South Wales Local Court
Law and Justice Foundation of NSW November 2016 8
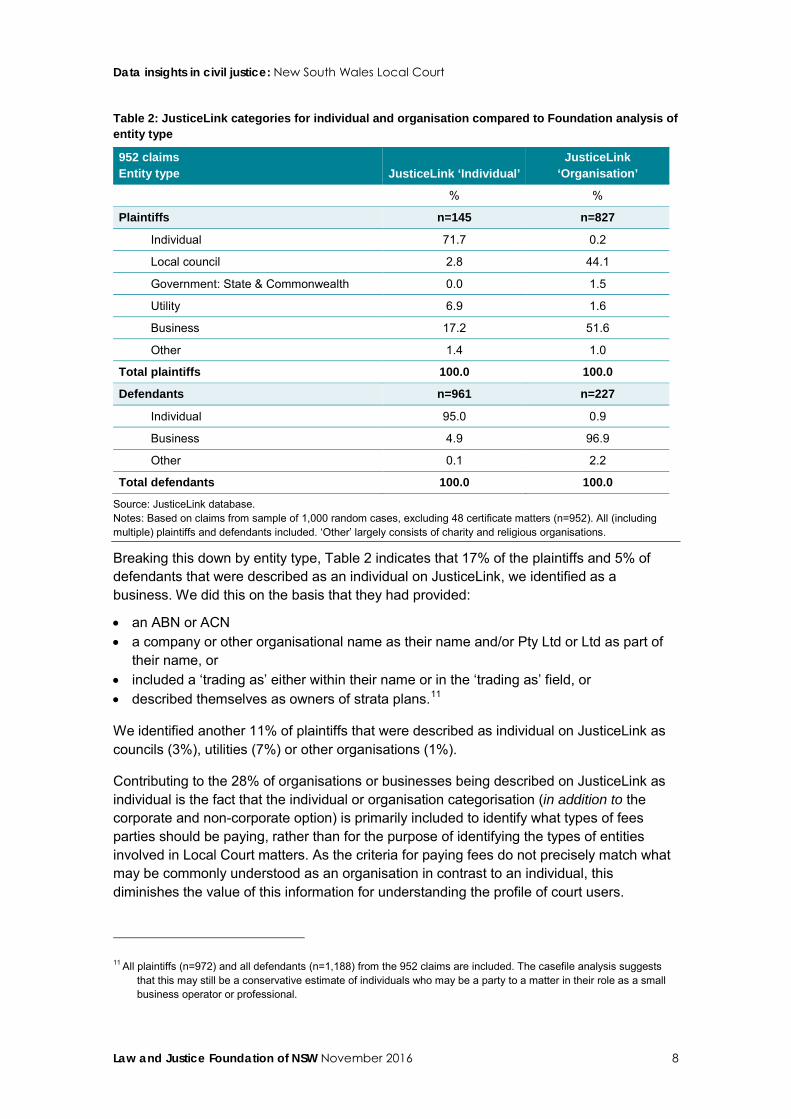
Table 2: JusticeLink categories for individual and organisation compared to Foundation analysis of entity type
952 claims Entity type JusticeLink ‘Individual’
JusticeLink ‘Organisation’
% %
Plaintiffs n=145 n=827
Individual 71.7 0.2
Local council 2.8 44.1
Government: State & Commonwealth 0.0 1.5
Utility 6.9 1.6
Business 17.2 51.6
Other 1.4 1.0
Total plaintiffs 100.0 100.0
Defendants n=961 n=227
Individual 95.0 0.9
Business 4.9 96.9
Other 0.1 2.2
Total defendants 100.0 100.0
Source: JusticeLink database. Notes: Based on claims from sample of 1,000 random cases, excluding 48 certificate matters (n=952). All (including multiple) plaintiffs and defendants included. ‘Other’ largely consists of charity and religious organisations.
Breaking this down by entity type, Table 2 indicates that 17% of the plaintiffs and 5% of defendants that were described as an individual on JusticeLink, we identified as a business. We did this on the basis that they had provided:
• an ABN or ACN • a company or other organisational name as their name and/or Pty Ltd or Ltd as part of
their name, or • included a ‘trading as’ either within their name or in the ‘trading as’ field, or • described themselves as owners of strata plans.11
We identified another 11% of plaintiffs that were described as individual on JusticeLink as councils (3%), utilities (7%) or other organisations (1%).
Contributing to the 28% of organisations or businesses being described on JusticeLink as individual is the fact that the individual or organisation categorisation (in addition to the corporate and non-corporate option) is primarily included to identify what types of fees parties should be paying, rather than for the purpose of identifying the types of entities involved in Local Court matters. As the criteria for paying fees do not precisely match what may be commonly understood as an organisation in contrast to an individual, this diminishes the value of this information for understanding the profile of court users.
11 All plaintiffs (n=972) and all defendants (n=1,188) from the 952 claims are included. The casefile analysis suggests that this may still be a conservative estimate of individuals who may be a party to a matter in their role as a small business operator or professional.
Data insights in civil justice: New South Wales Local Court
Law and Justice Foundation of NSW November 2016 9
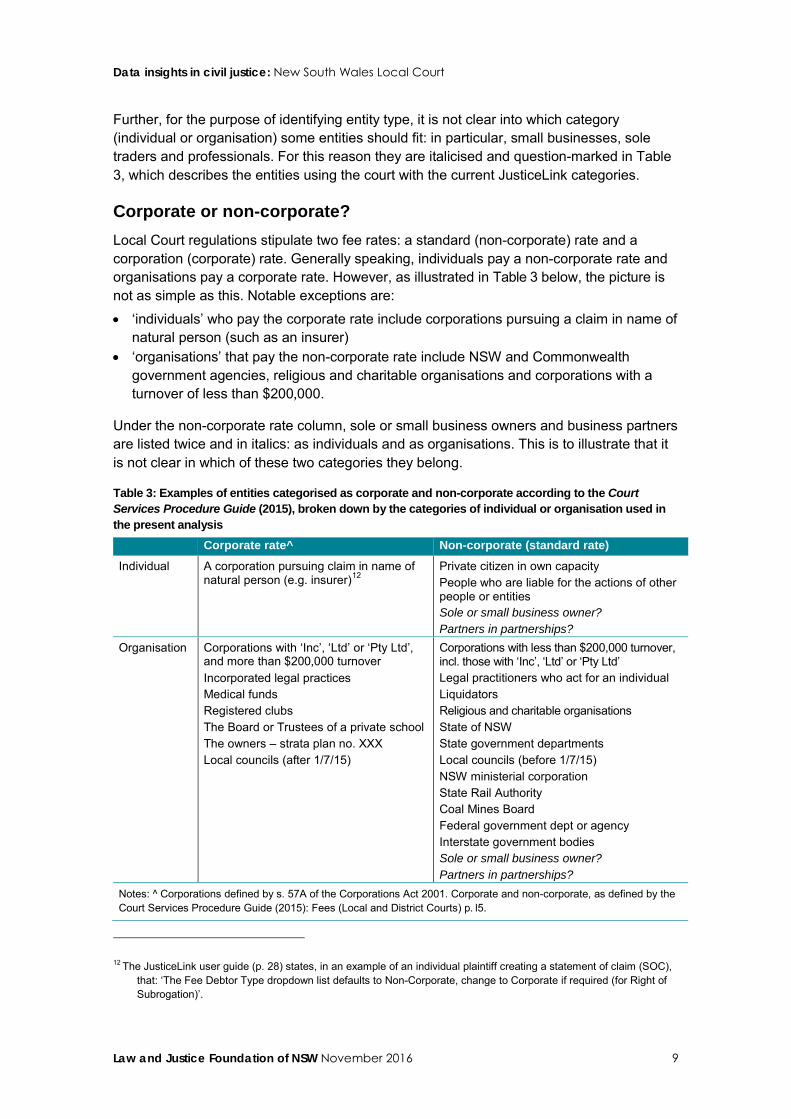
Further, for the purpose of identifying entity type, it is not clear into which category (individual or organisation) some entities should fit: in particular, small businesses, sole traders and professionals. For this reason they are italicised and question-marked in Table 3, which describes the entities using the court with the current JusticeLink categories.
Corporate or non-corporate? Local Court regulations stipulate two fee rates: a standard (non-corporate) rate and a corporation (corporate) rate. Generally speaking, individuals pay a non-corporate rate and organisations pay a corporate rate. However, as illustrated in Table 3 below, the picture is not as simple as this. Notable exceptions are:
• ‘individuals’ who pay the corporate rate include corporations pursuing a claim in name of natural person (such as an insurer)
• ‘organisations’ that pay the non-corporate rate include NSW and Commonwealth government agencies, religious and charitable organisations and corporations with a turnover of less than $200,000.
Under the non-corporate rate column, sole or small business owners and business partners are listed twice and in italics: as individuals and as organisations. This is to illustrate that it is not clear in which of these two categories they belong.
Table 3: Examples of entities categorised as corporate and non-corporate according to the Court Services Procedure Guide (2015), broken down by the categories of individual or organisation used in the present analysis Corporate rate^ Non-corporate (standard rate)
Individual A corporation pursuing claim in name of natural person (e.g. insurer)12
Private citizen in own capacity People who are liable for the actions of other people or entities Sole or small business owner? Partners in partnerships?
Organisation Corporations with ‘Inc’, ‘Ltd’ or ‘Pty Ltd’, and more than $200,000 turnover Incorporated legal practices Medical funds Registered clubs The Board or Trustees of a private school The owners – strata plan no. XXX Local councils (after 1/7/15)
Corporations with less than $200,000 turnover, incl. those with ‘Inc’, ‘Ltd’ or ‘Pty Ltd’ Legal practitioners who act for an individual Liquidators Religious and charitable organisations State of NSW State government departments Local councils (before 1/7/15) NSW ministerial corporation State Rail Authority Coal Mines Board Federal government dept or agency Interstate government bodies Sole or small business owner? Partners in partnerships?
Notes: ^ Corporations defined by s. 57A of the Corporations Act 2001. Corporate and non-corporate, as defined by the Court Services Procedure Guide (2015): Fees (Local and District Courts) p. l5.
12 The JusticeLink user guide (p. 28) states, in an example of an individual plaintiff creating a statement of claim (SOC), that: ‘The Fee Debtor Type dropdown list defaults to Non-Corporate, change to Corporate if required (for Right of Subrogation)’.
Data insights in civil justice: New South Wales Local Court
Law and Justice Foundation of NSW November 2016 10
Multiple defendants Also relevant to the analysis of parties is the reality of multiple defendants in one-quarter (26%) of Local Court claims. Only 1.4% of claims involved multiple plaintiffs.
The casefile analysis indicated that in 92% of claims with multiple defendants, both or all were individuals who, for instance, own a house or business together.13 Other combinations of multiple defendants included:
• the same individual in a personal capacity and as a business (individual, organisation) • an individual and the business that employs them (individual, organisation) • an organisation and an individual who has guaranteed a business debt (organisation,
individual).
For the claim-based analysis in the report, only one plaintiff and one defendant is reported per case.
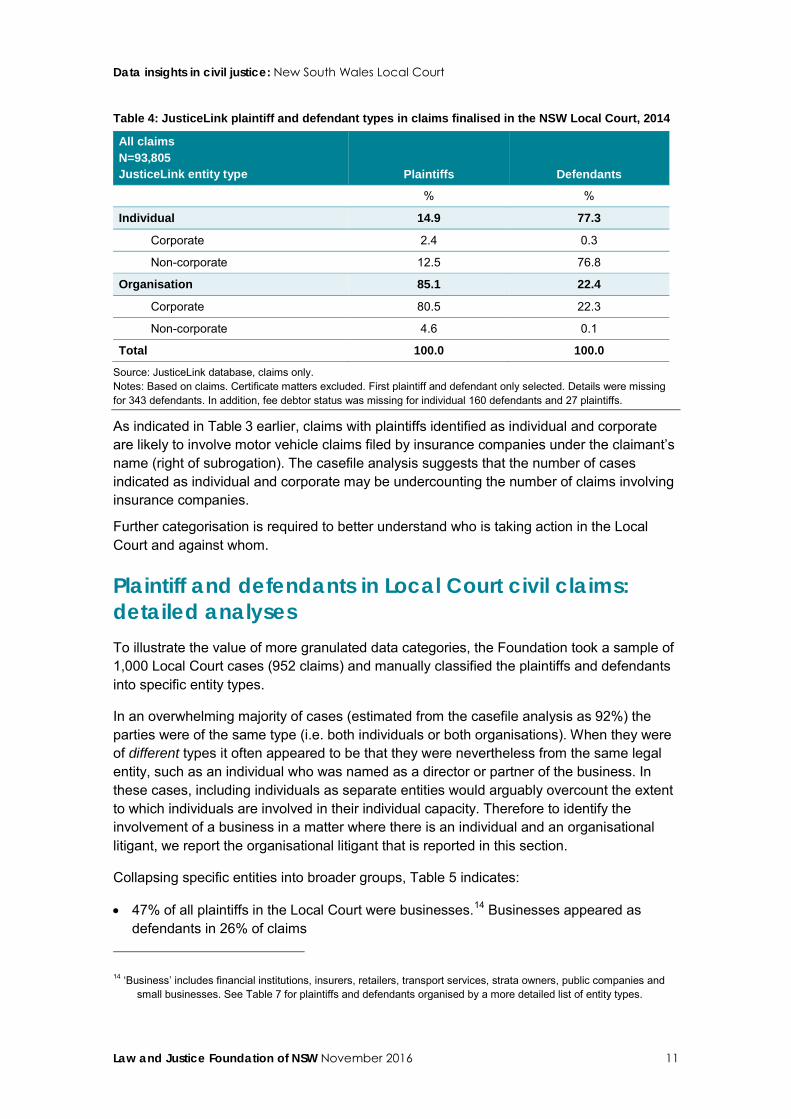
Plaintiff and defendants in Local Court civil claims: JusticeLink categories Table 4 provides first plaintiff and first defendant types recorded on JusticeLink, in all Local Court claims finalised in 2014. Noting the limitations described above, Table 4 indicates that:
• 85% of plaintiffs were recorded as organisations, most of which were identified as corporate
• 15% of plaintiffs were recorded as individuals, most of which were identified as non-corporate
• 77% of defendants were identified as individuals (non-corporate), and 22% as organisations (corporate).
13 71% of the casefile analysis (random sample) where there were multiple defendants involved two individuals with the same surname, while another 21% involved two individuals with different surnames. Half of all matters involving two individual defendants were related to unpaid council rates.
Data insights in civil justice: New South Wales Local Court
Law and Justice Foundation of NSW November 2016 11
Table 4: JusticeLink plaintiff and defendant types in claims finalised in the NSW Local Court, 2014
All claims N=93,805 JusticeLink entity type Plaintiffs Defendants
% %
Individual 14.9 77.3
Corporate 2.4 0.3
Non-corporate 12.5 76.8
Organisation 85.1 22.4
Corporate 80.5 22.3
Non-corporate 4.6 0.1
Total 100.0 100.0
Source: JusticeLink database, claims only. Notes: Based on claims. Certificate matters excluded. First plaintiff and defendant only selected. Details were missing for 343 defendants. In addition, fee debtor status was missing for individual 160 defendants and 27 plaintiffs.
As indicated in Table 3 earlier, claims with plaintiffs identified as individual and corporate are likely to involve motor vehicle claims filed by insurance companies under the claimant’s name (right of subrogation). The casefile analysis suggests that the number of cases indicated as individual and corporate may be undercounting the number of claims involving insurance companies.
Further categorisation is required to better understand who is taking action in the Local Court and against whom.
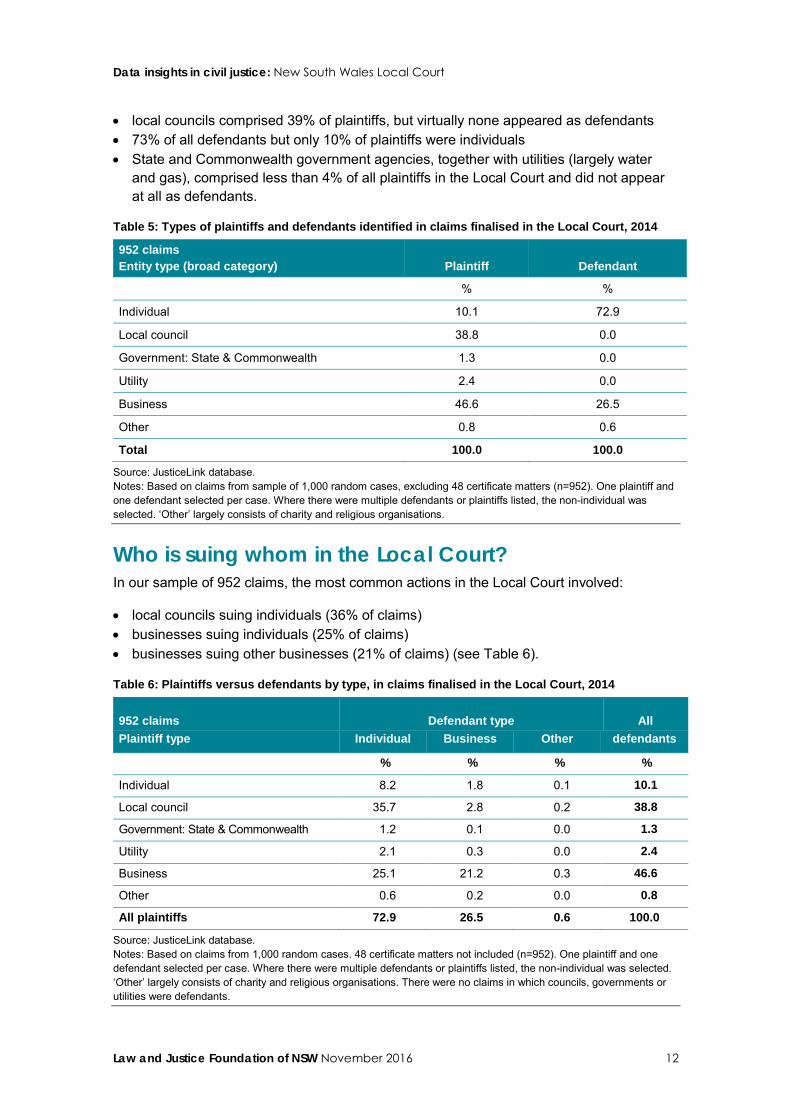
Plaintiff and defendants in Local Court civil claims: detailed analyses To illustrate the value of more granulated data categories, the Foundation took a sample of 1,000 Local Court cases (952 claims) and manually classified the plaintiffs and defendants into specific entity types.
In an overwhelming majority of cases (estimated from the casefile analysis as 92%) the parties were of the same type (i.e. both individuals or both organisations). When they were of different types it often appeared to be that they were nevertheless from the same legal entity, such as an individual who was named as a director or partner of the business. In these cases, including individuals as separate entities would arguably overcount the extent to which individuals are involved in their individual capacity. Therefore to identify the involvement of a business in a matter where there is an individual and an organisational litigant, we report the organisational litigant that is reported in this section.
Collapsing specific entities into broader groups, Table 5 indicates:
• 47% of all plaintiffs in the Local Court were businesses.14 Businesses appeared as defendants in 26% of claims
14 ‘Business’ includes financial institutions, insurers, retailers, transport services, strata owners, public companies and small businesses. See Table 7 for plaintiffs and defendants organised by a more detailed list of entity types.
Data insights in civil justice: New South Wales Local Court
Law and Justice Foundation of NSW November 2016 12
• local councils comprised 39% of plaintiffs, but virtually none appeared as defendants • 73% of all defendants but only 10% of plaintiffs were individuals • State and Commonwealth government agencies, together with utilities (largely water
and gas), comprised less than 4% of all plaintiffs in the Local Court and did not appear at all as defendants.
Table 5: Types of plaintiffs and defendants identified in claims finalised in the Local Court, 2014
952 claims Entity type (broad category) Plaintiff Defendant
% %
Individual 10.1 72.9
Local council 38.8 0.0
Government: State & Commonwealth 1.3 0.0
Utility 2.4 0.0
Business 46.6 26.5
Other 0.8 0.6
Total 100.0 100.0
Source: JusticeLink database. Notes: Based on claims from sample of 1,000 random cases, excluding 48 certificate matters (n=952). One plaintiff and one defendant selected per case. Where there were multiple defendants or plaintiffs listed, the non-individual was selected. ‘Other’ largely consists of charity and religious organisations.
Who is suing whom in the Local Court? In our sample of 952 claims, the most common actions in the Local Court involved:
• local councils suing individuals (36% of claims) • businesses suing individuals (25% of claims) • businesses suing other businesses (21% of claims) (see Table 6).
Table 6: Plaintiffs versus defendants by type, in claims finalised in the Local Court, 2014
952 claims Defendant type
All Plaintiff type Individual Business Other defendants
% % % %
Individual 8.2 1.8 0.1 10.1
Local council 35.7 2.8 0.2 38.8
Government: State & Commonwealth 1.2 0.1 0.0 1.3
Utility 2.1 0.3 0.0 2.4
Business 25.1 21.2 0.3 46.6
Other 0.6 0.2 0.0 0.8
All plaintiffs 72.9 26.5 0.6 100.0
Source: JusticeLink database. Notes: Based on claims from 1,000 random cases. 48 certificate matters not included (n=952). One plaintiff and one defendant selected per case. Where there were multiple defendants or plaintiffs listed, the non-individual was selected. ‘Other’ largely consists of charity and religious organisations. There were no claims in which councils, governments or utilities were defendants.
Data insights in civil justice: New South Wales Local Court
Law and Justice Foundation of NSW November 2016 13
While the number of business-to-business claims in our sample was small (n=202), over one-third of claims (35%, n=71) in this category were claims against businesses by the workers compensation nominal insurers and another 11% of business-to-business claims were claims by businesses involved in media and advertising.
Businesses that were more commonly the subject of claims by other businesses were those in construction, services, food and hospitality and ‘other business’.
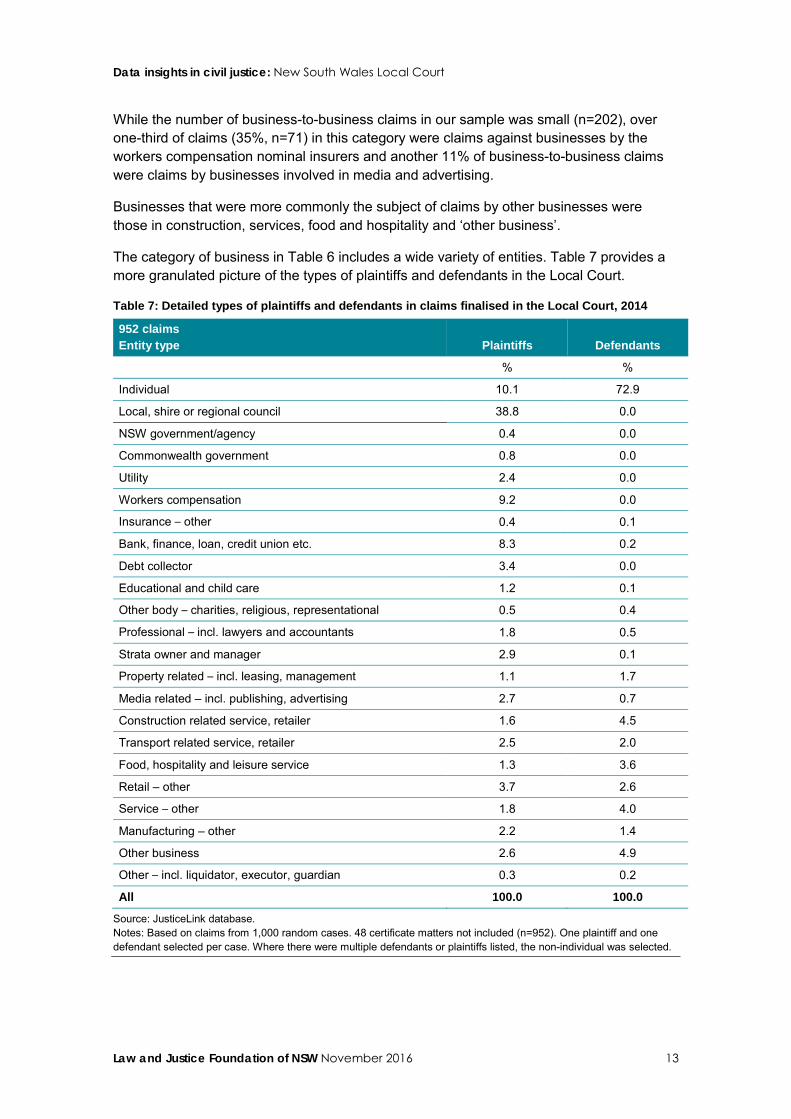
The category of business in Table 6 includes a wide variety of entities. Table 7 provides a more granulated picture of the types of plaintiffs and defendants in the Local Court.
Table 7: Detailed types of plaintiffs and defendants in claims finalised in the Local Court, 2014
952 claims Entity type Plaintiffs Defendants
% %
Individual 10.1 72.9
Local, shire or regional council 38.8 0.0
NSW government/agency 0.4 0.0
Commonwealth government 0.8 0.0
Utility 2.4 0.0
Workers compensation 9.2 0.0
Insurance – other 0.4 0.1
Bank, finance, loan, credit union etc. 8.3 0.2
Debt collector 3.4 0.0
Educational and child care 1.2 0.1
Other body – charities, religious, representational 0.5 0.4
Professional – incl. lawyers and accountants 1.8 0.5
Strata owner and manager 2.9 0.1
Property related – incl. leasing, management 1.1 1.7
Media related – incl. publishing, advertising 2.7 0.7
Construction related service, retailer 1.6 4.5
Transport related service, retailer 2.5 2.0
Food, hospitality and leisure service 1.3 3.6
Retail – other 3.7 2.6
Service – other 1.8 4.0
Manufacturing – other 2.2 1.4
Other business 2.6 4.9
Other – incl. liquidator, executor, guardian 0.3 0.2
All 100.0 100.0
Source: JusticeLink database. Notes: Based on claims from 1,000 random cases. 48 certificate matters not included (n=952). One plaintiff and one defendant selected per case. Where there were multiple defendants or plaintiffs listed, the non-individual was selected.
Data insights in civil justice: New South Wales Local Court
Law and Justice Foundation of NSW November 2016 14
The profile of plaintiffs and defendants in claims which reached determination differed from the profile of these entities when all claims were included in the analysis. This information is provided under Question 5, below.
Improving the quality of information about Local Court plaintiffs and defendants Greater clarity in the definition and intent of identifying individuals and organisations would facilitate a shared understanding of what types of entities may be found in each of these categories.
However, to better answer the question of who is taking action in the Local Courts and who is subject to this action, more detailed categories are required. One approach is to have plaintiffs or their representative select a category from a more detailed list (e.g. Commonwealth government, State government, local government, utility provider, public company, small business (<20 employees), micro business (<4 employees, sole business etc.). While plaintiffs and their representatives are usually well-placed to identify the category of their own entity, they may be less reliable in identifying the entity type of the defendant.
Another approach is to use ABN or ACN numbers to link organisations to the categories already defined through the ABR. A limitation of this approach may be that the categories used by the ABR may not match the information needs of the Department of Justice.
A question that remains unanswered – and appears difficult to answer reliably with the current data – is the extent to which insurers are involved in motor vehicle accident claims in particular. Insurers are currently masked by the fact that such litigation occurs in the name of the individual. While they can sometimes be identified using the combination of individual and corporate identifiers, this relies on their nominating the corporate fee. The extent to which this practice occurs is not currently evident in JusticeLink data.
Data insights in civil justice: New South Wales Local Court
Law and Justice Foundation of NSW November 2016 15
2. What types of claims are litigated in the Local Court?
Scope and quality of type of claim data When filing claims in the Local Court, plaintiffs or their representatives assign a claim type to the claim. Claim types are defined in the Uniform Civil Procedure Rules (UCPR) forms guide.15
We used the casefile analysis (see method section) to investigate how accurately claims are classified by parties and their representatives. In particular, we focused on claims in the general category Mercantile law – other. Casefile analysis indicated that a high proportion of claims in this category belonged in other categories. For instance, while the original JusticeLink data indicated 27.5% of claims concerned unpaid council rates, the revised data indicates the figure was over 34%. While further analysis is required, it appears that some councils have also categorised unpaid council rates as Real property – other. If so, this would further increase the overall proportion of all claims which were actually unpaid council rates.
Similarly, a second analysis of a sample of casefiles (all claim types) indicated that other claim types were also being misclassified. For example, claims relating to unpaid premiums for workers compensation insurances were found in the categories of Mercantile law – insurance disputes, Mercantile law – other, Mercantile law – sale of goods and services – goods sold and delivered, and Mercantile law – sale of goods and services – work done. An area of dispute, currently under Mercantile law – other which may have particular policy relevance but does not have its own claim type category relates to rented or hired goods, particularly hire purchase arrangements.
Bearing in mind that claim type is entered by the plaintiff or their representative, factors reducing the reliability of this data include that the:
• claim type categories provided are not mutually exclusive (e.g. some claims may logically be classified as either Mercantile law – consumer credit or Mercantile law – money lent).
• claim type categories provided are ambiguous e.g. the UCPR definitions indicate that Torts – negligence – motor vehicle accident applies when there has been an injury, while Torts – negligence – motor vehicle accident – driver applies where there has been damage to property, but no injury. In the cases reviewed, motor vehicle accident claims with no injury were routinely miscategorised (according to the definitions) as Torts – negligence – motor vehicle accident by plaintiffs and their lawyers. We found no cases in our sample where an injury was involved.
• definitions for the categories may not always be readily available.16
15 See UCPR Guide (undated) to completing the approved forms, s. 6 at http://www.ucprforms.justice.nsw.gov.au/Documents/ucpr%20guide%20section%206.pdf.
Data insights in civil justice: New South Wales Local Court
Law and Justice Foundation of NSW November 2016 16
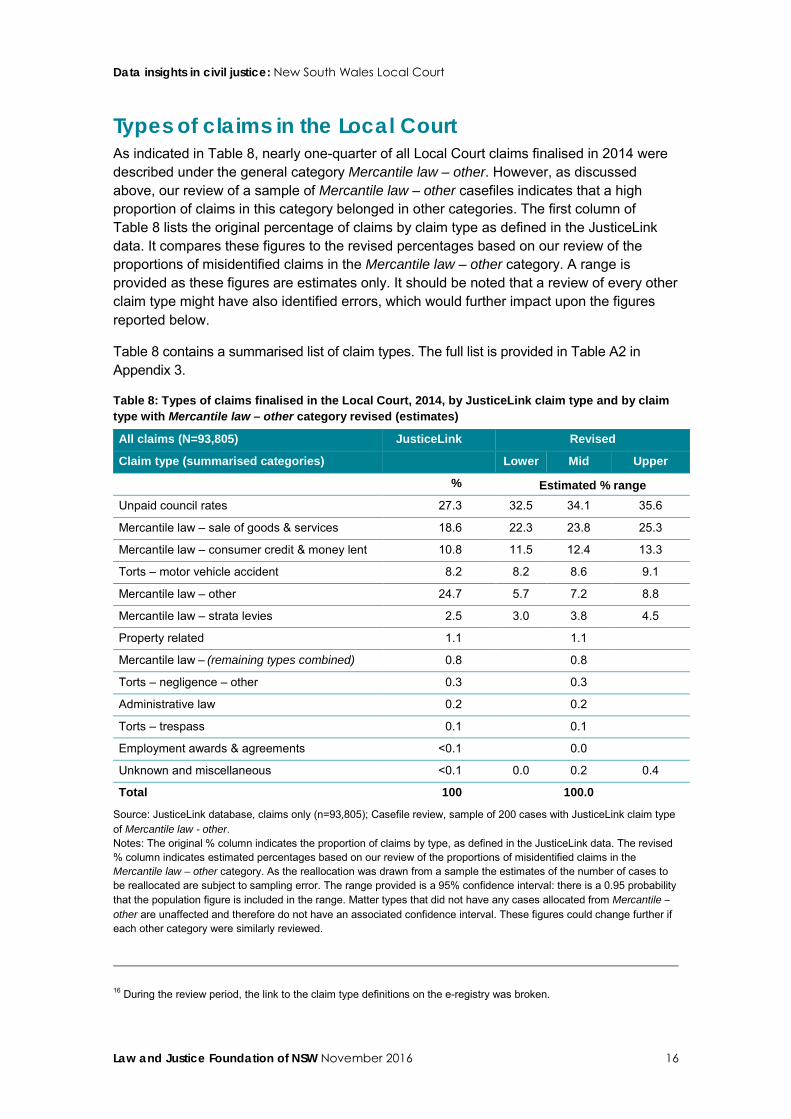
Types of claims in the Local Court As indicated in Table 8, nearly one-quarter of all Local Court claims finalised in 2014 were described under the general category Mercantile law – other. However, as discussed above, our review of a sample of Mercantile law – other casefiles indicates that a high proportion of claims in this category belonged in other categories. The first column of Table 8 lists the original percentage of claims by claim type as defined in the JusticeLink data. It compares these figures to the revised percentages based on our review of the proportions of misidentified claims in the Mercantile law – other category. A range is provided as these figures are estimates only. It should be noted that a review of every other claim type might have also identified errors, which would further impact upon the figures reported below.
Table 8 contains a summarised list of claim types. The full list is provided in Table A2 in Appendix 3.
Table 8: Types of claims finalised in the Local Court, 2014, by JusticeLink claim type and by claim type with Mercantile law – other category revised (estimates)
All claims (N=93,805) JusticeLink Revised
Claim type (summarised categories) Lower Mid Upper % Estimated % range Unpaid council rates 27.3 32.5 34.1 35.6
Mercantile law – sale of goods & services 18.6 22.3 23.8 25.3
Mercantile law – consumer credit & money lent 10.8 11.5 12.4 13.3
Torts – motor vehicle accident 8.2 8.2 8.6 9.1
Mercantile law – other 24.7 5.7 7.2 8.8
Mercantile law – strata levies 2.5 3.0 3.8 4.5
Property related 1.1
1.1
Mercantile law – (remaining types combined) 0.8 0.8
Torts – negligence – other 0.3
0.3
Administrative law 0.2
0.2
Torts – trespass 0.1 0.1 Employment awards & agreements <0.1
0.0
Unknown and miscellaneous <0.1 0.0 0.2 0.4
Total 100 100.0 Source: JusticeLink database, claims only (n=93,805); Casefile review, sample of 200 cases with JusticeLink claim type of Mercantile law - other. Notes: The original % column indicates the proportion of claims by type, as defined in the JusticeLink data. The revised % column indicates estimated percentages based on our review of the proportions of misidentified claims in the Mercantile law – other category. As the reallocation was drawn from a sample the estimates of the number of cases to be reallocated are subject to sampling error. The range provided is a 95% confidence interval: there is a 0.95 probability that the population figure is included in the range. Matter types that did not have any cases allocated from Mercantile – other are unaffected and therefore do not have an associated confidence interval. These figures could change further if each other category were similarly reviewed.
16 During the review period, the link to the claim type definitions on the e-registry was broken.
Data insights in civil justice: New South Wales Local Court
Law and Justice Foundation of NSW November 2016 17
The revised estimates indicate that:
• one-third (around 34%) of all claims in the Local Court finalised during 2014 were local councils pursuing unpaid council rates
• more than 20% of claims concerned Mercantile law – sale of goods and services (e.g. work done or goods sold and delivered)
• the proportion of claims filed as Mercantile law – other dropped from 25% to around 7%, when misclassified claims were removed.17
Do different plaintiffs bring different actions in the Local Court? While the proportion of claim types misclassified as Mercantile law – other has been reapportioned based on the casefile analysis, the revised proportions cannot be matched back with other JusticeLink data for cross-tabulation. For this reason and unless otherwise specified, the following figures reflect the claim types originally reported on JusticeLink, and must be interpreted with this caveat in mind.
JusticeLink data indicates that 73% of claims pursued by local councils concerned unpaid council rates. (The casefile analysis however, suggested that this figure was closer to 95%, when claims misclassified as Mercantile law – other were included.)
Government plaintiffs mainly pursued Mercantile law – other claims. The casefile analysis indicates that these were largely taxation-related claims.
Claims in which the plaintiffs were utilities were usually either Mercantile law – sale of goods and services or Mercantile law – other. Casefile analyses indicated that all these claims related to unpaid rates and charges. However, while one major utility classified the claims as Mercantile law – goods and services, another classified the same matters as Mercantile law – other.
None of the above entity types appeared in our sample as defendants.
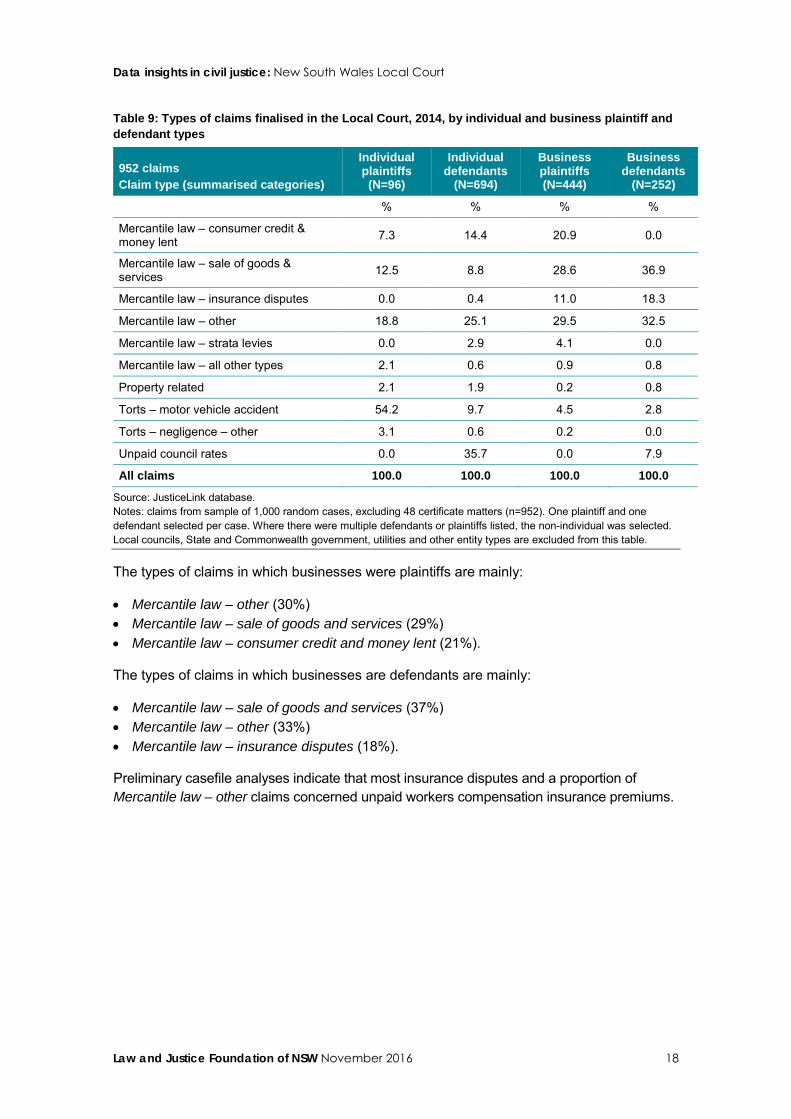
Claims involving individual and business plaintiffs and defendants As indicated in Table 9, the picture is more complex for individuals and for businesses. The data suggests that:
• more than half (54%) of the 96 individual plaintiffs in the sample were involved in motor vehicle accident claims. It is not clear what proportion of these claims also involved an insurer. Nearly one in five (19%) of individual plaintiffs were involved in Mercantile law – other claims and nearly 13% in Mercantile law – sale of goods and services claims
• as defendants (n=694), individuals were pursued for a broader range of claims including unpaid council rates (36%), Mercantile law – other (25%) and Mercantile law – consumer credit or money lent (14%).
17 This is a conservative estimate as, at the time of writing, particulars were not yet available for 12.5% of matters reviewed. These remain in the Mercantile law – other category until reviewed.
Data insights in civil justice: New South Wales Local Court
Law and Justice Foundation of NSW November 2016 18
Table 9: Types of claims finalised in the Local Court, 2014, by individual and business plaintiff and defendant types
952 claims Claim type (summarised categories)
Individual plaintiffs (N=96)
Individual defendants
(N=694)
Business plaintiffs (N=444)
Business defendants
(N=252)
% % % %
Mercantile law – consumer credit & money lent 7.3 14.4 20.9 0.0
Mercantile law – sale of goods & services 12.5 8.8 28.6 36.9
Mercantile law – insurance disputes 0.0 0.4 11.0 18.3
Mercantile law – other 18.8 25.1 29.5 32.5
Mercantile law – strata levies 0.0 2.9 4.1 0.0
Mercantile law – all other types 2.1 0.6 0.9 0.8
Property related 2.1 1.9 0.2 0.8
Torts – motor vehicle accident 54.2 9.7 4.5 2.8
Torts – negligence – other 3.1 0.6 0.2 0.0
Unpaid council rates 0.0 35.7 0.0 7.9
All claims 100.0 100.0 100.0 100.0
Source: JusticeLink database. Notes: claims from sample of 1,000 random cases, excluding 48 certificate matters (n=952). One plaintiff and one defendant selected per case. Where there were multiple defendants or plaintiffs listed, the non-individual was selected. Local councils, State and Commonwealth government, utilities and other entity types are excluded from this table. The types of claims in which businesses were plaintiffs are mainly:
• Mercantile law – other (30%) • Mercantile law – sale of goods and services (29%) • Mercantile law – consumer credit and money lent (21%).
The types of claims in which businesses are defendants are mainly:
• Mercantile law – sale of goods and services (37%) • Mercantile law – other (33%) • Mercantile law – insurance disputes (18%).
Preliminary casefile analyses indicate that most insurance disputes and a proportion of Mercantile law – other claims concerned unpaid workers compensation insurance premiums.
Data insights in civil justice: New South Wales Local Court
Law and Justice Foundation of NSW November 2016 19
The particular story about unpaid council rates Together, the analyses undertaken of plaintiff types and claim types have identified the use by local councils of the Local Court to pursue unpaid council rates.
Taking account of unpaid council rates matters that appeared to be misclassified as Mercantile law – other, we have examined the profile of councils that most commonly pursued unpaid council rates through the court. Analyses suggest that all but 3 of the 152 local councils in NSW had at least one claim for unpaid council rates (including those filed as Mercantile law – other).
Further:
• 10 councils (together covering 21% of the NSW adult population) brought one-third of all Local Court claims for unpaid council rates during 2014.
– 6 of these councils represented suburban Sydney local government areas (LGAs) and 4 were in regional or rural areas. 4 of the 10 LGAs are identified as disadvantaged or very disadvantaged on SEIFA ratings.18
• 20 councils (together covering 37% of the NSW adult population) brought half of all such claims.
– 11 of these councils were in rural or regional LGAs and 7 in Western Sydney LGAs with 9 of the 20 councils representing LGAs which are disadvantaged or very disadvantaged on SEIFA ratings.
• 30 councils (together covering 51% of the NSW adult population) brought 64% of such claims.
Taking account of the adult population size, we examined the rate of litigation for unpaid council rates per 1,000 residents. The 20 councils with the highest rates of filing for unpaid council rates were in rural and remote LGAs. Of note, 14 of these 20 LGAs are disadvantaged or very disadvantaged on SEIFA ratings.
Overall, these figures raise questions about how appropriate it is for local councils to so readily pursue these debts through the Local Court, particularly where disadvantage is likely implicated in the failure to pay rates in the first place. The high interest rates and costs associated with debt recovery through the Local Court may only compound disadvantage. More effective administrative arrangements, including time to pay arrangements and hardship provisions may provide a more appropriate alternative.
18 Census of Population and Housing: Socio-Economic Indexes for Areas (SEIFA), Australia, 2011 (cat. no. 2033.0.55.001). See http:// www.abs.gov.au/websitedbs/censushome.nsf/home/seifa.
Data insights in civil justice: New South Wales Local Court
Law and Justice Foundation of NSW November 2016 20
Improving information about types of claim Taking account of the issues raised above, revised classifications which provide mutually exclusive, plain language and intuitive claim type categories would vastly improve the quality of claim type data for policy purposes. Acknowledging that the existing categories have been created as part of a national civil classification scheme for civil litigation, any revised categories would need to align to the existing categories. One option may be to make a plain English list of categories available to the front-end user (including court staff and e-registry users), that maps to the national classification categories in the back-end of JusticeLink.
Data insights in civil justice: New South Wales Local Court
Law and Justice Foundation of NSW November 2016 21
3. What are Local Court claims worth?
A range of questions can be asked about the amounts of money claimed and awarded in the Local Court: about base claim amounts, claim amounts including costs, the value of costs relative to claims, amounts awarded and costs awarded. Relevant to each of these questions are types of claims made, types of plaintiffs and defendants and how matters are resolved. Here we explore:
a. base amount of claims (excluding interest, court and solicitor costs) b. interest and costs as a proportion of claims, and c. awards compared to claims and the value of costs awarded. Analyses of data on monetary amounts claimed and awarded is very complex due to the range of different figures that can potentially be reported. For instance, consideration needs to be given to what costs are relevant in each case, how costs may change with varying orders within the same case, and how awards and costs are allocated when there are multiple defendants.19
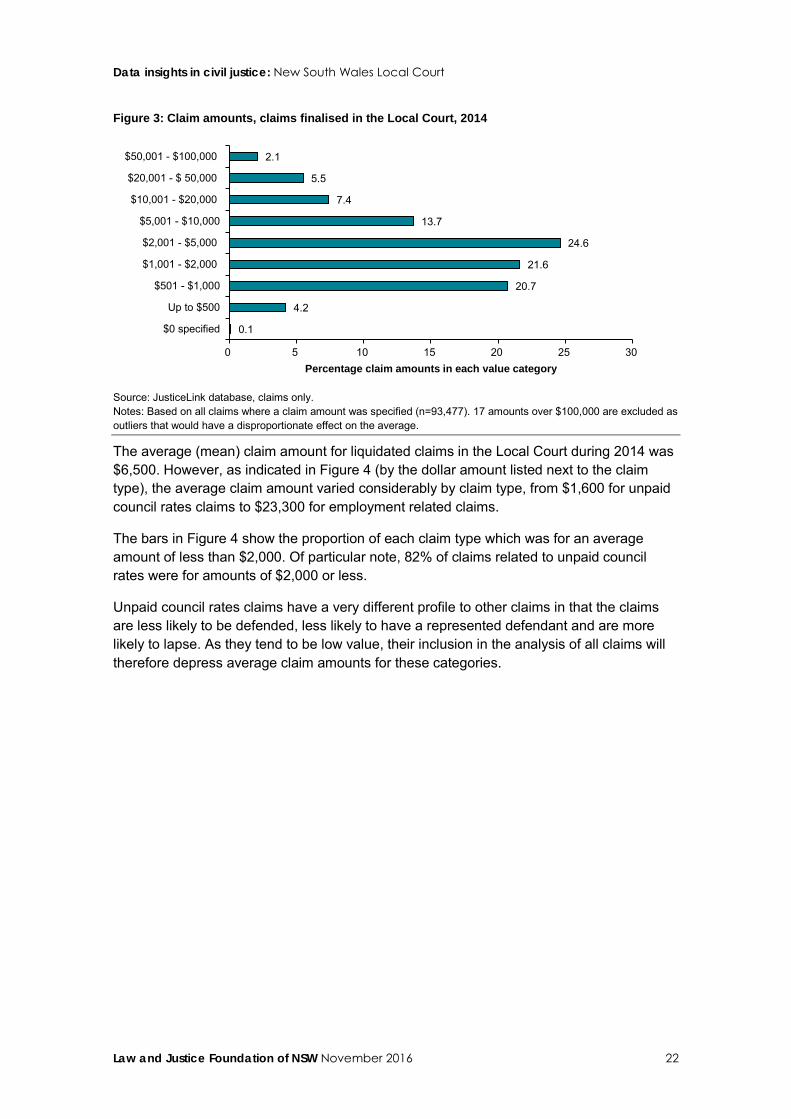
Claim amounts Two-thirds of all liquidated claims finalised in the Local Court during 2014 were for claim amounts of $5,000 or less, excluding interest, court costs and solicitor fees.20 Nearly 47% were for amounts of less than $2,000 (Figure 3).
19 It is not clear from the dataset provided whether, in the case of multiple defendants, the amounts indicated are shared by the defendants or each defendant is liable for the total amount. We have reported our calculations on the basis of what the plaintiff was awarded.
20 The analysis here excludes exclusively unliquidated claims.
Data insights in civil justice: New South Wales Local Court
Law and Justice Foundation of NSW November 2016 22
Figure 3: Claim amounts, claims finalised in the Local Court, 2014
Source: JusticeLink database, claims only. Notes: Based on all claims where a claim amount was specified (n=93,477). 17 amounts over $100,000 are excluded as outliers that would have a disproportionate effect on the average.
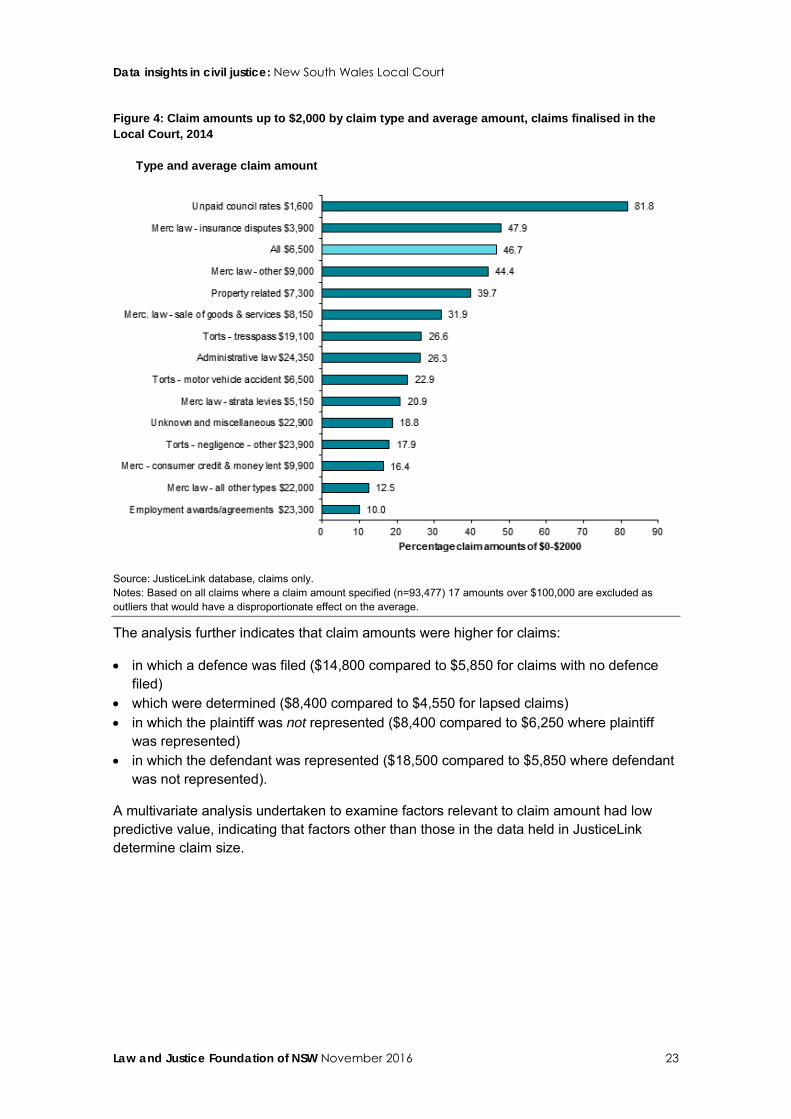
The average (mean) claim amount for liquidated claims in the Local Court during 2014 was $6,500. However, as indicated in Figure 4 (by the dollar amount listed next to the claim type), the average claim amount varied considerably by claim type, from $1,600 for unpaid council rates claims to $23,300 for employment related claims.
The bars in Figure 4 show the proportion of each claim type which was for an average amount of less than $2,000. Of particular note, 82% of claims related to unpaid council rates were for amounts of $2,000 or less.
Unpaid council rates claims have a very different profile to other claims in that the claims are less likely to be defended, less likely to have a represented defendant and are more likely to lapse. As they tend to be low value, their inclusion in the analysis of all claims will therefore depress average claim amounts for these categories.
0.1
4.2
20.7
21.6
24.6
13.7
7.4
5.5
2.1
0 5 10 15 20 25 30
$0 specified
Up to $500
$501 - $1,000
$1,001 - $2,000
$2,001 - $5,000
$5,001 - $10,000
$10,001 - $20,000
$20,001 - $ 50,000
$50,001 - $100,000
Percentage claim amounts in each value category
Data insights in civil justice: New South Wales Local Court
Law and Justice Foundation of NSW November 2016 23
Figure 4: Claim amounts up to $2,000 by claim type and average amount, claims finalised in the Local Court, 2014
Type and average claim amount
Source: JusticeLink database, claims only. Notes: Based on all claims where a claim amount specified (n=93,477) 17 amounts over $100,000 are excluded as outliers that would have a disproportionate effect on the average.
The analysis further indicates that claim amounts were higher for claims:
• in which a defence was filed ($14,800 compared to $5,850 for claims with no defence filed)
• which were determined ($8,400 compared to $4,550 for lapsed claims) • in which the plaintiff was not represented ($8,400 compared to $6,250 where plaintiff
was represented) • in which the defendant was represented ($18,500 compared to $5,850 where defendant
was not represented).
A multivariate analysis undertaken to examine factors relevant to claim amount had low predictive value, indicating that factors other than those in the data held in JusticeLink determine claim size.
Data insights in civil justice: New South Wales Local Court
Law and Justice Foundation of NSW November 2016 24
Interest and costs claimed In addition to the base amount of money claimed, a statement of claim specifies any interest, filing fees, service fees and solicitor costs also claimed. The rates of interest, and the fee and cost amounts that can be claimed, are authorised by legislation.21 The amounts claimable may vary, for instance, by the type of claim, the value of the claim, the entity type of the plaintiff (e.g., organisation or individual) and, in the case of interest, the point in proceedings (pre- or post-judgment).
Accordingly, the court data provides valuable insight into some of the costs associated with seeking to recover money or resolve disputes through the Local Court, and the value of these additional costs, relative to the claim amount.
We first examined the interest and costs claimed as a percentage of the base claim amount detailed in the statement of claim. By focusing on amounts claimed, we could include the many matters that are filed in the Local Court but lapse (and may be resolved outside the court). As we did not have JusticeLink data to complete this analysis on the full dataset, the data reported here is based on three samples from our casefile analyses.22 The first is the sample of matters that resulted in judgment by trial and the second is the sample of matters which settled. The third is the sample of all claims filed in the Local Court, including representative proportions of claims which had lapsed, claims that resulted in default judgment and small numbers of claims that reached judgment by trial or settlement.
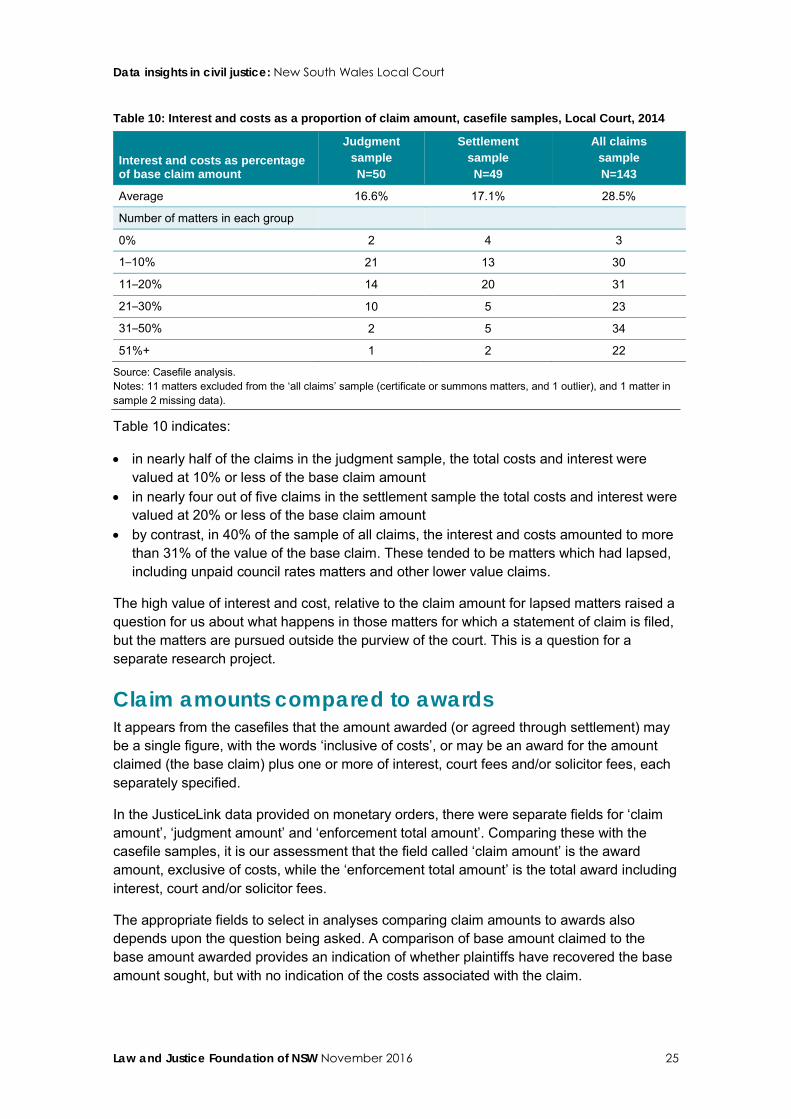
Table 10 indicates that the interest and costs claimed in each of the samples of matters that went to judgment by trial or were settled added, on average, 17% of the value of the base claim amount. In contrast, the interests and costs claimed in the sample of all claims, on average, added 30% of the value of the base claim.
Averages can mask variation in the amounts of interest and costs claimed. For this reason, Table 10 also shows the number of claims in which the interest and costs were a lower proportion of the claim amount, and the number in which the costs were higher, relative to the size of the claim.
21 The Civil Procedure Act 2005 authorises the payment of interest (ss.100-101) and costs in proceedings (s. 98). Tables of interest payable are listed on the Local Court website (http://www.localcourt.justice.nsw.gov.au/Pages/Practice_procedure/interest_rates.aspx). Fees payable in relation to court proceedings are detailed in the Civil Procedure Regulation 2012 (Clause 4). Solicitor costs (relevant to the recovery of certain debts and the enforcement of certain judgments) are outlined in the Legal Profession Uniform Law Application Regulation 2015, Schedule 1.
22 We did not have JusticeLink data for the separate fields of interest, service fees, filing fees and solicitor fees claimed, or the total claim amount including these fees.
Data insights in civil justice: New South Wales Local Court
Law and Justice Foundation of NSW November 2016 25
Table 10: Interest and costs as a proportion of claim amount, casefile samples, Local Court, 2014
Interest and costs as percentage of base claim amount
Judgment sample N=50
Settlement sample N=49
All claims sample N=143
Average 16.6% 17.1% 28.5%
Number of matters in each group
0% 2 4 3
1–10% 21 13 30
11–20% 14 20 31
21–30% 10 5 23
31–50% 2 5 34
51%+ 1 2 22
Source: Casefile analysis. Notes: 11 matters excluded from the ‘all claims’ sample (certificate or summons matters, and 1 outlier), and 1 matter in sample 2 missing data).
Table 10 indicates:
• in nearly half of the claims in the judgment sample, the total costs and interest were valued at 10% or less of the base claim amount
• in nearly four out of five claims in the settlement sample the total costs and interest were valued at 20% or less of the base claim amount
• by contrast, in 40% of the sample of all claims, the interest and costs amounted to more than 31% of the value of the base claim. These tended to be matters which had lapsed, including unpaid council rates matters and other lower value claims.
The high value of interest and cost, relative to the claim amount for lapsed matters raised a question for us about what happens in those matters for which a statement of claim is filed, but the matters are pursued outside the purview of the court. This is a question for a separate research project.
Claim amounts compared to awards It appears from the casefiles that the amount awarded (or agreed through settlement) may be a single figure, with the words ‘inclusive of costs’, or may be an award for the amount claimed (the base claim) plus one or more of interest, court fees and/or solicitor fees, each separately specified.
In the JusticeLink data provided on monetary orders, there were separate fields for ‘claim amount’, ‘judgment amount’ and ‘enforcement total amount’. Comparing these with the casefile samples, it is our assessment that the field called ‘claim amount’ is the award amount, exclusive of costs, while the ‘enforcement total amount’ is the total award including interest, court and/or solicitor fees.
The appropriate fields to select in analyses comparing claim amounts to awards also depends upon the question being asked. A comparison of base amount claimed to the base amount awarded provides an indication of whether plaintiffs have recovered the base amount sought, but with no indication of the costs associated with the claim.
Data insights in civil justice: New South Wales Local Court
Law and Justice Foundation of NSW November 2016 26
A comparison of the base amount claimed to the total amount received provides an indication of the amount recovered, including any additional award for the costs of recovering the money claimed. This appears closer to the take home amount.
Claim amounts compared to awards by claim type The first three columns of Table 11 indicate the proportion of claims, by claim type, for which the base amount awarded (exclusive of costs) was: less than the base amount claimed (column 1); the same (column 2); or more than the amount claimed (column 3).
The data indicates that in 72% of these claims, the base figure awarded was the same as the base figure claimed. In 27% of claims, the base figure awarded was less. This varied by claim type. In 43% of claims for unpaid council rates, the base figure awarded was less than the base figure claimed.
Column 4 of Table 11 indicates the average (mean) difference between the base amount awarded and base amount originally claimed. For all claim types, the average amount awarded was less than the average amount claimed. However, these figures do not include any interest and costs claimed or awarded.
Column 5 provides the average additional amount awarded to cover interest, fees and costs. This figure represents the difference between the award inclusive of costs and the award amount exclusive of costs.
Column 6 of Table 11 indicates the value of these additional costs as a percentage of the original claim. This indicates that, on average, the process of pursuing the matter through the court added 16% to the original claim in interest and costs. However, this varied by claim type, indicating that Unpaid council rates and Mercantile law – insurance disputes had the highest costs as a proportion of the original claim (27%). Again, this is likely to reflect the low value of claims and raises questions about the cost of pursuing such matters through the court, relative to other options.
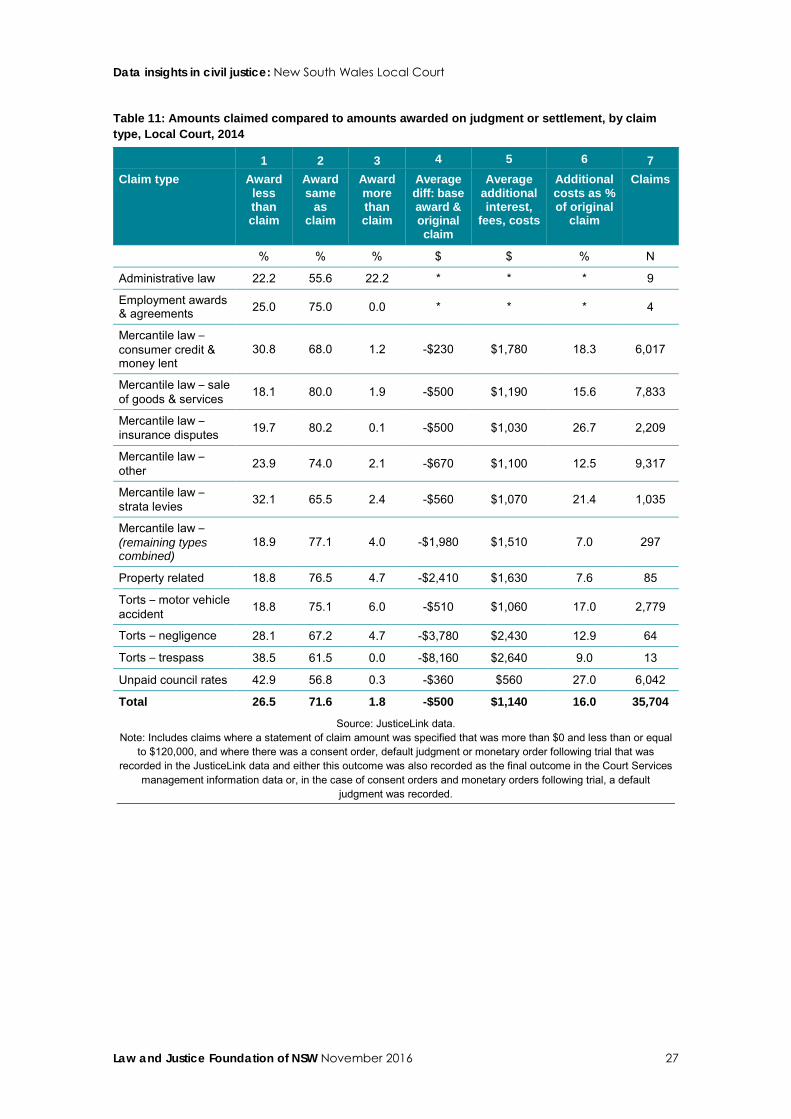
Data insights in civil justice: New South Wales Local Court
Law and Justice Foundation of NSW November 2016 27
Table 11: Amounts claimed compared to amounts awarded on judgment or settlement, by claim type, Local Court, 2014
1 2 3 4 5 6 7 Claim type Award
less than claim
Award same
as claim
Award more than claim
Average diff: base award & original claim
Average additional interest,
fees, costs
Additional costs as % of original
claim
Claims
% % % $ $ % N
Administrative law 22.2 55.6 22.2 * * * 9
Employment awards & agreements 25.0 75.0 0.0 * * * 4
Mercantile law – consumer credit & money lent
30.8 68.0 1.2 -$230 $1,780 18.3 6,017
Mercantile law – sale of goods & services 18.1 80.0 1.9 -$500 $1,190 15.6 7,833
Mercantile law – insurance disputes 19.7 80.2 0.1 -$500 $1,030 26.7 2,209
Mercantile law – other 23.9 74.0 2.1 -$670 $1,100 12.5 9,317
Mercantile law – strata levies 32.1 65.5 2.4 -$560 $1,070 21.4 1,035
Mercantile law – (remaining types combined)
18.9 77.1 4.0 -$1,980 $1,510 7.0 297
Property related 18.8 76.5 4.7 -$2,410 $1,630 7.6 85
Torts – motor vehicle accident 18.8 75.1 6.0 -$510 $1,060 17.0 2,779
Torts – negligence 28.1 67.2 4.7 -$3,780 $2,430 12.9 64
Torts – trespass 38.5 61.5 0.0 -$8,160 $2,640 9.0 13
Unpaid council rates 42.9 56.8 0.3 -$360 $560 27.0 6,042
Total 26.5 71.6 1.8 -$500 $1,140 16.0 35,704
Source: JusticeLink data. Note: Includes claims where a statement of claim amount was specified that was more than $0 and less than or equal
to $120,000, and where there was a consent order, default judgment or monetary order following trial that was recorded in the JusticeLink data and either this outcome was also recorded as the final outcome in the Court Services
management information data or, in the case of consent orders and monetary orders following trial, a default judgment was recorded.
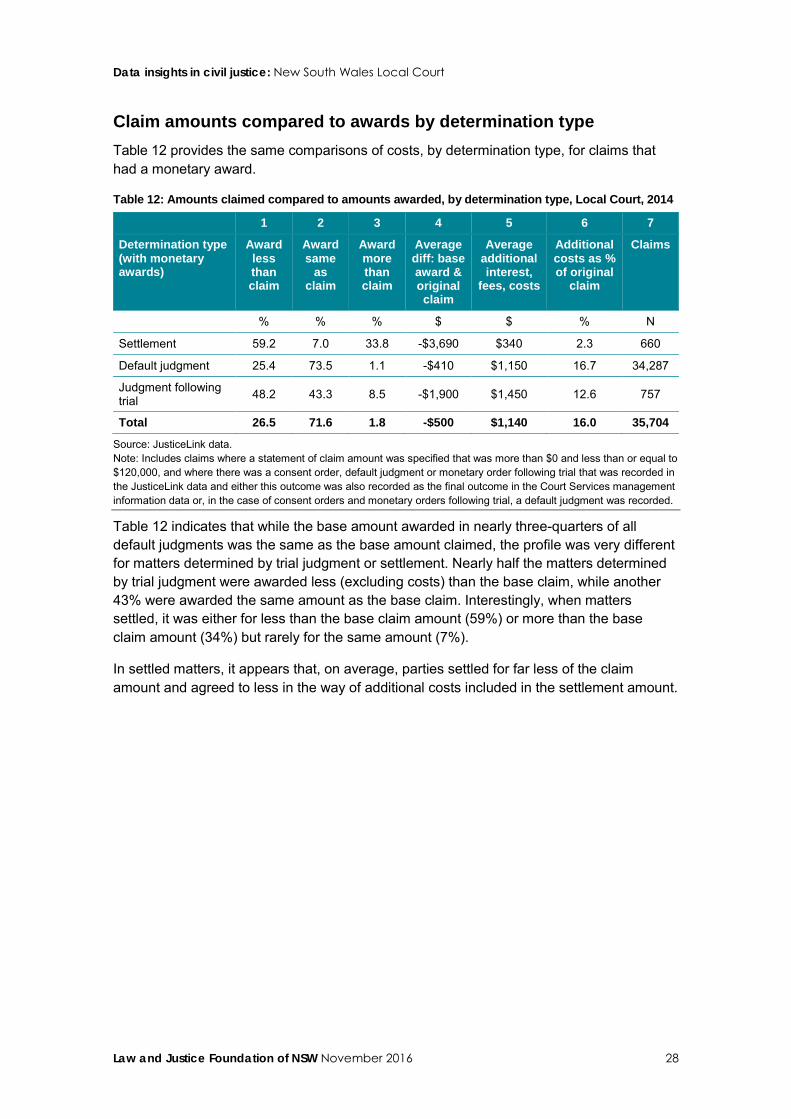
Data insights in civil justice: New South Wales Local Court
Law and Justice Foundation of NSW November 2016 28
Claim amounts compared to awards by determination type Table 12 provides the same comparisons of costs, by determination type, for claims that had a monetary award.
Table 12: Amounts claimed compared to amounts awarded, by determination type, Local Court, 2014
1 2 3 4 5 6 7
Determination type (with monetary awards)
Award less than claim
Award same
as claim
Award more than claim
Average diff: base award & original claim
Average additional interest,
fees, costs
Additional costs as % of original
claim
Claims
% % % $ $ % N
Settlement 59.2 7.0 33.8 -$3,690 $340 2.3 660
Default judgment 25.4 73.5 1.1 -$410 $1,150 16.7 34,287
Judgment following trial 48.2 43.3 8.5 -$1,900 $1,450 12.6 757
Total 26.5 71.6 1.8 -$500 $1,140 16.0 35,704
Source: JusticeLink data. Note: Includes claims where a statement of claim amount was specified that was more than $0 and less than or equal to $120,000, and where there was a consent order, default judgment or monetary order following trial that was recorded in the JusticeLink data and either this outcome was also recorded as the final outcome in the Court Services management information data or, in the case of consent orders and monetary orders following trial, a default judgment was recorded.
Table 12 indicates that while the base amount awarded in nearly three-quarters of all default judgments was the same as the base amount claimed, the profile was very different for matters determined by trial judgment or settlement. Nearly half the matters determined by trial judgment were awarded less (excluding costs) than the base claim, while another 43% were awarded the same amount as the base claim. Interestingly, when matters settled, it was either for less than the base claim amount (59%) or more than the base claim amount (34%) but rarely for the same amount (7%).
In settled matters, it appears that, on average, parties settled for far less of the claim amount and agreed to less in the way of additional costs included in the settlement amount.
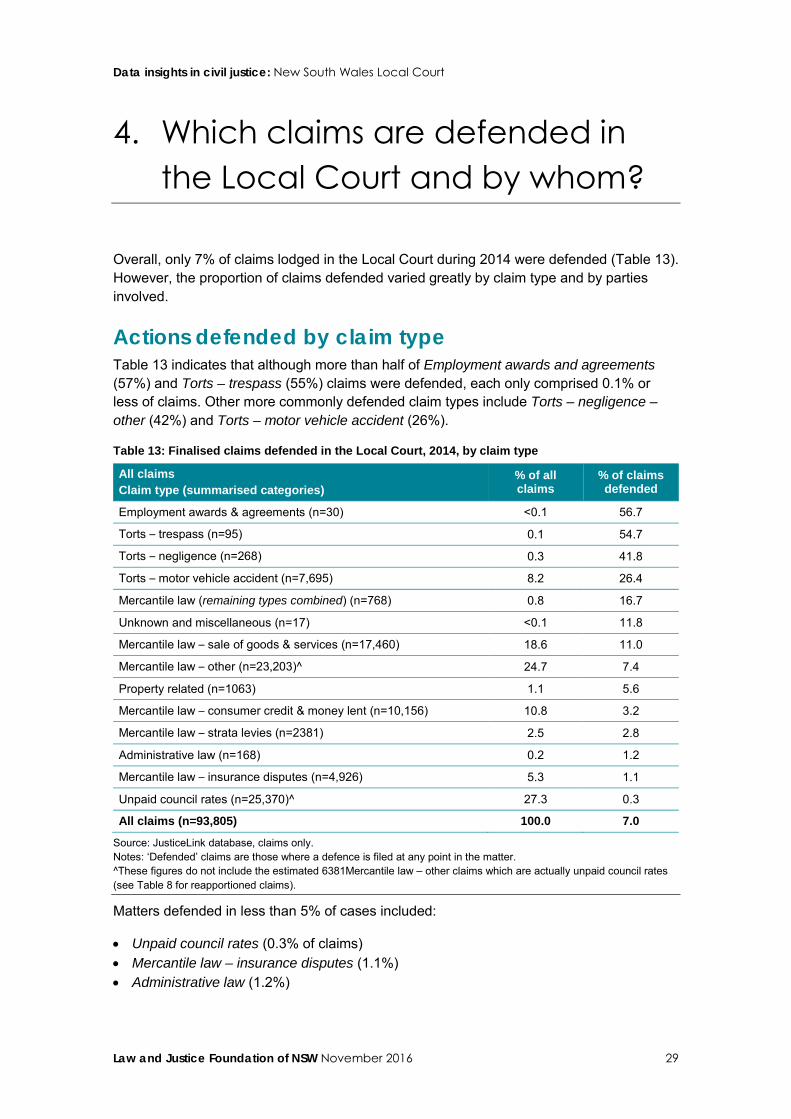
Data insights in civil justice: New South Wales Local Court
Law and Justice Foundation of NSW November 2016 29
4. Which claims are defended in the Local Court and by whom?
Overall, only 7% of claims lodged in the Local Court during 2014 were defended (Table 13). However, the proportion of claims defended varied greatly by claim type and by parties involved.
Actions defended by claim type Table 13 indicates that although more than half of Employment awards and agreements (57%) and Torts – trespass (55%) claims were defended, each only comprised 0.1% or less of claims. Other more commonly defended claim types include Torts – negligence – other (42%) and Torts – motor vehicle accident (26%).
Table 13: Finalised claims defended in the Local Court, 2014, by claim type
All claims Claim type (summarised categories)
% of all claims
% of claims defended
Employment awards & agreements (n=30) <0.1 56.7
Torts – trespass (n=95) 0.1 54.7
Torts – negligence (n=268) 0.3 41.8
Torts – motor vehicle accident (n=7,695) 8.2 26.4
Mercantile law (remaining types combined) (n=768) 0.8 16.7
Unknown and miscellaneous (n=17) <0.1 11.8
Mercantile law – sale of goods & services (n=17,460) 18.6 11.0
Mercantile law – other (n=23,203)^ 24.7 7.4
Property related (n=1063) 1.1 5.6
Mercantile law – consumer credit & money lent (n=10,156) 10.8 3.2
Mercantile law – strata levies (n=2381) 2.5 2.8
Administrative law (n=168) 0.2 1.2
Mercantile law – insurance disputes (n=4,926) 5.3 1.1
Unpaid council rates (n=25,370)^ 27.3 0.3
All claims (n=93,805) 100.0 7.0
Source: JusticeLink database, claims only. Notes: ‘Defended’ claims are those where a defence is filed at any point in the matter. ^These figures do not include the estimated 6381Mercantile law – other claims which are actually unpaid council rates (see Table 8 for reapportioned claims).
Matters defended in less than 5% of cases included:
• Unpaid council rates (0.3% of claims) • Mercantile law – insurance disputes (1.1%) • Administrative law (1.2%)
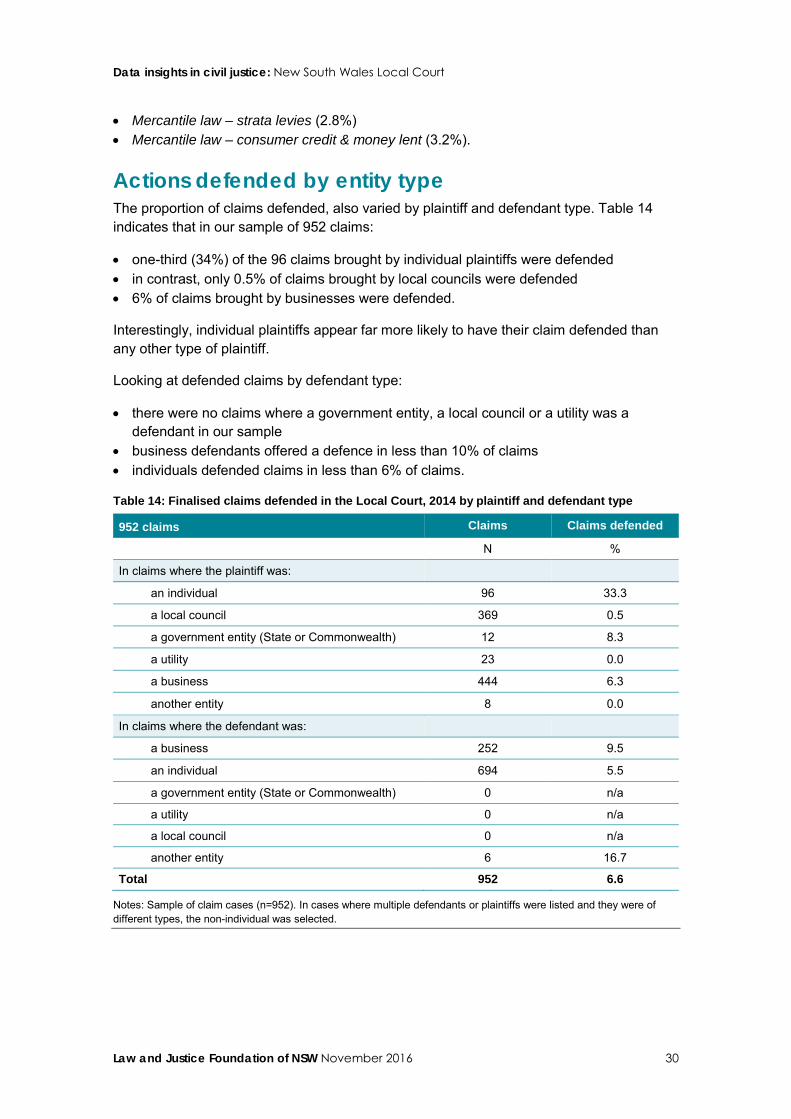
Data insights in civil justice: New South Wales Local Court
Law and Justice Foundation of NSW November 2016 30
• Mercantile law – strata levies (2.8%) • Mercantile law – consumer credit & money lent (3.2%).
Actions defended by entity type The proportion of claims defended, also varied by plaintiff and defendant type. Table 14 indicates that in our sample of 952 claims:
• one-third (34%) of the 96 claims brought by individual plaintiffs were defended • in contrast, only 0.5% of claims brought by local councils were defended • 6% of claims brought by businesses were defended.
Interestingly, individual plaintiffs appear far more likely to have their claim defended than any other type of plaintiff.
Looking at defended claims by defendant type:
• there were no claims where a government entity, a local council or a utility was a defendant in our sample
• business defendants offered a defence in less than 10% of claims • individuals defended claims in less than 6% of claims.
Table 14: Finalised claims defended in the Local Court, 2014 by plaintiff and defendant type
952 claims Claims Claims defended
N %
In claims where the plaintiff was:
an individual 96 33.3
a local council 369 0.5
a government entity (State or Commonwealth) 12 8.3
a utility 23 0.0
a business 444 6.3
another entity 8 0.0
In claims where the defendant was:
a business 252 9.5
an individual 694 5.5
a government entity (State or Commonwealth) 0 n/a
a utility 0 n/a
a local council 0 n/a
another entity 6 16.7
Total 952 6.6
Notes: Sample of claim cases (n=952). In cases where multiple defendants or plaintiffs were listed and they were of different types, the non-individual was selected.
Data insights in civil justice: New South Wales Local Court
Law and Justice Foundation of NSW November 2016 31
5. Who is represented in the Local Court and for what claims?
The scope and quality of data on representation The following observations provide important context to the data on the representation status of parties in the Local Court.
• At the point of lodgement, the defendant will not have received the statement of claim. Therefore, they are unlikely to be represented at this point, even if they subsequently engage a lawyer to defend the claim. Thus, if court data on representation is only examined at the point of lodgement, it will greatly underestimate the proportion of defendants who may be represented at some point during their matter.
• Parties vary in the points at which they engage representation. Examples were evident where:
– defendants engaged a representative to file a defence – defendants engaged a representative only after default judgment had been entered
and/or once enforcement had commenced, prompting the matter to be reopened – plaintiffs engaged a representative after a defence was filed or when enforcement
orders were challenged.
• Parties may not be represented in the claim but may receive legal help, for instance, from public legal assistance or information services, one-off advice from a solicitor or a friend who is a solicitor,23 or assistance from court registry staff and registrars through the chamber service.24 Of note, served statements of claim direct defendants to the assistance provided by LawAccess NSW.25 Legal assistance provided by any of these other sources will not be evident in JusticeLink data.
• The data reported here concerns representation by a lawyer. Parties may also be represented or supported by authorised officers, accountants or insurance companies. JusticeLink can indicate representation by an authorised officer but such representation is not included in this report.
• Even when parties are represented by a lawyer at some point in the process from filing to finalisation, this information may not be included on JusticeLink. Our casefile sample indicated cases where a lawyer’s signature was evident on a statement of claim or a consent order, but no lawyer was listed on JusticeLink as a participant (or indicated at any stage on the record of proceedings). This finding suggests that the data reported here is a conservative estimate of the proportion of parties represented at some point.
23 Coumarelos et al. 2012; Pleasence, P, Coumarelos, C, Forell, S & McDonald, HM 2014, Reshaping legal assistance services: building on the evidence base: a discussion paper, Law and Justice Foundation of NSW, Sydney.
24 <http://www.localcourt.justice.nsw.gov.au/Pages/about_us/registries.aspx> 25 In 2013, LawAccess NSW received 813 calls about civil law issues from people who had been referred by courts or
tribunals (Law and Justice Foundation of NSW, Legal Assistance Services Data Digest).
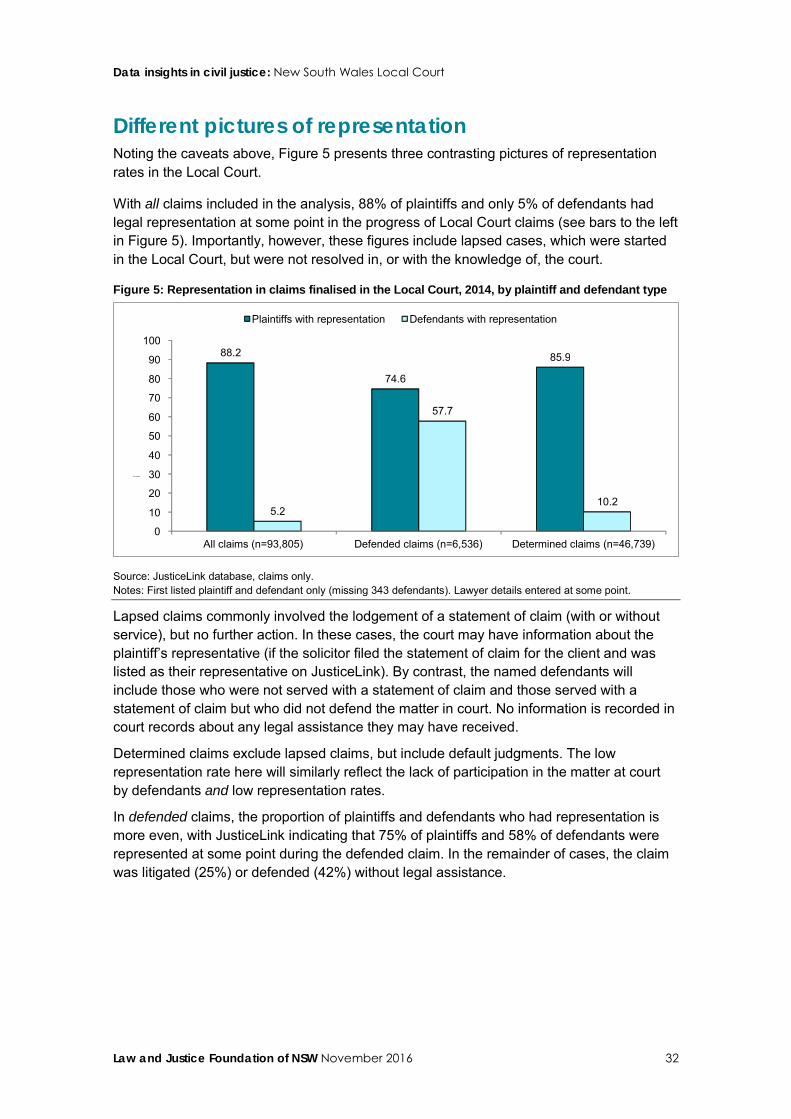
Data insights in civil justice: New South Wales Local Court
Law and Justice Foundation of NSW November 2016 32
Different pictures of representation Noting the caveats above, Figure 5 presents three contrasting pictures of representation rates in the Local Court.
With all claims included in the analysis, 88% of plaintiffs and only 5% of defendants had legal representation at some point in the progress of Local Court claims (see bars to the left in Figure 5). Importantly, however, these figures include lapsed cases, which were started in the Local Court, but were not resolved in, or with the knowledge of, the court.
Figure 5: Representation in claims finalised in the Local Court, 2014, by plaintiff and defendant type
Source: JusticeLink database, claims only. Notes: First listed plaintiff and defendant only (missing 343 defendants). Lawyer details entered at some point.
Lapsed claims commonly involved the lodgement of a statement of claim (with or without service), but no further action. In these cases, the court may have information about the plaintiff’s representative (if the solicitor filed the statement of claim for the client and was listed as their representative on JusticeLink). By contrast, the named defendants will include those who were not served with a statement of claim and those served with a statement of claim but who did not defend the matter in court. No information is recorded in court records about any legal assistance they may have received.
Determined claims exclude lapsed claims, but include default judgments. The low representation rate here will similarly reflect the lack of participation in the matter at court by defendants and low representation rates.
In defended claims, the proportion of plaintiffs and defendants who had representation is more even, with JusticeLink indicating that 75% of plaintiffs and 58% of defendants were represented at some point during the defended claim. In the remainder of cases, the claim was litigated (25%) or defended (42%) without legal assistance.
88.2
74.6 85.9
5.2
57.7
10.2
0 10 20 30 40 50 60 70 80 90
100
All claims (n=93,805) Defended claims (n=6,536) Determined claims (n=46,739)
Percentage
Plaintiffs with representation Defendants with representation
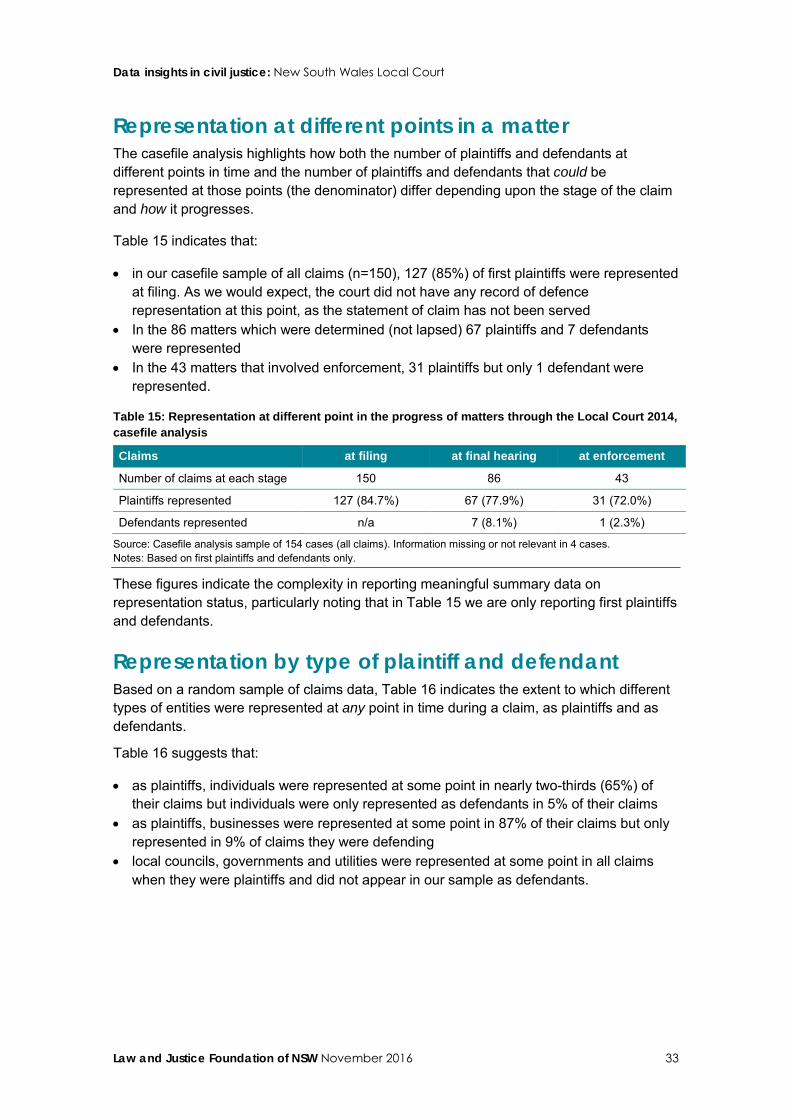
Data insights in civil justice: New South Wales Local Court
Law and Justice Foundation of NSW November 2016 33
Representation at different points in a matter The casefile analysis highlights how both the number of plaintiffs and defendants at different points in time and the number of plaintiffs and defendants that could be represented at those points (the denominator) differ depending upon the stage of the claim and how it progresses.
Table 15 indicates that:
• in our casefile sample of all claims (n=150), 127 (85%) of first plaintiffs were represented at filing. As we would expect, the court did not have any record of defence representation at this point, as the statement of claim has not been served
• In the 86 matters which were determined (not lapsed) 67 plaintiffs and 7 defendants were represented
• In the 43 matters that involved enforcement, 31 plaintiffs but only 1 defendant were represented.
Table 15: Representation at different point in the progress of matters through the Local Court 2014, casefile analysis
Claims at filing at final hearing at enforcement
Number of claims at each stage 150 86 43
Plaintiffs represented 127 (84.7%) 67 (77.9%) 31 (72.0%)
Defendants represented n/a 7 (8.1%) 1 (2.3%)
Source: Casefile analysis sample of 154 cases (all claims). Information missing or not relevant in 4 cases. Notes: Based on first plaintiffs and defendants only.
These figures indicate the complexity in reporting meaningful summary data on representation status, particularly noting that in Table 15 we are only reporting first plaintiffs and defendants.
Representation by type of plaintiff and defendant Based on a random sample of claims data, Table 16 indicates the extent to which different types of entities were represented at any point in time during a claim, as plaintiffs and as defendants.
Table 16 suggests that:
• as plaintiffs, individuals were represented at some point in nearly two-thirds (65%) of their claims but individuals were only represented as defendants in 5% of their claims
• as plaintiffs, businesses were represented at some point in 87% of their claims but only represented in 9% of claims they were defending
• local councils, governments and utilities were represented at some point in all claims when they were plaintiffs and did not appear in our sample as defendants.
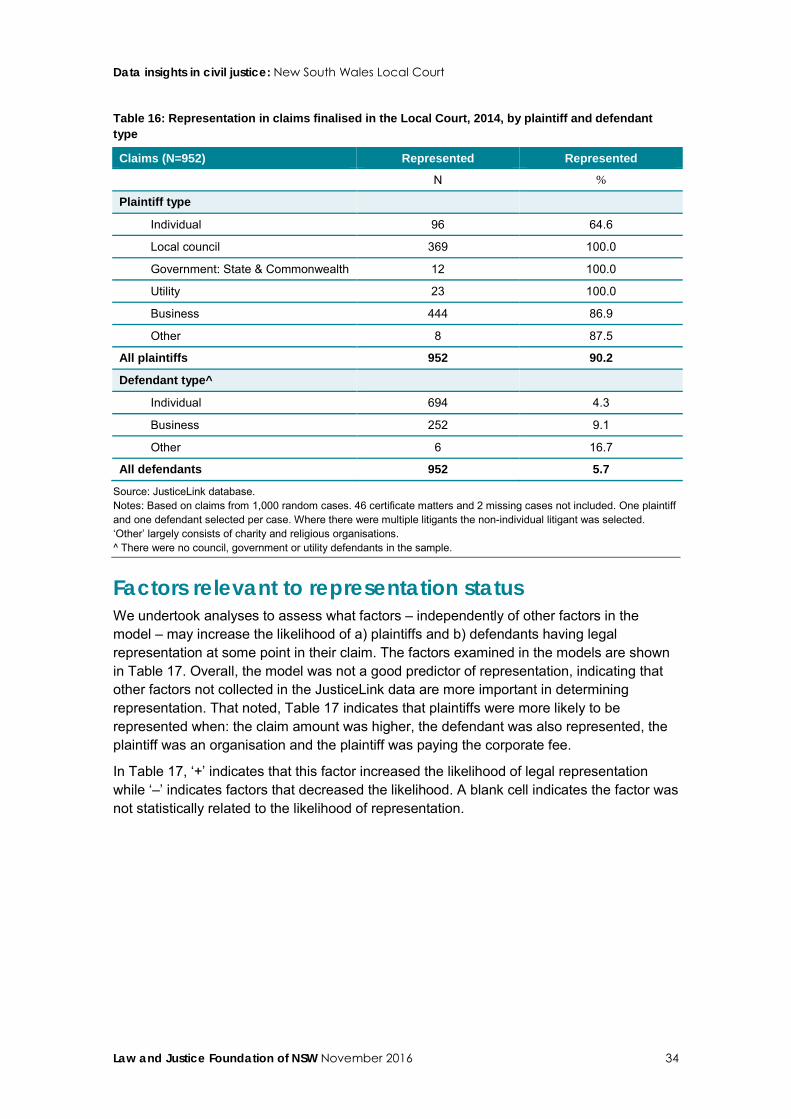
Data insights in civil justice: New South Wales Local Court
Law and Justice Foundation of NSW November 2016 34
Table 16: Representation in claims finalised in the Local Court, 2014, by plaintiff and defendant type
Claims (N=952) Represented Represented
N %
Plaintiff type
Individual 96 64.6
Local council 369 100.0
Government: State & Commonwealth 12 100.0
Utility 23 100.0
Business 444 86.9
Other 8 87.5
All plaintiffs 952 90.2
Defendant type^
Individual 694 4.3
Business 252 9.1
Other 6 16.7
All defendants 952 5.7
Source: JusticeLink database. Notes: Based on claims from 1,000 random cases. 46 certificate matters and 2 missing cases not included. One plaintiff and one defendant selected per case. Where there were multiple litigants the non-individual litigant was selected. ‘Other’ largely consists of charity and religious organisations. ^ There were no council, government or utility defendants in the sample.
Factors relevant to representation status We undertook analyses to assess what factors – independently of other factors in the model – may increase the likelihood of a) plaintiffs and b) defendants having legal representation at some point in their claim. The factors examined in the models are shown in Table 17. Overall, the model was not a good predictor of representation, indicating that other factors not collected in the JusticeLink data are more important in determining representation. That noted, Table 17 indicates that plaintiffs were more likely to be represented when: the claim amount was higher, the defendant was also represented, the plaintiff was an organisation and the plaintiff was paying the corporate fee.
In Table 17, ‘+’ indicates that this factor increased the likelihood of legal representation while ‘–’ indicates factors that decreased the likelihood. A blank cell indicates the factor was not statistically related to the likelihood of representation.
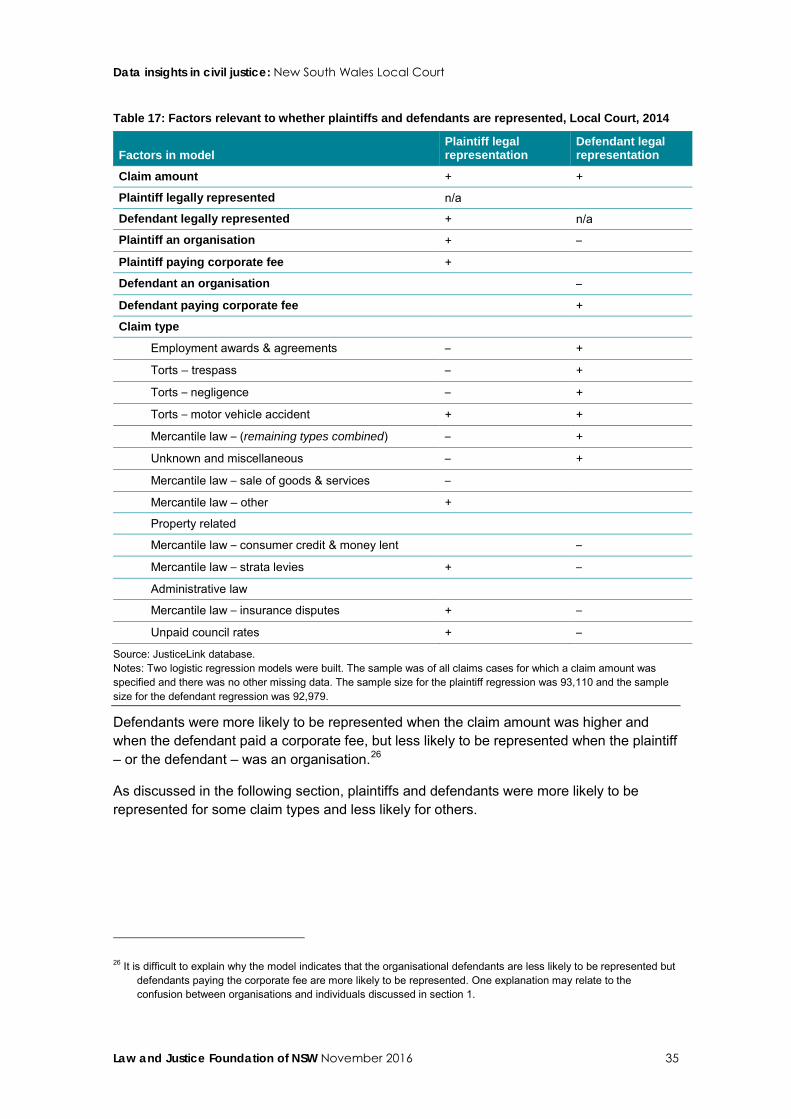
Data insights in civil justice: New South Wales Local Court
Law and Justice Foundation of NSW November 2016 35
Table 17: Factors relevant to whether plaintiffs and defendants are represented, Local Court, 2014
Factors in model Plaintiff legal representation
Defendant legal representation
Claim amount + +
Plaintiff legally represented n/a
Defendant legally represented + n/a
Plaintiff an organisation + –
Plaintiff paying corporate fee +
Defendant an organisation –
Defendant paying corporate fee +
Claim type
Employment awards & agreements – +
Torts – trespass – +
Torts – negligence – +
Torts – motor vehicle accident + +
Mercantile law – (remaining types combined) – +
Unknown and miscellaneous – +
Mercantile law – sale of goods & services –
Mercantile law – other +
Property related
Mercantile law – consumer credit & money lent –
Mercantile law – strata levies + –
Administrative law
Mercantile law – insurance disputes + –
Unpaid council rates + –
Source: JusticeLink database. Notes: Two logistic regression models were built. The sample was of all claims cases for which a claim amount was specified and there was no other missing data. The sample size for the plaintiff regression was 93,110 and the sample size for the defendant regression was 92,979.
Defendants were more likely to be represented when the claim amount was higher and when the defendant paid a corporate fee, but less likely to be represented when the plaintiff – or the defendant – was an organisation.26
As discussed in the following section, plaintiffs and defendants were more likely to be represented for some claim types and less likely for others.
26 It is difficult to explain why the model indicates that the organisational defendants are less likely to be represented but defendants paying the corporate fee are more likely to be represented. One explanation may relate to the confusion between organisations and individuals discussed in section 1.
Data insights in civil justice: New South Wales Local Court
Law and Justice Foundation of NSW November 2016 36
Representation by claim type Table 17 indicates that the likelihood of representation varies by claim type, but that claim type generally affects the representation status of plaintiffs and defendants differently. For instance, when other claim-related factors are controlled:
• plaintiffs are more likely and defendants less likely to be represented for claims related to strata levies, insurance disputes and unpaid council rates
• defendants are more likely and plaintiffs less likely to be represented for Employment, Torts – trespass and Torts – negligence claims
• both plaintiffs and defendants are more likely to be represented for motor vehicle accident-related claims.
Representation and outcome A separate analysis indicates that matters were more likely to settle than reach judgment following trial in cases where the plaintiff or both parties were represented, compared to when neither party was represented, irrespective of claim type. Defendant representation was not a significant factor.27
27 A logistic regression model, controlled for claim type, was built to assess the impact of plaintiff and defendant representation on whether a case settled or resulted in judgment following trial. No other factors were included. The sample for the analysis was 1,368 claims.
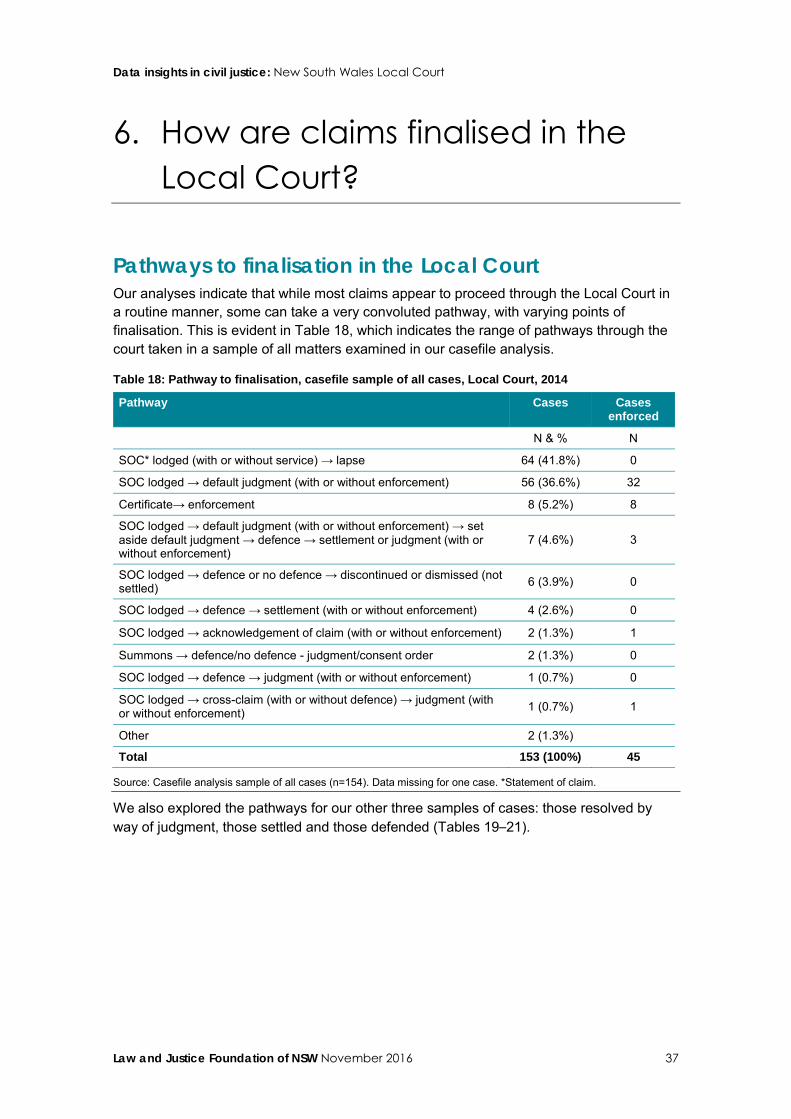
Data insights in civil justice: New South Wales Local Court
Law and Justice Foundation of NSW November 2016 37
6. How are claims finalised in the Local Court?
Pathways to finalisation in the Local Court Our analyses indicate that while most claims appear to proceed through the Local Court in a routine manner, some can take a very convoluted pathway, with varying points of finalisation. This is evident in Table 18, which indicates the range of pathways through the court taken in a sample of all matters examined in our casefile analysis.
Table 18: Pathway to finalisation, casefile sample of all cases, Local Court, 2014
Pathway Cases Cases enforced
N & % N
SOC* lodged (with or without service) → lapse 64 (41.8%) 0
SOC lodged → default judgment (with or without enforcement) 56 (36.6%) 32
Certificate→ enforcement 8 (5.2%) 8
SOC lodged → default judgment (with or without enforcement) → set aside default judgment → defence → settlement or judgment (with or without enforcement)
7 (4.6%) 3
SOC lodged → defence or no defence → discontinued or dismissed (not settled) 6 (3.9%) 0
SOC lodged → defence → settlement (with or without enforcement) 4 (2.6%) 0
SOC lodged → acknowledgement of claim (with or without enforcement) 2 (1.3%) 1
Summons → defence/no defence - judgment/consent order 2 (1.3%) 0
SOC lodged → defence → judgment (with or without enforcement) 1 (0.7%) 0
SOC lodged → cross-claim (with or without defence) → judgment (with or without enforcement) 1 (0.7%) 1
Other 2 (1.3%)
Total 153 (100%) 45
Source: Casefile analysis sample of all cases (n=154). Data missing for one case. *Statement of claim.
We also explored the pathways for our other three samples of cases: those resolved by way of judgment, those settled and those defended (Tables 19–21).
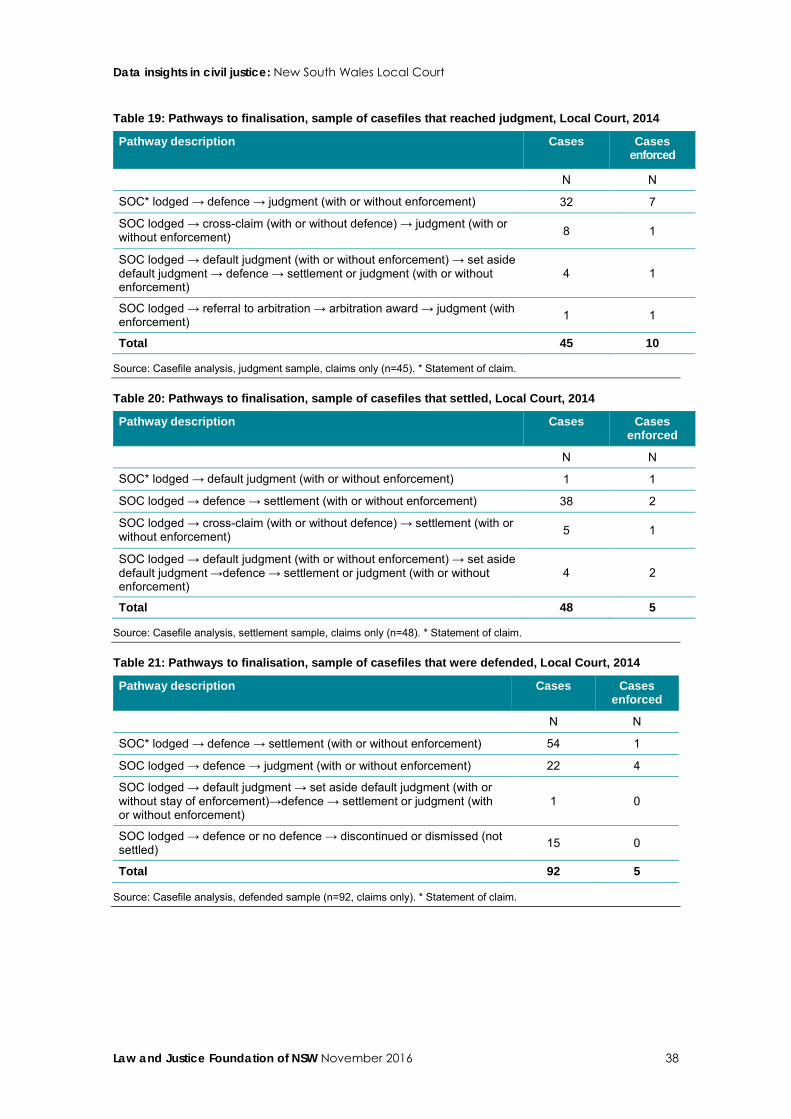
Data insights in civil justice: New South Wales Local Court
Law and Justice Foundation of NSW November 2016 38
Table 19: Pathways to finalisation, sample of casefiles that reached judgment, Local Court, 2014
Pathway description Cases Cases enforced
N N
SOC* lodged → defence → judgment (with or without enforcement) 32 7
SOC lodged → cross-claim (with or without defence) → judgment (with or without enforcement) 8 1
SOC lodged → default judgment (with or without enforcement) → set aside default judgment → defence → settlement or judgment (with or without enforcement)
4 1
SOC lodged → referral to arbitration → arbitration award → judgment (with enforcement) 1 1
Total 45 10
Source: Casefile analysis, judgment sample, claims only (n=45). * Statement of claim.
Table 20: Pathways to finalisation, sample of casefiles that settled, Local Court, 2014
Pathway description Cases Cases enforced
N N
SOC* lodged → default judgment (with or without enforcement) 1 1
SOC lodged → defence → settlement (with or without enforcement) 38 2
SOC lodged → cross-claim (with or without defence) → settlement (with or without enforcement) 5 1
SOC lodged → default judgment (with or without enforcement) → set aside default judgment →defence → settlement or judgment (with or without enforcement)
4 2
Total 48 5
Source: Casefile analysis, settlement sample, claims only (n=48). * Statement of claim.
Table 21: Pathways to finalisation, sample of casefiles that were defended, Local Court, 2014
Pathway description Cases Cases enforced
N N
SOC* lodged → defence → settlement (with or without enforcement) 54 1
SOC lodged → defence → judgment (with or without enforcement) 22 4
SOC lodged → default judgment → set aside default judgment (with or without stay of enforcement)→defence → settlement or judgment (with or without enforcement)
1 0
SOC lodged → defence or no defence → discontinued or dismissed (not settled) 15 0
Total 92 5
Source: Casefile analysis, defended sample (n=92, claims only). * Statement of claim.
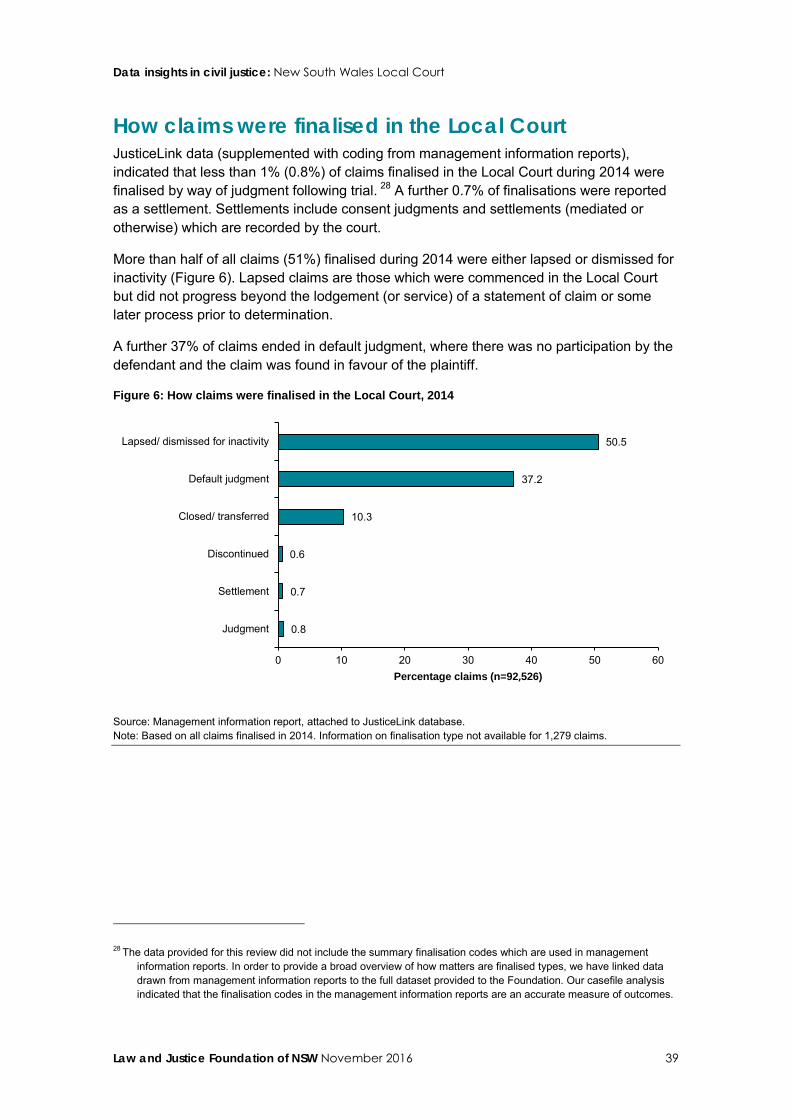
Data insights in civil justice: New South Wales Local Court
Law and Justice Foundation of NSW November 2016 39
How claims were finalised in the Local Court JusticeLink data (supplemented with coding from management information reports), indicated that less than 1% (0.8%) of claims finalised in the Local Court during 2014 were finalised by way of judgment following trial. 28 A further 0.7% of finalisations were reported as a settlement. Settlements include consent judgments and settlements (mediated or otherwise) which are recorded by the court.
More than half of all claims (51%) finalised during 2014 were either lapsed or dismissed for inactivity (Figure 6). Lapsed claims are those which were commenced in the Local Court but did not progress beyond the lodgement (or service) of a statement of claim or some later process prior to determination.
A further 37% of claims ended in default judgment, where there was no participation by the defendant and the claim was found in favour of the plaintiff.
Figure 6: How claims were finalised in the Local Court, 2014
Source: Management information report, attached to JusticeLink database. Note: Based on all claims finalised in 2014. Information on finalisation type not available for 1,279 claims.
28 The data provided for this review did not include the summary finalisation codes which are used in management information reports. In order to provide a broad overview of how matters are finalised types, we have linked data drawn from management information reports to the full dataset provided to the Foundation. Our casefile analysis indicated that the finalisation codes in the management information reports are an accurate measure of outcomes.
0.8
0.7
0.6
10.3
37.2
50.5
0 10 20 30 40 50 60
Judgment
Settlement
Discontinued
Closed/ transferred
Default judgment
Lapsed/ dismissed for inactivity
Percentage claims (n=92,526)
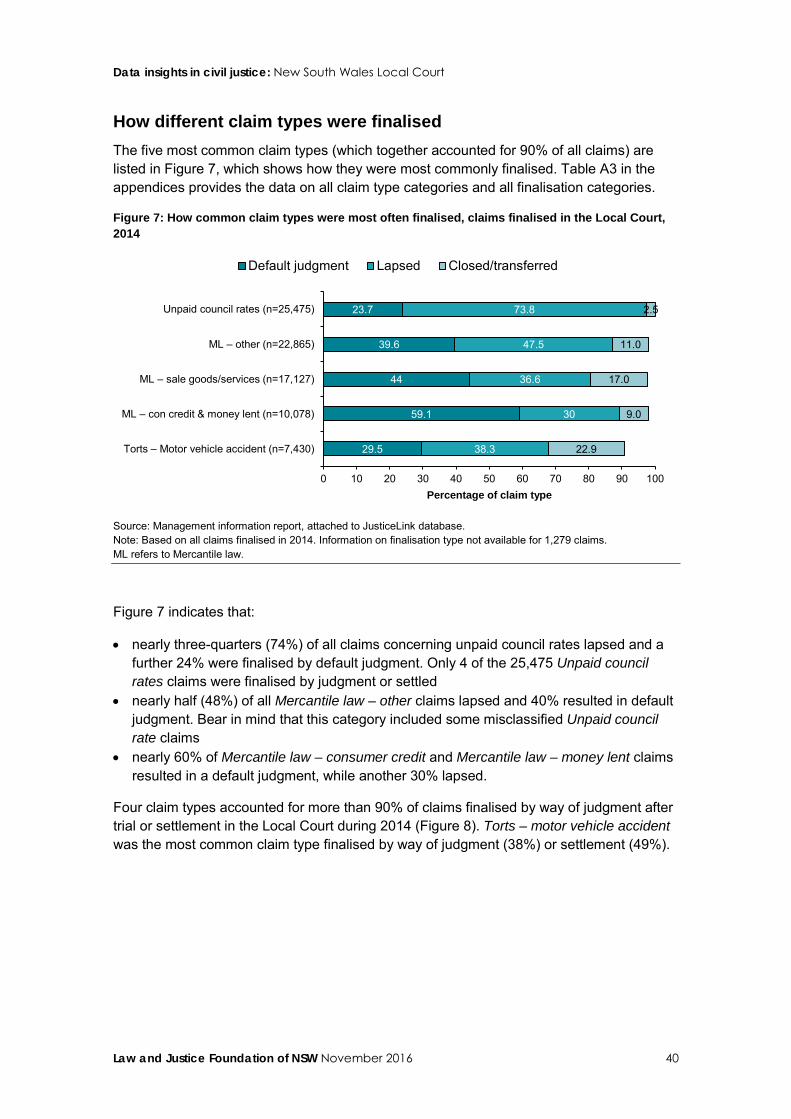
Data insights in civil justice: New South Wales Local Court
Law and Justice Foundation of NSW November 2016 40
How different claim types were finalised The five most common claim types (which together accounted for 90% of all claims) are listed in Figure 7, which shows how they were most commonly finalised. Table A3 in the appendices provides the data on all claim type categories and all finalisation categories.
Figure 7: How common claim types were most often finalised, claims finalised in the Local Court, 2014
Source: Management information report, attached to JusticeLink database. Note: Based on all claims finalised in 2014. Information on finalisation type not available for 1,279 claims. ML refers to Mercantile law.
Figure 7 indicates that:
• nearly three-quarters (74%) of all claims concerning unpaid council rates lapsed and a further 24% were finalised by default judgment. Only 4 of the 25,475 Unpaid council rates claims were finalised by judgment or settled
• nearly half (48%) of all Mercantile law – other claims lapsed and 40% resulted in default judgment. Bear in mind that this category included some misclassified Unpaid council rate claims
• nearly 60% of Mercantile law – consumer credit and Mercantile law – money lent claims resulted in a default judgment, while another 30% lapsed.
Four claim types accounted for more than 90% of claims finalised by way of judgment after trial or settlement in the Local Court during 2014 (Figure 8). Torts – motor vehicle accident was the most common claim type finalised by way of judgment (38%) or settlement (49%).
29.5
59.1
44
39.6
23.7
38.3
30
36.6
47.5
73.8
22.9
9.0
17.0
11.0
2.5
0 10 20 30 40 50 60 70 80 90 100
Torts – Motor vehicle accident (n=7,430)
ML – con credit & money lent (n=10,078)
ML – sale goods/services (n=17,127)
ML – other (n=22,865)
Unpaid council rates (n=25,475)
Percentage of claim type
Default judgment Lapsed Closed/transferred
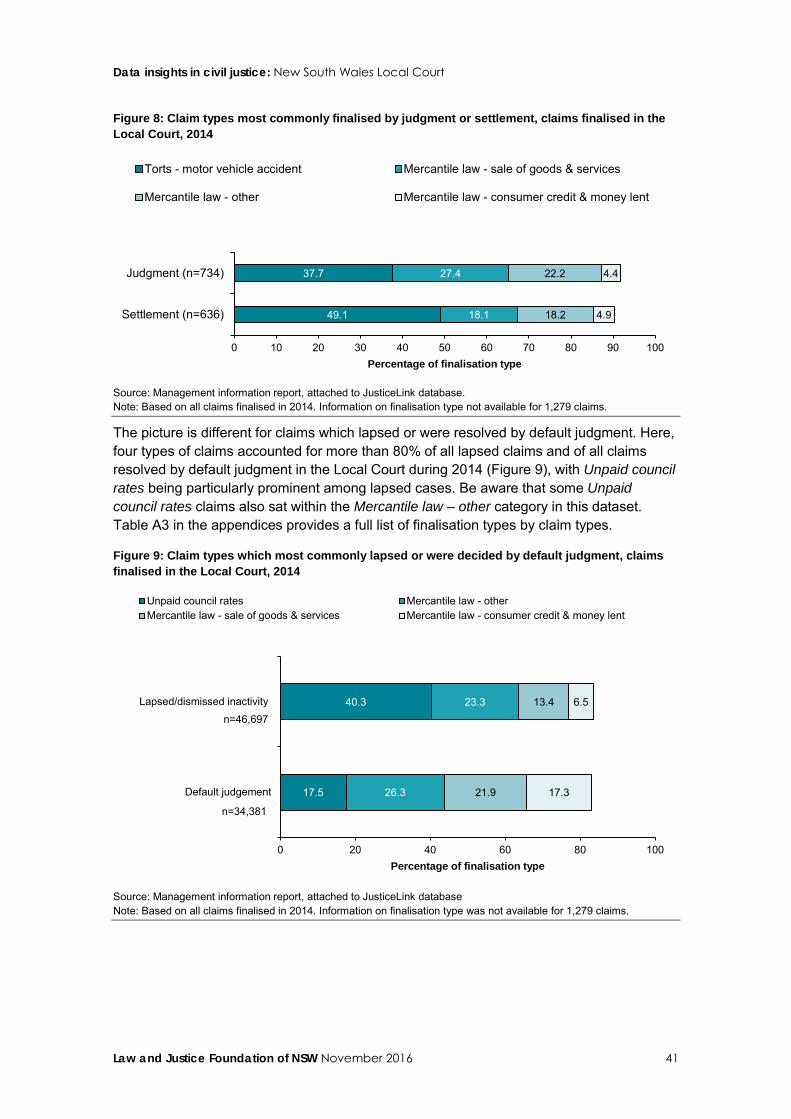
Data insights in civil justice: New South Wales Local Court
Law and Justice Foundation of NSW November 2016 41
Figure 8: Claim types most commonly finalised by judgment or settlement, claims finalised in the Local Court, 2014
Source: Management information report, attached to JusticeLink database. Note: Based on all claims finalised in 2014. Information on finalisation type not available for 1,279 claims.
The picture is different for claims which lapsed or were resolved by default judgment. Here, four types of claims accounted for more than 80% of all lapsed claims and of all claims resolved by default judgment in the Local Court during 2014 (Figure 9), with Unpaid council rates being particularly prominent among lapsed cases. Be aware that some Unpaid council rates claims also sat within the Mercantile law – other category in this dataset. Table A3 in the appendices provides a full list of finalisation types by claim types.
Figure 9: Claim types which most commonly lapsed or were decided by default judgment, claims finalised in the Local Court, 2014
Source: Management information report, attached to JusticeLink database Note: Based on all claims finalised in 2014. Information on finalisation type was not available for 1,279 claims.
49.1
37.7
18.1
27.4
18.2
22.2
4.9
4.4
0 10 20 30 40 50 60 70 80 90 100
Settlement (n=636)
Judgment (n=734)
Percentage of finalisation type
Torts - motor vehicle accident Mercantile law - sale of goods & services
Mercantile law - other Mercantile law - consumer credit & money lent
17.5
40.3
26.3
23.3
21.9
13.4
17.3
6.5
0 20 40 60 80 100
Default judgement
Lapsed/dismissed inactivity
Percentage of finalisation type
Unpaid council rates Mercantile law - otherMercantile law - sale of goods & services Mercantile law - consumer credit & money lent
n=46,697
n=34,381
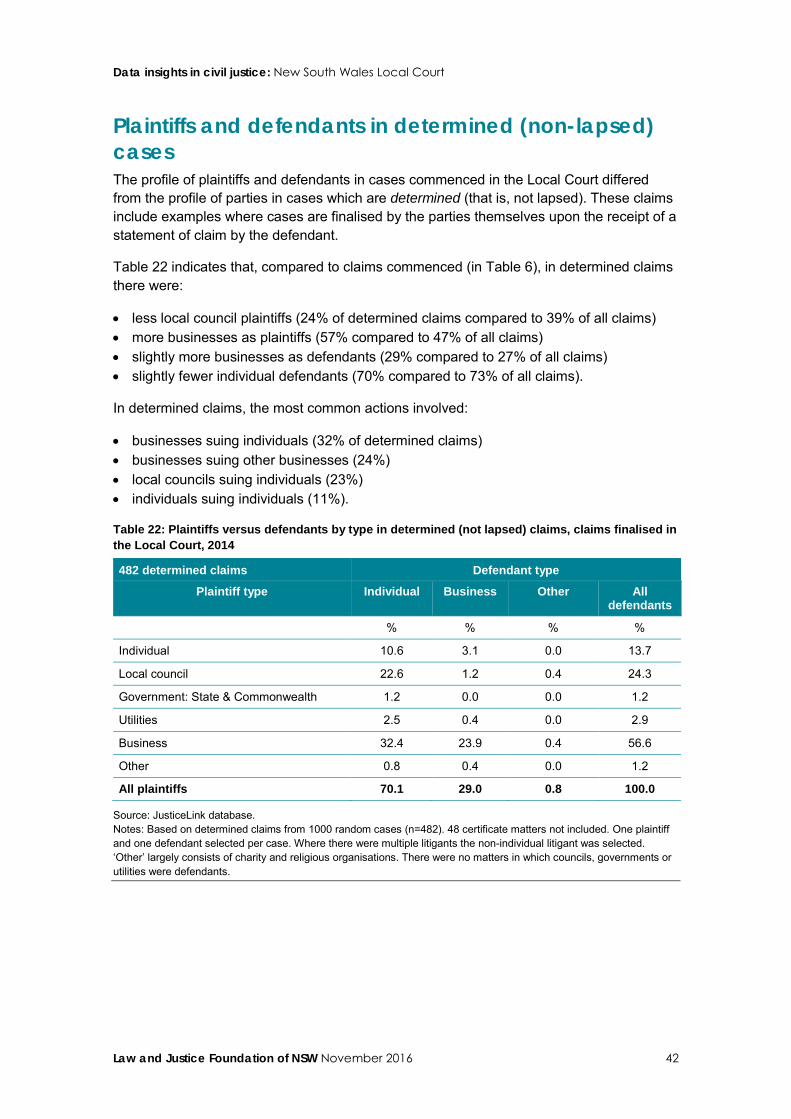
Data insights in civil justice: New South Wales Local Court
Law and Justice Foundation of NSW November 2016 42
Plaintiffs and defendants in determined (non-lapsed) cases The profile of plaintiffs and defendants in cases commenced in the Local Court differed from the profile of parties in cases which are determined (that is, not lapsed). These claims include examples where cases are finalised by the parties themselves upon the receipt of a statement of claim by the defendant.
Table 22 indicates that, compared to claims commenced (in Table 6), in determined claims there were:
• less local council plaintiffs (24% of determined claims compared to 39% of all claims) • more businesses as plaintiffs (57% compared to 47% of all claims) • slightly more businesses as defendants (29% compared to 27% of all claims) • slightly fewer individual defendants (70% compared to 73% of all claims).
In determined claims, the most common actions involved:
• businesses suing individuals (32% of determined claims) • businesses suing other businesses (24%) • local councils suing individuals (23%) • individuals suing individuals (11%).
Table 22: Plaintiffs versus defendants by type in determined (not lapsed) claims, claims finalised in the Local Court, 2014
482 determined claims Defendant type
Plaintiff type Individual Business Other All defendants
% % % %
Individual 10.6 3.1 0.0 13.7
Local council 22.6 1.2 0.4 24.3
Government: State & Commonwealth 1.2 0.0 0.0 1.2
Utilities 2.5 0.4 0.0 2.9
Business 32.4 23.9 0.4 56.6
Other 0.8 0.4 0.0 1.2
All plaintiffs 70.1 29.0 0.8 100.0
Source: JusticeLink database. Notes: Based on determined claims from 1000 random cases (n=482). 48 certificate matters not included. One plaintiff and one defendant selected per case. Where there were multiple litigants the non-individual litigant was selected. ‘Other’ largely consists of charity and religious organisations. There were no matters in which councils, governments or utilities were defendants.
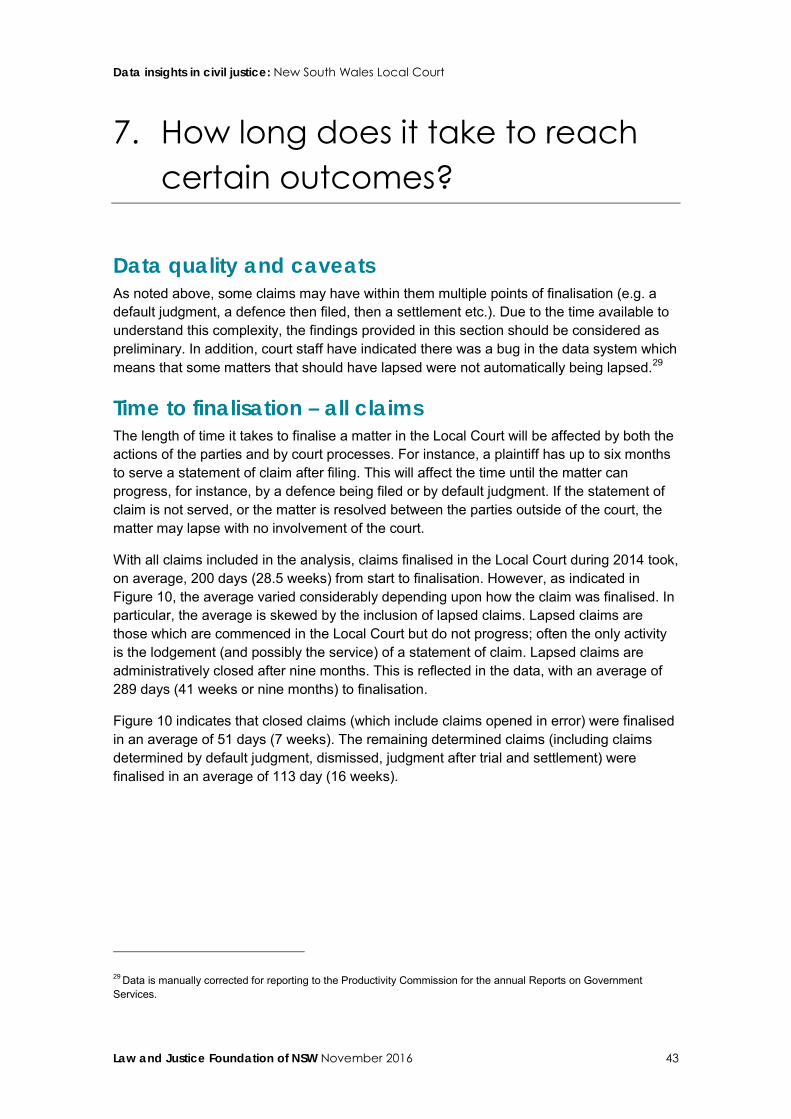
Data insights in civil justice: New South Wales Local Court
Law and Justice Foundation of NSW November 2016 43
7. How long does it take to reach certain outcomes?
Data quality and caveats As noted above, some claims may have within them multiple points of finalisation (e.g. a default judgment, a defence then filed, then a settlement etc.). Due to the time available to understand this complexity, the findings provided in this section should be considered as preliminary. In addition, court staff have indicated there was a bug in the data system which means that some matters that should have lapsed were not automatically being lapsed.29
Time to finalisation – all claims The length of time it takes to finalise a matter in the Local Court will be affected by both the actions of the parties and by court processes. For instance, a plaintiff has up to six months to serve a statement of claim after filing. This will affect the time until the matter can progress, for instance, by a defence being filed or by default judgment. If the statement of claim is not served, or the matter is resolved between the parties outside of the court, the matter may lapse with no involvement of the court.
With all claims included in the analysis, claims finalised in the Local Court during 2014 took, on average, 200 days (28.5 weeks) from start to finalisation. However, as indicated in Figure 10, the average varied considerably depending upon how the claim was finalised. In particular, the average is skewed by the inclusion of lapsed claims. Lapsed claims are those which are commenced in the Local Court but do not progress; often the only activity is the lodgement (and possibly the service) of a statement of claim. Lapsed claims are administratively closed after nine months. This is reflected in the data, with an average of 289 days (41 weeks or nine months) to finalisation.
Figure 10 indicates that closed claims (which include claims opened in error) were finalised in an average of 51 days (7 weeks). The remaining determined claims (including claims determined by default judgment, dismissed, judgment after trial and settlement) were finalised in an average of 113 day (16 weeks).
29 Data is manually corrected for reporting to the Productivity Commission for the annual Reports on Government Services.
Data insights in civil justice: New South Wales Local Court
Law and Justice Foundation of NSW November 2016 44
Figure 10: Average number of days to first determination, lapse or closure, claims finalised in the Local Court, 2014
Source: JusticeLink database, claims only. Note: Based on all claims (1 missing value). Average reported is the mean.
Factors related to length of time to finalise claims Table 23 shows the factors that, independently of the other factors included in the model, increased or decreased the length of time that all cases took to reach their first determined date (or to lapse).30 As indicated earlier, determined claims were significantly shorter than lapsed claims (which make up most of the claims that are not determined). The analysis indicates that the claim amount, a defence being filed, the defendant being represented and, to a lesser extent, the plaintiff being represented were all independently related to claims taking longer to reach an outcome.
Length of time by claim type Table 23 suggests that, when other factors were controlled for in the analysis, employment and administrative law matters tended to be longer, while motor vehicle accident, property, insurance disputes, consumer credit and money lent, and mercantile other matters tended to take shorter lengths of time.
30 This analysis used multiple regression techniques and explained 45% of the variance in the data. This suggests the model has reasonable predictive power.
289
113
51
0 50 100 150 200 250 300
Lapsed (n=46,715)
Determined (n= 46,739)
Closed (n=350)
number of days to finalisation
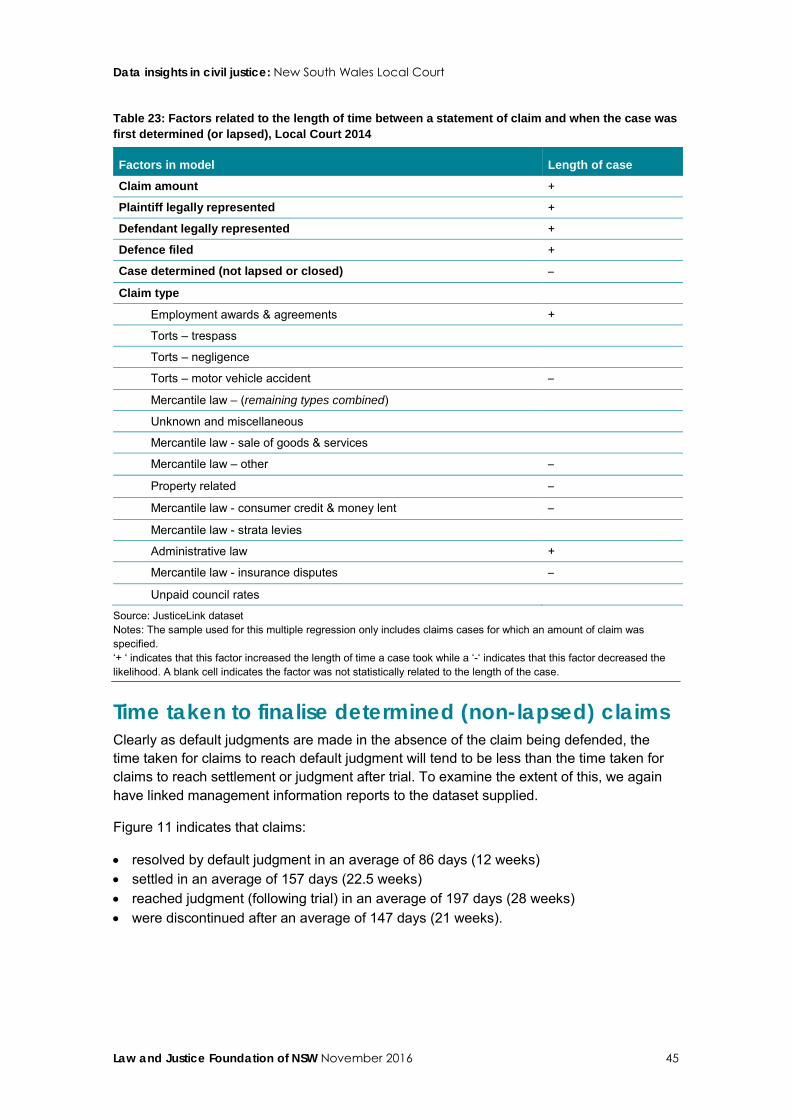
Data insights in civil justice: New South Wales Local Court
Law and Justice Foundation of NSW November 2016 45
Table 23: Factors related to the length of time between a statement of claim and when the case was first determined (or lapsed), Local Court 2014
Factors in model Length of case
Claim amount +
Plaintiff legally represented +
Defendant legally represented +
Defence filed +
Case determined (not lapsed or closed) –
Claim type
Employment awards & agreements +
Torts – trespass
Torts – negligence
Torts – motor vehicle accident –
Mercantile law – (remaining types combined)
Unknown and miscellaneous
Mercantile law - sale of goods & services
Mercantile law – other –
Property related –
Mercantile law - consumer credit & money lent –
Mercantile law - strata levies
Administrative law +
Mercantile law - insurance disputes –
Unpaid council rates
Source: JusticeLink dataset Notes: The sample used for this multiple regression only includes claims cases for which an amount of claim was specified. ‘+ ‘ indicates that this factor increased the length of time a case took while a ‘-‘ indicates that this factor decreased the likelihood. A blank cell indicates the factor was not statistically related to the length of the case.
Time taken to finalise determined (non-lapsed) claims Clearly as default judgments are made in the absence of the claim being defended, the time taken for claims to reach default judgment will tend to be less than the time taken for claims to reach settlement or judgment after trial. To examine the extent of this, we again have linked management information reports to the dataset supplied.
Figure 11 indicates that claims:
• resolved by default judgment in an average of 86 days (12 weeks) • settled in an average of 157 days (22.5 weeks) • reached judgment (following trial) in an average of 197 days (28 weeks) • were discontinued after an average of 147 days (21 weeks).
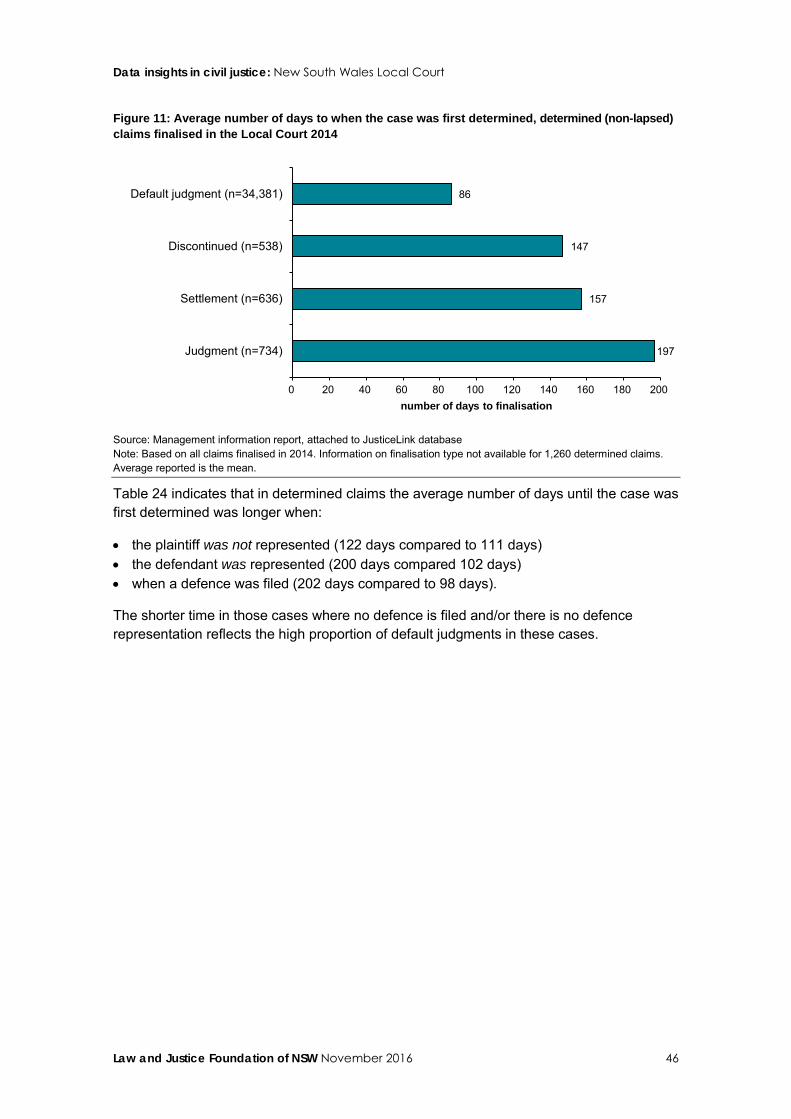
Data insights in civil justice: New South Wales Local Court
Law and Justice Foundation of NSW November 2016 46
Figure 11: Average number of days to when the case was first determined, determined (non-lapsed) claims finalised in the Local Court 2014
Source: Management information report, attached to JusticeLink database Note: Based on all claims finalised in 2014. Information on finalisation type not available for 1,260 determined claims. Average reported is the mean.
Table 24 indicates that in determined claims the average number of days until the case was first determined was longer when:
• the plaintiff was not represented (122 days compared to 111 days) • the defendant was represented (200 days compared 102 days) • when a defence was filed (202 days compared to 98 days).
The shorter time in those cases where no defence is filed and/or there is no defence representation reflects the high proportion of default judgments in these cases.
197
157
147
86
0 20 40 60 80 100 120 140 160 180 200
Judgment (n=734)
Settlement (n=636)
Discontinued (n=538)
Default judgment (n=34,381)
number of days to finalisation
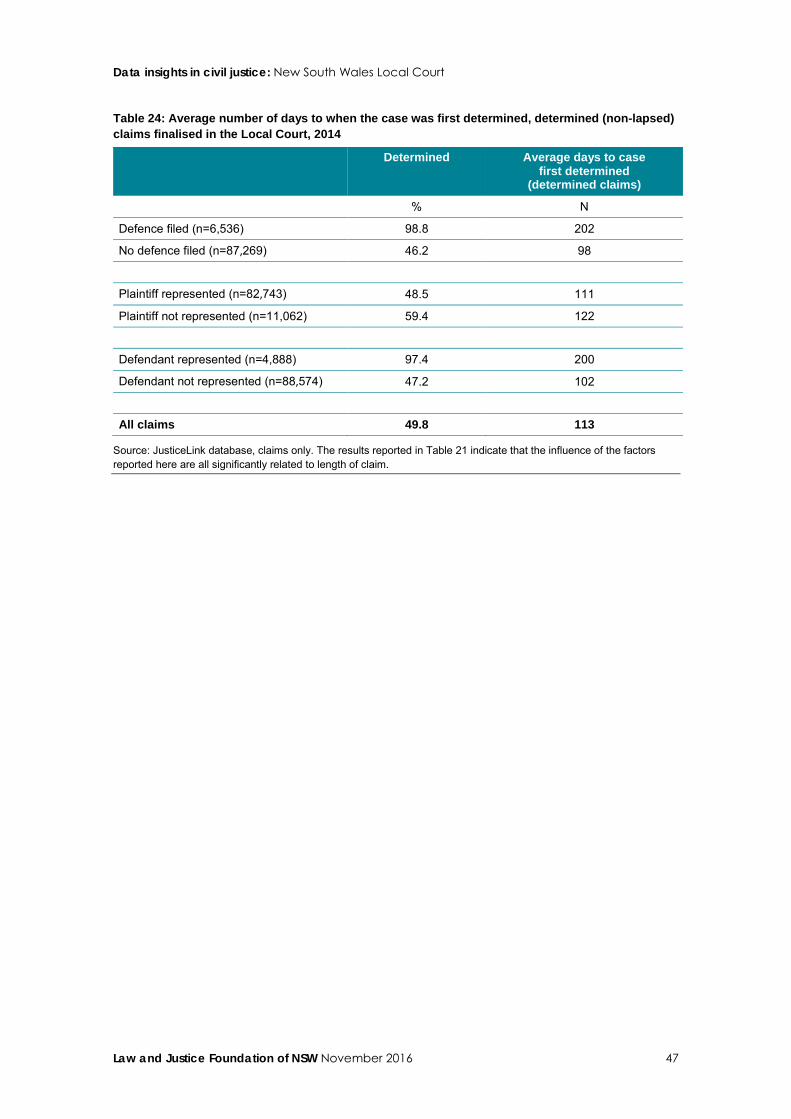
Data insights in civil justice: New South Wales Local Court
Law and Justice Foundation of NSW November 2016 47
Table 24: Average number of days to when the case was first determined, determined (non-lapsed) claims finalised in the Local Court, 2014
Determined Average days to case first determined
(determined claims)
% N
Defence filed (n=6,536) 98.8 202
No defence filed (n=87,269) 46.2 98
Plaintiff represented (n=82,743) 48.5 111
Plaintiff not represented (n=11,062) 59.4 122
Defendant represented (n=4,888) 97.4 200
Defendant not represented (n=88,574) 47.2 102
All claims 49.8 113
Source: JusticeLink database, claims only. The results reported in Table 21 indicate that the influence of the factors reported here are all significantly related to length of claim.
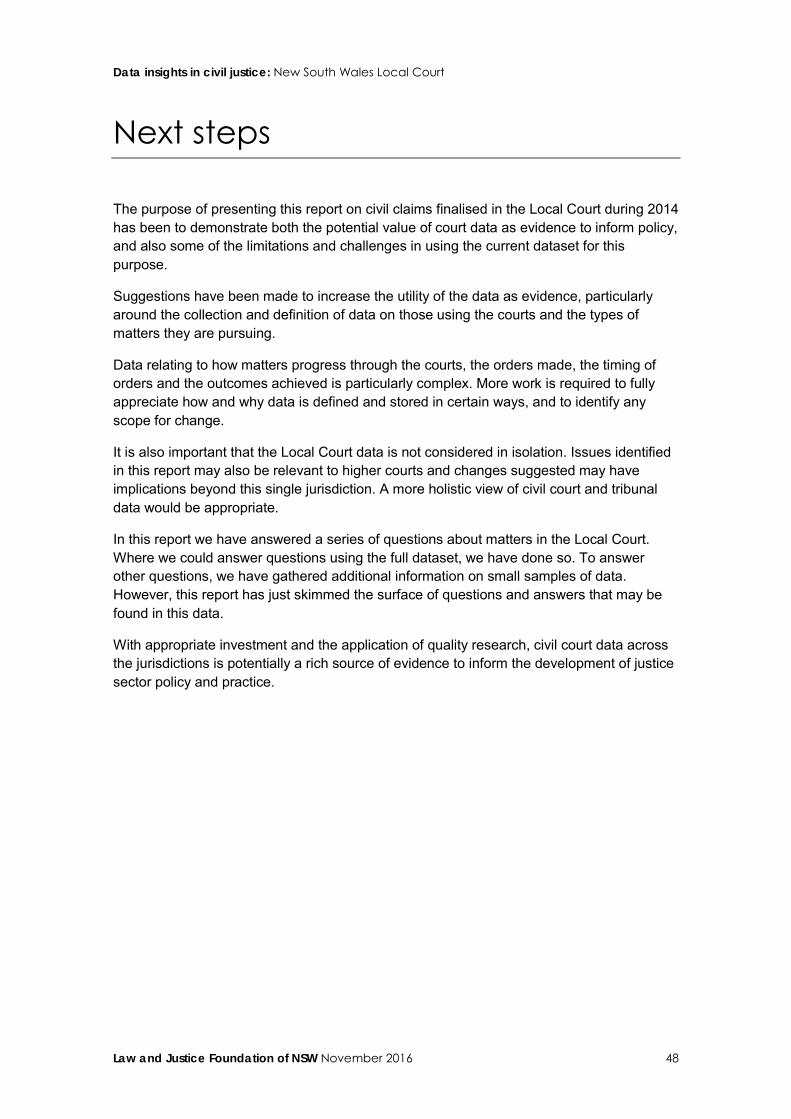
Data insights in civil justice: New South Wales Local Court
Law and Justice Foundation of NSW November 2016 48
Next steps
The purpose of presenting this report on civil claims finalised in the Local Court during 2014 has been to demonstrate both the potential value of court data as evidence to inform policy, and also some of the limitations and challenges in using the current dataset for this purpose.
Suggestions have been made to increase the utility of the data as evidence, particularly around the collection and definition of data on those using the courts and the types of matters they are pursuing.
Data relating to how matters progress through the courts, the orders made, the timing of orders and the outcomes achieved is particularly complex. More work is required to fully appreciate how and why data is defined and stored in certain ways, and to identify any scope for change.
It is also important that the Local Court data is not considered in isolation. Issues identified in this report may also be relevant to higher courts and changes suggested may have implications beyond this single jurisdiction. A more holistic view of civil court and tribunal data would be appropriate.
In this report we have answered a series of questions about matters in the Local Court. Where we could answer questions using the full dataset, we have done so. To answer other questions, we have gathered additional information on small samples of data. However, this report has just skimmed the surface of questions and answers that may be found in this data.
With appropriate investment and the application of quality research, civil court data across the jurisdictions is potentially a rich source of evidence to inform the development of justice sector policy and practice.
Data insights in civil justice: New South Wales Local Court
Law and Justice Foundation of NSW November 2016 49
Appendices
Appendix 1: Methodology A number of different sources of data were used in the analysis for this report. There were:
1. Data on all civil cases finalised for the first time during 2014. This was provided by NSW Court Services from data tables they extract from JusticeLink, the Court Services management information system.
2. A sample of 1,000 cases randomly selected from 1 above. This was to provide a sample of cases to code entity types.
3. Summary information held in a regular management information report for all cases finalised on a monthly basis during 2014 (for the first time or not). Cases from this data that matched these cases from 1 above provided information on how cases were finalised.
4. A sample of cases for five separate samples drawn from 3 above. These samples provided the basis for the file analysis described below.
Each is described in more detail below.
JusticeLink data tables Court Services NSW provided data to the Foundation in a set of Excel spreadsheets, each covering different aspects of the data held in JusticeLink. These datasets could be linked via common keys, in particular proceeding_number, entity_id and order_id. The Foundation imported these datasets into SPSS, a proprietary statistical software package. For claims-based analysis only claim-related proceedings were retained. In the small number of cases where there was more than one claim-related proceeding within a case, the first proceeding was retained. Variables or fields from other datasets were attached to the claims data, including information about the first plaintiff and the first defendant.
A separate dataset including all plaintiffs and defendants was constructed for entity-based analysis. This deleted duplicate records for entities where these related to an additional legal representative being associated with the entity. Whether or not an entity had legal representation was assumed if there were any details entered for a legal representative for that entity (whenever this had occurred). A number of new variables were constructed for the purpose of analysis and reporting from the existing fields, e.g., law types were grouped, reducing the full list provided from 52 to 14.
A full technical report is available on request from the Foundation.
Sample of 1,000 cases For the purpose of coding entities into their types a random sample of 1,000 cases was drawn from the JusticeLink data. Coding was undertaken separately on plaintiffs and defendants. An initial set of 34 codes was collapsed into summarised lists of 23 categories and six categories for reporting purposes.
Data insights in civil justice: New South Wales Local Court
Law and Justice Foundation of NSW November 2016 50
NSW Court Services management information (MI) report NSW Court Services senior staff are provided with regular (monthly) reports on the business of the court for monitoring purposes. These relate to cases commenced and finalised during the relevant month. A copy of the latter report for the full 2014 period was provided to the Foundation. The report contains summary information relating to cases, including a final outcome type. As it wasn’t feasible in the time available to reconstruct this final outcome type from the information provided for the JusticeLink dataset, the final outcome type in the MI reports was attached to the JusticeLink dataset for the purpose of identifying how cases were finalised.
Casefile samples A casefile analysis (paper and e-file attachments as required) was undertaken to investigate any systematic limitations in the data recorded on JusticeLink, relevant to the key questions addressed. Key data points examined and recorded on an Access database were:
• the status of the plaintiff(s) and defendant(s) as organisations or individuals • the representation status of the parties at different points in the process • the nature of the claim, and the types of matters included within the Mercantile – other
category • information on claims and outcomes, including claim amounts, interest, solicitor fees and
court costs • notes of further actions following judgment/after case closure.
Focusing on these variables, we audited the reliability of information recorded on JusticeLink and gathered information that was missing or not appropriately detailed in JusticeLink (e.g. subcategories of claim types under Mercantile – other).
The NSW Court Services management information (MI) report was used as the source of the casefile samples, as this was made available to the Foundation prior to the JusticeLink data. In addition to a random sample of 154 cases from the MI dataset, four further samples were randomly selected: of cases ending in judgment (50); settled cases (50); defended cases (100); and cases concerning Mercantile - other matters (200). The additional four samples were gathered to ensure enough cases could be reviewed to address the issues listed above, noting the very small number of cases likely to be included in a random sample taken only from the full dataset. The research team were provided access to a JusticeLink terminal at the court complex. Where necessary, documents (e.g. statements of claim, including pleadings and particulars, and defence documents) not accessible on JusticeLink were requested and reviewed in hardcopy.
To assess the accuracy of matter type descriptions we compared the pleadings and particulars to the stated ‘type of claim’ category. Because these particulars are often provided in a separate PDF, even when e-filed, these were not necessarily available on JusticeLink – even if the statement of claim could be viewed. This required us to request the paper files for review. The paper file was requested for one-third of files reviewed, however not all of these files were available in the timeframe.
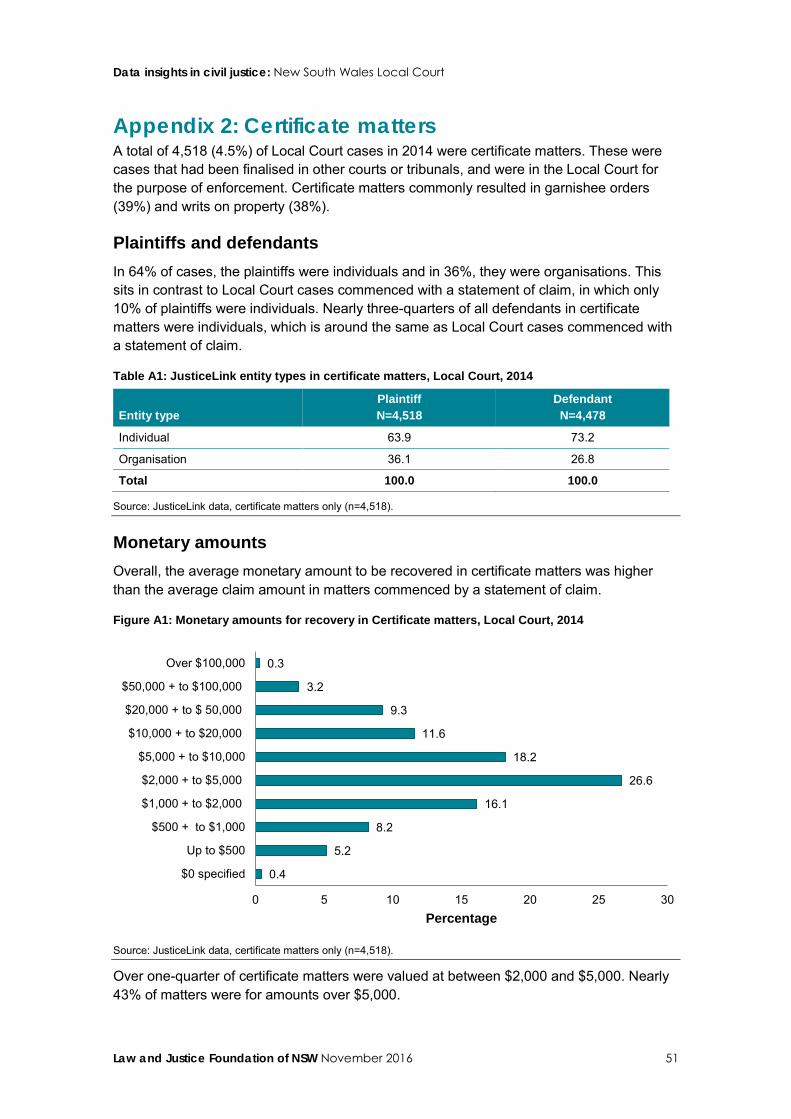
Data insights in civil justice: New South Wales Local Court
Law and Justice Foundation of NSW November 2016 51
Appendix 2: Certificate matters A total of 4,518 (4.5%) of Local Court cases in 2014 were certificate matters. These were cases that had been finalised in other courts or tribunals, and were in the Local Court for the purpose of enforcement. Certificate matters commonly resulted in garnishee orders (39%) and writs on property (38%).
Plaintiffs and defendants In 64% of cases, the plaintiffs were individuals and in 36%, they were organisations. This sits in contrast to Local Court cases commenced with a statement of claim, in which only 10% of plaintiffs were individuals. Nearly three-quarters of all defendants in certificate matters were individuals, which is around the same as Local Court cases commenced with a statement of claim.
Table A1: JusticeLink entity types in certificate matters, Local Court, 2014
Entity type Plaintiff N=4,518
Defendant N=4,478
Individual 63.9 73.2
Organisation 36.1 26.8
Total 100.0 100.0
Source: JusticeLink data, certificate matters only (n=4,518).
Monetary amounts Overall, the average monetary amount to be recovered in certificate matters was higher than the average claim amount in matters commenced by a statement of claim.
Figure A1: Monetary amounts for recovery in Certificate matters, Local Court, 2014
Source: JusticeLink data, certificate matters only (n=4,518).
Over one-quarter of certificate matters were valued at between $2,000 and $5,000. Nearly 43% of matters were for amounts over $5,000.
0.4
5.2
8.2
16.1
26.6
18.2
11.6
9.3
3.2
0.3
0 5 10 15 20 25 30
$0 specified
Up to $500
$500 + to $1,000
$1,000 + to $2,000
$2,000 + to $5,000
$5,000 + to $10,000
$10,000 + to $20,000
$20,000 + to $ 50,000
$50,000 + to $100,000
Over $100,000
Percentage
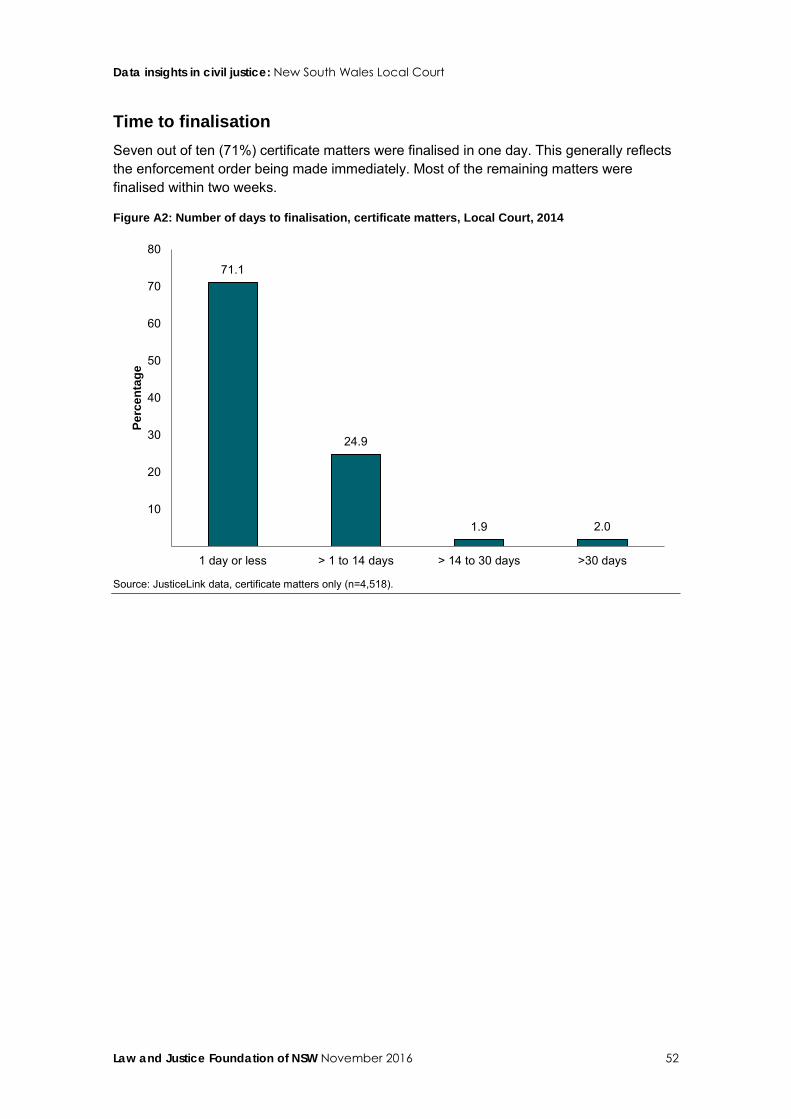
Data insights in civil justice: New South Wales Local Court
Law and Justice Foundation of NSW November 2016 52
Time to finalisation Seven out of ten (71%) certificate matters were finalised in one day. This generally reflects the enforcement order being made immediately. Most of the remaining matters were finalised within two weeks.
Figure A2: Number of days to finalisation, certificate matters, Local Court, 2014
Source: JusticeLink data, certificate matters only (n=4,518).
71.1
24.9
1.9 2.0 10
20
30
40
50
60
70
80
1 day or less > 1 to 14 days > 14 to 30 days >30 days
Perc
enta
ge
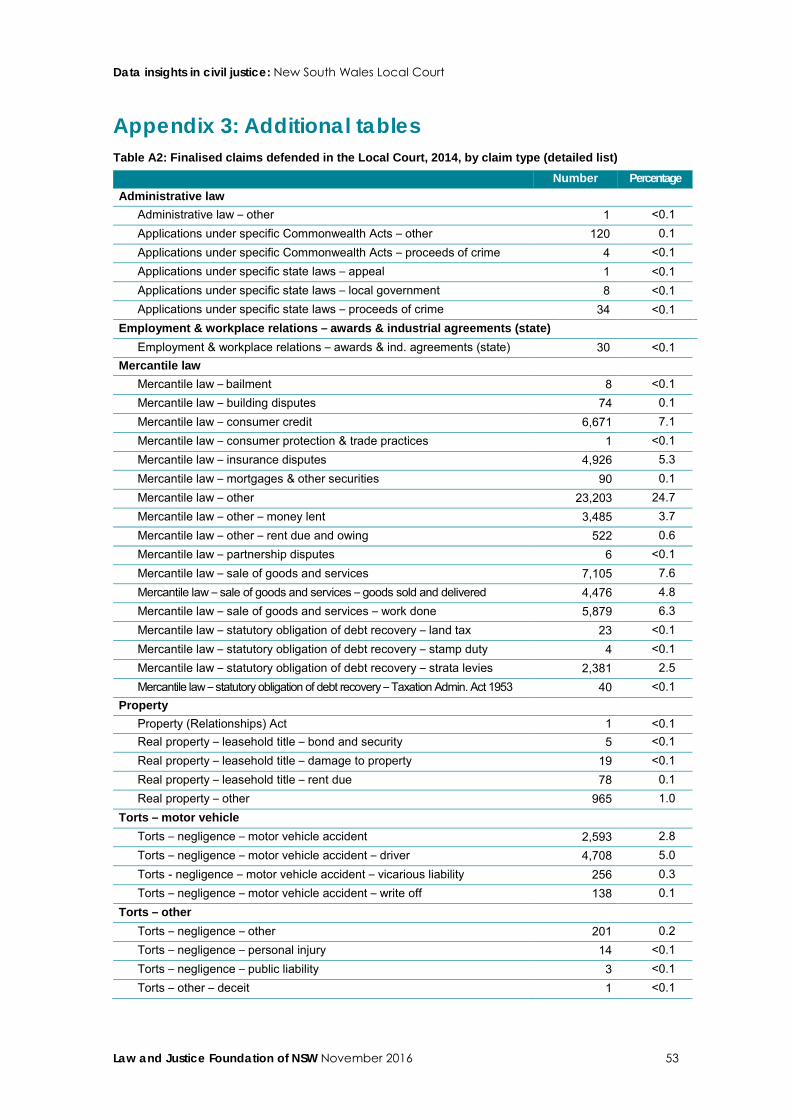
Data insights in civil justice: New South Wales Local Court
Law and Justice Foundation of NSW November 2016 53
Appendix 3: Additional tables Table A2: Finalised claims defended in the Local Court, 2014, by claim type (detailed list) Number Percentage Administrative law
Administrative law – other 1 <0.1 Applications under specific Commonwealth Acts – other 120 0.1 Applications under specific Commonwealth Acts – proceeds of crime 4 <0.1 Applications under specific state laws – appeal 1 <0.1 Applications under specific state laws – local government 8 <0.1 Applications under specific state laws – proceeds of crime 34 <0.1
Employment & workplace relations – awards & industrial agreements (state) Employment & workplace relations – awards & ind. agreements (state) 30 <0.1
Mercantile law Mercantile law – bailment 8 <0.1 Mercantile law – building disputes 74 0.1 Mercantile law – consumer credit 6,671 7.1 Mercantile law – consumer protection & trade practices 1 <0.1 Mercantile law – insurance disputes 4,926 5.3 Mercantile law – mortgages & other securities 90 0.1 Mercantile law – other 23,203 24.7 Mercantile law – other – money lent 3,485 3.7 Mercantile law – other – rent due and owing 522 0.6 Mercantile law – partnership disputes 6 <0.1 Mercantile law – sale of goods and services 7,105 7.6 Mercantile law – sale of goods and services – goods sold and delivered 4,476 4.8 Mercantile law – sale of goods and services – work done 5,879 6.3 Mercantile law – statutory obligation of debt recovery – land tax 23 <0.1 Mercantile law – statutory obligation of debt recovery – stamp duty 4 <0.1 Mercantile law – statutory obligation of debt recovery – strata levies 2,381 2.5 Mercantile law – statutory obligation of debt recovery – Taxation Admin. Act 1953 40 <0.1
Property Property (Relationships) Act 1 <0.1 Real property – leasehold title – bond and security 5 <0.1 Real property – leasehold title – damage to property 19 <0.1 Real property – leasehold title – rent due 78 0.1 Real property – other 965 1.0
Torts – motor vehicle Torts – negligence – motor vehicle accident 2,593 2.8 Torts – negligence – motor vehicle accident – driver 4,708 5.0 Torts - negligence – motor vehicle accident – vicarious liability 256 0.3 Torts – negligence – motor vehicle accident – write off 138 0.1
Torts – other Torts – negligence – other 201 0.2 Torts – negligence – personal injury 14 <0.1 Torts – negligence – public liability 3 <0.1 Torts – other – deceit 1 <0.1
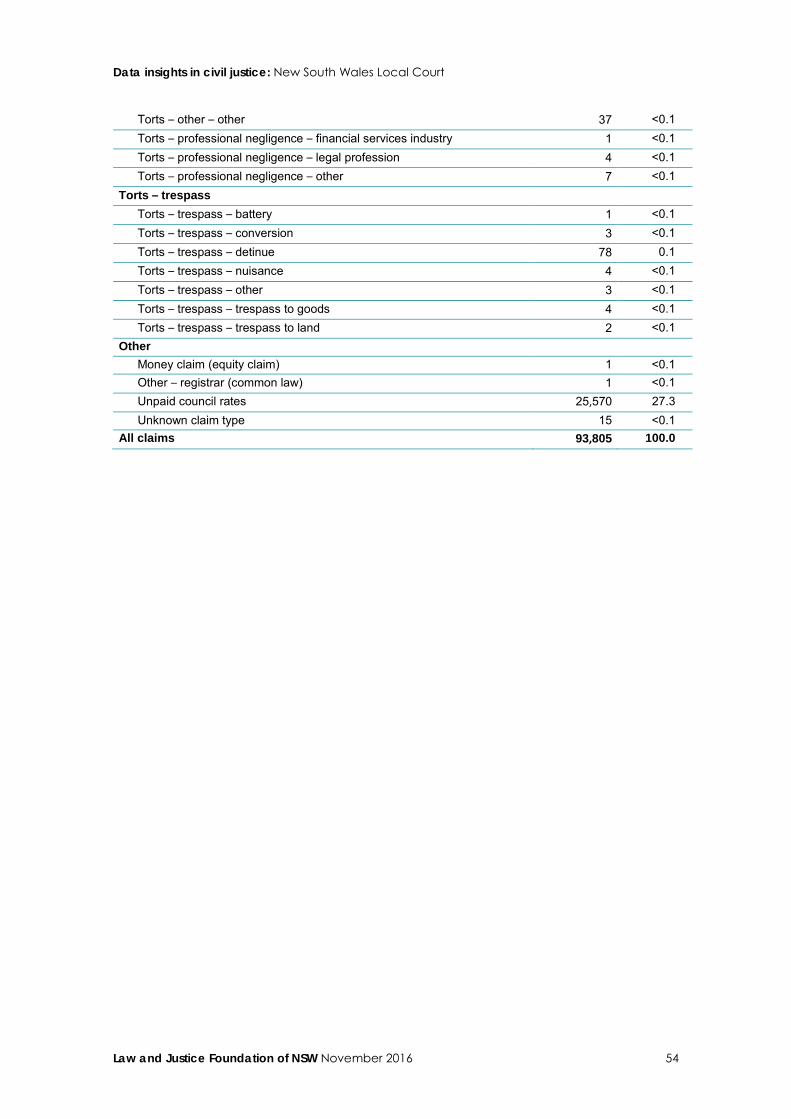
Data insights in civil justice: New South Wales Local Court
Law and Justice Foundation of NSW November 2016 54
Torts – other – other 37 <0.1 Torts – professional negligence – financial services industry 1 <0.1 Torts – professional negligence – legal profession 4 <0.1 Torts – professional negligence – other 7 <0.1
Torts – trespass Torts – trespass – battery 1 <0.1 Torts – trespass – conversion 3 <0.1 Torts – trespass – detinue 78 0.1 Torts – trespass – nuisance 4 <0.1 Torts – trespass – other 3 <0.1 Torts – trespass – trespass to goods 4 <0.1 Torts – trespass – trespass to land 2 <0.1
Other Money claim (equity claim) 1 <0.1 Other – registrar (common law) 1 <0.1 Unpaid council rates 25,570 27.3 Unknown claim type 15 <0.1
All claims 93,805 100.0
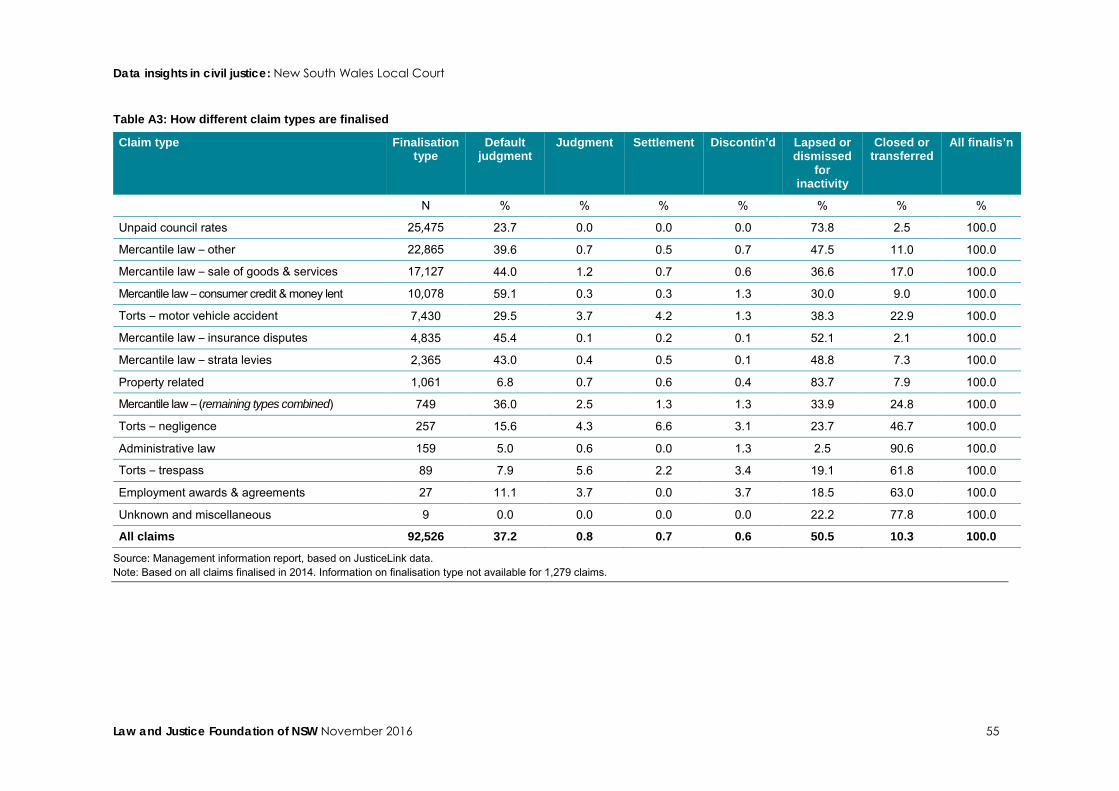
Data insights in civil justice: New South Wales Local Court
Law and Justice Foundation of NSW November 2016 55
Table A3: How different claim types are finalised
Claim type Finalisation type
Default judgment
Judgment Settlement Discontin’d Lapsed or dismissed
for inactivity
Closed or transferred
All finalis’n
N % % % % % % %
Unpaid council rates 25,475 23.7 0.0 0.0 0.0 73.8 2.5 100.0
Mercantile law – other 22,865 39.6 0.7 0.5 0.7 47.5 11.0 100.0
Mercantile law – sale of goods & services 17,127 44.0 1.2 0.7 0.6 36.6 17.0 100.0
Mercantile law – consumer credit & money lent 10,078 59.1 0.3 0.3 1.3 30.0 9.0 100.0
Torts – motor vehicle accident 7,430 29.5 3.7 4.2 1.3 38.3 22.9 100.0
Mercantile law – insurance disputes 4,835 45.4 0.1 0.2 0.1 52.1 2.1 100.0
Mercantile law – strata levies 2,365 43.0 0.4 0.5 0.1 48.8 7.3 100.0
Property related 1,061 6.8 0.7 0.6 0.4 83.7 7.9 100.0
Mercantile law – (remaining types combined) 749 36.0 2.5 1.3 1.3 33.9 24.8 100.0
Torts – negligence 257 15.6 4.3 6.6 3.1 23.7 46.7 100.0
Administrative law 159 5.0 0.6 0.0 1.3 2.5 90.6 100.0
Torts – trespass 89 7.9 5.6 2.2 3.4 19.1 61.8 100.0
Employment awards & agreements 27 11.1 3.7 0.0 3.7 18.5 63.0 100.0
Unknown and miscellaneous 9 0.0 0.0 0.0 0.0 22.2 77.8 100.0
All claims 92,526 37.2 0.8 0.7 0.6 50.5 10.3 100.0
Source: Management information report, based on JusticeLink data. Note: Based on all claims finalised in 2014. Information on finalisation type not available for 1,279 claims.
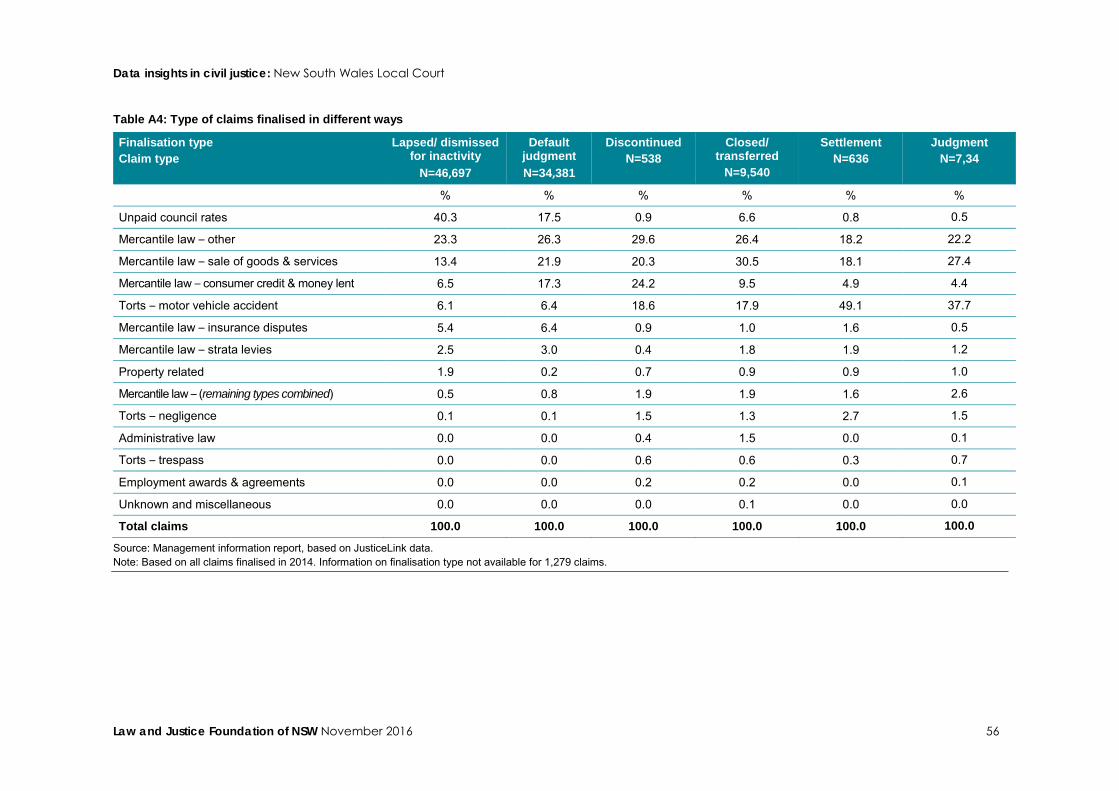
Data insights in civil justice: New South Wales Local Court
Law and Justice Foundation of NSW November 2016 56
Table A4: Type of claims finalised in different ways
Finalisation type Claim type
Lapsed/ dismissed for inactivity
N=46,697
Default judgment N=34,381
Discontinued N=538
Closed/ transferred
N=9,540
Settlement N=636
Judgment N=7,34
% % % % % %
Unpaid council rates 40.3 17.5 0.9 6.6 0.8 0.5
Mercantile law – other 23.3 26.3 29.6 26.4 18.2 22.2
Mercantile law – sale of goods & services 13.4 21.9 20.3 30.5 18.1 27.4
Mercantile law – consumer credit & money lent 6.5 17.3 24.2 9.5 4.9 4.4
Torts – motor vehicle accident 6.1 6.4 18.6 17.9 49.1 37.7
Mercantile law – insurance disputes 5.4 6.4 0.9 1.0 1.6 0.5
Mercantile law – strata levies 2.5 3.0 0.4 1.8 1.9 1.2
Property related 1.9 0.2 0.7 0.9 0.9 1.0
Mercantile law – (remaining types combined) 0.5 0.8 1.9 1.9 1.6 2.6
Torts – negligence 0.1 0.1 1.5 1.3 2.7 1.5
Administrative law 0.0 0.0 0.4 1.5 0.0 0.1
Torts – trespass 0.0 0.0 0.6 0.6 0.3 0.7
Employment awards & agreements 0.0 0.0 0.2 0.2 0.0 0.1
Unknown and miscellaneous 0.0 0.0 0.0 0.1 0.0 0.0
Total claims 100.0 100.0 100.0 100.0 100.0 100.0
Source: Management information report, based on JusticeLink data. Note: Based on all claims finalised in 2014. Information on finalisation type not available for 1,279 claims.


![Insights into local government: 2019 · 2020-06-15 · Insights into local government: 2019 B.29[20c] ... Productivity Commission commentary on well-being and outcomes reporting 39](https://img.pdfslide.us/doc/110x75/5f290c9640d5016fa44ce56f/insights-into-local-government-2019-2020-06-15-insights-into-local-government.jpg)