Embed Size (px)
Citation preview
CVBDataGuide Page 1 of 38 20 November 2017
CVB DATA GUIDE HOW TO SUBMIT DATA
This document describes how to submit data for studies reported to CVB.
1 Overview – How to submit data • Organize the data set according to a data format.
• Save the data set in Comma Separated Value (CSV) files.
• Use this data set in your own data analysis.
• Submit the CSV files to CVB.
2 Data Formats 2.1 What is a data format?
A data format is a defined way of arraying data. A data format definition specifies one or more related tables that have a particular structure.
2.2 What does a data format do? Data formats provide a common “language” for sharing data sets. The CVB data formats are designed for several characteristics. One of the most important is to facilitate machine reading and processing.
2.3 Data Format definitions are found in Appendix 1
3 CSV Files A CSV file is a type of text file.
• Use CSV files, not another electronic file type. (If you think an exception is warranted, please check first.)
• Each table in a data format should be in a separate CSV file.
• Files should be named according the naming convention of its data format.
• See Appendix 3.2: Creating CSV Files for CVB Statistics for more information.
4 Before submission 4.1 Prepare the data set
• Select the appropriate Data Format • Take into account Data Principles • Perform quality checks for internal consistency
4.2 Use the data set • First prepare the data set, then use the data set in your analysis (if you choose to do a statistical analysis). • By working with the data set before submitting it to CVB, your analysis serves as a final check of the
validity and quality of the data set before submission. Don’t leave the preparation of the data set for submission to the end.
• Your programming code should usually show how you read in the data from the CSV files.
CVBDataGuide Page 2 of 38 20 November 2017
• See the NCAH Portal Guidance web page for instructions on submitting the data files.
5 Help • See the appendix for a number of helpful documents and tools.
• If you need technical support from a person, contact: [email protected]

CVBDataGuide – Appendix Page 3 of 38 20 November 2017
APPENDIX
1 Data Formats ................................................................................................................................................................... 4
1.1 Introduction ............................................................................................................................................................. 4
1.2 ELISA Format ......................................................................................................................................................... 5
1.3 Clinical Format ....................................................................................................................................................... 8
1.4 Multi-well Assay Format ...................................................................................................................................... 10
1.5 Dichotomous Format............................................................................................................................................. 14
1.6 General Field Safety Format ................................................................................................................................. 17
1.7 Poultry/Fish Field Safety Format .......................................................................................................................... 19
1.8 Diagnostic Kit Format - Dichotomous .................................................................................................................. 21
1.9 Diagnostic Kit Format - Quantitative .................................................................................................................... 23
1.10 Checkerboard Format ............................................................................................................................................ 25
1.11 Build Your Own Format ....................................................................................................................................... 27
1.12 Glossary of Mandatory Columns .......................................................................................................................... 29
2 Expectations for all data submissions ........................................................................................................................... 31
2.1 Use CSV Files ....................................................................................................................................................... 31
2.2 Data Principles ...................................................................................................................................................... 31
2.3 Data Types and Variable Roles ............................................................................................................................. 32
3 Tools, troubleshooting and help .................................................................................................................................... 34
3.1 Common Data Formatting Issues .......................................................................................................................... 34
3.2 Creating CSV files for CVB Statistics .................................................................................................................. 36
3.3 Optional data entry tools ....................................................................................................................................... 37
3.4 Contact CVB Statistics.......................................................................................................................................... 37
4 Revision History ........................................................................................................................................................... 38

CVBDataGuide – Appendix Page 4 of 38 20 November 2017
1 Data Formats 1.1 Introduction A data format is a defined way of arraying data. A data format definition specifies one or more related tables that have a particular structure. The table specifications include “mandatory columns” – those that are always necessary, and “other columns” – those that may be necessary for specific studies. Both have required naming conventions.
The data formats are designed for the types of studies commonly submitted to CVB. To help choose a suitable data format, below is a list of study types with a suggested data format that often works. However if you think that your data doesn’t quite fit, feel free to Build Your Own Format or contact CVB statistics for advice.
POSSIBLE DATA FORMATS FOR SOME COMMON STUDY TYPES
Category Study Type Data Format
Efficacy Vaccination/Challenge Clinical
Serology or other efficacy surrogate Clinical
Natural exposure field efficacy Clinical
Field Safety FST by VSM 800.204
FST in target species General Field Safety
FST in target species – poultry or fish Poultry/Fish Field Safety
Clinical Safety Designed safety study Clinical
Assay e.g. Assay validation Reagent change Manufacturing process Inactivation kinetics Stability
Relative potency ELISA ELISA
Checkerboard ELISA optimization Checkerboard
Titration Multi-well Assay
Count Multi-well Assay
Conventional PCR Multi-well Assay
Other dilution assays (e.g. RID, dot blot, etc.) Multi-well Assay
Dichotomous response (pos/neg) Dichotomous
Diagnostic Test Kit
Dichotomous response (e.g. single use device) Diagnostic Kit-Dichotomous
Quantitative response (e.g. OD, Ct) Diagnostic Kit-Quantitative
Other Serological equivalence Clinical

CVBDataGuide – ELISA Page 5 of 38 20 November 2017
1.2 ELISA Format 1.2.1 Introduction This format is for enzyme-linked immunosorbent assays (ELISA) used to estimate relative potency or analyte concentration. This assay is performed in a 96-well microtiter plate. For assays that are performed on a 96-well microtiter plate, but are not ELISA, please see the Multi-well Assay Format.
1.2.2 What to Submit When submitting data for statistics that correspond to relative potency ELISA data format, include a total of four (4) CSV files, one corresponding to each of the 4 tables labeled below.
1.2.3 Tables This format includes four tables, named plateinfo, od, layout, and dilution. Except for plateinfo, the tables are laid out as stacked 8×12 arrays of plate information, with one additional column. The data should be presented exactly as arrayed on the plate. In other words, the rows are A-H and the columns are 1-12.
1.2.4 Submission subtypes with additional required information Assay validation: Please provide the Relative Potency (RP), product code (prod_code), and plate role (plate_role). The RP and product codes can be added as columns to the serialtesting table. The plate role, which would identify the aspect of the assay validation the plate was used in, should be added as a column to the plateinfo table (add multiple columns if a plate has more than one role).
Table Description Mandatory Columns
Other Columns
plateinfo Information about each individual plate. plateID date
technician capture antibody antigen role etc.
od The optical density readings of the wells. Every well should have a numeric result.
1-12 plateID
none
layout The contents of each well, usually the preparation identifier. Include information on every well.
For columns 1-12, if no material was added to the well, use “NA”. Note that the word “blank” should not be used for an empty well, since it usually refers to the preparation known as the reagent blank. For wells that are not part of the study, please use “NPS”.
1-12 plateID
none
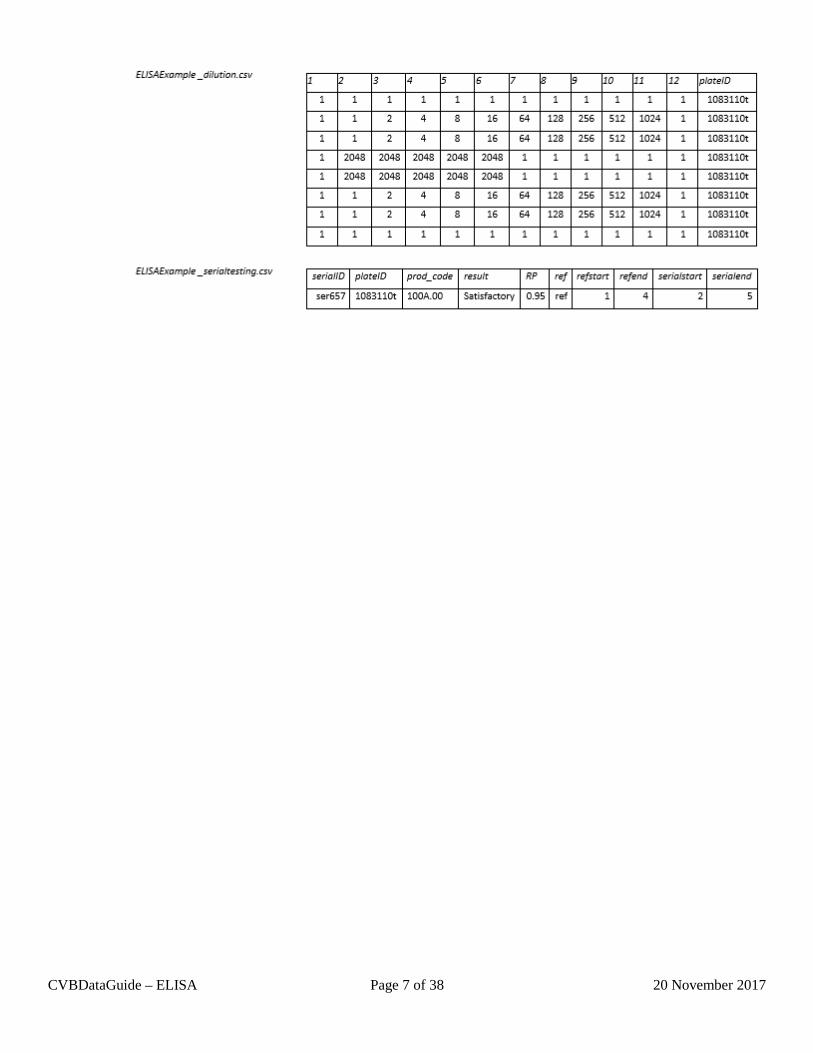
dilution The dilution of the material in each well. For columns 1-12, specify “undiluted” wells as 1. Use number (8, 0.125, NA) not text (1:8, 1/8, NPS). Do not use commas (1,024) that might cause a number to be interpreted as text. For ten-fold dilutions, scientific notation (1e9) may be used to avoid data entry errors of large dilutions (1000000000).
1-12 plateID
none
serialtesting (optional) Relationships between serial number, product code number and test data results.
plateID serial ID product code test outcome relative potency etc.

CVBDataGuide – ELISA Page 6 of 38 20 November 2017
Stability – confirm product dating: Please add a column for the Relative Potency (RP) results and serial fill date (fill_date) for each serial to the serialtesting table.
Stability-reference monitoring: Please provide the product code (prod_code) for each serial by adding a column to the serialtesting table.
Note: When submitting the Relative Potency (RP) results which rely on a linear model fit, please also provide the start and end dilutions1 used for each serial and reference that the linear model was fit to. Please see the serialtesting table example below for prefered column names.
1.2.5 Example Below are examples of the 4 tables in the format that should be included when submitting a study to the CVB. The fifth table, serialtesting, is used when specific serial information needs to be included.
1 Integer where 1 is the first dilution in the series, 2 is the second, etc. Not the same as dil, and not the column number. In example 1.2.5, the linear model is fit to the 1st – 4th dilutions for the reference (dil 1:1 – 1:8) and the linear model is fit to the 2nd to 5th dilutions for the serial (dil 1:2 – 1:16).
CVBDataGuide – ELISA Page 7 of 38 20 November 2017

CVBDataGuide – Clinical Format 8 of 38 20 November 2017
1.3 Clinical Format 1.3.1 Introduction This format is intended for designed experiments with live animals. This includes vaccination-challenge studies, natural exposure or field efficacy studies, other experimental efficacy studies without a challenge, feasibility studies involving target species or laboratory surrogates, and serological studies. It is not intended for simple in vivo titrations involving lab animals, for those studies see Dichotomous Format.
1.3.2 What to Submit When submitting data for statistics in the Clinical Format, include a total of three (3) CSV files, one corresponding to each of the 3 tables listed below. If no daily observations are taken, a repeated table may not be necessary.
1.3.3 Tables
Table Description Mandatory Columns
Other Columns
individual This table will contain all the information for the individual animal. Include any information that pertains to housing or litter (if applicable). It may also include any observations that are made once, usually at necropsy.
animalID group
sex date of birth litter pen lung lesions lymphoid depletion etc.
repeated This table will contain information on outcomes that were observed more than once. In most cases this means the daily observations. It should have an animal ID (identical to the one used in the individual table), a day column, and other observation columns.
animalID day
temperature coughing diarrhea etc.
variables This table is for the explanation of all the columns names in the previous two tables. You will provide the column name exactly as it appears in the previous two tables, a brief description of the column, and what table the column belongs to.
variable table description
comments

CVBDataGuide – Clinical Format 9 of 38 20 November 2017
1.3.4 Example Below are examples of the three tables in the format that should be included when submitting a study to the CVB with the Clinical format.

CVBDataGuide – Multi-well Assay Format 10 of 38 20 November 2017
1.4 Multi-well Assay Format 1.4.1 Introduction This format is designed for any assay that uses multiple wells or vessels for a single test. It is particularly suited for microtiter (multi-well) plates that can be of any shape or size.
1.4.2 What to Submit When submitting data for statistics that corresponds to the Multi-well Assay Format, include a total of three (3) CSV files, one corresponding to each of the 3 tables listed below.
1.4.3 Tables
1.4.4 Submission subtypes with additional required information Stability – confirm product dating: Please provide the results of the test as a column on the plateinfo table. If you have more than one serial/test per plate, please provide a testinfo table. This table would include columns for testID, plateID, date, serialID, fill_date and results.
Assay validation: Please provide the potency, product code, and plate role. These can be added to the plateinfo table using column names: potency, prod_code, plate_role. If you have more than one serial/test per plate, please provide a testinfo table for the results instead of reporting on the plateinfo table.
1.4.5 Example 1 Example of the three tables in the Multi-well Assay Format that should be included when submitting a study like a count assay to the CVB.
Table Description Mandatory Columns
Other Columns
plateinfo This table is designed to give us all the information that is specific to the plate or test.
plateID date
technician role etc.
wellinfo This table is designed to give us all the information on the individual wells. This file will include the plate ID (this needs to match exactly with the plateinfo table), the reading, the well position, the layout (content of well), and any other information
plateID od count area layout position dilution etc.
variables This table is for the explanation of all the columns names in the previous two tables. You will provide the column name exactly as it appears in the previous two tables, a brief description of the column, and what table the column belongs to.
variable table description
comments

CVBDataGuide – Multi-well Assay Format 11 of 38 20 November 2017
1.4.6 Example 2 Example of the three tables in the Multi-well Assay Format that should be included when submitting a study like a Western Blot to the CVB.

CVBDataGuide – Multi-well Assay Format 12 of 38 20 November 2017
1.4.7 Example 3 Example of the three tables in the Multi-well Assay Format that should be included when submitting a study like a PCR to the CVB.

CVBDataGuide – Multi-well Assay Format 13 of 38 20 November 2017

CVBDataGuide – Dichotomous Format 14 of 38 20 November 2017
1.5 Dichotomous Format 1.5.1 Introduction The Dichotomous Format is for studies where results are reported as positive (or negative) out of a total. For submissions where results are not dichotomous (such as continuous or integer readings like counts, etc.), please review the Multi-Well Assay Format. The Dichotomous Format can also be used for live lab animal vaccination/challenge with challenge back-titration studies.2
1.5.2 What to Submit When submitting data that corresponds to the Dichotomous Format, include at least three (3) CSV files, one corresponding to each of the three tables listed below. If the study also has a challenge with a back-titration, also include a fourth challenge table.
1.5.3 Tables
1.5.4 Submission subtypes with additional required information Stability – confirm product dating: Please make sure to add the titer results and fill date (fill_date) for each test to the testinfo table.
1.5.5 Example 1 Below are examples of the three tables in the format that should be included when submitting a study to the CVB when performing assays with dichotomous results.
2 This was formerly known as the Bioassay Format
Table Description Mandatory Columns
Other Columns
testinfo This table contains information about each individual test. testID date
challenge date vaccination date back-titer date technician results vial comments product code etc.
titration This table contains information about each titration within a test.
testID prepID prepRole dil positive total
comments etc.
variables This table is for the explanation of all the columns names in the previous two tables. You will provide the column name exactly as it appears in the previous two tables, a brief description of the column, and what table the column belongs to.
variable table description
comments
challenge (optional) This table contains information on the animals that were used in the back-titration of the challenge material.
prepID dil positive total testID

CVBDataGuide – Dichotomous Format 15 of 38 20 November 2017
1.5.6 Example 2 Below are examples of the four tables in the format that should be included when submitting a study to the CVB that has a live lab animal component where animals were vaccinated, challenged, and monitored. A third table has the challenge back-titration information.
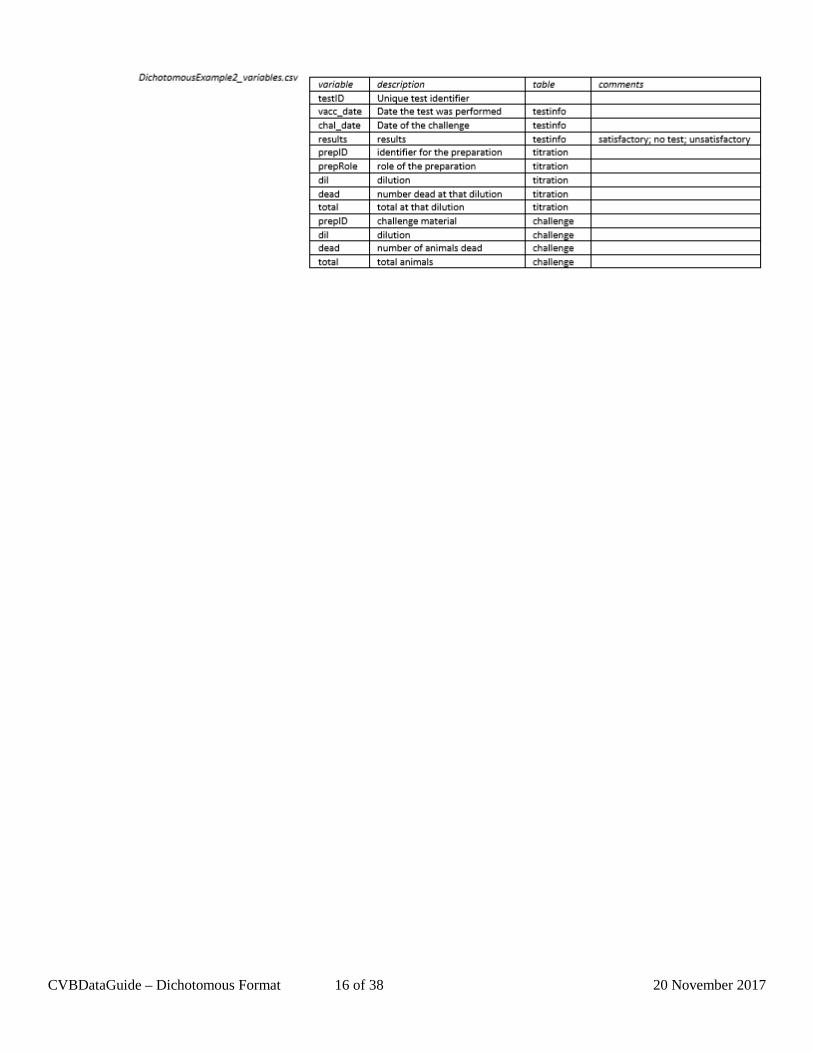
CVBDataGuide – Dichotomous Format 16 of 38 20 November 2017

CVBDataGuide – General Field Safety Format 17 of 38 20 November 2017
1.6 General Field Safety Format 1.6.1 Introduction This format is designed mainly for Field Safety Trials (FST) done in accordance with VSM 800.204. FSTs are loose observational studies done at several sites without much in the way of experimental design other than observing what happens after the product is administered under everyday conditions. This format is intended for use with all animals, except poultry and fish (see Poultry/Fish Field Safety Format).
1.6.2 What to Submit When submitting data for statistics that corresponds to the General Field Safety Format, include a total of three (3) CSV files, one corresponding to each of the 3 tables listed below.
1.6.3 Tables
1.6.4 Example Below are examples of the three tables in the format that should be included when submitting a study to the CVB with the General Field Safety Format. Please note this is a very brief example. It is understood that each site can have 100 or more animals and may go on for many days. These files can be very large.
Table Description Mandatory Columns
Other Columns
individual This table will provide us with the information on the individual animal.
animalID siteID group sex age
repeated This table will provide us with the observations on each animal. It will have a unique animal ID (exactly the same that was provided in the individual table). Then we need a date column, a column that states whether an adverse event was observed, and the VEDDRA term if an AE was observed (If there is more than one AE for an animal on the same day, please add an additional row with that animal and that day). Please click here for further information about the formatting for the VEDDRA term. You may also add a non-VEDDRA term and any other pertinent information about the animal on that date.
animalID date ae veddra altetiology
nonveddra localsite localsize comments etc.
variables This table is for the explanation of all the column names in the previous two tables. You will provide the column name exactly as it appears in the previous two tables, a brief description of the column, and what table the column belongs to.
variable table description
comments

CVBDataGuide – General Field Safety Format 18 of 38 20 November 2017

CVBDataGuide – Poultry/Fish Field Safety Format 19 of 38 20 November 2017
1.7 Poultry/Fish Field Safety Format 1.7.1 Introduction This format is designed mainly for Field Safety Trials (FST) done in accordance with VSM 800.204. FSTs are loose observational studies done at several sites without much in the way of experimental design other than observing what happens after the product is administered under everyday conditions. This FST Format is intended for use with poultry and fish.
1.7.2 What to Submit When submitting data for statistics that corresponds to Poultry/Fish Field Safety Format, include a total of four (4) CSV files, one corresponding to each of the 4 tables listed below.
1.7.3 Tables
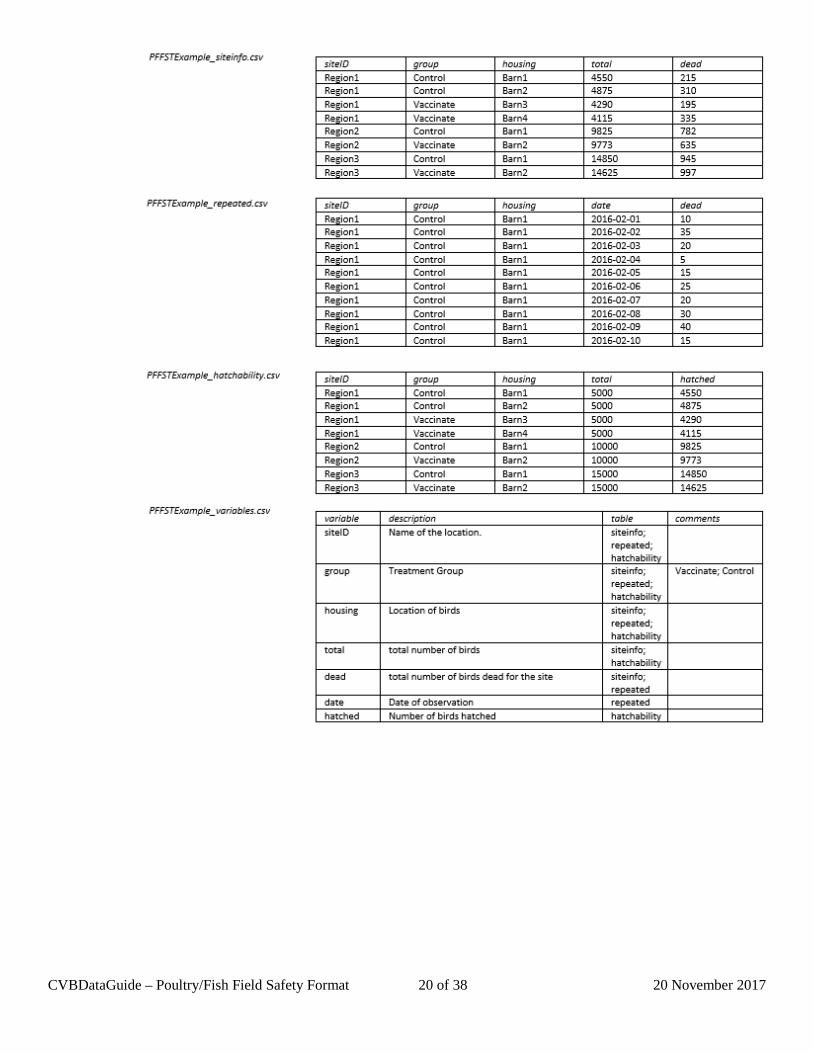
1.7.4 Example Below are examples of the four tables in the format that should be included when submitting a study to the CVB with the Poultry/Fish Field Safety Format.
Table Description Mandatory Columns
Other Columns
siteinfo This table will provide us with the information on the treatment groups for each site.
siteID group total dead
tanks isolators etc.
repeated This table will provide us with the mortality for each group at each site. It will have the site ID and the group (exactly the same that was provided in the individual table). Then we need a date column and a column for mortality for that date.
siteID group date dead
comments etc.
hatchability This table will provide us with the number of eggs that hatched per group.
siteID group total hatched
variables This table is for the explanation of all the columns in the previous two tables. You will provide the column name exactly as it appears in the previous two tables, a brief description of the column, and what table the column belongs to.
variable table description
comments
CVBDataGuide – Poultry/Fish Field Safety Format 20 of 38 20 November 2017

CVBDataGuide – Diagnostic Kit Dichotomous 21 of 38 20 November 2017
1.8 Diagnostic Kit Format - Dichotomous 1.8.1 Introduction This format is designed for diagnostic test kits with a dichotomous response such as lateral flow devices, or similar single use devices where a positive/negative determination is made by the presence or absence of a visible dot or line.
1.8.2 What to Submit When submitting data for statistics that corresponds to Diagnostic Kit - Dichotomous data format the number of tables submitted is dependent on the study type. Not all study types for diagnostic testing are listed below, such as confirmation of dating. However, formatting of those data may be similar to one of the study types described.
1.8.3 Tables Table Description Mandatory
Columns Other Columns
deviceinfo This table is designed to give us the results from the lab testing for each device and information about that device. Each device ID should only appear once. If the device has more than one spot or line that is read, like a control line, then add columns for additional readings.
deviceID serialID visual_read
date sample ID specimen species manufacture date test session panel member instrument reading reference result population product code etc.
labinfo This table contains information for each lab for interlaboratory testing. Information about the lab will include the lab name, technician, and other columns may be appropriate also.
testsession labID date
technician etc.
panelinfo This table is designed to give us the information on the panel members. Information will include the panel member description, specimen type and species.
panelmember memberdesc
blind ID code species specimen etc.
testinfo If multiple devices are used to report one derived value, such as a mean instrument result, then report the derived information on this table.
sampleID
variables This table is for the explanation of all the column names in the previous tables. You will provide the column name exactly as it appears in the previous tables, a brief description of the column, and what table the column belongs to.
variable table description
comments
1.8.4 Tables to submit for submission subtypes Assay Validation – Sensitivity and Specificity: Please submit a deviceinfo and variables table. Additional mandatory columns to those listed above for this study type on the deviceinfo table include: sampleID, date, and ref_result. If the reference test was not conducted concurrently, then please provide a reference date column indicating what date the reference test was initiated.

CVBDataGuide – Diagnostic Kit Dichotomous 22 of 38 20 November 2017
Assay Validation – Interlaboratory Comparison (Diagnostic Field Study): Please submit a deviceinfo, labinfo, panelinfo, and variables table. An additional mandatory column to those listed above for this study type on the deviceinfo table include: panelmember and testsession. For the panelinfo table, information such as blinding code, the description of the panel member (negative, weak positive, strong positive), species, and specimen should be included.
Serial Release Panel Validation (Diagnostic Panel Validation): Please submit a deviceinfo, panelinfo and variables table. Additional mandatory columns to those listed above for this study type on the deviceinfo table include: panelmember, and date. If multiple devices are used to report one derived value, such as a mean instrument result, then report the derived information on the testinfo table.
1.8.5 Example An example of tables to submit for each of the three types of studies (1.8.4) is included in the following zip file.
https://www.aphis.usda.gov/animal_health/vet_biologics/publications/DiagnosticKitDichotomous.zip

CVBDataGuide – Diagnostic Kit Quantitative 23 of 38 20 November 2017
1.9 Diagnostic Kit Format - Quantitative 1.9.1 Introduction This format is designed for diagnostic test kits with a quantitative response such as OD or Ct, which are usually conducted on multi-well plates and read by a machine.
1.9.2 What to Submit When submitting data for statistics that corresponds to Diagnostic Kit - Quantitative data format the number of tables submitted is dependent on the study type. Not all study types for diagnostic testing are listed below, such as confirmation of dating. However, formatting for those data may be similar to one of the study types described.
1.9.3 Tables Table Description Mandatory Columns Other Columns plateinfo This table is designed to give us the information about
the plate. Each plateID should only appear once on the plateinfo table.
plateID date serialID
lab ID technician manufacture date product code etc.
wellinfo This table is designed to give us all the information on the well readings (such as od). If the results are calculated for an individual well, then also include derived result, interpretation (pos/neg) and any other information necessary.
plateID row col
sample ID sample specimen sample species panel member raw well reading derived result population etc.
panelinfo This table is designed to give us the information about the panel member. Include information such as the description of the panel member, species, and specimen. Other columns may be appropriate also.
panelmember memberdesc
blind code member species member specimen etc.
testinfo This table is for derived information on a plate that is across multiple wells (similar to serialtesting table in the ELISA Format). Example, the SP Ratio is calculated using average of three wells on the plate.
plateID
derived result panel member etc.
variables This table is for the explanation of all the column names in the previous tables. You will provide the column name exactly as it appears in the previous tables, a brief description of the column, and what table the column belongs to.
variable table description
comments
1.9.4 Table to submit for submission subtypes Assay Validation – Sensitivity and Specificity: Please submit a plateinfo, wellinfo, and variables table. Additional mandatory columns to those listed in the Tables above for this study type on the wellinfo table include: sampleID, and raw well reading (od, etc.). Information about the reference result (ref_result), and reference date (if the test was not conducted concurrently) may be appropriate on any of the tables listed, and are mandatory columns. If information is derived from multiple wells, please include this on the testinfo table.
Assay Validation – Interlaboratory Comparison (Diagnostic Field Study): Please submit a plateinfo, wellinfo, panelinfo and variables table. Additional mandatory columns to those listed above for this study type on the wellinfo table include: panelmember, and well reading (od, etc.).

CVBDataGuide – Diagnostic Kit Quantitative 24 of 38 20 November 2017
Information about each lab that performed testing should be included on the plateinfo table. If information is derived from multiple wells, please include this on the testinfo table.
Serial Release Panel Validation (Diagnostic Panel Validation): Please submit a plateinfo, wellinfo, panelinfo and variables table. Additional mandatory columns to those listed above for this study type on the wellinfo table include: panelmember, and well reading (od, etc.). If information is derived from multiple wells, please include this on the testinfo table.
1.9.5 Example An example of tables to submit for each of the three types of studies (1.9.4) is included in the following zip file.
https://www.aphis.usda.gov/animal_health/vet_biologics/publications/DiagnosticKitQuantitative.zip
CVBDataGuide – Checkerboard 25 of 38 20 November 2017
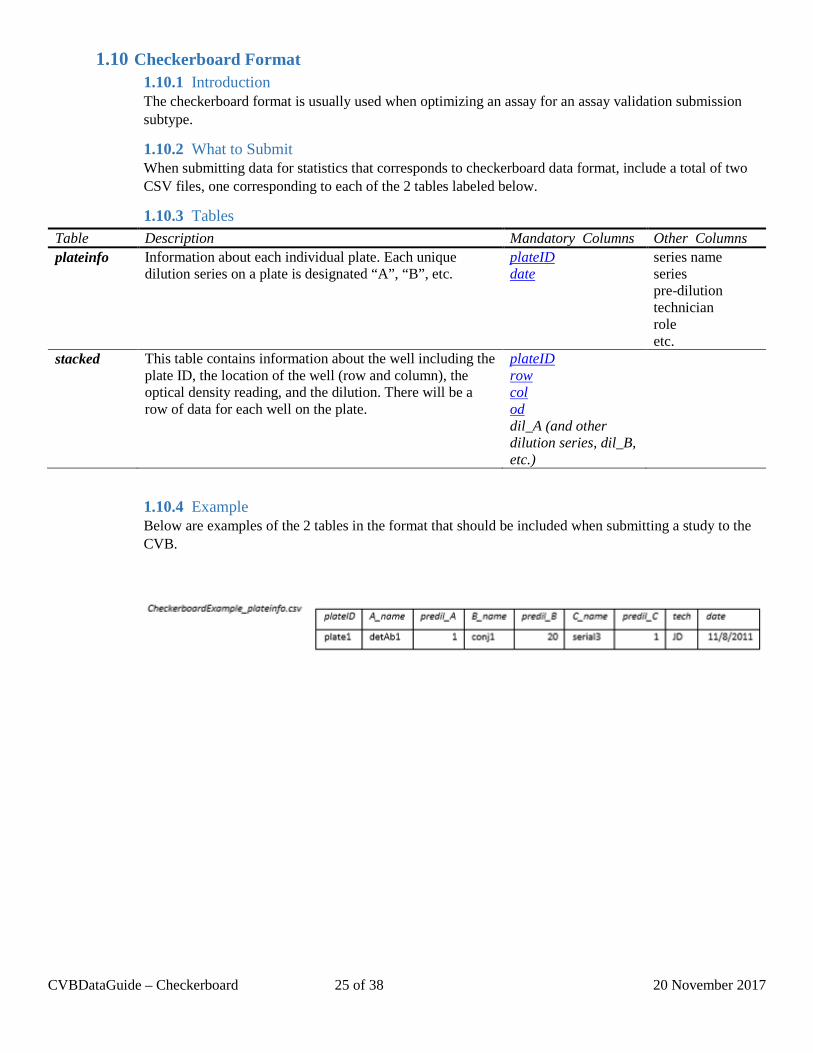
1.10 Checkerboard Format 1.10.1 Introduction The checkerboard format is usually used when optimizing an assay for an assay validation submission subtype.
1.10.2 What to Submit When submitting data for statistics that corresponds to checkerboard data format, include a total of two CSV files, one corresponding to each of the 2 tables labeled below.
1.10.3 Tables
1.10.4 Example Below are examples of the 2 tables in the format that should be included when submitting a study to the CVB.
Table Description Mandatory Columns Other Columns plateinfo Information about each individual plate. Each unique
dilution series on a plate is designated “A”, “B”, etc. plateID date
series name series pre-dilution technician role etc.
stacked This table contains information about the well including the plate ID, the location of the well (row and column), the optical density reading, and the dilution. There will be a row of data for each well on the plate.
plateID row col od dil_A (and other dilution series, dil_B, etc.)
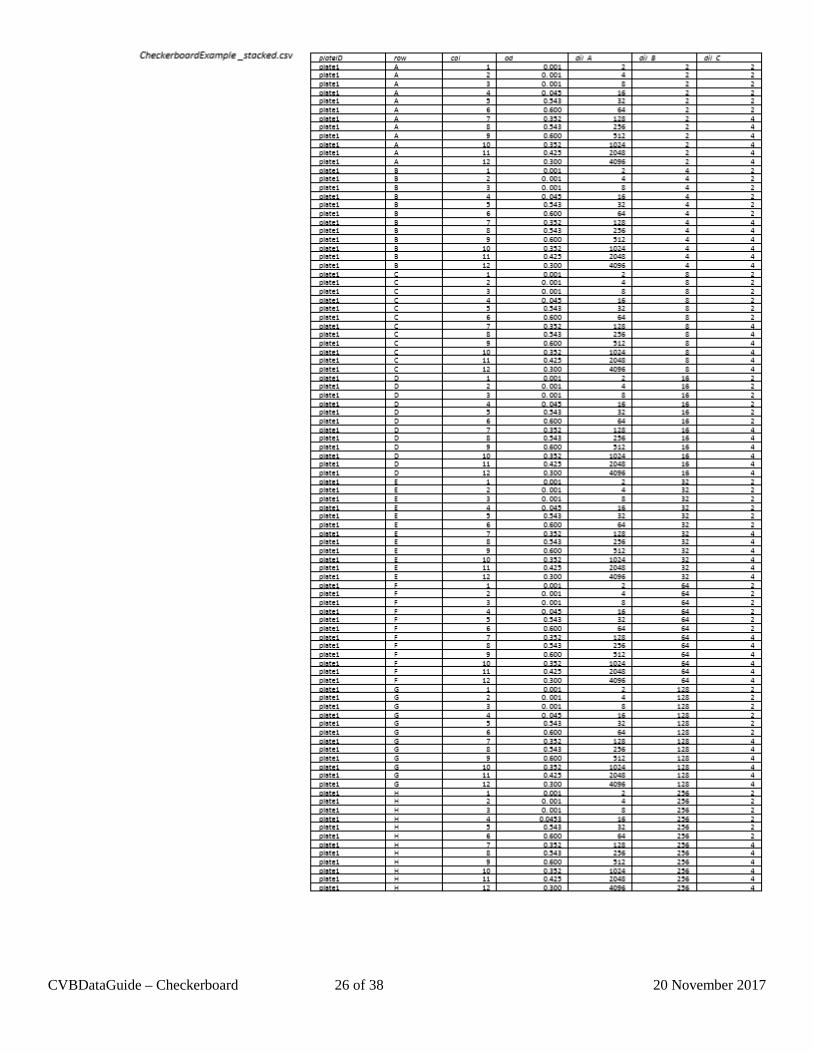
CVBDataGuide – Checkerboard 26 of 38 20 November 2017

CVBDataGuide – BYO Format 27 of 38 20 November 2017
1.11 Build Your Own Format 1.11.1 Introduction The Build Your Own Format goes over the basic ideas that you need in order to submit data to the CVB Statistics group if none of the prior formats fit your data. Please send Stat the format you determined was correct, and we’ll provide feedback.
1.11.2 What to Submit When submitting data for statistics, there will probably be 2-3 tables that are saved as CSV files. Depending on your data, there may be different combinations of the three tables that follow. However, the variables table should always be one of them.
1.11.3 Tables
Table Description Mandatory Columns
Other Columns
individual A table that has unique information in each row. You will have one column that links this file to your repeated table; like ID. Other columns in this table describe that key identifier column.
ID conjugate plate role date of birth group tech etc.
repeated A table that has one column that has a repeated entry in several rows of the table but is the key identifier that ties it to the individual table, and all other columns have unique entries to their row in the table.
ID day of study daily observations well position well readings counts etc.
variables A table that describes the columns in the other two tables. The column (variable) names that you choose for the individual and repeated tables, might be obvious, or they might not be. In order to make the submission as clear as possible, the variables table should describe the column names that are used.
variable description table
comments

CVBDataGuide – BYO Format 28 of 38 20 November 2017
1.11.4 Example Below are examples of 3 tables in the format could be included when submitting a study to the CVB.

CVBDataGuide – Glossary 29 of 38 20 November 2017
1.12 Glossary This glossary includes the names of Columns (Variables) that are mandatory, and some non mandatory, with a description of the column. It also includes some non-mandatory columns if their names are fixed and should not be altered. Not all column names will apply to every submission. Please review specific formats to determine which column names your table will need.
1-12 The twelve columns that relate to the 96-well plate used in relative potency ELISA ae Whether an Adverse Event is observed (Yes, No). age Age of the animal when vaccination is administered alive The number of animals that did not die or were not affected by the challenge altetiology Use “affirm” or NA. The licensee affirms that there is diagnostic or clinical support for a possible
cause of this AE other than vaccination (alternative etiology). animalID Unique identifier for an animal col Most commonly a number (1-12) that corresponds to the numbered row on a 96-well microtiter plate date Date of the test, assay, or observation, including month, day and year. Preferably in the format
“YYYY-MM-DD”. day A number to either indicate the day of the study, or day post challenge. It is not a date, but a count of
the days since time point 0 (vaccination, challenge, etc.) dead The number of animals in the group that died description Description of the column deviceID A single use device identifier that is unique to the table. The use of special characters such as periods,
hyphens, spaces, arithmetic operators, etc. is discouraged. Limiting the length of the string to fewer than 16 alphanumeric characters is encouraged.
dil The dilution administered to the animal or used in a well. Specify “undiluted” wells as 1. Use number (8, 0.125) not text (1:8, 1/8). Do not use commas (1,024) that might cause a number to be interpreted as text. For ten-fold dilutions, scientific notation (1e9) may be used to avoid data entry errors of large dilutions (1000000000).
fill_date A date (preferably formatted “YYYY-MM-DD”) that is the date that the serial was filled. group Treatment group assigned to an animal hatched Number of birds hatched ID Generic Identifier for a plate, gel, animal, test, etc. labID Unique identifier for the laboratory that is performing testing. The use of special characters such as
periods, hyphens, spaces, arithmetic operators, etc. is discouraged. localsite For injection site reactions only, identify the injection site if there is more than one vaccination: e.g. 1
for 1st vaccination and 2 for 2nd vaccination. localsize For injection site reactions only, provide the size. memberdesc Description of the panel member. Usually described as “negative”, “weak positive”, or “strong
positive”. nonveddra Can be used to apply a non-veddra category term to the event. od Optical density reading panelmember Unique identifier for the panel member being tested. The use of special characters such as periods,
hyphens, spaces, arithmetic operators, etc. is discouraged. plateID A plate identifier that is unique to the table. The use of special characters such as periods, hyphens,
spaces, arithmetic operators, etc. is discouraged. Limiting the length of the string to fewer than 16 alphanumeric characters is encouraged.
plate_role Role of the plate in an assay validation (i.e. precision, ruggedness, specificity) positive Total number of positive readings (tubes or wells) or animals affected by challenge. potency potency of a product prepID The identifier of the preparation used. This will usually be a lot or serial number of a vaccine prepRole The role of the preparation. This must be reference, test, or other prod_code Veterinary Services Product Code ref_result Reference test result which is usually a dichotomous result, “positive” or “negative”. In some cases, a
result of “suspect” may be appropriate. If multiple reference tests are performed, please report results

CVBDataGuide – Glossary 30 of 38 20 November 2017
in multiple columns with the reference tests numbered, refX_result. i.e. ref1_result, ref2_result, etc. Information about each of the tests can be included in the variables table.
results The outcome of a test row Most commonly a letter (A-H) that corresponds to the lettered row on a 96-well microtiter plate. RP Relative potency calculated sampleID Unique identifier for the sample being tested. The use of special characters such as periods, hyphens,
spaces, arithmetic operators, etc. is discouraged. serialID The identifier of the preparation used. This will usually be a lot or serial number of a vaccine sex sex of animal; Male (M) or Female (F) siteID Site location that animals were held at for observation table Name of the table that the column is found on testID A test identifier that is unique in the table. Every test must have a test identifier testsession An identifier that can be used to group individual identifiers together. total The total number of animals/tubes/wells in a group (treatment group or at a specified dilution) variable Names of the columns that are used in the corresponding data files veddra From the VEDDRA List of Clinical Terms select the appropriate Low Level Term (LLT) or Preferred
Term (PT). visual_read For tests that require a visual read per the SO or OP, include the visual read result.

CVBDataGuide – Expectations 31 of 38 20 November 2017
2 Expectations for all data submissions 2.1 Use CSV Files Comma Separated Value (CSV) files are a portable standard that allows for quick import into statistics analytical programs. Occasionally there may be a reason to submit some other file type to CVB Statistics. In such cases, please check first. Note that the CVB Portal for electronic submission does not accept all file types.
When preparing your CSV files:
• Include only one table per file. • If you use spreadsheet software to prepare the CSV file:
o Do not encode information via text formatting (e.g. italics, bold, color). This information is ignored when converting to CSV.
o Do not encode information by formatting the table (e.g. background color). This information is ignored when converting to CSV.
o Values in merged cells will be arbitrarily assigned to a single cell (merging lost) when converting to CSV. This will result in empty cells on the table which may extend analysis time
See Appendix 3 for troubleshooting technical help.
2.2 Data Principles Basic principles for data sets that should be followed for all submissions. Consideration of competing goals prior to analysis can help identify the best data structure for a particular submission.
2.2.1 Principles • Each variable is in a column, each observation is in a row.
o Some data formats may have an exception to this rule. That occurs when certain types of multivariate data are handled as a chunk, such as when 96-well plate data are included as they are captured by a plate reader.
• Each column contains one data type.
o For example, do not include the text “undiluted” in a column of numeric dilutions. o See list of data types (Section 2.2.2)
• Derived information.
o Do not include derived information, such as averages, in the same column as the raw data. o If it is needed for submission, derived information should be included in a separate column or
table.
Example: the relative potency of two preparations on a plate.
Example: lung lesion score calculated as the weighted sum of individual lobes.
• Include an entry in every cell of a table.
o Indicate missing data with NA (not N/A, na, or other code). o If using spreadsheet software, such as Excel, to create a CSV file, be sure to start the table in
the first row and column of the spreadsheet (cell A1). Otherwise, there will be empty cells.

CVBDataGuide – Expectations 32 of 38 20 November 2017
• Avoid redundant data.
o If the same data are used to support different aspects of the same study (e.g. accuracy and parallelism in an assay validation study) do not submit those data twice. Submit them in one data set. An additional variable can be used to indicate the roles of various subsets of the data.
2.2.2 Points to consider • The number of data sets for a single study is sometimes a judgment call, and must balance design
needs for data entry with demands for efficient analysis workflows.
o Sometimes it’s better to use multiple data sets Example: An efficacy study has daily clinical signs, nasal swabs every other day, and blood work weekly. It is convenient to use a separate repeated table for each observation sequence.
o Sometimes it’s better to use a single data set. Example: An assay validation study includes experiments for accuracy, parallelism, and freeze/thaw effects. Their data may be included in a single set, with a variable indicating which experiment they are from. The reason for using a single data set for similar data of this type is that statistical modeling may need to include all of them to estimate certain parameters.
2.3 Data Types and Variable Roles 2.3.1 Data Types
Data Type Description Continuous A measurement on a continuous scale, such as body temperature. Large imprecise integer counts,
such as blood cell counts, are often considered continuous. Interval censored continuous data, such as duration in days, may at times be treated as either continuous or integer.
Count Integer counts, such as frequencies. Ranked A numerical value that reflects a valid ordering but a unit spacing that is not calibrated. For
example, a valid clinical scoring scheme may produce integers from 0 to 16, where a higher number always indicates more severe disease than a lower number but the severity difference
between any two adjacent scores is not necessarily the same. Dichotomous A binary response that can only take two values, such as dead or alive Ordinal Categories that are ordered, such as those applied to disease severity. The number of categories
should be as few as possible and ideally would reflect distinct states, such as dead, sick, normal. (Excessive categories lead to issues of discreteness and sparseness.) Simple grading scales may
generate ordinal categories. Nominal Categories without any natural ordering, such as breed of cattle. Date Date Censored Measurements that have an upper or lower observational limit imposed by the instrument.
(example: colony counts greater than 300 may be reported as “TNTC” [too numerous to count])

CVBDataGuide – Expectations 33 of 38 20 November 2017
2.3.2 Variable Roles Variable Type Role Identifier Unique identification given to each unit (or possibly subunit). The identifier also serves as the
grouping factor for repeated observations made on the individual. (Data type: nominal) Grouping Grouping factors are nominal categories important in study design, such as treatments or
clusters. All efficacy studies have treatment groups, such as vaccine or placebo. Many have clusters, such as litter or pen. (Data type: nominal.)
Observation Direct observations or measurements. (Data types: continuous, count, ranked, dichotomous, ordinal, nominal.)
Derived Value calculated or derived from other variables. (Data types: continuous, count, ranked, dichotomous, ordinal, nominal.)
Timing Date or time. May be an actual date or time (Data type: date), or may be a count, such as the number of days in relation to an event such as challenge, or continuous, such as the number of
minutes from inactivation. (Data type: count or continuous.) Units The units of measurement. Units must be indicated for continuous and count data types. Leave
blank otherwise.
CVBDataGuide – Troubleshooting 34 of 38 20 November 2017
3 Tools, troubleshooting and help 3.1 Common Data Formatting Issues
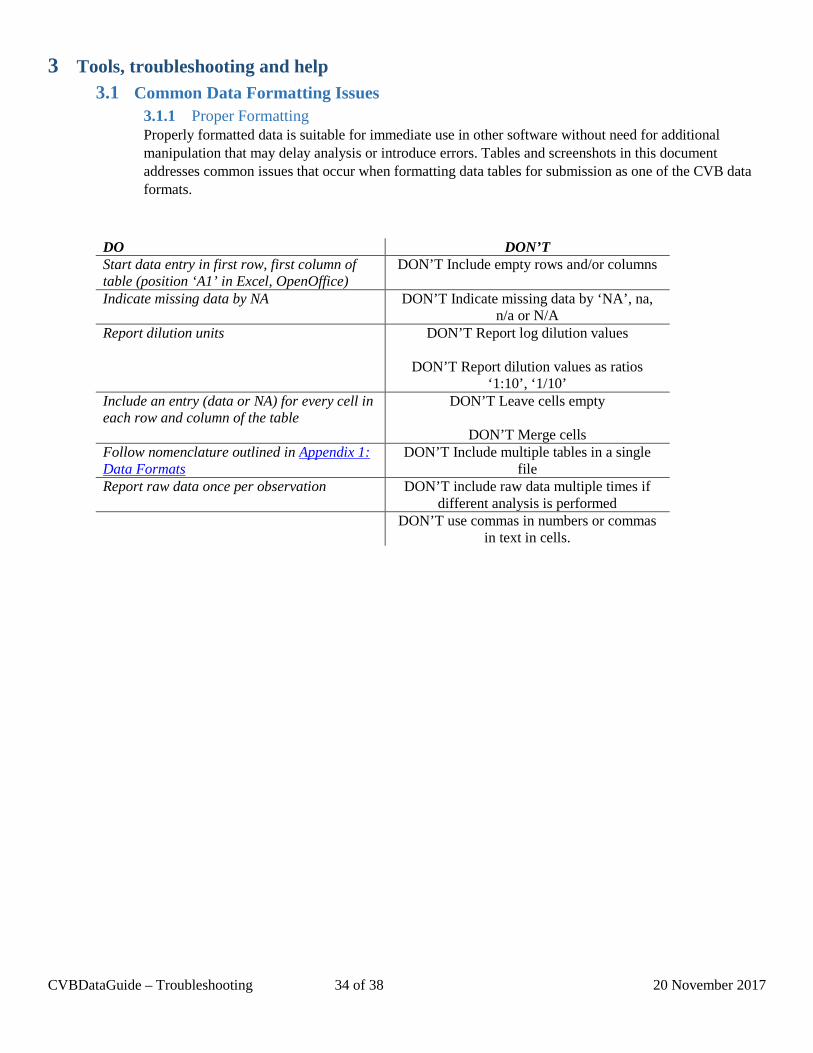
3.1.1 Proper Formatting Properly formatted data is suitable for immediate use in other software without need for additional manipulation that may delay analysis or introduce errors. Tables and screenshots in this document addresses common issues that occur when formatting data tables for submission as one of the CVB data formats.
DO DON’T Start data entry in first row, first column of table (position ‘A1’ in Excel, OpenOffice)
DON’T Include empty rows and/or columns
Indicate missing data by NA DON’T Indicate missing data by ‘NA’, na, n/a or N/A
Report dilution units DON’T Report log dilution values
DON’T Report dilution values as ratios ‘1:10’, ‘1/10’
Include an entry (data or NA) for every cell in each row and column of the table
DON’T Leave cells empty
DON’T Merge cells Follow nomenclature outlined in Appendix 1: Data Formats
DON’T Include multiple tables in a single file
Report raw data once per observation DON’T include raw data multiple times if different analysis is performed
DON’T use commas in numbers or commas in text in cells.

CVBDataGuide – Troubleshooting 35 of 38 20 November 2017
3.1.2 Example
Figure 1: Common formatting errors that delay analysis (lower) and correct formatting for the same data (upper).

CVBDataGuide – Troubleshooting 36 of 38 20 November 2017
3.2 Creating CSV files for CVB Statistics CSV tables created from user-specified files must follow a specific nomenclature to facilitate automated data management tools. Follow the nomenclature and conventions described in Appendix 1: Data Formats.
3.2.1 Starting from statistical software • In R, use: write.csv(…) • In SAS, use: proc export
3.2.2 Starting from Excel • Use the “Save As” option to designate “CSV” as the file type.
o Merged cells will be ignored. o Text and border formatting (font, color, background) will be lost. o Only one worksheet will be saved per destination file.
In Office 2013, the “Save As” option is on the “File” page. Pick “CSV” as the file type from the drop down.

CVBDataGuide – Troubleshooting 37 of 38 20 November 2017
3.3 Optional data entry tools
CVB Statistics is in the process of creating tools to support creating CSV files that conform to the data formats described above. These tools are completely optional to use. Please check back later for details.
These tools can be found at:
https://www.aphis.usda.gov/animal_health/vet_biologics/publications/OptionalDataEntryTools.zip
3.4 Contact CVB Statistics
If your question is in regards to one of the following area, ask to speak to a Statistician:
• Identifying the best Data Format for a specific submission • Troubleshooting creating Data Format tables for submission • Bug fixes/upgrades to optional data entry tools. • Informal feedback regarding experimental design prior to submission
Email: [email protected]

CVBDataGuide – Revision History 38 of 38 20 November 2017
4 Revision History
Date Affected Sections 2017-02-07 Appendix Sections 1.2.4, 1.2.5, 1.4.3, 1.4.4, 1.4.5, 1.4.6, 1.4.7, 1.5.2, 1.5.3, 1.5.4, 1.5.5, 1.5.6, 1.6.3,
1.6.4, 1.9.4, 1.10, 3.3 2017-09-26 1 Overview; Appendix Sections 1.1, 1.2.3, 1.2.4, 1.2.5, 1.4.4, 1.4.5, 1.4.6, 1.5.6, 1.6, 1.8, 1.9, 1.12,
3.1.1 2017-11-20 Appendix Sections 1.6.3, 1.6.4, 1.10.2, 1.10.3, 1.10.4, 1.12, 2.2.2