Embed Size (px)
Citation preview
Advisory Panel I INSTRUMENTATION I Jonathan W. Amy Donald R. Johnson Harry L. Pardue Jack W. Frazer Charles E. Klopfenstein Ralph E. Thiers G. Phillip Hicks Marvin Margoshes William F. Ulrich
Data Domains-An Analysis of Digital and Analog Instrumentation Systems and Components
Data domains concepts offer a means of effectively utilizing new electronic devices which requires only an understanding of basic measurement processes. These con- cepts can be used to great advantage in designing or modifying systems and in as- sessing and minimizing the sources of measurement errors.
C. G. ENKE Department of Chemistry, Michigan State University, E. Lansing, Mich. 48823
CIESTIFIC ISSTRUMENTATION IS be- ing revolutionized by the availabil-
ity of an ever-increasing array of elec- tronic devices which increase measure- ment speed, accuracy, and convenience while decrensing instrument size and power requirements. Integrated cir- cuits and hybrid circuits have made many measurement techniques, n-hich were previously only theoretically possi- ble, a reality. The continual decrease in the cost of digital and linear circuits has made many sophisticated devices such as frequency meters, digital pH meters, signal averngers, and minicomputers practical for most laboratories. As electronic technology continues to ad- vance, we can expect more and more of the sampling, control, and dnta analy- ,?is of scientific measurements to be per- formed b>- the instrument itself.
Digitnl instrumcntation has been the .scene of milch development and interest liecause of its inherent accuracy capa- hilit!., convenient numerical output, and potential digital computer compati- bility. However, just “digitizing” a n instrument does not insure these ad- vnnt:iges. There are literally hundreds of datn handling and digitizing devices available today and an unwise com- bination of units can actually degrade
the output accuracy. Also, many digi- tized measurement systems, while pro- viding excellent accuracy and conve- nience, are unnecessarily complicated.
Data Domains Concepts
The convenience and power of the amazing new electronic devices are irresistible to almost all scientists, but few are in a position to understand these new tools in detail. A4 means of applying new devices efficiently and effectively, which requires only an un- derstanding of the liasic measurement concepts, is needed for most. The datn domains concepts described here are very useful in analyzing, describing, modifying, and designing analog, digi- tal, :ind analogldigital measurement systems and devices and in assessing and minimizing the sources of measure- ment errors ( 1 ) . In addition, a much better understanding of the instru- mental data handling process is gained as :I result of the study and application of the data domains concept. The first, four concepts of datn domains analysis are given below:
(1) Measurement data are repre- sented in an instrument a t any instant by n physical quantity, n chemical quantity, or some property of an elec- trical signal. The characteristics or properties used to represent the mea- surement data can be categorized in groups called “data domains.”
( 2 ) As the data proceed through the instrument, a change in the character- istic or property used to represent the measured data is called a “data domain conversion.”
(3) All electronic measurement sys- tems can be described as a sequence of two or more data domain converters, each of which can be analyzed sepa- rately.
(4) llethods of using electrical sig- nals to represent measurement data in11 into three major categories or do- mains: analog, time, and digital.
Since there are only three data do- mains for electrical signals, the elec- tronic sections of complex measure- ment systems can be easily analyzed (or designed) as combinations of only a few basic interdomain converters. =Ilso the hundreds of data handling devices available can be shown to be simply various methods of accomplish- ing the basic interdomain conversions.
Electronics-Aided Measurement
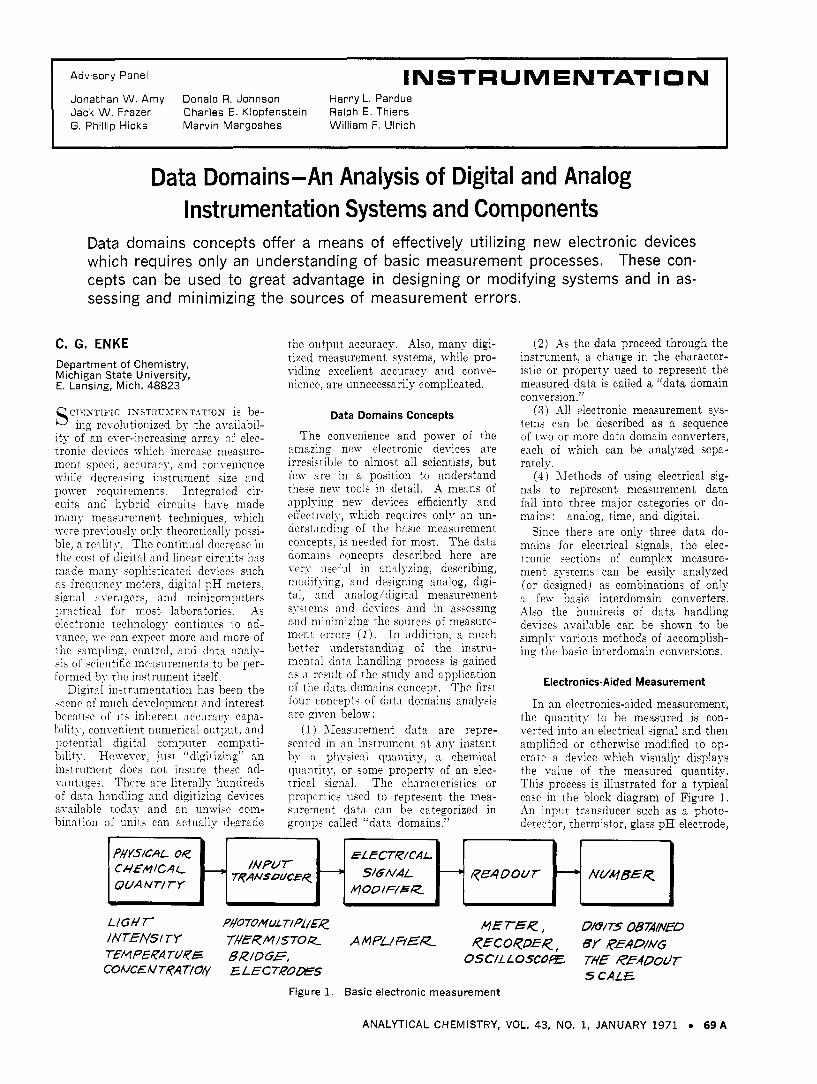
In an electronics-aided measurement, the quantity to be measured is con- verted into an electrical signal and then amplified or otherwise modified to op- erate a device which visually displays the value of the measured quantity. This process is illustrated for a typical case in the block diagram of Figure 1. An input transducer such as a photo- detector, thermistor, glass p H electrode,
ANALYTICAL CHEMISTRY, VOL. 43, NO. 1, JANUARY 1971 6 9 A
Instrumentation
EL ECTkiCAL ANALOG- ro-
MODIFIER CONV€RE< SIGNAL - DIGITAL
PHY5K4L of? CHEMICAL H TRANSDUCER INpur 1 QUANTITY
I D/GKAL D/G/TAL
P@CESS/NG (NUM BE K) - DA7.A- - mrwr
L -- or strain gage is used to convert the quantit’y to be measured int,o a n elec- trical signal. The current or voltage amplitude of this signal is related in some known way to the quant,ity to be measured. The electrical signal from the input transducer is then modified by an electronic circuit to make it suit- able to operate a readout, device. The elect’ronic circuit is most frequently an amplifier with the appropriate adjust,- able parameters (zero, standardizat,ion, position, etc.) and sometimes with auto- matic compensation for nonlinearities, temperature variation, etc. of the trans- ducer. The output is a readout device from which a number can be obtained, generally by observing the position of R marker against a numbered scale.
Using the data domains concepts, the basic electronic measurement of Figure 1 is described as follo~vs: The measure- ment data exist first as the physical or chemical quantity to be measured. At the output of the input, transducer, the measurement data are represented by an electrical signal and are thus in one of the three “electrical” domains. The input transdueer is thus a device which converts quantities or translates information from a physical or chemical domain into an electrical domain. The measurement data remain in an elec- trical domain through the electrical sig- nal modifier. However, the output de- vice converts the electrical signal into some readable form such as the rela- tive positions of a marker and a scale- i.e., a nonelectrical domain. Thus the entire measurement can be described in terms of conversions b e h e e n domains and modifications within domains.
In the basic electronic measurement’, a t least two converters are required; one to transfer into an electrical do- main and one to transfer out’. The characteristics of each interdomain con- verter and each signal modifier affect the quality of the measurement. To take advantage of special input trans- ducers, particular readouts, and avail- able signal processing techniques, an instrument may involve many dat’a domain conversions and signal modi- fiers. The data domains concept allows ench step to be blocked out’ and ana- lyzed separately. This will be shown to be particularly desirable in assessing sources of errors and the relative ad-
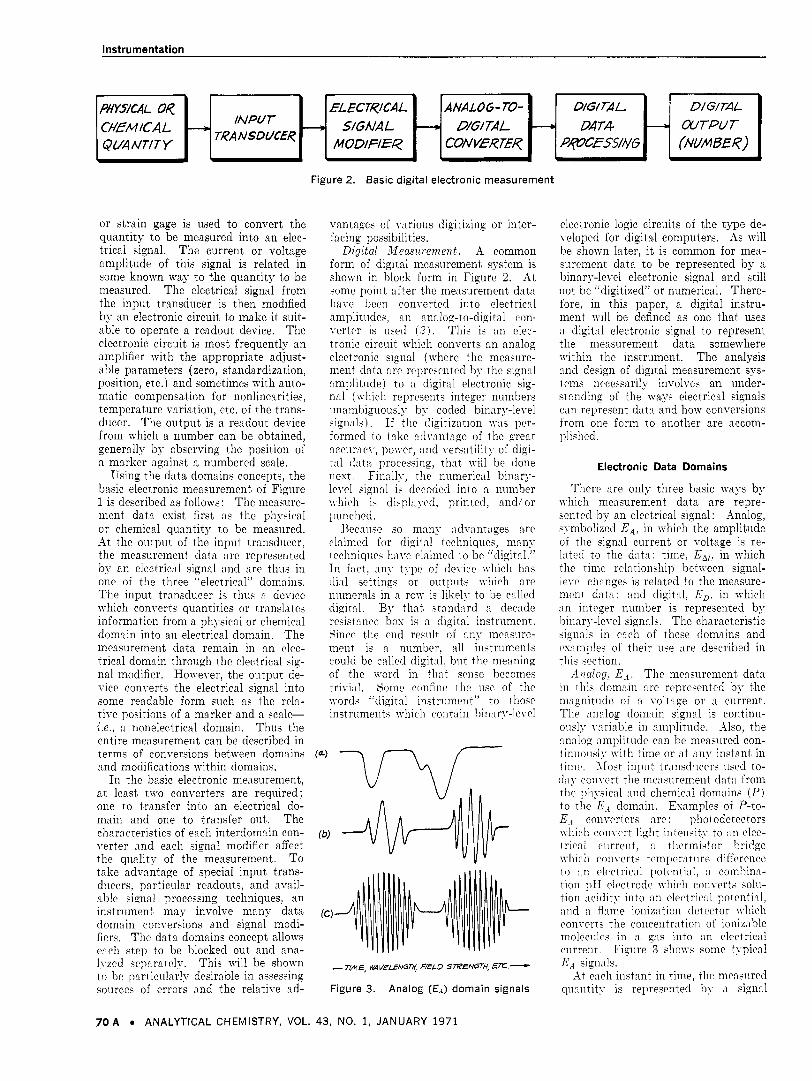
Figure 2. Basic digital electronic measurement
vantages of various digitizing or int’er- facing possibilities.
Digital dfeasurement. -4 common form of digital measurement system is shown in block form in Figure 2. At some point after the measurement data h a w been converted into electrical amplitiides, an analog-to-digital con- verter is wed (a). This is an elec- tronic circuit which converts an analog electronic signal (where the measure- ment data are reprcscnted by the signal amplitude) to n digital electronic sig- nal (n-liicli represents integer numbers iinainbiguously by coded binary-level signal.). If the digitization n-as pcr- formed to take advantage of the great accuracy, power, and versatility of digi- tal data processing, that will be done next. Finnlly, the numerical binary- level signal is decoded into a number nhich is diaplnyed, printed, andl or piinched.
Becawe so many :idvantages are claimed for digital techniques, many techniques have claimed to be “digital.” In fact, any t j y e of device which has din1 settings or outputs which are niimerals in a roTv is likely to be called digital. By that, standnrd a decade resistancc bos is a digital instrument. Since the end result of any measure- ment is a number, all instruments could be callrd digital, biit the meaning of the word in t h a t wnse becomes trivi:il, Some confine the iise of the word< “digital instrument” to those instruments which contain linary-level
electronic logic circuits of the type de- veloped for digital computers. As will be s h o m later, it is common for mea- surement data to be represented by a binary-level electronic signal and still not be ”digitized” or numerical. There- fore, in this paper, a digital instru- ment will be defined as one that, uses :I digital electronic signal to represent the measurement data somewhere within the instrument. The analysis :ind design of digital measurement sys- tems necessarily involves an under- standing of the ways electrical signals can represent, data and how conversions from one form to another are accom- plished.
Electronic Data Domains
There are only three basic ways by which measurement data are repre- sented by an electrical signal: Analog, symbolized E,4, in which the amplitude of the signal current or voltage is re- Inted to the data; time, in which the time relationsliip hetn-een signal- levcl changes is related to the measure- ment data: and digital, E,, in which :in integer number is represented by binary-level signals. The characteristic signals in each of these domains and cxiinple. of their use are described in this section.
dA~in/ogt EA4. The measurement, data in this domain are represented by the mngnitiidc of a voltnge or a current. The analog domain signal is continu- oiisly variable in amplitude. A i l ~ o , the analog :implitude can be measured con- tinuousl!- with time or a t any instant in timc. Most input transducers used to- t h y convert the rnenm-ement dnt:i from thc phypical and chemical domains ( P ) to the E.t domain. Esamples of P-to- E , converters are: photodetectors nliich convert, light intensity to nn elec- trical ciirrent, a thermistor bridge which converts temperature differcnce to :in electrical potential, n cornbina- tion p H rlcctrodc which converts solii- tion ncidity into an electricnl potentid, and a flame ionization detector which convrrts the concentration of ioniznble moleciilw in n gas into an electrical current. Figure 3 shows some typical
- TME, MVELENGT$ FELD SRENGT? EX: -C
- i t each inqtant in time, the measured Figure 3. Analog (EA) domain signals qiinntity is represented by a signal
7 0 A ANALYTICAL CHEMISTRY, VOL. 43, NO. 1, JANUARY 1971
Instrumentation
amplitude. The variations in the sig- nal amplitude may be plotted against time, wavelength, magnet'ic field strength, temperature, or other experi- mental parameters as shown in Figure 3. From such plots, addit'ional infor- mation can often be obt,ained from a correlation of amplitudes measured a t different times. Such information viould include simple observations like peak height, peak position, number of peaks, or more complex correlations such as peak area, peak separation, signal averaging, and Fourier trans- formation. The techniques of correlat- ing data taken s t different times must be distinguished from the techniques of converting t,he data taken at each instant, into a usable form. I t is the latter problem that this paper is pri- marily concerned with. The former problem is handled by datn processing techniques, once the required instmi- taneous data points have been con- verted to a useful form and stored.
Signals in the EB domain are sus- ceptible to electrical noise sources con- tained within or induced upon the cir- cuits and connections. The resulting signal amplitude a t any instant is the sum of the data signals and the noise -ignals.
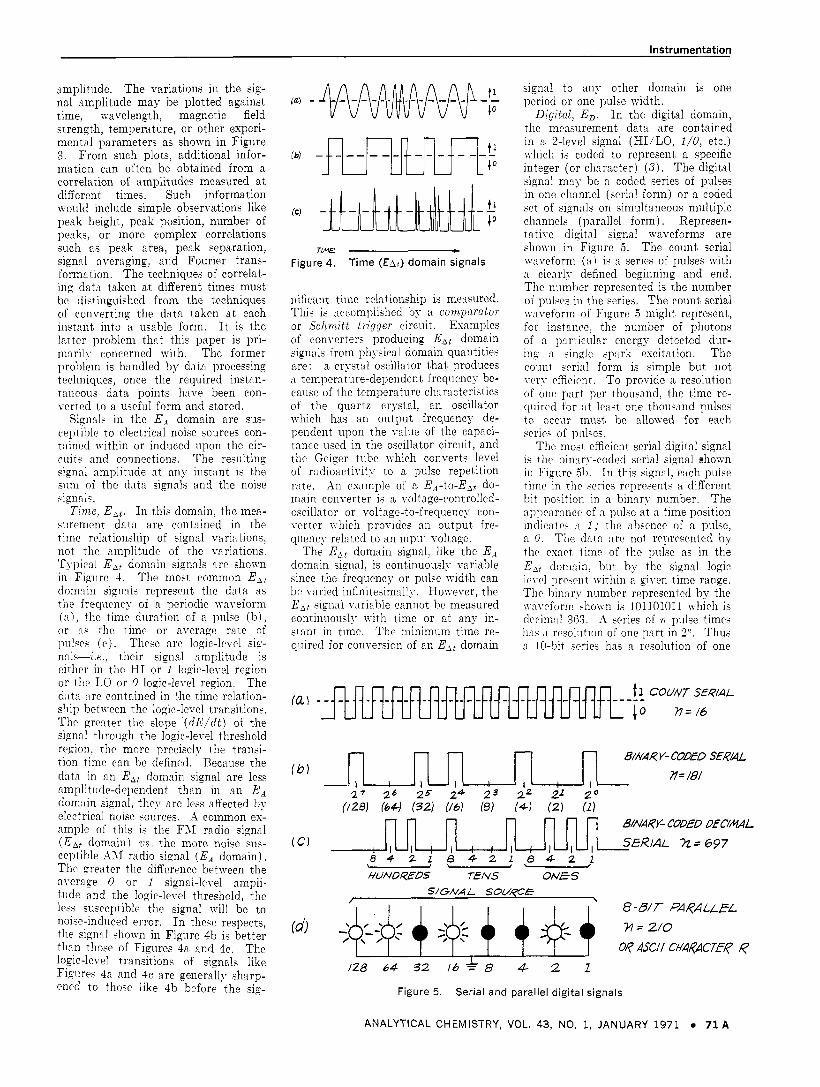
T h e , EAt . I n this domain, the mea- siirement data are contained in the time relationship of signal variations, not the amplitude of the variations. Tj.pical EAt domain signals are shoivn in Figiire 4. Tlie most common E A t dom:iin signnls represent, the data RS
the frequency of a periodic waveform ( a ) , the time duration of a pnlse ( b ) , or 3.q the time or average rate of 11111scs (c ) . T h e arc logic-h-el sig- nals--i.e., their signal amplitude is either in tlic HI or 1 logic-level region or thc LO or 0 logic-level region. The data are contained in the time relation- ship between the logic-level transitions. The greater the slope ( d E / d t ) of the signa 1 through the logic-level threshold region, the more precisely the transi- tion time can be defined. Because the data in an E,, domain signal are less amplitude-dependent than in an E A domain signal, thry are less affected by electrical noise sources. A common ex- ample of this is the FM radio signal (EA? domain) vs. the more noise sus- ceptible -411 radio signal ( E A domain). The greater the difference between the average 0 or 1 signal-level ampli- tude and the logic-level threshold, the less susceptible the signal will be to noise-induced error. I n these respects, the signal shown in Figure 4b is better than those of Figures 4a and 4c. The logic-level transitions of signals like Figures 4a and 4c are generally sharp- ened to those like 4b before the sjg-
TIME L
Figure 4. Time (Eat) domain signals
nificant tinie relationship is measured. Tliis is accomplished by a comparator or Scjlmitt tr igger circuit, Examples of converters producing EAt domain signals from physical domain quantities are: a crystal oscillator that produces a temperature-dependent. frequency be- cause of the temperature characteristics of the quartz crystal, an oscillator which lias an output frequency de- pendent upon the value of the capaci- tance used in the oscillator circuit, and the Geiger tube ivhich converts level of radioactivity to a pulsc repetition mte. An example of a Ea-to-E,t do- main converter is a voltage-controlled- oscillator or voltage-to-frequency con- verter which provides an output fre- quency related to an input voltage.
The ESt domain signal, like the E, domain signal, is continuously variable since the frequency or pulse width can be varied infinitesimally. However, the EAt signal variable cannot be measured continuously with time or a t any in- stant in time. The minimum time re- quired for conversion of an EAt domain
signal t o any other domain is one period or one pulse width.
Digital, E,. I n the digital domain, the measurement dat,a are contained in a %level signal (HI/LO, 1 / U , etc.) wliicli is coded to represent a specific integer (or character) (3). The digital signal may be a coded series of pulses in one channel (serial form) or a coded set of signals on simultaneous multiple channels (parallel form). Represen- tative digital signal waveforms are shown in Figure 5. The count' serial waveform ( a ) is a series of pulses with a clearly defined beginning and end. Tlie number represented is the number of pulses in the series. The count serial waveform of Figure 5 might represent, for instance, the number of photons of n particular energy detected dur- ing n singlc spark excitation. The count serial form is simple but not very efficient. To provide a resolution of one part per thousand, the time re- quired for at least one thousand pulses to occur must, be allowed for each series of piilscs.
The most efficient serial digital signal is tlie binary-coded serial signal 21 iown in Figure 5b. I n this signal, each pulse timc in tlic series represents a different hit poqition in a binary number. The appcnrnnce of a pulse at a time position indicates a 1 ; tlie absence of a pulse, a 0. The data are not represented by thc exact time of the pulse as in the EAt domain, but by the signal logic Icvcl prc5cnt within a given time range. The hinary number represented by the n-awform rho!!-n is 101101011 which is dccim:il 363. ,4 series of n pulse times
resolution of one part in 2". Thus a 10-bit Perk. has a resolution of one
7 B/NAR Y- COD?D S E Q / !
??= /8/ ( 6 ) I I '
- 5/NA<% COD&D UFC/#AL
I ' SERIAL Z= 697 (CI
n = 2/0 04' ASCII CffAQACTEq Q
128 6 4 32 16 4 8 4 2 1
Figure 5 . Serial and parallel digital signals
ANALYTICAL CHEMISTRY, VOL. 43, NO, 1, JANUARY 1971 71 A

number is then obtained by reading the position of the pointer against the calibrated scale. The signal path on the data domains map for the pH me-
NOff-EUCTR/aL ter is also shown in Figure 7 . Note that there are two instrumental inter- domain conversions, one intradomain conversion, and one “manual” interdo- main conversion. It will be shown later that interdomain conversions are more complex and error-prone than intra- domain conversions. Recording and “servodigital” pH meters have essen- tially the same block diagram and do- mains path except that the servo sys- tem can be used to convert the EA volt- age signal from the combination elec- trode directly into the pen position in the case of the recorder or the position
Figure 6. Data domains map of the turns-counting dial (a rotnr\r
ELECTi/CAL
€ A t
part in 210 = 1024,,, and a 20-bit, series has a resolution of better than one part per niillion.
The binary-coded decimal serial form is somewhat less efficient but very con- venient where a decimal numerical out- put is desired. Each group of four bits represents one decimal digit in a num- ber. Twvelve bits can thus represent three decimnl digits and provide one part, in one thousand resolution.
A parallel digital signal uses a sepa- rate wire for each bit, position instead of a separate time on a single wire. The principal advantage of lm-allel digital data connections is speed. An entire “word” (group of bits) can be conveyed from one circuit to another in the time required for the transmission of one bit in a serial connection. .4n 8-bit parallel data source is shown in Figure 5d connected to indicator lights to show the simultaneous appearance of the data logic levels on all eight d a h lines. Binary coding (shown), binary- coded decimal coding, and others are used for parallel digital data, Parallel data connections are used in all modern, fast computers. Serial data connections are often used for telemetry and slow computer peripherals such as teletypes.
Mapping Domain Conversions
I t has been pointed out that elec- tronic instruments making chemical or physical measurements use no fewer than two data domain conversions. I n fact, modern laboratory instruments frequently use three or more domain conversions to perform the desired mea- surement. Knowing the data domains involved in a particular instrument’s operation can help in understanding its operation, applications, limitations, and adaptability as part of a larger measure-
ment system. When analyzing an in- strument it is helpful to use the data domains “map” shown in Figure 6. The path of the signal can be traced out on the map as it is followed through the instrument. This process will be illus- trated for several chemical instruments of various types.
p H Meter. The block diagram of a conventional pH meter is shown in Figure 7 . The combination glass/calo- me1 electrode converts the hydrogen ion activity (chemical composition do- main) to an electrical potential ( E A domain). This signal is amplified and converted to a current amplitude that is used to deflect the meter pointer. A
pH ELECTiODE
SCALE
U
Y
scale) in the case of t,he servodigital metcr. Notice that even in the latter case the data are never in the digital domain. Digital pH Meter. .4 digital pH
meter (Figure 8) differs from an ordi- nary pH meter in that the meter is replaced by an analog-to-digital (.4/D) converter and a digital display. ,4 fre- quently used A/D converter for this ap- plication is the dual slope converter. .4s is often the case, this .4/D convert,er does not convert directly from the EA t o E, domains. The dual-slope circuit produces a pulse which has a duration proportional to the input signal volt- a g c i . e . , a EAt signal. The pulse width is converted to a digital signal using the pulse to turn an oscillator on and off, generating a count serial digital signal.
\ / Figure 7. pH meter &At
neter
7 2 A ANALYTICAL CHEMISTRY, VOL. 43, NO. 1, JANUARY 1971
Instrumentation TEMP€RATURE
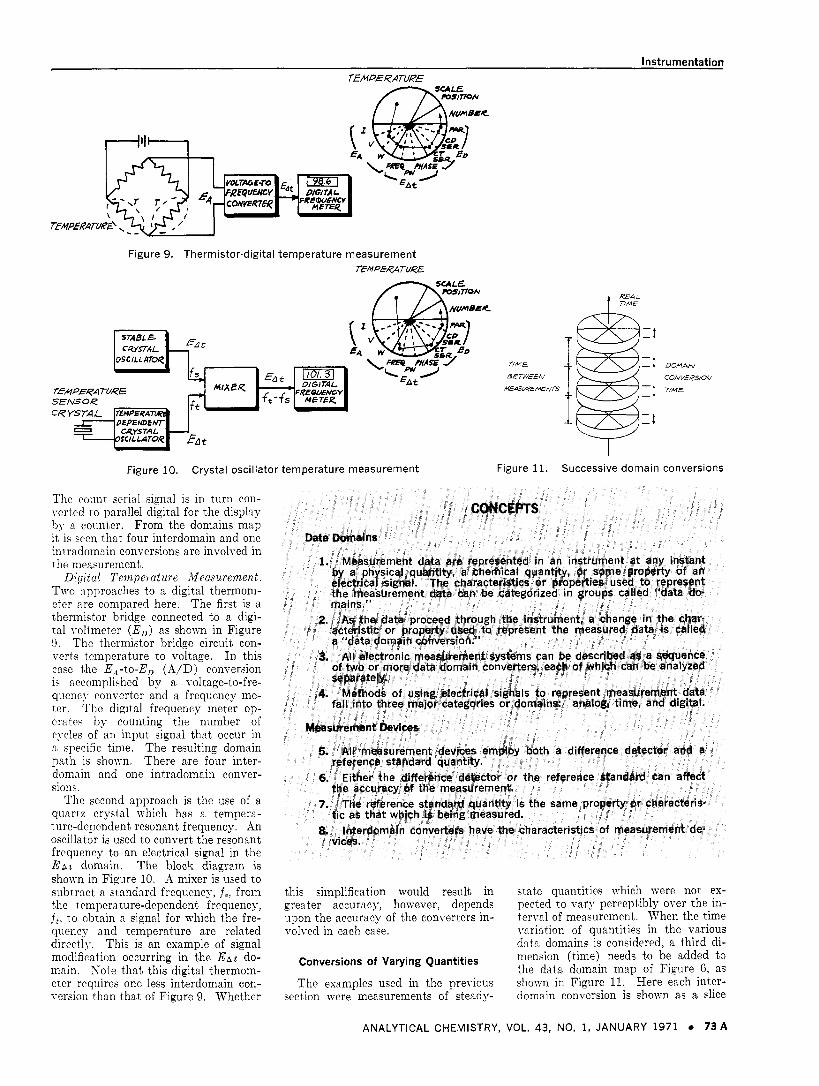
Figure 9. Thermistor-digital temperature measurement TEMPERA TUKE
Figure 10. Crystal oscillator temperature measurement
Tlic count serial signal is in turn coii- verted to parallel digital for the display by a counter. From the domains map it is seen that four interdomain and one intradomain conversions are involved in the measurement.
Digital Temperature Measurement. Two :rpproaches to n digital thermom- eter are compared here. The first is a t,liermistor bridge connected to a digi- tal voltmeter (E,) as shown in Figure 9. The thermistor bridge circuit con- verts temperature to voltage. I n this case t,he E,-to-E, (.4/D) conversion is accomplished by a voltage-to-fre- quency converter and a frequency me- ter. The digital frequency meter op- erates by counting the number of cycles of an input’ signal that occur in n specific time. The resulting domain path is shown. There are four inter- domain and one intradomain conrer- sions.
The second approach is the use of a quartz crystal which has a tempera- ture-dependent resonant frequency. An oscillator is used to convert’ the resonant frequency to a n electrical signal in the EAt domain. The block diagram is shown in Figure 10. A mixer is used to subtract a standard frequency, f,, from t8he temperature-dependent frequency, ft, to obtain n signal for which the fre- quency and temperature are related directly. This is an example of signal modification occurring in tmhe Eat do- main. Yote that this digital thermom- eter requires one less interdomain con- version than that of Figure 9. Whether
Figure 11. Successive domain
DOMAIN
CONV€RSlOU
7/ME
conversions
this simplification would result in state quantities which iyere not ex- greater accuracy, however, depends pected to vary perceptibly over the in- upon the accuracy of the converters in- terval of measurement. When the time volved in each case. variation of quantities in the various
d n t n domains is considered. a third di- Conversions of Varying Quantities menqion (time) needs to be added to
the data domain map of Figure 6, as The examples used in the previous
section were measurements of steady- shown in Figure 11. Here each inter- domain conversion is shown as a slice
ANALYTICAL CHEMISTRY, VOL. 43, NO, 1, JANUARY 1971 7 3 A
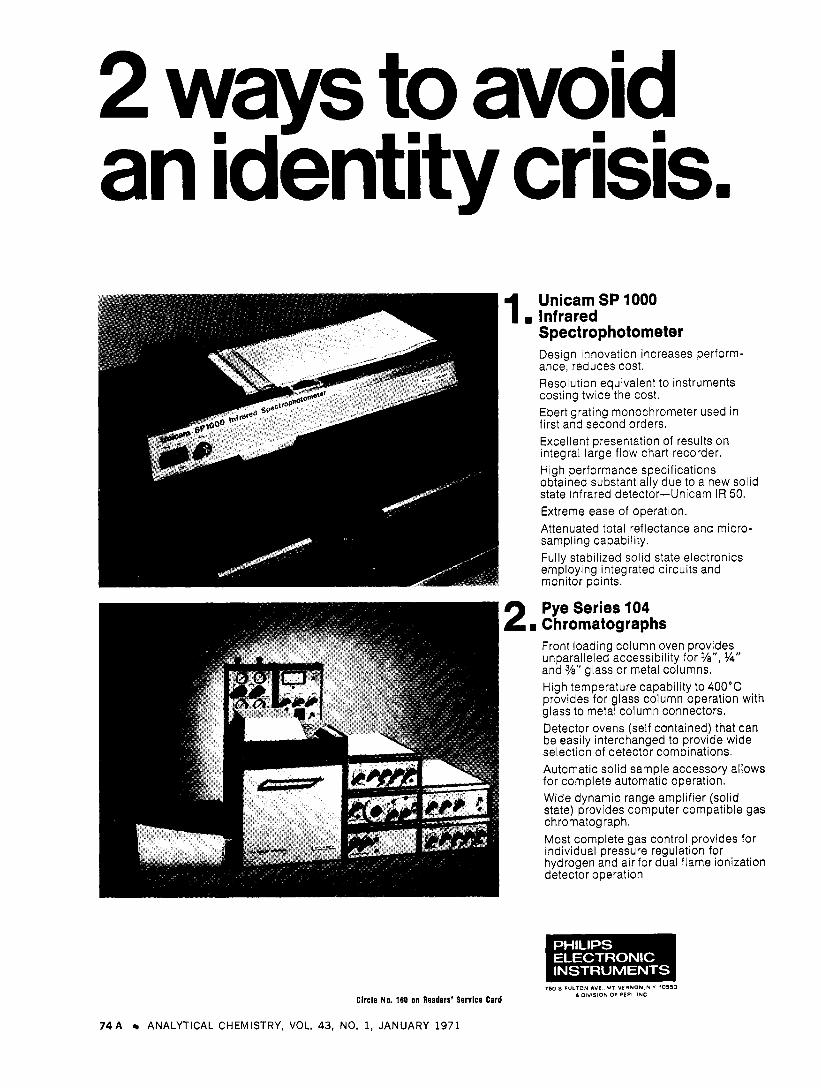
1. Unicam SP 1000 Infrared Spectrophotometer Design innovation increases perform- ance, reduces cost. Resolution equivalent to instruments costing twice the cost. Ebert grating monochrometer used in first and second orders. Excellent presentation of results on integral large flow chart recorder. High performance specifications obtained substantially due to a new solid state Infrared detector-Unicam IR 50. Extreme ease of operation. Attenuated total reflectance and micro- sampling capability. Fully stabilized solid state electronics employing integrated circuits and monitor points.
2. Ciwom iat ographs Pye Series 104
Front loading column oven provides unparalleled accessibility for YE", Y4" and %" glass or metal columns. High temperature capability to 400°C provides for glass column operation with glass to metal column connectors. Detector ovens (self contained) that can be easily interchanged to provide wide selection of detector combinations. Automatic solid sample accessory allows for complete automatic operation. Wide dynamic range amplifier (solid state) provides computer compatible gas chromatograph. Most complete gas control provides for individual pressure regulation for hydrogen and air for dual flame ionization detector operation.
Circle NO. 160 on Readers' Service Card
7 4 A ANALYTICAL CHEMISTRY, VOL. 43, NO. 1, JANUARY 1971
750 s F U L I O N aVE MT VERNON N .I 10550 A OlVlSlON OF PEP1 INC
Instrumentation
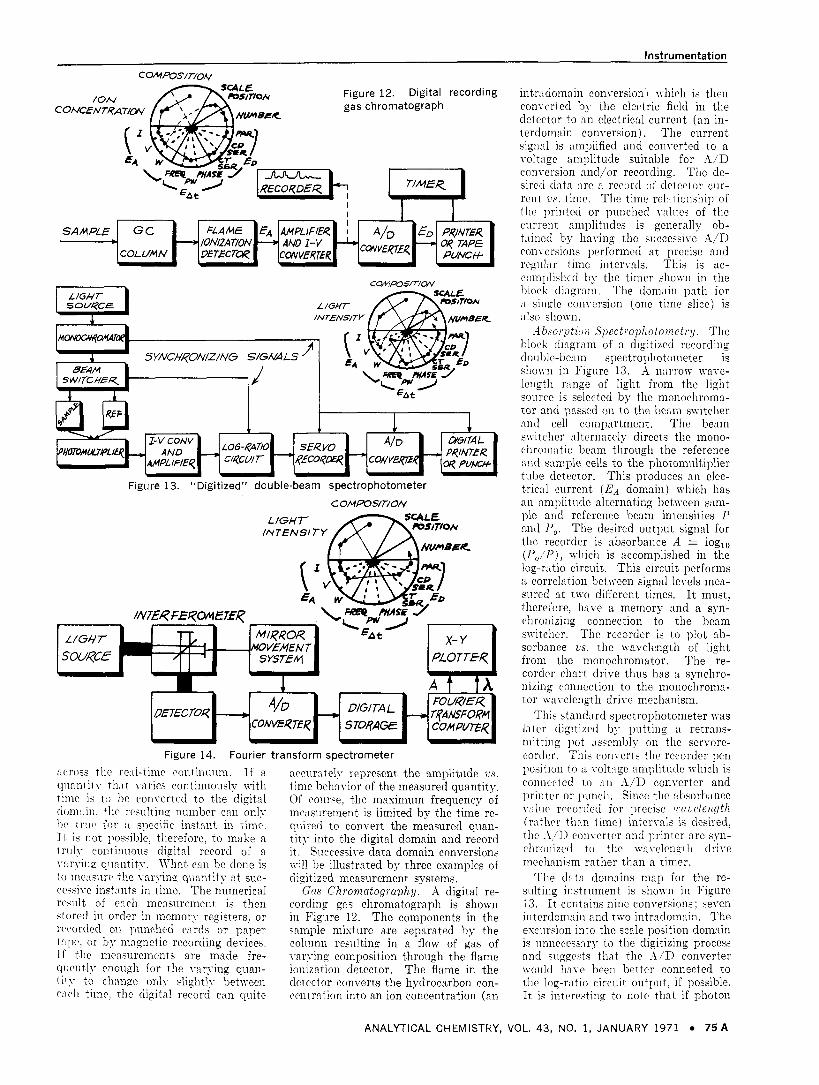
Figure 12. Digital recording gas chromatograph
T/M€K
1 I I U
t
Figure 13. "Digitized" double-beam spectrophotometer
C OMPOS/T/ON
Figure 14. Fourier transform spectrometer
across tlie re:il-time coiitiniiiiin. If a qiinntitj. t'h:it varies continuoiisly with time is to lie converted to the digital d~~ni: i in , t he resulting niiinber c n n only he t rue for n specific instant, in time. I t is not) po,wible, therefore, to make a t,ruly contiiiiious digital record of a v a v i n g quantity. W i a t can be done is to me:isiirp the \-arying qiinntity a t suc- cessive in9t:ints in time. The numerical rewit, of rnch mcasnreinent is then stored in order in memorJ- registers, or recorded on pnnclied cards or paper tnpc, or by mngnetic recording devices. If tlic mcnsiireinents are made fre- qiicntly rnoiigli for tlie varying quan- t i ty to change only slightly between enrli time, the digital record can quite
nccurntely represent the amplitude 2)s.
time behavior of the measured quantity. Of coiirse, the maximum frequency of mc:isiirenient is limited by the time re- qnired to convert t,he measured quan- tity into the digital domain and record it. Successive data domain con~7ersions n-ill be illustrated by three examples of digitized measurement systems.
Gas Chyomatography . A digital re- cording gas chromatograph is shown in Figure 12. The components in the sample mixture are separat,ed by the coliimn resulting in a flow of gas of varFing composition through the flame ionization detector. The flame in the detector converts the hydrocarbon con- centration into an ion concentration (an
intrLidomain conversion I n-liicli is then converted by the electric field in the detector to an electrical current (an in- terdomain conversion). The current signal is amplified and converted to a 1-oltnge amplitude suitable for A/D conversion and/or recording. The de- sired tlnta :ire n rccortl uf detector cur- rent us. time. The time re1:itionship of the printed or piinched vnliies of the current amplitudes is generally ob- t:iined by having the successive A/D conversions performed a t precise mid rcgiilar tinie intervals. This is ac- conipli,~Iied by the tinier slionii in the block diagram. The donxiin path for :I single conversion (one time slice) is also shown.
Absoiptioii S p e c t i o p l i o t o i i i e t ~ y . The block dingram of a digitized recording double-beam spectropliotoineter is s1ion.n in Figure 13. A nnrrow wave- length range of light from the light soiirce is selected by the monocliroina- tor and passcd on to tlic heam sxitcher n n d cell compartment. The beam switcher alternately directs the mono- cliroiiiatic beam through the reference and sample cells to the photomultiplier tube detector. This produces an elec- trical current ( E A domain) ~ h i c l i has an amplitiidc alternating between sam- ple and reference beam intensities P and P o . The desired output signal for tlie recorder is absorbance A = log,, (PJZ'), which is accomplished in tlie log-ratio circuit. This circuit performs a correlntion between signal levels mea- sured a t tn-o different times. It must, therefore, have a memory and n syn- clironizing connection to the beam switcher. The recorder is to plot ab- sorbnnce zls. tlie wavelength of light from the monochromator. The re- corder cliart drive thus has a synchro- nizing coiinection to the monochroma- tor n-avelengtli drive mechanism.
This standnrd spectrophotometer was later digitized by putting a retrans- mitting pot ;isaemlily oii tlie servore- corder. Tliis converts tlie recorder pen position to n volt:tgc :implitudc wliich is connected to n n A/D converter and printer or punch, Since the absorhnnce v:iliic rccorded for prcci>c wauc2erigtl~ (rntlicr tlinn time) intervals is desired, the -I/D converter mid printer are syn- rlironizctl to the wnl-elengtli drive mechanism rather than a timer.
The data doinnins map for the re- sulting instrument is showi in Figure 13. It contains nine conversions; seven interdomain and two intradomnin. The esciiraion into the scale position domain is iinneceps:iry to the digitizing process and suggests tlint tlie .I,'D converter ~voi i ld linve been better coniiected to the log-ratio circuit outpiit, if possible. It is interesting t o note that if photon
ANALYTICAL CHEMISTRY, VOL. 43, NO. 1, JANUARY 1971 7 5 A
SOMEONE YOU SHOULD
KNOW
LET OUR CATALOG G6
INTRODUCE YOU TO THE
WORLD OF PCR.
Are you engaged in Research on FLUORINE containing compounds? Do SILICON organics hold your attention? Catalog G6 contains one of the most complete listings of these compounds to be found anywhere. We’re not limited to these fields of chemistry, many other compounds will be found in t h i s catalog. G6 is more than just a price list, Molecular Weights and Physical Properties are listed for your convenience.
Foryourcopycall904376-7522orwrite
P.O. Box 1466-Cainesville, Florida 32601 PCR, INCORPORATED
Forrnerlv Peninsular ChernResearch Inc
Circle Ra. 147 on Readers’ Service Card
Instrumentation
DJFFE4‘ENcE qEFERENCE position. The quantity measured is ourpur aVrPui-
t t
Figure 15. Basic measurement sys- tem
counting is used to measure the relative intensities, the number of interdomain conversions is reduced to three and a digital log-ratio circuit is required.
Fourier T r a n s f o r m Spec troscopy . A Fourier transform spectrometer is an esample of a conceptually very simple data acquisition system connected to a comples data correlating and processing system. The block diagram is shown in Figure 14. To obtain the interference pattern, t,lie A/D converter converts the detector output signal at’ constant increments of movement of the refer- ence beam mirror. Each piece of data is stored for use in the Fourier t’rans- form calculation. The data domains inn13 as shown is complete for each piece of data as it is acquired and stored. A successive approximations type of X/D converter has been as- sumed in this map. There are four in- tcrdom:iin and tvio intradomnin con- versions in all. After the transform cnlculation (which involves an intercor- relation of all the measured data points) i i complete, a plot of absorbance vs. n.avclengtli can be made.
This esnmple demonstrates that Fourier transformation from nmplit’ude 7’s. time or space to amplitude us. fre- qiicncy (or the reverse) is rexlly an in- tcrcorrclntion of analog signals which 1i:ivc nlrcad>- bccn “mea?iired.” I t i q es- icntial to distingiiish between the data tloiiinin. involvcd in the methods of RC- qiiiring ench data point and the nieth- od. of correlating and displn>-ing groups of t i n t n points.
Errors in Domain Conversions
To understand the sources of error in doinnin conversion, it is helpful to re- vien. hriefl). the hasic measurement proecs+. Mcnsiirement can be defined as: The determinat ioi i of a part icular characteristic of a sample in t e r m s of a nzunber of s tandard uni t s for t h a t char- acteris t ic . The comparison of the quan- tity to b c measiired with standard iiiiits of that qiiantity is implicit in this defi- nition. The comparison concept in meneiirement is illiistrated b!. Figure 15. Thc quantity to be mensnred is com- pared with a reference standard qiian- tit?. The difference is converted to anotlicr form (domain) such ns scale
then the sum of i h e standard units in the reference quantity and the differ- ence output calibrated in t,he same stan- dard units.
All measurement devices involve both a difference detector and a reference standard, although they differ widely in the degree to which one or the ot,her is relied upon in the measurement. As a n esample, three mass measuring devices can be compared in this regard. With a double pan balance, the unknown mass is compared with standard weights, whole units and fractional, un- til the difference det,ector (beam pointer) points to zero. In this case, the accuracy and resolution of the stan- (lard weights determines the accuracy of the measurement as long as the dif- ference detector is sufficiently sensitive. S o accuracy requirement is placed on the off-null calibrations of the difference detector. The other extreme is a spring-loaded scale, such as a fish or bathroom scale. In this case, the ref- crence stnndard weights are used to cal- ibrate tlie scale markings of the manu- fncturer’a original protot,jpe. I n use, thr measurement accuracy depends en- tircly upon the off-null markings on the scale. The reference standard qiiantit’y compared by the scale in this case is zero weight. In b e h e e n t,hese two ex- tremes is the single pan balance with an optical scale for fractional weights. Bilnnccs of this type rely upon accur- : i t? stiintlard wights for the most sig- iiificant figures n n t l upon off-null cali- 1)rfirions for the less significant figures.
Similar comparisonj and anaIyses can t i c made for other typcs of measure- mrnt del-ices. -4 potcntiometric rolt- :ige measiircment dcpends much more iipon the slidcnire (standard voltage iiiiit, adjwtment) calibration than upon the gnlvnnometer niill detector, while nn c1ectric:il nicter depends much more upon tlie difference detector calibra- tions thnn upon the standard. This kind of analysis is helpful in assessing thc soiirccs of errors in measurement clcviccs nntl in c1ioo.ing among avail- able deviccs for a pnrticular applica- tion. After considering n variety of
tcmx in this way, some t in+ conrepts concerning mensiirement tleviccs evolve w h i c h can be added to tlic four data domain. concepts listed earlier.
( 5 ) A11 measiiremcnt devices employ both n diffcrence detector and a refer- ciicc .stantlnrd qiiantit!.. (6) Eitlicr the diffrrence detector o r
tlic refercnce standard cnn affect the ac- ciirncy of the mensiirement,.
(TI The reference standard quantit,y i.: thc snmc property or characteristic as t l i n t which is bring measured.
7 6 A ANALYTICAL CHEMISTRY, VOL. 43, NO. 1, JANUARY 1971
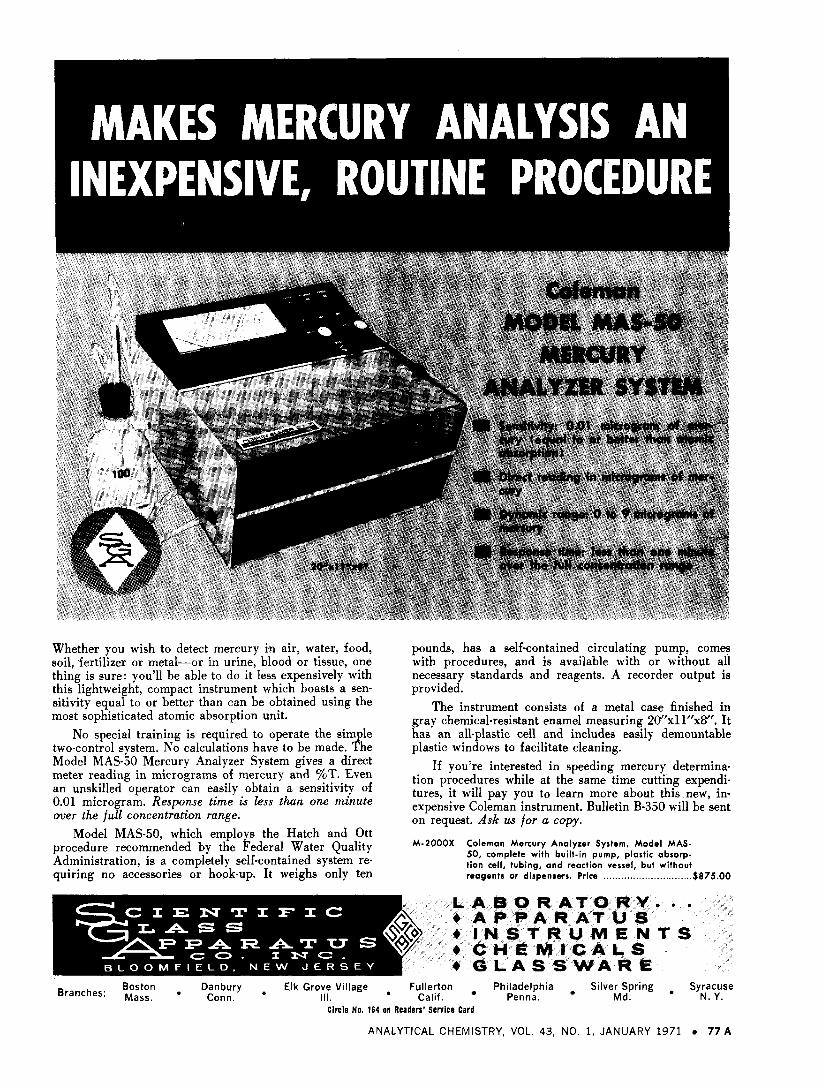
Whether you wish to detect mercury in air, water, food, soil, fertilizer or metal-or in urine, blood or tissue, one thing is sure: you'll be able to do it less expensively with this lightweight, compact instrument which boasts a sen- sitivity equal to or better than can be obtained using the most sophisticated atomic absorption unit.
No special training is required to operate the simple two-control system. No calculations have to be made. The Model MAS-50 Mercury Analyzer System gives a direct meter reading in micrograms of mercury and %T. Even an unskilled operator can easily obtain a sensitivity of 0.01 microgram. Response time is less than one minute mer the full concentration range.
Model MAS-SO, which employs the Hatch and Ott procedure recommended by the Federal Water Quality Administration, is a completely self-contained system re- quir ing n o accessories or hook-up. It weighs only ten
pounds, has a self-contained circulating pump, comes with procedures, and is available with or without all necessary standards and reagents. A recorder output is provided.
The instrument consists of a metal case finished in gray chemical-resistant enamel measuring 20"xll"xkY'. I t has an all-plastic cell and includes easily demountable plastic windows to facilitate cleaning.
If you're interested in speeding mercury determina- tion procedures while at the same time cutting expendi- tures, i t will pay you to learn more about this new, in- expensive Coleman instrument. Bulletin B-350 will be sent on request. Ask us for a copy.
M-2000X Coleman Mercury Analyzer System, Model MAS- 50, complete with built-in pump, plastic absorp- tion cell, tubing, and reaction vessel, but without reagents or dispensers. Price .......................... .... $875.00
Boston . Danbury . Elk Grove Village . Fullerton Philadelphia Silver Spring . Syracuse Branches: Mass. Conn. 111. Calif. Penna. Md. N. Y.
Circle No. 164 on Readers' Service Card
ANALYTICAL CHEMISTRY, VOL. 43, NO. 1, JANUARY 1971 7 7 A
new from Buchler . . . THERMO=LIFT’*
CONTROLLED HEATING B A T H
BUCHLER INSTRUMENTS DlMSlOI m R NUCLEAR-CWICAOO CORP. “STRUMEN’S A SUBSlOlARY OF Q 0 VI & CO 0 1327 SIXTEENTH STREET, FORT LEE, NEW JERSEY, OIOH
Cirri8 No. 23 on Readers’ SOrViCO Card
Instrumentation
A data domain conversion is the con- version of a number of units of some physical, chemical, or electrical char- acteristic into a related number of units of a different characteristic; for in- stance, the conversion of units of pH into Nernst factor potential units by a combination p H electrode. Devices for converting data from one domain to another are “measuring” one character- istic in terms of another. Therefore,
(8) Interdomain converters have the characteristics of measurement devices.
Using a combination p H electrode as an example of an interdomain converter to illustrate concepts 5-7: 5 ) The com- bination p H electrode itself is the differ- ence detector; the reference standard is the standard buffer solution used to “standardize” the voltage output a t a given pH. 6) The conversion error (difference between the predicted and actual potential/pH relationship) de- pends upon the accuracy of the standard solution and upon the accuracy of the electrode response. The greater the pH difference between the standard and un- known solutions, the more the con- version accuracy depends upon the elec- trode’s characteristics. 7 ) The refer- ence standard is pH, the units which are being converted to electrical poten- tial.
Once one is accustomed to looking for the difference detector, reference stan- dard, and accuracy dependence of inter- domain converters, the basis of the con- version and the sources of error are easier to uncover. Every A/D con- verter contains a standard voltage or current source and every At /D con- verter contains a standard clock oscil- lator, as expected from concept 7 above. I n both cases the conversion ac- curacy depends directly upon the stan- dard sources and, for various types, to a greater or lesser degree upon the other converter characteristics.
Conversions of data within domains can often be accomplished with high ac- curacy by simple transfer devices that require no comparison or reference standard. For instance, a resistor can be used to convert current to voltage or vice versa; the shift register will convert between serial digital and par- allel digital domains.
Domain Converter Classification
A classification scheme for data con- version devices would seem desirable for two purposes: to categorize by func- tion the great many devices available, and to provide a way to organize these devices into complete measurement sys- tems. It is natural and useful t o clas- sify converter devices according to the domains which the device converts from
7 8 A ANALYTICAL CHEMISTRY, VOL. 43, NO. 1, JANUARY 1971
OXYGEN
ARGON I
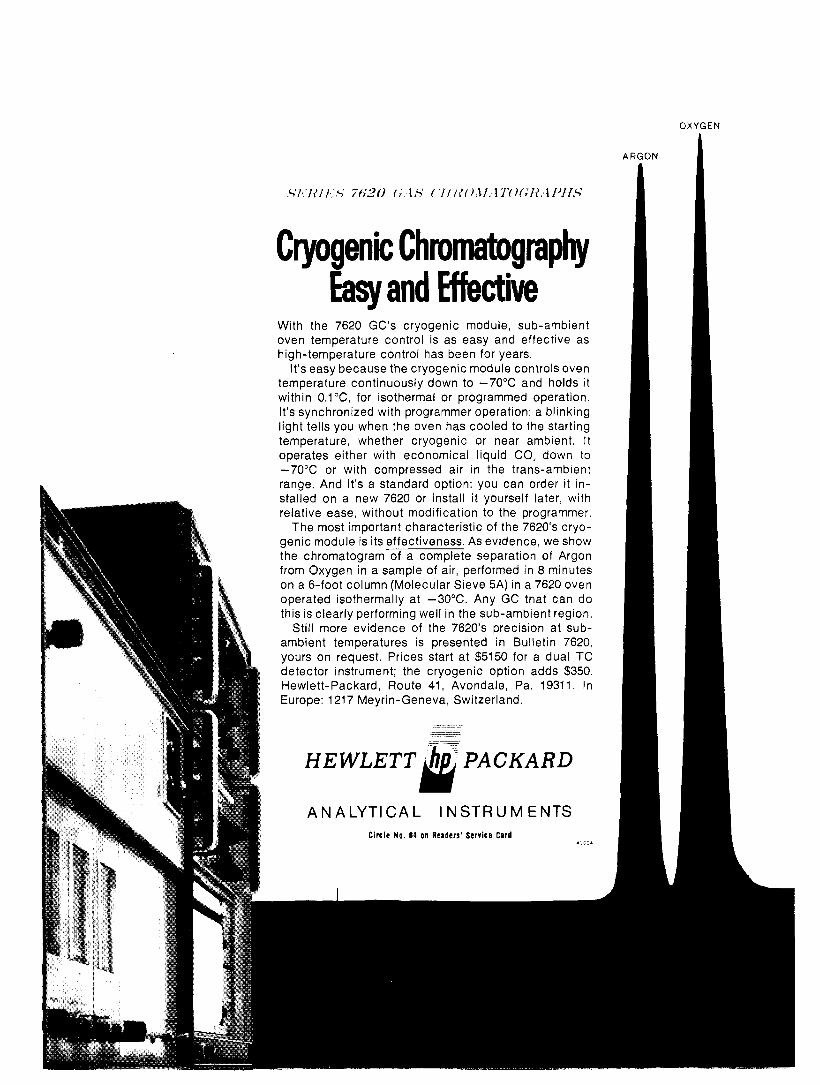
Cryogenic Chromatography -
hsyand Effective With the 7620 GC’s cryogenic module, sub-ambient oven temperature control is as easy and effective as high-temperature control has been for years.
It’s easy because the cryogenic module controls oven temperature continuously down to -70°C and holds i t within 0.1 “C, for isothermal or programmed operation. It’s synchronized with programmer operation: a blinking light tells you when the oven has cooled to the starting temperature, whether cryogenic or near ambient. It operates either with economical liquid CO, down to -70°C or with compressed air in the trans-ambient range. And it’s a standard option: you can order it in- stalled on a new 7620 or install it yourself later, with relative ease, without modification to the programmer.
The most important characteristic of the 7620’s cryo- genic module is its effectiveness. As evidence, we show the chromatogram of a complete separation of Argon from Oxygen in a sample of air, performed in 8 minutes on a 6-foot column (Molecular Sieve 5A) in a 7620 oven operated isothermally at -30°C. Any GC that can do this is clearly performing well in the sub-ambient region.
Still more evidence of the 7620’s precision at sub- ambient temperatures is presented in Bulletin 7620, yours on request. Prices start at $5150 for a dual TC detector instrument; the cryogenic option adds $350. Hewlett-Packard, Route 41, Avondale, Pa. 19311. In Europe: 1217 Meyrin-Geneva, Switzerland.
.-- - .. __ __- -- __ -
HEWLETT PACKARD
A N A LYTl C A L I N ST R U M E NTS C i r c l e No. 84 on Readers’ S e r v i c e Card
4)OCI
1. 2. 3. 4.
5. 6. 7. 8. 9. 10. 11.
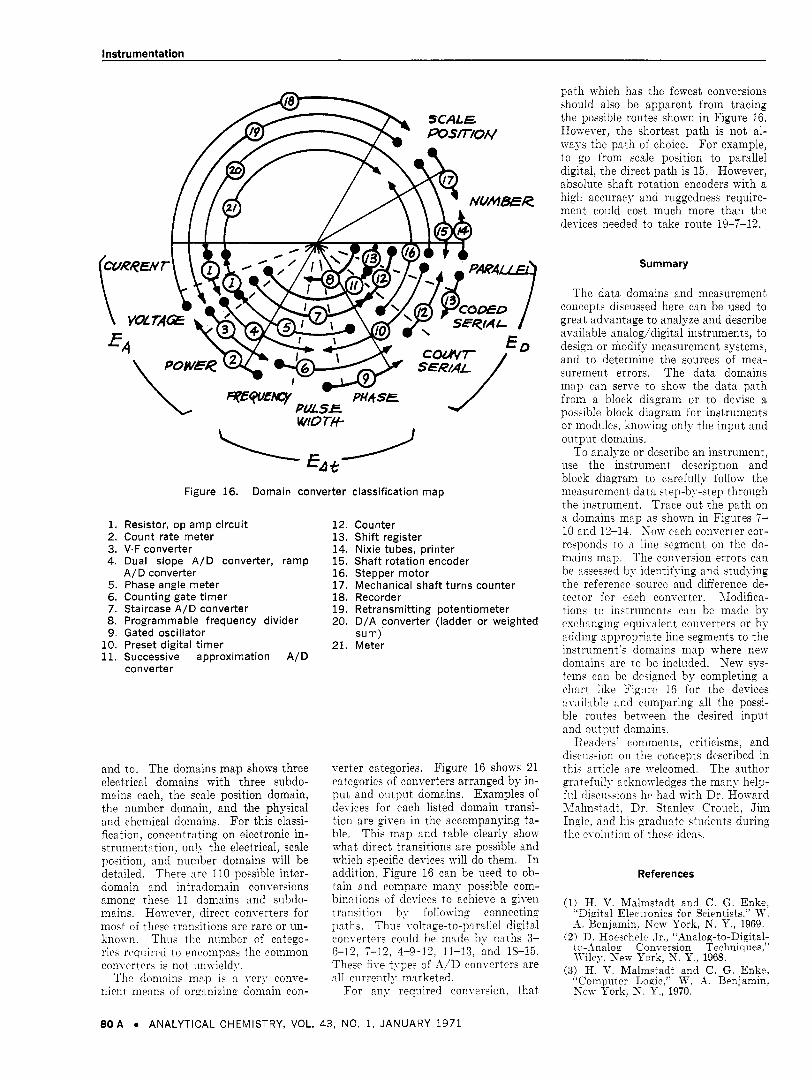
Figure 16. Domain converter classification map
Resistor, op amp circuit Count rate meter V.F converter Dual slope A/D converter, ramp A/D converter Phase angle meter Counting gate t imer Staircase A/D converter Programmable frequency divider Gated oscillator Preset digital t imer Successive approximation A/D converter
and to. The domains map shows three electrical domains with three subdo- mains each, the scale position domain, the number domain, and the physical and chemical domains. For this classi- fication, concentrating on electronic in- strumentation, only the electrical, scale position, and number domains will be detailed. There are 110 possible inter- domain and intradoniain conversions among these 11 domains and subdo- mains. However, direct converters for most of these transitions are rare or un- known. Thus the number of catego- ries required to encompass the common converters is not unwieldy.
The domains map is a very conve- nient means of organizing domain con-
12. 13. 14. 15. 16. 17. 18. 19. 20.
21.
Counter Shift register Nixie tubes, printer Shaft rotation encoder Stepper motor Mechanical shaft turns counter Recorder Retransmitting potentiometer D/A converter (ladder or weighted sum) Meter
verter categories. Figure 16 shows 21 categories of converters arranged by in- put, and output domains. Examples of devices for each listed domain transi- tion are given in the accompanying ta- ble. This map and table clearly shorn what direct transitions are possible and which specific devices will do them. I n addition, Figure 16 can be used to ob- tain and compare many possible com- binations of devices to achieve a given transition by following connecting paths. Thus voltage-to-parallel digital coiivertcrs could be made by paths 3- G-12, 7-12, 4-9-12, 11-13, and 15-15. These five types of A/D converters are all currently marketed.
For any required conversion, that
path which has the fewest conversions ahould also be apparent from tracing the possible routes shown in Figure 16. However, the shortest path is not al- ways the path of choice. For example, t o go from scale position to parallel digital, the direct path is 15. However, absolute shaft rotation encoders with a high accuracy and ruggedness require- ment could cost much more than the devices needed to take route 19-7-12.
Summary
The data domains and measurement concepts discussed here can be used to great advantage to analyze and describe available analog/digital instruments, to design or modify measurement systems, and to determine the sources of mea- surement errors. The data domains map can serve to shorn the data path from a block diagram or to devise a possible block diagram for instruments or modules, knowing only the input and output domains.
To analyze or describe an instrument, use the instrument description and block diagram to carefully follow the measurement, data st ell-by-step through the instrument. Trace out the path on a domains map as shown in Figures 7- 10 and 12-14. S o w each converter cor- responds to a line segment on the do- mains map. The conversion errors can be assessed by identifying and studying the reference source and difference de- tector for each conr-erter. Modifica- tions to instruments can be made by exchanging equivalent converters or by adding appropriate line segments to the instrument’s domains map where new domains are to be included. New sys- tenis can be designed by completing a chart like Figure 1 G for the devices ar-nilable and comparing all the possi- ble rolites between the desired input and output domains.
Readers’ comments, criticisms, and discuszion on the concepts described in this article are welcomed. The author gratefiilly acknowledges the many help- ful discussions he had with Dr. Hoivard llalmqtadt, Dr. Stanley Crouch, Jim Ingle, and his graduate students during the el-ohition of these ideas.
References
(1) H. V. Mslmstadt and C. G. Enke, “Digital Electronics for Scientists.” 1%‘. A. Benjamin, Y e a York, N . Y. , 1969.
(2) D. Hoeachclc Jr.. “4nalog-to-Digital- to-.4nalog Conversion Techniques,” Wiley. Sew York, S. Y., 1968.
(3)( H. V. Malnietadt and C. G. Enke, Computer Logic,” W. A . Benjamin.
Yew York, S. Y. , 1970.
80A ANALYTICAL CHEMISTRY, VOL. 43, NO, 1, JANUARY 1971