Embed Size (px)
Citation preview
GAPI Global Aquaculture Performance IndexAn innovative tool for evaluating and improving the environmental performance of marine aquaculture


GAPI Global Aquaculture Performance IndexAn innovative tool for evaluating and improving the environmental performance of marine aquaculture20
10

ii GAPI Global Aquaculture Performance Index www.gapi.ca
About the Authors And CollAborAtors
The Global Aquaculture Performance Index is a tool developed by the Seafood Ecology Research Group at the University of Victoria, British Columbia, to empower seafood industry leaders and policy makers to make informed decisions about the environ-mental costs and benefits of farmed marine finfish. GAPI uses a well-established statistical methodology to provide a rigorous and objective evaluation of the environmental performance of marine aquaculture globally. The species-country focus of the 2010 GAPI yields results that are most relevant for comparisons of performance across species and countries. Future applications of the GAPI framework will include the development of a farm-level performance index and an evaluation tool to benchmark the environmental performance of current and future aquaculture standards (www.gapi.ca).
The Seafood Ecology Research Group (SERG) at the University of Victoria is an interdisciplinary team whose research is focused on the inevitable challenges arising from the limited capacity of marine systems to produce seafood and the seemingly limitless capac-ity for humans to consume those products. SERG uses scientific approaches to link ecological and social sustainability with regard to marine-based food production systems. SERG publishes broadly in both the scientific and popular literature where its work serves to highlight underlying drivers of contentious seafood conservation debates (web.uvic.ca/~serg/index.html).
The Pew Marine Finfish Aquaculture Standards Project advances the development of precautionary, science-based environmental standards for the conduct of marine finfish aquaculture. The Project recognizes that in order to establish aquaculture practices, purchasing policies, and production standards that lead to real improvements on the water, we must first be able to measure and compare the environmental impacts of these production systems. The Project supports the Global Aquaculture Performance Index (GAPI) as a cutting-edge approach to assessing the industry’s ecological impacts and enabling a thorough comparison of perfor-mance among marine finfish species and producing countries.
suPPorted by
The Lenfest Ocean Program invests in scientific research on the environmental, economic and social impacts of fishing, fisheries management, and aquaculture. Supported research projects result in peer-reviewed publications in leading scientific journals. The Program works with the scientists to ensure that research results are delivered effectively to decision makers and the public, who can take action based on the findings. The program was established in 2004 by the Lenfest Foundation and is managed by the Pew Charitable Trusts (www.lenfestocean.org).
Copyright 2010 John Volpe
Suggested Citation: Volpe, J.P., M. Beck, V. Ethier, J. Gee, A. Wilson. 2010. Global Aquaculture Performance Index. University of Victoria, Victoria, British Columbia, Canada.
Photo Credits: Renée Comet, cover image (tail fin); Alexandra Morton, page 53 and 58; Christopher Reed, page 21; Robert Turner, page 7; John Volpe, pages xii, xiv, 1, 13, 30, 31, 37, 41, 50, 55, 61, 85.

iii GAPI Global Aquaculture Performance Index www.gapi.ca
Foreword�� � � � � � � � � � � � � � � � � � � � � � � � � � � � � � � � � � � � � � � � � � � � � � � � � � � � � � � � � � � � � � � � � � � � � � � � � � � � � � � � � � � � � � � � � � � � � � � � � � � � � � � � � � � � � � � � � � � � � � � � � � � � � � � � � � � � � � � � � � � � � � � � � � � � � � � � � � � � � � � � � � � � � � � � � � � � � � � � � � � � � � � � � � � � � � � � � � iv
Acknowledgements�� � � � � � � � � � � � � � � � � � � � � � � � � � � � � � � � � � � � � � � � � � � � � � � � � � � � � � � � � � � � � � � � � � � � � � � � � � � � � � � � � � � � � � � � � � � � � � � � � � � � � � � � � � � � � � � � � � � � � � � � � � � � � � � � � � � � � � � � � � � � � � � � � � � � � � � � � � � � � � � � � � � � � � � � � � � � � � � v
Executive�Summary�� � � � � � � � � � � � � � � � � � � � � � � � � � � � � � � � � � � � � � � � � � � � � � � � � � � � � � � � � � � � � � � � � � � � � � � � � � � � � � � � � � � � � � � � � � � � � � � � � � � � � � � � � � � � � � � � � � � � � � � � � � � � � � � � � � � � � � � � � � � � � � � � � � � � � � � � � � � � � � � � � � � � � � � � � � � � � � vi
OvervIew��� � � � � � � � � � � � � � � � � � � � � � � � � � � � � � � � � � � � � � � � � � � � � � � � � � � � � � � � � � � � � � � � � � � � � � � � � � � � � � � � � � � � � � � � � � � � � � � � � � � � � � � � � � � � � � � � � � � � � � � � � � � � � � � � � � � � � � � � � � � � � � � � � � � � � � � � � � � � � � � � � � � � � � � � � � � � � � � � � � � � � � � � � � � � � � � � � �1Methods�� � � � � � � � � � � � � � � � � � � � � � � � � � � � � � � � � � � � � � � � � � � � � � � � � � � � � � � � � � � � � � � � � � � � � � � � � � � � � � � � � � � � � � � � � � � � � � � � � � � � � � � � � � � � � � � � � � � � � � � � � � � � � � � � � � � � � � � � � � � � � � � � � � � � � � � � � � � � � � � � � � � � � � � � � � � � � � � � � � � � � � � � � � � � � � � � � � � �2
Species�and�Country�Selection�� � � � � � � � � � � � � � � � � � � � � � � � � � � � � � � � � � � � � � � � � � � � � � � � � � � � � � � � � � � � � � � � � � � � � � � � � � � � � � � � � � � � � � � � � � � � � � � � � � � � � � � � � � � � � � � � � � � � � � � � � � � � � � � � � � � � � � � � � � � � � � � � � � � � � � � � � � �11
Summary�of�Results�� � � � � � � � � � � � � � � � � � � � � � � � � � � � � � � � � � � � � � � � � � � � � � � � � � � � � � � � � � � � � � � � � � � � � � � � � � � � � � � � � � � � � � � � � � � � � � � � � � � � � � � � � � � � � � � � � � � � � � � � � � � � � � � � � � � � � � � � � � � � � � � � � � � � � � � � � � � � � � � � � � � � � � � � � � � � 14
Conclusions�� � � � � � � � � � � � � � � � � � � � � � � � � � � � � � � � � � � � � � � � � � � � � � � � � � � � � � � � � � � � � � � � � � � � � � � � � � � � � � � � � � � � � � � � � � � � � � � � � � � � � � � � � � � � � � � � � � � � � � � � � � � � � � � � � � � � � � � � � � � � � � � � � � � � � � � � � � � � � � � � � � � � � � � � � � � � � � � � � � � � � � � � � � 29
IndIcAtOrs�� � � � � � � � � � � � � � � � � � � � � � � � � � � � � � � � � � � � � � � � � � � � � � � � � � � � � � � � � � � � � � � � � � � � � � � � � � � � � � � � � � � � � � � � � � � � � � � � � � � � � � � � � � � � � � � � � � � � � � � � � � � � � � � � � � � � � � � � � � � � � � � � � � � � � � � � � � � � � � � � � � � � � � � � � � � � � � � � � � � � � � � � � � � � � 31
Contents
Capture-Based�Aquaculture�CAP��� � � � � � � � � � � � � � � � � � � � � � � � � � � � � � � � � � � � � � � � � � � � � � � � � � � � � � � � � � � � � � � � � � � � � � � � � � � � � � � � � � � � � � � � � � � � � � � � � � � � � � � � � � � � � � � � � � � � � � � � � � � � � � � � � � � � � � � � � 33
Ecological�Energy�ECOE��� � � � � � � � � � � � � � � � � � � � � � � � � � � � � � � � � � � � � � � � � � � � � � � � � � � � � � � � � � � � � � � � � � � � � � � � � � � � � � � � � � � � � � � � � � � � � � � � � � � � � � � � � � � � � � � � � � � � � � � � � � � � � � � � � � � � � � � � � � � � � � � � � � � � � � � � � �37
Industrial�Energy�INDE�� � � � � � � � � � � � � � � � � � � � � � � � � � � � � � � � � � � � � � � � � � � � � � � � � � � � � � � � � � � � � � � � � � � � � � � � � � � � � � � � � � � � � � � � � � � � � � � � � � � � � � � � � � � � � � � � � � � � � � � � � � � � � � � � � � � � � � � � � � � � � � � � � � � � � � � � � � � � 39
Sustainability�of�Feed�FEED��� � � � � � � � � � � � � � � � � � � � � � � � � � � � � � � � � � � � � � � � � � � � � � � � � � � � � � � � � � � � � � � � � � � � � � � � � � � � � � � � � � � � � � � � � � � � � � � � � � � � � � � � � � � � � � � � � � � � � � � � � � � � � � � � � � � � � � � � � � � � � � � � � � � 41
Antibiotics�ANTI�� � � � � � � � � � � � � � � � � � � � � � � � � � � � � � � � � � � � � � � � � � � � � � � � � � � � � � � � � � � � � � � � � � � � � � � � � � � � � � � � � � � � � � � � � � � � � � � � � � � � � � � � � � � � � � � � � � � � � � � � � � � � � � � � � � � � � � � � � � � � � � � � � � � � � � � � � � � � � � � � � � � � � � � � 45
Antifoulants�(Copper)�COP��� � � � � � � � � � � � � � � � � � � � � � � � � � � � � � � � � � � � � � � � � � � � � � � � � � � � � � � � � � � � � � � � � � � � � � � � � � � � � � � � � � � � � � � � � � � � � � � � � � � � � � � � � � � � � � � � � � � � � � � � � � � � � � � � � � � � � � � � � � � � � � � � � � � � 48
Biochemical�Oxygen�Demand�BOD��� � � � � � � � � � � � � � � � � � � � � � � � � � � � � � � � � � � � � � � � � � � � � � � � � � � � � � � � � � � � � � � � � � � � � � � � � � � � � � � � � � � � � � � � � � � � � � � � � � � � � � � � � � � � � � � � � � � � � � � � � � � � � � � � � � � � � � 50
Parasiticides�PARA��� � � � � � � � � � � � � � � � � � � � � � � � � � � � � � � � � � � � � � � � � � � � � � � � � � � � � � � � � � � � � � � � � � � � � � � � � � � � � � � � � � � � � � � � � � � � � � � � � � � � � � � � � � � � � � � � � � � � � � � � � � � � � � � � � � � � � � � � � � � � � � � � � � � � � � � � � � � � � � � � � � 53
Escapes�ESC�� � � � � � � � � � � � � � � � � � � � � � � � � � � � � � � � � � � � � � � � � � � � � � � � � � � � � � � � � � � � � � � � � � � � � � � � � � � � � � � � � � � � � � � � � � � � � � � � � � � � � � � � � � � � � � � � � � � � � � � � � � � � � � � � � � � � � � � � � � � � � � � � � � � � � � � � � � � � � � � � � � � � � � � � � � � � � � 55
Pathogens�PATH��� � � � � � � � � � � � � � � � � � � � � � � � � � � � � � � � � � � � � � � � � � � � � � � � � � � � � � � � � � � � � � � � � � � � � � � � � � � � � � � � � � � � � � � � � � � � � � � � � � � � � � � � � � � � � � � � � � � � � � � � � � � � � � � � � � � � � � � � � � � � � � � � � � � � � � � � � � � � � � � � � � � � � � 58
Atlantic�cod�� � � � � � � � � � � � � � � � � � � � � � � � � � � � � � � � � � � � � � � � � � � � � � � � � � � � � � � � � � � � � � � � � � � � � � � � � � 64
Atlantic�salmon�� � � � � � � � � � � � � � � � � � � � � � � � � � � � � � � � � � � � � � � � � � � � � � � � � � � � � � � � � � � � � � � � � � � � �65
Barramundi�� � � � � � � � � � � � � � � � � � � � � � � � � � � � � � � � � � � � � � � � � � � � � � � � � � � � � � � � � � � � � � � � � � � � � � � � � � � �66
Bastard�halibut�� � � � � � � � � � � � � � � � � � � � � � � � � � � � � � � � � � � � � � � � � � � � � � � � � � � � � � � � � � � � � � � � � � � � � 67
Chinook�salmon�� � � � � � � � � � � � � � � � � � � � � � � � � � � � � � � � � � � � � � � � � � � � � � � � � � � � � � � � � � � � � � � � � � � 68
Cobia�� � � � � � � � � � � � � � � � � � � � � � � � � � � � � � � � � � � � � � � � � � � � � � � � � � � � � � � � � � � � � � � � � � � � � � � � � � � � � � � � � � � � � � �69
Coho�salmon�� � � � � � � � � � � � � � � � � � � � � � � � � � � � � � � � � � � � � � � � � � � � � � � � � � � � � � � � � � � � � � � � � � � � � � � � � � 70
European�seabass�� � � � � � � � � � � � � � � � � � � � � � � � � � � � � � � � � � � � � � � � � � � � � � � � � � � � � � � � � � � � � � � � � 71
Flathead�grey�mullet�� � � � � � � � � � � � � � � � � � � � � � � � � � � � � � � � � � � � � � � � � � � � � � � � � � � � � � � � � � � 72
Gilthead�seabream��� � � � � � � � � � � � � � � � � � � � � � � � � � � � � � � � � � � � � � � � � � � � � � � � � � � � � � � � � � � � � � 73
Groupers�� � � � � � � � � � � � � � � � � � � � � � � � � � � � � � � � � � � � � � � � � � � � � � � � � � � � � � � � � � � � � � � � � � � � � � � � � � � � � � � � � 74
Japanese�amberjack�� � � � � � � � � � � � � � � � � � � � � � � � � � � � � � � � � � � � � � � � � � � � � � � � � � � � � � � � � � � 75
Japanese�seabass�� � � � � � � � � � � � � � � � � � � � � � � � � � � � � � � � � � � � � � � � � � � � � � � � � � � � � � � � � � � � � � � � 76
Korean�rockfish�� � � � � � � � � � � � � � � � � � � � � � � � � � � � � � � � � � � � � � � � � � � � � � � � � � � � � � � � � � � � � � � � � � � � � 77
Large�yellow�croaker�� � � � � � � � � � � � � � � � � � � � � � � � � � � � � � � � � � � � � � � � � � � � � � � � � � � � � � � � � � � 78
Milkfish�� � � � � � � � � � � � � � � � � � � � � � � � � � � � � � � � � � � � � � � � � � � � � � � � � � � � � � � � � � � � � � � � � � � � � � � � � � � � � � � � � � � 79
Red�drum��� � � � � � � � � � � � � � � � � � � � � � � � � � � � � � � � � � � � � � � � � � � � � � � � � � � � � � � � � � � � � � � � � � � � � � � � � � � � � � 80
Red�seabream��� � � � � � � � � � � � � � � � � � � � � � � � � � � � � � � � � � � � � � � � � � � � � � � � � � � � � � � � � � � � � � � � � � � � � � �81
Tiger�pufferfish�� � � � � � � � � � � � � � � � � � � � � � � � � � � � � � � � � � � � � � � � � � � � � � � � � � � � � � � � � � � � � � � � � � � � �82
Turbot�� � � � � � � � � � � � � � � � � � � � � � � � � � � � � � � � � � � � � � � � � � � � � � � � � � � � � � � � � � � � � � � � � � � � � � � � � � � � � � � � � � � � �83
Australia�� � � � � � � � � � � � � � � � � � � � � � � � � � � � � � � � � � � � � � � � � � � � � � � � � � � � � � � � � � � � � � � � � � � � � � � � � � � � � � � � 88
Canada�� � � � � � � � � � � � � � � � � � � � � � � � � � � � � � � � � � � � � � � � � � � � � � � � � � � � � � � � � � � � � � � � � � � � � � � � � � � � � � � � � � � �89
Chile�� � � � � � � � � � � � � � � � � � � � � � � � � � � � � � � � � � � � � � � � � � � � � � � � � � � � � � � � � � � � � � � � � � � � � � � � � � � � � � � � � � � � � � � 90
China�� � � � � � � � � � � � � � � � � � � � � � � � � � � � � � � � � � � � � � � � � � � � � � � � � � � � � � � � � � � � � � � � � � � � � � � � � � � � � � � � � � � � � � � �91
Egypt�� � � � � � � � � � � � � � � � � � � � � � � � � � � � � � � � � � � � � � � � � � � � � � � � � � � � � � � � � � � � � � � � � � � � � � � � � � � � � � � � � � � � � � �92
France�� � � � � � � � � � � � � � � � � � � � � � � � � � � � � � � � � � � � � � � � � � � � � � � � � � � � � � � � � � � � � � � � � � � � � � � � � � � � � � � � � � � � �93
Greece�� � � � � � � � � � � � � � � � � � � � � � � � � � � � � � � � � � � � � � � � � � � � � � � � � � � � � � � � � � � � � � � � � � � � � � � � � � � � � � � � � � � � �94
Iceland�� � � � � � � � � � � � � � � � � � � � � � � � � � � � � � � � � � � � � � � � � � � � � � � � � � � � � � � � � � � � � � � � � � � � � � � � � � � � � � � � � � � �95
Indonesia�� � � � � � � � � � � � � � � � � � � � � � � � � � � � � � � � � � � � � � � � � � � � � � � � � � � � � � � � � � � � � � � � � � � � � � � � � � � � � � � �96
Israel�� � � � � � � � � � � � � � � � � � � � � � � � � � � � � � � � � � � � � � � � � � � � � � � � � � � � � � � � � � � � � � � � � � � � � � � � � � � � � � � � � � � � � � �97
Italy�� � � � � � � � � � � � � � � � � � � � � � � � � � � � � � � � � � � � � � � � � � � � � � � � � � � � � � � � � � � � � � � � � � � � � � � � � � � � � � � � � � � � � � � � 98
Japan�� � � � � � � � � � � � � � � � � � � � � � � � � � � � � � � � � � � � � � � � � � � � � � � � � � � � � � � � � � � � � � � � � � � � � � � � � � � � � � � � � � � � � �99
Korea,�Republic�of�� � � � � � � � � � � � � � � � � � � � � � � � � � � � � � � � � � � � � � � � � � � � � � � � � � � � � � � � � � � � � � 100
Malaysia�� � � � � � � � � � � � � � � � � � � � � � � � � � � � � � � � � � � � � � � � � � � � � � � � � � � � � � � � � � � � � � � � � � � � � � � � � � � � � � � � 101
New�Zealand�� � � � � � � � � � � � � � � � � � � � � � � � � � � � � � � � � � � � � � � � � � � � � � � � � � � � � � � � � � � � � � � � � � � � � � � � 102
Norway�� � � � � � � � � � � � � � � � � � � � � � � � � � � � � � � � � � � � � � � � � � � � � � � � � � � � � � � � � � � � � � � � � � � � � � � � � � � � � � � � � 103
Philippines�� � � � � � � � � � � � � � � � � � � � � � � � � � � � � � � � � � � � � � � � � � � � � � � � � � � � � � � � � � � � � � � � � � � � � � � � � � � 104
Spain�� � � � � � � � � � � � � � � � � � � � � � � � � � � � � � � � � � � � � � � � � � � � � � � � � � � � � � � � � � � � � � � � � � � � � � � � � � � � � � � � � � � � � 105
Taiwan,�Republic�of�China�� � � � � � � � � � � � � � � � � � � � � � � � � � � � � � � � � � � � � � � � � � � � � � � � � 106
Thailand�� � � � � � � � � � � � � � � � � � � � � � � � � � � � � � � � � � � � � � � � � � � � � � � � � � � � � � � � � � � � � � � � � � � � � � � � � � � � � � � � 107
Turkey�� � � � � � � � � � � � � � � � � � � � � � � � � � � � � � � � � � � � � � � � � � � � � � � � � � � � � � � � � � � � � � � � � � � � � � � � � � � � � � � � � � � 108
United�Kingdom��� � � � � � � � � � � � � � � � � � � � � � � � � � � � � � � � � � � � � � � � � � � � � � � � � � � � � � � � � � � � � � � � � 109
references�� � � � � � � � � � � � � � � � � � � � � � � � � � � � � � � � � � � � � � � � � � � � � � � � � � � � � � � � � � � � � � � � � � � � � � � � � � � � � � � � � � � � � � � � � � � � � � � � � � � � � � � � � � � � � � � � � � � � � � � � � � � � � � � � � � � � � � � � � � � � � � � � � � � � � � � � � � � � � � � � � � � � � � � � � � � � � � � � � � � � � � � � � � 111
sPecIes�resULts�� � � � � � � � � � � � � � � � � � � � � � � � � � � � � � � � � � � � � � � � � � � � � � � � � � � � � � � � � � � � � � � � � � � � � � � � � � � � � � � � � � � � � � � � � � � � � � � � � � � � � � � � � � � � � � � � � � � � � � � � � � � � � � � � � � � � � � � � � � � � � � � � � � � � � � � � � � � � � � � � � � � � � � � � � � � � � � � � � 61
cOUntry�resULts�� � � � � � � � � � � � � � � � � � � � � � � � � � � � � � � � � � � � � � � � � � � � � � � � � � � � � � � � � � � � � � � � � � � � � � � � � � � � � � � � � � � � � � � � � � � � � � � � � � � � � � � � � � � � � � � � � � � � � � � � � � � � � � � � � � � � � � � � � � � � � � � � � � � � � � � � � � � � � � � � � � � � � � � � � � � � � � 85
INPUTS
DIS
CH
ARGES
BIO
LOGIC
AL
iv GAPI Global Aquaculture Performance Index www.gapi.ca
2010: For the first time in human history, the majority of the world’s seafood will be grown on farms, rather than caught in the wild. Looking to the future, fish farming will inevitably play an increasingly important role in global food supplies, providing a nutritious source of protein to billions of people around the world. However, the growth of the global aquaculture industry also poses grave risks to the marine and freshwater environments. If ill-conceived, expansion of the aquaculture industry could cause serious environmental harms, from chemical pollution to the invasion of non-native species.
The rapid expansion of aquaculture worldwide that is underway today requires careful oversight. Balancing the potential growth of the industry with the protection of the marine environment is an enormous challenge. It is essential to have useful data to guide policy makers as they grapple with the complexities of this issue. The Global Aquaculture Performance Index (GAPI) is a laudable contribution by John Volpe and his team of research-ers at the University of Victoria, British Columbia, to a more comprehensive understanding of the environmental performance of marine aquaculture globally.
Over the past decades my colleagues at Yale and Columbia universities have pioneered and refined a methodol-ogy to compare the overall environmental performance of countries: the Environmental Performance Index (EPI). EPI can be used to collect and synthesize a wide range of environmental information, thereby supporting the move toward a more data-driven, performance-based approach to environmental protection. By enabling policy makers to spot problems, track trends, highlight policy successes and failures, identify best practices, and optimize the gains from investments in environmental protection, EPI provides a powerful tool for steering individual countries and the world as a whole toward environmental sustainability.
GAPI represents a breakthrough application of the EPI approach to a specific environmental issue: marine finfish aquaculture. Employing the core statistical methodology developed and refined by EPI, GAPI focuses exclusively on the performance of marine aquaculture around the globe. Dr. Volpe and his colleagues at the University of Victoria have identified the main environmental issues linked to aquaculture, carefully selected a suite of critical indicators, and compiled the best available data sets in order to create the first synthesis of global marine aquaculture performance.
The results are illuminating. The GAPI study not only benchmarks leaders and laggards in the field, but it also shines a spotlight on specific areas of environmental performance on which policy makers should focus their attention. The EPI initiative has demonstrated clearly that data accessibility, quality, and verification fall short of what is required by decision makers to craft robust environmental policies. GAPI has faced similar challenges, highlighting the need to invest in better and more transparent information within the marine aquaculture industry. By enhancing our ability to compare across countries, farmed species, and environmental issues, I believe that GAPI can help aquaculture chart a course towards sustainability.
dr. daniel esty
Yale University, Hillhouse Professor of Environmental Law and Policy
Foreword
v GAPI Global Aquaculture Performance Index www.gapi.ca
Acknowledgements
Authors: seafood ecology research Group, university of Victoria, british Columbia
John VolpePrincipal Investigator
Martina BeckResearch Associate
Valerie EthierResearch Associate
Jennifer GeeResearch Associate
Amanda WilsonResearch Associate
edited by
Sally Koch Kubetin
research staff: seafood ecology research Group, university of Victoria, british Columbia
Alina FisherLab Manager
Jenna StonerResearch Assistant
Erin WebbResearch Assistant
supported by: lenfest ocean Program
In Collaboration with: Pew Marine Finfish Aquaculture standards Project
Christopher MannSenior Officer
Hank CauleySenior Officer
Rachel HopkinsManager
Advisory Committee
Katherine BostickWorld Wildlife Fund (WWF)
Peter BridsonMonterey Bay Aquarium
Carrie BrownsteinWhole Foods Market
Alice ChiuStanford University
Matthew ElliottCalifornia Environmental Associates
Rebecca Goldburg, Ex officio memberPew Marine Science
George LeonardOcean Conservancy
Corey PeetDavid Suzuki Foundation
Helene YorkBon Appétit Management Company Foundation
expert Contributors
Vicki BlazerUnited States Geological Survey (USGS)
Claude BoydAuburn University
Alejandro BuschmannUniversidad de Los Lagos
Alex de SherbininColumbia University
Daniel EstyYale University
Jennifer FordDepartment of Fisheries and Oceans Canada
Christine KimYale University
Kevin LaffertyUnited States Geological Survey (USGS)/University of California, Santa Barbara
Astrid ScholzEcotrust
Tanja SrebotnjakEcologic Institute
Peter TyedmersDalhousie University
Judith WeisRutgers University

vi GAPI Global Aquaculture Performance Index www.gapi.ca
sSustainability is a growing priority for most seafood professionals, whether they are producers, regulators, buyers, or others in the seafood industry. With an increasing dependence on aquaculture to fill the growing demand for seafood, numerous questions have arisen regarding the environmental impact of these production systems. To chart a sustainable path forward, it is imperative that decision makers have a rigorous, yet efficient way to quantify and compare the environmental impacts of seafood products. Measuring the actual impacts of aquaculture has proven difficult, however. These challenges stem from a scarcity of data, inconsistent reporting, incomplete science, a wide range of environmental impacts across vastly different production regions, and an ever-evolving definition of sustainability.
The Global Aquaculture Performance Index (GAPI) is a new assessment tool that has been developed with this dilemma in mind. GAPI’s main objective is to condense current scientific understanding and aquaculture data into a sound, yet simple score of the environmental performance of marine finfish aquaculture. In addition to provid-ing a single measure of performance, GAPI empowers the seafood sector with a tool to compare environmental impacts quantitatively across marine finfish aquaculture, identify better performers, and highlight potential solutions. Through the development of this tool, GAPI has amassed what is arguably the most comprehensive set of data on the ecological impacts of global marine finfish aquaculture production.
One of the major advantages of GAPI is its ability to compare both normalised and cumulative performance. Normalised scores, which are the focus of the GAPI report, measure the intensity of environmental impacts per unit of production. These scores level the playing field among producers of all sizes, so that direct comparisons can be made across countries or species regardless of the scale of production. These scores can assist policy makers in developing regulations that can improve the performance of the industry relative to their peers. In contrast, cumulative scores, which look at the overall impact of aquaculture production, encourage policy makers to grapple with important questions of industry scale and carrying capacity in their region.
Developing a framework to measure the actual performance of marine finfish aquaculture production globally has been no small feat. We have spent more than two years refining the GAPI methodology, defining ecological indicators, and collecting and transforming environmental data. This effort has involved substantial input from over 30 experts, including biologists, statisticians, seafood buyers, and a number of individuals engaged in the assessment of seafood sustainability. In addition, the GAPI methodology has been submitted for publication in the peer-reviewed literature.
Why MArIne FInFIsh AquACulture?
GAPI 2010 focuses solely on marine finfish aquaculture. Although this sector represents a modest portion of aquaculture production globally, the environmental impacts of the industry, such as dependence on wild fish for feed, the introduction and spread of invasive species, and marine pollution, are disproportionately large. The unprecedented and ongoing expansion of marine finfish aquaculture, coupled with the growing attention
executive summary

vii GAPI Global Aquaculture Performance Index www.gapi.ca
to both understanding and mitigating the environmental impacts of these farming systems, makes marine finfish aquaculture a strong candidate for GAPI assessment.
GAPI is designed to be a global assessment of marine finfish aquaculture. It currently assesses the top 20 marine finfish aquaculture species (by mT), which comprise 93.7% of global marine finfish aquaculture by weight and 91.0% by value (FAO 2008) (Figure 1).
tAkInG A dAtA-drIVen, quAntItAtIVe APProACh to eVAluAtInG PerForMAnCe
Over the past few years, there has been a shift in the way environmental sustainability of food production is assessed. Decision makers are now placing greater emphasis on quantitative measures of environmental impact instead of relying on more theoretical, qualitative assessments. One recent example is the Keystone Center’s Field to Market study, which measures the impact of crop production against a set of sustainability indicators (Keystone Center 2009). In the seafood sector, a project conducted by Dalhousie University, Ecotrust, and The Swedish Institute for Food and Biotechnology has used the Life Cycle Analysis methodology to assess a variety of global salmon production systems (Ayer and Tyedmers 2009; Pelletier et al. 2009).
More broadly, Yale and Columbia universities have partnered on the development of a statistical tool, the Environmental Performance Index (EPI), which tracks the performance of 163 countries across 10 categories covering both environmental health and ecosystem vitality. EPI indicates which countries perform best across an array of environmental criteria and allows users to drill down into the data to assess performance within each country, region, policy category, or specific impact area (Emerson et al. 2010). EPI, which is presented biennially at the World Economic Forum meeting in Davos, Switzerland, has transformed the way in which global environ-mental performance is measured and compared.
Figure 1: the Proportion of Global Aquaculture Production Assessed by GAPI
% OF PRODUCTION (mT) ASSESSED BY GAPI
93.7%
FRESHWATER AQUACULTURE57.7%
OTHER MARINE AQUACULTURE35.3%
MARINE FINFISH AQUACULTURE7.0%
% OF PRODUCTION (mT) NOT ASSESSED BY GAPI
6.3%

viii GAPI Global Aquaculture Performance Index www.gapi.ca
Building on the EPI methodology, GAPI applies a similar approach focused on marine finfish aquaculture. Like EPI, GAPI scores performance on a scale of 0 to 100, where a higher score indicates better overall performance. Performance is measured across 10 indicators of environmental impact, which have been selected based on a survey of the ecological impacts addressed in current aquaculture assessment initiatives, including purchasing standards, industry-sponsored standards, seafood guides, and third-party certification programs (Table 1). While there are no universal criteria for the formulation of these indicators, careful attention was paid to ensuring that
the indicator formulas were scientifically sound, comprehensible, and could be populated with publicly available data. Expert workshops were convened to assist in refining especially problematic or complex indicators such as waste discharges, chemical use and discharges, and pathogens.
To determine where performers fall within the 0 to 100 scale, absolute best (100) and worst (0) performance must be defined. Setting the best performance bar is straightforward, as the best any performer can do is to have absolutely no environmental impact. While zero-impact targets may be unrealistic as farming standards, GAPI provides crucial information regarding how close marine finfish aquaculture comes to meeting an ideal performance (zero-impact) and allows users to track real progress or decline in performance against fixed, aspirational targets.
Determining worst performance (i.e., a score of 0) is trickier, as a production system could perform infinitely poorly within all indicators. To solve this dilemma, GAPI reviews the pool of performance data and uses the worst actual performance in each indicator to set the worst performance benchmark (0). Thus, like a classroom grading system, GAPI grades on a curve, where a performer’s GAPI score is partially dependent on the performance of the pool of players among which it is being assessed. To achieve a perfect score (100), a performer must attain the zero-impact target in each of the 10 indicators.
Since GAPI assesses each performer relative to its peers, the inclusion of additional species or different types of production systems (e.g., polyculture, recirculating systems) would realign GAPI scores. To this end, the next phase of GAPI will be to develop a farm-level aquaculture performance index to enable a more refined look at environmental performance among individual farms. The GAPI methodology will also be used to assess and compare the current array of environmental standards (including those in draft stages) for marine aquaculture, including those that various certification schemes are promoting.
table 1: GAPI’s ten Indicators of environmental Performance in Marine Finfish Aquaculture
INPUTS DISCHARGES BIOLOGICAL
Capture-Based Aquaculture (CAP) Antibiotics (ANTI) Escapes (ESC)
Ecological Energy (ECOE) Antifoulants (Copper) (COP) Pathogens (PATH)
Industrial Energy (INDE) Biochemical Oxygen Demand (BOD)
Sustainability of Feed (FEED) Parasiticides (PARA)
ix GAPI Global Aquaculture Performance Index www.gapi.ca
A FlexIble tool
By zooming out of or into the GAPI analysis, users can completely change the lens through which they view environmental performance. This flexibility allows a variety of stakeholders to apply GAPI with an almost infinite number of applications. For instance, GAPI can help to answer such questions as: Are there common modes of production and geographic characteristics that enable a specific sector or country to perform better than others? GAPI also helps to uncover broader trends, such as the effects of market value, type of production system, and trophic level, on environmental performance. While the GAPI 2010 report reviews the GAPI analysis and findings, it only scratches the surface in terms of how GAPI can be used and applied.
The core building block of GAPI is the Species-Country Score (e.g., Atlantic salmon–Norway score), which describes the overall performance for each species-country pair across all 10 indicators. GAPI also groups performance by country or species so that broader observations can be made across countries and across marine finfish species. Species GAPI Scores and Country GAPI Scores are simply the average of all individual species-country scores related to a particular species or country, respectively, weighted by the proportion of production assessed within GAPI. For all of these levels of observation—species-country, species, and country—GAPI provides cumulative and normalised scores in addition to an indicator-by-indicator breakdown of scores.
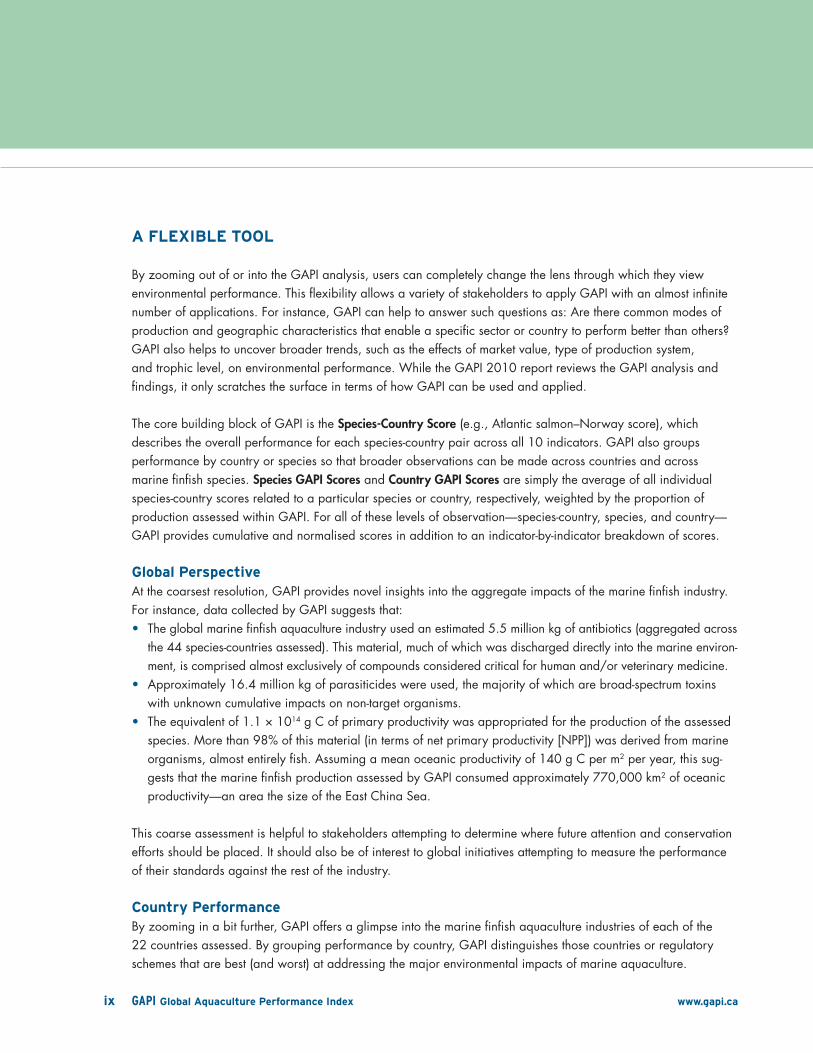
Global PerspectiveAt the coarsest resolution, GAPI provides novel insights into the aggregate impacts of the marine finfish industry. For instance, data collected by GAPI suggests that:
The global marine finfish aquaculture industry used an estimated 5.5 million kg of antibiotics (aggregated across •the 44 species-countries assessed). This material, much of which was discharged directly into the marine environ-ment, is comprised almost exclusively of compounds considered critical for human and/or veterinary medicine.Approximately 16.4 million kg of parasiticides were used, the majority of which are broad-spectrum toxins •with unknown cumulative impacts on non-target organisms.The equivalent of 1.1 × 10• 14 g C of primary productivity was appropriated for the production of the assessed species. More than 98% of this material (in terms of net primary productivity [NPP]) was derived from marine organisms, almost entirely fish. Assuming a mean oceanic productivity of 140 g C per m2 per year, this sug-gests that the marine finfish production assessed by GAPI consumed approximately 770,000 km2 of oceanic productivity—an area the size of the East China Sea.
This coarse assessment is helpful to stakeholders attempting to determine where future attention and conservation efforts should be placed. It should also be of interest to global initiatives attempting to measure the performance of their standards against the rest of the industry.
Country PerformanceBy zooming in a bit further, GAPI offers a glimpse into the marine finfish aquaculture industries of each of the 22 countries assessed. By grouping performance by country, GAPI distinguishes those countries or regulatory schemes that are best (and worst) at addressing the major environmental impacts of marine aquaculture.

x GAPI Global Aquaculture Performance Index www.gapi.ca
For instance, China’s GAPI score (normalised per mT of production) is 32, 27 points below the global average for all countries and well below ideal performance (100) (Figure 2). Since GAPI assesses eight different species produced in China, which comprise 61% of all of China’s marine finfish production, users can have some confidence that China’s GAPI score is a strong reflection of its marine aquaculture industry.
Similarly, users can gain an understanding of the effects of scale of production in a country. For instance, Chile’s score per mT of fish produced is 65. Its cumulative score (30) is less than half its normalised score, demonstrating the effects of the large scale of its salmon industry.
Country scores are a powerful tool for regulators looking to compare their country’s overall performance to that of their peers. Normalised country scores are especially useful to regulators interested in comparing their performance to that of other countries, regardless of the scale of their production, where cumulative country scores provide insight into the overall impact of a country’s marine aquaculture industry. Country scores can also be dissected by indicator, which enables a regulator to assess where it might focus its efforts (e.g., reduction of wild feed inputs or greater treatment of discharges) to achieve the greatest ecological improvement (i.e., higher GAPI score). Similarly, regulators can compare their country’s performance across species to identify trends and evaluate the efficacy of marine aquaculture regulations in particular impact areas.
species PerformanceGAPI also aggregates performance for each of the 20 marine finfish species assessed, allowing for global observations across species and highlighting those species that have the best and worst performance globally (Figure 3). With a global average score of 50 for all marine finfish species, GAPI suggests there is substantial room for improvement within the marine finfish aquaculture as a whole.
Figure 2: Country GAPI scores
PERFORMANCE
OUTLIERSREMOVED
CO
UN
TR
Y G
AP
I S
CO
RE
(N
OR
M.)
NORMALISED GAPI SCORE CUMULATIVE GAPI SCORE PRODUCTION ASSESSED
PR
OD
UC
TIO
N A
SS
ES
SE
D (m
T) 2 STANDARD
DEVIATIONS
0
20
40
60
80
100
0
100,000
200,000
300,000
400,000
500,000
600,000
700,000
800,000
PRODUCTION ASSESSED
CUMULATIVE
NORMALISED
UK
TU
RK
EY
TH
AIL
AN
D
TAIW
AN
SP
AIN
PH
ILIP
PIN
ES
NO
RW
AY
NE
W Z
EA
LA
ND
MA
LA
YS
IA
KO
RE
A,
RE
PU
BL
IC O
F
JA
PA
N
ITA
LY
ISR
AE
L
IND
ON
ES
IA
ICE
LA
ND
GR
EE
CE
FR
AN
CE
EG
YP
T
CH
INA
CH
ILE
CA
NA
DA
AU
ST
RA
LIA
47
90
70
64 65
3032
36
71
6468
96
60
7269
96
66
47
60
9188
67
46
34
57
69
50
86
73
90
72
34
59
28
60
82
30
64
41
72
59
6872
64
xi GAPI Global Aquaculture Performance Index www.gapi.ca
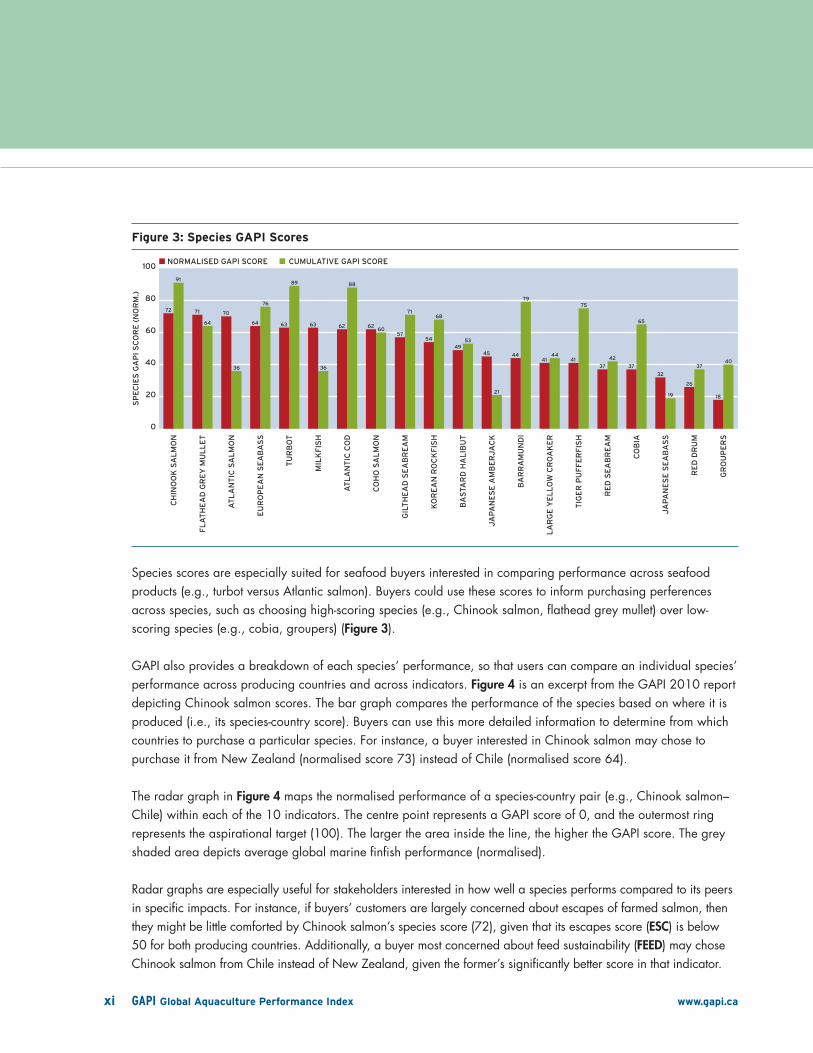
Species scores are especially suited for seafood buyers interested in comparing performance across seafood products (e.g., turbot versus Atlantic salmon). Buyers could use these scores to inform purchasing perferences across species, such as choosing high-scoring species (e.g., Chinook salmon, flathead grey mullet) over low-scoring species (e.g., cobia, groupers) (Figure 3).
GAPI also provides a breakdown of each species’ performance, so that users can compare an individual species’ performance across producing countries and across indicators. Figure 4 is an excerpt from the GAPI 2010 report depicting Chinook salmon scores. The bar graph compares the performance of the species based on where it is produced (i.e., its species-country score). Buyers can use this more detailed information to determine from which countries to purchase a particular species. For instance, a buyer interested in Chinook salmon may chose to purchase it from New Zealand (normalised score 73) instead of Chile (normalised score 64).
The radar graph in Figure 4 maps the normalised performance of a species-country pair (e.g., Chinook salmon–Chile) within each of the 10 indicators. The centre point represents a GAPI score of 0, and the outermost ring represents the aspirational target (100). The larger the area inside the line, the higher the GAPI score. The grey shaded area depicts average global marine finfish performance (normalised).
Radar graphs are especially useful for stakeholders interested in how well a species performs compared to its peers in specific impacts. For instance, if buyers’ customers are largely concerned about escapes of farmed salmon, then they might be little comforted by Chinook salmon’s species score (72), given that its escapes score (ESC) is below 50 for both producing countries. Additionally, a buyer most concerned about feed sustainability (FEED) may chose Chinook salmon from Chile instead of New Zealand, given the former’s significantly better score in that indicator.
Figure 3: species GAPI scores
SP
EC
IES
GA
PI
SC
OR
E (
NO
RM
.)
NORMALISED GAPI SCORE CUMULATIVE GAPI SCORE
0
20
40
60
80
100
GAPI SCORE (CUMULATIVE)
GAPI SCORE (NORMALISED)
GR
OU
PE
RS
RE
D D
RU
M
JA
PA
NE
SE
SE
AB
AS
S
CO
BIA
RE
D S
EA
BR
EA
M
TIG
ER
PU
FF
ER
FIS
H
LA
RG
E Y
EL
LO
W C
RO
AK
ER
BA
RR
AM
UN
DI
JA
PA
NE
SE
AM
BE
RJ
AC
K
BA
STA
RD
HA
LIB
UT
KO
RE
AN
RO
CK
FIS
H
GIL
TH
EA
D S
EA
BR
EA
M
CO
HO
SA
LM
ON
AT
LA
NT
IC C
OD
MIL
KF
ISH
TU
RB
OT
EU
RO
PE
AN
SE
AB
AS
S
AT
LA
NT
IC S
AL
MO
N
FL
AT
HE
AD
GR
EY
MU
LL
ET
CH
INO
OK
SA
LM
ON
91
72
64
71 70
36
64
76
63 63
89
36
62 62
88
6057
71
54
4945
68
53
21
4441 41
79
44
75
37
42
37
65
32
26
1819
3740

xii GAPI Global Aquaculture Performance Index www.gapi.ca
effects of scaleBy providing both normalised and cumulative scores of performance, GAPI allows users to explore the effects of the scale of production on environmental performance at an individual product level (e.g., barramundi from Australia), by country (e.g., Chile’s normalised versus cumulative score), and species (e.g., Atlantic salmon’s normalised versus cumulative score).
Figure 5 depicts normalised and cumulative GAPI scores for all species-country pairs and differentiates them by the period of time (years) each pair has been in culture.
Production systems are expected to evolve and improve in efficiency over time. Thus, one would expect to see GAPI scores increase the longer a production system has been in existence. All start-up production (zero to five years) assessed by GAPI took place in Asian countries, predominantly China. In these cases, both normalised and cumulative performances tend to be relatively poor. This is probably due to the fact that performance is so poor that even a relatively small volume of production carries a large ecological footprint.
As a system matures, ecological performance tends to improve in both cumulative and normalised impacts. It is during this intermediate stage that overall performance appears to peak. Interestingly, most mature systems assessed by GAPI (41–60 years) tend to retain a high normalised or a high cumulative score, but not both. Some sacrifice cumulative performance in pursuit of tremendous production (e.g., Atlantic salmon from Norway and milkfish from the Philippines). Others sacrifice normalised performance by farming products that are so ecologically damaging (Japanese tiger pufferfish and barramundi from Indonesia and Thailand) that high-volume production may not be feasible.
Figure 4: Chinook salmon Performance
INPUTS
DISCHARGESBIO
LOGI
CA
L
BODANTI
INDE
FEED
ECOE
CAP
PATH
ESC
PA
RA
COP
50 100
Species GAPI Score (Norm.)
Global averaGe—SpecieS (Norm.) 50
Chinook salmon
achieves an overall
species score of 72—
the highest performance
score of all species
assessed by GAPI.
0 50 100
Global Average
Country Score
72
New Zealand
Chile
25
50
75
100
25
50
75
100
New Zealand
Chile
0 50 100
73
64
GLOBAL AVERAGE—SPECIES (NORM.) 50
68 Gapi Global Aquaculture Performance Index www.gapi.ca
SpecieS reSUlTS
OverviewA majority of farmed Chinook salmon is produced in New Zealand (81% of production assessed by GAPI) and Chile (19%). Chinook salmon achieves an overall species score of 72—the highest performance score of all species assessed by GAPI. While New Zealand performs better than Chile (73 versus 64), both countries score well above the global average (50) for their production of Chinook salmon.
InputsChinook salmon performs well in the Inputs indicators. Chile and New Zealand score 75 and 70, respec-tively, in ecological energy (ECOE). Both countries utilize feed formulations with high proportions of plant materials. However, New Zealand’s sustainability of feed (FEED) performance (52 versus Chile’s 75) is undermined by its inclusion of tuna in some of its feed formulations.
DischargesA robust regulatory regime and sound husbandry practices in New Zealand help it achieve a perfect antibiotics (ANTI) score for Chinook salmon, whereas Chile’s score (68) is more in line with the global average for that indicator (54). New Zealand also achieves a perfect score in parasiticides (PARA), whereas the rest of Chile’s scores are more consistent with scores of other salmon (Atlantic and coho) producers.
BiologicalBoth Chile (42) and New Zealand (47) perform close to the global average (40) for escapes (ESC). While Chile (53) performs close to the global average (52) for pathogens (PATH) as well, the near absence of parasites on New Zealand farms allows it to achieve a PATH of 100. Chile’s performance is significantly worse due to on-farm mortalities.
Chinook salmon

xiii GAPI Global Aquaculture Performance Index www.gapi.ca
GAPI�condenses�current�scientific�
understanding�and�available�data�into�a�
statistically�accurate,�yet�simple�score�of�
environmental�performance�
Figure 5: normalised and Cumulative species-Country scores
0 10 20 30 40 50 60 70 80 90 1000
10
20
30
40
50
60
70
80
90
100
Cumulative GAPI
CU
MU
LA
TIV
E
NORMALISED
0—5 YEARS 6—20 YEARS 21—40 YEARS 41—60 YEARS
Cobia—China
Tiger pufferfish—China
Groupers—China
Red seabream—China
Bastard halibut—ChinaLarge yellow croaker—China
Japanese seabass—China
Atlantic salmon—Chile
Groupers—Indonesia
Cobia—Taiwan
Barramundi—Australia
Red drum—China
Chinook salmon—ChileAtlantic cod—Iceland
European seabass—Turkey
Bastard halibut—Korea, Republic ofKorean rockfish—Korea, Republic of
Atlantic cod—Norway
Barramundi—Thailand
Tiger pufferfish—Japan
Barramundi—Indonesia
Red seabream—Japan
Japanese amberjack—Japan
Milkfish—Philippines
Atlantic salmon—Norway
Milkfish—Indonesia
Groupers—Taiwan
Barramundi—Malaysia
Coho salmon—Chile
Atlanticsalmon—Canada Flathead grey mullet—Egypt
Atlantic salmon—United Kingdom
Chinook salmon—New Zealand
Turbot—France
Turbot—Spain
European seabass—Italy
European seabass—Spain
European seabass—Greece
Coho salmon—Japan
Gilthead seabream—Spain
Gilthead seabream—Italy
Gilthead seabream—Israel
Giltheadseabream—Turkey
Gilthead seabream—Greece
xiv GAPI Global Aquaculture Performance Index www.gapi.ca
ConClusIons
The results of GAPI analyses underscore several policy-relevant conclusions:
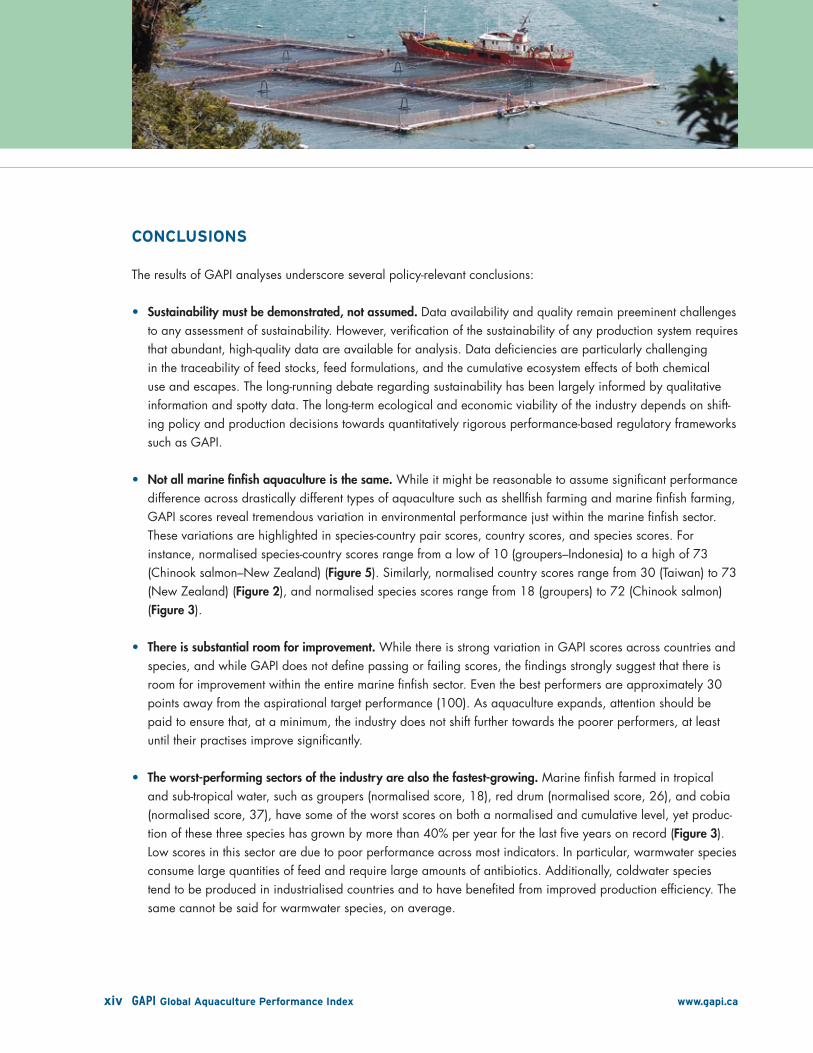
Sustainability must be demonstrated, not assumed. • Data availability and quality remain preeminent challenges to any assessment of sustainability. However, verification of the sustainability of any production system requires that abundant, high-quality data are available for analysis. Data deficiencies are particularly challenging in the traceability of feed stocks, feed formulations, and the cumulative ecosystem effects of both chemical use and escapes. The long-running debate regarding sustainability has been largely informed by qualitative information and spotty data. The long-term ecological and economic viability of the industry depends on shift-ing policy and production decisions towards quantitatively rigorous performance-based regulatory frameworks such as GAPI.
Not all marine finfish aquaculture is the same.• While it might be reasonable to assume significant performance difference across drastically different types of aquaculture such as shellfish farming and marine finfish farming, GAPI scores reveal tremendous variation in environmental performance just within the marine finfish sector. These variations are highlighted in species-country pair scores, country scores, and species scores. For instance, normalised species-country scores range from a low of 10 (groupers–Indonesia) to a high of 73 (Chinook salmon–New Zealand) (Figure 5). Similarly, normalised country scores range from 30 (Taiwan) to 73 (New Zealand) (Figure 2), and normalised species scores range from 18 (groupers) to 72 (Chinook salmon) (Figure 3).
There is substantial room for improvement.• While there is strong variation in GAPI scores across countries and species, and while GAPI does not define passing or failing scores, the findings strongly suggest that there is room for improvement within the entire marine finfish sector. Even the best performers are approximately 30 points away from the aspirational target performance (100). As aquaculture expands, attention should be paid to ensure that, at a minimum, the industry does not shift further towards the poorer performers, at least until their practises improve significantly.
The worst-performing sectors of the industry are also the fastest-growing.• Marine finfish farmed in tropical and sub-tropical water, such as groupers (normalised score, 18), red drum (normalised score, 26), and cobia (normalised score, 37), have some of the worst scores on both a normalised and cumulative level, yet produc-tion of these three species has grown by more than 40% per year for the last five years on record (Figure 3). Low scores in this sector are due to poor performance across most indicators. In particular, warmwater species consume large quantities of feed and require large amounts of antibiotics. Additionally, coldwater species tend to be produced in industrialised countries and to have benefited from improved production efficiency. The same cannot be said for warmwater species, on average.
xv GAPI Global Aquaculture Performance Index www.gapi.ca
Asia faces significant sustainability hurdles.• Asian countries account for the 15 lowest species-country scores. The trend towards lower normalised scores in Asian countries largely results from the prevalence of poor performance in the Inputs category, such as ecological and industry energy, feed sustainability, and biochemi-cal oxygen demand. Asian countries also tend to score poorly in the antibiotics and parasiticides indicators since GAPI assumes that performers use the maximum allowable dose or quantity in the absence of actual performance data. In general, Asian countries’ cumulative scores are relatively higher than their normalised scores by virtue of the modest production in those countries.
Atlantic salmon performance illustrates that scale is everything. • GAPI’s comparison of cumulative to normalised scores demonstrates that the sheer scale of production can have drastic effects on environmental performance. Some of the best-performing species on a normalised basis are among the worst on a cumulative basis due to the sheer scale of those industries. For example, Atlantic salmon is the third-highest-ranking species on a per mT basis (normalised score, 70), but when production volume is taken into account, Atlantic salmon’s score drops almost 50%, which ties it as the third-worst of the 20 species assessed by GAPI (Figure 3).
In contrast, cobia is one of the worst performers on a normalised basis (37). Per mT of production, cobia has one of the biggest environmental footprints of any marine finfish. However, because cobia farming is a modest-sized industry, it has a small cumulative impact (cumulative score, 65) compared to bigger farming sectors like Atlantic salmon (Figure 3).
In other words, large production of better-performing species could create more environmental damage than a single poorly performing farm. This discrepancy raises a question at the heart of sustainability: How do we expand aquaculture to support the food and protein needs of 9 billion humans without overwhelming the carrying capacity of the marine environment? Clearly, part of the answer lies in selecting the right species, choosing the right environments in which to grow them, and utilising responsible farming practices. At the same time, regulators need to consider the carrying capacity of local waters and begin to design and reward operations that minimise the environmental footprint of marine finfish aquaculture.
The GAPI 2010 report represents a work in progress. GAPI is intended to both inform and stimulate discussion of the appropriate metrics for evaluating performance and to drive the gathering and sharing of data. While the 2010 GAPI report provides a snapshot in time of environmental performance, the GAPI website (www.gapi.ca) is the repository for the wider body of data and analyses that will be updated as additional or better data become available. User feedback is encouraged and will be incorporated into the online tool. We are hopeful that GAPI will transform the way environmental performance is assessed and will aid decision makers—whether they are policy makers, producers, large buyers, or standard setters—as they continue to address the promise and challenges of marine finfish aquaculture.

xvi GAPI Global Aquaculture Performance Index www.gapi.ca

1 GAPI Global Aquaculture Performance Index www.gapi.ca
Methods�� � � � � � � � � � � � � � � � � � � � � � � � � � � � � � � � � � � � � � � � � � � � � � � � � � � � � � � � � � � � � � � � � � � � � � � � � � � � � � � � � � � 2
Species�and�Country�Selection�� � � � � � � � � � � � � � � � � � � � � � � � � � � � � � � � � � � � � � � � � � 11
Summary�of�Results�� � � � � � � � � � � � � � � � � � � � � � � � � � � � � � � � � � � � � � � � � � � � � � � � � � � � � � � � � � � � 14
Conclusions�� � � � � � � � � � � � � � � � � � � � � � � � � � � � � � � � � � � � � � � � � � � � � � � � � � � � � � � � � � � � � � � � � � � � � � � � � � 29
OvervIew

2 GAPI Global Aquaculture Performance Index www.gapi.ca
OvervIew Methods
tThe GAPI methodology is based on the Environmental Performance Index (EPI) methodology developed by a team of environmental experts at Yale and Columbia universities. EPI was developed in response to the grow-ing demand from policy makers for a more quantitative foundation for decision making on key environmental policy issues. EPI tracks the performance of 163 countries across major environmental impact categories such as climate change, air pollution, deforestation, fisheries sustainability, and biodiversity (Emerson et al. 2010). GAPI applies the basic EPI methodology more specifically to environmental issues surrounding marine finfish aquaculture production.
The EPI and GAPI scoring systems can be likened to those used in many competitive sports. For instance, much like in gymnastics, EPI and GAPI evaluate each “competitor” based on performance within a number of categories. GAPI uses 10 categories or indicators such as escapes, disease/parasites, and waste discharges to evaluate performance. GAPI measures how close each competitor’s performance comes to a set target or perfect score for each category. GAPI derives each competitor’s final score by summing scores in each category. While a perfect score may not be achieved by any competitor, the scoring system allows observers to clearly demarcate the leaders and laggards in each category and overall performance.
In practise, the EPI and GAPI methodologies are markedly more complicated than this analogy suggests. Such a simple approach would introduce many ill-founded assumptions (e.g., each indicator is of equal importance) and mathematical challenges (e.g., 10 different units of measure are not easily standardised to a single logical unit). Instead, GAPI relies on two well-established quantitative approaches to ensure objective, transparent, and statisti-cally meaningful results. The first technique, known as proximity-to-target, enables GAPI to map performance in core environmental impact categories across a scale of 0 to 100, where 100 represents perfect performance. The second technique, principal component analysis (PCA), is a common statistical tool that is used to determine an appropriate weighting for each performance category.
derIVInG GAPI sCores
The GAPI methodology, which produces a final GAPI score for each species-country pair, consists of nine basic steps:
step 1: Selecting Key Indicators of Environmental Performancestep 2: Constructing Formulas for Each Indicatorstep 3: Setting Targets for Each Indicatorstep 4: Collecting Datastep 5: Winsorisationstep 6: Proximity-to-Target Calculationstep 7: Weighting Indicatorsstep 8: Calculating the Final GAPI Score for Each Species-Country Pairstep 9: Aggregating GAPI Scores by Species and Country

3 GAPI Global Aquaculture Performance Index www.gapi.ca
step 1: selecting key Indicators of environmental PerformanceAn important step in the development of GAPI was to identify key indicators of environmental performance. It is not an exaggeration to say that one could identify hundreds of indicators to evaluate the environmental performance of an aquaculture production system. However, within GAPI, emphasis is placed on identifying a suite of indicators that sufficiently describes the major ecological impacts of marine finfish aquaculture while using the fewest indicators possible. Each additional indicator increases the complexity of the analysis, the likelihood of significant data gaps, and the effort required to collect data. Therefore, rather than attempting to measure all conceivable impacts from production systems, GAPI evaluates the most significant and measurable environmental effects.
In order to determine the suite of GAPI indicators, the project examined existing aquaculture assessment efforts and pinpointed those environmental impacts that were commonly addressed across these efforts. Those issues that appeared consistently among initiatives were considered to have passed something of a peer review and, as a result, were important enough to include within GAPI.1 Ten common impact categories were identified and incorporated into GAPI, including, among others, the impacts of: escaped fish; parasites/disease; discharges of organic and inorganic waste; energy use; dependence on wild fish for feed; and dependence on wild fish for broodstock and juveniles.
Final GAPI indicators are summarised in Table 2. Within the report, the indicators are grouped relative to the type of impact. These groupings include: impacts of production that are related to its inputs, discharges, and biological effects. Summaries of each indicator are provided in the Indicators section.
step 2: Constructing Formulas for each IndicatorThe second, more challenging step was to determine how best to measure actual performance within each indicator category. The GAPI project developed specific criteria to ensure that GAPI indicators were sufficiently rigorous. Included in these criteria are:
Relevance: How well the indicator gauges the environmental impact at hand•Performance orientation: Whether the indicator tracks actual, on-the-water performance•Transparency of formulas and data•Availability of quality data•
In constructing the formulas for the 10 indicators, wastes and disease/parasites turned out to be especially problematic. Both of these issues are notoriously difficult to track, and there is no universally accepted measure or model of these impacts. While expert opinion was sought during the development of all indicators, dedicated expert workshops were convened to address the particular challenges of wastes and disease/parasites.2 Both workshops were successful in developing rigorous, comprehensive indicators, which are detailed in the Indicators section.
1 Detailed results of the indicator scoping exercise are available on the GAPI website, www.gapi.ca.2 Expert contributors are listed in the Acknowledgements section.
Rather�than�attempting�to�measure�all�
conceivable�impacts�from�production�systems,�
GAPI�evaluates�the�most�significant�and�
measurable�environmental�effects�

4 GAPI Global Aquaculture Performance Index www.gapi.ca
In the same way that it is valuable information to know a country’s GDP and its GDP per capita or its overall contribution to carbon dioxide emissions versus its per capita contribution, both cumulative and normalised performance are assessed within GAPI. The absolute GAPI score for each species-country pair reflects the overall environmental impact of the production of a species in a particular country. However, because absolute scores
table 2: GAPI environmental Performance Indicators
GROUPING INDICATOR INDICATOR�DESCRIPTION INDICATOR�FORMULAS*
INPUTS Capture-Based Aquaculture (CAP)
The extent to which a system relies on the capture of wild fish for stocking farms, taking into account the sustainability of these wild fish inputs
∑(Amount from Wild Capture (kg) × Sustainability Score)
mT Fish Produced
Ecological Energy (ECOE)
Amount of energy, or net primary productivity (NPP), that farmed fish divert from the ecosystem through consumption of feed ingredients
∑Net Primary Production of Feed Inputs (mT carbon)
mT Fish Produced
Industrial Energy (INDE)
Energy consumed in production and in the acquisition and processing of feed ingredients
∑(Proportion Fish/Livestock/Plant/Production System x Knife Coefficient (Megajoules/mT) ×
Total Feed Consumed (mT))
mT Fish Produced
Sustainability of Feed (FEED)
Amount, efficiency, and sustainability of wild fish ingredients of feed
∑(Proportion of Feed by Species × Sustainability Score of Each Species) ×
Fish In: Fish Out Ratio
mT Fish Produced
DISCHARGES Antibiotics (ANTI)
Amount of antibiotics used, weighted by a measure of human and animal health risk
∑(Amount Active Ingredient (kg) × WHO-OIE Score)
mT Fish Produced
Antifoulants (Copper) (COP)
Estimated proportion of production using copper-based antifoulants
mT Fish Produced × % Production Using Copper-Based Antifoulants
mT Fish Produced
Biochemical Oxygen Demand (BOD)
Relative oxygen-depletion effect of waste contaminants (uneaten feed and feces)
BOD (mT O2) × Area of Impact (km2)
mT Fish Produced
Parasiticides (PARA)
Amount of parasiticides used, weighted by mea-sures of environmental toxicity and persistence
∑(Amount (kg) × [(1/LC50)+1] × Persistence (Days))
mT Fish Produced
BIOLOGICAL Escapes (ESC) Number of escaped fish, weighted by an estimate of the per capita risk associated with escapes
GAPI Invasive Score × # Escaped Fish
mT Fish Produced
Pathogens (PATH)
Number of on-farm mortalities, weighted by an estimate of wild species in the ecosystem that are susceptible to farm-derived pathogens
∑Pathogen-specific Wild Losses (mT)
mT Fish Produced
* GAPI takes the square root of each indicator formula to make the range of performance values more manageable and to spread out the final scores so that differences in scores are more apparent.

5 GAPI Global Aquaculture Performance Index www.gapi.ca
take into account the volume of fish produced, they can be greatly affected by differences in production volume (e.g., large producers will tend to have low cumulative scores given their sheer volume of production). In order to level the playing field among the range of performers from small to large and to highlight intrinsic performance differences among species, thereby allowing for direct comparison, performance in each indicator is divided by the production volume (mT, live-weight equivalents). These normalised values for performance within each indicator are used to obtain a normalised GAPI score for each species-country pair.
This report focuses on the normalised GAPI scores (per unit of production). Compared to cumulative scores, these scores offer decision makers greater insight not only into how players are performing compared to their peers, but also into where they are leading or lagging, and where effective solutions might lie. The Summary of Results section briefly explores the impact of the scale of production on overall environmental performance. Detailed information on both the cumulative and normalised GAPI scores is also provided on the GAPI website (www.gapi.ca).
step 3: setting targets for each IndicatorOne of the major strengths of GAPI is that it enables aquaculture performance to be judged against a set of targets that would be unrealistic as farming standards but provide crucial information regarding how close marine finfish aquaculture comes to meeting an ecological ideal. By setting a target of zero for each indicator, GAPI permanently sets the environmental performance at the ecological ideal rather than continually recalibrating the goal as the performance of the industry improves or as viewpoints of what is an “acceptable” level of impact shift. As such, GAPI provides a robust tool to assess any real progress or decline in environmental performance over time.
step 4: Collecting dataGAPI uses a wide range of data sets drawn from international organisations, regulatory bodies, conservation organisations, academia, seafood industry groups, and the seafood industry trade press. The data used in GAPI are publicly available and traceable. Data sources are referenced within the indicator summaries (in the Indicators section). The GAPI website (www.gapi.ca) also provides a log of all data and respective sources. All data included within the current GAPI data set are from 2007, unless otherwise indicated.
As with any effort to assess aquaculture performance, GAPI faces challenges related to data availability and quality. Limited data coverage, methodological inconsistencies, low-quality metrics, and poor (or nonexistent) reporting structures pose problems for all assessment efforts. While GAPI is focused at the country level, where most aquacul-ture data are collected and reported by regulatory authorities, data inaccuracies are still likely. Where questions regarding data accuracy or gaps in data remain, GAPI is transparent about how these potential inaccuracies and gaps are treated. This information is summarised in the Indicators section and on the GAPI website (www.gapi.ca). As new and better data become available, the GAPI website and GAPI analysis will be updated.
Lastly, while the preference is to use data that track on-the-water performance, in some cases there is simply a lack of direct empirical data. For instance, there is currently no method that is both feasible and credible for predicting or tracking the full range of actual effects on wild fish of farm-derived disease transmission or the effect of escaped fish from farms. Given that expert opinion suggests that these impacts are important components of

6 GAPI Global Aquaculture Performance Index www.gapi.ca
environmental performance, GAPI relies on a combination of “measured” performance data and “modelled” indicators of performance and/or risk.
In keeping with the approach of the Environmental Performance Index (EPI), GAPI aims to stimulate discussion on defining the appropriate metrics and methodologies for evaluating environmental performance in addition to highlighting the need for improved data collection.
step 5: WinsorisationOnce indicators are defined and the relevant data are collected, the GAPI scores are calculated. The first step of this process is winsorisation. Winsorisation is an accepted statistical approach to dealing with outliers. It allows users to address the small number of extremely high or low values in a data set so that those values do not distort the distribu-tion of the entire data set. EPI suggests that when assessing environmental performance, such extreme values tend to be the result of measurement errors rather than signals of legitimately high or low performance (Esty et al. 2008).
In winsorisation, if any performance lies outside the normal distribution of data for the entire group of performers, that outlier performance value is adjusted so that it lies at the extreme edge of the normal range (two standard deviations from the mean), as demonstrated in Figure 6. Since the GAPI target performance is set at zero, however, no performer can overperform (i.e., do better than zero impact). Thus, winsorisation is only used to adjust for extreme underperformance (i.e., performing significantly worse in any one indicator than the data set would suggest is plausible).
Figure 6: treating outliers Within GAPI
MAX WINSORISED
VALUE
OUTLIERSREMOVED
2 STANDARDDEVIATIONS
1 STANDARDDEVIATION
MEANPERFORMANCE
TARGETPERFORMANCE
step 6: Proximity-to-target CalculationData come in many different units, scales, and ranges. To be able to compare performance among escapes and the sustainability of feed sources, for example, it is necessary to standardise the data for each indicator. GAPI’s aim is to standardise all data so they can be mapped on the same 0-to-100 scale, where individual scores can be

7 GAPI Global Aquaculture Performance Index www.gapi.ca
compared in a statistically meaningful way. GAPI uses the proximity-to-target approach to calculate how close each performer is to meeting the established precautionary targets (i.e., zero impact).
Proximity-to-target is calculated for each individual indicator separately, using the following formula:
Proximity-to-target = 100 − [100 × (Actual Performance − Target)(Maximum Winsorised Value − Target)]
The proximity-to-target calculation measures the distance between actual performance and the established target for each indicator. In order to provide some context for this value or score, this number is expressed as a proportion of the distance from target of the worst performer (i.e., maximum winsorised value). This distance is converted into a percentage and then transformed into the GAPI scale, so that a high score indicates better performance. This results in an initial, unweighted GAPI score for each individual indicator.
Since the worst performer in the analysis sets the floor for performance, the GAPI score is partially dependent on the pool of performers included in the analysis. Thus, it is important that this pool of performers is representative of the marine finfish aquaculture industry. The performers included within GAPI comprise approximately 93.7% of marine finfish aquaculture by weight and 91.0% by value, which is a solid representation of the global marine finfish aquaculture industry.
step 7: Weighting IndicatorsAt this point, the overall GAPI score could be calculated by taking the average of the 10 individual indicator scores. However, doing so would ignore the fact that some indicators are more important than others in explaining the difference in performance among two or more players. Therefore, a data aggregation and weighting scheme needs to be applied to reflect the differential importance of indicators to overall environmental performance.
A recent review of sustainability assessment methodologies (Singh et al. 2009) demonstrated that normalisation and weighting of indicators used in sustainability assessments is typically associated with subjective judgements and reveals a high degree of arbitrariness without mentioning or systematically assessing critical assumptions. For instance, an assessment tool may be designed to weight energy use or carbon footprint more heavily than other indicators because of global attention to this issue or evidence of its large-scale effect. But, is this type of subjec-tive weighting sound? Further, can we legitimately say that disease impacts are more important than escape impacts in all geographies or at all times?
GAPI addresses this dilemma by shifting away from weighting based on the assumed magnitude of environmental impact of each indicator. By selecting an indicator to be included within GAPI, it has already been decided that it is a relatively important driver of environmental performance. However, to ensure that GAPI is as rigorous, transparent, and objective as possible, the data and not the investigator determine the degree of weighting for each indicator. A standard statistical procedure for such a task is the principal component analysis (PCA).
To�ensure�that�GAPI�is�as�rigorous,�
transparent,�and�objective�as�possible,�the�
data�and�not�the�investigator�determine�the�
degree�of�weighting�for�each�indicator�
8 GAPI Global Aquaculture Performance Index www.gapi.ca
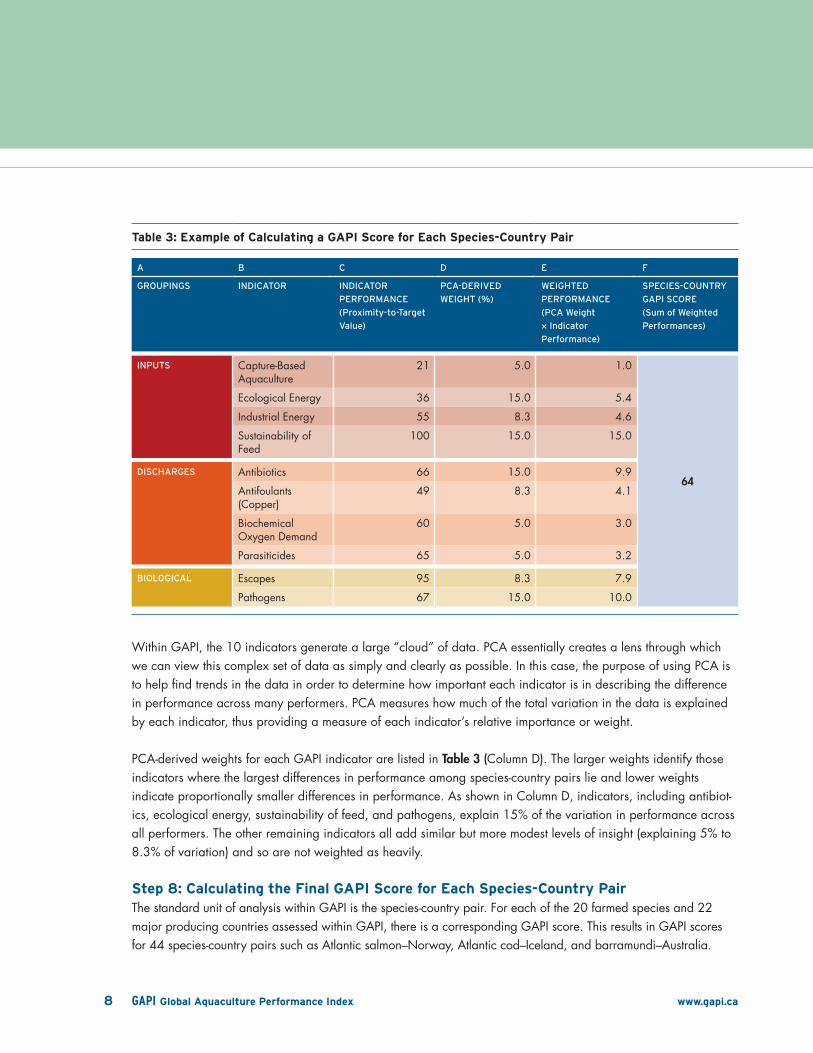
Within GAPI, the 10 indicators generate a large “cloud” of data. PCA essentially creates a lens through which we can view this complex set of data as simply and clearly as possible. In this case, the purpose of using PCA is to help find trends in the data in order to determine how important each indicator is in describing the difference in performance across many performers. PCA measures how much of the total variation in the data is explained by each indicator, thus providing a measure of each indicator’s relative importance or weight.
PCA-derived weights for each GAPI indicator are listed in Table 3 (Column D). The larger weights identify those indicators where the largest differences in performance among species-country pairs lie and lower weights indicate proportionally smaller differences in performance. As shown in Column D, indicators, including antibiot-ics, ecological energy, sustainability of feed, and pathogens, explain 15% of the variation in performance across all performers. The other remaining indicators all add similar but more modest levels of insight (explaining 5% to 8.3% of variation) and so are not weighted as heavily.
step 8: Calculating the Final GAPI score for each species-Country PairThe standard unit of analysis within GAPI is the species-country pair. For each of the 20 farmed species and 22 major producing countries assessed within GAPI, there is a corresponding GAPI score. This results in GAPI scores for 44 species-country pairs such as Atlantic salmon–Norway, Atlantic cod–Iceland, and barramundi–Australia.
table 3: example of Calculating a GAPI score for each species-Country Pair
A B C D E F
GROUPINGS INDICATOR INDICATOR�
PERFORMANCE�
(Proximity-to-Target�
Value)
PCA-DERIVED�
WEIGHT�(%)
WEIGHTED�
PERFORMANCE�
(PCA�Weight�
�Indicator�
Performance)
SPECIES-COUNTRy�
GAPI�SCORE�
(Sum�of�Weighted�
Performances)
INPUTS Capture-Based Aquaculture
21 5.0 1.0
64
Ecological Energy 36 15.0 5.4
Industrial Energy 55 8.3 4.6
Sustainability of Feed
100 15.0 15.0
DISCHARGES Antibiotics 66 15.0 9.9
Antifoulants (Copper)
49 8.3 4.1
Biochemical Oxygen Demand
60 5.0 3.0
Parasiticides 65 5.0 3.2
BIOLOGICAL Escapes 95 8.3 7.9
Pathogens 67 15.0 10.0

9 GAPI Global Aquaculture Performance Index www.gapi.ca
Table 3 demonstrates how the final GAPI score for each species-country pair is calculated for a hypothetical performer. First, the performer’s environmental performance within each indicator is determined by calculating the proximity-to-target for each normalised indicator, standardised on a scale of 0 to 100 (Column C). The weight of each of these indicators is then calculated using PCA. Next, the indicator performance values (Column C) are multiplied by the PCA-derived weight assigned to each indicator (Column D) to yield the weighted performance within each indicator (Column E). The final GAPI score (Column F), which describes the performer’s normalised performance within all environmental indicators, is the sum (rounded) of the 10 weighted performance scores in Column E. Within this example, the hypothetical performer’s normalised GAPI score is 64 (out of 100).
step 9: Aggregating GAPI scores by species and CountryWhile GAPI assesses performance at the species-country level, it is critical that these individual GAPI scores can be aggregated so that some conclusions can be made about performance across farmed marine finfish species and the countries in which they are produced. While one user might be interested in how Atlantic salmon–Chile scores, another user may be more interested in how Chile’s marine finfish industry is performing overall or how Atlantic salmon scores compare to Atlantic cod in general. The Species Results and Country Results included within this report provide both the aggregate species and country GAPI scores in addition to individual species-country pair GAPI scores.
The aggregate scores are simply the average of the individual normalised species-country scores related to the particular species or country weighted by the proportion of production assessed by GAPI. For example, the Species GAPI score for “Species A” below would be calculated as:
SPECIES COUNTRy GAPI�SCORE PROPORTION�OF�
ASSESSED�PRODUCTION
Species A Country 1 68 0.10
Species A Country 2 50 0.90
Species A GAPI Score = (68 × 0.10) + (50 × 0.90) = 51.8
Similarly, the Country GAPI Score of Country 1 would be calculated as:
SPECIES COUNTRy GAPI�SCORE PROPORTION�OF�
ASSESSED�PRODUCTION
Species A Country 1 68 0.65
Species B Country 1 80 0.35
Country 1 GAPI Score = (68 × 0.65) + (80 × 0.35) = 72.2

10 GAPI Global Aquaculture Performance Index www.gapi.ca
InterPretInG GAPI sCores
Figure 7 provides a snapshot of the variety of performance measures provided by GAPI. The species-country score (e.g., Atlantic salmon–Norway score) is the core building block of GAPI. It describes the overall perfor-mance score for each species-country pair, which takes into account performance in each of the 10 indicators. Using this score, GAPI can measure a particular species-country pair’s performance on a cumulative or norma-lised (per unit production) level. GAPI also takes a weighted average of all species-country scores for each of the 20 assessed species to determine an average “Species GAPI Score”. Similarly, it takes a weighted average of all species-country scores for each of the 22 countries included in the assessment to determine an average “Country GAPI Score”. Just as the species-country scores can be viewed at a normalised or cumulative level, the same can be done at the aggregate species and country level as well.
Figure 7: the building blocks of GAPI scores
When comparing scores, it is important to keep in mind that GAPI is a coarse assessment tool. Given the lack of precision within data that are currently available, we do not advise placing a great deal of weight on minor differences in scores such as a performer that scores 57 versus one that scores 56. While these values still have some meaning, the real value of GAPI in its ability to view broader trends or differences. For instance, it is appar-ent that Atlantic salmon (ranking 2, 3, 5, and 11 per unit production) performs better than groupers (ranking 43 and 44). Or that Chinook salmon produced in New Zealand (score of 73) is closer to the ecological goalpost than the same fish produced in Chile (64).
ANTI
CUMULATIVE�SPECIES–COUNTRy�
SCORE
SPECIES�GAPI�SCORE�(Cum�)
COUNTRy�GAPI�SCORE�
(Cum�)
NORMALISED�SPECIES–COUNTRy�
SCORE(per mT production)
SPECIES�GAPI�SCORE�(Norm�)
(per mT production)
COUNTRy�GAPI�SCORE�
(Norm�)(per mT production)
INDICATOR�SCORES�
for each species–country
BOD
CAP
COP
ECOE
ESC
FEED
INDE
PARA
PATH
sPeCIes–Country
sCore
Average of individual
species scores
Average of individual
species scores
Average of individual country scores
Average of individual country scores

11 GAPI Global Aquaculture Performance Index www.gapi.ca
OvervIew species and Country selection
AAccording to the U.N. Food and Agriculture Organization (FAO), in 2007 82 marine finfish species or species groups were farmed in 62 countries. While these numbers are impressive, it becomes quickly apparent that marine finfish aquaculture is dominated by a relatively small number of species. Although GAPI could assess every one of the species and producing countries, it would require an immense data collection effort while add-ing very little new information to the overall analysis. Instead, we decided to limit the assessment to those marine finfish species that comprise a majority of marine finfish aquaculture production by weight and value.
In order to determine exactly which species and countries to include in the analysis, we defined two cut-off points. Our first decision was to restrict the analysis to the top 20 species by mT of production. As shown in Table 4, these 20 species constituted 98.5% of marine finfish aquaculture production by weight in 2007.
table 4: selecting species and Country for GAPI Assessment
SPECIES�
RANK�By�
PRODUCTION�
WEIGHT�(mT)
MARINE�FINFISH�
SPECIES��
(in�production�in�2007)
%�OF�GLOBAL�
MARINE�FINFISH�
PRODUCTION�By�
WEIGHT
%�OF�GLOBAL�
MARINE�FINFISH�
PRODUCTION�By�
VALUE
PRODUCING�COUNTRIES�INCLUDED�IN�
GAPI�ANALySIS�(representing�90%�of�
Species�Production)*
1 Atlantic salmon 40.8 50.0 Canada, Chile, Norway, United Kingdom2 Milkfish 17.1 4.6 Indonesia, Philippines3 Flathead grey mullet 6.7 3.8 Egypt4 Japanese amberjack 4.9 9.0 Japan5 Red seabream 3.8 3.7 China, Japan6 Gilthead seabream 3.5 4.7 Greece, Israel, Italy, Spain, Turkey7 Coho salmon 3.3 3.0 Chile, Japan8 Bastard halibut 3.2 4.1 China, Republic of Korea9 European seabass 3.0 4.3 Greece, Italy, Spain, Turkey
10 Japanese seabass 2.9 0.9 China11 Groupers 2.0 1.4 China, Indonesia, Taiwan (Republic of China)12 Large yellow croaker 1.8 0.5 China13 Red drum 1.5 0.5 China14 Korean rockfish 1.0 1.4 Republic of Korea15 Barramundi 0.9 0.6 Australia, Indonesia, Malaysia, Thailand16 Cobia 0.8 0.4 China, Taiwan (Republic of China)17 Tiger pufferfish 0.5 0.7 China, Japan18 Atlantic cod 0.3 0.3 Iceland, Norway19 Chinook salmon 0.3 0.5 Chile, New Zealand20 Turbot 0.2 0.4 France, Spain
%�OF�GLOBAL�MARINE�
FINFISH�PRODUCTION98�5 95�0
%�OF�GLOBAL�MARINE�FINFISH�
PRODUCTION�ASSESSED�By�GAPI93�7 91�0
Data source: FAO FishStat, www.fao.org/fishery/statistics/software/fishstat/en.* GAPI’s decision rule is to assess 90% of the production of the top 20 species listed above. Thus, the actual percentage of production assessed by GAPI is a few points lower (93.7% versus 98.5%) than the total % of marine finfish production of these species.

12 GAPI Global Aquaculture Performance Index www.gapi.ca
Once we selected the group of species to include in the assessment, we had to make a decision about which producing countries to include in the analysis. Just as a small number of species comprises the majority of production, the same is true for countries. A particular species may be produced in a large number of countries, but in reality, relatively few countries dominate the production of that species. Thus, our decision was to include those countries that comprised the top 90% of production of each of the 20 selected species. These two decisions resulted in a GAPI assessment that includes 20 marine finfish species and 22 producing countries. Together, these performers comprise 93.7% of 2007 marine finfish production by weight (mT) and 91.0% by value (USD).
It is important to keep in mind that GAPI currently assesses only a portion of aquaculture production, albeit the sector that has been the focus of greatest concern in terms of ecological impacts. As depicted in Figure 8, marine finfish aquaculture comprised just 7% of global aquaculture production in 2007. A majority of aquaculture production takes place in freshwater systems, which are not currently assessed by GAPI. Since GAPI scores are dependent on the pools of players assessed, the inclusion of additional species such as freshwater species would likely change the GAPI landscape significantly.
treAtInG “neI” sPeCIes
In some cases, the FAO was unable to report 2007 production down to the species level and instead reported production of an aggregate group of species. In these cases, the FAO lists the group as “nei” or “not elsewhere included”. For instance, the FAO 2007 data list “amberjack nei” and “seabasses nei”, indicating that a particu-lar species was not identified.
Figure 8: Production Assessed by GAPI relative to Global Aquaculture
% OF PRODUCTION (mT) ASSESSED BY GAPI
93.7%
FRESHWATER AQUACULTURE57.7%
OTHER MARINE AQUACULTURE35.3%
MARINE FINFISH AQUACULTURE7.0%
% OF PRODUCTION (mT) NOT ASSESSED BY GAPI
6.3%

13 GAPI Global Aquaculture Performance Index www.gapi.ca
To determine the actual species of production within these “nei” groups, we cross-referenced each of the “nei” groups that appears among the top 20 species with information on production in that specific country. For instance, FAO reports 41,900 mT of “seabass nei” produced in Turkey. However, assessment of the Turkish aquaculture industry suggests that Turkey’s production is dominated by or is entirely European seabass. Thus, GAPI assumes that the 41,900 mT of “seabass nei” are actually European seabass.
The top 20 marine finfish aquaculture species included five “nei” groups: amberjacks nei, lefteye flounder nei, seabass nei, and porgies/seabreams nei. GAPI assessed these as Japanese amberjack, bastard halibut, European seabass, and red seabream, respectively. Since all of these species appeared elsewhere in the top 20 list, GAPI simply added the production values of each of these species to its counterparts in the top 20 list. Thus, no new species were added to the top 20 list.
GAPI treats one group, “groupers nei”, somewhat differently from the rest. FAO data indicate that “groupers nei” was one of the top 20 species or species groups in production in 2007. However, the proportion of production that each of these species comprises is unclear. Since ecological performance is similar across farmed grouper species, some generalizations can be made. Thus, “groupers” was maintained as a generic group where performance is assumed to be consistent across individual grouper species.

14 GAPI Global Aquaculture Performance Index www.gapi.ca
BBy zooming out of or into the GAPI analysis, users can change the lens through which they view environmental performance. This flexibility allows a variety of stakeholders to apply GAPI with an almost infinite number of applications. For instance, GAPI can help to answer such questions as: Are there common modes of production and geographic characteristics that enable a specific sector or country to perform better than others? GAPI also helps to uncover broader trends, such as the effects of market value, type of production system, and trophic level, on environmental performance. While the GAPI 2010 report reviews the GAPI analysis and findings, it only scratches the surface in terms of how GAPI can be used and applied.
Below, we highlight some of the key findings of the analysis:
Variation in GAPI scoresGAPI scores reveal tremendous variation in environmental performance across species-country pairs (Table 5), countries (Figure 9), and species (Figure 10). Normalised species-country scores range from a very low score of 10 (groupers from Indonesia) to a mediocre score of 73 (Chinook salmon from New Zealand), with an average score of 53. Asian countries account for the 15 lowest species-country scores, while leading scores show no clear geographic bias. With a peak score of 73, ample room remains for improvement across the board. Similarly, on a cumulative level (accounting for volume of production), GAPI species-country scores range from a peak score of 96 (turbot from France) to a low of 19 (Japanese seabass from China).
Normalised species scores ranged from a low of 18 (groupers) to a high of 72 (Chinook salmon), with an average score of 50 (Figure 10). The three salmonid species (Chinook, Atlantic, and coho) received comparatively high scores, ranking first, third, and eighth, respectively. The higher of the salmon scores can be attributed mainly to production practices in Norway, the UK, and New Zealand, while coho salmon from Chile and Japan receive lower-range scores. At the other end of the spectrum, groupers uniformly performed poorly, with grouper from Indonesia scoring lowest (10) and grouper from China second-lowest (15). The next worst-performing species, red seabream from China, received a score of 25, a considerably higher score than the grouper from that country.
By observing the range of species-country scores that contributes to the aggregate species scores, we can better understand the factors determining environmental performance. For instance, the data reveal an inverse relation-ship between species scores and volatility in the species-country scores associated with those species. Of the 20 species examined, those that exhibit the most variation within their species-country scores are the red seabream (ranked 16th), bastard halibut (11th), and groupers (20th). On the flip side, top-ranking species show low volatil-ity. For example, one of the higher-scoring species—Atlantic salmon—has species-country scores differing by only six points despite significant biotic, geographic, and regulatory differences. This trend suggests that improvements can be readily accomplished at the lower end of the performance spectrum, but that improvements may depend more on innovation at the upper end.
Country scores follow the same linear trend in performance, with no clear breakpoints in scores. Asian countries dominate the lower end of the country scores, while salmon-producing nations dominate the upper end. The results suggest that the greater the number of species assessed for a country, the greater the likelihood that
OvervIew summary of results

15 GAPI Global Aquaculture Performance Index www.gapi.ca
table 5: GAPI scores of species–Country Pairs
SPECIES–COUNTRy�PAIR
%�OF�GLOBAL�
MARINE�FINFISH�
PRODUCTION�
ASSESSED
NORMALISED CUMULATIVE DIFFERENCE�
IN�GAPI�
SCORES�
(NORM�-CUM�)RANK GAPI�SCORE RANK GAPI�SCORE
Chinook salmon–New Zealand 0.27 1 73 5 90 -17Atlantic salmon–Norway 21.00 2 72 38 33 39Atlantic salmon–UK 3.70 3 72 28 64 8Flathead grey mullet–Egypt 6.41 4 71 29 64 7Atlantic salmon–Canada 3.30 5 70 27 64 6Atlantic cod–Iceland 0.04 6 69 2 96 -27European seabass–Italy 0.24 7 69 7 89 -20
Turbot–France 0.02 8 68 1 96 -28Milkfish–Indonesia 7.49 9 68 34 46 22European seabass–Greece 1.00 10 66 17 77 -11Atlantic salmon–Chile 10.80 11 66 42 23 43Gilthead seabream–Italy 0.20 12 65 9 88 -23Chinook salmon–Chile 0.06 13 64 3 94 -30European seabass–Spain 0.26 14 63 10 87 -24Coho salmon–Chile 2.90 15 63 32 57 6Turbot–Spain 0.19 16 63 8 88 -25Atlantic cod–Norway 0.27 17 62 11 87 -25European seabass–Turkey 1.19 18 61 21 70 -9Bastard halibut–Korea, Republic of 1.17 19 61 22 69 -8Gilthead seabream–Israel 0.08 20 60 4 91 -31Milkfish–Philippines 8.78 21 59 41 28 31Gilthead seabream–Spain 0.58 22 57 18 77 -20Gilthead seabream–Greece 1.42 23 56 23 68 -12Coho salmon–Japan 0.38 24 56 16 80 -24Gilthead seabream–Turkey 0.95 25 55 26 66 -11Korean rockfish–Korea 1.01 26 54 24 68 -14Barramundi–Malaysia 0.16 27 50 13 86 -36Red seabream–Japan 1.91 28 47 33 50 -3Barramundi–Australia 0.07 29 47 6 90 -43Barramundi–Indonesia 0.13 30 46 12 86 -40Japanese amberjack–Japan 4.49 31 45 43 21 24Tiger pufferfish–China 0.43 32 42 19 72 -30Large yellow croaker–China 1.76 33 41 35 44 -3Bastard halibut–China 1.89 34 41 36 43 -2Barramundi–Thailand 0.45 35 41 20 72 -31Tiger pufferfish–Japan 0.12 36 39 14 85 -46Cobia–China 0.74 37 37 30 62 -25Cobia–Taiwan 0.11 38 35 15 84 -49Japanese seabass–China 2.86 39 32 44 19 13Groupers–Taiwan 0.49 40 28 31 59 -31Red drum–China 1.40 41 26 37 37 -11Red seabream–China 1.56 42 25 39 33 -8Groupers–China 1.22 43 15 40 29 -14Groupers–Indonesia 0.18 44 10 25 68 -58

16 GAPI Global Aquaculture Performance Index www.gapi.ca
country will be on the lower end of the performance distribution. Of the 22 countries assessed by GAPI, 14 belong to the Organisation for Economic Co-operation and Development (OECD), and nine of these 14 comprise the 10 top-performing countries. OECD countries account for 61% of assessed production but 83% of value, suggesting a relationship between a country’s domestic economic activity and the performance of its marine aquaculture industry.
Some�of�the�best-performing�species��
groups�on�a�normalised�basis�were�among��
the�worst�on�a�cumulative�basis�due�to�the�
sheer�scale�of�those�industries�
Figure 9: Country scores
PERFORMANCE
OUTLIERSREMOVED
CO
UN
TR
Y G
AP
I S
CO
RE
(N
OR
M.)
NORMALISED GAPI SCORE CUMULATIVE GAPI SCORE PRODUCTION ASSESSED
PR
OD
UC
TIO
N A
SS
ES
SE
D (m
T) 2 STANDARD
DEVIATIONS
0
20
40
60
80
100
0
100,000
200,000
300,000
400,000
500,000
600,000
700,000
800,000
PRODUCTION ASSESSED
CUMULATIVE
NORMALISED
UK
TU
RK
EY
TH
AIL
AN
D
TAIW
AN
SP
AIN
PH
ILIP
PIN
ES
NO
RW
AY
NE
W Z
EA
LA
ND
MA
LA
YS
IA
KO
RE
A,
RE
PU
BL
IC O
F
JA
PA
N
ITA
LY
ISR
AE
L
IND
ON
ES
IA
ICE
LA
ND
GR
EE
CE
FR
AN
CE
EG
YP
T
CH
INA
CH
ILE
CA
NA
DA
AU
ST
RA
LIA
47
90
70
64 65
3032
36
71
6468
96
60
7269
96
66
47
60
9188
67
46
34
57
69
50
86
73
90
72
34
59
28
60
82
30
64
41
72
59
6872
64
Figure 10: species scores
SP
EC
IES
GA
PI
SC
OR
E (
NO
RM
.)
NORMALISED GAPI SCORE CUMULATIVE GAPI SCORE
0
20
40
60
80
100
GAPI SCORE (CUMULATIVE)
GAPI SCORE (NORMALISED)
GR
OU
PE
RS
RE
D D
RU
M
JA
PA
NE
SE
SE
AB
AS
S
CO
BIA
RE
D S
EA
BR
EA
M
TIG
ER
PU
FF
ER
FIS
H
LA
RG
E Y
EL
LO
W C
RO
AK
ER
BA
RR
AM
UN
DI
JA
PA
NE
SE
AM
BE
RJ
AC
K
BA
STA
RD
HA
LIB
UT
KO
RE
AN
RO
CK
FIS
H
GIL
TH
EA
D S
EA
BR
EA
M
CO
HO
SA
LM
ON
AT
LA
NT
IC C
OD
MIL
KF
ISH
TU
RB
OT
EU
RO
PE
AN
SE
AB
AS
S
AT
LA
NT
IC S
AL
MO
N
FL
AT
HE
AD
GR
EY
MU
LL
ET
CH
INO
OK
SA
LM
ON
91
72
64
71 70
36
64
76
63 63
89
36
62 62
88
6057
71
54
4945
68
53
21
4441 41
79
44
75
37
42
37
65
32
26
1819
3740

17 GAPI Global Aquaculture Performance Index www.gapi.ca
normalised Versus Cumulative scoresSome of the best-performing species groups on a normalised basis were among the worst on a cumulative basis due to the sheer scale of those industries. For example, Chilean Atlantic salmon is the third-worst performer on a cumulative basis, despite being in the top three on a normalised scale (Table 5). In contrast, cobia was one of the five worst performers on a normalised basis. Per mT of production, it had one of the biggest environmental footprints of any marine finfish. However, because cobia farming is a modest-sized industry, it has a smaller cumulative impact compared to larger farmer sectors.
Similarly, Figure 9 provides a comparison of the normalised and cumulative GAPI scores for each country in addition to the total assessed production of each country. In most cases, there is significant divergence between the two scores; the best-performing sectors have the worst cumulative impacts. Consider Norway, where produc-tion is dominated heavily by Atlantic salmon. While Norway scores relatively well (72) per mT of production, the scale of production drops its cumulative score to 34. Alternatively, Australia’s normalised score of 47 reflects the poor environmental performance of barramundi. However, due to the small scale of Australia’s barramundi industry, Australia scores a high cumulative score of 90.
Industry scale is perhaps the overarching issue that determines the environmental impacts of aquaculture produc-tion. A large production of high-performing species could create more environmental damage than a single poor-performing farm. The cumulative scores indicate that governments cannot simply promote salmon farming as better than groupers farming. Instead, the industry must work on shifting production towards better systems while improving the performance of all sectors.
Farmed salmon PerformanceWhile there is no doubt that salmon outperforms many other marine finfish species within the GAPI assessment, it serves as a perfect example of how drilling down into the details of the assessment is critical to providing a more complete and accurate picture of environmental performance. So, what does a finer-scale review of salmon scores say about farmed salmon’s performance?
At first glance, farmed salmon products occupy the top three ranks among all species-country pairs assessed (Table 5), with Chinook salmon from New Zealand taking first place with a score of 73 (normalised). We also see that scores in the 70s are satisfactory to place two salmon species—Chinook and Atlantic—among the top echelon of marine finfish aquaculture performance.
However, context is important. While no other performer scores higher than Chinook salmon from New Zealand, a score of 73 is still a substantial distance from the ecological target, or perfect score of 100. Thus, there is substantial room for improvement for all marine finfish, including salmon. Additionally, scores of all performers are affected by the pool of players against which they are judged. While some species like salmon may lead the pack, it must be acknowledged that this pack—marine finfish—was chosen specifically for assessment because of concerns regarding wide-ranging and well-documented environmental impacts. The addition of new players to
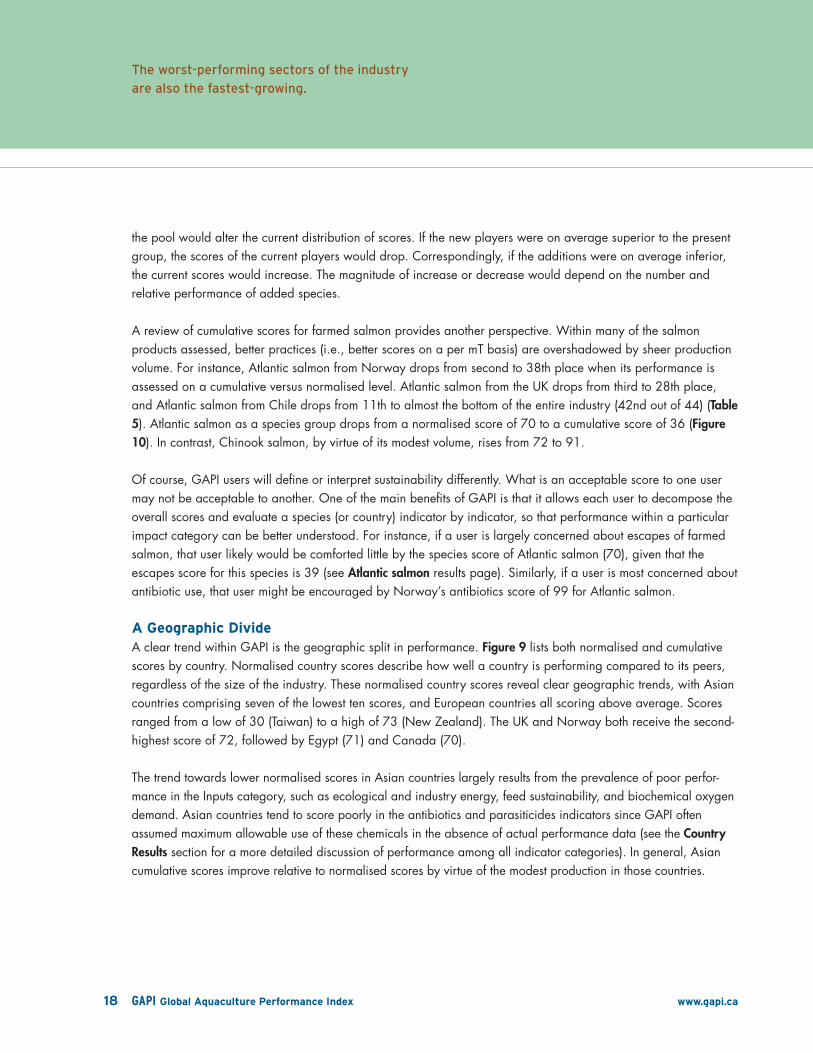
18 GAPI Global Aquaculture Performance Index www.gapi.ca
The�worst-performing�sectors�of�the�industry�
are�also�the�fastest-growing�
the pool would alter the current distribution of scores. If the new players were on average superior to the present group, the scores of the current players would drop. Correspondingly, if the additions were on average inferior, the current scores would increase. The magnitude of increase or decrease would depend on the number and relative performance of added species.
A review of cumulative scores for farmed salmon provides another perspective. Within many of the salmon products assessed, better practices (i.e., better scores on a per mT basis) are overshadowed by sheer production volume. For instance, Atlantic salmon from Norway drops from second to 38th place when its performance is assessed on a cumulative versus normalised level. Atlantic salmon from the UK drops from third to 28th place, and Atlantic salmon from Chile drops from 11th to almost the bottom of the entire industry (42nd out of 44) (Table 5). Atlantic salmon as a species group drops from a normalised score of 70 to a cumulative score of 36 (Figure 10). In contrast, Chinook salmon, by virtue of its modest volume, rises from 72 to 91.
Of course, GAPI users will define or interpret sustainability differently. What is an acceptable score to one user may not be acceptable to another. One of the main benefits of GAPI is that it allows each user to decompose the overall scores and evaluate a species (or country) indicator by indicator, so that performance within a particular impact category can be better understood. For instance, if a user is largely concerned about escapes of farmed salmon, that user likely would be comforted little by the species score of Atlantic salmon (70), given that the escapes score for this species is 39 (see Atlantic salmon results page). Similarly, if a user is most concerned about antibiotic use, that user might be encouraged by Norway’s antibiotics score of 99 for Atlantic salmon.
A Geographic divideA clear trend within GAPI is the geographic split in performance. Figure 9 lists both normalised and cumulative scores by country. Normalised country scores describe how well a country is performing compared to its peers, regardless of the size of the industry. These normalised country scores reveal clear geographic trends, with Asian countries comprising seven of the lowest ten scores, and European countries all scoring above average. Scores ranged from a low of 30 (Taiwan) to a high of 73 (New Zealand). The UK and Norway both receive the second-highest score of 72, followed by Egypt (71) and Canada (70).
The trend towards lower normalised scores in Asian countries largely results from the prevalence of poor perfor-mance in the Inputs category, such as ecological and industry energy, feed sustainability, and biochemical oxygen demand. Asian countries tend to score poorly in the antibiotics and parasiticides indicators since GAPI often assumed maximum allowable use of these chemicals in the absence of actual performance data (see the Country Results section for a more detailed discussion of performance among all indicator categories). In general, Asian cumulative scores improve relative to normalised scores by virtue of the modest production in those countries.

19 GAPI Global Aquaculture Performance Index www.gapi.ca
Warmwater and Coldwater speciesA related trend in the findings is that the worst-performing sectors of the industry are also the fastest-growing. Figure 10 lists both normalised and cumulative scores across all 20 species assessed within GAPI. Marine finfish farmed in tropical and sub-tropical waters, such as groupers (18), red drum (26), and cobia (37), have some of the lowest scores on both a normalised and cumulative level; however, production of these three species has grown over 40% per year during the last five years (FAO 2008). Low normalised scores in this sector are due to poor performance across most indicators. In particular, warmwater species consume large quantities of feed and antibiotics. Additionally, coldwater species tend to be produced in industrialised countries and have benefited from improved production efficiency. The same cannot be said for warmwater species, on average. As a con-sequence, the environmental performance of these emerging warmwater species lags behind coldwater species such as salmon (see Species Results for a more thorough examination of these findings). As aquaculture expands, attention should be placed on ensuring that the industry does not shift further towards the worst performers, at least until their performance improves significantly.
trophic level of the Farmed species“Trophic level” is an estimate of an animal’s place in the food web, ranging from two for herbivores to five or more for the highest-level predators. The trend in farming higher-trophic-level fish species is driven by economic factors. Farm-gate prices in 2007 increased exponentially with the trophic level of the species, and demand for high-trophic-level fish continues to mirror global spending power (FAO 2008).
While trophic level is often used as an indicator of environmental performance (i.e., assumption that the higher the trophic level, the worse the performance), GAPI revealed no association between a farmed species’ trophic level and its GAPI score (Figure 11). The lack of a connection between trophic level and the GAPI score is counter-intuitive. Conventional wisdom holds that high-trophic-level species are particularly problematic when reared at commercial-scale densities. In addition to requiring wild fish as a food source, placing species that natu-rally occur at low densities into high-density production facilities heightens stress and results in greater disease and parasite susceptibility.
This outcome may reflect the limited trophic diversity of marine aquaculture industry. Marine finfish aquaculture represents a rarefied sub-group within the aquaculture world. Half of the assessed species (62% by production) have on-farm trophic levels of 4.0 or greater. Only two assessed species (flathead grey mullet and milkfish) have a trophic level below 3.0. In contrast, 78% of production of the top 20 freshwater finfish in production have on-farm trophic levels of 3.0 or lower. Because most species are high-trophic-level, and due to the fact that GAPI does not assign a high weight to indicators with low variability, those indicators that incorporate trophic level, such as sustainability of feed, ecological energy, and industrial energy, tend not to dominate the final score. Inclusion of lower-trophic-level species would likely redefine what “good” performance looks like.

20 GAPI Global Aquaculture Performance Index www.gapi.ca
stage of development of the Production systemProduction systems are expected to evolve and improve in efficiency over time. Thus, one would expect to see improved GAPI scores increase the longer a production system has been in existence. Figure 12 plots the normalised and cumulative GAPI scores for all species-country pairs and differentiates them by the period of time (years) that each pair has been in culture.
All start-up production (0–5 years) assessed by GAPI took place in Asian countries, predominantly China. In these cases, both normalised and cumulative performance tend to be relatively poor. This is likely due to the fact that performance is so poor that even a relatively small volume of production carries a large ecological footprint.
As a system matures, ecological performance tends to improve in terms of both cumulative and normalised impacts. It is at this intermediate stage that overall performance appears to peak. Interestingly, most mature systems assessed by GAPI (41–60 years) tend to retain either a high normalised or cumulative score, but not both. Some sacrifice cumulative performance in pursuit of tremendous production (e.g., Atlantic salmon from Norway and milkfish from the Philippines). Others sacrifice normalised performance through farming products that are so ecologically damaging (Japanese tiger pufferfish and barramundi from Indonesia and Thailand) that high-volume production may not be feasible.
Figure 11: trophic level Versus species scores
SP
EC
IES
GA
PI
SC
OR
E (
NO
RM
.)
TROPHIC LEVEL
1.5 2.0 2.5 3.0 3.5 4.0 4.5 5.0
0
20
40
60
80
100
FLATHEAD GREY MULLET
MILKFISH TURBOT
TIGER PUFFERFISH
GROUPERS
RED DRUM
REDSEABREAM
LARGEYELLOW
CROAKER
COBIA
BARRAMUNDI
BASTARD HALIBUT
ATLANTIC SALMON
COHO SALMON
KOREAN ROCKFISH
ATLANTIC CODEUROPEAN SEABASS
GILTHEAD SEABREAM
JAPANESEAMBERJACK
JAPANESESEABASS
CHINOOK SALMON

21 GAPI Global Aquaculture Performance Index www.gapi.ca
Figure 12: normalised Versus Cumulative species-Country scores
0 10 20 30 40 50 60 70 80 90 1000
10
20
30
40
50
60
70
80
90
100
Cumulative GAPI
CU
MU
LA
TIV
E
NORMALISED
0—5 YEARS 6—20 YEARS 21—40 YEARS 41—60 YEARS
Cobia—China
Tiger pufferfish—China
Groupers—China
Red seabream—China
Bastard halibut—ChinaLarge yellow croaker—China
Japanese seabass—China
Atlantic salmon—Chile
Groupers—Indonesia
Cobia—Taiwan
Barramundi—Australia
Red drum—China
Chinook salmon—ChileAtlantic cod—Iceland
European seabass—Turkey
Bastard halibut—Korea, Republic ofKorean rockfish—Korea, Republic of
Atlantic cod—Norway
Barramundi—Thailand
Tiger pufferfish—Japan
Barramundi—Indonesia
Red seabream—Japan
Japanese amberjack—Japan
Milkfish—Philippines
Atlantic salmon—Norway
Milkfish—Indonesia
Groupers—Taiwan
Barramundi—Malaysia
Coho salmon—Chile
Atlanticsalmon—Canada Flathead grey mullet—Egypt
Atlantic salmon—United Kingdom
Chinook salmon—New Zealand
Turbot—France
Turbot—Spain
European seabass—Italy
European seabass—Spain
European seabass—Greece
Coho salmon—Japan
Gilthead seabream—Spain
Gilthead seabream—Italy
Gilthead seabream—Israel
Giltheadseabream—Turkey
Gilthead seabream—Greece

22 GAPI Global Aquaculture Performance Index www.gapi.ca
Increased�efficiency�translates�into�higher�GAPI�
scores�within�most�of�the�Inputs�indicators�
type of Production systemGiven recent interest in alternative production systems such as recirculating systems, we performed a cursory analysis of the impact of production technology on environmental performance. At a basic level, aquaculture operations can be either open or closed. Open systems include net pens and cages, wherein water can flow unfiltered through the aquaculture operations. For purposes of this assessment, closed systems include both ponds and land-based tank production systems, although these may still discharge untreated water. Of the 44 species-country pairs, 13 included at least some production in closed systems in 2007.
Figure 13 demonstrates the relationship between production systems and GAPI scores. For this analysis, the 44 species-country pairs were divided into three categories of performance: those that score an overall score of 0–30 (red); 30–60 (amber); and 60–100 (yellow). Next, the performers were divided based on whether they were predominantly open (31 performers) or closed systems (13). Then, overall scores of each performer were plotted against its average scores in the three indicator categories: Inputs, Discharges, and Biological.
Overall, closed systems fare better than their open-system counterparts. The closed-system category did not include one performer from the worst (red) performance grouping. Additionally, closed systems consistently outperformed open systems in all three indicator categories, especially Inputs and Discharges. The higher energy demands of some closed systems were offset by significant improvement in other inputs such as feed consumption and capture-based production (closed systems rely entirely on hatchery production).
Figure 13: Average Indicator Category scores (normalised) Among open and Closed systems
AV
ER
AG
E I
ND
ICA
TO
R C
AT
EG
OR
Y S
CO
RE
INPUTS DISCHARGES
OPEN CLOSED
BIOLOGICAL INPUTS DISCHARGES BIOLOGICAL0
20
40
60
80
1000—30 OVERALL GAPI SCORE 30—60 OVERALL GAPI SCORE 60—100 OVERALL GAPI SCORE

23 GAPI Global Aquaculture Performance Index www.gapi.ca
These results should be interpreted with caution as very few of the species and countries assessed utilise fully closed systems. Further, in those instances where open net pens were not used exclusively, the type of system in use is often not explicit. Performance profiles of different pond and tank systems also differ widely across indica-tors. The next phase of GAPI, which will assess farm-level performance, will explore with greater precision the effect of differing husbandry and production systems on environmental performance.
economic driversPositive relationship between a Country’s PPP and GAPI scores
Yale University’s Environmental Performance Index (EPI) found a strong positive relationship between a country’s environmental and economic performances. This supports the notion that wealthy countries can often afford to be better stewards of their environment. GAPI scores exhibit this same trend; countries with high purchasing power parity (PPP) tend to receive top scores (Figure 14).
no relationship between species Value and GAPI scores
In theory, higher-value products generate greater economic benefits per mT produced, and that revenue can potentially be used to adopt more ecologically sound production methods. A quick review of the species-country scores only partially supports this hypothesis (Figure 15). While the very worst performers are some of the lowest-value species, some of the best performers are relatively low-value species as well.
Figure 14: PPP (usd) Versus Country scores (normalised)
CO
UN
TR
Y G
AP
I S
CO
RE
(N
OR
M.)
PPP (USD)
$0 $10,000 $20,000 $30,000 $40,000 $50,000 $60,0000
20
40
60
80
100

24 GAPI Global Aquaculture Performance Index www.gapi.ca
Comparing environmental Performance Across IndicatorsWhile the overall GAPI scores are very instructive, of even greater interest are the differential performances within each indicator that comprises the final score (Table 6). While the overall GAPI scores reflect aggregated performance trends, the individual indicators highlight areas where a particular production system excels and where improvement is possible.
For instance, in Table 6 turbot from Spain and coho salmon from Chile both score 63. The turbot scores poorly for antibiotic use (23), an indicator for which the coho scores reasonably well (68). In contrast, the coho performs poorly with respect to escapes (37) compared to turbot (61). Similarly, barramundi from Australia and red seabream from Japan both have a species score of 47. The barramundi scores poorly for parasiticides use (30) compared to the red seabream (72). Conversely, the red seabream performs poorly for biological oxygen demand (9), while the barramundi scores reasonably well (62).
The examples for comparison are infinite. However, deeper analysis of the performance within all species and country categories is provided within the Species Results and Country Results provided at the end of this report. Detailed analysis will also be provided and updated on the GAPI website, www.gapi.ca.
Figure 15: species-Country scores Versus species Value (usd $’000/mt)
SP
EC
IES
-CO
UN
TR
Y P
AIR
SC
OR
E (
NO
RM
.)
2007 VALUE (USD $'000/mT)
0 5 10 15 20 25 300
20
40
60
80
100

25 GAPI Global Aquaculture Performance Index www.gapi.ca
table 6: species–Country Performance Across GAPI Indicators
SPECIES–COUNTRy�PAIR
INPUTS DISCHARGES BIOLOGICAL OVERALL�
SPECIES-
COUNTRy�
GAPI�SCORECAP ECOE FEED INDE ANTI BOD COP PARA ESC PATH
Atlantic cod–Iceland 100 64 68 58 98 92 28 88 0 87 69Atlantic cod–Norway 100 64 68 58 98 59 28 45 0 63 62Atlantic salmon–Canada 100 74 75 57 90 66 28 99 39 72 70Atlantic salmon–Chile 100 72 75 62 68 81 28 77 38 67 66Atlantic salmon–Norway 100 75 75 64 99 50 28 84 40 78 72Atlantic salmon–UK 100 66 75 60 96 61 49 53 40 86 72Barramundi–Australia 100 70 65 0 58 62 28 30 35 24 47Barramundi–Indonesia 100 39 44 40 42 94 28 5 35 57 46
Barramundi–Malaysia 100 39 44 40 77 75 28 0 35 57 50Barramundi–Thailand 100 39 44 40 38 0 28 40 35 46 41Bastard halibut–China 100 59 34 61 37 39 28 69 49 0 41Bastard halibut–Korea, Republic of 100 51 42 23 82 44 100 4 100 57 61Chinook salmon–Chile 100 75 75 55 68 98 28 64 42 53 64Chinook salmon–New Zealand 100 70 52 43 100 100 28 100 47 100 73Cobia–China 100 0 51 5 37 42 28 35 41 60 37Cobia–Taiwan 100 0 51 5 24 74 28 6 41 60 35Coho salmon–Chile 100 71 75 59 68 90 28 64 37 52 63Coho salmon–Japan 100 68 62 61 13 68 28 79 34 77 56European seabass–Greece 100 61 75 50 81 58 28 81 47 75 66European seabass–Italy 100 61 72 31 64 97 64 81 74 75 69European seabass–Spain 100 60 69 47 57 93 31 78 49 75 63European seabass–Turkey 100 59 74 43 50 66 28 81 53 75 61Flathead grey mullet–Egypt 68 75 99 57 32 79 100 81 41 91 71Gilthead seabream–Greece 100 67 79 60 50 49 28 57 5 56 56Gilthead seabream–Israel 100 69 80 41 50 69 49 77 32 56 60Gilthead seabream–Italy 100 67 81 37 50 98 64 81 53 56 65Gilthead seabream–Spain 100 67 72 57 50 90 31 56 8 56 57Gilthead seabream–Turkey 100 69 69 55 50 66 28 81 5 44 55Groupers–China 0 0 0 0 37 21 28 47 35 3 15Groupers–Indonesia 0 0 0 0 0 85 28 6 32 3 10Groupers–Taiwan 0 41 45 39 24 58 28 0 35 3 28Japanese amberjack–Japan 99 60 39 56 36 0 28 84 43 32 45Japanese seabass–China 54 24 18 25 31 4 28 44 35 57 32Korean rockfish–Korea 100 55 52 40 82 45 28 0 49 57 54Large yellow croaker–China 100 23 33 27 31 37 28 89 48 57 41Milkfish–Indonesia 98 80 90 61 97 67 28 45 46 39 68Milkfish–Philippines 98 78 90 57 69 37 28 0 46 39 59Red drum–China 100 0 4 5 37 21 28 49 37 37 26Red seabream–China 100 0 0 0 37 11 28 65 44 32 25Red seabream–Japan 100 59 60 52 36 9 28 72 44 32 47Tiger pufferfish–China 100 66 11 60 37 72 28 84 47 3 42Tiger pufferfish–Japan 100 69 11 60 36 80 28 21 47 3 39Turbot–France 100 68 81 44 52 100 51 67 61 73 68Turbot–Spain 100 68 83 44 23 82 51 65 61 73 63Average Indicator Scores 91 53 56 42 54 61 35 55 40 52

26 GAPI Global Aquaculture Performance Index www.gapi.ca
A Global Perspective of the Marine Aquaculture IndustryEcological assessments of aquaculture to date have typically focused on single species or jurisdictions. In some cases, only single issues are addressed within these assessments (e.g., escapes or energy use). While these analyses are informative within a restricted context, the global scope of GAPI provides novel insights never before available. Summing cumulative data within various indicators provides an aggregated global picture of the marine finfish aquaculture sector. For instance, data collected by GAPI suggest that:
The global marine finfish aquaculture industry used an estimated 5.5 million kg of antibiotics (aggregate •amount across the 44 species-countries assessed). This material, much of which was discharged directly into the marine environment, is comprised almost exclusively of compounds considered critical for human and/or veterinary medicine.Approximately 16.4 million kg of parasiticides were deployed, the majority of which are broad-spectrum •toxins with unknown impacts on non-target organisms.The equivalent of 1.1 x 10• 14 g C of primary productivity was appropriated for the production of the 20 assessed species. Over 98% of this material (in terms of net primary productivity [NPP]) was derived from marine organisms, almost entirely fish. Assuming a mean oceanic productivity of 140 g C per m2 per year, this suggests that the marine finfish production assessed by GAPI consumed approximately 770,000 km2 of oceanic productivity—an area the size of the East China Sea.
Of course, while GAPI provides a coarse estimate of environmental impact, these initial global estimates begin to reveal the global footprint of marine aquaculture. The aggregate impact of this industry is explored further on the GAPI website, www.gapi.ca.
sensItIVIty AnAlysIs
In developing the GAPI methodology, one concern was how to weight indicators. Several different techniques can be used to weight indicators, including: weighting all indicators equally, weighting each category of indicators equally (i.e., Inputs, Discharges, and Biological), or using a statistical technique known as principal component analysis (PCA) to weight them according to their relative importance in predicting overall variation (see the Methods section for further explanation of weighting within GAPI). The concern is that the choice of weighting technique may substantially affect the results. The validity of this concern was tested using a sensitivity analysis known as a non-parametric Kendall’s tau rank correlation test. This test was used to determine the extent to which the rank of a species-country pair changes when indicators are weighted using PCA versus equally weighted indicators. Results can range from zero (the ranks from worst to best are completely reversed) to one (the ranks remain completely unchanged).

27 GAPI Global Aquaculture Performance Index www.gapi.ca
For this assessment, Kendall’s tau was 0.89, indicating that there was only a very modest change in the overall structure of the rankings in using PCA versus equally weighted indicators. PCA was ultimately selected as the preferred technique for weighting indicators. The use of PCA led the three groups of indicators (Inputs, Discharges, and Biological) to be weighted differently. The composite weight of the four Inputs indicators is 43%; the four Discharge indicators, 34%; and the two Biological indicators, 23%.
Figure 16 plots the overall GAPI scores of all species-country pairs against the mean score of these pairs in each of the three indicator groups to ensure that none of the three indicator categories was driving overall GAPI performance. Despite the differential weightings of the three groups, there is clear consistency in performance. Low overall GAPI scores are a product of consistently poor performance across all three groups. Likewise, high overall GAPI scores are generally a product of superior performance in all three groups.
A second factor of concern was that, in some cases, the limited number of performers in a species group (i.e., only one or two countries) or in a country group (i.e., only one or two species) may reduce the robustness of the GAPI scores. Because the GAPI decision rule is focused on assessing the top 20 species (by production), and then those countries that comprise 90% of production of each of those species, in some cases, only one species within a country or one producing country for a given species was assessed. For example, 11 countries were assessed on the basis of a single species. Likewise, two species (Korean rockfish and large yellow croaker) were only assessed in single countries.
While�GAPI�provides�a�coarse�estimate�of�
environmental�impact,�these�initial�global�
estimates�begin�to�reveal�the�global�footprint�
of�marine�aquaculture�
Figure 16: species-Country Pair scores Versus Average Indicator Category score
AV
ER
AG
E I
ND
ICA
TO
R C
AT
EG
OR
Y S
CO
RE
INPUTS DISCHARGES BIOLOGICAL
0
20
40
60
80
1000—30 OVERALL GAPI SCORE 30—60 OVERALL GAPI SCORE 60—100 OVERALL GAPI SCORE

28 GAPI Global Aquaculture Performance Index www.gapi.ca
GAPI assumes that the greater the number of performers that comprise species and country scores, the more robust the GAPI findings are likely to be. For example, China ranks 21st out of the 22 assessed countries. Because China’s score is comprised of eight species assessments, we can have relatively high confidence that China is a demonstrably and consistently poor performer. In contrast, Thailand’s rank (20th of 22 assessed countries) is derived from a single species assessment (barramundi). As a consequence, we have less confidence in our ability to assume that Thailand’s entire marine finfish sector is a poor performer.
Lastly, it is a valid concern that, depending on the pool of players included in the assessment, GAPI scores may change substantially. In particular, a pool that includes a preponderance of poor performers may seem to artificially inflate the scores of otherwise mediocre players. This is a concern, given that the group currently being assessed (marine finfish) was selected due to concerns over its environmental footprint. This group arguably lacks representatives from the better-performing sectors of aquaculture (e.g., mollusks, algae, and freshwater herbivores).
To evaluate the sensitivity of GAPI scores to changes in the overall pool of players, we reassessed the field after removing the bottom two, bottom five, and bottom 10 species-country performers. The score of New Zealand Chinook salmon (first of 44 pairs) dropped from 73 to 72, 70, and 67, respectively. The scores of the top performers appear relatively robust compared to fluctuations in the distribution of poorer players. However, the assessment of poor performers is somewhat more volatile. For instance, when large yellow croaker from China is demoted to “worst performer” (performers ranked 34th or worse are removed from the assessment), its score of 40 drops by 25% to 30.

29 GAPI Global Aquaculture Performance Index www.gapi.ca
t
OvervIew Conclusions
The 2010 GAPI offers a first-of-its kind analysis of the environmental performance of marine finfish aquaculture systems. The findings of the first phase of GAPI point to some clear policy conclusions, which are:
sustainability must be demonstrated.Data availability and quality remain preeminent challenges to any assessment of sustainability. However, verification of the sustainability of any production system requires that abundant, high-quality data are available for analysis. If industry and/or governments are interested in verifying claims of aquaculture’s sustainability, more and better-quality data are needed. Data deficiencies are particularly challenging in the traceability of feed stocks, feed formulations, and the cumulative ecosystem effects of both chemical use and escapes. The long-running debate regarding the sustainability of marine aquaculture has been largely informed by qualitative information and spotty data. The long-term ecological and economic viability of the industry depends on shifting policy and production decisions towards quantitatively rigorous performance-based regulatory frameworks such as GAPI.
We must test our assumptions.GAPI shows us that our assumptions are not always correct. As might be expected, tropical and sub-tropical species fared poorly in the GAPI analysis. However, quite unexpectedly, high-trophic-level species did not neces-sarily perform poorly in many cases. Importantly, the GAPI analysis allows us to put our assumptions to the test, measure and compare environmental performance more rigorously, and design informed and effective solutions to pressing aquaculture issues.
not all marine finfish aquaculture is created equal.The initial results indicate that there is substantial variation within the environmental performance of the marine finfish aquaculture industry. The distribution of scores shows a smooth linear progression, with the largest gap between any two species-country scores being five points. GAPI demonstrates that even among species and within countries, there can be substantial variation in performance. However, GAPI enables us to identify why species or country scores are what they are and determine how their peers have addressed the same challenges.
there is still a lot of work ahead.Normalised performance scores range from what could be described as mediocre to poor—begging the question of what does “good” performance look like. Assigning letter grades (A, B, C, etc.) is somewhat arbitrary. Where the break between a grade of “B” and of “C” sits is, to some extent, in the eye of the interpreter. Further, where a single point separates a “B” performance from a “C” performance in an assessment framework, on-the-water performance differences would be almost imperceptible. That said, even the best performer among the marine fin-fish species assessed is 27 points away from the ecological goalpost, a GAPI score of 100. The worst performers score as low as 10 out of 100. Given that GAPI has been used to assess over 90% of marine finfish production by volume and value, the findings strongly suggest that there is still much room for improvement within this sector.
Aquaculture sustainability must be viewed in the proper context.Only those species and countries that dominate current global marine finfish production were included in this iteration of GAPI. Because the analytical framework seeks to highlight performance differences among players, it

30 GAPI Global Aquaculture Performance Index www.gapi.ca
stands to reason that including new additional species, products of small artisanal systems, or even different types of production systems (e.g., integrated polyculture) would change the GAPI performance landscape. A current high performer may or may not maintain that position when included in a broader mix of players.
To this end, the next phase of the GAPI project (beginning summer 2010) will explore a farm-level aquaculture analysis, culminating in a farm-level aquaculture performance index that parallels the GAPI country-level index. Also within this next phase a benchmarking study of marine aquaculture standards will be undertaken. Utilising the GAPI methodology, both the absolute (against zero-impact targets) and relative (against peers) environmental performance of aquaculture standards in existence and in development will be assessed. Results of this study will be available in early 2011.
For the first time, impacts of marine finfish aquaculture can be viewed on a global or aggregate scale.By summing cumulative data across farmed marine species, GAPI yields a global perspective of environmental performance. We now have some understanding of marine finfish aquaculture’s cumulative appropriation of ecological productivity and its consumption of antibiotics and other chemicals. Just as cumulative performance of a production system is important to track, the cumulative industry-wide performance is likewise important to monitor.
Current environmental challenges facing aquaculture cannot be solved by improving on-farm practises alone.As the comparison of normalised to cumulative scores demonstrates, the sheer scale of production can have drastic effects on environmental performance and must be incorporated into any environmental performance assessment. GAPI highlights the inverse relationship between normalised and cumulative scores. Some of best-performing sectors per unit of production have the worst cumulative impacts.
By analogy, U.S. automobile greenhouse gas emission standards are among the most stringent in the world, but due to the sheer volume of automobiles in use, automobiles cumulatively comprise one-third of all U.S. green-house gas emissions. Benefits of improved normalised performance can only be realised if scale is kept in check. Even the worst-performing production system is of little concern if there is only one farm. Alternatively, a reason-ably good performer can be cause for concern if scale is large. Witness Norwegian Atlantic salmon—ranked second on the normalised scale but 38th on the cumulative scale.
This result begs the question: How do we grow aquaculture in a way that both supports the global food industry and mitigates local environmental damage? Clearly, part of the answer lies in selecting the right species and choosing the right environments in which to grow them (i.e., reducing normalised scores). At the same time, regulators need to consider the carrying capacity of local waters and begin to design and reward operations that minimise their environmental footprint.

31 GAPI Global Aquaculture Performance Index www.gapi.ca
IndIcAtOrs
Capture-Based�Aquaculture�CAP��� � � � � � � � � � � � � � � � � � � � � � � � � � � � � � � � � � � 33
Ecological�Energy�ECOE��� � � � � � � � � � � � � � � � � � � � � � � � � � � � � � � � � � � � � � � � � � � � � � � � � � � � 37
Industrial�Energy�INDE�� � � � � � � � � � � � � � � � � � � � � � � � � � � � � � � � � � � � � � � � � � � � � � � � � � � � � � 39
Sustainability�of�Feed�FEED��� � � � � � � � � � � � � � � � � � � � � � � � � � � � � � � � � � � � � � � � � � � � � � 41
Antibiotics�ANTI�� � � � � � � � � � � � � � � � � � � � � � � � � � � � � � � � � � � � � � � � � � � � � � � � � � � � � � � � � � � � � � � � � � 45
Antifoulants�(Copper)�COP��� � � � � � � � � � � � � � � � � � � � � � � � � � � � � � � � � � � � � � � � � � � � � � �48
Biochemical�Oxygen�Demand�BOD��� � � � � � � � � � � � � � � � � � � � � � � � � � � � � � � � � 50
Parasiticides�PARA��� � � � � � � � � � � � � � � � � � � � � � � � � � � � � � � � � � � � � � � � � � � � � � � � � � � � � � � � � � � � 53
Escapes�ESC�� � � � � � � � � � � � � � � � � � � � � � � � � � � � � � � � � � � � � � � � � � � � � � � � � � � � � � � � � � � � � � � � � � � � � � � � � 55
Pathogens�PATH��� � � � � � � � � � � � � � � � � � � � � � � � � � � � � � � � � � � � � � � � � � � � � � � � � � � � � � � � � � � � � � � � � 58

32 GAPI Global Aquaculture Performance Index www.gapi.ca
IndIcAtOrs GAPI environmental Performance Indicators
tThis section of the report provides a summary of each of the 10 GAPI indicators, including the rationale for inclusion within GAPI and a review of the indicator formula and calculation. Table 7 provides a snapshot of these 10 indicators of environmental performance:
table 7: GAPI environmental Performance Indicators
GROUPING INDICATOR INDICATOR�DESCRIPTION INDICATOR�FORMULAS*
INPUTS Capture-Based Aquaculture (CAP)
The extent to which a system relies on the capture of wild fish for stocking farms, taking into account the sustainability of these wild fish inputs
∑(Amount from Wild Capture (kg) × Sustainability Score)
mT Fish Produced
Ecological Energy (ECOE)
Amount of energy, or net primary productivity (NPP), that farmed fish divert from the ecosystem through consumption of feed ingredients
∑Net Primary Production of Feed Inputs (mT carbon)
mT Fish Produced
Industrial Energy (INDE)
Energy consumed in production and in the acquisition and processing of feed ingredients
∑(Proportion Fish/Livestock/Plant/Production System x Knife Coefficient (Megajoules/mT) ×
Total Feed Consumed (mT))
mT Fish Produced
Sustainability of Feed (FEED)
Amount, efficiency, and sustainability of wild fish ingredients of feed
∑(Proportion of Feed by Species × Sustainability Score of Each Species) ×
Fish In: Fish Out Ratio
mT Fish Produced
DISCHARGES Antibiotics (ANTI)
Amount of antibiotics used, weighted by a measure of human and animal health risk
∑(Amount Active Ingredient (kg) × WHO-OIE Score)
mT Fish Produced
Antifoulants (Copper) (COP)
Estimated proportion of production using copper-based antifoulants
mT Fish Produced × % Production Using Copper-Based Antifoulants
mT Fish Produced
Biochemical Oxygen Demand (BOD)
Relative oxygen-depletion effect of waste contaminants (uneaten feed and feces)
BOD (mT O2) × Area of Impact (km2)
mT Fish Produced
Parasiticides (PARA)
Amount of parasiticides used, weighted by mea-sures of environmental toxicity and persistence
∑(Amount (kg) × [(1/LC50)+1] × Persistence (Days))
mT Fish Produced
BIOLOGICAL Escapes (ESC) Number of escaped fish, weighted by an estimate of the per capita risk associated with escapes
GAPI Invasive Score × # Escaped Fish
mT Fish Produced
Pathogens (PATH)
Number of on-farm mortalities, weighted by an estimate of wild species in the ecosystem that are susceptible to farm-derived pathogens
∑Pathogen-specific Wild Losses (mT)
mT Fish Produced
* GAPI takes the square root of each indicator formula to make the range of performance values more manageable and to spread out the final scores so that differences in scores are more apparent.

33 GAPI Global Aquaculture Performance Index www.gapi.ca
IndIcAtOrs Capture-based Aquaculture CAP
IndICAtor bACkGround And rAtIonAle For InClusIon
Some aquaculture production systems, known as capture-based aquaculture (CBA), depend on the capture of wild fish either as a source of broodstock (mature fish used for breeding) or as farm stock that are raised to com-mercial size (i.e., ranching). The life stage of the species may range from larvae to adult at the time of capture (Lovatelli and Holthus 2008). The capture of wild fish for use in aquaculture results in the same set of pressures as a conventional fishery. Specific impacts associated with ongoing CBA fisheries are the reduction of (wild) genetic biodiversity, stock depletion or collapse from low recruitment, habitat degradation from capture methods, and localised or wide-scale population disturbances (Ottolenghi et al. 2004).
FormulaAmount from Wild Capture (kg) × Sustainability Score
mT Fish Produced
Sustainability Score• = (harvest performance) × (stock status) × (management score)units kg × sustainability score per mT fish producedtarget Zerosources1 Amount from Wild Capture: FishSource; FishStat Plus (FAO 2008)
Sustainability Score: FAO; Sustainable Fisheries Partnership; FishSource
IndICAtor ForMulA
This indicator is a measure of the sustainability of capture-based aquaculture. If the performer does not rely on the capture of wild fish to sustain its production, it receives a perfect score (100) for this indicator.
Amount of Wild Capture (kg)Within the CAP formula, the amount of wild capture measures the loss in future biomass of seed fish resulting from capture-based aquaculture. It is calculated accordingly:
Amount of Wild Capture (or Lost Future Biomass) = Total Weight Removed from Wild − (Total Weight Removed from Wild × Natural Mortality)
This calculation measures the total volume of fish removed from the wild ecosystem, but it adjusts for natural mortality to account for the fact that not all fish removed from the wild would have survived if left in the wild. This avoids any overestimation of the impact of wild fish removed. Once the volume of fish removed from the wild is calculated, it is multiplied by the Sustainability Score to obtain a measure of the total seed removed from the wild that is unsustainably fished and/or poorly managed.
1 Complete information on all data sources is provided on the GAPI website, www.gapi.ca.
INPUTS

34 GAPI Global Aquaculture Performance Index www.gapi.ca
IndIcAtOrs Capture-based Aquaculture
sustainability score CalculationThe Sustainability Score of the fishery supplying the seed for an aquaculture system is the product of three factors: harvest performance, stock status, and an assessment of the management regime for that particular fishery. These three measures are multiplied so that the final Sustainability Score most effectively differentiates between high and low performers.
harvest PerformanceThis measures the percentage of the actual catch of the fishery that is over the set management catch limit. Where actual catch is above the management limit, the harvest performance is:
Harvest Performance =Actual Catch − Mgmt Catch Limit
× 100Actual Catch
However, where actual catch is below the management limit, the numerator is transformed to 1. Thus, the equa-tion for harvest performance is:
Harvest Performance =1
× 100Actual Catch
Management catch limit information is largely taken from FishSource (2010) (www.fishsource.org). GAPI’s first preference is to use the biological maximum sustainable yield (Bmsy) as the management catch limit for each species. However, if the Bmsy is unavailable, GAPI uses the total allowable catch (TAC). If the TAC is unavailable, GAPI uses the spawning stock biomass (SSB) or any other available management catch limit. If no management catch limit was set for the assessment year (2007), GAPI uses the best of Bmsy, TAC, or other management catch limit (in order of preference) for the most recent year. If no management catch limit was ever set for the fishery, GAPI assumes that the management catch limit is zero. This leads to a harvest performance score where 100% of catch is considered to be over the management catch limit (i.e., the worst-case scenario).
stock statusIn 2005, the FAO assigned categorical values to the health of fish stocks. The four categories ranged from underexploited to overexploited-depleted. Within GAPI, these categorical scores are converted to numeric scores between one and four, with one being the best performance (underexploited) and four being the worst perfor-mance (overexploited-depleted).
INPUTS

35 GAPI Global Aquaculture Performance Index www.gapi.ca
IndIcAtOrs Capture-based Aquaculture
Management scoreThe Sustainable Fisheries Partnership (SFP) (Fish Source 2010), examined the sustainability of world fisheries used for reduction purposes (e.g., aquaculture feeds). SFP used the setting of biological reference points (BRPs) as an indicator of the sustain-ability of reduction fisheries. BRPs can be derived using a variety of approaches. Ecosystem-based management is considered to be the best approach for setting upper target reference points, while B20 or biomass/recruitment models are considered the best approach for setting lower limit reference points.
Based on the BRP information provided in the SFP report, GAPI assigned a score between one and nine, where nine represents the worst possible performance (no upper and lower limits set) and one represents the best possible performance (use of ecosystem-based management and B20 to set upper and lower limits, respectively) (Table 8).
Fisheries terminology
B20 and Biomass/Recruitment Models—Limiting fishing so that 20% of the original unfished biomass is unharvested
Bpa—A fishing limit set slightly more stringently than the B20 level to create a buffer ensuring that the number of fish removed from the population does not meet or exceed 20% of the spawning stock biomass
Ecosystem-Based Management—According to the FAO Code of Conduct for Responsible Fisheries (1995), management measures should not only ensure the conservation of target species but also that of species belonging to the same ecosystem or associated with or dependent upon the target species
Fecundity—The fertility of the fish stock, or how quickly the stock can reproduce to sustain its population
Maximum Sustainable Yield (Bmsy)—In theory, the maximum volume of fish (catch) that can be removed from a species’ stock over an indefinite period while still maintaining the maximum growth rate of the population
Spawning Stock Biomass (SSB)—The total weight of all sexually mature fish in a population
Total Allowable Catch (TAC)—The total catch of stock permitted to be removed in a specified period (usually a year), as defined in the management plan. The TAC may be allocated to stakeholders in the form of quotas representing specific quantities or proportions.
table 8: GAPI Management scores
BIOLOGICAL�REFERENCE�POINTS�(BRPs)
MANAGEMENT�
SCORE
BRP�FOR��
UPPER�LIMIT
BRP�FOR�
LOWER�LIMIT
None None 9
B20 None 8
B20 Bpa 7
None Fecundity 6
B20 Fecundity 5
None Bmsy 4
B20 Bmsy 3
None Ecosystem 2
B20 Ecosystem 1
INPUTS
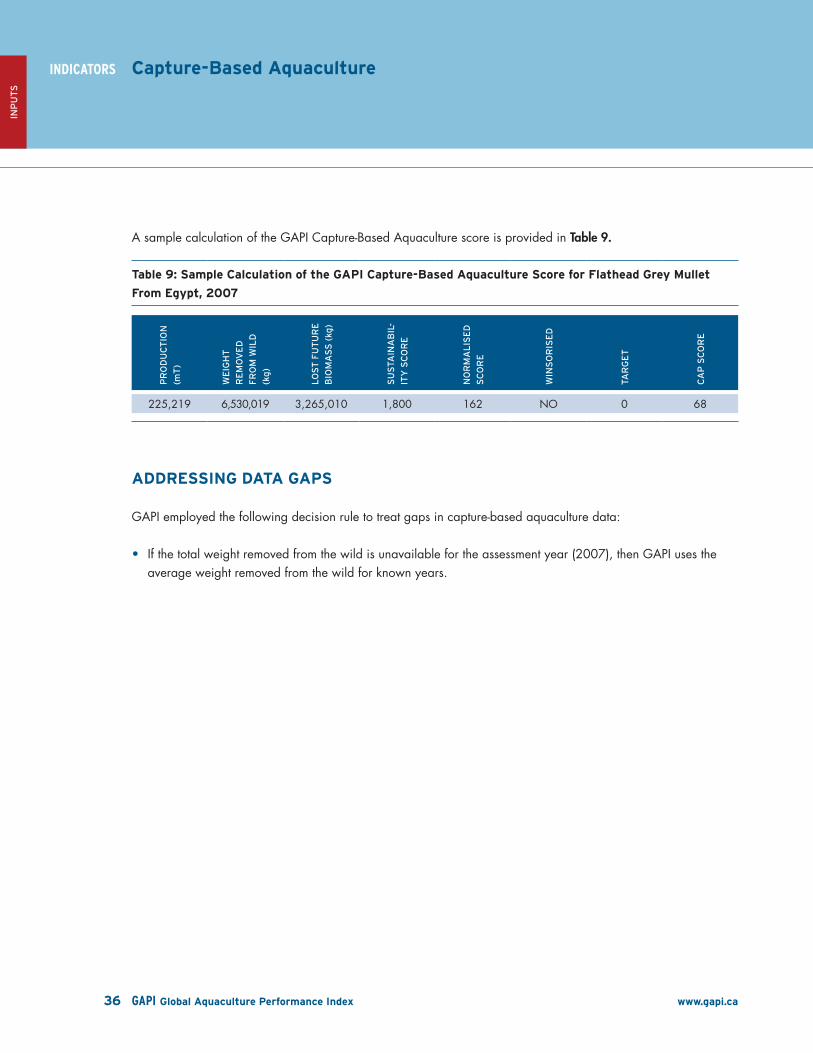
36 GAPI Global Aquaculture Performance Index www.gapi.ca
IndIcAtOrs
A sample calculation of the GAPI Capture-Based Aquaculture score is provided in Table 9.
table 9: sample Calculation of the GAPI Capture-based Aquaculture score for Flathead Grey Mullet
From egypt, 2007
PRO
DUCTIO
N�
(mT)
WEIG
HT�
REM
OVED�
FRO
M�W
ILD�
(kg)
LOST�F
UTURE�
BIO
MASS�(kg
)
SUSTA
INA
BIL
-
ITy�S
CO
RE
NO
RM
ALIS
ED�
SCO
RE
WIN
SO
RIS
ED
TARGET
CA
P�S
CO
RE
225,219 6,530,019 3,265,010 1,800 162 NO 0 68
AddressInG dAtA GAPs
GAPI employed the following decision rule to treat gaps in capture-based aquaculture data:
If the total weight removed from the wild is unavailable for the assessment year (2007), then GAPI uses the •average weight removed from the wild for known years.
Capture-based Aquaculture
INPUTS

37 GAPI Global Aquaculture Performance Index www.gapi.ca
IndIcAtOrs ecological energy eCoe
IndICAtor bACkGround And rAtIonAle For InClusIon
Within GAPI, energy consumption is divided into two categories: industrial energy and ecological energy. Industrial energy is energy as we commonly know it—resources such as petroleum and hydroelectric power that are used by aquaculture producers to support fish-farming activities. Ecological energy is not as familiar a concept, however. It is a measure of how much energy, or net primary productivity (NPP), is imbedded in the feed that is consumed by farmed fish.
Fish meal and fish oil continue to play an integral role in fulfilling the nutritional needs of aquaculture species, particularly for carnivorous marine finfish species (Deutsch et al. 2007; Kristofersson and Anderson 2006; Naylor et al. 1998; Naylor et al. 2000; Tacon and Metian 2008). While the sustainability of feed (FEED) indica-tor measures the amount and sustainability of the wild fish that goes into farming marine finfish, the ecological energy indicator (ECOE) focuses specifically on how much ecological energy these systems take out of the environ-ment (i.e., NPP). Values for NPP can be easily obtained by converting the amounts of feed ingredients consumed by each species into grams of Carbon (g C) consumed per kilograms (kg) of farmed fish (Tyedmers 2000).
So, what is ECOE measuring exactly? Energy is converted up the food chain, from solar energy (sunlight) into forms that are biologically consumable. The ECOE indicator measures the magnitude of photosynthesis diverted from the ecosystem and appropriated by an aquaculture production system. Conversion of energy up the food chain is not 100% efficient, however. As energy is converted from plants to successively higher positions on the food chain (i.e., trophic levels), there is always a net loss of usable energy (second law of thermodynamics). In wild systems, roughly 10% of the energy contained in the biomass of the prey is converted to the biomass of the predator. Thus 90% of the energy is lost in the transfer. The higher the trophic level, the greater the net primary productivity needed to produce the fish and the higher the ECOE score. For example, the production of one kilogram of adult cobia requires the equivalent of approximately 10,000 kg of photosynthetic plankton.
While the case can be made that fishery by-products, by-catch, and discarded fish are more sustainable feed alternatives than using wild fish meal and fish oil directly, all of these sources still require the removal of wild fish from the ecosystem and have associated ecological ramifications. Thus, GAPI includes within the ECOE calcula-tion all wild sources of fish feed and oil, no matter how the fish are caught or the initial destination.
It is also necessary to account for the net primary productivity of the agriculture and livestock components of feed. GAPI uses the NPP of poultry as a proxy for the NPP of all livestock, since chicken is a major protein input of feed and typically displays similar feed conversion rates to swine and slightly higher than cattle (Tyedmers 2000). For the plant proportion, a composite value is used, derived from NPP values for wheat, corn, and soy.
INPUTS

38 GAPI Global Aquaculture Performance Index www.gapi.ca
IndIcAtOrs ecological energy
Formula Net Primary Production of Feed Inputs
mT Fish Produced
Net Primary Productivity of Feed Inputs (NPP)• = (m/9) x 10(T-1) (Tyedmers 2000), where 9 represents a conservative 9:1 conversion ratio from wet weight to carbon contentm• = Mass of feed components (mT)T• = Trophic level of the feed components
units NPP (in mT C) per mT producedtarget Zerosources1 National and regional statistics; FAO; seafood industry trade press; scientific literature
Feed Components—The proportion of feed comprised of fish, livestock, and plants is calculated from either industry figures for feed composition or literature published on diet compositions.
IndICAtor ForMulA
A sample calculation of the GAPI Ecological Energy Score is provided in Table 10.
table 10: sample Calculation of the GAPI ecological energy score for Atlantic salmon From Chile, 2007
FEED�
COM
PONENTS
PRO
PO
RTIO
N
FCR
PRO
DUCTIO
N�
(mT)
MASS�
OF�F
EED�
COM
PONENTS
TRO
PH
IC�
LEVEL
NPP
SUM
�OF�N
PP
NO
RM
ALIS
ED�
SCO
RE
WIN
SO
RIS
ED
TARGET
ECO
E�S
CO
RE
Fish 0.31
1.30 378,817
152,663.25 3.10 2,135,462.73
2,232,313.61 2.43 NO 0 75Livestock 0.12 59,095.45 2.00 65,661.61
Plants 0.57 280,703.40 1.00 31,189.27
Proportion = Feed component proportion used in feedFCR = Feed conversion ratio of the particular speciesMass of Feed Components = Proportion × FCR × total production
Normalised Score = See formula aboveECOE Score = Normalised score after proximity-to-target calculation
AddressInG dAtA GAPsGAPI employed the following decision rules to treat gaps in ecological energy data:
GAPI assumes that no livestock components are present in feed mixtures consumed in all European Union •countries due to EU regulations banning the use of these components in feed.If the proportion of fish, plant, or livestock is unknown, GAPI uses the most recent data for that country and/or •a similar species.
1 Complete information on all data sources is provided on the GAPI website, www.gapi.ca.
INPUTS

39 GAPI Global Aquaculture Performance Index www.gapi.ca
IndIcAtOrs Industrial energy Inde
IndICAtor bACkGround And rAtIonAle For InClusIon
Within GAPI, energy consumption is divided into two categories: industrial energy and ecological energy. Industrial energy is energy as we commonly know it—resources such as petroleum and hydroelectric power that are used by aquaculture producers to support fish-farming activities. Ecological energy, however, is a measure of how much energy, or net primary productivity (NPP), is embedded in the feed that is consumed by farmed fish. The industrial energy indicator (INDE) evaluates only the industrial energy component.
The acquisition, processing, and transport of feed ingredients accounts for up to 94% of the total energy consumption of a conventional net pen aquaculture production system (Ayer and Tyedmers 2009; Pelletier et al. 2009). Energy use of non-conventional production systems (e.g., closed containment, bag technologies) is not so tightly tied to feed-related energy use, however. GAPI uses an average value (megajoules/mT) for different production systems. The INDE indicator also includes the production energy embedded in marine, plant, and livestock inputs.
Formula∑(Proportion Fish/Livestock/Plant/Production System) × Knife Coefficient (megajoules/mT) ×
Total Feed Consumed (mT))
mT Fish Produced
Knife coefficient• = Average energy of fish, livestock, and plant components in feed (Tyedmers, pers. comm. 2009; Ayer and Tyedmers 2009; Pelletier et al. 2009)
units Megajoules (MJ) per mT fish producedtarget Zerosources1 National and regional statistics; FAO; seafood industry trade press; scientific literature
IndICAtor ForMulA
Industrial energy consumption is calculated as the energy use (MJ) embedded in feed used to produce one mT of fish in that country. Using values from Life Cycle Analysis on salmon (a full “cradle to grave” analysis of environ-mental impacts), the knife coefficient represents the amount of industrial energy necessary for production of feed components and differing production systems (Ayer and Tyedmers 2009; Pelletier et al. 2009). The components are separated into livestock, plant, and marine. Energy input for each of these includes production, raw material processing/reduction, and feed milling.
A sample calculation of the GAPI Industrial Energy Score is provided in Table 11.
1 Complete information on all data sources is provided on the GAPI website, www.gapi.ca.
INPUTS

40 GAPI Global Aquaculture Performance Index www.gapi.ca
IndIcAtOrs Industrial energy
table 11: sample Calculation of the GAPI Industrial energy score for tiger Pufferfish From Japan, 2007
PRO
DUCTIO
N�
(mT)
CO
MPO
NEN
T
PRO
PO
RTIO
N
KN
IFE�
CO
EFFIC
IEN
T�
(MJ/m
T)
EN
ERGy�O
F�
CO
MPO
NEN
TS
SUM
�
EN
ERGy�O
F�
CO
MPO
NEN
TS
AM
OUN
T�F
EED�
USED�(m
T)
TOTA
L�
INDUSTRIA
L�
EN
ERGy
NO
RM
ALIS
ED�
SCO
RE
WIN
SO
RIS
ED
TARGET
INDE�S
CO
RE
4,200
Fish 0.41 29,078.33 11,922.12
19,741.76 5,838
118,604,011 169.97 NO 0 60
Livestock 0.05 37,319.05 1,865.95
Crops 0.54 11,107.64 5,953.70
Production system—sea cage
1.00 798.00 798.00798.00
Component = Feed and production system proportions usedKnife Coefficient = Energy embedded in componentsEnergy of Components = Knife coefficient × proportionSum of Energy Components = Sum of feed and sum of production systemsAmount of Feed Used = FCR × productionTotal Industrial Energy = Feed energy × (amount feed + production system energy) × amount productionNormalised Score = See formula, page 39INDE Score = Normalised score after proximity-to-target calculation
AddressInG dAtA GAPs
GAPI employed the following decision rules to treat gaps in industrial energy data:
GAPI assumes no livestock components are present in feed mixtures consumed in countries of the European •Union due to EU regulations banning the use of these components in feed.If the proportion of fish, plant, or livestock is unknown, GAPI uses the most recent data for that country and/or •a similar species.
INPUTS

41 GAPI Global Aquaculture Performance Index www.gapi.ca
IndIcAtOrs sustainability of Feed Feed
IndICAtor bACkGround And rAtIonAle For InClusIon
Fish meal and fish oil continue to play an integral role in fulfilling the nutritional requirements of aquaculture-raised species (Deutsch et al. 2007; Kristofersson and Anderson 2006; Naylor et al. 1998; Naylor et al. 2000; Tacon and Metian 2008), particularly for carnivorous species fed compound feeds. Tacon and Metian (2008) estimate that in 2006 the aquaculture sector consumed the equivalent of 16.6 million tonnes of small pelagic forage fish by way of consuming 3,724,000 tonnes of fish meal and 835,000 tonnes of fish oil.
Seven of the 10 largest global fisheries (by weight) are reduction fisheries, which means that the product of these fisheries is not destined for direct human consumption. Numerous and significant ecological impacts have been linked to these reduction fisheries and their increasing appropriation of marine productivity (Naylor et al. 1998). The targets of reduction fisheries tend to be fish species that not only constitute major components of marine ecosystems but also comprise the primary prey of economically important wild fish species.
Formula∑ (Proportion of Feed by Species × Sustainability Score of Each Species) ×
Fish In: Fish Out Ratio × mT Fish Produced
mT Fish Produced
Feed Component = • The fish meal and fish oil components of feed. This takes into account the species, country of origin, and proportion of each component in the final feed formulation.Sustainability Score • = (harvest performance) × (stock status) × (management score)Fish In: Fish Out Ratio = • Calculated as the pelagic equivalent inputs to farmed fish outputs (kg wild fish inputs: kg farmed fish outputs) (Tacon and Metian 2008)
units Gauge of feed sustainability (unitless)target Zerosources1 Fish Source; Sustainable Fisheries Partnership; seafood industry trade press; FAO
IndICAtor ForMulA
sustainability score CalculationThe Sustainability Score calculation for fish meal and fish oil ingredients is the same formula used to determine the Sustainability Score of wild fish inputs in the capture-based aquaculture indicator (CAP). The Sustainability Score of the fisheries supplying feed for an aquaculture system is the product of three factors: harvest per-formance, stock status, and an assessment of the management regime for that particular fishery. These three measures are multiplied so that final Sustainability Scores most effectively show the differences in performance between best and worst performance.
1 Complete information on all data sources is provided on the GAPI website, www.gapi.ca.
INPUTS

42 GAPI Global Aquaculture Performance Index www.gapi.ca
IndIcAtOrs sustainability of Feed
harvest PerformanceThis measures the percentage of the actual catch of the fishery that is over the set management catch limit. Where the actual catch is above the management limit, the harvest performance is:
Harvest Performance =Actual Catch − Mgmt Catch Limit
× 100Actual Catch
However, where actual catch is below the management limit, the numerator is transformed to 1. Thus, the equa-tion for harvest performance is:
Harvest Performance =1
× 100Actual Catch
Management catch limit information is largely taken from FishSource (2010) (www.fishsource.org). GAPI’s first preference is to use the biological maximum sustainable yield (Bmsy) as the management catch limit for each species. However, if the Bmsy is unavailable, GAPI uses the total allowable catch (TAC). If the TAC is unavailable, GAPI uses the spawning stock biomass (SSB) or any other available management catch limit. If no management catch limit was set for the assessment year (2007), GAPI uses the best of Bmsy, TAC, or other management catch limit (in order of preference) for the most recent year. If no management catch limit was ever set for the fishery, GAPI assumes that the management catch limit is zero. This leads to a harvest performance score where 100% of catch is considered to be over the management catch limit (i.e., the worst-case scenario).
stock statusIn 2005, the FAO assigned categorical values to the health of fish stocks. The four categories ranged from underexploited to overexploited-depleted. Within GAPI, these categorical scores are converted to numeric scores between one and four, with one being the best performance (underexploited) and four being the worst perfor-mance (overexploited-depleted).
Management scoreA 2009 Sustainable Fisheries Partnership (SFP) report examined the sustainability of world fisheries used for reduction purposes (e.g., aquaculture feeds). SFP used the setting of biological reference points (BRPs) as an indi-cator of the sustainability of reduction fisheries. BRPs can be derived using a variety of approaches. Ecosystem-based management is considered to be the best approach for setting upper target reference points, while B20 or biomass/recruitment models are considered the best approach for setting lower limit reference points.
INPUTS

43 GAPI Global Aquaculture Performance Index www.gapi.ca
IndIcAtOrs sustainability of Feed
Based on the BRP information provided in the SFP report, GAPI assigned a score between one and nine, where nine represents the worst possible performance (no upper and lower limits set) and one represents the best possible performance (use of ecosystem-based management and B20 to set upper and lower limits, respectively) (Table 12).
A sample calculation of the GAPI Sustainability of Feed score is provided in Table 13.
table 12: GAPI Management scores
BIOLOGICAL�REFERENCE�POINTS�(BRPs)
MANAGEMENT�
SCORE
BRP�FOR�
UPPER�LIMIT
BRP�FOR�
LOWER�LIMIT
None None 9
B20 None 8
B20 Bpa 7
None Fecundity 6
B20 Fecundity 5
None Bmsy 4
B20 Bmsy 3
None Ecosystem 2
B20 Ecosystem 1
table 13: sample Calculation of the GAPI sustainability of Feed score for barramundi From Australia, 2007
REGIO
N�A
ND�
SPECIE
S�
CO
MPO
NEN
TS
PRO
PO
RTIO
N
SPECIF
IC�
SUSTA
INA
BIL
ITy�
SCO
RE
PRO
PO
RTIO
N�×
�
SUSTA
INA
BIL
ITy�
SCO
RE
TOTA
L�
SUSTA
INA
BIL
ITy�
SCO
RE
TRA
NSFER�
CO
EFFIC
IEN
T
NO
RM
ALIS
ED�
SCO
RE
WIN
SO
RIS
ED
TARGET
FEED�S
CO
RE
Anchovy (Peru) 0.816 441.38 360.17
709.43 2.20 39.51 NO 0 65Tuna trimmings (Australia)
0.139 2,413.63 335.49
Mackerel (Chile) 0.045 306.00 13.77
Proportion: Proportion of feed comprised of each componentSpecific Sustainability Score: See Sustainability Score calculation, page 41Proportion × Sustainability Score: Proportion × specific sustainability scoreTotal Sustainability Score: Sum of proportional sustainability scoresTransfer Coefficient: See Fish In: Fish Out Ratio explanation, page 41Normalised score: See formula, page 41FEED Score: Normalised score after proximity-to-target calculation
INPUTS

44 GAPI Global Aquaculture Performance Index www.gapi.ca
IndIcAtOrs sustainability of Feed
AddressInG dAtA GAPs
GAPI employed the following decision rules to treat gaps in feed sustainability data:
If the composition of feed used in the country is unknown, GAPI uses available data on the composition of •feed from the most similar country producing that species.If the species composition is unknown for any production country for a species being farmed, GAPI uses a •breakdown of species caught for reduction fisheries for that year.
Fisheries terminology
B20 and Biomass/Recruitment Models—Limiting fishing so that 20% of the original unfished biomass is unharvested
Bpa—A fishing limit set slightly more stringently than the B20 level to create a buffer ensuring that the number of fish removed from the population does not meet or exceed 20% of the spawning stock biomass
Ecosystem-Based Management—According to the FAO Code of Conduct for Responsible Fisheries (1995), management measures should not only ensure the conservation of target species but also of species belonging to the same ecosystem or associated with or dependent upon the target species
Fecundity—The fertility of the fish stock, or how quickly the stock can reproduce to sustain its population
Maximum Sustainable Yield (Bmsy)—In theory, the maximum volume of fish (catch) that can be removed from a species’ stock over an indefinite period while still maintaining the maximum growth rate of the population
Spawning Stock Biomass—The total weight of all sexually mature fish in a population
Total Allowable Catch (TAC)—The total catch of stock permitted to be removed in a specified period (usually a year), as defined in the management plan. The TAC may be allocated to stakeholders in the form of quotas representing specific quantities or proportions.
INPUTS

45 GAPI Global Aquaculture Performance Index www.gapi.ca
IndIcAtOrs
IndICAtor bACkGround And rAtIonAle For InClusIon
A large percentage of marine finfish species is farmed in nets or cages in the marine environment, which makes them especially susceptible to a host of pathogen-borne diseases. To treat or, in some cases, prevent, disease, producers sometimes administer antibiotics that are often in the form of bath treatments or incorporated within feed (Burridge et al. 2008b). Given the open nature of most marine finfish production systems, a significant portion of the applied antibiotics is released into the ecosystem. Some of these antibiotics have been associated with a variety of impacts, including: selection for antibiotic-resistant bacteria (Burka et al. 1997; Cabello 2006); persistence in sediments and water column (Cabello 2006; Hektoen et al. 1995); and potential toxicity to non-target organisms (Christensen et al. 2006; Holten Lützhøft et al. 1999). Based on this evidence, there has been significant attention within both the conservation sector and aquaculture industry to minimise or eliminate the release of antibiotics into the environment. Of utmost concern is the use and release of antibiotics such as fluoroquinolones, which are considered critical in the prevention of infection and disease in humans.
Formula∑ (Amount Active Ingredient (kg) × WHO-OIE Score)
mT Fish Produced
units Kilograms weighted by the WHO-OIE Score per mT producedtarget Zerosources1 Antibiotics used: Producers; international, national, and regional aquaculture associations; FAO;
seafood industry trade press; science literatureWHO-OIE Score: Report of Joint FAO/WHO/OIE Expert Meeting on Critically Important Antimicrobials (FAO 2008)
IndICAtor ForMulA
The antibiotic indicator considers two primary factors: the absolute volume of antibiotics used in production and a measure of the environmental risk of each antibiotic. It assumes that antibiotic use is indirectly related to strong environmental performance; the fewer antibiotics used, the better the performer’s score for this indicator. Since antibiotics have varying degrees of potential ecological impact, it was also deemed necessary to weight the use of each antibiotic by some measure of potential impact or risk. Through expert consultation, the WHO and OIE ratings of antibiotics were determined to be the most readily accessible, yet accurate, measures of the risk of antibiotic use related to human and veterinary use, respectively. Like all GAPI indicators, the antibiotics indicator is normalised by mT of fish produced.
1 Complete information on all data sources is provided on the GAPI website, www.gapi.ca.
Antibiotics AntI DIS
CH
ARGES
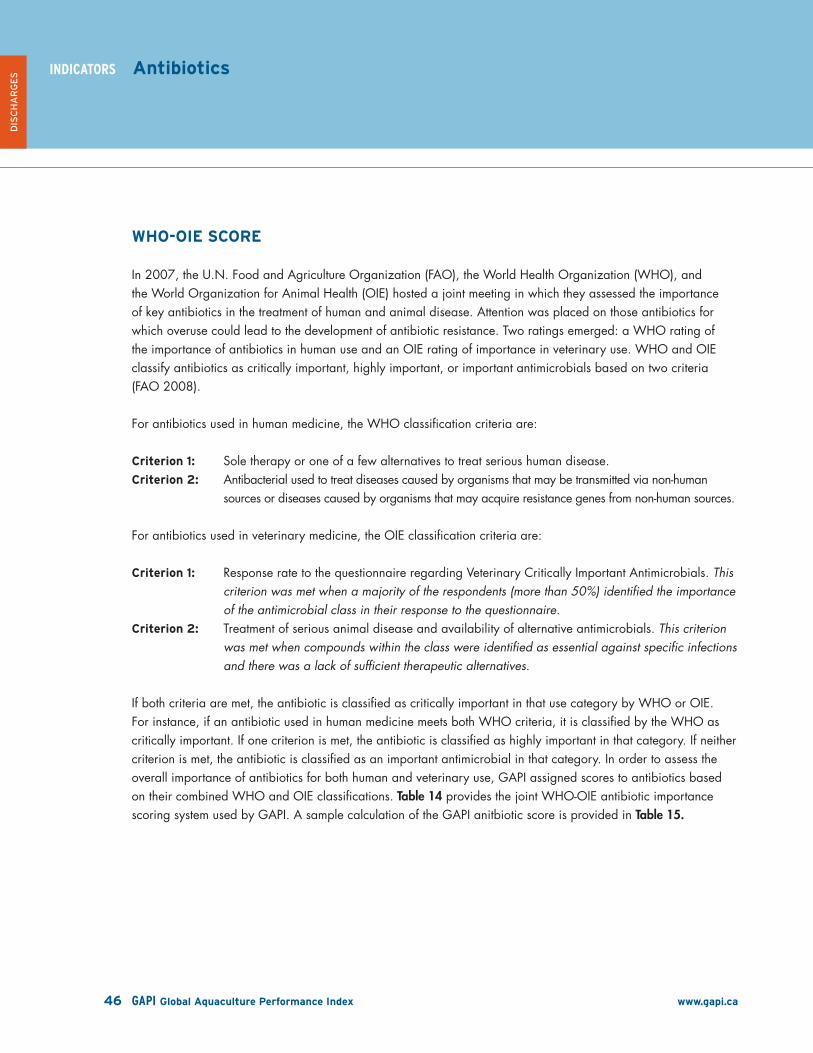
46 GAPI Global Aquaculture Performance Index www.gapi.ca
IndIcAtOrs
Who-oIe sCore
In 2007, the U.N. Food and Agriculture Organization (FAO), the World Health Organization (WHO), and the World Organization for Animal Health (OIE) hosted a joint meeting in which they assessed the importance of key antibiotics in the treatment of human and animal disease. Attention was placed on those antibiotics for which overuse could lead to the development of antibiotic resistance. Two ratings emerged: a WHO rating of the importance of antibiotics in human use and an OIE rating of importance in veterinary use. WHO and OIE classify antibiotics as critically important, highly important, or important antimicrobials based on two criteria (FAO 2008).
For antibiotics used in human medicine, the WHO classification criteria are:
Criterion 1: Sole therapy or one of a few alternatives to treat serious human disease.Criterion 2: Antibacterial used to treat diseases caused by organisms that may be transmitted via non-human
sources or diseases caused by organisms that may acquire resistance genes from non-human sources.
For antibiotics used in veterinary medicine, the OIE classification criteria are:
Criterion 1: Response rate to the questionnaire regarding Veterinary Critically Important Antimicrobials. This criterion was met when a majority of the respondents (more than 50%) identified the importance of the antimicrobial class in their response to the questionnaire.
Criterion 2: Treatment of serious animal disease and availability of alternative antimicrobials. This criterion was met when compounds within the class were identified as essential against specific infections and there was a lack of sufficient therapeutic alternatives.
If both criteria are met, the antibiotic is classified as critically important in that use category by WHO or OIE. For instance, if an antibiotic used in human medicine meets both WHO criteria, it is classified by the WHO as critically important. If one criterion is met, the antibiotic is classified as highly important in that category. If neither criterion is met, the antibiotic is classified as an important antimicrobial in that category. In order to assess the overall importance of antibiotics for both human and veterinary use, GAPI assigned scores to antibiotics based on their combined WHO and OIE classifications. Table 14 provides the joint WHO-OIE antibiotic importance scoring system used by GAPI. A sample calculation of the GAPI anitbiotic score is provided in Table 15.
Antibiotics
DIS
CH
ARGES
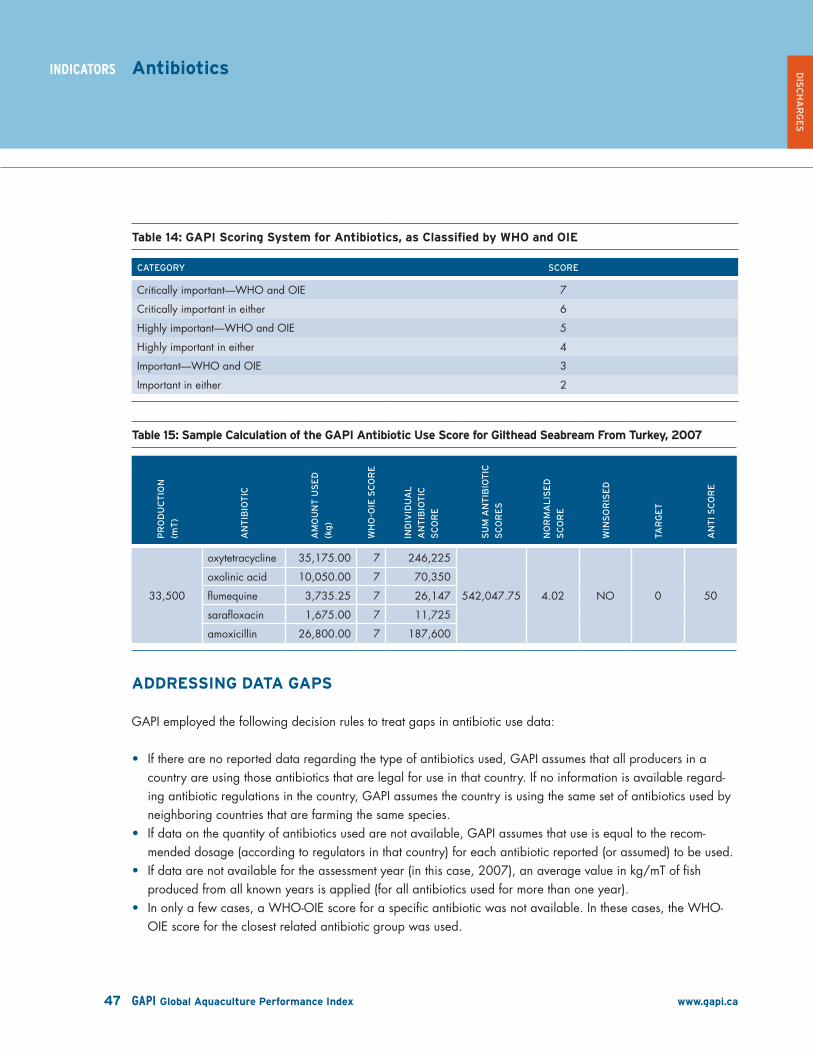
47 GAPI Global Aquaculture Performance Index www.gapi.ca
IndIcAtOrs
table 14: GAPI scoring system for Antibiotics, as Classified by Who and oIe
CATEGORy SCORE
Critically important—WHO and OIE 7
Critically important in either 6
Highly important—WHO and OIE 5
Highly important in either 4
Important—WHO and OIE 3
Important in either 2
table 15: sample Calculation of the GAPI Antibiotic use score for Gilthead seabream From turkey, 2007
PRO
DUCTIO
N�
(mT)
AN
TIB
IOTIC
AM
OUN
T�U
SED�
(kg)
WH
O-O
IE�S
CO
RE
INDIV
IDUA
L�
AN
TIB
IOTIC
�
SCO
RE
SUM
�AN
TIB
IOTIC
�
SCO
RES
NO
RM
ALIS
ED�
SCO
RE
WIN
SO
RIS
ED
TARGET
AN
TI�SCO
RE
33,500
oxytetracycline 35,175.00 7 246,225
542,047.75 4.02 NO 0 50
oxolinic acid 10,050.00 7 70,350
flumequine 3,735.25 7 26,147
sarafloxacin 1,675.00 7 11,725
amoxicillin 26,800.00 7 187,600
AddressInG dAtA GAPs
GAPI employed the following decision rules to treat gaps in antibiotic use data:
If there are no reported data regarding the type of antibiotics used, GAPI assumes that all producers in a •country are using those antibiotics that are legal for use in that country. If no information is available regard-ing antibiotic regulations in the country, GAPI assumes the country is using the same set of antibiotics used by neighboring countries that are farming the same species.If data on the quantity of antibiotics used are not available, GAPI assumes that use is equal to the recom-•mended dosage (according to regulators in that country) for each antibiotic reported (or assumed) to be used.If data are not available for the assessment year (in this case, 2007), an average value in kg/mT of fish •produced from all known years is applied (for all antibiotics used for more than one year).In only a few cases, a WHO-OIE score for a specific antibiotic was not available. In these cases, the WHO-•OIE score for the closest related antibiotic group was used.
Antibiotics DIS
CH
ARGES

48 GAPI Global Aquaculture Performance Index www.gapi.ca
IndIcAtOrs Antifoulants (Copper) CoP
IndICAtor bACkGround And rAtIonAle For InClusIon
The accumulation of fouling organisms on marine aquaculture net pens reduces water flow through the pens and, in turn, decreases the dissolved oxygen concentration inside the pen. These fouling organisms also compromise the buoyancy and durability of the nets (Braithwaite et al. 2007). Antifoulant coating and paint are applied to marine net pens to prevent the colonisation of fouling organisms. Copper is the primary active ingredient in the vast majority of these applications (Burridge et al. 2008). Copper leaches from the nets into the marine environment over time and the on-site cleaning of treated nets can cause spikes of copper to be released into the surrounding water. Copper is highly toxic to a wide range of aquatic organisms, including algae (Franklin et al. 2001), copepods (Bechmann 1994), amphipods (Ahsanullah and Williams 1991), echinoderms (Fernandez and Beiras 2001), and larger microbial communities (Webster et al. 2001). Copper in excess of recommended maximum concentrations has been found at aquaculture facilities (Chou et al. 2002). It also remains biologically active and therefore potentially lethal even when bound in marine sediments (Chou et al. 2002).
FormulamT Fish Produced × % Production Using Copper-Based Antifoulants
mT Fish Produced
units Proportion of production using copper-based antifoulantstarget Zerosources1 Producers; international, national, and regional aquaculture associations; FAO; seafood industry
trade press; scientific literature
IndICAtor ForMulA
The copper indicator is an estimate of metric tonnes (mT) of the species produced using copper-based antifoulants. Actual data regarding the on-farm usage of copper tend to be unavailable, at either the individual farm level or the aggregated country level. Thus, GAPI uses the next best available data based on the proportion of production that used copper antifoulants.
A sample calculation of the GAPI Antifoulants score is provided in Table 16.
1 Complete information on all data sources is provided on the GAPI website, www.gapi.ca.
DIS
CH
ARGES

49 GAPI Global Aquaculture Performance Index www.gapi.ca
IndIcAtOrs Antifoulants (Copper)
table 16: sample Calculation of the GAPI Antifoulants score for Gilthead seabream, 2007
COUNTRy
PRODUCTION�
(mT)
PROPORTION�
USING�
COPPER-BASED�
ANTIFOULANTS
NORMALISED�
SCORE WINSORISED TARGET COP�SCORE
Greece 50,023 0.98 0.99 NO 0 28
Israel 2,880 0.50 0.71 NO 0 49
Italy 7,003 0.24 0.49 NO 0 64
Spain 20,355 0.91 0.95 NO 0 31
Turkey 33,500 0.98 0.99 NO 0 28
AddressInG dAtA GAPs
GAPI employed the following decision rule to treat gaps in copper-based antifoulant use data:
In the absence of verifiable data on the proportion of production using copper-based antifoulants, GAPI uses •an average value from known years. If this information is unavailable, GAPI assumes that 100% of production used copper-based antifoulants.
DIS
CH
ARGES

50 GAPI Global Aquaculture Performance Index www.gapi.ca
IndIcAtOrs biochemical oxygen demand bod
IndICAtor bACkGround And rAtIonAle For InClusIon
The open nature of most marine finfish production systems results in the discharge of uneaten feed and fish wastes directly into the marine environment. The impacts of nutrient loading on water quality as well as on the sea floor environment are well documented (Ackefors and Enell 1990; Barg 1992; Gowen et al. 1991; Wu 1995).
While expert opinion was sought during the development of all indicators, a dedicated expert workshop was convened to address the particular challenges surrounding the formulation of a “waste” indicator. A number of metrics can be used to assess farm-derived organic pollution. In this case, workshop participants concluded that the most tractable method for estimating the direct ecological effect of waste discharges is to estimate the biochemical oxygen demand (BOD) required to process the waste materials. BOD is a measure of the relative oxygen-depletion effect of waste contaminants (uneaten feed and feces) and is defined as the amount of oxygen required to oxidize organic carbon (C) and nitrogen (N) from feed inputs that is not recovered in the biomass at harvest. The development of the metric was led by Dr. Claude Boyd, and the underlying calculations are avail-able in Boyd 2009.
Other possible measures of “waste” impacts such as Reduction (Redox) potential and nitrogen discharges, which often vary greatly even over short distances, were deemed inappropriate for a country-scale analysis such as GAPI. Further, all other indicators that were considered required a baseline measure to define the “normal” profile of the area against which the magnitude of farm impact could be calibrated. The GAPI BOD indicator is empirically derived and invariant; the oxygen required to oxidize a unit of organic carbon or nitrogen is the same everywhere and therefore is a powerful standard against which to measure organic pollution performance. The bio-physical environment in some areas may be better able than that in others to mitigate organic outputs. However, the GAPI BOD indicator assumes performance decreases as pollution load increases, irrespective of location.
FormulaBOD (mT O2) × Area of Overlap (km2)
mT Fish Produced
BOD• = (total N in feed − total N in fish) × 4.57 + (total C in feed − total C in fish) × 2.67Area of Overlap • (km2) = sum of the area of overlap of the buffer zones
units (mT O2 × km2) per mT fish producedtarget Zerosources1 International, regional, and national legislation; FAO; Sea Around Us Project (SAUP); scientific
literature (including Boyd 2009)
1 Complete information on all data sources is provided on the GAPI website, www.gapi.ca.
DIS
CH
ARGES

51 GAPI Global Aquaculture Performance Index www.gapi.ca
IndIcAtOrs
IndICAtor ForMulA
bodBOD is calculated by assessing the total carbon and nitrogen per unit of feed. According to Boyd (2009), the amounts of molecular oxygen necessary to oxidize 1 kg of organic carbon and 1 kg of ammonia nitrogen are 2.67 kg and 4.57 kg, respectively. These relationships allow us to estimate the biochemical oxygen demand of feed as demonstrated in the BOD equation above.
Area of overlapGAPI assumes that nutrient loading spread across a large area will, on average, have a lesser impact than the same loading concentrated in a small area. In order to establish the area of impact, GAPI first identified farm locations using Google Earth images (Google Inc. 2009) imported into ArcGIS 9.2. For each site, the area of impact is assumed to be a 3 km radius buffer around the farm site. The effect that farm-derived nutrients have on the water column is well documented (Sarà 2007a) and has been measured up to and including distances of 1,000 m (Sarà et al. 2006). It is likely that ecological impacts extend beyond this point and, as a result, farm-siting regulations in countries vary from 300 m (Nova Scotia) to 8 km (Scotland) (Ministry of Agriculture and Lands 2005). Because there are very few systematic data regarding how ecological effects vary with distance (Sarà 2007b), GAPI uses a median value of the siting regulations (3 km) to set the buffer for the area of overlap.
As depicted in Figure 17, Area of Overlap value is the sum of the area of overlap of the buffer zones. A higher Area of Overlap indicates a more concentrated effluent release. Since we were unable to identify the type of spe-cies farmed at each site, the total Area of Overlap of all farms for a country was adjusted based on the propor-tion of production comprised by each species in a given country. Similarly, we could not quantify the production magnitude at any particular farm. Therefore, GAPI assumes negligible impact of any single farm located beyond 3 km from the next closest farm. For this reason, the BOD indicator is a very conservative performance metric.
Figure 17: example of the Assessment of Area of overlap in GAPI
NO OVERLAP
2 LAYERS
3 LAYERS
4 LAYERS
biochemical oxygen demand DIS
CH
ARGES
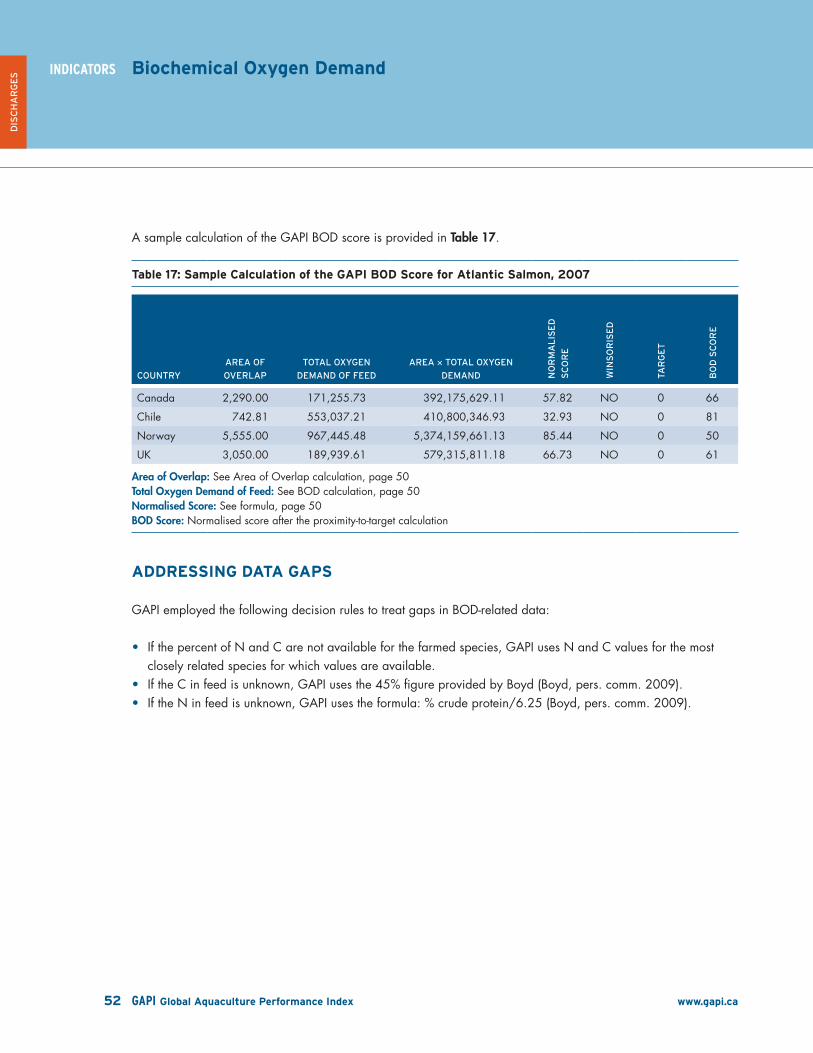
52 GAPI Global Aquaculture Performance Index www.gapi.ca
IndIcAtOrs
A sample calculation of the GAPI BOD score is provided in Table 17.
table 17: sample Calculation of the GAPI bod score for Atlantic salmon, 2007
COUNTRy
AREA�OF�
OVERLAP
TOTAL�OxyGEN�
DEMAND�OF�FEED
AREA��TOTAL�OxyGEN�
DEMAND NO
RM
ALIS
ED�
SCO
RE
WIN
SO
RIS
ED
TARGET
BO
D�S
CO
RE
Canada 2,290.00 171,255.73 392,175,629.11 57.82 NO 0 66
Chile 742.81 553,037.21 410,800,346.93 32.93 NO 0 81
Norway 5,555.00 967,445.48 5,374,159,661.13 85.44 NO 0 50
UK 3,050.00 189,939.61 579,315,811.18 66.73 NO 0 61
Area of Overlap: See Area of Overlap calculation, page 50Total Oxygen Demand of Feed: See BOD calculation, page 50Normalised Score: See formula, page 50BOD Score: Normalised score after the proximity-to-target calculation
AddressInG dAtA GAPs
GAPI employed the following decision rules to treat gaps in BOD-related data:
If the percent of N and C are not available for the farmed species, GAPI uses N and C values for the most •closely related species for which values are available.If the C in feed is unknown, GAPI uses the 45% figure provided by Boyd (Boyd, pers. comm. 2009).•If the N in feed is unknown, GAPI uses the formula: % crude protein/6.25 (Boyd, pers. comm. 2009).•
biochemical oxygen demand
DIS
CH
ARGES

53 GAPI Global Aquaculture Performance Index www.gapi.ca
IndIcAtOrs Parasiticides PArA
IndICAtor bACkGround And rAtIonAle For InClusIon
In addition to antibiotic use to treat bacterial infection in farmed marine finfish, parasiticides are frequently used to reduce parasite infestations in farmed fish. Most parasiticides are applied in a similar manner to antibiotics, either in medicated baths or within formulated feeds. When used in open net pen aquaculture systems, the effects of parasiticides typically manifest beyond the fish farm, and thus it is important to consider the ecological implications of their application within the marine environment.
Many parasiticides are toxic to non-target organisms, especially aquatic invertebrates (Burridge et al. 2008a). Toxicity varies by the type of parasiticide and type of organisms affected (Burridge et al. 2008a). Similarly, the persistence of parasiticides in the sediment and water column range significantly (Bright and Dionne 2005; Burridge et al. 2008a; SEPA 1999 in Burridge et al. 2008b; Mayor et al. 2008). Overuse of certain parasiti-cides can lead to chemical resistance, such as the documented resistance to parasiticides in Scottish sea lice (Jones et al. 1997).
The parasiticides indicator (PARA) was designed by a workshop of experts brought together by the project to determine indicators for waste-related impacts. While the amount of chemical used and the level of toxicity were considered key components of the indicator, consulted experts agreed that the persistence of the chemicals should also be incorporated. LC50 and half-life, the major components of the formula, were chosen because they are both accepted and readily available measures of toxicity and persistence, respectively.
Formula∑(Amount (kg) × [(1/LC50) +1] × Persistence (Days))
mT Fish Produced
Amount (kg) • = Amount of active ingredient of the parasiticide usedLC50 (mg/L) • = Lethal concentration of a chemical in water that kills 50% of the test animals in a given time (represents the organism most harmed by each substance)Persistence (half-life) • = Residency time of a chemical in the environment measured by its half-life in that environment
units Kilograms per mT fish producedtarget Zerosources1 Producers; international, national, and regional aquaculture associations; FAO; Material Safety
Data Sheets (MSDS); seafood industry trade press; scientific literature
A sample calculation of the GAPI Parasiticides score is provided in Table 18.
1 Complete information on all data sources is provided on the GAPI website, www.gapi.ca.
DIS
CH
ARGES

54 GAPI Global Aquaculture Performance Index www.gapi.ca
IndIcAtOrs
IndICAtor ForMulA
table 18: sample Calculation of the GAPI Parasiticides score for Coho salmon From Chile, 2007
PARASITICIDE AM
OUN
T�(kg
)
LC50�(m
g/L
)
PERSIS
TEN
CE�
(DAyS)
INDIV
IDUA
L�
PA
RASIT
ICID
E�
SCO
RE
TOTA
L�
PA
RASIT
ICID
E�
SCO
RE
NO
RM
ALIS
ED�
SCO
RE
WIN
SO
RIS
ED
TARGET
PA
RA
�SCO
RE
Emamectin benzoate
23,553.31 6.9000 174 4,692,229.512,695,120.3 11.2 NO 0 64
Ivermectin 456.58 0.0016 28 8,002,890.8
Individual Parasiticide Score = Amount (kg) x [(1/LC50) + 1] x persistence (days)Total Parasiticide Score = Sum of all individual parasiticide scoresNormalised Score = See formula, page 53GAPI Score = Normalised score after the proximity-to-target calculation
AddressInG dAtA GAPs
GAPI employed the following decision rules to treat gaps in parasiticide data:
If data on the amount of parasiticide used are not available, GAPI assumes that the recommended dosage is •being used for all parasiticides known to be in use.If parasiticide use data are not available for a given year, an average value (kg active ingredient/mT of fish •produced) for known years is applied.The LC50 of active ingredient is standard regardless of the application. Where the LC50 for an aquaculture •parasiticide is not available, the LC50 for the use of that parasiticide in other organisms/applications is used.
Parasiticides
DIS
CH
ARGES

55 GAPI Global Aquaculture Performance Index www.gapi.ca
IndIcAtOrs escapes esC
IndICAtor bACkGround And rAtIonAle For InClusIon
The inevitability of escapes from aquaculture facilities has led the U.N. Food and Agriculture Organization (FAO) to recommend that introductions of species in aquaculture should be considered an introduction to the wild, even if the facility is considered a closed system (FAO 1995). Negative impacts on community structure, biodiversity, genetic resources, and ecosystem function are well documented regardless of whether escapees are exotic spe-cies (Costa-Pierce 2002, ICES 2005) or native species (Naylor et al. 2005) farmed in the same waters as their wild counterparts. How to predict and quantify the full impact of escapees on community structure and ecosystem services is still a matter of some debate; however, there is consensus that any introduction or translocation of organisms or novel genetic profiles carries risk (ICES 2005).
The impact of escapes of non-native species is particularly challenging to assess. Exotic species establish new interaction patterns in the ecosystem and disrupt established patterns. As such, the pathways of impact are not often predictable and may not be reversible or easily quantifiable in terms of damage (Costa-Pierce 2002; Pullin and Sumaila 2005). Damage can be sustained or even increase with time if escape events are chronic or if escapees produce offspring that are able to survive and adapt to their new environment (ICES 2005).
Farming of native species is not free from risk either. The culture of native species may introduce additional concerns beyond those relevant for non-native species, particularly with regard to introduction of maladapted genes and/or alleles from farmed to wild fish populations. For instance, escapes of farmed Atlantic salmon in the North Atlantic manifest within populations of wild Atlantic salmon. Escapes of farmed Atlantic salmon in regions where the species is non-native, such as British Columbia and Chile, manifest at the higher community and ecosystem levels. In all cases, ecological impacts are density dependent; therefore, the magnitude of impact is tied to escape numbers. In those cases where genetic introgression of wild populations is possible, the per capita impact of an escape increases with each generation in culture as deviation from the wild gene pool increases (Araki et al. 2007).
FormulaGAPI Invasive Score × # Escaped Fish
mT Fish Produced
units Synthetic unit composed of the product of the number of escapees and per capita risk per mT produced
target Zerosources1 FishBase; Sea Around Us Project (SAUP); FAO; industry reporting; country reports on escapes;
seafood industry trade press; scientific literature
1 Complete information on all data sources is provided on the GAPI website, www.gapi.ca.
BIO
LO
GIC
AL

56 GAPI Global Aquaculture Performance Index www.gapi.ca
IndIcAtOrs escapes
IndICAtor ForMulA
Impacts associated with inanimate wastes are relatively predictable. However, because escapees (and pathogens) are living organisms, the magnitude of their impact is greatly influenced by local biotic and abiotic conditions. An escape event may be devastating when it occurs in one region, yet produce only a modest disturbance in another. Therefore, assessing performance by the number of escapees alone is inadequate. Some species-country combinations carry a higher per capita escapee risk than others. For this reason, the escapes indicator is the product of the number of escapees and the GAPI Invasiveness Score, which provides an estimate of the per capita risk associated with an escape.
GAPI Invasiveness scoreInspired by the Marine Fish Invasiveness Screening Kit (MFISK) tool developed by Copp et al. (2007)2, the GAPI Invasiveness Score assesses the risks of impact of escape events within several broad categories. These include: domestication; climate; distribution; invasion elsewhere; undesirable traits; feeding traits; reproduction; and persistence attributes. For each species, a 26-question survey (Table 19) is completed. Responses, which are usually scored as either 0 or 1, are summed to obtain the total GAPI Invasiveness Score.
table 19: GAPI Invasiveness score questionnaire
1 Is the species domesticated anywhere in the world? No = 0 Yes = 1
2 Has the species naturalised (established viable populations) beyond its native range?
Native or No = 0, Few(<3) = 2, Many = 3
3 Does the species have invasive congeners? No = 0 Yes = 1
4 Is the species poisonous or does it possess other immunochemical predation defenses?
No = 0 Yes = 1
5 Is the species parasitic of other species? No = 0 Yes = 1
6 Is the species likely to be unpalatable to natural predators? No = 0 Yes = 1
7 Is the species likely to be a novel predator to native forage species? No = 0 Yes = 1
8 Does the species host, and/or is it a vector for, recognised pests and pathogens, especially non-native?
No = 0 Yes = 1
9 Does the species achieve a large ultimate body (> 30 cm FL)? No = 0 Yes = 1
10 Does the species tolerate a wide range of salinity? No = 0 Yes = 1
11 Habitat diversity (Value Range 0–1) x 3
12 Does feeding or other behaviours of the species reduce habitat quality for native species (i.e., ecosystem engineer)?
No = 0 Yes = 1
13 Adult wild trophic level SAUP Value
14 Does it exhibit parental care and/or is it known to reduce age-at-maturity in response to environmental conditions?
No = 0 Yes = 1
2 http://www.cefas.co.uk/projects/risks-and-impacts-of-non-native-species/decision-support-tools.aspx
BIO
LO
GIC
AL

57 GAPI Global Aquaculture Performance Index www.gapi.ca
IndIcAtOrs escapes
table 19: GAPI Invasiveness score questionnaire
15 Do production fish produce viable gametes? No = 0 Yes = 1
16 May the species hybridise with one or more native species? No = 0 Yes = 1
17 Is the species hermaphroditic? No = 0 Yes = 1
18 Is the species dependent on another species or specific habitat feature(s) to complete its life cycle (including diadromy)?
No = 1 Yes = 0
19 Does natural dispersal occur as a function of egg or larval dispersal? No = 0 Yes = 1
20 Does the species tolerate or benefit from environmental disturbance? No = 0 Yes = 1
21 Are there effective natural enemies of the species present in the risk assessment area?
No = 1 Yes = 0
22 Does the species tolerate a wide range of water quality conditions (e.g., hydrodynamics, pollution, oxygen)?
0-low, 3-high
23 If native, # generations from wild type native = # generations (max = 3), exotic = 1
24 Resilience Very Low = 0, Low = 1, Medium = 2, High = 3
25 Identified in IUCN Global Invasive Species Database No = 0 Yes = 3
26 Effective distance (Max range degrees)/60
GAPI INVASIVENESS SCORE = [Sum of above responses]
A sample calculation of the GAPI Escapes score is provided in Table 20.
table 20: sample Calculation of the GAPI escapes score for Atlantic Cod From norway, 2007
PRODUCTION�
(mT) #�OF�ESCAPES
GAPI�
INVASIVENESS�
SCORE
NORMALISED�
SCORE WINSORISED TARGET ESC�SCORE
9,611 85,000 15.39 11.67 YES 0 0
AddressInG dAtA GAPs
GAPI employed the following decision rule to treat gaps in escapes data:
If the numbers of escapes for a species-country pair is unknown, in order of preference GAPI uses a) the most •recent data for that county; b) the average escape ratio for the species; or c) the average escape ratio for all species.
Continued
BIO
LO
GIC
AL
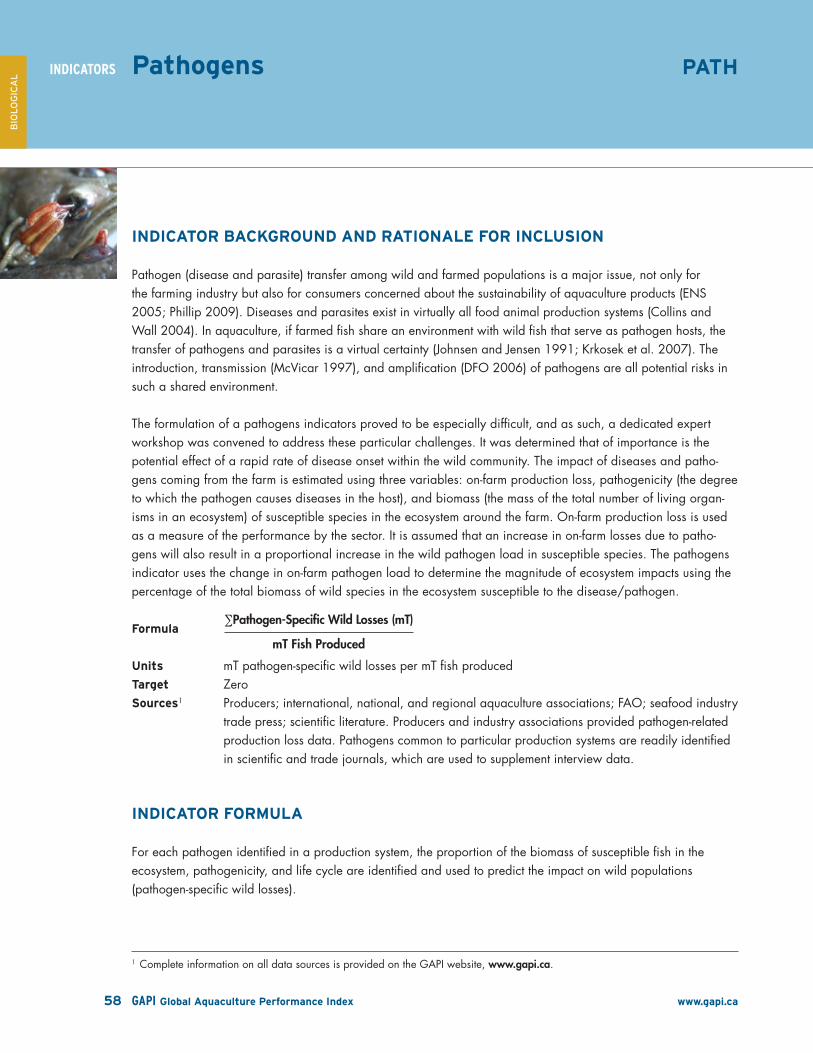
58 GAPI Global Aquaculture Performance Index www.gapi.ca
IndIcAtOrs Pathogens PAth
IndICAtor bACkGround And rAtIonAle For InClusIon
Pathogen (disease and parasite) transfer among wild and farmed populations is a major issue, not only for the farming industry but also for consumers concerned about the sustainability of aquaculture products (ENS 2005; Phillip 2009). Diseases and parasites exist in virtually all food animal production systems (Collins and Wall 2004). In aquaculture, if farmed fish share an environment with wild fish that serve as pathogen hosts, the transfer of pathogens and parasites is a virtual certainty (Johnsen and Jensen 1991; Krkosek et al. 2007). The introduction, transmission (McVicar 1997), and amplification (DFO 2006) of pathogens are all potential risks in such a shared environment.
The formulation of a pathogens indicators proved to be especially difficult, and as such, a dedicated expert workshop was convened to address these particular challenges. It was determined that of importance is the potential effect of a rapid rate of disease onset within the wild community. The impact of diseases and patho-gens coming from the farm is estimated using three variables: on-farm production loss, pathogenicity (the degree to which the pathogen causes diseases in the host), and biomass (the mass of the total number of living organ-isms in an ecosystem) of susceptible species in the ecosystem around the farm. On-farm production loss is used as a measure of the performance by the sector. It is assumed that an increase in on-farm losses due to patho-gens will also result in a proportional increase in the wild pathogen load in susceptible species. The pathogens indicator uses the change in on-farm pathogen load to determine the magnitude of ecosystem impacts using the percentage of the total biomass of wild species in the ecosystem susceptible to the disease/pathogen.
Formula∑Pathogen-Specific Wild Losses (mT)
mT Fish Produced
units mT pathogen-specific wild losses per mT fish producedtarget Zerosources1 Producers; international, national, and regional aquaculture associations; FAO; seafood industry
trade press; scientific literature. Producers and industry associations provided pathogen-related production loss data. Pathogens common to particular production systems are readily identified in scientific and trade journals, which are used to supplement interview data.
IndICAtor ForMulA
For each pathogen identified in a production system, the proportion of the biomass of susceptible fish in the ecosystem, pathogenicity, and life cycle are identified and used to predict the impact on wild populations (pathogen-specific wild losses).
1 Complete information on all data sources is provided on the GAPI website, www.gapi.ca.
BIO
LO
GIC
AL

59 GAPI Global Aquaculture Performance Index www.gapi.ca
IndIcAtOrs Pathogens
Proportion of the biomass of susceptible Fish in the ecosystemThe proportion of the biomass of susceptible fish in the ecosystem is the proportion of species in the ecosystem that is susceptible to the pathogen in question. It is assumed that all members of a taxonomic Family are suscep-tible to a pathogen when two or more Genera are known to be susceptible (Lafferty, pers. comm. 2009). This estimate is derived from input data to Ecopath models (Christensen and Walters 2004), which use a trophic mass balance approach to quantify ecosystem biomasses of the world’s 66 large marine ecosystems (LMEs).2 Specific input data for LME models were obtained from Christensen et al. (2009) and additional peer-reviewed Ecopath ecosystem data.
PathogenicityPathogenicity is the relative proportion of total production losses that is attributed to the pathogen in question.
A sample calculation of the GAPI Pathogens score is provided in Table 21.
table 21: sample Calculation of the GAPI Pathogens score for bastard halibut from
the republic of korea, 2007
PATHOGEN/�PARASITE PRO
DUCTIO
N�(m
T)
TOTA
L�%
�PRO
DUCTIO
N�
LOSS�D
UE�T
O�D
ISEASES�
FOR�y
EA
R
TOTA
L�P
RO
DUCTIO
N�L
OSS
PATH
OGEN
ICIT
y�
(PRO
PO
RTIO
N�T
OTA
L�
BIO
MASS�L
OST)
PATH
OGEN
-SPECIF
IC�L
OSS�
(mT)
HOST�R
AN
GE
PRO
PO
RTIO
N�O
F�
SUSCEPTIB
LE�F
ISH
�
BIO
MASS�IN
�ECOSySTEM
PATH
OGEN
-SPECIF
IC�
WIL
D�L
OSS
NO
RM
ALIS
ED�S
CO
RE
WIN
SO
RIS
ED
TARGET
PATH
�SCO
RE
Scuticociliatosis
41,171 0.10 4,117
0.14 588.16 A 0.07 41.42
0.08 NO 0 57
Fish nodaviral disease 0.14 588.16 A 0.07 41.42
Viral hemorrhagic septicemia
0.14 588.16 A 0.07 41.42
Edwardsiellosis 0.14 588.16 A 0.07 41.42
Vibriosis 0.14 588.16 A 0.07 41.42
Streptococcosis 0.14 588.16 A 0.07 41.42
White spot disease 0.14 588.16 A 0.07 41.42
Total Production Loss = Production (mT) × total % production loss due to pathogens for yearPathogen-Specific Production Loss (mT) = Total production loss × pathogenicityHost Range: Members of a taxonomic Order, Family, Genus, or Species that are susceptible to a specific pathogen. In this
example, A = ActinopterygiiPathogen-Specific Wild Loss = Pathogen-specific production loss × proportion host range biomass in ecosystemNormalised Score = See formula, page 58PATH Score = Normalised score after proximity-to-target calculation
2 http://www.ecopath.org/
BIO
LO
GIC
AL

60 GAPI Global Aquaculture Performance Index www.gapi.ca
IndIcAtOrs Pathogens
AddressInG dAtA GAPs
If data on the total production loss from pathogens are not available, GAPI uses either:
an average of the production loss from dead fish (not including other factors such as escapes and poor •quality) for available years, oran estimated proportion of diseased fish calculated using the expected survival rate. For example, Canadian •Atlantic salmon have an expected survival rate of approximately 90%, with 25% of dead fish resulting from disease and parasites. Thus, the resulting production loss from pathogens would be 2.5%.
If no proportional loss (relative pathogenicity) information is available, GAPI uses:
frequency of pathogen occurrence and severity to represent each pathogen’s contribution to the total losses •due to disease;economic loss due to disease/pathogen converted into a proportion of production loss; or•if none of the above is available for a given year, pathogenicity is spread equally among pathogens known to •be present.
BIO
LO
GIC
AL

61 GAPI Global Aquaculture Performance Index www.gapi.ca
sPecIes�resULts
How�to�Interpret�Species�Results�� � � � � � � � � � � � � � � � � � � � � � � � � � � � � � 62
Atlantic�cod�� � � � � � � � � � � � � � � � � � � � � � � � � � � � � � � � � � � � � � � � � � � � � � � � � � � � � � � � � � � � � � � � � � � � � � � � 64
Atlantic�salmon��� � � � � � � � � � � � � � � � � � � � � � � � � � � � � � � � � � � � � � � � � � � � � � � � � � � � � � � � � � � � � � � � 65
Barramundi�� � � � � � � � � � � � � � � � � � � � � � � � � � � � � � � � � � � � � � � � � � � � � � � � � � � � � � � � � � � � � � � � � � � � � � � � � 66
Bastard�halibut�� � � � � � � � � � � � � � � � � � � � � � � � � � � � � � � � � � � � � � � � � � � � � � � � � � � � � � � � � � � � � � � � � � 67
Chinook�salmon��� � � � � � � � � � � � � � � � � � � � � � � � � � � � � � � � � � � � � � � � � � � � � � � � � � � � � � � � � � � � � � � � 68
Cobia�� � � � � � � � � � � � � � � � � � � � � � � � � � � � � � � � � � � � � � � � � � � � � � � � � � � � � � � � � � � � � � � � � � � � � � � � � � � � � � � � � � � � � 69
Coho�salmon��� � � � � � � � � � � � � � � � � � � � � � � � � � � � � � � � � � � � � � � � � � � � � � � � � � � � � � � � � � � � � � � � � � � � � � 70
European�seabass�� � � � � � � � � � � � � � � � � � � � � � � � � � � � � � � � � � � � � � � � � � � � � � � � � � � � � � � � � � � � � �71
Flathead�grey�mullet�� � � � � � � � � � � � � � � � � � � � � � � � � � � � � � � � � � � � � � � � � � � � � � � � � � � � � � � �72
Gilthead�seabream��� � � � � � � � � � � � � � � � � � � � � � � � � � � � � � � � � � � � � � � � � � � � � � � � � � � � � � � � � � �73
Groupers�� � � � � � � � � � � � � � � � � � � � � � � � � � � � � � � � � � � � � � � � � � � � � � � � � � � � � � � � � � � � � � � � � � � � � � � � � � � � � � �74
Japanese�amberjack�� � � � � � � � � � � � � � � � � � � � � � � � � � � � � � � � � � � � � � � � � � � � � � � � � � � � � � � �75
Japanese�seabass�� � � � � � � � � � � � � � � � � � � � � � � � � � � � � � � � � � � � � � � � � � � � � � � � � � � � � � � � � � � � �76
Korean�rockfish�� � � � � � � � � � � � � � � � � � � � � � � � � � � � � � � � � � � � � � � � � � � � � � � � � � � � � � � � � � � � � � � � � �77
Large�yellow�croaker�� � � � � � � � � � � � � � � � � � � � � � � � � � � � � � � � � � � � � � � � � � � � � � � � � � � � � � � 78
Milkfish�� � � � � � � � � � � � � � � � � � � � � � � � � � � � � � � � � � � � � � � � � � � � � � � � � � � � � � � � � � � � � � � � � � � � � � � � � � � � � � � � � 79
Red�drum��� � � � � � � � � � � � � � � � � � � � � � � � � � � � � � � � � � � � � � � � � � � � � � � � � � � � � � � � � � � � � � � � � � � � � � � � � � � � 80
Red�seabream��� � � � � � � � � � � � � � � � � � � � � � � � � � � � � � � � � � � � � � � � � � � � � � � � � � � � � � � � � � � � � � � � � � � � 81
Tiger�pufferfish�� � � � � � � � � � � � � � � � � � � � � � � � � � � � � � � � � � � � � � � � � � � � � � � � � � � � � � � � � � � � � � � � � 82
Turbot�� � � � � � � � � � � � � � � � � � � � � � � � � � � � � � � � � � � � � � � � � � � � � � � � � � � � � � � � � � � � � � � � � � � � � � � � � � � � � � � � � � � 83
62 GAPI Global Aquaculture Performance Index www.gapi.ca
hoW to reAd sPeCIes PAGes
GAPI evaluates the environmental performance of the top 20 farmed marine finfish species in production. For each species, GAPI scores environmental performance across those major producing countries that make up at least 90% of production of that species. For example, for Atlantic salmon, GAPI assesses the four top-producing countries: Canada, Chile, Norway, and UK. GAPI scores are first calculated for each species-country pair. To offer users insight into how entire species (and countries) perform, we also calculate an overall “Species GAPI Score” for each of the 20 species and a “Country GAPI Score” for each of the 22 countries assessed. The example provided on the next page explains how to interpret the results summarised in each of the species pages.
GAPI users should keep in mind that this section of the report reflects normalised GAPI scores only. Normalisation allows us to assess performance per mT of production so that performers of varying scales of production can be compared. The GAPI website (www.gapi.ca) provides both absolute and normalised scores, as does the Summary of Results section. For more information on normalised versus absolute scoring, see the Methods section of this report.
The farmed marine finfish species assessed by GAPI are:
how to Interpret species resultssPecIes�resULts
Atlantic�cod�� � � � � � � � � � � � � � � � � � � � � � � � � � � � � � � � � � � � � � � � � � � � � � � � � � � � � � � � � � � � � � � � � � � � � � � � 64
Atlantic�salmon��� � � � � � � � � � � � � � � � � � � � � � � � � � � � � � � � � � � � � � � � � � � � � � � � � � � � � � � � � � � � � � � � 65
Barramundi�� � � � � � � � � � � � � � � � � � � � � � � � � � � � � � � � � � � � � � � � � � � � � � � � � � � � � � � � � � � � � � � � � � � � � � � � � 66
Bastard�halibut�� � � � � � � � � � � � � � � � � � � � � � � � � � � � � � � � � � � � � � � � � � � � � � � � � � � � � � � � � � � � � � � � � � 67
Chinook�salmon��� � � � � � � � � � � � � � � � � � � � � � � � � � � � � � � � � � � � � � � � � � � � � � � � � � � � � � � � � � � � � � � � 68
Cobia�� � � � � � � � � � � � � � � � � � � � � � � � � � � � � � � � � � � � � � � � � � � � � � � � � � � � � � � � � � � � � � � � � � � � � � � � � � � � � � � � � � � � � 69
Coho�salmon��� � � � � � � � � � � � � � � � � � � � � � � � � � � � � � � � � � � � � � � � � � � � � � � � � � � � � � � � � � � � � � � � � � � � � � 70
European�seabass�� � � � � � � � � � � � � � � � � � � � � � � � � � � � � � � � � � � � � � � � � � � � � � � � � � � � � � � � � � � � � �71
Flathead�grey�mullet�� � � � � � � � � � � � � � � � � � � � � � � � � � � � � � � � � � � � � � � � � � � � � � � � � � � � � � � �72
Gilthead�seabream��� � � � � � � � � � � � � � � � � � � � � � � � � � � � � � � � � � � � � � � � � � � � � � � � � � � � � � � � � � �73
Groupers�� � � � � � � � � � � � � � � � � � � � � � � � � � � � � � � � � � � � � � � � � � � � � � � � � � � � � � � � � � � � � � � � � � � � � � � � � � � � � � �74
Japanese�amberjack�� � � � � � � � � � � � � � � � � � � � � � � � � � � � � � � � � � � � � � � � � � � � � � � � � � � � � � � �75
Japanese�seabass�� � � � � � � � � � � � � � � � � � � � � � � � � � � � � � � � � � � � � � � � � � � � � � � � � � � � � � � � � � � � �76
Korean�rockfish�� � � � � � � � � � � � � � � � � � � � � � � � � � � � � � � � � � � � � � � � � � � � � � � � � � � � � � � � � � � � � � � � � �77
Large�yellow�croaker�� � � � � � � � � � � � � � � � � � � � � � � � � � � � � � � � � � � � � � � � � � � � � � � � � � � � � � � 78
Milkfish�� � � � � � � � � � � � � � � � � � � � � � � � � � � � � � � � � � � � � � � � � � � � � � � � � � � � � � � � � � � � � � � � � � � � � � � � � � � � � � � � � 79
Red�drum��� � � � � � � � � � � � � � � � � � � � � � � � � � � � � � � � � � � � � � � � � � � � � � � � � � � � � � � � � � � � � � � � � � � � � � � � � � � � 80
Red�seabream��� � � � � � � � � � � � � � � � � � � � � � � � � � � � � � � � � � � � � � � � � � � � � � � � � � � � � � � � � � � � � � � � � � � � 81
Tiger�pufferfish�� � � � � � � � � � � � � � � � � � � � � � � � � � � � � � � � � � � � � � � � � � � � � � � � � � � � � � � � � � � � � � � � � 82
Turbot�� � � � � � � � � � � � � � � � � � � � � � � � � � � � � � � � � � � � � � � � � � � � � � � � � � � � � � � � � � � � � � � � � � � � � � � � � � � � � � � � � � � 83

INPUTS
DISCHARGES
BIO
LOGI
CA
L
BODANTI
INDE
FEED
ECOE
CAP
PATH
ESC
PA
RA
COP
50 100
Global averaGe—SpecieS (Norm.) 50
Species GAPI Score (Norm.)
Atlantic salmon’s overall
species score (70) is the
third-highest of the 20
species assessed.
0 50 100
Global Average
Country Score
70
UK
Norway
Chile
Canada
25
50
75
100
25
50
75
100
UK
Norway
Chile
Canada
0 50 100
72
72
66
70
GLOBAL AVERAGE—SPECIES (NORM.) 50
65 Gapi Global Aquaculture Performance Index www.gapi.ca
SpecieS reSUlTS
OverviewWith 1.43 million mT of production in 2007, Atlantic salmon dominates the global marine finfish industry and comprises over 40% of global marine finfish production. The vast majority of production occurs in the four countries assessed by GAPI—Norway, Chile, UK, and Canada. Similar scores within each produc-ing country—72, 66, 72, and 70, respectively—reflect a relatively mature, consolidated industry that has implemented an ecomonically optimal production model globally. Atlantic salmon’s overall species score (70) is the third–highest of the 20 species assessed.
InputsAtlantic salmon performs better than average across all Inputs indicators. Ecological energy (ECOE) scores range from a low of 66 for the UK—reflecting a higher proportion of fish protein in feed relative to other countries—to 75 for Norway. Even the UK’s score of 66 is considerably higher than the global ECOE average score of 53. Each country scores a 75 for sustainability of feed (FEED), 19 points above the global FEED average.
DischargesThese indicators drive the differences in scores across the four countries—particularly highlighting differ-ences in regulation and reporting. Chile’s antibiotics
score (ANTI) of 68 and parasiticides score (PARA) of 77 reflect more lenient regulations regarding the use of chemical therapeutants than those of other major producers. Norway, which has more stringent regulations and reporting structure for chemical use, scored 99 and 84, respectively. The UK scores below average in the PARA indicator due to the use of parasiticides with high toxicity and persistence levels. Yet it is the only major producer that requires report-ing on the quantity of copper-based antifoulants used and scores 49 for COP versus a COP score of 28 in the other producing countries. BOD scores range from 50 (Norway) to 81 (Chile), reflecting the degree of clustering found in each country.
BiologicalPerformance within the biological category is split. All countries have average escapes (ESC) scores between 38 and 40, hovering around the global average ESC score. Pathogens (PATH) scores are above the global average (52), with Canada (72) and Chile (67) scoring lower than Norway (78) and the UK (86). The higher scores are due to a combination of improved on-farm pathogen management and fewer susceptible species in the ecosystem’s host range biomass.
Atlantic salmon
63 GAPI Global Aquaculture Performance Index www.gapi.ca
radar GraphThis maps the performance of each species-country pair (i.e., Atlantic salmon–Norway) within the 10 indicator categories. Line colours in the radar graph match with colours in the bar graph.
The centre point equates to a GAPI score of 0. The outermost ring represents a perfect GAPI score of 100. The area inside each line is the GAPI score for that species-country pair. The larger the area, the higher the score.
For example, Norway and the UK both score a 72 for Atlantic salmon. However, the radar graph shows that while the two countries achieve a total GAPI score of 72, their performance within some of the indicator categories—such as parasiticides and antifoulants (copper) use—differs substantially.
species-Country Pair scoresThese are the normalised GAPI scores for each major producing country of this species (i.e., Atlantic salmon–Canada; Atlantic salmon–Chile).
Together, the listed countries comprise at least 90% of production of the farmed species.
Colours in the bar graph match with line colours in the radar graph.
species GAPI score (norm.)The blue bar indicates the normalised GAPI score (70) for the entire species. To derive this species score, the GAPI score for each species-country pair (listed on left-side bar graph) is weighted by the relative amount of production in that country and then aver-aged across countries, to get a weighted-average GAPI score for the species.
Global Average—species (norm.)This is the average normalised GAPI score for all species assessed by GAPI. This allows a comparison of how well the species is perform-ing relative to the average farmed marine finfish.
The grey-shaded area depicts average global performance (norm.) of all species-country pairs.
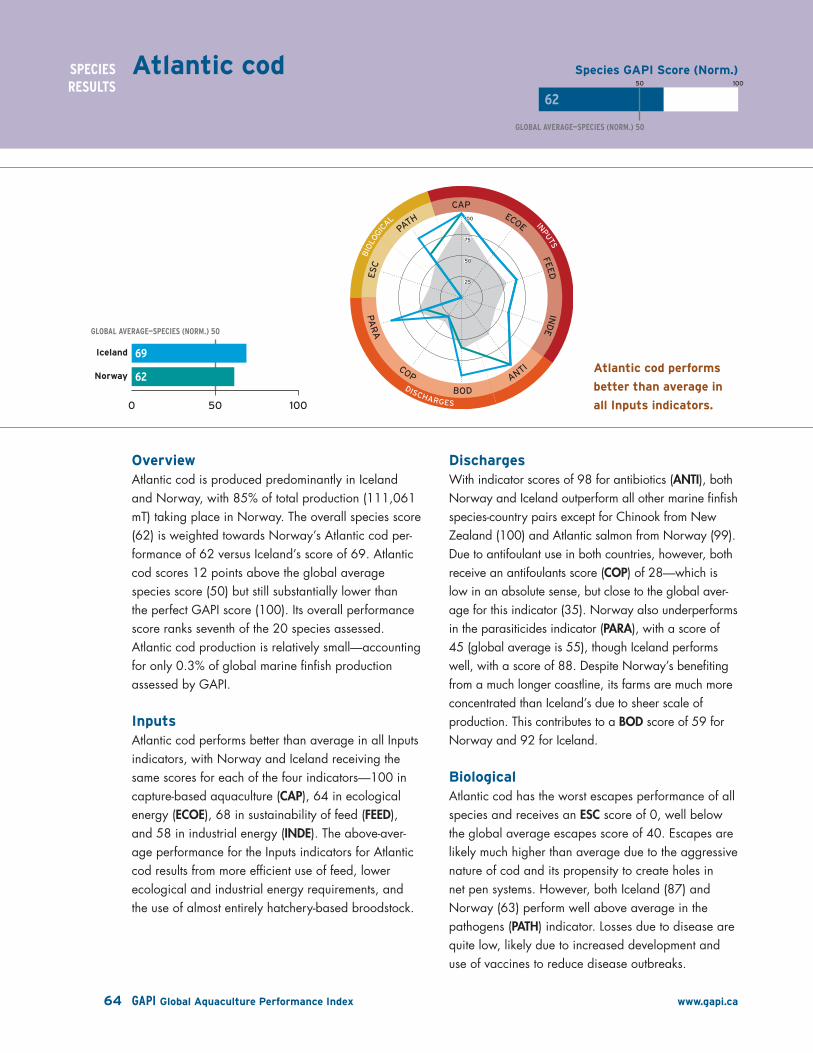
INPUTS
DISCHARGES
BIO
LOGI
CA
L
BODANTI
INDE
FEED
ECOE
CAP
PATH
ESC
PA
RA
COP
50 100
species GAPI score (norm.)
GLOBAL�AverAGe—sPecIes�(nOrm�)�50
Atlantic cod performs
better than average in
all Inputs indicators.
0 50 100
Global Average
Score
62
Norway
Iceland
0 50 100
62
69
GLOBAL AVERAGE—SPECIES (NORM.) 50
Norway
Iceland
25
50
75
100
25
50
75
100
64 GAPI Global Aquaculture Performance Index www.gapi.ca
sPecIes�resULts
overviewAtlantic cod is produced predominantly in Iceland and Norway, with 85% of total production (111,061 mT) taking place in Norway. The overall species score (62) is weighted towards Norway’s Atlantic cod per-formance of 62 versus Iceland’s score of 69. Atlantic cod scores 12 points above the global average species score (50) but still substantially lower than the perfect GAPI score (100). Its overall performance score ranks seventh of the 20 species assessed. Atlantic cod production is relatively small—accounting for only 0.3% of global marine finfish production assessed by GAPI.
InputsAtlantic cod performs better than average in all Inputs indicators, with Norway and Iceland receiving the same scores for each of the four indicators—100 in capture-based aquaculture (CAP), 64 in ecological energy (ECOE), 68 in sustainability of feed (FEED), and 58 in industrial energy (INDE). The above-aver-age performance for the Inputs indicators for Atlantic cod results from more efficient use of feed, lower ecological and industrial energy requirements, and the use of almost entirely hatchery-based broodstock.
dischargesWith indicator scores of 98 for antibiotics (ANTI), both Norway and Iceland outperform all other marine finfish species-country pairs except for Chinook from New Zealand (100) and Atlantic salmon from Norway (99). Due to antifoulant use in both countries, however, both receive an antifoulants score (COP) of 28—which is low in an absolute sense, but close to the global aver-age for this indicator (35). Norway also underperforms in the parasiticides indicator (PARA), with a score of 45 (global average is 55), though Iceland performs well, with a score of 88. Despite Norway’s benefiting from a much longer coastline, its farms are much more concentrated than Iceland’s due to sheer scale of production. This contributes to a BOD score of 59 for Norway and 92 for Iceland.
biologicalAtlantic cod has the worst escapes performance of all species and receives an ESC score of 0, well below the global average escapes score of 40. Escapes are likely much higher than average due to the aggressive nature of cod and its propensity to create holes in net pen systems. However, both Iceland (87) and Norway (63) perform well above average in the pathogens (PATH) indicator. Losses due to disease are quite low, likely due to increased development and use of vaccines to reduce disease outbreaks.
Atlantic cod
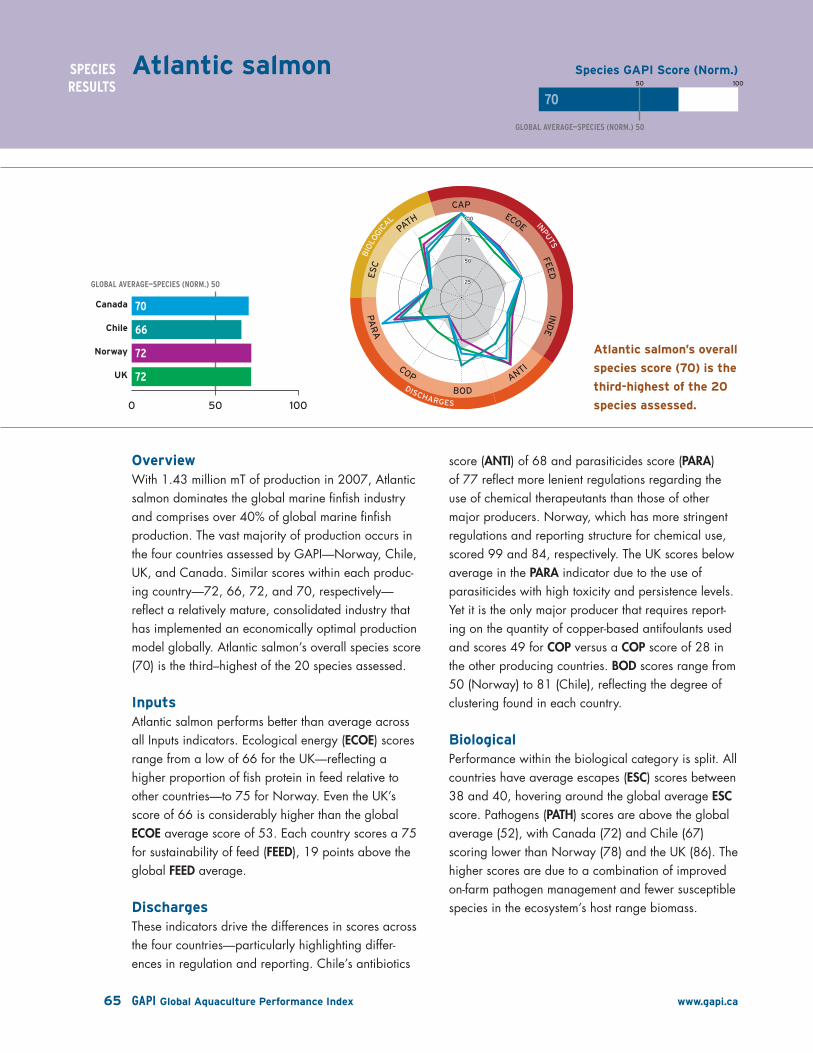
INPUTS
DISCHARGES
BIO
LOGI
CA
L
BODANTI
INDE
FEED
ECOE
CAP
PATH
ESC
PA
RA
COP
50 100
GLOBAL�AverAGe—sPecIes�(nOrm�)�50
species GAPI score (norm.)
Atlantic salmon’s overall
species score (70) is the
third-highest of the 20
species assessed.
0 50 100
Global Average
Country Score
70
UK
Norway
Chile
Canada
25
50
75
100
25
50
75
100
UK
Norway
Chile
Canada
0 50 100
72
72
66
70
GLOBAL AVERAGE—SPECIES (NORM.) 50
65 GAPI Global Aquaculture Performance Index www.gapi.ca
sPecIes�resULts
overviewWith 1.43 million mT of production in 2007, Atlantic salmon dominates the global marine finfish industry and comprises over 40% of global marine finfish production. The vast majority of production occurs in the four countries assessed by GAPI—Norway, Chile, UK, and Canada. Similar scores within each produc-ing country—72, 66, 72, and 70, respectively—reflect a relatively mature, consolidated industry that has implemented an economically optimal production model globally. Atlantic salmon’s overall species score (70) is the third–highest of the 20 species assessed.
InputsAtlantic salmon performs better than average across all Inputs indicators. Ecological energy (ECOE) scores range from a low of 66 for the UK—reflecting a higher proportion of fish protein in feed relative to other countries—to 75 for Norway. Even the UK’s score of 66 is considerably higher than the global ECOE average score of 53. Each country scores a 75 for sustainability of feed (FEED), 19 points above the global FEED average.
dischargesThese indicators drive the differences in scores across the four countries—particularly highlighting differ-ences in regulation and reporting. Chile’s antibiotics
score (ANTI) of 68 and parasiticides score (PARA) of 77 reflect more lenient regulations regarding the use of chemical therapeutants than those of other major producers. Norway, which has more stringent regulations and reporting structure for chemical use, scored 99 and 84, respectively. The UK scores below average in the PARA indicator due to the use of parasiticides with high toxicity and persistence levels. Yet it is the only major producer that requires report-ing on the quantity of copper-based antifoulants used and scores 49 for COP versus a COP score of 28 in the other producing countries. BOD scores range from 50 (Norway) to 81 (Chile), reflecting the degree of clustering found in each country.
biologicalPerformance within the biological category is split. All countries have average escapes (ESC) scores between 38 and 40, hovering around the global average ESC score. Pathogens (PATH) scores are above the global average (52), with Canada (72) and Chile (67) scoring lower than Norway (78) and the UK (86). The higher scores are due to a combination of improved on-farm pathogen management and fewer susceptible species in the ecosystem’s host range biomass.
Atlantic salmon

INPUTS
DISCHARGES
BIO
LOGI
CA
L
BODANTI
INDE
FEED
ECOE
CAP
PATH
ESC
PA
RA
COP
50 100
species GAPI score (norm.)
GLOBAL�AverAGe—sPecIes�(nOrm�)�50
the three Asian produc-
ers of barramundi tend
to perform similarly
across indicators, while
Australia often tends to
be the outlier.
0 50 100
Global Average
Country Score
44
Thailand
Malaysia
Indonesia
Australia
25
50
75
100
25
50
75
100
Thailand
Malaysia
Indonesia
Australia
0 50 100
41
50
46
47
GLOBAL AVERAGE—SPECIES (NORM.) 50
66 GAPI Global Aquaculture Performance Index www.gapi.ca
sPecIes�resULts
overviewBarramundi is largely produced in four countries—Australia, Indonesia, Malaysia, and Thailand. Each country performs at or below the global species average score (50). With scores ranging from a high of 50 (Malaysia) to a low of 41 (Thailand) and an average barramundi score of 44, it ranks in the bottom half of all marine finfish species assessed. The three Asian producers of barramundi tend to perform similarly across indicators, while Australia often tends to be the outlier. Barramundi comprised less than 1% of global marine finfish production in 2007.
InputsAustralia performs above average in all Input categories except industrial energy (INDE), for which it scores 0. This score reflects a large proportion of production farmed in closed containment, which dramatically increases Australia’s industrial energy consumption and makes it one of the worst performers of all species-country pairs in the INDE indicator. This is offset somewhat by Australia’s superior ecological energy (ECOE) performance (70 versus 39 for Asian producers), a result of high plant content in the Australian barramundi diet that is typically absent from Asian feeds.
dischargesSignificant variation exists in performance among producing countries in the Discharges category. Thailand’s antibiotic (ANTI) score (38) is the worst of the cohort due to its excessive use of (estimated 63.7 mT) antibiotics, all of which are critical for veterinary and/or human medicine, according to the WHO-OIE ratings. The parasiticides (PARA) scores range from 0 (Malaysia) to 40 (Thailand). Malaysia’s poor performance reflects the routine use of formalin, malachite green, and polyvinyl pyrrolidone iodide. The BOD indicator scores exhibit the largest range, ranging from 0 (Thailand) to 94 (Indonesia). The area of overlap of barramundi farms in Thailand is more than 29,000 km2 of marine habitat, which results in a BOD score of 0. This ties Thailand’s barramundi with Japanese amberjack from Japan as the worst performer of all species-country pairs for BOD. Greater dispersal among Indonesia’s barramundi scores results in its BOD score of 94.
biologicalEach country receives an Escapes (ESC) score of 35, just below the global average for ESC. Australia’s pathogen (PATH) score (24) falls well below the global average of 52 and is roughly half that of Asian producers, caused by a significantly greater propor-tion of susceptible host biomass species in Australian waters relative to that in Asian waters.
barramundi

INPUTS
DISCHARGES
BIO
LOGI
CA
L
BODANTI
INDE
FEED
ECOE
CAP
PATH
ESC
PA
RA
COP
50 100
GLOBAL�AverAGe—sPecIes�(nOrm�)�50
species GAPI score (norm.)
korea’s exclusive use
of land-based systems
eliminates the issue of
escapes (resulting in a
perfect esC score).
0 50 100
Global Average
Country Score
49
Korea, Republic of
China
25
50
75
100
25
50
75
100
Korea, Republic of
China
0 50 100
61
41
GLOBAL AVERAGE—SPECIES (NORM.) 50
67 GAPI Global Aquaculture Performance Index www.gapi.ca
sPecIes�resULts
overviewBastard halibut production is assessed within two countries—China (62% of total assessed produc-tion) and the Republic of Korea. Its species score (49) is just shy of the global species average. Its performance score ranks 11th of the 20 marine finfish species assessed. Performance varies greatly between the two countries and among the three indicator categories.
InputsThe largest difference in China and the Republic of Korea’s performance in Inputs is industrial energy (INDE) use. The Republic of Korea (23) scores significantly lower than China (61) in INDE since Korea’s bastard halibut production occurs exclusively in closed, land-based systems. Further, the Republic of Korea’s production relies largely on the use of (low-transfer-efficiency) whole “trash” fish instead of the pelleted, compound feeds that China uses in its open net pens. Both countries perform below the global average (56) in sustainability of feed (FEED), with China scoring 34 and the Republic of Korea 42. Both achieve a perfect score for capture-based aquaculture (CAP) as they rely solely on hatcheries.
dischargesThere is significant difference in performance within the Discharges indicators, with Korea outperforming
China on three of the four indicators. China’s antibiot-ics (ANTI) score (37) is less than half the Republic of Korea’s score (82), because China uses over 10 times the amount of antibiotics per mT of fish produced (3.8 kg per mT antibiotics [active ingredient] versus 0.31 kg per mT, respectively). The relatively low levels of antibiotics used by the Republic of Korea also reflect its use of closed-containment systems that minimize the contact between the farm and the wild environ-ment. The Republic of Korea also vastly outperforms China in antifoulant use (COP), with a perfect score (100) versus China’s 28. China rebounds with a much higher parasiticides (PARA) score than Korea (69 versus 4), resulting from the Republic of Korea’s use of approximately 914,000 kg of the therapeutant, formalin.
biologicalChina’s bastard halibut pathogens (PATH) score is 0 due to very high mortality (approximately 56%) on its farms, compared to approximately 10% in Korea. Both regions have similar proportions of susceptible host biomass in their ecosystems (approximately 7%). Korea’s exclusive use of land-based systems eliminates the issue of escapes (resulting in a perfect ESC score), whereas an estimated 122,000 fish escaped from Chinese bastard halibut farms, resulting in an ESC score of 49.
bastard halibut

INPUTS
DISCHARGES
BIO
LOGI
CA
L
BODANTI
INDE
FEED
ECOE
CAP
PATH
ESC
PA
RA
COP
50 100
species GAPI score (norm.)
GLOBAL�AverAGe—sPecIes�(nOrm�)�50
Chinook salmon
achieves an overall
species score of 72—
the highest performance
score of all species
assessed by GAPI.
0 50 100
Global Average
Country Score
72
New Zealand
Chile
25
50
75
100
25
50
75
100
New Zealand
Chile
0 50 100
73
64
GLOBAL AVERAGE—SPECIES (NORM.) 50
68 GAPI Global Aquaculture Performance Index www.gapi.ca
sPecIes�resULts
overviewA majority of farmed Chinook salmon is produced in New Zealand (81% of production assessed by GAPI) and Chile (19%). Chinook salmon achieves an overall species score of 72—the highest performance score of all species assessed by GAPI. While New Zealand performs better than Chile (73 versus 64), both countries score well above the global average (50) for their production of Chinook salmon.
InputsChinook salmon performs well in the Inputs indicators. Chile and New Zealand score 75 and 70, respec-tively, in ecological energy (ECOE). Both countries utilize feed formulations with high proportions of plant materials. However, New Zealand’s sustainability of feed (FEED) performance (52 versus Chile’s 75) is undermined by its inclusion of tuna in some of its feed formulations.
dischargesA robust regulatory regime and sound husbandry practices in New Zealand help it achieve a perfect antibiotics (ANTI) score for Chinook salmon, whereas Chile’s score (68) is more in line with the global average for that indicator (54). New Zealand also achieves a perfect score in parasiticides (PARA), whereas the rest of Chile’s scores are more consistent with scores of other salmon (Atlantic and coho) producers.
biologicalBoth Chile (42) and New Zealand (47) perform close to the global average (40) for escapes (ESC). While Chile (53) performs close to the global average (52) for pathogens (PATH) as well, the near absence of parasites on New Zealand farms allows it to achieve a PATH of 100. Chile’s performance is significantly worse due to on-farm mortalities.
Chinook salmon

INPUTS
DISCHARGES
BIO
LOGI
CA
L
BODANTI
INDE
FEED
ECOE
CAP
PATH
ESC
PA
RA
COP
50 100
GLOBAL�AverAGe—sPecIes�(nOrm�)�50
species GAPI score (norm.)
With a species score of
37, cobia ranks among
the worst performers of
all species assessed.
0 50 100
Global Average
Country Score
37
Taiwan
China
25
50
75
100
25
50
75
100
Taiwan,Republic of China
China
0 50 100
35
37
GLOBAL AVERAGE—SPECIES (NORM.) 50
69 GAPI Global Aquaculture Performance Index www.gapi.ca
sPecIes�resULts
overviewCobia farming takes place primarily in China (87% of total production assessed) and Taiwan. With a species score of 37, cobia ranks among the worst performers of all species assessed. Ecological energy (ECOE) and industrial energy (INDE) are problem areas in both countries, whereas BOD, antibiotics (ANTI), and parasiticides (PARA) are important in differentiating the relative performances of China and Taiwan. Cobia production is relatively small, compris-ing less than 1% of global marine finfish production assessed by GAPI.
InputsBoth countries perform poorly in the Inputs category; in particular, both score 0 for ECOE reflecting the strong reliance on typically high-trophic-level “trash” fish for feed. The use of “trash” fish also results in a poor conversion efficiency, further undermining the ECOE score. This practice also negatively affects cobia’s INDE performance (5 for both countries), as substantial fish protein is required to produce a relatively modest volume of farmed product.
dischargesCobia performs poorly within all Discharges indica-tors with the exception of Taiwan’s above-average BOD score of 74. Significant antibiotic use in both countries results in low ANTI performance; however, the performance in PARA, particularly in Taiwan, is even more severe. China’s use of an estimated 175,000 kg of eight different parasiticides such as malachite green and formalin results in a low PARA score (35); however, Taiwan’s liberal use of toxic chemicals such as trichlorfon results in an even lower PARA score of 6.
biologicalEscapes (ESC) (41) and pathogens (PATH) (60) scores are the same for both countries and are proximate to the global averages scores for both indicators.
Cobia
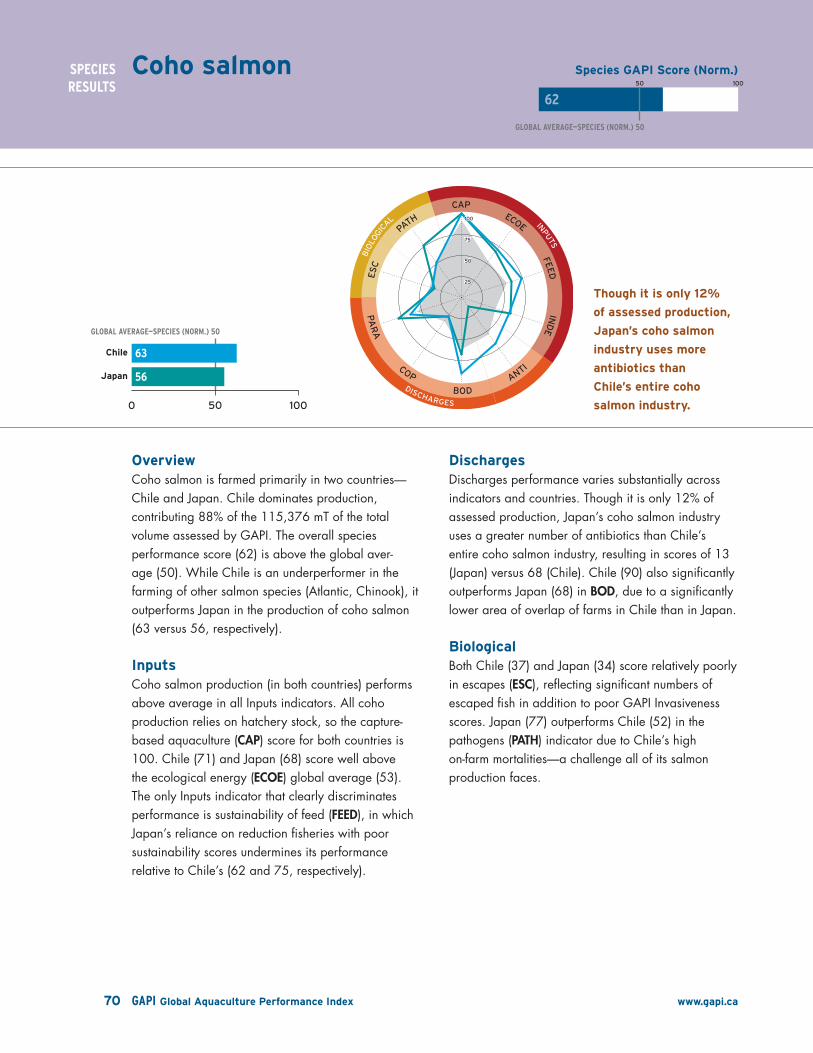
INPUTS
DISCHARGES
BIO
LOGI
CA
L
BODANTI
INDE
FEED
ECOE
CAP
PATH
ESC
PA
RA
COP
50 100
species GAPI score (norm.)
GLOBAL�AverAGe—sPecIes�(nOrm�)�50
though it is only 12%
of assessed production,
Japan’s coho salmon
industry uses more
antibiotics than
Chile’s entire coho
salmon industry.
0 50 100
Global Average
Country Score
62
Japan
Chile
25
50
75
100
25
50
75
100
Japan
Chile
0 50 100
56
63
X
X
X
X
X
GLOBAL AVERAGE—SPECIES (NORM.) 50
70 GAPI Global Aquaculture Performance Index www.gapi.ca
sPecIes�resULts
overviewCoho salmon is farmed primarily in two countries—Chile and Japan. Chile dominates production, contributing 88% of the 115,376 mT of the total volume assessed by GAPI. The overall species performance score (62) is above the global aver-age (50). While Chile is an underperformer in the farming of other salmon species (Atlantic, Chinook), it outperforms Japan in the production of coho salmon (63 versus 56, respectively).
InputsCoho salmon production (in both countries) performs above average in all Inputs indicators. All coho production relies on hatchery stock, so the capture-based aquaculture (CAP) score for both countries is 100. Chile (71) and Japan (68) score well above the ecological energy (ECOE) global average (53). The only Inputs indicator that clearly discriminates performance is sustainability of feed (FEED), in which Japan’s reliance on reduction fisheries with poor sustainability scores undermines its performance relative to Chile’s (62 and 75, respectively).
dischargesDischarges performance varies substantially across indicators and countries. Though it is only 12% of assessed production, Japan’s coho salmon industry uses a greater number of antibiotics than Chile’s entire coho salmon industry, resulting in scores of 13 (Japan) versus 68 (Chile). Chile (90) also significantly outperforms Japan (68) in BOD, due to a significantly lower area of overlap of farms in Chile than in Japan.
biologicalBoth Chile (37) and Japan (34) score relatively poorly in escapes (ESC), reflecting significant numbers of escaped fish in addition to poor GAPI Invasiveness scores. Japan (77) outperforms Chile (52) in the pathogens (PATH) indicator due to Chile’s high on-farm mortalities—a challenge all of its salmon production faces.
Coho salmon

INPUTS
DISCHARGES
BIO
LOGI
CA
L
BODANTI
INDE
FEED
ECOE
CAP
PATH
ESC
PA
RA
COP
50 100
GLOBAL�AverAGe—sPecIes�(nOrm�)�50
species GAPI score (norm.)
Consistency of
production methods and
geographic proximity of
producers result in low
variation in performance
among producers.
0 50 100
Global Average
Country Score
64
Turkey
Spain
Italy
Greece
25
50
75
100
25
50
75
100
Turkey
Spain
Italy
Greece
0 50 100
61
63
69
66
GLOBAL AVERAGE—SPECIES (NORM.) 50
71 GAPI Global Aquaculture Performance Index www.gapi.ca
sPecIes�resULts
overviewEuropean seabass is farmed throughout the Mediterranean. GAPI assessed 94,317 mT of produc-tion, the greatest proportion coming from Turkey (44%), followed by Greece (37%), Spain (10%), and Italy (9%). The overall species score is 64—14 points above the global species average. Italy’s score of 69 leads all producers, with Turkey as the worst performer (61). Consistency of production methods and geographic proximity of producers result in low variation in performance among producers.
InputsAll producing countries score well in the Inputs indicators. The main discriminator of performance among Inputs is the proportion of production coming from land-based facilities in each country. With 24% of production on land, Italy’s industrial energy (INDE) score (31) trails all others (range 43–50), which have much smaller proportions of land-based production. All other indicator performances exceed global mean performances and show very little variation among European seabass producers (leaders and laggards are separated by six or fewer points).
dischargesDischarges scores are more variable than those in the Inputs or Biological categories. The ranges for antibiotics (ANTI) (50–81), BOD (58–97), and COP (28–64) reflect differing husbandry practices and habitats as well as a difference in the degree of reliance on land-based systems. Interestingly, not one producing country consistently performs better or worse than its peers. The long coastlines of Italy and Spain and distributed production play in their favour for BOD performance (97 and 93, respectively). Turkey’s relatively low ANTI score (50) highlights its intense use of five antibiotics that are critically important in both human and veterinary medicine.
biologicalThe near identical context of producing countries is most evident in pathogens (PATH) scores, where all scored 75. In contrast, considerable variation is seen in escapes (ESC) scores, where Italy’s predominance of closed-containment systems drives its high score (74) compared to other producers. Greece (47) trails due to high volumes of escapes and modest differ-ences in its GAPI Invasiveness score.
european seabass

INPUTS
DISCHARGES
BIO
LOGI
CA
L
BODANTI
INDE
FEED
ECOE
CAP
PATH
ESC
PA
RA
COP
50 100
species GAPI score (norm.)
GLOBAL�AverAGe—sPecIes�(nOrm�)�50
Flathead grey mullet’s
performance ranks
second of the 20
marine species
assessed by GAPI.
0 50 100
Global Average
Country Score
71
Egypt
25
50
75
100
25
50
75
100
Egypt
0 50 100
71
GLOBAL AVERAGE—SPECIES (NORM.) 50
72 GAPI Global Aquaculture Performance Index www.gapi.ca
sPecIes�resULts
overviewEgypt is the only assessed flathead grey mullet producer, accounting for over 90% of production of the species. It comprised close to 7% of global marine finfish production in 2007, and its score (71) is well above the global average species score of 50 (and country score of 59). Egypt’s exclusive use of closed, pond production systems and a diet of 70% plant material result in flathead grey mullet’s high score. Flathead grey mullet’s performance ranks second of the 20 marine species assessed by GAPI.
InputsFlathead grey mullet performs well in all Inputs indica-tors, with the exception of capture-based aquaculture (CAP) due to reliance on wild-caught fry. Its CAP score (68) is well below the global average (91). A relatively low-trophic-level species, Egypt’s flathead grey mullet’s diet is typically supplemented by chicken manure and the wastes of other species with which it is cultured. This results in a relatively high ecological energy (ECOE) score (75) and a close to perfect sustainability of feed (FEED) score (99). Because production is in ponds, not in on-land tanks, it manages to achieve a decent industrial energy (INDE) score (57), 15 points above the global average.
dischargesFlathead grey mullet scores well in the Discharges category, with the marked exception of its antibiotics (ANTI) performance (32), which is well below the global mean of 54. Antibiotic use by Egypt’s flathead grey mullet industry is potentially as high as 1 mT (active ingredient); however, GAPI had to make some assumptions regarding antibiotic use due to lack of data.
biologicalFlathead grey mullet scores well in pathogens (PATH) (91), compared to the global mean of 52, resulting from low (reported) on-farm losses due to disease and a lack of wild species vulnerable to diseases common in flathead grey mullet. Closed-pond facilities are susceptible to escape events (unlike land-based tank culture), resulting in an escapes (ESC) score (41) similar to the global average ESC score (40).
Flathead grey mullet

INPUTS
DISCHARGES
BIO
LOGI
CA
L
BODANTI
INDE
FEED
ECOE
CAP
PATH
ESC
PA
RA
COP
50 100
GLOBAL�AverAGe—sPecIes�(nOrm�)�50
species GAPI score (norm.)
Intercountry variation in
scores is due primarily
to those indicators most
affected by proportion in
land-based facilities.
0 50 100
Global Average
Country Score
57
Turkey
Spain
Italy
Israel
Greece
25
50
75
100
25
50
75
100
Turkey
Spain
Italy
Israel
Greece
0 50 100
55
57
65
60
56
GLOBAL AVERAGE—SPECIES (NORM.) 50
73 GAPI Global Aquaculture Performance Index www.gapi.ca
sPecIes�resULts
overviewFive countries dominate gilthead seabream production—Greece, Israel, Italy, Spain, and Turkey (listed in descending order of production). It is still a relatively small industry, accounting for just over 3% of the global marine finfish production assessed by GAPI (113,761 mT). The overall species score is 57, besting the global average of 50. Italy leads produc-ing countries (65), and the worst-performing producer is Turkey (55). Intercountry variation in scores is due primarily to those indicators most affected by propor-tion in land-based facilities: industrial energy (INDE), biochemical oxygen demand (BOD), antifoulants (COP), escapes (ESC), and pathogens (PATH).
InputsInputs scores are largely similar across producing countries because of consistency throughout gilthead seabream aquaculture operations. The largest range occurs within INDE (60–37) due to differences in production systems. Israel and Italy score 41 and 37, respectively, for INDE, below the global average (42) because of the high energy demand of their closed-containment facilities. Other Inputs indicators scores for all producing countries are above the global average.
dischargesDifferences in Discharges scores are affected by differences in production systems (i.e., land-based facilities), density of farms, and parasiticides use. BOD scores range from Greece’s 49, where clustering of farms is at its maximum, to Italy’s 98, where pro-duction is distributed along its long coastline. Scores for parasiticides (PARA) show a similar pattern, with Greece scoring 57 and Italy and Turkey scoring 81. The greater use of land-based facilities in Italy (64) and Israel (49) enables the two countries to achieve higher-than-average (35) COP scores.
biologicalThe ESC scores show the influence of land-based culture as well, with Italy and Israel scoring 53 and 32, respectively, while the countries relying on open-net cage production score between 5 and 8. Gilthead seabream scores are above the global PATH average of 52, except for Turkey (44), which can be explained by a higher proportion of production loss from diseases in Turkey than in the other four producing countries.
Gilthead seabream
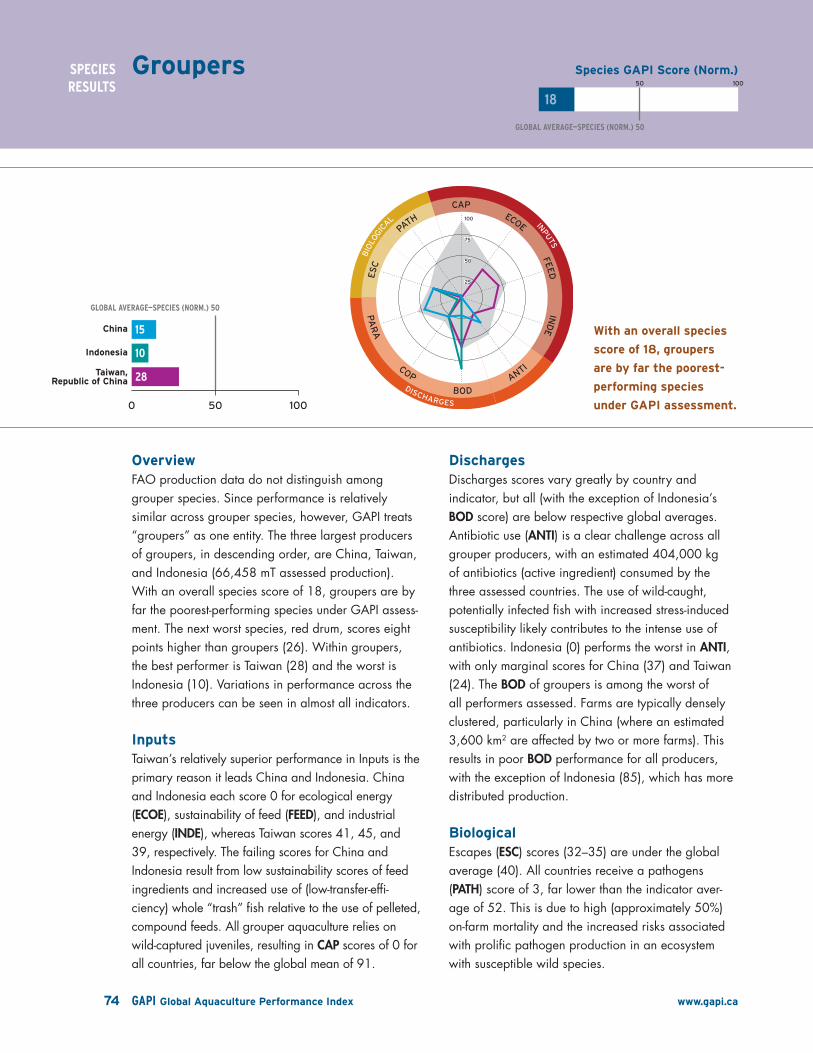
INPUTS
DISCHARGES
BIO
LOGI
CA
L
BODANTI
INDE
FEED
ECOE
CAP
PATH
ESC
PA
RA
COP
50 100
species GAPI score (norm.)
GLOBAL�AverAGe—sPecIes�(nOrm�)�50
With an overall species
score of 18, groupers
are by far the poorest-
performing species
under GAPI assessment.
0 50 100
Global Average
Country Score
18
Taiwan
Indonesia
China25
50
75
100
25
50
75
100
Taiwan,Republic of China
Indonesia
China
0 50 100
28
10
15
GLOBAL AVERAGE—SPECIES (NORM.) 50
74 GAPI Global Aquaculture Performance Index www.gapi.ca
sPecIes�resULts
overviewFAO production data do not distinguish among grouper species. Since performance is relatively similar across grouper species, however, GAPI treats “groupers” as one entity. The three largest producers of groupers, in descending order, are China, Taiwan, and Indonesia (66,458 mT assessed production). With an overall species score of 18, groupers are by far the poorest-performing species under GAPI assess-ment. The next worst species, red drum, scores eight points higher than groupers (26). Within groupers, the best performer is Taiwan (28) and the worst is Indonesia (10). Variations in performance across the three producers can be seen in almost all indicators.
InputsTaiwan’s relatively superior performance in Inputs is the primary reason it leads China and Indonesia. China and Indonesia each score 0 for ecological energy (ECOE), sustainability of feed (FEED), and industrial energy (INDE), whereas Taiwan scores 41, 45, and 39, respectively. The failing scores for China and Indonesia result from low sustainability scores of feed ingredients and increased use of (low-transfer-effi-ciency) whole “trash” fish relative to the use of pelleted, compound feeds. All grouper aquaculture relies on wild-captured juveniles, resulting in CAP scores of 0 for all countries, far below the global mean of 91.
dischargesDischarges scores vary greatly by country and indicator, but all (with the exception of Indonesia’s BOD score) are below respective global averages. Antibiotic use (ANTI) is a clear challenge across all grouper producers, with an estimated 404,000 kg of antibiotics (active ingredient) consumed by the three assessed countries. The use of wild-caught, potentially infected fish with increased stress-induced susceptibility likely contributes to the intense use of antibiotics. Indonesia (0) performs the worst in ANTI, with only marginal scores for China (37) and Taiwan (24). The BOD of groupers is among the worst of all performers assessed. Farms are typically densely clustered, particularly in China (where an estimated 3,600 km2 are affected by two or more farms). This results in poor BOD performance for all producers, with the exception of Indonesia (85), which has more distributed production.
biologicalEscapes (ESC) scores (32–35) are under the global average (40). All countries receive a pathogens (PATH) score of 3, far lower than the indicator aver-age of 52. This is due to high (approximately 50%) on-farm mortality and the increased risks associated with prolific pathogen production in an ecosystem with susceptible wild species.
Groupers

INPUTS
DISCHARGES
BIO
LOGI
CA
L
BODANTI
INDE
FEED
ECOE
CAP
PATH
ESC
PA
RA
COP
50 100
GLOBAL�AverAGe—sPecIes�(nOrm�)�50
species GAPI score (norm.)
the major obstacle
preventing Japanese
amberjack from achieving
a higher score is its
performance in bod and
pathogens (PAth).
0 50 100
Global Average
Country Score
45
Japan
25
50
75
100
25
50
75
100
Japan
0 50 100
45
GLOBAL AVERAGE—SPECIES (NORM.) 50
75 GAPI Global Aquaculture Performance Index www.gapi.ca
sPecIes�resULts
overviewJapanese amberjack is assessed in Japan only (157,900 mT assessed production), as Japan accounts for over 90% of production of this species. Though its production is dominated by one country, Japanese amberjack accounted for close to 5% of global marine finfish production in 2007. The overall species performance score (45) is near the global average (50). The major obstacle preventing Japanese amberjack from achieving a higher score is its performance in BOD and pathogens (PATH).
InputsJapanese amberjack performs best in the Inputs indicators, scoring well in capture-based aquaculture (CAP) (99), ecological energy (ECOE) (60), and indus-trial energy (INDE) (56). However, it scores poorly in sustainability of feed (FEED) (39), due to significant inclusion of Pacific sandeel in feed, a species with serious conservation concerns, particularly a lack of catch limits within the Japanese fishery.
dischargesDischarges indicators show similar variations. Japan only uses three different types of parasiticides, all of which have relatively low persistence, resulting in a high parasiticides (PARA) score (84) relative to the global PARA average (55). The BOD indicator score is 0 due to the extreme clustering of farms (area of overlap is nearly 26,000 km2). Both antibiotics (ANTI) and antifoulants (COP) scores (36 and 28, respec-tively) fall below global average scores.
biologicalJapanese amberjack performs poorly in pathogens (PATH) (32—far below the global average of 52) due to high reported production loss from pathogens and a large host range biomass vulnerable to diseases that are common in farmed Japanese amberjack.
Japanese amberjack

INPUTS
DISCHARGES
BIO
LOGI
CA
L
BODANTI
INDE
FEED
ECOE
CAP
PATH
ESC
PA
RA
COP
50 100
species GAPI score (norm.)
GLOBAL�AverAGe—sPecIes�(nOrm�)�50
Japanese seabass’s poor
performance is largely
a result of low scores in
the discharges category.
0 50 100
Global Average
Country Score
32
China
25
50
75
100
25
50
75
100
China
0 50 100
32
GLOBAL AVERAGE—SPECIES (NORM.) 50
76 GAPI Global Aquaculture Performance Index www.gapi.ca
sPecIes�resULts
overviewJapanese seabass farming accounted for close to 3% of global marine finfish production in 2007, with the majority of production taking place in China. With an overall species score of 32 (18 points below the global average), China’s Japanese seabass ranks 18th out of the 20 species assessed. Japanese seabass’s poor performance is largely a result of low scores in the Discharges category.
InputsChina’s Japanese seabass aquaculture industry performs well below average in every Inputs indica-tor. While its strongest performance in this category is in capture-based aquaculture (CAP) (54), it is still 37 points below the global average due to partial reliance on wild-source broodstock.
dischargesChina’s Japanese seabass’s worst performance occurs within the Discharges indicators. It scores a 4 for BOD (compared to the global average of 61), which reflects a very high area of overlap among farms. It also performs poorly in PARA (44) and antibiotics (ANTI) (31) relative to the global indicator averages of 55 and 54, respectively, a result of lax regulations allowing frequent and extensive therapeutant use.
biologicalRelative to the two other indicator categories, China’s Japanese seabass performs decently within the Biological category, with scores of 35 and 57 for escapes (ESC) and pathogens (PATH), respectively. However, it still performs below the global average scores for each of these indicators.
Japanese seabass

INPUTS
DISCHARGES
BIO
LOGI
CA
L
BODANTI
INDE
FEED
ECOE
CAP
PATH
ESC
PA
RA
COP
50 100
GLOBAL�AverAGe—sPecIes�(nOrm�)�50
species GAPI score (norm.)
korean rockfish’s overall
species score (54) is
in line with the global
species average (50).
0 50 100
Global Average
Country Score
54
Korea
25
50
75
100
25
50
75
100
Korea, Republic of
0 50 100
54
GLOBAL AVERAGE—SPECIES (NORM.) 50
77 GAPI Global Aquaculture Performance Index www.gapi.ca
sPecIes�resULts
overviewKorean rockfish accounted for approximately 1% of global marine finfish production in 2007, with 100% of production occurring in Korea. Korean rockfish’s overall species score (54) is in line with the global species average (50).
InputsKorean rockfish’s performance within the Inputs indicators tracks the global average for each indica-tor. It achieves a perfect score in capture-based aquaculture (CAP) since Korea’s industry does not rely on wild stock.
dischargesWhile Korean rockfish performs well above average in antibiotics (ANTI) (82 versus a global average score of 54), it scores below average in the other three Discharges indicators—BOD (45), antifoulants
(COP) (28), and parasiticides (PARA) (0). The relatively high ANTI score and low PARA score are indicators of poor reporting regarding use of medica-tion and a discrepancy in data availability between the two indicators. The low PARA score is driven by widespread use of the chemical, formalin, in Korean rockfish farming. It is one of only four other perform-ers to score a 0 for parasiticide use, with a global average PARA score of 55.
biologicalKorean rockfish performs slightly above average in both Biological indicators, with a score of 49 in escapes (ESC) and 57 in pathogens (PATH). One explanation of its moderate performance in patho-gens is reduced mortality resulting from higher levels of applied parasiticide treatments.
korean rockfish

INPUTS
DISCHARGES
BIO
LOGI
CA
L
BODANTI
INDE
FEED
ECOE
CAP
PATH
ESC
PA
RA
COP
50 100
species GAPI score (norm.)
GLOBAL�AverAGe—sPecIes�(nOrm�)�50
large yellow croaker
performs above average
in the biological
indicators and, in
general, below average
in the Inputs and
discharges indicators.
0 50 100
Global Average
Country Score
41
China
25
50
75
100
25
50
75
100
China
0 50 100
41
GLOBAL AVERAGE—SPECIES (NORM.) 50
78 GAPI Global Aquaculture Performance Index www.gapi.ca
sPecIes�resULts
overviewLarge yellow croaker, farmed primarily in China, accounted for close to 2% of global marine finfish production in 2007. Its overall species score (41) is marginally below the global average (50). Large yellow croaker performs above average in the Biological indicators and, in general, below average in the Inputs and Discharges indicators.
InputsChina’s large yellow croaker farming performs below average among the Input indicators, except for a score of 100 for capture-based aquaculture (CAP). Ecological energy (ECOE) (23), sustainability of feed (FEED) (33), and industrial energy (INDE) (27) scores are significantly lower than the global indicator averages of 53, 56, and 42, respectively. The use of less-sustainable feed species in very high quantities results in poor ECOE and FEED scores. At the same time, the low INDE score results from high industrial energy demands from both the feed and production systems. The low FEED score is explained by large yellow croaker’s high transfer coefficient (7.6).
dischargesLarge yellow croaker performs below the global average in the Discharges category as well, with the exception of parasiticides (PARA), in which it scores 89 versus a global average of 55. With a high PARA score and low antibiotics (ANTI) score (31), it appears that China’s large yellow croaker industry may be more reliant on antibiotics than on parasiticides to reduce pathogen outbreaks.
biologicalLarge yellow croaker performs slightly above average in both Biological indicators, scoring 48 in escapes (ESC) and 57 in pathogens (PATH), against the means of 40 and 52, respectively. It appears that a trade-off may exist between heavy antibiotic use and reduced pathogens in China’s farmed large yellow croaker industry.
large yellow croaker

INPUTS
DISCHARGES
BIO
LOGI
CA
L
BODANTI
INDE
FEED
ECOE
CAP
PATH
ESC
PA
RA
COP
50 100
GLOBAL�AverAGe—sPecIes�(nOrm�)�50
species GAPI score (norm.)
Milkfish accounted for
17% of global marine
finfish production in
2007, making it the
second-largest marine
finfish aquaculture sector
after Atlantic salmon.
0 50 100
Global Average
Country Score
63
Phillippines
Indonesia
25
50
75
100
25
50
75
100
Philippines
Indonesia
0 50 100
59
68
GLOBAL AVERAGE—SPECIES (NORM.) 50
79 GAPI Global Aquaculture Performance Index www.gapi.ca
sPecIes�resULts
overviewMilkfish accounted for 17% of global marine finfish production in 2007, making it the second-largest marine finfish aquaculture sector after Atlantic salmon. Indonesia and the Philippines dominate production. Milkfish performs above the global species average, with an overall species score of 63. Indonesia outperforms the Philippines with scores of 68 and 59, respectively. Milkfish farming performs relatively well within the Inputs category, while there is greater variation in country performance among the Discharges indicators.
InputsBoth countries achieve an above-average capture-based aquaculture (CAP) score (98), as neither country is dependent upon wild stocks for production. While the ecological energy (ECOE) and industrial energy (INDE) scores in Indonesia (80 and 61, respectively) and the Philippines (78 and 57, respec-tively) are slightly different, all are above the global average (53 and 42, respectively). Milkfish farming is largely pond-based and extensive, requiring less external input in terms of energy than traditional inten-sive aquaculture systems. It also scores well above average in sustainability of feed (FEED) (90 versus a global average score of 56), since very few wild fish ingredients are used. Other factors contributing to
high Inputs scores are high feed conversion efficien-cies and the use of polyculture.
dischargesAntibiotics (ANTI) scores of 97 and 69 for Indonesia and the Philippines, respectively, are both above the global average of 54. The Philippines receives a score of 0 for parasiticides (PARA), and Indonesia a below-average score of 45. The extremely poor performance by the Philippines for PARA suggests that the use of parasiticides in milkfish farming is not strictly regulated. Further, those parasiticides used have a high level of persistence and toxicity. The higher ANTI scores suggest that both countries have stronger regulations pertaining to antibiotic use than to parasiticide use. The difference in BOD scores between Indonesia (67) and the Philippines (37) is due to a greater clustering of milkfish farms in the Philippines.
biologicalMilkfish’s escapes (ESC) score (46) is slightly above the global average (40), whereas its pathogens (PATH) score (39) is below the global average (52). The low PATH score in both countries is a result of both higher on-farm mortalities due to pathogens and a greater number of susceptible wild species in the area.
Milkfish
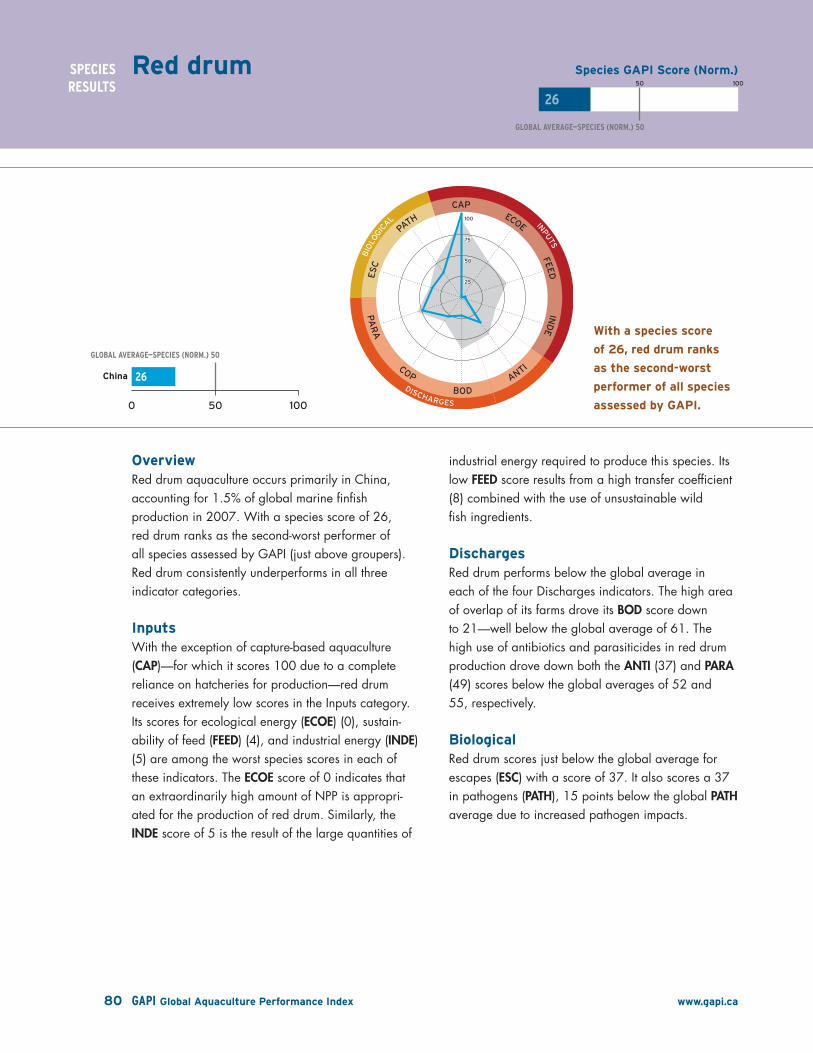
INPUTS
DISCHARGES
BIO
LOGI
CA
L
BODANTI
INDE
FEED
ECOE
CAP
PATH
ESC
PA
RA
COP
50 100
species GAPI score (norm.)
GLOBAL�AverAGe—sPecIes�(nOrm�)�50
With a species score
of 26, red drum ranks
as the second-worst
performer of all species
assessed by GAPI.
0 50 100
Global Average
Country Score
26
China
25
50
75
100
25
50
75
100
China
0 50 100
26
GLOBAL AVERAGE—SPECIES (NORM.) 50
80 GAPI Global Aquaculture Performance Index www.gapi.ca
sPecIes�resULts
overviewRed drum aquaculture occurs primarily in China, accounting for 1.5% of global marine finfish production in 2007. With a species score of 26, red drum ranks as the second-worst performer of all species assessed by GAPI (just above groupers). Red drum consistently underperforms in all three indicator categories.
InputsWith the exception of capture-based aquaculture (CAP)—for which it scores 100 due to a complete reliance on hatcheries for production—red drum receives extremely low scores in the Inputs category. Its scores for ecological energy (ECOE) (0), sustain-ability of feed (FEED) (4), and industrial energy (INDE) (5) are among the worst species scores in each of these indicators. The ECOE score of 0 indicates that an extraordinarily high amount of NPP is appropri-ated for the production of red drum. Similarly, the INDE score of 5 is the result of the large quantities of
industrial energy required to produce this species. Its low FEED score results from a high transfer coefficient (8) combined with the use of unsustainable wild fish ingredients.
dischargesRed drum performs below the global average in each of the four Discharges indicators. The high area of overlap of its farms drove its BOD score down to 21—well below the global average of 61. The high use of antibiotics and parasiticides in red drum production drove down both the ANTI (37) and PARA (49) scores below the global averages of 52 and 55, respectively.
biologicalRed drum scores just below the global average for escapes (ESC) with a score of 37. It also scores a 37 in pathogens (PATH), 15 points below the global PATH average due to increased pathogen impacts.
red drum
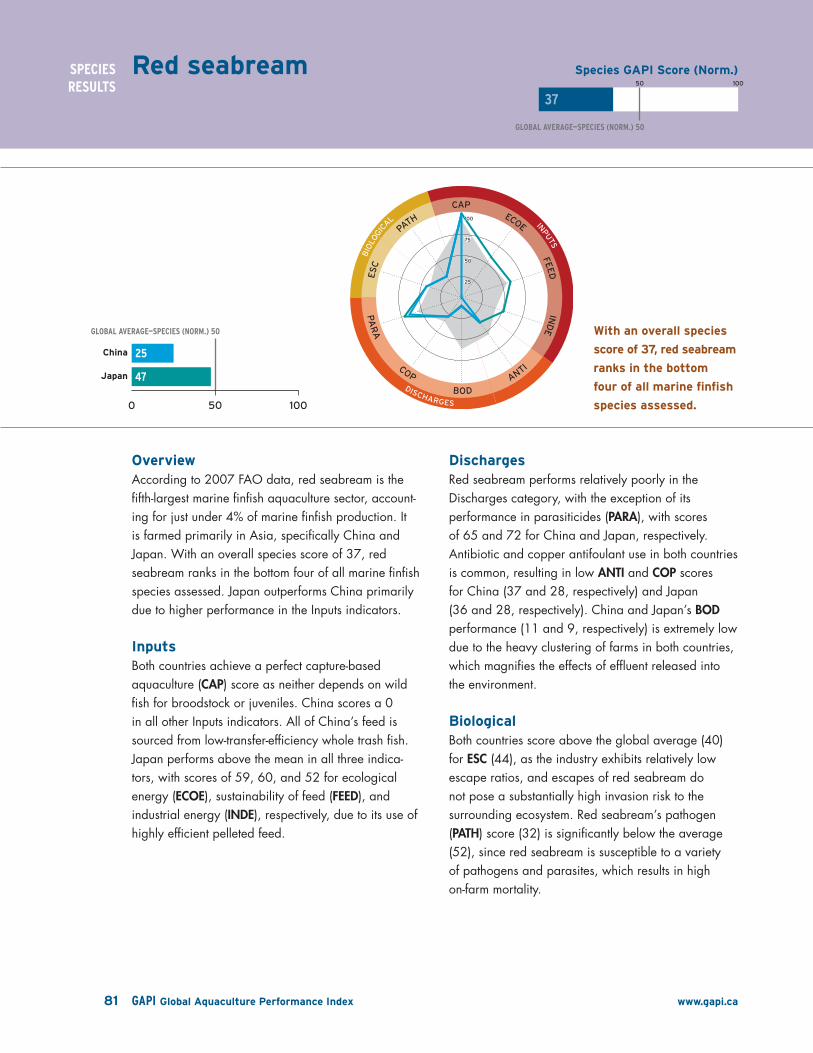
INPUTS
DISCHARGES
BIO
LOGI
CA
L
BODANTI
INDE
FEED
ECOE
CAP
PATH
ESC
PA
RA
COP
50 100
GLOBAL�AverAGe—sPecIes�(nOrm�)�50
species GAPI score (norm.)
With an overall species
score of 37, red seabream
ranks in the bottom
four of all marine finfish
species assessed.
0 50 100
Global Average
Country Score
37
Japan
China
25
50
75
100
25
50
75
100
Japan
China
0 50 100
47
25
GLOBAL AVERAGE—SPECIES (NORM.) 50
81 GAPI Global Aquaculture Performance Index www.gapi.ca
sPecIes�resULts
overviewAccording to 2007 FAO data, red seabream is the fifth-largest marine finfish aquaculture sector, account-ing for just under 4% of marine finfish production. It is farmed primarily in Asia, specifically China and Japan. With an overall species score of 37, red seabream ranks in the bottom four of all marine finfish species assessed. Japan outperforms China primarily due to higher performance in the Inputs indicators.
InputsBoth countries achieve a perfect capture-based aquaculture (CAP) score as neither depends on wild fish for broodstock or juveniles. China scores a 0 in all other Inputs indicators. All of China’s feed is sourced from low-transfer-efficiency whole trash fish. Japan performs above the mean in all three indica-tors, with scores of 59, 60, and 52 for ecological energy (ECOE), sustainability of feed (FEED), and industrial energy (INDE), respectively, due to its use of highly efficient pelleted feed.
dischargesRed seabream performs relatively poorly in the Discharges category, with the exception of its performance in parasiticides (PARA), with scores of 65 and 72 for China and Japan, respectively. Antibiotic and copper antifoulant use in both countries is common, resulting in low ANTI and COP scores for China (37 and 28, respectively) and Japan (36 and 28, respectively). China and Japan’s BOD performance (11 and 9, respectively) is extremely low due to the heavy clustering of farms in both countries, which magnifies the effects of effluent released into the environment.
biologicalBoth countries score above the global average (40) for ESC (44), as the industry exhibits relatively low escape ratios, and escapes of red seabream do not pose a substantially high invasion risk to the surrounding ecosystem. Red seabream’s pathogen (PATH) score (32) is significantly below the average (52), since red seabream is susceptible to a variety of pathogens and parasites, which results in high on-farm mortality.
red seabream
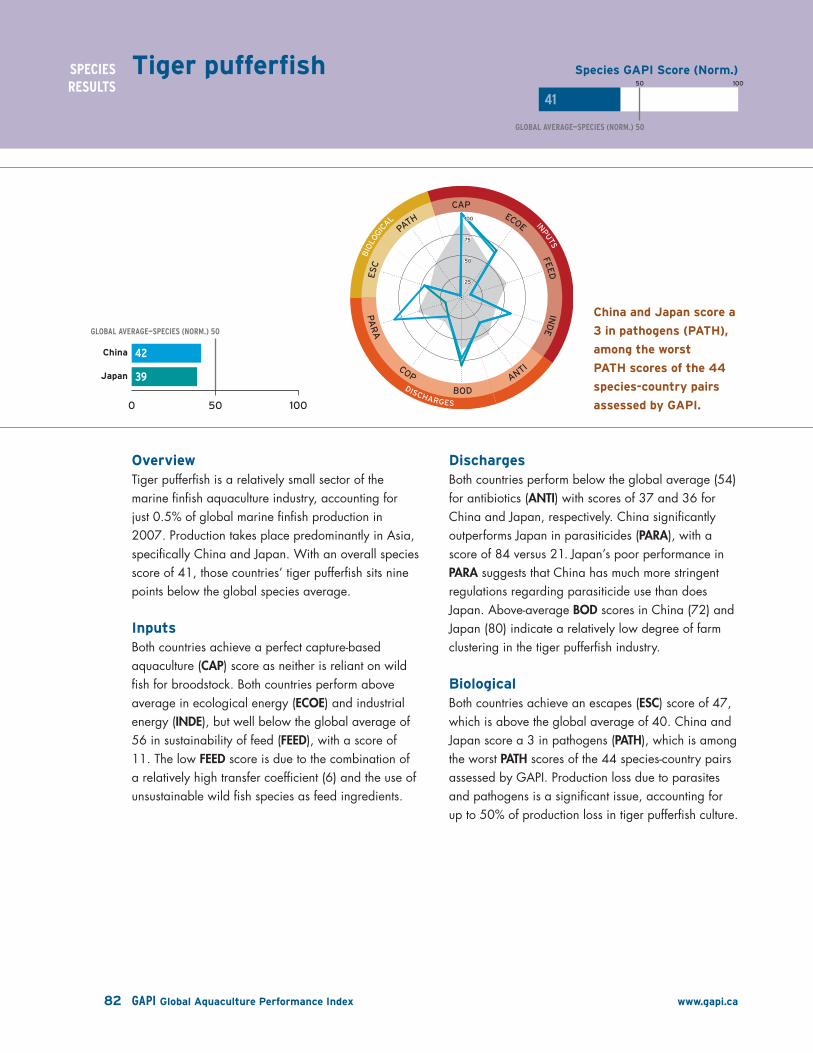
INPUTS
DISCHARGES
BIO
LOGI
CA
L
BODANTI
INDE
FEED
ECOE
CAP
PATH
ESC
PA
RA
COP
50 100
species GAPI score (norm.)
GLOBAL�AverAGe—sPecIes�(nOrm�)�50
China and Japan score a
3 in pathogens (PAth),
among the worst
PAth scores of the 44
species-country pairs
assessed by GAPI.
0 50 100
Global Average
Country Score
41
Japan
China
25
50
75
100
25
50
75
100
Japan
China
0 50 100
39
42
GLOBAL AVERAGE—SPECIES (NORM.) 50
82 GAPI Global Aquaculture Performance Index www.gapi.ca
sPecIes�resULts
overviewTiger pufferfish is a relatively small sector of the marine finfish aquaculture industry, accounting for just 0.5% of global marine finfish production in 2007. Production takes place predominantly in Asia, specifically China and Japan. With an overall species score of 41, those countries’ tiger pufferfish sits nine points below the global species average.
InputsBoth countries achieve a perfect capture-based aquaculture (CAP) score as neither is reliant on wild fish for broodstock. Both countries perform above average in ecological energy (ECOE) and industrial energy (INDE), but well below the global average of 56 in sustainability of feed (FEED), with a score of 11. The low FEED score is due to the combination of a relatively high transfer coefficient (6) and the use of unsustainable wild fish species as feed ingredients.
dischargesBoth countries perform below the global average (54) for antibiotics (ANTI) with scores of 37 and 36 for China and Japan, respectively. China significantly outperforms Japan in parasiticides (PARA), with a score of 84 versus 21. Japan’s poor performance in PARA suggests that China has much more stringent regulations regarding parasiticide use than does Japan. Above-average BOD scores in China (72) and Japan (80) indicate a relatively low degree of farm clustering in the tiger pufferfish industry.
biologicalBoth countries achieve an escapes (ESC) score of 47, which is above the global average of 40. China and Japan score a 3 in pathogens (PATH), which is among the worst PATH scores of the 44 species-country pairs assessed by GAPI. Production loss due to parasites and pathogens is a significant issue, accounting for up to 50% of production loss in tiger pufferfish culture.
tiger pufferfish

INPUTS
DISCHARGES
BIO
LOGI
CA
L
BODANTI
INDE
FEED
ECOE
CAP
PATH
ESC
PA
RA
COP
50 100
GLOBAL�AverAGe—sPecIes�(nOrm�)�50
species GAPI score (norm.)
With an overall
species score of 63,
turbot ranks fifth out
of the 20 species
assessed by GAPI.
0 50 100
Global Average
Country Score
63
Spain
France
25
50
75
100
25
50
75
100
Spain
France
0 50 100
63
68
GLOBAL AVERAGE—SPECIES (NORM.) 50
83 GAPI Global Aquaculture Performance Index www.gapi.ca
sPecIes�resULts
overviewOf the 20 species assessed by GAPI, turbot is the smallest sector, accounting for just 0.2% of global marine finfish aquaculture production in 2007. Production occurs primarily in Europe, specifically France and Spain. With an overall species score of 63, turbot ranks fifth out of the 20 species assessed by GAPI. While France and Spain perform similarly across indicators, significant differences in performance are apparent in antibiotic use (ANTI) and BOD.
InputsWith established turbot hatchery programs, both France and Spain achieve a perfect score in the capture-based aquaculture (CAP) indicator. Both countries also perform above average in ecological energy (ECOE) (68), FEED (81 and 83, respectively), and industrial energy (INDE) (44). The FEED scores are well above average (56) due to the low transfer coefficients (2.5) of turbot from France and Spain. The INDE score is close to the global average (42) due to approximately 50% of production in both countries occurring in land-based systems with higher energy requirements.
dischargesSpain (23) underperforms France (52) by 29 points in the antibiotics (ANTI) indicator. This discrepancy is due to Spain’s use of 21 times more antibiotics (by volume) than France. Both countries perform above average (55) in parasiticides (PARA), with scores of 65 and 67, respectively. The relative PARA scores suggest stronger parasiticides regulations within turbot farming than in other marine finfish sectors. High scores in BOD (100 for Spain and 82 for France) indicate a lesser degree of farm clustering in turbot production, in addition to the use of closed-contain-ment facilities. France’s perfect score in BOD is a result of no overlap among turbot aquaculture farms.
biologicalBoth producing countries receive a 73 in pathogens (PATH) and 61 in escapes (ESC)—above-average performance in each indicator. Turbot farming benefits from a relatively low disease incidence and the use of land-based production (50% of production), which greatly reduces the escapes risk.
turbot

84 GAPI Global Aquaculture Performance Index www.gapi.ca

85 GAPI Global Aquaculture Performance Index www.gapi.ca
cOUntry�resULts
How�to�Interpret�Country�Results�� � � � � � � � � � � � � � � � � � � � � � � � � � � � � � 86
Australia�� � � � � � � � � � � � � � � � � � � � � � � � � � � � � � � � � � � � � � � � � � � � � � � � � � � � � � � � � � � � � � � � � � � � � � � � � � � � � � 88
Canada�� � � � � � � � � � � � � � � � � � � � � � � � � � � � � � � � � � � � � � � � � � � � � � � � � � � � � � � � � � � � � � � � � � � � � � � � � � � � � � � � � � 89
Chile�� � � � � � � � � � � � � � � � � � � � � � � � � � � � � � � � � � � � � � � � � � � � � � � � � � � � � � � � � � � � � � � � � � � � � � � � � � � � � � � � � � � � � � 90
China�� � � � � � � � � � � � � � � � � � � � � � � � � � � � � � � � � � � � � � � � � � � � � � � � � � � � � � � � � � � � � � � � � � � � � � � � � � � � � � � � � � � � � � 91
Egypt�� � � � � � � � � � � � � � � � � � � � � � � � � � � � � � � � � � � � � � � � � � � � � � � � � � � � � � � � � � � � � � � � � � � � � � � � � � � � � � � � � � � � � 92
France�� � � � � � � � � � � � � � � � � � � � � � � � � � � � � � � � � � � � � � � � � � � � � � � � � � � � � � � � � � � � � � � � � � � � � � � � � � � � � � � � � � � 93
Greece�� � � � � � � � � � � � � � � � � � � � � � � � � � � � � � � � � � � � � � � � � � � � � � � � � � � � � � � � � � � � � � � � � � � � � � � � � � � � � � � � � � 94
Iceland�� � � � � � � � � � � � � � � � � � � � � � � � � � � � � � � � � � � � � � � � � � � � � � � � � � � � � � � � � � � � � � � � � � � � � � � � � � � � � � � � � � 95
Indonesia�� � � � � � � � � � � � � � � � � � � � � � � � � � � � � � � � � � � � � � � � � � � � � � � � � � � � � � � � � � � � � � � � � � � � � � � � � � � � � 96
Israel�� � � � � � � � � � � � � � � � � � � � � � � � � � � � � � � � � � � � � � � � � � � � � � � � � � � � � � � � � � � � � � � � � � � � � � � � � � � � � � � � � � � � � 97
Italy�� � � � � � � � � � � � � � � � � � � � � � � � � � � � � � � � � � � � � � � � � � � � � � � � � � � � � � � � � � � � � � � � � � � � � � � � � � � � � � � � � � � � � � � � 98
Japan�� � � � � � � � � � � � � � � � � � � � � � � � � � � � � � � � � � � � � � � � � � � � � � � � � � � � � � � � � � � � � � � � � � � � � � � � � � � � � � � � � � � � 99
Korea,�Republic�of�� � � � � � � � � � � � � � � � � � � � � � � � � � � � � � � � � � � � � � � � � � � � � � � � � � � � � � � � � � 100
Malaysia�� � � � � � � � � � � � � � � � � � � � � � � � � � � � � � � � � � � � � � � � � � � � � � � � � � � � � � � � � � � � � � � � � � � � � � � � � � � � � � � 101
New�Zealand�� � � � � � � � � � � � � � � � � � � � � � � � � � � � � � � � � � � � � � � � � � � � � � � � � � � � � � � � � � � � � � � � � � � � � � 102
Norway��� � � � � � � � � � � � � � � � � � � � � � � � � � � � � � � � � � � � � � � � � � � � � � � � � � � � � � � � � � � � � � � � � � � � � � � � � � � � � � � 103
Philippines�� � � � � � � � � � � � � � � � � � � � � � � � � � � � � � � � � � � � � � � � � � � � � � � � � � � � � � � � � � � � � � � � � � � � � � � � � 104
Spain�� � � � � � � � � � � � � � � � � � � � � � � � � � � � � � � � � � � � � � � � � � � � � � � � � � � � � � � � � � � � � � � � � � � � � � � � � � � � � � � � � � � �105
Taiwan,�Republic�of�China�� � � � � � � � � � � � � � � � � � � � � � � � � � � � � � � � � � � � � � � � � � � � �106
Thailand�� � � � � � � � � � � � � � � � � � � � � � � � � � � � � � � � � � � � � � � � � � � � � � � � � � � � � � � � � � � � � � � � � � � � � � � � � � � � � � 107
Turkey�� � � � � � � � � � � � � � � � � � � � � � � � � � � � � � � � � � � � � � � � � � � � � � � � � � � � � � � � � � � � � � � � � � � � � � � � � � � � � � � � � 108
United�Kingdom��� � � � � � � � � � � � � � � � � � � � � � � � � � � � � � � � � � � � � � � � � � � � � � � � � � � � � � � � � � � � � �109

86 GAPI Global Aquaculture Performance Index www.gapi.ca
hoW to reAd Country PAGes
GAPI evaluates the environmental performance of the top 20 farmed marine finfish in production. For each species, GAPI scores environmental performance across those major producing countries that make up at least 90% of production of that species. For the 20 species assessed, GAPI assesses 22 major producing countries. GAPI scores are first calculated for each species-country pair. To offer users insight into how entire countries (and species) perform, we also calculate an overall “Species GAPI Score” for each of the 20 species and a “Country GAPI Score” for each of the 22 counties assessed. The example provided on the next page explains how to interpret the results summarized in each of the country pages.
It is important to keep in mind that this report reflects normalised GAPI scores only. Normalisation allows us to assess performance per mT of production so that performers of varying scales of production can be compared. The GAPI website (www.gapi.ca) provides both absolute and normalised scores, as does the Summary of Results section. For more information on normalised versus absolute scoring, see the Methods section.
The following countries were selected for GAPI assessment, as they were the top producers of at least one species under assessment.
how to Interpret Country resultscOUntry�resULts
Australia�� � � � � � � � � � � � � � � � � � � � � � � � � � � � � � � � � � � � � � � � � � � � � � � � � � � � � � � � � � � � � � � � � � � � � � � � � � � � � � 88
Canada�� � � � � � � � � � � � � � � � � � � � � � � � � � � � � � � � � � � � � � � � � � � � � � � � � � � � � � � � � � � � � � � � � � � � � � � � � � � � � � � � � � 89
Chile�� � � � � � � � � � � � � � � � � � � � � � � � � � � � � � � � � � � � � � � � � � � � � � � � � � � � � � � � � � � � � � � � � � � � � � � � � � � � � � � � � � � � � � 90
China�� � � � � � � � � � � � � � � � � � � � � � � � � � � � � � � � � � � � � � � � � � � � � � � � � � � � � � � � � � � � � � � � � � � � � � � � � � � � � � � � � � � � � � 91
Egypt�� � � � � � � � � � � � � � � � � � � � � � � � � � � � � � � � � � � � � � � � � � � � � � � � � � � � � � � � � � � � � � � � � � � � � � � � � � � � � � � � � � � � � 92
France�� � � � � � � � � � � � � � � � � � � � � � � � � � � � � � � � � � � � � � � � � � � � � � � � � � � � � � � � � � � � � � � � � � � � � � � � � � � � � � � � � � � 93
Greece�� � � � � � � � � � � � � � � � � � � � � � � � � � � � � � � � � � � � � � � � � � � � � � � � � � � � � � � � � � � � � � � � � � � � � � � � � � � � � � � � � � 94
Iceland�� � � � � � � � � � � � � � � � � � � � � � � � � � � � � � � � � � � � � � � � � � � � � � � � � � � � � � � � � � � � � � � � � � � � � � � � � � � � � � � � � � 95
Indonesia�� � � � � � � � � � � � � � � � � � � � � � � � � � � � � � � � � � � � � � � � � � � � � � � � � � � � � � � � � � � � � � � � � � � � � � � � � � � � � 96
Israel�� � � � � � � � � � � � � � � � � � � � � � � � � � � � � � � � � � � � � � � � � � � � � � � � � � � � � � � � � � � � � � � � � � � � � � � � � � � � � � � � � � � � � 97
Italy�� � � � � � � � � � � � � � � � � � � � � � � � � � � � � � � � � � � � � � � � � � � � � � � � � � � � � � � � � � � � � � � � � � � � � � � � � � � � � � � � � � � � � � � � 98
Japan�� � � � � � � � � � � � � � � � � � � � � � � � � � � � � � � � � � � � � � � � � � � � � � � � � � � � � � � � � � � � � � � � � � � � � � � � � � � � � � � � � � � � 99
Korea,�Republic�of�� � � � � � � � � � � � � � � � � � � � � � � � � � � � � � � � � � � � � � � � � � � � � � � � � � � � � � � � � � 100
Malaysia�� � � � � � � � � � � � � � � � � � � � � � � � � � � � � � � � � � � � � � � � � � � � � � � � � � � � � � � � � � � � � � � � � � � � � � � � � � � � � � � 101
New�Zealand�� � � � � � � � � � � � � � � � � � � � � � � � � � � � � � � � � � � � � � � � � � � � � � � � � � � � � � � � � � � � � � � � � � � � � � 102
Norway��� � � � � � � � � � � � � � � � � � � � � � � � � � � � � � � � � � � � � � � � � � � � � � � � � � � � � � � � � � � � � � � � � � � � � � � � � � � � � � � 103
Philippines�� � � � � � � � � � � � � � � � � � � � � � � � � � � � � � � � � � � � � � � � � � � � � � � � � � � � � � � � � � � � � � � � � � � � � � � � � 104
Spain�� � � � � � � � � � � � � � � � � � � � � � � � � � � � � � � � � � � � � � � � � � � � � � � � � � � � � � � � � � � � � � � � � � � � � � � � � � � � � � � � � � � �105
Taiwan,�Republic�of�China�� � � � � � � � � � � � � � � � � � � � � � � � � � � � � � � � � � � � � � � � � � � � �106
Thailand�� � � � � � � � � � � � � � � � � � � � � � � � � � � � � � � � � � � � � � � � � � � � � � � � � � � � � � � � � � � � � � � � � � � � � � � � � � � � � � 107
Turkey�� � � � � � � � � � � � � � � � � � � � � � � � � � � � � � � � � � � � � � � � � � � � � � � � � � � � � � � � � � � � � � � � � � � � � � � � � � � � � � � � � 108
United�Kingdom��� � � � � � � � � � � � � � � � � � � � � � � � � � � � � � � � � � � � � � � � � � � � � � � � � � � � � � � � � � � � � �109

INPUTS
DISCHARGES
BIO
LOGI
CA
L
BODANTI
INDE
FEED
ECOE
CAP
PATH
ESC
PA
RA
COP
Country GAPI Score (Norm.)
Global averaGe—CountrY (norm.) 59
50 100% Country’s Marine FinFish ProduCtion
assessed
China’s score is sig-
nificantly undermined
by groupers (species-
country score of 15).
61
0 50 100
Global Average
Country Score
32
Tiger puffer
Red Seabream
Red Drum
Large Yellow Croaker
Japanese Seabass
Groupers
Cobia
Bastard halibut
25
50
75
100
25
50
75
100
GLOBAL AVERAGE—COUNTRY (NORM.) 59
Tiger pufferfish
Red seabream
Red drum
Large yellow croaker
Japanese seabass
Groupers
Cobia
Bastard halibut
0 50 100
42
25
26
41
32
15
37
41
91 GaPI Global Aquaculture Performance Index www.gapi.ca
CountrY reSultS
OverviewChina ranks as a major producing country for eight of the top 20 marine finfish species in production—the most of any country assessed by GAPI. These include: bastard halibut, cobia, groupers, Japanese seabass, large yellow croaker, red drum, red seabream, and tiger pufferfish. Together, GAPI assesses the performance of over 400,000 mT of marine finfish production in China.
China’s country score (32) is the second-worst of all countries (just above Taiwan’s 30)—far below the global average country score (59). China’s score is significantly undermined by groupers (species-country score of 15). Even more striking is that China’s high-est performance score—for tiger pufferfish culture—is only 42. While all assessed Chinese production performs below average, specific performance within each indicator varies widely.
InputsChina’s grouper culture depends entirely on wild capture of production stock, resulting in a failing score (0) for capture-based aquaculture (CAP) for this industry (Indonesia’s grouper industry faces the same challenge). Japanese seabass culture is also partially dependent on wild capture, scoring 54 for CAP. Industrial energy (INDE) scores are volatile, ranging
from 0 (groupers and red seabream) to 61 (bastard halibut), reflecting highly variable efficiencies in pro-duction systems. Sustainability of feed (FEED) scores also reflects a large range due to varied sources of marine ingredients with differing sustainability scores.
DischargesWhile there is marked volatility in Discharges category scores, all sectors score below average for antifoulant use (COP). China’s best-performing sectors, large yellow croaker and tiger pufferfish, are bolstered by their above-average parasiticides (PARA) scores of 89 and 84, respectively. These two species use relatively small quantities of parasiticides per mT of production. The high density of Japanese seabass and red seabream culture in China resulted in low BOD scores of 4 and 9, respectively.
BiologicalChina’s bastard halibut receives a pathogens (PATH) score of 0 due to its susceptibility to a large number of high-risk pathogens. However, groupers and tiger pufferfish do not fare much better, each with a PATH score of 3. The highest score in the Biological category (59) is for cobia’s PATH performance.
China
87 GAPI Global Aquaculture Performance Index www.gapi.ca
radar GraphThis maps the performance of each species-country pair (i.e., Atlantic salmon–Norway) within the 10 indicator categories. Line colours in the radar graph match with colours in the bar graphs.
The centre point equates to a GAPI score of 0. The outermost ring represents a perfect GAPI score of 100. The area inside each line is the GAPI score for that species-country pair. The larger the area, the higher the score.
For example, the GAPI scores for tiger pufferfish (42) and large yellow croaker (41) from China are very similar. While the two Chinese species have similar scores, their per-formance within some of the indicator categories—such as the sustainability of feed and biochemical oxygen demand—differs substantially.
Country GAPI score (norm.)The blue bar indicates the normalised GAPI score (32) for the country. To derive this species score, the GAPI score for each species-country pair (listed on left-side bar graph) is weighted by the relative amount of production of that species and then averaged across the country, to get a weighted-average GAPI score for the country. It is important to keep in mind that this score only reflects the performance of those species listed in the bar graph (left).
Percentage of Production AssessedThe proportion of the country’s total marine finfish production assessed by GAPI. In some cases, the percentage of production assessed within this report comprises only a small percentage of total finfish production in a given country. Nonetheless, for complete-ness, this report includes all countries that were major producers of the species assessed by GAPI.
species-Country Pair scoresThese are the normalised GAPI scores for each of the top 20 species assessed by GAPI that are produced in this country. In this example, China produces 8 of the 20 species assessed by GAPI.
Colours in the bar graph match with the line colours in the radar graph.
Global Average—Countries (norm.)This is the average normalised GAPI score for all countries assessed by GAPI. This allows a comparison of how well the country is performing relative to the average country.
The grey-shaded area depicts average global performance (norm.) of all species-country pairs.
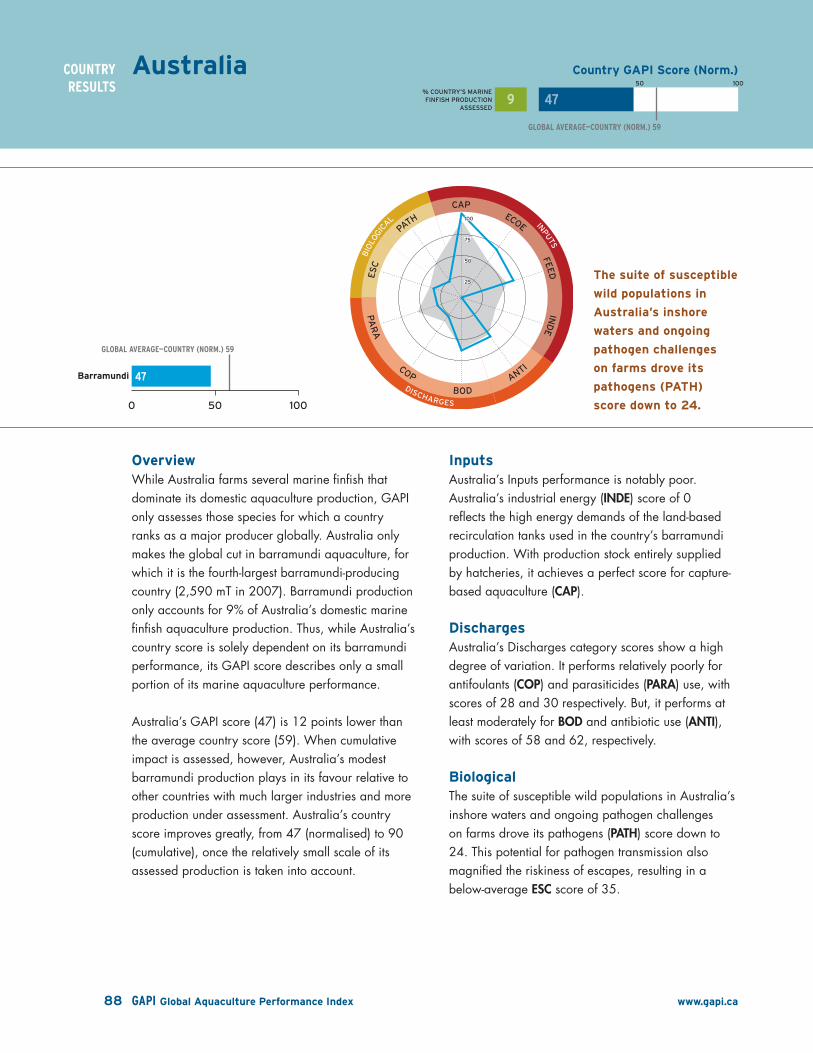
INPUTS
DISCHARGES
BIO
LOGI
CA
L
BODANTI
INDE
FEED
ECOE
CAP
PATH
ESC
PA
RA
COP
Country GAPI score (norm.)
GLOBAL�AverAGe—cOUntry�(nOrm�)�59
50 100%�COUNTRy’S�MARINE�FINFISH�PRODUCTION�
ASSESSED
the suite of susceptible
wild populations in
Australia’s inshore
waters and ongoing
pathogen challenges
on farms drove its
pathogens (PAth)
score down to 24.
9
0 50 100
Global Average
Country Score
47
0 50 100
Global
0 50 100
Species
Barramundi
0 50 100
47
X
X
X
X
X
X
GLOBAL AVERAGE—COUNTRY (NORM.) 59
Barramundi
25
50
75
100
25
50
75
100
88 GAPI Global Aquaculture Performance Index www.gapi.ca
cOUntry�resULts
overviewWhile Australia farms several marine finfish that dominate its domestic aquaculture production, GAPI only assesses those species for which a country ranks as a major producer globally. Australia only makes the global cut in barramundi aquaculture, for which it is the fourth-largest barramundi-producing country (2,590 mT in 2007). Barramundi production only accounts for 9% of Australia’s domestic marine finfish aquaculture production. Thus, while Australia’s country score is solely dependent on its barramundi performance, its GAPI score describes only a small portion of its marine aquaculture performance.
Australia’s GAPI score (47) is 12 points lower than the average country score (59). When cumulative impact is assessed, however, Australia’s modest barramundi production plays in its favour relative to other countries with much larger industries and more production under assessment. Australia’s country score improves greatly, from 47 (normalised) to 90 (cumulative), once the relatively small scale of its assessed production is taken into account.
InputsAustralia’s Inputs performance is notably poor. Australia’s industrial energy (INDE) score of 0 reflects the high energy demands of the land-based recirculation tanks used in the country’s barramundi production. With production stock entirely supplied by hatcheries, it achieves a perfect score for capture-based aquaculture (CAP).
dischargesAustralia’s Discharges category scores show a high degree of variation. It performs relatively poorly for antifoulants (COP) and parasiticides (PARA) use, with scores of 28 and 30 respectively. But, it performs at least moderately for BOD and antibiotic use (ANTI), with scores of 58 and 62, respectively.
biologicalThe suite of susceptible wild populations in Australia’s inshore waters and ongoing pathogen challenges on farms drove its pathogens (PATH) score down to 24. This potential for pathogen transmission also magnified the riskiness of escapes, resulting in a below-average ESC score of 35.
Australia

INPUTS
DISCHARGES
BIO
LOGI
CA
L
BODANTI
INDE
FEED
ECOE
CAP
PATH
ESC
PA
RA
COP
Country GAPI score (norm.)
GLOBAL�AverAGe—cOUntry�(nOrm�)�59
50 100%�COUNTRy’S�MARINE�FINFISH�PRODUCTION�
ASSESSED
Canada’s score drops
to 64 when accounting
for scale of production
(i.e., cumulative score),
reflecting the relatively
large size of its Atlantic
salmon industry.
100
0 50 100
Global Average
Country Score
70
Atlantic salmon
0 50 100
70
GLOBAL AVERAGE—COUNTRY (NORM.) 59
Atlantic Salmon
25
50
75
100
25
50
75
100
89 GAPI Global Aquaculture Performance Index www.gapi.ca
cOUntry�resULts
overviewAccording to FAO production data, Canada’s marine finfish production was dominated by Atlantic salmon production in 2007, making it the fourth-largest producer of Atlantic salmon globally. Canada’s GAPI score is a weighted average of east and west coast Atlantic salmon production (40% and 60% of total production, respectively). Canada’s normalised performance score (70) is well above the average country score (59). Canada’s score drops to 64 when accounting for scale of production (i.e., cumulative score), reflecting the relatively large size of its Atlantic salmon industry.
InputsCanada’s performance within the Inputs indicators ranges from 57 to 100. It achieves a perfect score for capture-based aquaculture (CAP) since Atlantic salmon aquaculture in Canada does not utilize wild-captured broodstock. Its lowest Inputs score is within industrial energy (INDE) (57), reflecting its heavy reliance on fish meal and fish oil as feed ingredients.
dischargesCanada’s Discharges scores range from 28 to 99. While its lowest score is for its use of antifoulants (COP), it scores only marginally worse than the global average COP score (35). Despite contentious debate
regarding potential ecological impacts of chemicals used for disease and parasite treatment, Canada’s parasiticides (PARA) score (99) is higher than all but one other marine finfish performer assessed by GAPI (global average PARA score is 55). It is not clear whether this performance is a reflection of actual performance, a function of discrepancies in data quality and/or reporting, or a combination of various factors.
biologicalOf the two Biological indicators, Canada performs worse in escapes (ESC) (39). This largely reflects a high potential per capita risk of Atlantic salmon escapees on both coasts. However, Canada’s reported Atlantic salmon escapes figures were so far outside the range of values reported by other Atlantic salmon producers that its figures were considered outliers. In order to correct for this, GAPI assumes that Canada’s escapes are in line with the global average for reported escapes. Canada scores a 72 for pathogens (PATH), a moderate score reflecting the susceptibility of the finfish communities on both coasts.
Canada

INPUTS
DISCHARGES
BIO
LOGI
CA
L
BODANTI
INDE
FEED
ECOE
CAP
PATH
ESC
PA
RA
COP
Country GAPI score (norm.)
GLOBAL�AverAGe—cOUntry�(nOrm�)�59
50 100%�COUNTRy’S�MARINE�FINFISH�PRODUCTION�
ASSESSED
Chile performs similarly
across the three salmon
species with scores in
the mid- to high 60s for
all salmon.
73
0 50 100
Global Average
Country Score
65
Coho Salmon
Chinook salmon
Atlantic Salmon25
50
75
100
25
50
75
100
Coho salmon
Chinook salmon
Atlantic salmon
0 50 100
63
64
66
GLOBAL AVERAGE—COUNTRY (NORM.) 59
90 GAPI Global Aquaculture Performance Index www.gapi.ca
cOUntry�resULts
overviewWhile GAPI only assesses salmon production in Chile, three salmon species—Atlantic, Chinook, and coho—comprised 73% of Chilean marine finfish production in 2007. Chile’s country score (65) exceeds the global average country score (59), placing it within the top half of country scores. Chile performs similarly across the three salmon species, with scores in the mid- to high 60s for all salmon.
When taking total production into account, Chile’s cumulative score drops to 30—the second-worst cumu-lative performance score of all assessed countries. The cumulative score reflects the tremendous industrial and ecological energetic footprint of the Chilean salmon farming industry in addition to the numerous scale-related waste and biological impacts.
InputsChile achieves a perfect capture-based aquaculture (CAP) score (100) for all species, sustainability of feed (FEED) scores of 75, ecological energy (ECOE) scores in the low to mid-70s, and industrial energy scores ranging from 55 (Chinook) to 62 (Atlantic). The relatively small ecological (ECOE) and industrial energy (INDE) performance differences reflect the small differences in the degree of dependence on fish meal and fish oil as well as differing feed conversion efficiencies for each species.
dischargesChile’s worst score is in antifoulant use (COP), with a below-average 28 for all species. The greater stress typically experienced by farmed Chinook and coho relative to Atlantic salmon is reflected in the parasiti-cides (PARA) scores—64, 64, and 77, respectively. The greater dispersal of farms results in a Chinook BOD score of 98, compared to coho (90), and the more-clustered production of Atlantic salmon (81). Yet, while farms in Chile may be considered “dense” in the context of other salmon producers, there is little comparison to the hyper-density of marine finfish farms observed in other sectors, especially within Asian countries.
biologicalChile’s three salmon species perform poorly in escapes (ESC), with below-average scores of 37 (coho), 38 (Atlantic), and 42 (Chinook). Given some questions regarding the accuracy of reporting of escapes within Chile, it is assumed that these scores are conservative. All species score at or above average for pathogens (PATH), with Atlantic salmon scoring the highest PATH score (67) due to lower stress levels than the other Chilean species. It is important to note that GAPI assesses performance using 2007 pathogens data, before the outbreak of infectious salmon anemia (ISA) in Chilean salmon farms.
Chile

INPUTS
DISCHARGES
BIO
LOGI
CA
L
BODANTI
INDE
FEED
ECOE
CAP
PATH
ESC
PA
RA
COP
Country GAPI score (norm.)
GLOBAL�AverAGe—cOUntry�(nOrm�)�59
50 100%�COUNTRy’S�MARINE�FINFISH�PRODUCTION�
ASSESSED
China’s score is sig-
nificantly undermined
by groupers (species-
country score of 15).
61
0 50 100
Global Average
Country Score
32
Tiger puffer
Red Seabream
Red Drum
Large Yellow Croaker
Japanese Seabass
Groupers
Cobia
Bastard halibut
25
50
75
100
25
50
75
100
GLOBAL AVERAGE—COUNTRY (NORM.) 59
Tiger pufferfish
Red seabream
Red drum
Large yellow croaker
Japanese seabass
Groupers
Cobia
Bastard halibut
0 50 100
42
25
26
41
32
15
37
41
91 GAPI Global Aquaculture Performance Index www.gapi.ca
cOUntry�resULts
overviewChina ranks as a major producing country for eight of the top 20 marine finfish species in production—the most of any country assessed by GAPI. These include: bastard halibut, cobia, groupers, Japanese seabass, large yellow croaker, red drum, red seabream, and tiger pufferfish. Together, GAPI assesses the performance of over 400,000 mT of marine finfish production in China.
China’s country score (32) is the second-worst of all countries (just above Taiwan’s 30)—far below the global average country score (59). China’s score is significantly undermined by groupers (species-country score of 15). Even more striking is that China’s high-est performance score—for tiger pufferfish culture—is only 42. While all assessed Chinese production performs below average, specific performance within each indicator varies widely.
InputsChina’s grouper culture depends entirely on wild capture of production stock, resulting in a failing score (0) for capture-based aquaculture (CAP) for this industry (Indonesia’s grouper industry faces the same challenge). Japanese seabass culture is also partially dependent on wild capture, scoring 54 for CAP. Industrial energy (INDE) scores are volatile, ranging
from 0 (groupers and red seabream) to 61 (bastard halibut), reflecting highly variable efficiencies in pro-duction systems. Sustainability of feed (FEED) scores also reflects a large range due to varied sources of marine ingredients with differing sustainability scores.
dischargesWhile there is marked volatility in Discharges category scores, all sectors score below average for antifoulant use (COP). China’s best-performing sectors, large yellow croaker and tiger pufferfish, are bolstered by their above-average parasiticides (PARA) scores of 89 and 84, respectively. These two species use relatively small quantities of parasiticides per mT of production. The high density of Japanese seabass and red seabream culture in China resulted in low BOD scores of 4 and 9, respectively.
biologicalChina’s bastard halibut receives a pathogens (PATH) score of 0 due to its susceptibility to a large number of high-risk pathogens. However, groupers and tiger pufferfish do not fare much better, each with a PATH score of 3. The highest score in the Biological category (59) is for cobia’s PATH performance.
China

INPUTS
DISCHARGES
BIO
LOGI
CA
L
BODANTI
INDE
FEED
ECOE
CAP
PATH
ESC
PA
RA
COP
Country GAPI score (norm.)
GLOBAL�AverAGe—cOUntry�(nOrm�)�59
50 100%�COUNTRy’S�MARINE�FINFISH�PRODUCTION�
ASSESSED
With a country score
of 71, egypt ranks
as the third-best
performer of the 22
assessed countries.
99
0 50 100
Global Average
Country Score
71
Flathead grey mullet
25
50
75
100
25
50
75
100
Flathead grey mullet
0 50 100
71
GLOBAL AVERAGE—COUNTRY (NORM.) 59
92 GAPI Global Aquaculture Performance Index www.gapi.ca
cOUntry�resULts
overviewEgypt ranks as a major producing country for only one of the top 20 marine finfish species in production—flathead grey mullet. However, flathead grey mullet accounted for almost all (99%) of Egypt’s total marine finfish aquaculture production in 2007. Thus, Egypt’s GAPI score is actually quite reflective of its limited but strong-performing marine finfish industry. With a country score of 71, Egypt ranks as the third-best performer of the 22 assessed countries. It achieves high scores in many of the Inputs and Discharges categories, resulting, in part, from its use of extensive pond culture systems that often incorpo-rate polyculture and use lower stocking densities.
InputsFlathead grey mullet culture relies largely on capture rather than hatchery supply, resulting in a below-average CAP score of 68. Improvements in this one indicator would likely significantly improve Egypt’s (and flathead grey mullet’s) already relatively high overall score. The relatively small production and low transfer coefficient of flathead grey mullet in Egypt result in lower consumption of fish meal and fish oil. This is reflected in its sustainability of feed (FEED) score of 99—the highest of any performer assessed.
This is offset somewhat by its industrial energy (INDE) score (57), which is affected by Egypt’s partial use of closed-pond systems and related on-farm energy requirements.
dischargesEgypt performs relatively well in all Discharges indica-tors except for antibiotic use (ANTI) (32). Its solid performance within most of these indicators reflects the ecological benefits of the integrated pond culture systems that dominate flathead grey mullet production in Egypt. The relatively high reliance on antibiotics is likely due to the dependence on wild-caught fish for production. While these pond systems are considered “closed”, effluent is still not captured or processed. This may result in harmful ecological impacts related to antibiotic residue accumulation.
biologicalEgypt’s flathead grey mullet production scores well in pathogens (PATH) (91), due to the use of extensive cul-ture systems that result in less crowding and pathogen transfer. However, pond systems are still susceptible to escapes, resulting in an ESC score of 41.
egypt
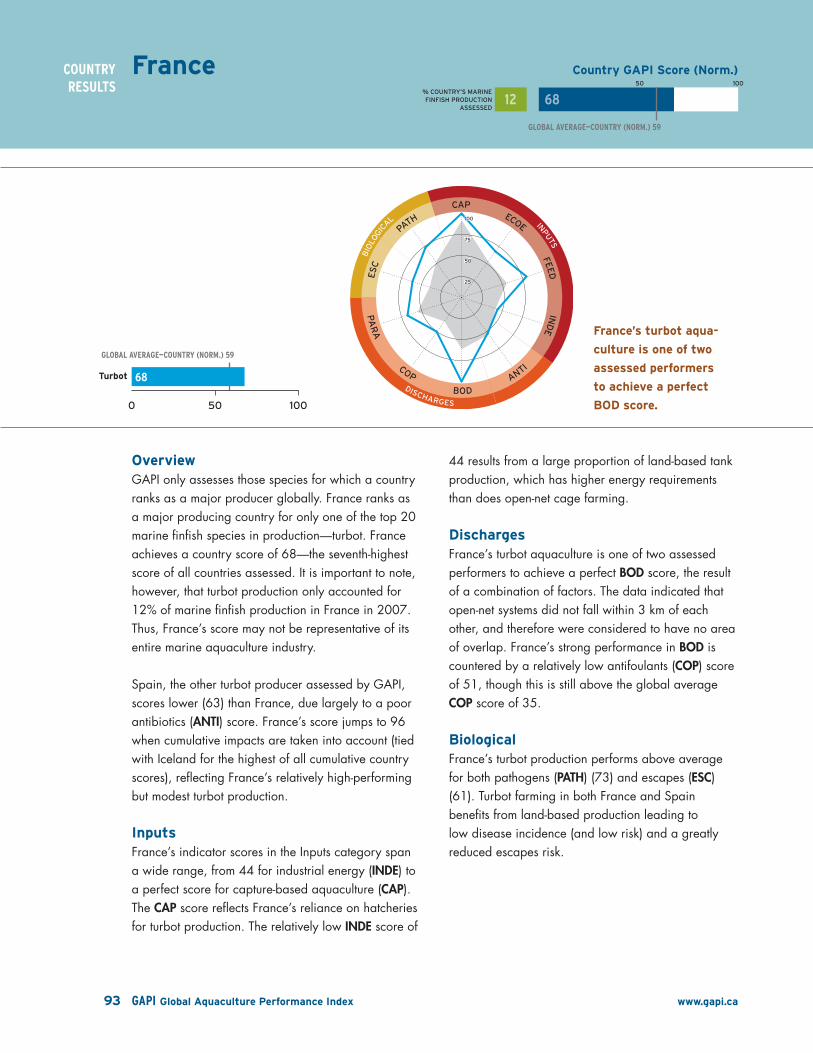
INPUTS
DISCHARGES
BIO
LOGI
CA
L
BODANTI
INDE
FEED
ECOE
CAP
PATH
ESC
PA
RA
COP
Country GAPI score (norm.)
GLOBAL�AverAGe—cOUntry�(nOrm�)�59
50 100%�COUNTRy’S�MARINE�FINFISH�PRODUCTION�
ASSESSED
France’s turbot aqua-
culture is one of two
assessed performers
to achieve a perfect
bod score.
12
0 50 100
Global Average
Country Score
68
Turbot
25
50
75
100
25
50
75
100
Turbot
0 50 100
68
GLOBAL AVERAGE—COUNTRY (NORM.) 59
93 GAPI Global Aquaculture Performance Index www.gapi.ca
cOUntry�resULts
overviewGAPI only assesses those species for which a country ranks as a major producer globally. France ranks as a major producing country for only one of the top 20 marine finfish species in production—turbot. France achieves a country score of 68—the seventh-highest score of all countries assessed. It is important to note, however, that turbot production only accounted for 12% of marine finfish production in France in 2007. Thus, France’s score may not be representative of its entire marine aquaculture industry.
Spain, the other turbot producer assessed by GAPI, scores lower (63) than France, due largely to a poor antibiotics (ANTI) score. France’s score jumps to 96 when cumulative impacts are taken into account (tied with Iceland for the highest of all cumulative country scores), reflecting France’s relatively high-performing but modest turbot production.
InputsFrance’s indicator scores in the Inputs category span a wide range, from 44 for industrial energy (INDE) to a perfect score for capture-based aquaculture (CAP). The CAP score reflects France’s reliance on hatcheries for turbot production. The relatively low INDE score of
44 results from a large proportion of land-based tank production, which has higher energy requirements than does open-net cage farming.
dischargesFrance’s turbot aquaculture is one of two assessed performers to achieve a perfect BOD score, the result of a combination of factors. The data indicated that open-net systems did not fall within 3 km of each other, and therefore were considered to have no area of overlap. France’s strong performance in BOD is countered by a relatively low antifoulants (COP) score of 51, though this is still above the global average COP score of 35.
biologicalFrance’s turbot production performs above average for both pathogens (PATH) (73) and escapes (ESC) (61). Turbot farming in both France and Spain benefits from land-based production leading to low disease incidence (and low risk) and a greatly reduced escapes risk.
France

INPUTS
DISCHARGES
BIO
LOGI
CA
L
BODANTI
INDE
FEED
ECOE
CAP
PATH
ESC
PA
RA
COP
Country GAPI score (norm.)
GLOBAL�AverAGe—cOUntry�(nOrm�)�59
50 100%�COUNTRy’S�MARINE�FINFISH�PRODUCTION�
ASSESSED
Greece’s country score
(60) is just above the
global country average
but places it within
the bottom half of all
country scores.
97
0 50 100
Global Average
Country Score
60
Gilthead Seabream
European seabass
25
50
75
100
25
50
75
100
Gilthead seabream
European seabass
0 50 100
56
66
GLOBAL AVERAGE—COUNTRY (NORM.) 59
94 GAPI Global Aquaculture Performance Index www.gapi.ca
cOUntry�resULts
overviewGreece is a major producing country for two farmed marine finfish species—European seabass and gilthead seabream. Together, these species comprised 97% of total marine finfish production in Greece in 2007. Its European seabass sector (66) outperforms its gilthead seabream sector (56) by 10 points. Greece’s country score (60) is just above the global country average but places it within the bottom half of all country scores. Both of Greece’s sectors performed reasonably well in the Inputs indicators, largely because they are both relatively low-trophic-level species compared to other assessed marine finfish.
InputsThe indicator performance scores for Inputs range from 50 for industrial energy (INDE) to 100 for capture-based aquaculture (CAP). The species’ relatively low trophic level (3.8) plays a significant role in the favourable Inputs scores.
dischargesAntibiotic use is one of the major discriminators separating Greece’s European seabass and gilthead seabream Discharges scores. Gilthead seabream’s greater reliance on antibiotics yields an ANTI of 50 versus European seabass’s score of 81.
biologicalGreece’s gilthead seabream sector apparently faces serious challenges related to escapes (ESC), with a score of 5. European seabass performs better in both indicators, with a relatively high score of 75 for pathogens (PATH), reflecting fewer production losses due to on-farm disease.
Greece

INPUTS
DISCHARGES
BIO
LOGI
CA
L
BODANTI
INDE
FEED
ECOE
CAP
PATH
ESC
PA
RA
COP
Country GAPI score (norm.)
GLOBAL�AverAGe—cOUntry�(nOrm�)�59
50 100%�COUNTRy’S�MARINE�FINFISH�PRODUCTION�
ASSESSED
Iceland’s Atlantic cod
production clearly lags
in its escapes (esC)
performance, with a
failing score of 0.
35
0 50 100
Global Average
Country Score
69
Atlantic cod
25
50
75
100
25
50
75
100
Atlantic cod
0 50 100
69
GLOBAL AVERAGE—COUNTRY (NORM.) 59
95 GAPI Global Aquaculture Performance Index www.gapi.ca
cOUntry�resULts
overviewAccording to GAPI’s country inclusion rule, Iceland ranks as a major global producer of only one marine finfish species—Atlantic cod. Because Atlantic cod production only accounted for 35% of marine finfish production in Iceland in 2007, Iceland’s country score and indicator scores may not be representative of the performance of its entire marine aquaculture industry.
Iceland’s performance in its Atlantic cod sector yields an above-average country score of 69—placing it sixth out of the 22 assessed countries. The only other assessed Atlantic cod producer, Norway, performs marginally worse (62). When accounting for the relatively small scale of Atlantic cod production in Iceland, however, Iceland’s cumulative score jumps to 96, despite serious escape challenges. Tied with France, this is the highest cumulative country score of any assessed country.
InputsIceland’s advances in hatchery technology for Atlantic cod yield a perfect score for capture-based aquaculture (CAP). Despite the nominally high trophic level of Atlantic cod, feed formulation advances have resulted in a relatively solid ecological energy (ECOE)
performance (64), well above the global ECOE average of 53.
dischargesWith the exception of a below-average antifoulants (COP) score (28), Iceland’s performance in the Discharges indicators is relatively good. Its frequent use of vaccines is the primary driver of strong antibiot-ics (ANTI) (98) and parasiticides (PARA) scores (88), which far exceed global averages by 43 and 33 points, respectively. Iceland also performs well in BOD (92) as a result of a relatively low area of overlap amongst farms.
biologicalIceland’s Atlantic cod production clearly lags in its escapes (ESC) performance, with a failing score of 0. Norway, the other major Atlantic cod producer assessed, also receives a score of 0 for escapes. The extremely high reported escape rate in both major producing countries is likely due to the aggressive nature of cod, including chewing nets. Iceland rebounds with a relatively strong pathogens (PATH) performance (87), reflecting its generally heavy reliance on vaccines.
Iceland

INPUTS
DISCHARGES
BIO
LOGI
CA
L
BODANTI
INDE
FEED
ECOE
CAP
PATH
ESC
PA
RA
COP
Country GAPI score (norm.)
GLOBAL�AverAGe—cOUntry�(nOrm�)�59
50 100%�COUNTRy’S�MARINE�FINFISH�PRODUCTION�
ASSESSED
the three Indonesian
species span the spec-
trum of performance—
from relatively strong
(68), to below average
(46), to poor (10).
98
0 50 100
Global Average
Country Score
66
Milkfish
Groupers
Barramundi25
50
75
100
25
50
75
100
Milkfish
Groupers
Barramundi
0 50 100
68
10
46
X
X
X
X
GLOBAL AVERAGE—COUNTRY (NORM.) 59
96 GAPI Global Aquaculture Performance Index www.gapi.ca
cOUntry�resULts
overviewThree species are assessed in Indonesia: milkfish, bar-ramundi, and groupers. These three species comprised 98% of Indonesia’s total marine finfish production in 2007. They span the spectrum of performance—from relatively strong (68), to below average (46), to poor (10), respectively. As a result, Indonesia’s country score (66) sits in the middle of the spectrum but seven points higher than the global country average (59).
Indonesia’s milkfish score (68) is among the highest of all performers assessed, largely due to its use of extensive, polyculture-based systems. In contrast, grou-pers from Indonesia receive the worst performance score (10) of the 44 species-country performers assessed by GAPI. This contrast highlights the suite of performance differences between extensively farmed, low-trophic-level species such as milkfish versus the intensive culture of a high-trophic-level species like groupers. Indonesia’s country score falls to 47 when the cumulative effect of its total assessed production is considered. This is due, in large part, to the generally high density of its coastal aquaculture operations.
InputsGroupers from Indonesia score 0 for all four Inputs indicators, tying with groupers from China as the worst performers in this category. Milkfish from
Indonesia, on the other hand, ranks among the top performers in all four Inputs indicators. The greatest contrast appears in the sustainability of feed (FEED) indicator. Milkfish (90) has high feed conversion efficiency and is polycultured with other species, whereas groupers are fed fresh fish (low conversion efficiency) supplemented by compound, pelleted feed.
dischargesDischarges indicator scores do not vary as widely. The three species perform more similarly here, with the clear exception of antibiotic use (ANTI). Groupers score 0 and milkfish scores 97 in ANTI. Barramundi and groupers also perform at the very low end of the spectrum for parasiticides (PARA), with scores of 5 and 6, respectively, while milkfish receives a margin-ally better score of 45.
biologicalEscapes (ESC) scores for the three species are relatively close to the global ESC average (40): milkfish (46), barramundi (35) and groupers (32). Pathogens (PATH) scores are more variable. Groupers receive a score of 3, while milkfish and barramundi score 57 and 39, respectively. Groupers receive a low PATH score due to high (approximately 50%) on-farm mortality and increased risks associated with prolific pathogen pro-duction in an ecosystem with susceptible wild species.
Indonesia

INPUTS
DISCHARGES
BIO
LOGI
CA
L
BODANTI
INDE
FEED
ECOE
CAP
PATH
ESC
PA
RA
COP
Country GAPI score (norm.)
GLOBAL�AverAGe—cOUntry�(nOrm�)�59
50 100%�COUNTRy’S�MARINE�FINFISH�PRODUCTION�
ASSESSED
Israel’s gilthead
seabream culture
scores 60, one point
above the global
country average.
84
0 50 100
Global Average
Country Score
60
Gilthead Seabream
25
50
75
100
25
50
75
100
Gilthead seabream
0 50 100
60
X
X
X
X
X
X
GLOBAL AVERAGE—COUNTRY (NORM.) 59
97 GAPI Global Aquaculture Performance Index www.gapi.ca
cOUntry�resULts
overviewAccording to GAPI’s country inclusion rule, Israel ranks as a major global producer of only one marine finfish species—gilthead seabream. However, Israel’s gilthead seabream sector accounted for 84% of its total marine finfish production in 2007. Israel’s gilthead seabream culture scores 60, one point above the global country average. While Israel’s gilthead seabream score ranks as the second-highest of the five gilthead seabream producers assessed, the range of performance across countries is relatively small (just 10 points separating the best and worst country scores). Israel’s modest production of a relatively high-performing species propels its cumulative country score up 50% to 91—the third-highest cumulative score of the 22 countries assessed by GAPI.
InputsIsrael’s gilthead seabream scores well in the Input indicators except for industrial energy (INDE) (41). Its Inputs scores reflect the relatively low trophic level of the species. Its INDE score is just below average (41), owing largely to Israel’s widespread use of land-based production.
dischargesDespite relying heavily on land-based production systems, there is no evidence that Israel’s gilthead seabream sector treats effluence before releasing it into the marine environment. Since this is no better than open-net cage systems, its Discharges indica-tors tend to be unaffected and parallel average indicator scores.
biologicalEscape data are not reported for gilthead seabream in Israel. However, the proportion of land-based versus sea cage production is known. While GAPI assumes a perfect escapes (ESC) score for the land-based portion of Israel’s gilthead seabream production, it uses an average of ESC scores of other gilthead seabream producers for the portion of Israel’s production that is farmed in sea cages. This yields a moderately poor escapes (ESC) score (32). It performs marginally better in pathogens (PATH), with a score of 56, which exceeds the global average PATH score of 52.
Israel
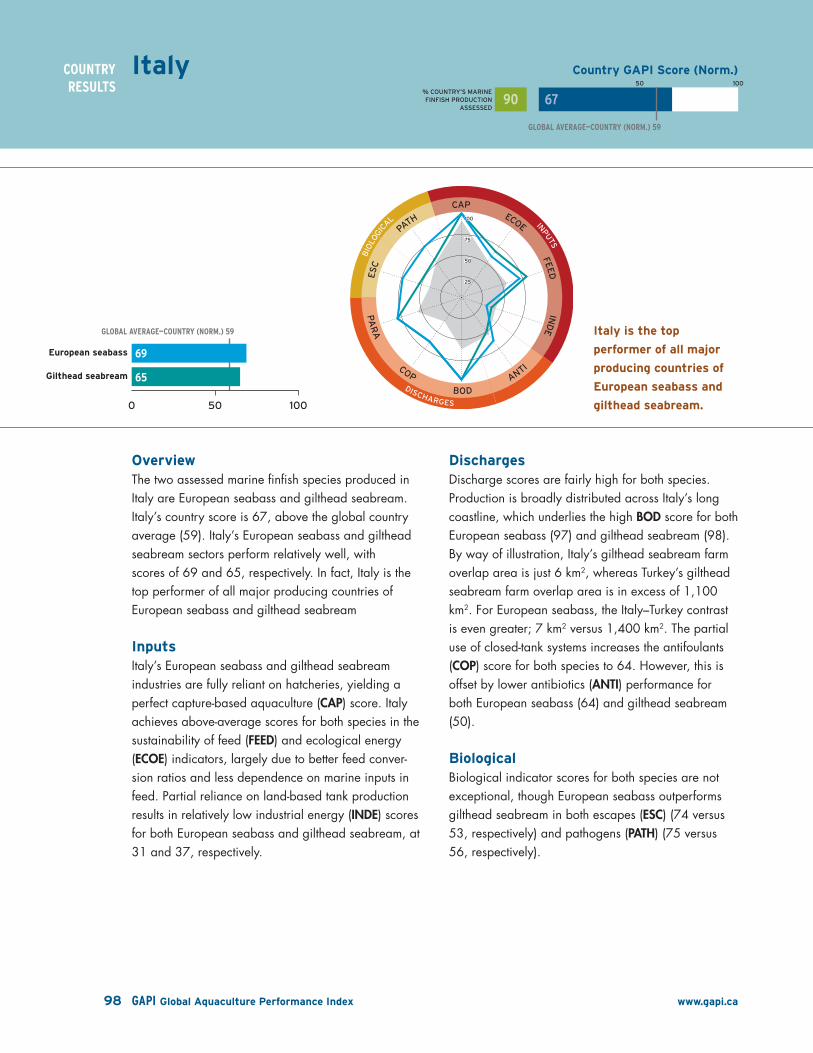
INPUTS
DISCHARGES
BIO
LOGI
CA
L
BODANTI
INDE
FEED
ECOE
CAP
PATH
ESC
PA
RA
COP
Country GAPI score (norm.)
GLOBAL�AverAGe—cOUntry�(nOrm�)�59
50 100%�COUNTRy’S�MARINE�FINFISH�PRODUCTION�
ASSESSED
Italy is the top
performer of all major
producing countries of
european seabass and
gilthead seabream.
90
0 50 100
Global Average
Country Score
67
Gilthead Seabream
European seabass
25
50
75
100
25
50
75
100
Gilthead seabream
European seabass
0 50 100
65
69
GLOBAL AVERAGE—COUNTRY (NORM.) 59
98 GAPI Global Aquaculture Performance Index www.gapi.ca
cOUntry�resULts
overviewThe two assessed marine finfish species produced in Italy are European seabass and gilthead seabream. Italy’s country score is 67, above the global country average (59). Italy’s European seabass and gilthead seabream sectors perform relatively well, with scores of 69 and 65, respectively. In fact, Italy is the top performer of all major producing countries of European seabass and gilthead seabream
InputsItaly’s European seabass and gilthead seabream industries are fully reliant on hatcheries, yielding a perfect capture-based aquaculture (CAP) score. Italy achieves above-average scores for both species in the sustainability of feed (FEED) and ecological energy (ECOE) indicators, largely due to better feed conver-sion ratios and less dependence on marine inputs in feed. Partial reliance on land-based tank production results in relatively low industrial energy (INDE) scores for both European seabass and gilthead seabream, at 31 and 37, respectively.
dischargesDischarge scores are fairly high for both species. Production is broadly distributed across Italy’s long coastline, which underlies the high BOD score for both European seabass (97) and gilthead seabream (98). By way of illustration, Italy’s gilthead seabream farm overlap area is just 6 km2, whereas Turkey’s gilthead seabream farm overlap area is in excess of 1,100 km2. For European seabass, the Italy–Turkey contrast is even greater; 7 km2 versus 1,400 km2. The partial use of closed-tank systems increases the antifoulants (COP) score for both species to 64. However, this is offset by lower antibiotics (ANTI) performance for both European seabass (64) and gilthead seabream (50).
biologicalBiological indicator scores for both species are not exceptional, though European seabass outperforms gilthead seabream in both escapes (ESC) (74 versus 53, respectively) and pathogens (PATH) (75 versus 56, respectively).
Italy

INPUTS
DISCHARGES
BIO
LOGI
CA
L
BODANTI
INDE
FEED
ECOE
CAP
PATH
ESC
PA
RA
COP
Country GAPI score (norm.)
GLOBAL�AverAGe—cOUntry�(nOrm�)�59
50 100%�COUNTRy’S�MARINE�FINFISH�PRODUCTION�
ASSESSED
Japan’s overall
country score is 46,
substantially below
the global country
average (59).
93
0 50 100
Global Average
Country Score
46
Tiger puffer
Red seabream
Japanese Amberjack
Coho Salmon
25
50
75
100
25
50
75
100
Tiger pufferfish
Red seabream
Japanese amberjack
Coho salmon
0 50 100
39
47
45
56
GLOBAL AVERAGE—COUNTRY (NORM.) 59
99 GAPI Global Aquaculture Performance Index www.gapi.ca
cOUntry�resULts
overviewJapan’s country score is comprised of four assessed species, which accounted for 93% of total marine finfish production in Japan in 2007. The four species, as assessed by GAPI, are: coho salmon, Japanese amberjack, red seabream, and tiger pufferfish. Coho salmon achieves the highest score for Japan (56), while tiger pufferfish scores the lowest (39). Japan’s overall country score is 46, substantially below the global country average (59).
InputsAll four species produced in Japan achieve a perfect capture-based aquaculture (CAP) score, given that all depend on hatchery production. Tiger pufferfish scores very low for sustainability of feed (FEED) (11) as a result of its high trophic level and low feed transfer efficiency. Japanese amberjack faces similar challenges, though not as extreme as tiger pufferfish.
dischargesAntibiotic use in Japanese marine finfish aquaculture is common, resulting in low antibiotics (ANTI) scores for all species, especially coho salmon (13). Japan’s
major competitor in coho salmon aquaculture, Chile, scores 68 for ANTI, demonstrating a much lower reliance on antibiotics. BOD shows a wide range of performance, from 0 (Japanese amberjack) to 80 (tiger pufferfish) reflecting varied density of farms across species and systems. All species but tiger pufferfish score well in parasiticides (PARA), particu-larly in contrast to tiger pufferfish (21), which relies heavily on parasiticides. Japanese tiger pufferfish’s reliance on parasiticides is especially apparent when compared to Chinese tiger pufferfish’s PARA score of 84.
biologicalCoho salmon experiences significantly fewer patho-gen-related mortalities compared to the other species farmed in Japan. This contributes to coho salmon’s pathogens (PATH) score of 77, 45 points greater than the next best PATH score of 32 for both Japanese amberjack and red seabream. The high mortality rate of tiger pufferfish drives its PATH score down to 3 (equal to China’s tiger pufferfish PATH score).
Japan
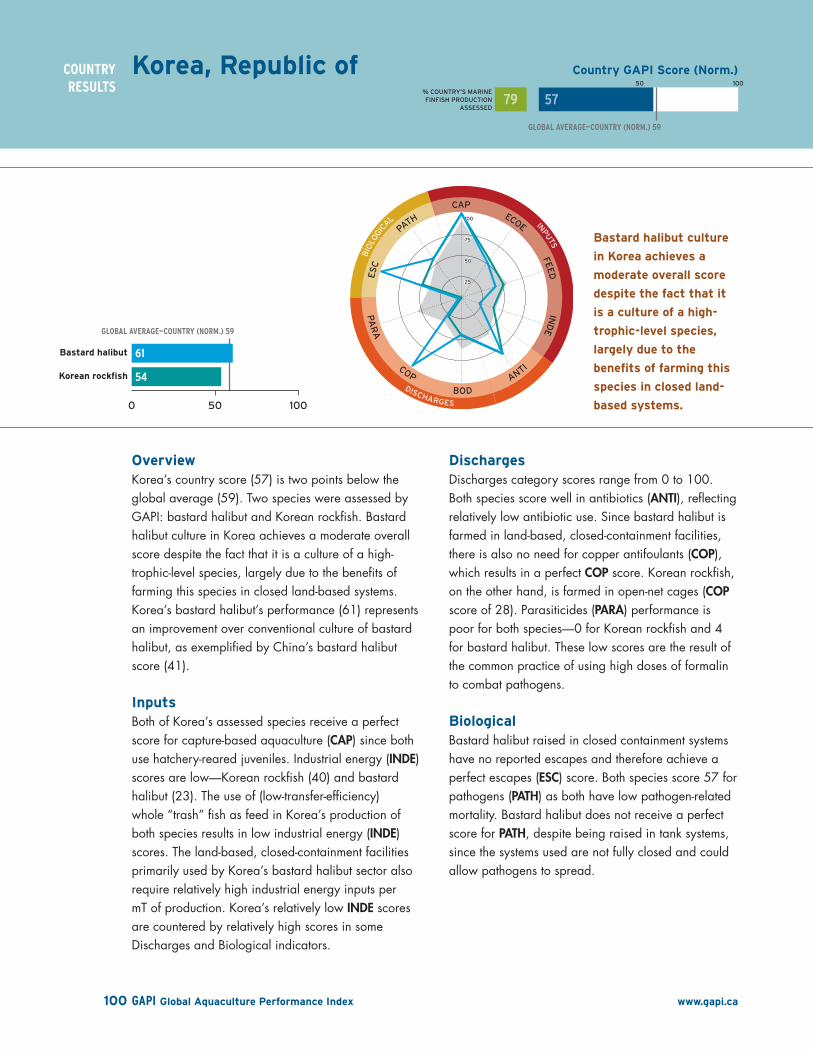
INPUTS
DISCHARGES
BIO
LOGI
CA
L
BODANTI
INDE
FEED
ECOE
CAP
PATH
ESC
PA
RA
COP
Country GAPI score (norm.)
GLOBAL�AverAGe—cOUntry�(nOrm�)�59
50 100%�COUNTRy’S�MARINE�FINFISH�PRODUCTION�
ASSESSED
bastard halibut culture
in korea achieves a
moderate overall score
despite the fact that it
is a culture of a high-
trophic-level species,
largely due to the
benefits of farming this
species in closed land-
based systems.
79
0 50 100
Global Average
Country Score
57
Korean Rockfish
Bastard halibut
25
50
75
100
25
50
75
100
Korean rockfish
Bastard halibut
0 50 100
54
61
GLOBAL AVERAGE—COUNTRY (NORM.) 59
100 GAPI Global Aquaculture Performance Index www.gapi.ca
cOUntry�resULts
overviewKorea’s country score (57) is two points below the global average (59). Two species were assessed by GAPI: bastard halibut and Korean rockfish. Bastard halibut culture in Korea achieves a moderate overall score despite the fact that it is a culture of a high-trophic-level species, largely due to the benefits of farming this species in closed land-based systems. Korea’s bastard halibut’s performance (61) represents an improvement over conventional culture of bastard halibut, as exemplified by China’s bastard halibut score (41).
InputsBoth of Korea’s assessed species receive a perfect score for capture-based aquaculture (CAP) since both use hatchery-reared juveniles. Industrial energy (INDE) scores are low—Korean rockfish (40) and bastard halibut (23). The use of (low-transfer-efficiency) whole “trash” fish as feed in Korea’s production of both species results in low industrial energy (INDE) scores. The land-based, closed-containment facilities primarily used by Korea’s bastard halibut sector also require relatively high industrial energy inputs per mT of production. Korea’s relatively low INDE scores are countered by relatively high scores in some Discharges and Biological indicators.
dischargesDischarges category scores range from 0 to 100. Both species score well in antibiotics (ANTI), reflecting relatively low antibiotic use. Since bastard halibut is farmed in land-based, closed-containment facilities, there is also no need for copper antifoulants (COP), which results in a perfect COP score. Korean rockfish, on the other hand, is farmed in open-net cages (COP score of 28). Parasiticides (PARA) performance is poor for both species—0 for Korean rockfish and 4 for bastard halibut. These low scores are the result of the common practice of using high doses of formalin to combat pathogens.
biologicalBastard halibut raised in closed containment systems have no reported escapes and therefore achieve a perfect escapes (ESC) score. Both species score 57 for pathogens (PATH) as both have low pathogen-related mortality. Bastard halibut does not receive a perfect score for PATH, despite being raised in tank systems, since the systems used are not fully closed and could allow pathogens to spread.
korea, republic of
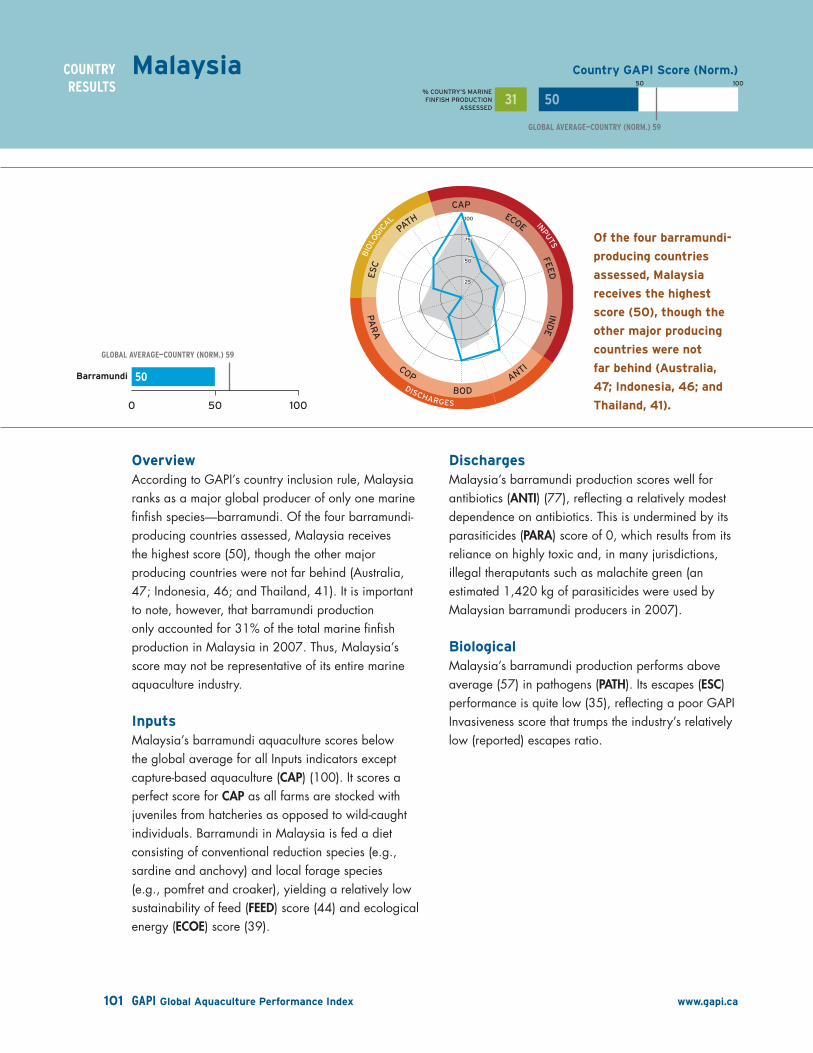
INPUTS
DISCHARGES
BIO
LOGI
CA
L
BODANTI
INDE
FEED
ECOE
CAP
PATH
ESC
PA
RA
COP
Country GAPI score (norm.)
GLOBAL�AverAGe—cOUntry�(nOrm�)�59
50 100%�COUNTRy’S�MARINE�FINFISH�PRODUCTION�
ASSESSED
of the four barramundi-
producing countries
assessed, Malaysia
receives the highest
score (50), though the
other major producing
countries were not
far behind (Australia,
47; Indonesia, 46; and
thailand, 41).
31
0 50 100
Global Average
Country Score
50
Barramundi
25
50
75
100
25
50
75
100
Barramundi
0 50 100
50
X
X
X
X
X
X
GLOBAL AVERAGE—COUNTRY (NORM.) 59
101 GAPI Global Aquaculture Performance Index www.gapi.ca
cOUntry�resULts
overviewAccording to GAPI’s country inclusion rule, Malaysia ranks as a major global producer of only one marine finfish species—barramundi. Of the four barramundi-producing countries assessed, Malaysia receives the highest score (50), though the other major producing countries were not far behind (Australia, 47; Indonesia, 46; and Thailand, 41). It is important to note, however, that barramundi production only accounted for 31% of the total marine finfish production in Malaysia in 2007. Thus, Malaysia’s score may not be representative of its entire marine aquaculture industry.
InputsMalaysia’s barramundi aquaculture scores below the global average for all Inputs indicators except capture-based aquaculture (CAP) (100). It scores a perfect score for CAP as all farms are stocked with juveniles from hatcheries as opposed to wild-caught individuals. Barramundi in Malaysia is fed a diet consisting of conventional reduction species (e.g., sardine and anchovy) and local forage species (e.g., pomfret and croaker), yielding a relatively low sustainability of feed (FEED) score (44) and ecological energy (ECOE) score (39).
dischargesMalaysia’s barramundi production scores well for antibiotics (ANTI) (77), reflecting a relatively modest dependence on antibiotics. This is undermined by its parasiticides (PARA) score of 0, which results from its reliance on highly toxic and, in many jurisdictions, illegal theraputants such as malachite green (an estimated 1,420 kg of parasiticides were used by Malaysian barramundi producers in 2007).
biologicalMalaysia’s barramundi production performs above average (57) in pathogens (PATH). Its escapes (ESC) performance is quite low (35), reflecting a poor GAPI Invasiveness score that trumps the industry’s relatively low (reported) escapes ratio.
Malaysia

INPUTS
DISCHARGES
BIO
LOGI
CA
L
BODANTI
INDE
FEED
ECOE
CAP
PATH
ESC
PA
RA
COP
Country GAPI score (norm.)
GLOBAL�AverAGe—cOUntry�(nOrm�)�59
50 100%�COUNTRy’S�MARINE�FINFISH�PRODUCTION�
ASSESSED
new Zealand is the
top performer of all 22
assessed countries, with
a country score of 73.
100
0 50 100
Global Average
Country Score
73
Chinook salmon
25
50
75
100
25
50
75
100
Chinook salmon
0 50 100
73
GLOBAL AVERAGE—COUNTRY (NORM.) 59
102 GAPI Global Aquaculture Performance Index www.gapi.ca
cOUntry�resULts
overviewNew Zealand is the top performer of all 22 assessed countries, with a country score of 73. While GAPI only considers the production of Chinook salmon in New Zealand, according to FAO production data, Chinook salmon actually accounted for all marine finfish production in New Zealand in 2007. Relatively low, dispersed production drives New Zealand’s cumulative country score up to 90—among the highest cumulative scores of all assessed countries.
InputsNew Zealand’s Chinook salmon farms are stocked with juveniles reared in hatcheries as opposed to wild-caught fish, resulting in a perfect capture-based aquaculture (CAP) score. However, it underperforms in both sustainability of feed (FEED) (52) and industrial energy (INDE) (43). Its FEED score reflects the relatively poor transfer coefficient typical of farmed Chinook salmon, while its INDE score reflects a high FCR value, which results in greater industrial energy use per unit of production.
dischargesNew Zealand’s Chinook salmon receives perfect scores (100) for three of the four Discharges indicators—antibiotics (ANTI), BOD, and parasiticides (PARA). These scores are a result of rare pathogen-related mortalities, no reported use of antibiotics or parasiticides, few farms, and relatively low production. Elimination of copper-based antifoulants (COP) (28) would further improve New Zealand’s Discharges score.
biologicalNew Zealand’s escapes score (48) is above average. While the invasiveness risk in New Zealand’s marine environment is high, its relatively low escapes ratio helps to offset the risk factor somewhat. There were no reported pathogen-related mortalities for Chinook salmon in New Zealand, resulting in the only perfect score for pathogens (PATH) of any performer assessed by GAPI.
new Zealand
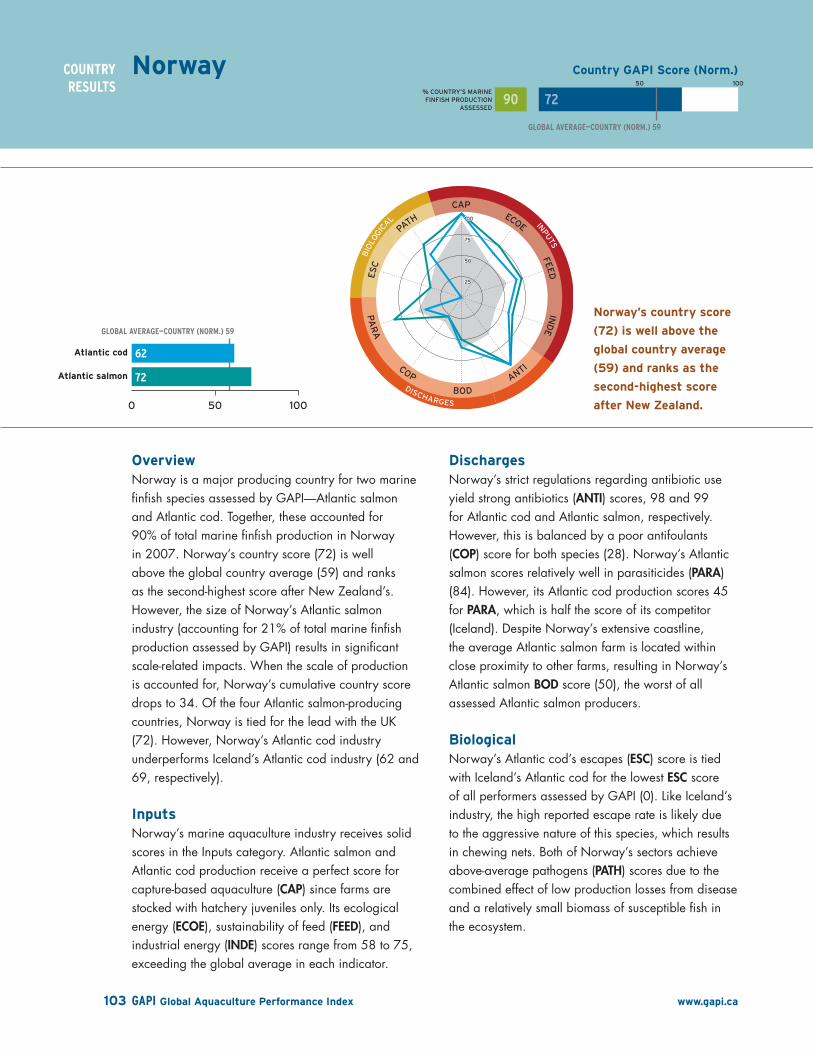
INPUTS
DISCHARGES
BIO
LOGI
CA
L
BODANTI
INDE
FEED
ECOE
CAP
PATH
ESC
PA
RA
COP
Country GAPI score (norm.)
GLOBAL�AverAGe—cOUntry�(nOrm�)�59
50 100%�COUNTRy’S�MARINE�FINFISH�PRODUCTION�
ASSESSED
norway’s country score
(72) is well above the
global country average
(59) and ranks as the
second-highest score
after new Zealand.
90
0 50 100
Global Average
Country Score
72
Atlantic Salmon
Atlantic cod
25
50
75
100
25
50
75
100
Atlantic salmon
Atlantic cod
0 50 100
72
62
GLOBAL AVERAGE—COUNTRY (NORM.) 59
103 GAPI Global Aquaculture Performance Index www.gapi.ca
cOUntry�resULts
overviewNorway is a major producing country for two marine finfish species assessed by GAPI—Atlantic salmon and Atlantic cod. Together, these accounted for 90% of total marine finfish production in Norway in 2007. Norway’s country score (72) is well above the global country average (59) and ranks as the second-highest score after New Zealand’s. However, the size of Norway’s Atlantic salmon industry (accounting for 21% of total marine finfish production assessed by GAPI) results in significant scale-related impacts. When the scale of production is accounted for, Norway’s cumulative country score drops to 34. Of the four Atlantic salmon-producing countries, Norway is tied for the lead with the UK (72). However, Norway’s Atlantic cod industry underperforms Iceland’s Atlantic cod industry (62 and 69, respectively).
InputsNorway’s marine aquaculture industry receives solid scores in the Inputs category. Atlantic salmon and Atlantic cod production receive a perfect score for capture-based aquaculture (CAP) since farms are stocked with hatchery juveniles only. Its ecological energy (ECOE), sustainability of feed (FEED), and industrial energy (INDE) scores range from 58 to 75, exceeding the global average in each indicator.
dischargesNorway’s strict regulations regarding antibiotic use yield strong antibiotics (ANTI) scores, 98 and 99 for Atlantic cod and Atlantic salmon, respectively. However, this is balanced by a poor antifoulants (COP) score for both species (28). Norway’s Atlantic salmon scores relatively well in parasiticides (PARA) (84). However, its Atlantic cod production scores 45 for PARA, which is half the score of its competitor (Iceland). Despite Norway’s extensive coastline, the average Atlantic salmon farm is located within close proximity to other farms, resulting in Norway’s Atlantic salmon BOD score (50), the worst of all assessed Atlantic salmon producers.
biologicalNorway’s Atlantic cod’s escapes (ESC) score is tied with Iceland’s Atlantic cod for the lowest ESC score of all performers assessed by GAPI (0). Like Iceland’s industry, the high reported escape rate is likely due to the aggressive nature of this species, which results in chewing nets. Both of Norway’s sectors achieve above-average pathogens (PATH) scores due to the combined effect of low production losses from disease and a relatively small biomass of susceptible fish in the ecosystem.
norway

INPUTS
DISCHARGES
BIO
LOGI
CA
L
BODANTI
INDE
FEED
ECOE
CAP
PATH
ESC
PA
RA
COP
Country GAPI score (norm.)
GLOBAL�AverAGe—cOUntry�(nOrm�)�59
50 100%�COUNTRy’S�MARINE�FINFISH�PRODUCTION�
ASSESSED
the Philippines’ milkfish
production performs well
in sustainability of feed
(Feed), with a score
of 90, reflecting the
species’ high transfer
efficiency (0.2).
99
0 50 100
Global Average
Country Score
59
Milkfish
25
50
75
100
25
50
75
100
Milkfish
0 50 100
59
GLOBAL AVERAGE—COUNTRY (NORM.) 59
104 GAPI Global Aquaculture Performance Index www.gapi.ca
cOUntry�resULts
overviewThe Philippines ranks as a major producing country for only one of the top 20 marine finfish species in production—milkfish. However, milkfish accounted for 99% of the total marine finfish production in the Philippines in 2007. The Philippines’ country score, which is solely dependent on its milkfish performance, is 59. The Philippines’ country score is equal to the global country average but is nine points below that of its competitor—milkfish from Indonesia.
InputsMilkfish in the Philippines performs reasonably well in the Inputs category, with a mean Inputs score of 80 (19 points above the global average for Inputs performance). Its performance closely tracks that of its competitor—Indonesia’s milkfish industry. Broodstock in the Philippines’ milkfish industry is almost entirely hatchery-based, resulting in a capture-based aqua-culture (CAP) score of 98. The Philippines’ milkfish production performs well in sustainability of feed (FEED) with a score of 90, reflecting the species’ high transfer efficiency (0.2).
dischargesWith the exception of its antibiotic use score (ANTI) (69), the Philippines’ milkfish production performs poorly in the Discharge category. It receives a failing score (0) for parasiticides (PARA) a result of using at least 16 parasiticide compounds in 2007, including 30,000 kg methylene blue, 353 kg malachite green, 4.4 million kg formalin, and 8,800 kg trichlorofon. Indonesia, the other assessed milkfish producer, reported using half as many parasiticides. Further, both BOD (37) and antifoulant use COP (28) are also apparent problem areas.
biologicalThe Philippines’ pathogens (PATH) performance (39) is significantly below the global PATH average (52), reflecting relatively high on-farm mortalities. Relatively low reported escapes explains its escapes (ESC) score of 46, above the global ESC average score of 40.
Philippines

INPUTS
DISCHARGES
BIO
LOGI
CA
L
BODANTI
INDE
FEED
ECOE
CAP
PATH
ESC
PA
RA
COP
Country GAPI score (norm.)
GLOBAL�AverAGe—cOUntry�(nOrm�)�59
50 100%�COUNTRy’S�MARINE�FINFISH�PRODUCTION�
ASSESSED
spain scores at the
lower to middle range
of performance for
each of the three
species assessed,
relative to other
producing countries.
97
0 50 100
Global Average
Country Score
60
Turbot
Gilthead Seabream
European seabass25
50
75
100
25
50
75
100
Turbot
Gilthead seabream
European seabass
0 50 100
63
57
63
GLOBAL AVERAGE—COUNTRY (NORM.) 59
105 GAPI Global Aquaculture Performance Index www.gapi.ca
cOUntry�resULts
overviewEuropean seabass, gilthead seabream, and turbot are the three species that comprise Spain’s country score (60), which hovers around the global country average (59). Spain’s turbot and European seabass receive the same score (63), while gilthead seabream performs somewhat lower (57). Spain scores at the lower to middle range of performance for each of the three species assessed, relative to other producing countries.
InputsAll three species are entirely reliant on hatcheries, yielding a perfect score for capture-based aquaculture (CAP). Turbot’s sustainability of feed (FEED) score (88) outperforms gilthead seabream’s (72) and European seabass’s (69), reflecting turbot’s superior feed transfer efficiency. Both industrial energy (INDE) and ecological energy (ECOE) scores suggest moderate performance across the three species, with scores ranging from 44 to 69.
dischargesBOD scores are relatively high for all species, reflect-ing only a moderate level of concentration (relative to other assessed countries) of farms along Spain’s coast. European seabass leads the BOD scores with 93, followed by gilthead seabream (90) and turbot (82). Turbot’s antibiotics (ANTI) score (23) is Spain’s lowest score in the Discharges category, reflecting its turbot sector’s use of 39,100 kg of eight different antibiotics in 2007. By contrast, France’s turbot sector used half the volume of antibiotics in lower doses, resulting in an ANTI score of 52.
biologicalSpain’s gilthead seabream’s escapes (ESC) score of 8 is extremely low as a result of a high escapes ratio. This score is consistent with some of the other major gilthead seabream producers (Greece and Turkey both scored 5). European seabass (49) and turbot (61) both exceed the ESC global average score of 40. Pathogen (PATH) scores are low for all three species, reflecting a high number of reported on-farm pathogens and significant susceptibility in the wild finfish community.
spain

INPUTS
DISCHARGES
BIO
LOGI
CA
L
BODANTI
INDE
FEED
ECOE
CAP
PATH
ESC
PA
RA
COP
Country GAPI score (norm.)
GLOBAL�AverAGe—cOUntry�(nOrm�)�59
50 100%�COUNTRy’S�MARINE�FINFISH�PRODUCTION�
ASSESSED
Poor performance
within both cobia and
grouper culture results
in a country score of
30 for taiwan—the
worst score of all 22
countries assessed.
35
0 50 100
Global Average
Country Score
30
Groupers
Cobia
25
50
75
100
25
50
75
100
Groupers
Cobia
0 50 100
28
35
GLOBAL AVERAGE—COUNTRY (NORM.) 59
106 GAPI Global Aquaculture Performance Index www.gapi.ca
cOUntry�resULts
overviewCobia and groupers are the only marine finfish from Taiwan assessed by GAPI. Poor performance within both cobia (35) and grouper culture (28) results in a country score of 30 for Taiwan—the worst score of all 22 countries assessed. However, Taiwan is not alone in its poor performance in cobia and grouper produc-tion. In fact, Taiwan outperforms its two competitors in grouper production (China, 15, and Indonesia, 10) and performs within range of the other assessed cobia producer, China (37).
It is important to note that cobia and grouper produc-tion only accounted for 35% of the total marine finfish production in Taiwan in 2007. Thus, Taiwan’s score may not be representative of the performance of its entire marine aquaculture industry.
InputsThe production of groupers is entirely dependent on capture-based aquaculture (CAP), resulting in a failing (0) score for CAP. Cobia, on the other hand, is entirely hatchery-based broodstock, resulting in a perfect score CAP (100). Cobia receives a failing (0) score for ecological energy (ECOE), however, reflecting the near total reliance on “trash” fish for feed and a related poor conversion efficiency. The reliance on “trash” fish also negatively influences
Taiwan’s industrial energy (INDE) scores (5 for cobia and 39 for groupers). In sustainability of feed (FEED), both cobia (51) and groupers (45) are below the global FEED average (56).
dischargesOf all Discharges indicators, Taiwan performs the worst in parasiticides (PARA), with cobia scoring 6 and groupers scoring 0. The culture of both species relies on the application of large amounts of often highly toxic compounds to control parasites. Grouper culture alone consumed an estimated 37,000 kg of benzethonium chloride in 2007. Both species receive a well-below-average antibiotics (ANTI) score (24), with an estimated 131,000 kg of antibacterial compounds consumed between the two species. Eight of the nine antibiotics used in Taiwan’s cobia and grouper production are considered critical for human and veterinary use, according to WHO-OIE ratings.
biologicalGroupers’ pathogens (PATH) score (3) is among the lowest of all assessed performers. This is attributed to the high incidence of disease within grouper aquacul-ture in Taiwan.
taiwan, republic of China

INPUTS
DISCHARGES
BIO
LOGI
CA
L
BODANTI
INDE
FEED
ECOE
CAP
PATH
ESC
PA
RA
COP
Country GAPI score (norm.)
GLOBAL�AverAGe—cOUntry�(nOrm�)�59
50 100%�COUNTRy’S�MARINE�FINFISH�PRODUCTION�
ASSESSED
thailand’s barramundi
score (41) places it
as the fourth-worst
performer of all
assessed countries.
84
0 50 100
Global Average
Country Score
41
Barramundi
25
50
75
100
25
50
75
100
Barramundi
0 50 100
41
X
X
X
X
X
X
GLOBAL AVERAGE—COUNTRY (NORM.) 59
107 GAPI Global Aquaculture Performance Index www.gapi.ca
cOUntry�resULts
overviewThailand ranks as a major producing country for only one of the top 20 marine finfish species in produc-tion—barramundi. However, barramundi accounted for 84% of the total marine finfish production in Thailand in 2007. Thailand’s barramundi production (15,700 mT in 2007) is three times larger than that of Malaysia, the next-largest producer. Thailand’s barramundi score (41) places it as the fourth-worst performer of all assessed countries.
InputsThailand’s Inputs scores parallel those of the two other Asian producers of barramundi (Indonesia and Malaysia). Its scores range from a low of 39 for ecological energy (ECOE) to a high of 100 for capture-based aquaculture (CAP). In all indicators except CAP, Thailand’s performance is below the global averages for each indicator.
dischargesMore than 29,000 km2 of inshore marine habitat is affected by overlapping barramundi production (two or more farms) in Thailand, resulting in a BOD score of 0. Thailand’s production is three times that of Malaysia, but it consumes nearly 20 times the volume of antibiotics, all of which are considered critical for veterinary and/or human medicine by the WHO and OIE. Thailand’s antibiotics (ANTI) score (38) is the lowest of assessed barramundi producers.
biologicalThailand’s relatively poor escapes (ESC) performance (35) reflects consistent escapes from its barramundi farms. Its pathogens (PATH) performance (46) is close to the global PATH average score of 52.
thailand

INPUTS
DISCHARGES
BIO
LOGI
CA
L
BODANTI
INDE
FEED
ECOE
CAP
PATH
ESC
PA
RA
COP
Country GAPI score (norm.)
GLOBAL�AverAGe—cOUntry�(nOrm�)�59
50 100%�COUNTRy’S�MARINE�FINFISH�PRODUCTION�
ASSESSED
turkey is the worst
performer of the four
european seabass and
five gilthead seabream
producers assessed.
94
0 50 100
Global Average
Country Score
59
Gilthead Seabream
European seabass
25
50
75
100
25
50
75
100
Gilthead seabream
European seabass
0 50 100
55
61
GLOBAL AVERAGE—COUNTRY (NORM.) 59
108 GAPI Global Aquaculture Performance Index www.gapi.ca
cOUntry�resULts
overviewGAPI assesses Turkey’s European seabass and gilthead seabream production. Together, these two sectors comprised 94% of the total marine finfish production in Turkey in 2007. Turkey’s country score (59) sits at the global country average. Its European seabass industry (61) moderately outperforms its gilthead seabream industry (55). Turkey is the worst performer of the four European seabass and five gilthead seabream producers assessed.
InputsTurkey’s European seabass and gilthead seabream production is reliant on hatcheries for production, resulting in a perfect capture-based aquaculture (CAP) score of 100. Its industrial energy (INDE) scores for both European seabass (43) and gilthead seabream (55) are the lowest Inputs scores among the major producers of each species. Nearly all of Turkey’s European seabass production is in sea cages (com-pared to Italy, with 24% of production in land-based systems), which yields better performance in INDE. The same trend occurs with gilthead seabream production—Turkey’s cage-based production results in a moderate INDE score (55) relative to other produc-ers such as Israel (41), where 50% of production occurs in land-based systems.
dischargesOne of the few bright spots for Turkey is its parasiti-cides (PARA) performance, in which its European seabass and gilthead seabream production both score 81. This reflects a relatively low dependence on parasiticides. Since most production of both species occurs in sea cages, Turkey’s industry is reliant on copper-based antifoulants (COP), resulting in a below-average COP score of 28.
biologicalEscapes of gilthead seabream are a clear issue in Turkey, which scored only 5 out of 100. European seabass performs considerably better, with a score of 53. Both species show similar escape ratios, but Turkey’s gilthead seabream has a considerably higher GAPI Invasiveness score than does European seabass. The pathogens (PATH) performance of Turkey’s gilthead seabream (44) is considerably below its European seabass performance (75). This reflects the high estimated mortality (32%) of Turkey’s gilthead seabream relative to its European seabass (7%).
turkey

INPUTS
DISCHARGES
BIO
LOGI
CA
L
BODANTI
INDE
FEED
ECOE
CAP
PATH
ESC
PA
RA
COP
Country GAPI score (norm.)
GLOBAL�AverAGe—cOUntry�(nOrm�)�59
50 100%�COUNTRy’S�MARINE�FINFISH�PRODUCTION�
ASSESSED
the uk’s country
score, which is solely
dependent on its
Atlantic salmon
production, is 72—the
third-highest score of
any assessed country.
97
Atlantic Salmon
25
50
75
100
25
50
75
100
0 50 100
Global Average
Country Score
72
Atlantic salmon
0 50 100
72
GLOBAL AVERAGE—COUNTRY (NORM.) 59
109 GAPI Global Aquaculture Performance Index www.gapi.ca
cOUntry�resULts
overviewWhile the UK produces several marine finfish species, it ranks as a major producing country for only one of the top 20 marine finfish species in production—Atlantic salmon. Atlantic salmon production accounted for 97% of the UK’s total marine finfish production in 2007. The UK ranked as the third-largest producer of Atlantic salmon, above Canada and below Norway and Chile. The UK’s country score, which is solely dependent on its Atlantic salmon production, is 72—the third-highest score of any assessed country.
InputsAs is the case for all assessed Atlantic salmon producers, the UK’s Atlantic salmon sector uses only hatchery-raised fish and therefore achieves a perfect capture-based aquaculture (CAP) score. The considerably higher proportion of fish material in feed formulations used in the UK drives down its industrial energy (INDE) score to 60—the lowest INDE score of the Atlantic salmon-producing cohort. The balance of Inputs scores show little variation among Atlantic salmon countries. All performers score well above global average scores for each indicator.
dischargesTightly regulated chemical use and use of vaccines result in a high antibiotics (ANTI) score for the UK’s Atlantic salmon production (96). The UK is the only assessed Atlantic salmon producer to require report-ing of antifoulant use (COP); therefore, its COP score, (49) relative to its cohorts (28) reflects the actual proportion of farms using copper-based antifoulants. The UK’s parasiticides (PARA) score (53) is low by comparison to other Atlantic salmon producers (e.g., Canada’s score of 99), which is more reflective of the toxicity of compounds used than of larger quantities used.
biologicalThe UK’s escapes (ESC) performance (40) is consistent with other Atlantic salmon producers and is equal to the average global ESC score. The UK’s pathogens (PATH) score (86) leads Atlantic salmon producers, reflecting relatively low on-farm mortality.
united kingdom

110 GAPI Global Aquaculture Performance Index www.gapi.ca

111 GAPI Global Aquaculture Performance Index www.gapi.ca
references

112 GAPI Global Aquaculture Performance Index www.gapi.ca
executive summary
Ayer N, Tyedmers P. 2009. Assessing alternative aquaculture technologies: life cycle assessment of salmonid culture systems in Canada. Journal of Cleaner Production. 17(3): 362–373.
Emerson J, Esty D, Levy M, Kim C, Mara V, de Sherbinin A, Srebotnjak T. 2010. 2010 Environmental Performance Index. New Haven: Yale Center for Environmental Law and Policy.
Food and Agriculture Organization (FAO). 2008. FishStat Plus. Universal software for fishery statistical time series. Version 2.3. [Software]. Available from: http://www.fao.org/fishery/statistics/software/fishstat/en (Data sources: Aquaculture Production (1950—2007) and Capture Production)
The Keystone Center. 2009. Field to Market: The Keystone Alliance for Sustainable Agriculture. Environmental Resource Indicators.for Measuring Outcomes of On-Farm Agricultural Production in the United States. First Report, January 2009. Available from: http://keystone.org/spp/env-sustain_ag.html
Pelletier N, Tyedmers P, Sonesson U, Scholz A, Ziegler F, Flysjo A, Kruse S, Cancino B, Silverman H. 2009. Not all salmon are created equal: life cycle assessment (LCA) of global salmon farming systems. Environment Science and Technology. 43(23): 8,730–8,736.
overview
Methods
Emerson J, Esty D, Levy M, Kim C, Mara V, de Sherbinin A, Srebotnjak T. 2010. 2010 Environmental Performance Index. New Haven: Yale Center for Environmental Law and Policy.
Esty D, Levy M, Kim C, de Sherbinin A, Srebotnjak T, Mara V. 2008. 2008 Environmental Performance Index. New Haven: Yale Center for Environmental Law and Policy.
Singh R, Murty H, Gupta S, Dikshit A. 2009. An overview of sustainability assessment methodologies. Ecological Indicators. 9(2): 189–212.
species and Country selection
Food and Agriculture Organization (FAO). 2008. FishStat Plus. Universal software for fishery statistical time series. Version 2.3. [Software]. Available from: http://www.fao.org/fishery/statistics/software/fishstat/en (Data sources: Aquaculture Production (1950–2007) and Capture Production)
summary of results
Food and Agriculture Organization (FAO). 2008. FishStat Plus. Universal software for fishery statistical time series. Version 2.3. [Software]. Available from: http://www.fao.org/fishery/statistics/software/fishstat/en (Data sources: Aquaculture Production (1950–2007) and Capture Production)
Indicators
Capture-based Aquaculture
FishSource. 2010. [Internet]. San Francisco (CA). Sustainable Fisheries Partnership. [cited 2010 February 15]. Available from: http://www.fishsource.org
Food and Agriculture Organization (FAO). 1995. Code of conduct for responsible fisheries. Rome, Italy, FAO. 41 pp.
Lovatelli A, Holthus P, editors. 2008. Capture-based aquaculture. Global overview. FAO Fisheries Technical Paper. No. 508. 298 pp.
references
113 GAPI Global Aquaculture Performance Index www.gapi.ca
Ottolenghi F, Silvestri C, Giordano P, Lovatelli A, New M. 2004. Capture-based aquaculture. The fattening of eels, groupers, tunas and yellowtails. Rome, Italy, FAO. 308 pp.
Sadovy de Mitcheson Y, Liu M. 2008. Environmental and biodiversity impacts of capture-based aquaculture. In Lovatelli A, Holthus PF, editors. Capture-based aquaculture. Global overview. FAO Fisheries Technical Paper. No. 508. Rome, Italy, FAO. Pp. 5–39.
ecological energy
Deutsch L, Gräslund S, Folke C, Huitric M, Kautsky N, Troell M, Lebel L. 2007. Feeding aquaculture growth through globalization; exploitation of marine ecosystems for fishmeal. Global Environmental Change. 17(2): 238–249.
Kristofersson D, Anderson J. 2006. Is there a relationship between fisheries and farming? Inter-dependence of fisheries, animal production and aquaculture. Marine Policy. 30(6): 721–725.
Naylor RL, Goldburg RJ, Primavera JH, Kautsky N, Beveridge MCM, Clay J, Folke C, Lubchenco J, Mooney H, Troell M. 2000. Effect of aquaculture on world fish supplies. Nature. 405: 1017–1024.
Naylor RL, Goldburg RJ, Mooney H, Beveridge MCM, Clay J, Folke C, Kautsky N, Lubchenco J, Primavera JH, Williams M. 1998. Nature’s subsidies to shrimp and salmon farming. Science. 282(5,390): 883–884.
Tacon A, Metian M. 2008. Global overview on the use of fish meal and fish oil in industrially compounded aquafeeds: Trends and future prospects. Aquaculture. 285(1-4): 146–158.
Tyedmers P. 2000. Salmon and sustainability: The biophysical cost of producing salmon through the commercial salmon fishery and the intensive salmon culture industry [PhD thesis]. University of British Columbia.
sustainability of Feed
Deutsch L, Gräslund S, Folke C, Huitric M, Kautsky N, Troell M, Lebel L. 2007. Feeding aquaculture growth through globalization; exploitation of marine ecosystems for fishmeal. Global Environmental Change. 17(2): 238–249.
Food and Agriculture Organization (FAO). 1995. Code of conduct for responsible fisheries. Rome, Italy, FAO. 41 pp.
FishSource. 2010. [Internet]. San Francisco (CA). Sustainable Fisheries Partnership. [cited 2010 February 15]. Available from: http://www.fishsource.org
Kristofersson D, Anderson J. 2006. Is there a relationship between fisheries and farming? Inter-dependence of fisheries, animal production and aquaculture. Marine Policy. 30(6): 721–725.
Naylor RL, Goldburg RJ, Primavera JH, Kautsky N, Beveridge MCM, Clay J, Folke C, Lubchenco J, Mooney H, Troell M. 2000. Effect of aquaculture on world fish supplies. Nature. 405: 1017–1024.
Naylor RL, Goldburg RJ, Mooney H, Beveridge MCM, Clay J, Folke C, Kautsky N, Lubchenco J, Primavera JH, Williams M. 1998. Nature’s subsidies to shrimp and salmon farming. Science. 282(5390): 883–884.
Tacon A, Metian M. 2008. Global overview on the use of fish meal and fish oil in industrially compounded aquafeeds: Trends and future prospects. Aquaculture. 285(1-4): 146–158.
Industrial energy
Ayer N, Tyedmers P. 2009. Assessing alternative aquaculture technologies: life cycle assessment of salmonid culture systems in Canada. Journal of Cleaner Production. 17(3): 362–373.
Pelletier N, Tyedmers P, Sonesson U, Scholz A, Ziegler F, Flysjo A, Kruse S, Cancino B, Silverman H. 2009. Not all salmon are created equal: life cycle assessment (LCA) of global salmon farming systems. Environment Science and Technology. 43(23): 8730–8736.
114 GAPI Global Aquaculture Performance Index www.gapi.ca
Antibiotics
Burka J, Hammell K, Horsberg T, Johnson G, Rainnie D, Speare D. 1997. Drugs in salmonid aquaculture—a review. Journal of Veterinary Pharmacology and Therapeutics. 20(5): 333–349.
Burridge LE, Weis J, Cabello F, Pizarro J. 2008b. Chemical use in salmon aquaculture: a review of current practices and possible environmental effects. WWF Report. [Internet] [cited 2009 June 11]. 84 pp. Available from: http://www.worldwildlife.org/what/globalmarkets/aquaculture/WWFBinaryitem8842.pdf
Cabello F. 2006. Heavy use of prophylactic antibiotics in aquaculture: a growing problem for human and animal health and for the environment. Environmental Microbiology. 8(7): 1137–1144.
Christensen A, Ingersley F, Baun A. 2006. Ecotoxicity of mixtures of antibiotics use in aquacultures. Environmental Toxicology and Chemistry. 25(8): 2208–2215.
Food and Agriculture Organization (FAO), World Health Organization (WHO), World Organization for Animal Health (WHO). 2008. In: Joint FAO/WHO/OIE Expert Meeting on Critically Important Antimicrobials; 2007 November 26–30; Rome, Italy.
Hektoen H, Berge JA, Hormazabal V, Yndestad M. 1995. Persistence of antibacterial agents in marine sediments. Aquaculture. 133(3–4): 175–184.
Holten Lützhøft H, Halling-Sørensen B, Jørgensen S. 1999. Algal toxicity of antibacterial agents applied in Danish fish farming. Archives of Environment Contamination and Toxicology. 36(1): 1–6.
biochemical oxygen demand
Ackefors H, Enell M. 1990. Discharge of nutrients from Swedish fish farming to adjacent sea areas. Ambio. 19(1): 28–35.
Barg UC. 1992. Guideline for the promotion of management of coastal aquaculture development. FAO Fisheries Technical Paper No. 328. 122 pp.
Boyd C. 2009. Estimating mechanical aeration requirement in shrimp ponds from the oxygen demand of feed. In: Proceedings of the World Aquaculture Society Meeting; 2009 September 25–29; VeraCruz, Mexico.
Google Inc. 2009. Google Earth. (Version 5.1.3533.1731) [Software]. Available from: http://earth.google.com/
Gowen RJ, Weston DP, Ervik A. 1991. Aquaculture and the benthic environment. In: Cowey CB, Cho CY, editors. Nutritional Strategies and Aquaculture Waste. In: Proceedings of the First International Symposium on Nutritional Strategies in Management of Aquaculture Waste (NSMAW), Dept. of Nutritional Science, Univ. of Guelph, Ontario. Pp. 187–206.
Ministry of Agriculture and Lands. 2005. A comparison of B.C.’s current licensing and regulatory requirements with other jurisdictions [Internet]. Victoria (BC); [cited 2009 Nov 9]. 1 p. Available from: http://www.agf.gov.bc.ca/fisheries/Finfish/reg_comparisons.htm
Sarà G. 2007a. A meta-analysis on the ecological effects of aquaculture on the water column: Dissolved nutrients. Marine Environmental Research. 63: 390–408.
Sarà G. 2007b. Ecological effects of aquaculture on living and non-living suspended fractions of the water column: A meta-analysis. Water Research. 41: 3187–3200.
Sarà G, Scilipoti D, Milazzo M, Modica A. 2006. Use of stable isotopes to investigate dispersal of waste from fish farms as a function of hydrodynamics. Marine Ecology Progress Series. 313: 261–270.
Wu RSS. 1995. The environmental impact of marine fish culture: towards a sustainable future. Marine Pollution Bulletin. 31(4–12): 159–166.

115 GAPI Global Aquaculture Performance Index www.gapi.ca
Antifoulants (Copper)
Ahsanullah M, Williams A. 1991. Sublethal effects and bioaccumulation of cadmium, chromium, copper, and zinc in the marine amphipod Allorchestes compressa. Marine Biology. 108(1): 59–65.
Bechmann R. 1994. Use of life tables and LC50 tests to evaluate chronic and acute toxicity effects of copper on the marine copepod Tisbe furcata (Baird). Environmental Toxicology Chemistry. 13(9): 1509–1517.
Braithwaite R, Cadavid Carrascosa M, McEvoy L. 2007. Biofouling of salmon cage netting and the efficacy of a typical copper-based antifoulant. Aquaculture. 262(2-4): 219–226.
Burridge LE, Haya K, Waddy S. 2008. The effects of repeated exposure to azamethiphos on survival and spawning in the American lobster (Homarus americanus). Ecotoxicology and Environmental Safety. 69(3): 411–415.
Chou C, Haya K, Paon L, Burridge L, Moffatt J. 2002. Aquaculture-related trace metals in sediments and lobsters and relevance to environmental monitoring program ratings for near-field effects. Marine Pollution Bulletin. 44(11): 1259–1268.
Fernandez N, Beiras R. 2001. Combined toxicity of dissolved mercury with copper, lead, and cadmium on embryogenesis and early larval growth of the Paracentrotus lividus sea urchin. Ecotoxicology. 10(5): 263–271.
Franklin N, Stauber J, Lim R. 2001. Development of flow cytometry-based algal bioassays for assessing toxicity of copper in natural waters. Environmental Toxicology and Chemistry. 20(1): 160–170.
Webster N, Webb R, Ridd M, Hill R, Negri A. 2001. The effects of copper on the microbial community of a coral reef sponge. Environmental Microbiology. 3(1): 19–29.
Parasiticides
Bright D, Dionne S. 2005. Use of emamectin benzoate in the Canadian finfish aquaculture industry: A review of environmental fate and effects. Prepared for Environment Canada Environmental Protection Branch. 74 pp.
Burridge LE, Haya K, Waddy SL. 2008a. The effect of repeated exposure to azamethiphos on survival and spawning in the American lobster (Homarus americanus). Ecotoxicology and Environmental Safety. 69(3): 411–415.
Burridge LE, Weis J, Cabello F, Pizarro J. 2008b. Chemical use in salmon aquaculture: A review of current practices and possible environmental effects. [Internet]. WWF Report. [cited 2009 June 11]. 84 pp. Available from: www.worldwildlife.org/what/globalmarkets/aquaculture/WWFBinaryitem8842.pdf
Jones M, Sommerville C, Wootten R. 1997. Reduced sensitivity of the salmon louse, Lepeophtheirus salmonis to the organophos-phate dichlorvos. Journal of Fish Diseases. 15: 197–202.
Mayor D, Solan M, Martinez I, Murray L, McMillan H, Paton G, Killham K. 2008. Acute toxicity of some treatments commonly used by the salmonid aquaculture industry to Corophium volutator and Hediste diversicolor: Whole sediment bioassay tests. Aquaculture. 285: 102–108.
Scottish Environmental Protection Agency [SEPA]. 1999. Emamectin benzoate, an environmental assessment. pp 1–23. (cited in Burridge et al. 2008b)
escapes
Araki H, Cooper B, Blouin MS. 2007. Genetic effects of captive breeding cause a rapid, cumulative fitness decline in the wild. Science. 318 (5847): 100–103.
Copp G, Vilizzi L, Cooper D, South A. 2007. MFISK: Marine Fish Invasiveness Scoring Kit. [Internet]. Lowestoft (Suffolk): Cefas Salmon & Freshwater Fisheries Team [cited 2009 September 19]. Available from: http://www.cefas.co.uk/projects/risks-and-impacts-of-non-native-species/decision-support-tools.aspx
Costa-Pierce BA. 2002. Ecology as the paradigm for the future of aquaculture. In: Costa-Pierce BA, editor. Ecological aquaculture: The evolution of the blue revolution. Malden (MA): Blackwell Science. pp. 339–372.
116 GAPI Global Aquaculture Performance Index www.gapi.ca
Fisheries and Agriculture Organization (FAO). 1995. Code of Conduct for Responsible Fisheries. Food and Organization of the United Nations, Rome, Italy. 41 pp.
International Council for the Exploration of the Sea (ICES). 2005. Code of Practice on the Introductions and Transfers of Marine Organisms. ICES Co-operative Research Report. 30 pp.
Naylor RL, Hindar K, Fleming IA, Goldburg R, Williams S, Volpe J, Whoriskey F, Eagle J, Mangel M. 2005. Fugitive salmon: assessing the risks of escaped fish from net-pen aquaculture. Bioscience. 55 (5): 427–437.
Pullin R, Sumaila U. 2005. Aquaculture. In: Kooiman J, Bavinck M, Jentoft S, Pullin R, editors. Fish for life: interactive governance for fisheries. Amsterdam: Amsterdam University Press. pp. 93–108.
Pathogens
Christensen, V, Walters C. 2004. Ecopath with Ecosim: methods, capabilities and limitations. Ecological Modelling. 172: 109–139.
Christensen V, Walters C, Ahrens R, Alder J, Buszowski J, Christensen LB, Cheung WWL, Dunne J, Froese R, Karpouzi V, et al. 2009. Database-driven models of the world’s large marine ecosystems. Ecological Modelling. 220: 1984–1996.
Collins JD, Wall P. 2004. Food safety and animal production systems: controlling zoonoses at farm level. Revue Scientifique et Technique. 23(2): 685–700.
Environment News Service (ENS). 2005. Norwegian fish farm escapees place wild salmon at risk. [Internet] [cited 2009 June 29]. Available from: http://www.ens-newswire.com/ens/may2005/2005-05-12–02.asp
Fisheries and Oceans Canada (DFO). 2006. State-of-knowledge presentation for the special committee on sustainable aquaculture of the British Columbia Legislature. [Internet]. Vancouver (BC) [cited 2009 Jun 29]. Available from: http://www.dfo-mpo.gc.ca/Library/327248.pdf
Johnsen B, Jensen A. 1991. The Gyrodactylus story in Norway. Aquaculture. 98(1-3): 289–302.
Krkosek M, Ford J, Morton A, Lele S, Myers R, Lewis M. 2007. Declining wild salmon populations in relation to parasites from farm salmon. Science. 318(5,857): 1772–1775.
McVicar A. 1997. Disease and parasite implications of the coexistence of wild and cultured Atlantic salmon populations. ICES Journal of Marine Science. 54(6): 1093–1103.
Phillip A. 2009. Salmon disease confirmed at third Scottish fish farm. The Scotsman. [modified 2009 20 March; cited 2009 June 29]. Available from: http://thescotsman.scotsman.com/nature/Salmon-disease-confirmed-at-third.5095298.jp


Seafood Ecology Research Group
School of Environmental StudiesUniversity of VictoriaPO Box 3060 STN CSCVictoria, BC, V8W 3R4Canada
Printed on stock made with an average of 100% de-inked recycled fiber and an average of 50% post-consumer waste, which is processed chlorine free and designated Ancient Forest Friendly™ using EcoSmart™ certified inks.
Paper manufactured using electricity that is offset with Green-e® certified renewable energy certificates and printed using Clean Currents (wind power) by an EPA Green Power partner.