Embed Size (px)
Citation preview
Data Collection Survey on the Comprehensive Transport Plan
between Dhaka and Chittagong
Final Report
November 2017
JAPAN INTERNATIONAL COOPERATION AGENCY
PADECO Co., Ltd.

The exchange rates applied in this study are;
USD1.0 = BDT80.0 (November, 2017) BDT: Bangladesh TAKA
Data Collection Survey on the Comprehensive Transport Plan between Dhaka and Chittagong Final Report
i
Executive Summary
Background and Objectives Dhaka and Chittagong are the two largest cities in Bangladesh, accounting for 13% of the national population and 50% of gross domestic product (GDP). Strengthening the linkages between the two cities (250 km by road, 320 km by rail, and 300 km by waterway) by infrastructure development is essential for the national economic growth. The objectives of the Survey are as follows:
To review ongoing/planned transport projects and urban development plans for strengthening major intercity (mainly between Dhaka and Chittagong) and regional cross-border transport networks in Bangladesh;
To analyze transport demand that would result from future economic growth; and
To examine project plans for unleashing the development potential along the Dhaka–Chittagong corridor by means of enhancing multimodal transport including rail, inland water, and road.
Current Situation of Transport Development Transport and Related Infrastructure Road In 2009, the Roads and Highways Department (RHD) prepared the Bangladesh Road Master Plan to guide road sector investment over the 20 years. Nevertheless, RHD in collaboration with LGED is planning to update the road master plan due to various changes of the existing master plan scenario, including the recent government promotion of developing economic zones and the increasing importance of regional connectivity, road maintenance, and traffic safety. There are two overlapped expressway projects for the Dhaka–Chittagong corridor. One is the Dhaka–Chittagong Expressway proposed by RHD, and its F/S was done as of October 2017, while the other is the Dhaka–Chittagong Multimodal Transport Corridor proposed by Bangladesh Bridges Authority (BBA), and its EOI has been called as of October 2017. Another major projects under implementation are the Kanchpur, Meghna, and Gumti 2nd Bridge Construction and Exiting Bridge Rehabilitation Project (I) (II). Rail In 2013, the Bangladesh Railway (BR) prepared the Railway Master Plan with the support of the UK Department for International Development (DFID). The master plan proposes a total of 235 projects costing Taka 23 billion ($30 billion) over the 2010–2030 period. BR has been undertaking the activities under the ADB-funded SASEC Railway Connectivity Investment Program including the updating the existing master plan. The revised master plan looks at the next 30 years until 2045. There are two overlapped high-speed railway projects for the Dhaka–Chittagong corridor, one proposed by BR and the other by BBA Inland Water Developments There are various development plans and projects. Seventh Five Year Plan was prepared over the 2016-2020 period, covering the development of Inland Water Transport. Annual Development Program was also prepared over the 2016–2017 period and includes various development projects. There is also Inland Water Transport Master Plan studied in 2009. The World Bank conducted their study in 2016 and formulated the Bangladesh Regional Inland Water Transport Project 1.
Data Collection Survey on the Comprehensive Transport Plan between Dhaka and Chittagong Final Report
ii
Summary of Major Issues Road
Lack of integrated planning and coordination among relevant agencies Insufficient road capacity and traffic congestion Lack of a transport hierarchy and connectivity Inadequate maintenance of damaged roads and bridges Low level of road safety, prevalent vehicle overloading, and inadequate traffic
management Rail
Insufficient rail track and structure Insufficient capacity of ICD and rolling stock. Operational inefficiency
Inland Water
Shortening of navigable route length Inadequate river ports and jetties Shortage of facilities and services for international trade Management of increasingly large vessels Inadequate container transport Lack of navigational aids Deficient access road to river ports
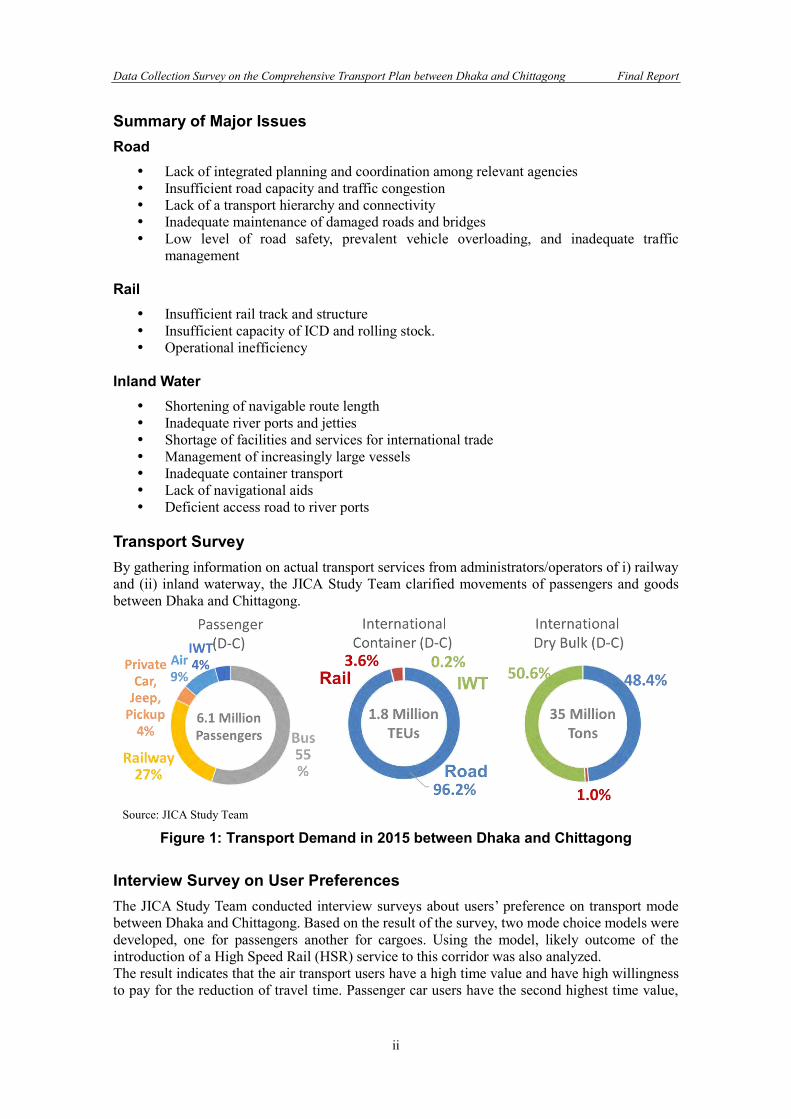
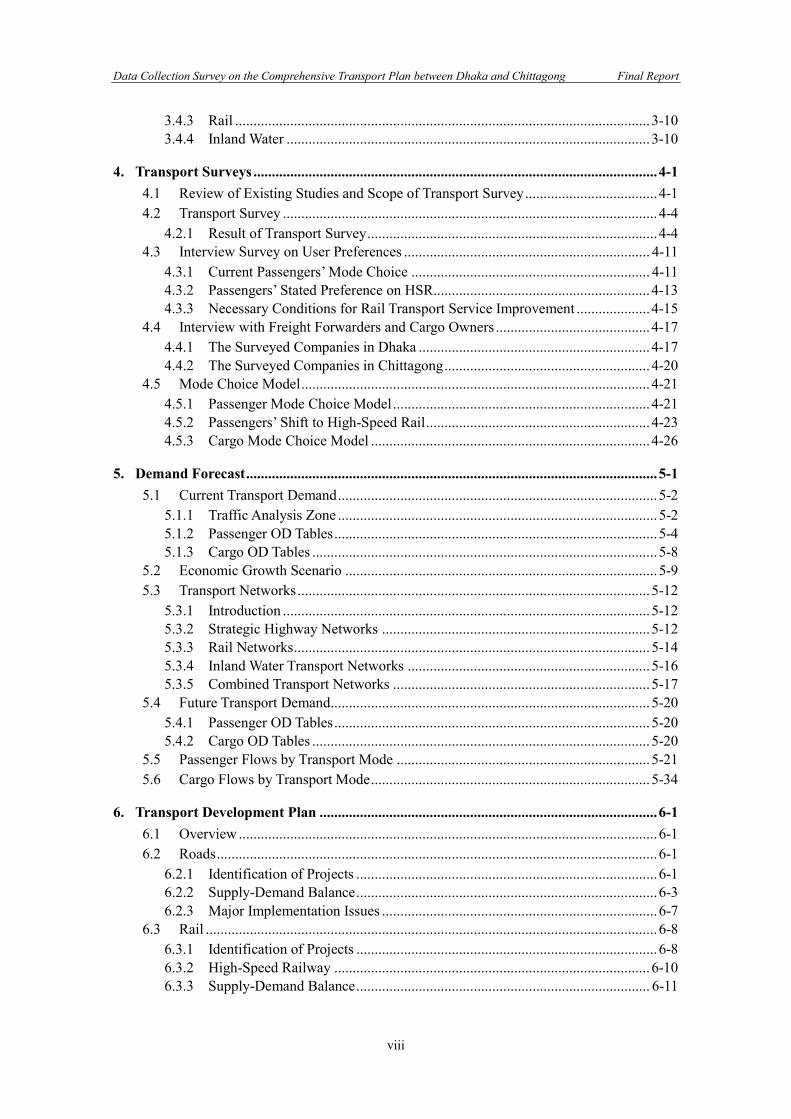
Transport Survey By gathering information on actual transport services from administrators/operators of i) railway and (ii) inland waterway, the JICA Study Team clarified movements of passengers and goods between Dhaka and Chittagong.
Source: JICA Study Team
Figure 1: Transport Demand in 2015 between Dhaka and Chittagong Interview Survey on User Preferences The JICA Study Team conducted interview surveys about users’ preference on transport mode between Dhaka and Chittagong. Based on the result of the survey, two mode choice models were developed, one for passengers another for cargoes. Using the model, likely outcome of the introduction of a High Speed Rail (HSR) service to this corridor was also analyzed. The result indicates that the air transport users have a high time value and have high willingness to pay for the reduction of travel time. Passenger car users have the second highest time value,
Data Collection Survey on the Comprehensive Transport Plan between Dhaka and Chittagong Final Report
iii
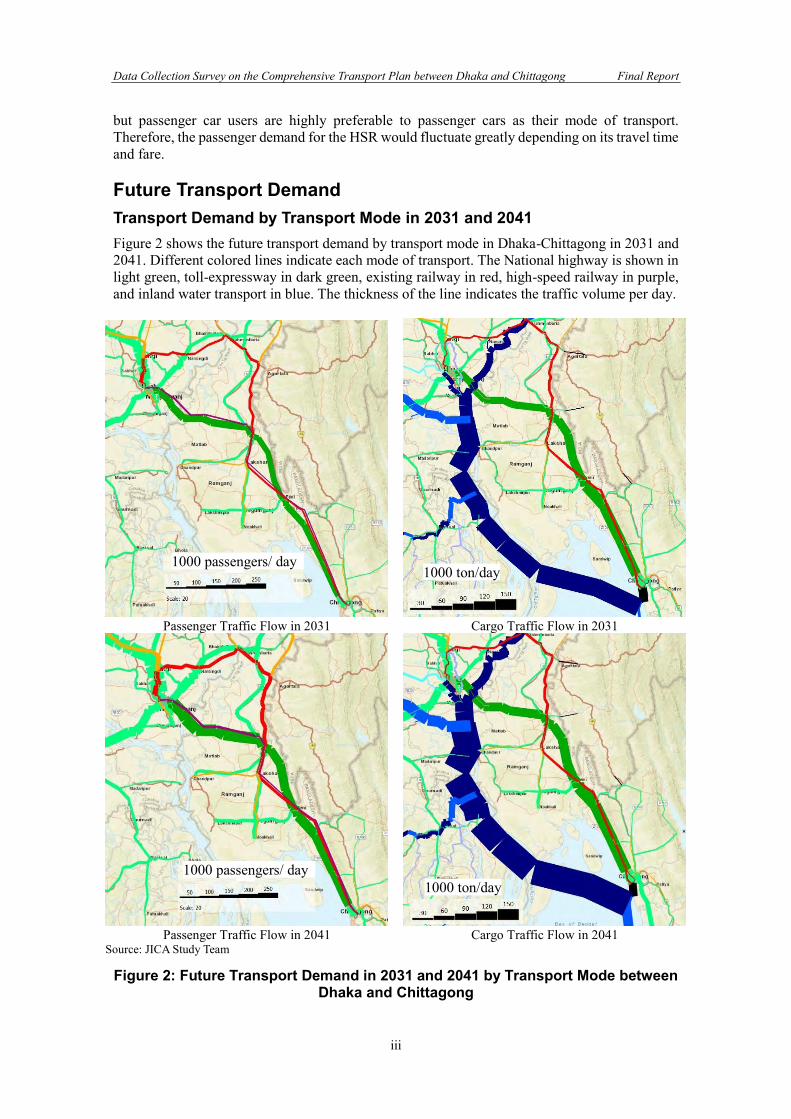
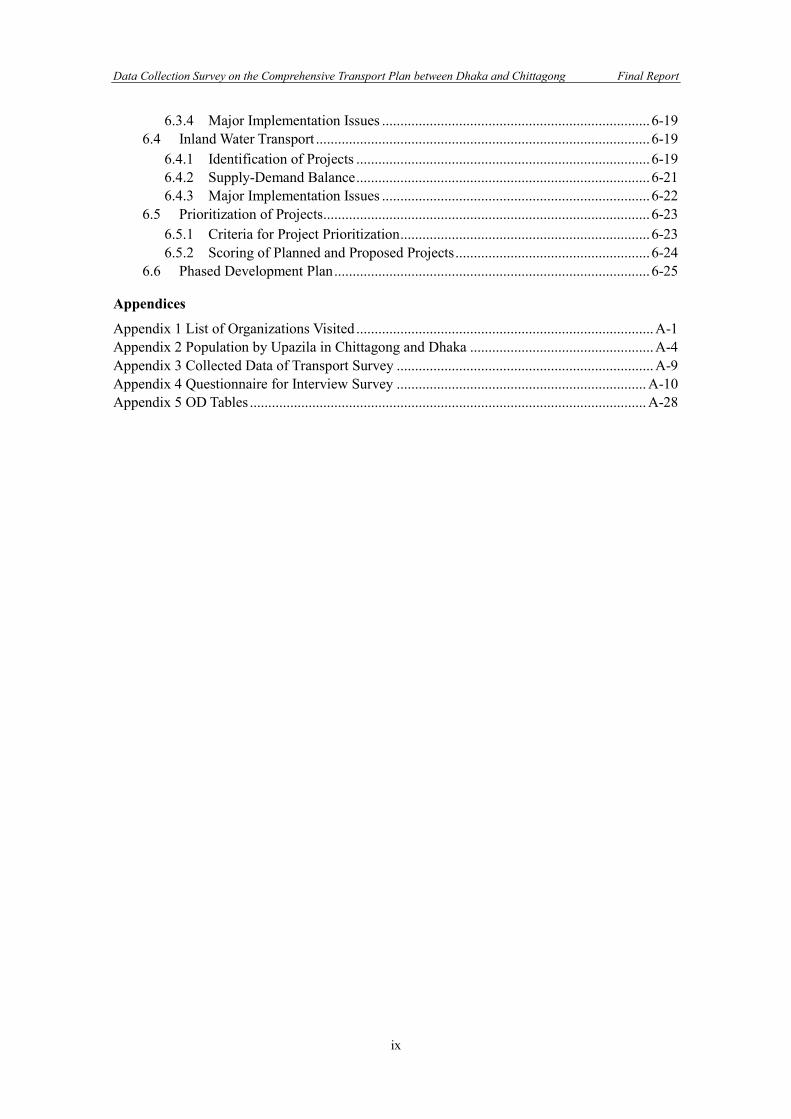
but passenger car users are highly preferable to passenger cars as their mode of transport. Therefore, the passenger demand for the HSR would fluctuate greatly depending on its travel time and fare. Future Transport Demand Transport Demand by Transport Mode in 2031 and 2041 Figure 2 shows the future transport demand by transport mode in Dhaka-Chittagong in 2031 and 2041. Different colored lines indicate each mode of transport. The National highway is shown in light green, toll-expressway in dark green, existing railway in red, high-speed railway in purple, and inland water transport in blue. The thickness of the line indicates the traffic volume per day.
Passenger Traffic Flow in 2031 Cargo Traffic Flow in 2031
Passenger Traffic Flow in 2041 Cargo Traffic Flow in 2041
Source: JICA Study Team
Figure 2: Future Transport Demand in 2031 and 2041 by Transport Mode between Dhaka and Chittagong
1000 passengers/ day /日
1000 ton/day
1000 ton/day
1000 passengers/ day /日
Data Collection Survey on the Comprehensive Transport Plan between Dhaka and Chittagong Final Report
iv
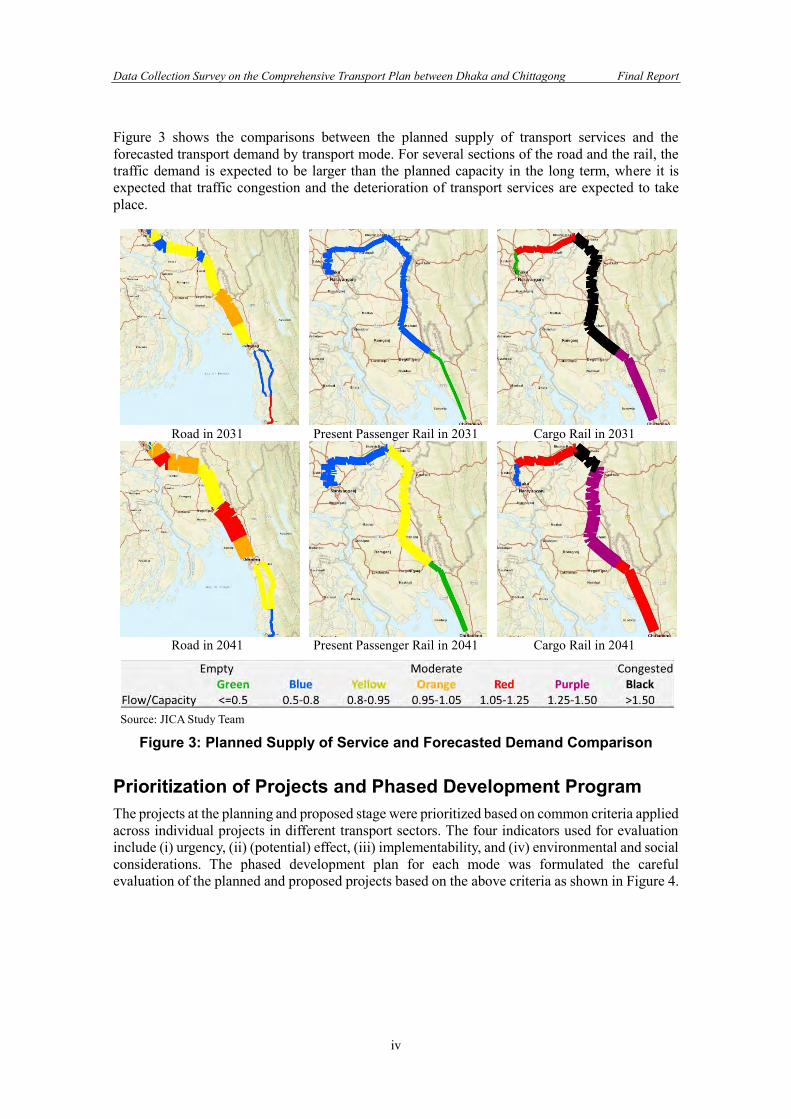
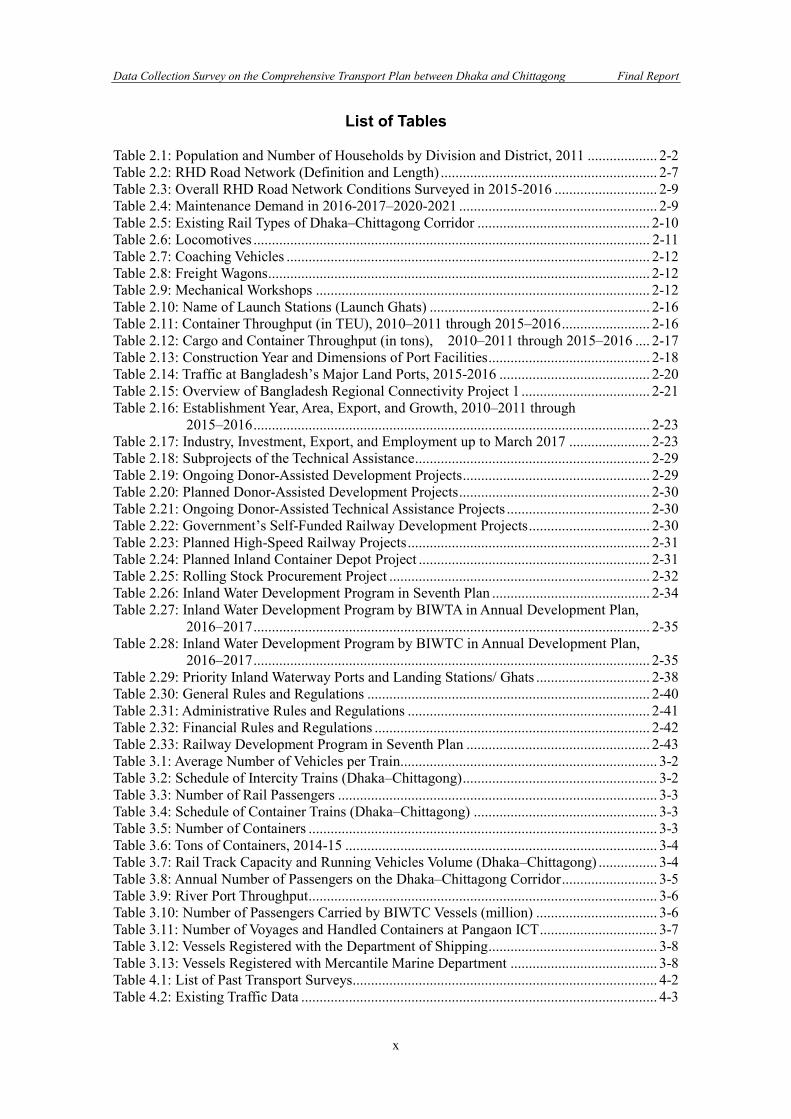
Figure 3 shows the comparisons between the planned supply of transport services and the forecasted transport demand by transport mode. For several sections of the road and the rail, the traffic demand is expected to be larger than the planned capacity in the long term, where it is expected that traffic congestion and the deterioration of transport services are expected to take place.
Road in 2031 Present Passenger Rail in 2031 Cargo Rail in 2031
Road in 2041 Present Passenger Rail in 2041 Cargo Rail in 2041
Source: JICA Study Team
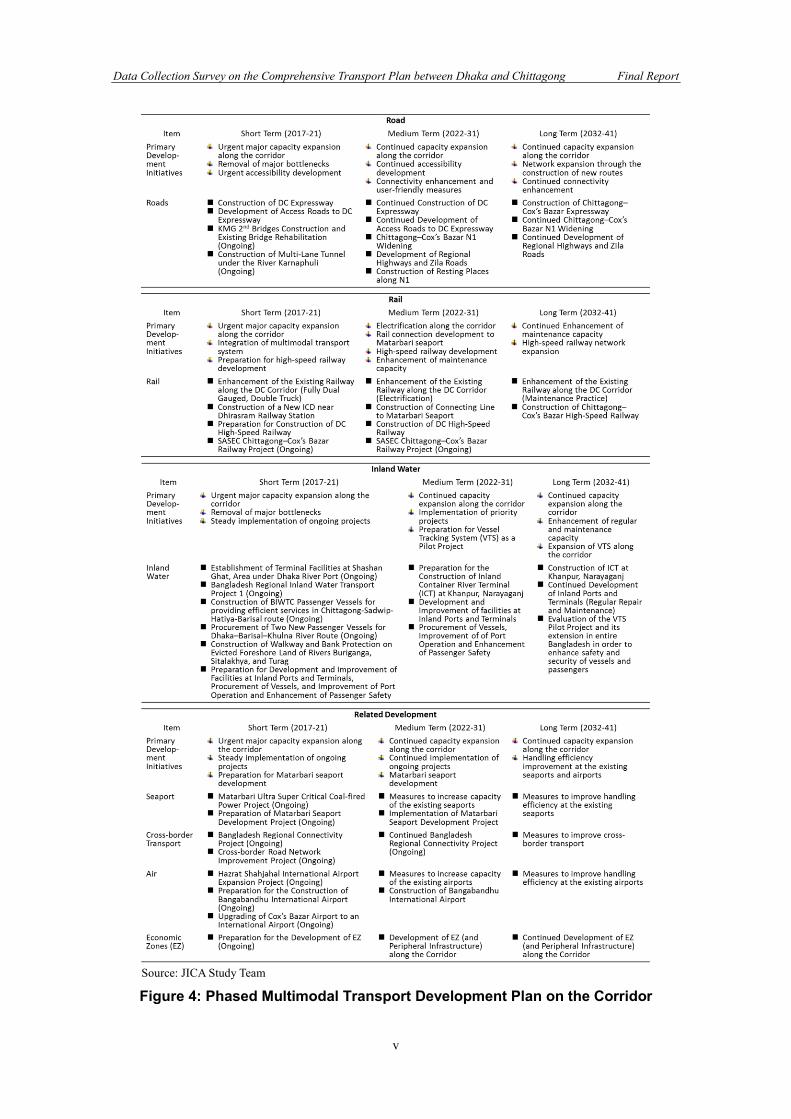
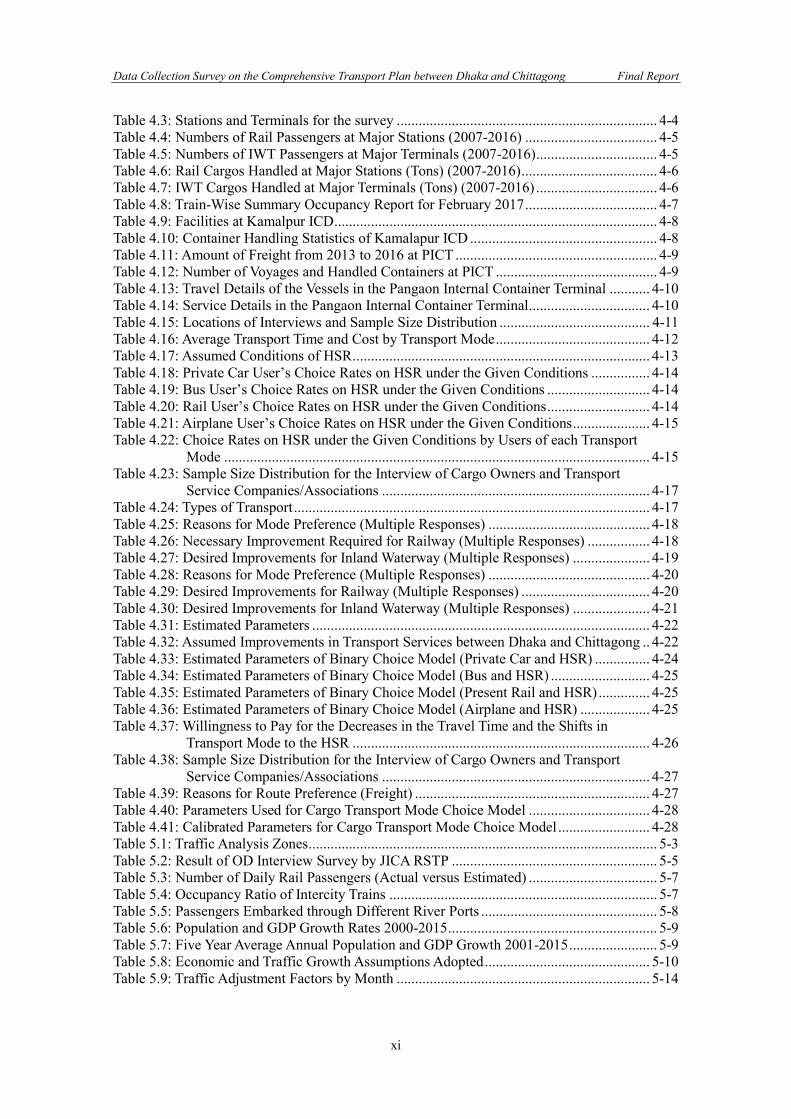
Figure 3: Planned Supply of Service and Forecasted Demand Comparison Prioritization of Projects and Phased Development Program The projects at the planning and proposed stage were prioritized based on common criteria applied across individual projects in different transport sectors. The four indicators used for evaluation include (i) urgency, (ii) (potential) effect, (iii) implementability, and (iv) environmental and social considerations. The phased development plan for each mode was formulated the careful evaluation of the planned and proposed projects based on the above criteria as shown in Figure 4.
Data Collection Survey on the Comprehensive Transport Plan between Dhaka and Chittagong Final Report
v
Source: JICA Study Team
Figure 4: Phased Multimodal Transport Development Plan on the Corridor

Data Collection Survey on the Comprehensive Transport Plan between Dhaka and Chittagong Final Report
vii
Contents
Executive Summary ..................................................................................................................... i
1. Introduction ........................................................................................................................ 1-1
1.1 Background .............................................................................................................. 1-1
1.2 Objectives ................................................................................................................. 1-1
1.3 Survey Area .............................................................................................................. 1-2
1.4 Survey Tasks............................................................................................................. 1-2
2. Overview of Transport Development in Dhaka–Chittagong Region and Related Areas ...................................................................................................................... 2-1
2.1 Socio-Economic Conditions ..................................................................................... 2-1
2.1.1 Population......................................................................................................... 2-1
2.1.2 Economy........................................................................................................... 2-3
2.1.3 International Trade ........................................................................................... 2-4
2.2 Transport and Related Infrastructure ........................................................................ 2-7
2.2.1 Roads ................................................................................................................ 2-7
2.2.2 Rail ................................................................................................................... 2-9
2.2.3 Inland Water ................................................................................................... 2-14
2.2.4 Seaport, Cross-border Transport, Air ............................................................. 2-16
2.2.5 Export Processing Zones, Economic Zones ................................................... 2-22
2.3 Development Plans and Projects ............................................................................ 2-25
2.3.1 Road Developments ....................................................................................... 2-25
2.3.2 Rail Developments ......................................................................................... 2-28
2.3.3 Inland Water Developments ........................................................................... 2-34
2.4 Related Laws and Regulations ............................................................................... 2-39
2.4.1 Roads .............................................................................................................. 2-39
2.4.2 Rail ................................................................................................................. 2-42
2.4.3 Inland Water ................................................................................................... 2-44
2.5 Summary of Major Issues ...................................................................................... 2-47
2.5.1 Roads .............................................................................................................. 2-47
2.5.2 Rail ................................................................................................................. 2-49
2.5.3 Inland Water ................................................................................................... 2-50
3. Transport Services .............................................................................................................. 3-1
3.1 Roads ........................................................................................................................ 3-1
3.1.1 BRTA ................................................................................................................ 3-1
3.1.2 Bus Services ..................................................................................................... 3-1
3.2 Rail ........................................................................................................................... 3-2
3.2.1 Bangladesh Railway ......................................................................................... 3-2
3.3 Inland Water ............................................................................................................. 3-4
3.3.1 BIWTA ............................................................................................................. 3-4
3.3.2 BIWTC ............................................................................................................. 3-6
3.4 Issues in Transport Services ..................................................................................... 3-8
3.4.1 Overview .......................................................................................................... 3-8
3.4.2 Roads ................................................................................................................ 3-9
Data Collection Survey on the Comprehensive Transport Plan between Dhaka and Chittagong Final Report
viii
3.4.3 Rail ................................................................................................................. 3-10
3.4.4 Inland Water ................................................................................................... 3-10
4. Transport Surveys .............................................................................................................. 4-1
4.1 Review of Existing Studies and Scope of Transport Survey .................................... 4-1
4.2 Transport Survey ...................................................................................................... 4-4
4.2.1 Result of Transport Survey ............................................................................... 4-4
4.3 Interview Survey on User Preferences ................................................................... 4-11
4.3.1 Current Passengers’ Mode Choice ................................................................. 4-11
4.3.2 Passengers’ Stated Preference on HSR ........................................................... 4-13
4.3.3 Necessary Conditions for Rail Transport Service Improvement .................... 4-15
4.4 Interview with Freight Forwarders and Cargo Owners .......................................... 4-17
4.4.1 The Surveyed Companies in Dhaka ............................................................... 4-17
4.4.2 The Surveyed Companies in Chittagong ........................................................ 4-20
4.5 Mode Choice Model ............................................................................................... 4-21
4.5.1 Passenger Mode Choice Model ...................................................................... 4-21
4.5.2 Passengers’ Shift to High-Speed Rail ............................................................. 4-23
4.5.3 Cargo Mode Choice Model ............................................................................ 4-26
5. Demand Forecast ................................................................................................................ 5-1
5.1 Current Transport Demand ....................................................................................... 5-2
5.1.1 Traffic Analysis Zone ....................................................................................... 5-2
5.1.2 Passenger OD Tables ........................................................................................ 5-4
5.1.3 Cargo OD Tables .............................................................................................. 5-8
5.2 Economic Growth Scenario ..................................................................................... 5-9
5.3 Transport Networks ................................................................................................ 5-12
5.3.1 Introduction .................................................................................................... 5-12
5.3.2 Strategic Highway Networks ......................................................................... 5-12
5.3.3 Rail Networks ................................................................................................. 5-14
5.3.4 Inland Water Transport Networks .................................................................. 5-16
5.3.5 Combined Transport Networks ...................................................................... 5-17
5.4 Future Transport Demand ....................................................................................... 5-20
5.4.1 Passenger OD Tables ...................................................................................... 5-20
5.4.2 Cargo OD Tables ............................................................................................ 5-20
5.5 Passenger Flows by Transport Mode ..................................................................... 5-21
5.6 Cargo Flows by Transport Mode ............................................................................ 5-34
6. Transport Development Plan ............................................................................................ 6-1
6.1 Overview .................................................................................................................. 6-1
6.2 Roads ........................................................................................................................ 6-1
6.2.1 Identification of Projects .................................................................................. 6-1
6.2.2 Supply-Demand Balance .................................................................................. 6-3
6.2.3 Major Implementation Issues ........................................................................... 6-7
6.3 Rail ........................................................................................................................... 6-8
6.3.1 Identification of Projects .................................................................................. 6-8
6.3.2 High-Speed Railway ...................................................................................... 6-10
6.3.3 Supply-Demand Balance ................................................................................ 6-11
Data Collection Survey on the Comprehensive Transport Plan between Dhaka and Chittagong Final Report
ix
6.3.4 Major Implementation Issues ......................................................................... 6-19
6.4 Inland Water Transport ........................................................................................... 6-19
6.4.1 Identification of Projects ................................................................................ 6-19
6.4.2 Supply-Demand Balance ................................................................................ 6-21
6.4.3 Major Implementation Issues ......................................................................... 6-22
6.5 Prioritization of Projects ......................................................................................... 6-23
6.5.1 Criteria for Project Prioritization .................................................................... 6-23
6.5.2 Scoring of Planned and Proposed Projects ..................................................... 6-24
6.6 Phased Development Plan ...................................................................................... 6-25
Appendices
Appendix 1 List of Organizations Visited ................................................................................. A-1
Appendix 2 Population by Upazila in Chittagong and Dhaka .................................................. A-4
Appendix 3 Collected Data of Transport Survey ...................................................................... A-9
Appendix 4 Questionnaire for Interview Survey .................................................................... A-10
Appendix 5 OD Tables ............................................................................................................ A-28
Data Collection Survey on the Comprehensive Transport Plan between Dhaka and Chittagong Final Report
x
List of Tables Table 2.1: Population and Number of Households by Division and District, 2011 ................... 2-2
Table 2.2: RHD Road Network (Definition and Length) ........................................................... 2-7
Table 2.3: Overall RHD Road Network Conditions Surveyed in 2015-2016 ............................ 2-9
Table 2.4: Maintenance Demand in 2016-2017–2020-2021 ...................................................... 2-9
Table 2.5: Existing Rail Types of Dhaka–Chittagong Corridor ............................................... 2-10
Table 2.6: Locomotives ............................................................................................................ 2-11
Table 2.7: Coaching Vehicles ................................................................................................... 2-12
Table 2.8: Freight Wagons ........................................................................................................ 2-12
Table 2.9: Mechanical Workshops ........................................................................................... 2-12
Table 2.10: Name of Launch Stations (Launch Ghats) ............................................................ 2-16
Table 2.11: Container Throughput (in TEU), 2010–2011 through 2015–2016 ........................ 2-16
Table 2.12: Cargo and Container Throughput (in tons), 2010–2011 through 2015–2016 .... 2-17
Table 2.13: Construction Year and Dimensions of Port Facilities ............................................ 2-18
Table 2.14: Traffic at Bangladesh’s Major Land Ports, 2015-2016 ......................................... 2-20
Table 2.15: Overview of Bangladesh Regional Connectivity Project 1 ................................... 2-21
Table 2.16: Establishment Year, Area, Export, and Growth, 2010–2011 through 2015–2016 ............................................................................................................ 2-23
Table 2.17: Industry, Investment, Export, and Employment up to March 2017 ...................... 2-23
Table 2.18: Subprojects of the Technical Assistance ................................................................ 2-29
Table 2.19: Ongoing Donor-Assisted Development Projects ................................................... 2-29
Table 2.20: Planned Donor-Assisted Development Projects .................................................... 2-30
Table 2.21: Ongoing Donor-Assisted Technical Assistance Projects ....................................... 2-30
Table 2.22: Government’s Self-Funded Railway Development Projects ................................. 2-30
Table 2.23: Planned High-Speed Railway Projects .................................................................. 2-31
Table 2.24: Planned Inland Container Depot Project ............................................................... 2-31
Table 2.25: Rolling Stock Procurement Project ....................................................................... 2-32
Table 2.26: Inland Water Development Program in Seventh Plan ........................................... 2-34
Table 2.27: Inland Water Development Program by BIWTA in Annual Development Plan, 2016–2017 ............................................................................................................ 2-35
Table 2.28: Inland Water Development Program by BIWTC in Annual Development Plan, 2016–2017 ............................................................................................................ 2-35
Table 2.29: Priority Inland Waterway Ports and Landing Stations/ Ghats ............................... 2-38
Table 2.30: General Rules and Regulations ............................................................................. 2-40
Table 2.31: Administrative Rules and Regulations .................................................................. 2-41
Table 2.32: Financial Rules and Regulations ........................................................................... 2-42
Table 2.33: Railway Development Program in Seventh Plan .................................................. 2-43
Table 3.1: Average Number of Vehicles per Train...................................................................... 3-2
Table 3.2: Schedule of Intercity Trains (Dhaka–Chittagong) ..................................................... 3-2
Table 3.3: Number of Rail Passengers ....................................................................................... 3-3
Table 3.4: Schedule of Container Trains (Dhaka–Chittagong) .................................................. 3-3
Table 3.5: Number of Containers ............................................................................................... 3-3
Table 3.6: Tons of Containers, 2014-15 ..................................................................................... 3-4
Table 3.7: Rail Track Capacity and Running Vehicles Volume (Dhaka–Chittagong) ................ 3-4
Table 3.8: Annual Number of Passengers on the Dhaka–Chittagong Corridor .......................... 3-5
Table 3.9: River Port Throughput ............................................................................................... 3-6
Table 3.10: Number of Passengers Carried by BIWTC Vessels (million) ................................. 3-6
Table 3.11: Number of Voyages and Handled Containers at Pangaon ICT ................................ 3-7
Table 3.12: Vessels Registered with the Department of Shipping .............................................. 3-8
Table 3.13: Vessels Registered with Mercantile Marine Department ........................................ 3-8
Table 4.1: List of Past Transport Surveys................................................................................... 4-2
Table 4.2: Existing Traffic Data ................................................................................................. 4-3
Data Collection Survey on the Comprehensive Transport Plan between Dhaka and Chittagong Final Report
xi
Table 4.3: Stations and Terminals for the survey ....................................................................... 4-4
Table 4.4: Numbers of Rail Passengers at Major Stations (2007-2016) .................................... 4-5
Table 4.5: Numbers of IWT Passengers at Major Terminals (2007-2016) ................................. 4-5
Table 4.6: Rail Cargos Handled at Major Stations (Tons) (2007-2016) ..................................... 4-6
Table 4.7: IWT Cargos Handled at Major Terminals (Tons) (2007-2016) ................................. 4-6
Table 4.8: Train-Wise Summary Occupancy Report for February 2017 .................................... 4-7
Table 4.9: Facilities at Kamalpur ICD ........................................................................................ 4-8
Table 4.10: Container Handling Statistics of Kamalapur ICD ................................................... 4-8
Table 4.11: Amount of Freight from 2013 to 2016 at PICT ....................................................... 4-9
Table 4.12: Number of Voyages and Handled Containers at PICT ............................................ 4-9
Table 4.13: Travel Details of the Vessels in the Pangaon Internal Container Terminal ........... 4-10
Table 4.14: Service Details in the Pangaon Internal Container Terminal ................................. 4-10
Table 4.15: Locations of Interviews and Sample Size Distribution ......................................... 4-11
Table 4.16: Average Transport Time and Cost by Transport Mode .......................................... 4-12
Table 4.17: Assumed Conditions of HSR ................................................................................. 4-13
Table 4.18: Private Car User’s Choice Rates on HSR under the Given Conditions ................ 4-14
Table 4.19: Bus User’s Choice Rates on HSR under the Given Conditions ............................ 4-14
Table 4.20: Rail User’s Choice Rates on HSR under the Given Conditions ............................ 4-14
Table 4.21: Airplane User’s Choice Rates on HSR under the Given Conditions ..................... 4-15
Table 4.22: Choice Rates on HSR under the Given Conditions by Users of each Transport Mode .................................................................................................................... 4-15
Table 4.23: Sample Size Distribution for the Interview of Cargo Owners and Transport Service Companies/Associations ......................................................................... 4-17
Table 4.24: Types of Transport ................................................................................................. 4-17
Table 4.25: Reasons for Mode Preference (Multiple Responses) ............................................ 4-18
Table 4.26: Necessary Improvement Required for Railway (Multiple Responses) ................. 4-18
Table 4.27: Desired Improvements for Inland Waterway (Multiple Responses) ..................... 4-19
Table 4.28: Reasons for Mode Preference (Multiple Responses) ............................................ 4-20
Table 4.29: Desired Improvements for Railway (Multiple Responses) ................................... 4-20
Table 4.30: Desired Improvements for Inland Waterway (Multiple Responses) ..................... 4-21
Table 4.31: Estimated Parameters ............................................................................................ 4-22
Table 4.32: Assumed Improvements in Transport Services between Dhaka and Chittagong .. 4-22
Table 4.33: Estimated Parameters of Binary Choice Model (Private Car and HSR) ............... 4-24
Table 4.34: Estimated Parameters of Binary Choice Model (Bus and HSR) ........................... 4-25
Table 4.35: Estimated Parameters of Binary Choice Model (Present Rail and HSR) .............. 4-25
Table 4.36: Estimated Parameters of Binary Choice Model (Airplane and HSR) ................... 4-25
Table 4.37: Willingness to Pay for the Decreases in the Travel Time and the Shifts in Transport Mode to the HSR ................................................................................. 4-26
Table 4.38: Sample Size Distribution for the Interview of Cargo Owners and Transport Service Companies/Associations ......................................................................... 4-27
Table 4.39: Reasons for Route Preference (Freight) ................................................................ 4-27
Table 4.40: Parameters Used for Cargo Transport Mode Choice Model ................................. 4-28
Table 4.41: Calibrated Parameters for Cargo Transport Mode Choice Model ......................... 4-28
Table 5.1: Traffic Analysis Zones ............................................................................................... 5-3
Table 5.2: Result of OD Interview Survey by JICA RSTP ........................................................ 5-5
Table 5.3: Number of Daily Rail Passengers (Actual versus Estimated) ................................... 5-7
Table 5.4: Occupancy Ratio of Intercity Trains ......................................................................... 5-7
Table 5.5: Passengers Embarked through Different River Ports ................................................ 5-8
Table 5.6: Population and GDP Growth Rates 2000-2015 ......................................................... 5-9
Table 5.7: Five Year Average Annual Population and GDP Growth 2001-2015 ........................ 5-9
Table 5.8: Economic and Traffic Growth Assumptions Adopted ............................................. 5-10
Table 5.9: Traffic Adjustment Factors by Month ..................................................................... 5-14
Data Collection Survey on the Comprehensive Transport Plan between Dhaka and Chittagong Final Report
xii
Table 5.10: Assumed Daily Train Schedule (non-HSR, Both Directions, Both Passenger and Cargo) ............................................................................................................ 5-16
Table 5.11: Inputs to Passenger Cargo Mode Choice Model ................................................... 5-20
Table 5.12: Estimated Container Volume Handled at Each Port (TEU) ................................... 5-20
Table 5.13: Dry Bulk Cargos Traffic Potential (Million Ton) .................................................. 5-20
Table 5.14: Crossing-Border International Cargo Volumes (Million Ton) ............................... 5-21
Table 6.1: Identified Road Infrastructure Projects ..................................................................... 6-2
Table 6.2: Identified Rail Infrastructure Projects ....................................................................... 6-9
Table 6.3: High-Speed + Viaduct (Option 1)............................................................................ 6-10
Table 6.4: High-Speed + Embankment (Option 2) ................................................................... 6-10
Table 6.5: Semi High-Speed + Whole Construction (Option 3) .............................................. 6-11
Table 6.6: Semi High-Speed + Partial Construction (Option 4) ............................................... 6-11
Table 6.7: Planned Capacity Expansions of Rail Service for Each Sections (Train Services per Day) ................................................................................................................ 6-15
Table 6.8: Identified Inland Water Infrastructure Projects ....................................................... 6-20
Table 6.9: Expected Capacity of Private ICTs (TEU) .............................................................. 6-21
Table 6.10: Evaluation Criteria for Project Prioritization ........................................................ 6-23
Table 6.11: Scoring of Planned and Proposed Roads Infrastructure Projects .......................... 6-24
Table 6.12: Scoring of Planned and Proposed Rail Infrastructure Projects.............................. 6-24
Table 6.13: Scoring of Planned and Proposed Inland Water Infrastructure Projects ................ 6-25
Table 6.14: Phased Multimodal Transport Development Plan on the Dhaka–Chittagong Corridor ................................................................................................................ 6-26
Data Collection Survey on the Comprehensive Transport Plan between Dhaka and Chittagong Final Report
xiii
List of Figures Figure 1.1: Survey Flow and Schedule ...................................................................................... 1-2
Figure 2.1: Bangladesh Urban and Rural Population 2000-2015............................................... 2-1
Figure 2.2: Bangladesh GDP and GDP per Capita, 2000–2015 ................................................. 2-3
Figure 2.3: Bangladesh GDP per capita Growth, 2000–2015 .................................................... 2-4
Figure 2.4: Bangladesh Imports, 2000–2015 ............................................................................. 2-4
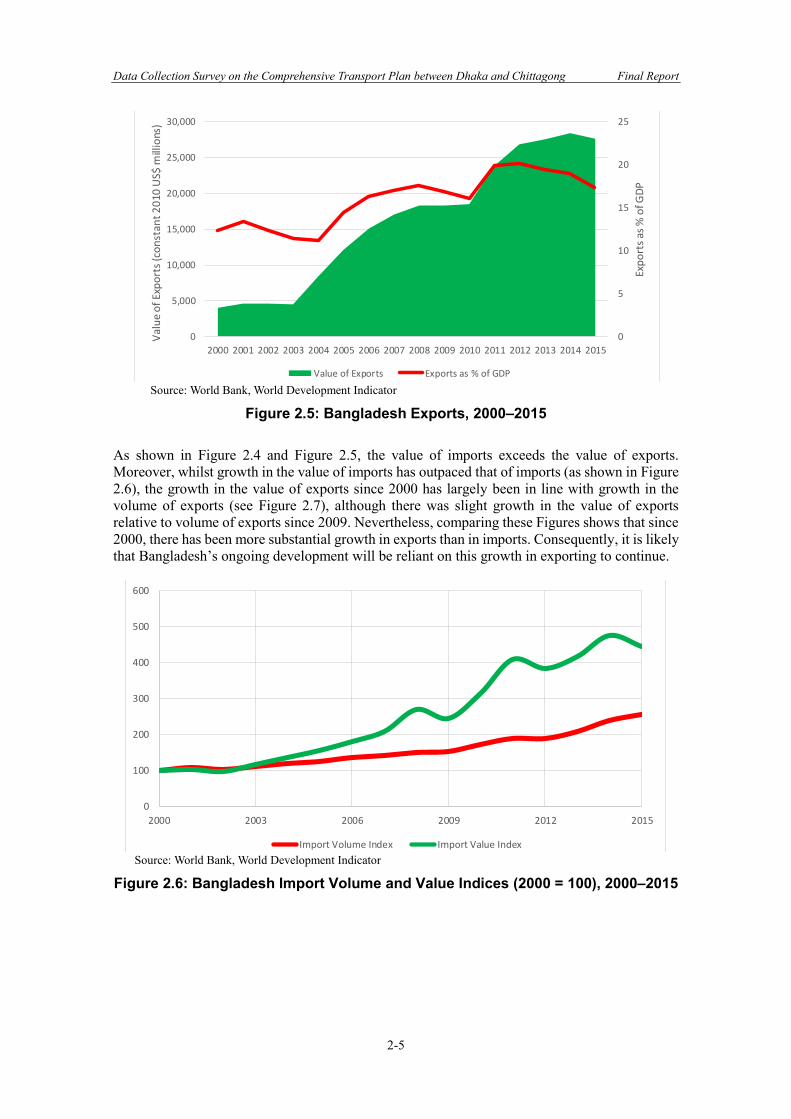
Figure 2.5: Bangladesh Exports, 2000–2015 ............................................................................. 2-5
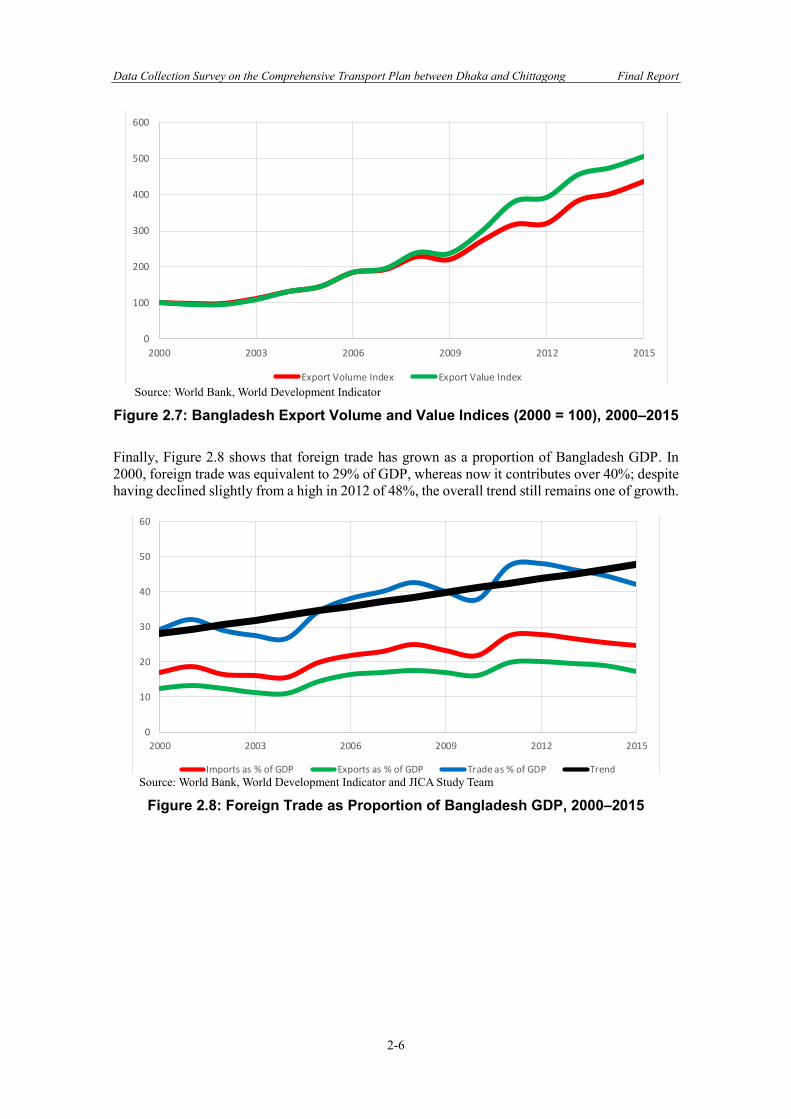
Figure 2.6: Bangladesh Import Volume and Value Indices (2000 = 100), 2000–2015 .............. 2-5
Figure 2.7: Bangladesh Export Volume and Value Indices (2000 = 100), 2000–2015 .............. 2-6
Figure 2.8: Foreign Trade as Proportion of Bangladesh GDP, 2000–2015 ................................ 2-6
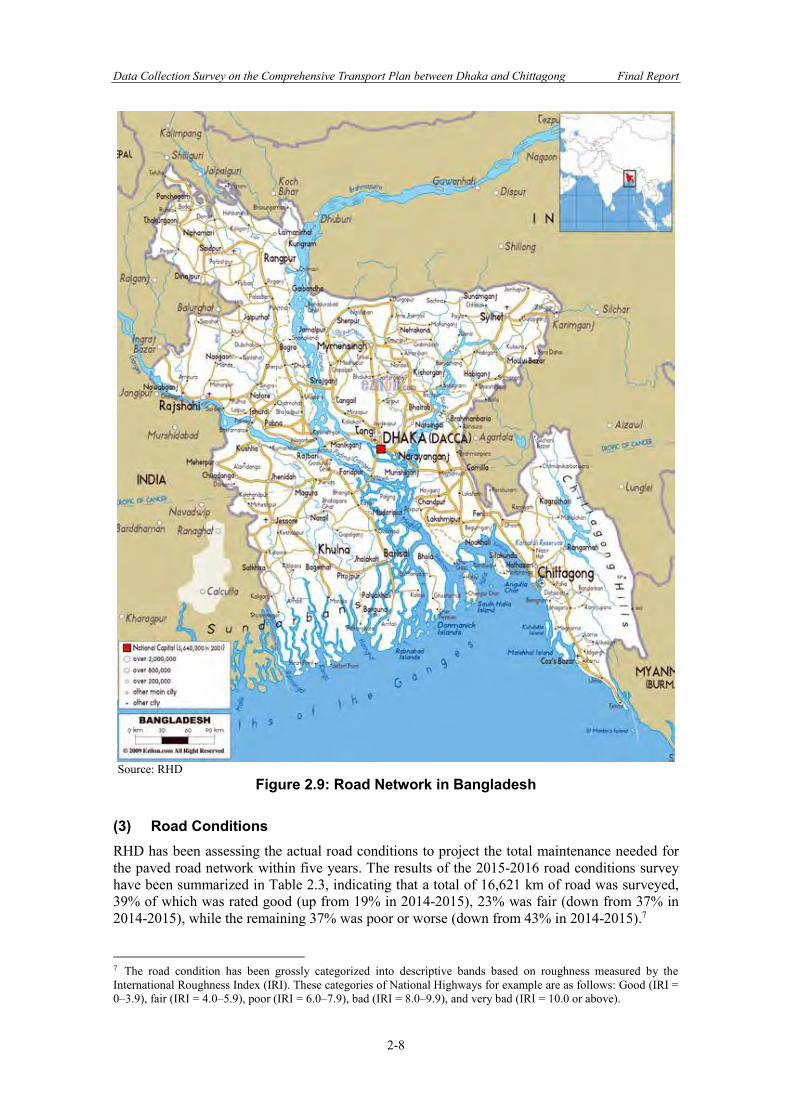
Figure 2.9: Road Network in Bangladesh .................................................................................. 2-8
Figure 2.10: Existing Rail Types of the Dhaka–Chittagong Corridor ...................................... 2-13
Figure 2.11: Chittagong Port Area ........................................................................................... 2-18
Figure 2.12: Location of Major Land Ports .............................................................................. 2-19
Figure 2.13: Map of Bangladesh Regional Connectivity Project 1 .......................................... 2-21
Figure 2.14: Location of Economic Zones ............................................................................... 2-24
Figure 2.15: Railway Development Project of the Dhaka–Chittagong Corridor ..................... 2-33
Figure 2.16: Bangladesh Railway Organization Chart ............................................................. 2-44
Figure 2.17: Revenues and Expenditures of BR ...................................................................... 2-50
Figure 4.1: Number of Passengers at Kamalapur Railway Station ............................................ 4-7
Figure 4.2: Distribution of Responses on the Transport Time and Cost for Each Transport Mode .................................................................................................................... 4-11
Figure 4.3: Mode Choice by Monthly Income Group .............................................................. 4-12
Figure 4.4: Available Alternatives by Users’ Transport Mode ................................................. 4-13
Figure 4.5: Multinomial Choice Model among Transport Modes ............................................ 4-21
Figure 4.6: Sensitivity Analysis of Access Time to Terminal/Station on Passengers’ Mode Choice .................................................................................................................. 4-23
Figure 4.7: Sensitivity Analysis of the Railway Fare on Passengers’ Mode Choice ................ 4-23
Figure 4.8: Binary Choice Model between High-Speed Rail and Each Transport Mode ..... 4-24
Figure 4.9: Willingness to Pay for the Shift to HSR in Accordance with Changes in Travel Time by Shifting to HSR for Each Transport User ................................. 4-26
Figure 4.10: Estimated Changes in Cargo Owner’s Mode Choice by Distance ....................... 4-29
Figure 5.1: Objective of Demand Forecast ................................................................................ 5-1
Figure 5.2: OD tables for Each Transport Mode ........................................................................ 5-2
Figure 5.3: Districts of Bangladesh ............................................................................................ 5-4
Figure 5.4: Observed Rail Traffic versus Estimated Traffic from the Dhaka City ..................... 5-6
Figure 5.5: Observed and Forecast Real Annual GDP Growth Rates ...................................... 5-11
Figure 5.6: Strategic Highway Network - Whole Country ....................................................... 5-12
Figure 5.7: Strategic Highway Network: Dhaka–Chittagong Corridor .................................... 5-13
Figure 5.8: Rail Network - Whole Country .............................................................................. 5-14
Figure 5.9: Rail Network - Dhaka–Chittagong Corridor ......................................................... 5-15
Figure 5.10: Rail Network - Dhaka–Chittagong with High-Speed Rail Shown ...................... 5-15
Figure 5.11: Inland and Coastal Water Transport Networks .................................................... 5-17
Figure 5.12: Bangladesh Coded Networks ............................................................................... 5-18
Figure 5.13: Dhaka–Chittagong Corridor Network ................................................................. 5-18
Figure 5.14: Network around Dhaka and to Comilla ............................................................... 5-19
Figure 5.15: Networks: Comilla to Chittagong ........................................................................ 5-19
Figure 5.16: Daily Passenger Flows, Whole Country, All Modes, 2031, without HSR ........... 5-22
Figure 5.17: Daily Passenger Flows, Dhaka–Chittagong Corridor, All Modes, 2031, without HSR ......................................................................................................... 5-23
Figure 5.18: Daily Passenger Flows on Highways, Dhaka–Chittagong Corridor, 2031, without HSR ......................................................................................................... 5-24
Data Collection Survey on the Comprehensive Transport Plan between Dhaka and Chittagong Final Report
xiv
Figure 5.19: Daily Passenger Flows on Railways, Dhaka–Chittagong Corridor, 2031, without HSR ......................................................................................................... 5-25
Figure 5.20: Daily Passenger Flows, Whole Country, All Modes, 2031, with HSR ................ 5-26
Figure 5.21: Daily Passenger Flows, Dhaka–Chittagong Corridor, All Modes, 2031, with HSR .............................................................................................................. 5-27
Figure 5.22: Daily Passenger Flows on Highways, Dhaka–Chittagong Corridor, 2031, with HSR .............................................................................................................. 5-28
Figure 5.23: Daily Passenger Flows on Railways, Dhaka–Chittagong Corridor, 2031, with HSR .............................................................................................................. 5-29
Figure 5.24: Daily Passenger Flows, Whole Country, All Modes, 2041, with HSR ................ 5-30
Figure 5.25: Daily Passenger Flows, Dhaka–Chittagong Corridor, All Modes, 2041, with HSR .............................................................................................................. 5-31
Figure 5.26: Daily Passenger Flows on Highways, Dhaka–Chittagong Corridor, 2041, with HSR .............................................................................................................. 5-32
Figure 5.27: Daily Passenger Flows on Railways, Dhaka–Chittagong Corridor, 2041, with HSR .............................................................................................................. 5-33
Figure 5.28: Daily Freight Flows, Whole Country, All Modes, 2031 ...................................... 5-35
Figure 5.29: Daily Freight Flows, Dhaka-Chittagong Corridor, All Modes, 2031 .................. 5-36
Figure 5.30: Daily Freight Flows on Highways, Dhaka-Chittagong Corridor, 2031 ............... 5-37
Figure 5.31: Daily Freight Flows on Rail, Dhaka-Chittagong Corridor, 2031 ......................... 5-38
Figure 5.32: Daily Freight Flows on Inland Waterways, Dhaka-Chittagong Corridor, 2031 .. 5-39
Figure 5.33: Daily Freight Flows, Whole Country, All Modes, 2041 ...................................... 5-40
Figure 5.34: Daily Freight Flows, Dhaka-Chittagong Corridor, All Modes, 2041 .................. 5-41
Figure 5.35: Daily Freight Flows on Highways, Dhaka-Chittagong Corridor, 2041 ............... 5-42
Figure 5.36: Daily Freight Flows on Rail, Dhaka-Chittagong Corridor, 2041 ......................... 5-43
Figure 5.37: Daily Freight Flows on Inland Waterways, Dhaka-Chittagong Corridor, 2041 .. 5-44
Figure 6.1: Planned Supply of Transport Service and Forecasted Transport Demand Comparison at Kanchpur Bridge (PCU/day) .......................................................... 6-3
Figure 6.2: Planned Supply of Transport Service and Forecasted Transport Demand Comparison at Meghna Bridge (PCU/day) ............................................................ 6-4
Figure 6.3: Planned Supply of Transport Service and Forecasted Transport Demand Comparison at Gumti Bridge (PCU/day) ............................................................... 6-4
Figure 6.4: Planned Supply of Transport Service and Forecasted Transport Demand Comparison at Signboad (PCU/day) ...................................................................... 6-5
Figure 6.5: Planned Supply of Transport Service and Forecasted Transport Demand Comparison on the Kanchpur–Sonargaon Section (PCU/day)............................... 6-5
Figure 6.6: Planned Supply of Transport Service and Forecasted Transport Demand Comparison on the Daudkandi–Comilla Section (PCU/day) ................................. 6-6
Figure 6.7: Planned Supply of Transport Service and Forecasted Transport Demand Comparison on the Comilla–Feni Section (PCU/day) ........................................... 6-6
Figure 6.8: Planned Supply of Transport Service and Forecasted Transport Demand Comparison on the Feni–Sitakunda Section (PCU/day) ........................................ 6-7
Figure 6.9: Planned Supply of Transport Service and Forecasted Transport Demand Comparison on the Sitakunda–Chittagong Section (PCU/day) .............................. 6-7
Figure 6.10: Planned Supply of Train Service and Forecasted Transport Demand Comparison on the Dhaka–Tongi Section (trains/day) ........................................ 6-12
Figure 6.11: Planned Supply of Train Service and Forecasted Transport Demand Comparison on the Tongi–Bhairab Bazaar Section (trains/day) .......................... 6-13
Figure 6.12: Planned Supply of Train Service and Forecasted Transport Demand Comparison on the Bhairab Bazaar–Akhaura Section (trains/day) ...................... 6-13
Figure 6.13: Planned Supply of Train Service and Forecasted Transport Demand Comparison on the Akhaura–Comilla Section (trains/day) .................................. 6-14
Data Collection Survey on the Comprehensive Transport Plan between Dhaka and Chittagong Final Report
xv
Figure 6.14: Planned Supply of Train Service and Forecasted Transport Demand Comparison on the Comilla–Feni Section (trains/day) ........................................ 6-14
Figure 6.15: Planned Supply of Train Service and Forecasted Transport Demand Comparison on the Feni–Chittagong Section (trains/day) ................................... 6-15
Figure 6.16: Forecasted Demand on HSR on the Dhaka–Comilla Section (passengers/day) .. 6-17
Figure 6.17: Forecasted Demand on HSR on the Comilla–Feni Section (passengers/day) ..... 6-17
Figure 6.18: Forecasted Demand on HSR on the Feni–Chittagong Section (passengers/day) ................................................................................................... 6-18
Figure 6.19: Impacts of Raising Fare on the Demand on HSR on the Dhaka–Chittagong Section .................................................................................................................. 6-18
Data Collection Survey on the Comprehensive Transport Plan between Dhaka and Chittagong Final Report
xvi
Abbreviations and Acronyms
ADB Asian Development Bank ADP Annual Development Program BAFFA Bangladesh Freight Forwarders Association BBA Bangladesh Bridge Authority BEPZA Bangladesh Export Processing Zones Authority BEZA Bangladesh Economic Zone Authority BKMEA Bangladesh Knitwear Manufacturers and Exporters Association BG Broad Gauge BGMEA Bangladesh Garments Manufacture and Export Association BIWTA Bangladesh Inland Water Transport Authority BIWTC Bangladesh Inland Water Transport Corporation BLPA Bangladesh Land Port Authority BOT Build-Operate-Transfer BR Bangladesh Railway BRT Bus Rapid Transit BRTA Bangladesh Road Transport Authority BRTC Bangladesh Road Transport Corporation CAAB Civil Aviation Authority of Bangladesh CCT Chittagong Container Terminal CPA Chittagong Port Authority DEPTC Deck and Engine Personnel Training Center DFID Department for International Development DOS Department of Shipping DPP Development Project Proforma/Proposal EDCF Economic Development Cooperation Fund EIA Environment Impact Assessment EOI Expression of Interest EPZ Export Processing Zones GCB General Cargo Berth GDP Gross Domestic Product GOB Government of Bangladesh HSIA Hazrat Shajalal International Airport ICD Inland Container Depot ICT Inland Container River Terminal IRI International Roughness Index IWT Inland Water Transport JICA Japan International Cooperation Agency LAD Least Available Depth LGED Local Government Engineering Department LoC Line of Credit LPG Liquefied Petroleum Gas MG Meter Gauge MOS Ministry of Shipping MPA Mongla Port Authority MRT Mass Rapid Transit NCT New-mooring Container Terminal NLTP National Land Transport Policy OD Origin and Destination ODA Official Development Assistance PFR Periodic Financing Request
Data Collection Survey on the Comprehensive Transport Plan between Dhaka and Chittagong Final Report
xvii
PIWTA Protocol on Inland Water Trade and Traffic POL Petroleum, Oil, and Lubricants PPP Public-Private Partnership RCC Reinforced Cement Concrete RFP Request for Proposal RHD Roads and Highways Department RMG Ready-made Garments RMIP Road Maintenance Improvement Project ROW Right of Way SAARC South Asian Association for Regional Cooperation SASEC South Asian Sub-Regional Economic Cooperation TA Technical Assistance TEC Tender Evaluation Committee TEU Twenty-foot Equivalent Unit

Data Collection Survey on the Comprehensive Transport Plan between Dhaka and Chittagong Final Report
1-1
1. Introduction
1.1 Background Dhaka and Chittagong are the two largest cities in Bangladesh, accounting for 13% of the national population and 50% of gross domestic product (GDP). Both passenger and freight traffic between the two cities (250 km by road, 320 km by rail, and 300 km by waterway) are serviced by roads, railways, air transport, and inland waterways. The urban population in Bangladesh is anticipated to grow at an average rate of 2.8% per year over the period 2015–2030,1 while the robust economic growth is expected to continue at an average rate of 7.0% per year between 2017 and 2022.2 Thus, strengthening the linkages between the two cities is essential. The Government of Bangladesh has prepared the Seventh Five Year Plan, a national development plan for the fiscal years of 2016–2020,3 with the goal of realizing an annual average growth rate of 7.4%. Under the plan, the government intends to accelerate economic growth, strengthen inclusiveness, reduce poverty, and create employment, while also setting core targets which include infrastructure development. The key issues raised and targeted for development include, among other things, the improvement of intercity highways, promotion of regional connectivity, improvement of port handling capacity, and efficient use of river and rail transport. In order to develop major intercity transportation systems, it is necessary to prepare and utilize multiple modes in an efficient and effective manner. This requires the consideration of various measures, including those that serve to increase transport capacity through the widening and upgrading of roads, constructing highways, upgrading and developing railway facilities and rolling stock, institutionally reforming inland water, dredging, and developing navigation aid facilities. Therefore, it is desirable that the development strategy for multimodal transport be considered from a diversified and comprehensive perspective, and thereby multimodal transport can be enhanced towards the strengthening of major intercity (centered on the Dhaka–Chittagong corridor) and regional cross-border transport network in Bangladesh. This Final Report was prepared following the study activities that were performed from mid-December 2016 to November 2017. A total of seven field surveys were conducted over the period. Details of the organizations visited in each field survey are shown in Appendix 1. 1.2 Objectives The objectives of the Survey are as follows:
• To review ongoing/planned transport projects and urban development plans for strengthening major intercity (mainly between Dhaka and Chittagong) and regional cross-border transport networks in Bangladesh;
• To analyze transport demand that would result from future economic growth; and • To examine project plans for unleashing the development potential along the Dhaka–
Chittagong corridor by means of enhancing multimodal transport including rail, inland water, and road.
1 Source: UN, World Urbanization Prospects: The 2014 Revision. 2 Source: IMF, World Economic Outlook Database, April 2017. 3 The fiscal year in Bangladesh begins on 1 July and ends on 30 June.
Data Collection Survey on the Comprehensive Transport Plan between Dhaka and Chittagong Final Report
1-2
1.3 Survey Area The subject area of the Survey is the entire country of Bangladesh, particularly its major cities (with population over 300,000) and areas between neighboring countries (especially India and Myanmar). 1.4 Survey Tasks The specific tasks envisaged for the Survey were set out in the Terms of Reference (TOR) and include the following: 1. Collect and analyze existing documents, information, and data relevant to the study; 2. Prepare Inception Report (IC/R); 3. Present the study plan to relevant organizations in Bangladesh; 4. Collect detailed information and review transport and urban development sectors of
Bangladesh; 5. Interview relevant government organizations, shippers, freight forwarders, logistics
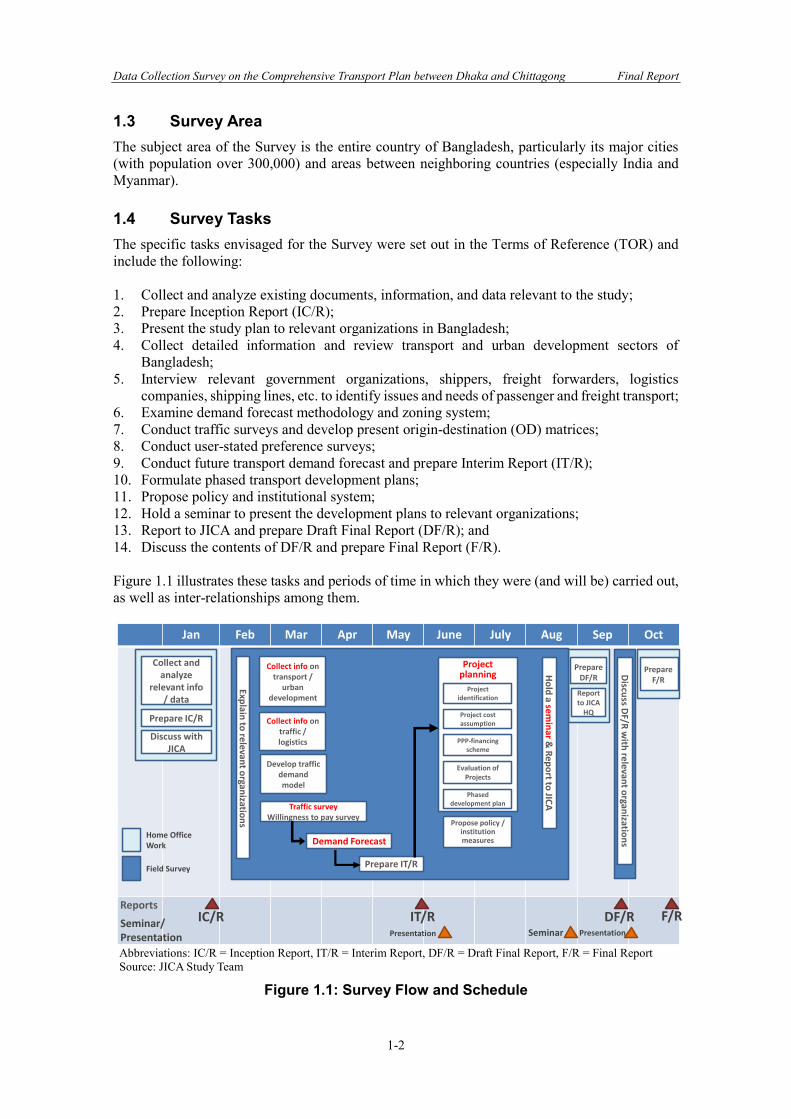
companies, shipping lines, etc. to identify issues and needs of passenger and freight transport; 6. Examine demand forecast methodology and zoning system; 7. Conduct traffic surveys and develop present origin-destination (OD) matrices; 8. Conduct user-stated preference surveys; 9. Conduct future transport demand forecast and prepare Interim Report (IT/R); 10. Formulate phased transport development plans; 11. Propose policy and institutional system; 12. Hold a seminar to present the development plans to relevant organizations; 13. Report to JICA and prepare Draft Final Report (DF/R); and 14. Discuss the contents of DF/R and prepare Final Report (F/R). Figure 1.1 illustrates these tasks and periods of time in which they were (and will be) carried out, as well as inter-relationships among them.
Abbreviations: IC/R = Inception Report, IT/R = Interim Report, DF/R = Draft Final Report, F/R = Final Report Source: JICA Study Team
Figure 1.1: Survey Flow and Schedule
Jan Feb Mar Apr May June July Aug Sep Oct
Home Office Work
Field Survey
Prepare IC/R
Collect and analyze
relevant info / data
Collect info on transport /
urban development
Projectplanning
Projectidentification
Propose policy / institution measures
Reports
Seminar/ Presentation
IC/R IT/R DF/R F/RPresentation Seminar
Discuss with JICA
Collect info on traffic / logistics
Develop traffic demand model
Traffic surveyWillingness to pay survey
Demand Forecast
Prepare IT/R
Project cost assumption
PPP-financing scheme
Evaluation of Projects
Phased development plan
Ho
ld a se
min
ar&
Re
po
rt to JIC
A
Explain
to re
levant o
rganizatio
ns
Report to JICA
HQ
Discu
ss DF/R
with
relevan
t organ
ization
s
Presentation
Prepare F/R
Prepare DF/R
Data Collection Survey on the Comprehensive Transport Plan between Dhaka and Chittagong Final Report
2-1
2. Overview of Transport Development in Dhaka–Chittagong Region and Related Areas
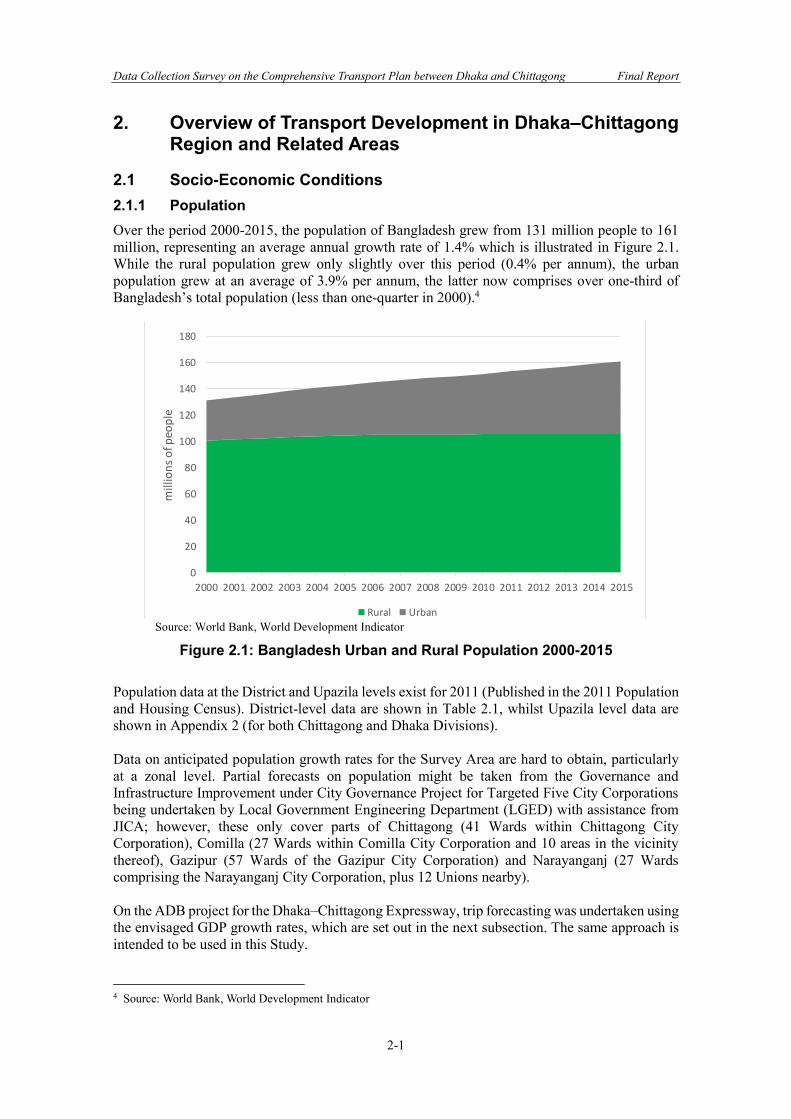
2.1 Socio-Economic Conditions 2.1.1 Population Over the period 2000-2015, the population of Bangladesh grew from 131 million people to 161 million, representing an average annual growth rate of 1.4% which is illustrated in Figure 2.1. While the rural population grew only slightly over this period (0.4% per annum), the urban population grew at an average of 3.9% per annum, the latter now comprises over one-third of Bangladesh’s total population (less than one-quarter in 2000).4
Source: World Bank, World Development Indicator
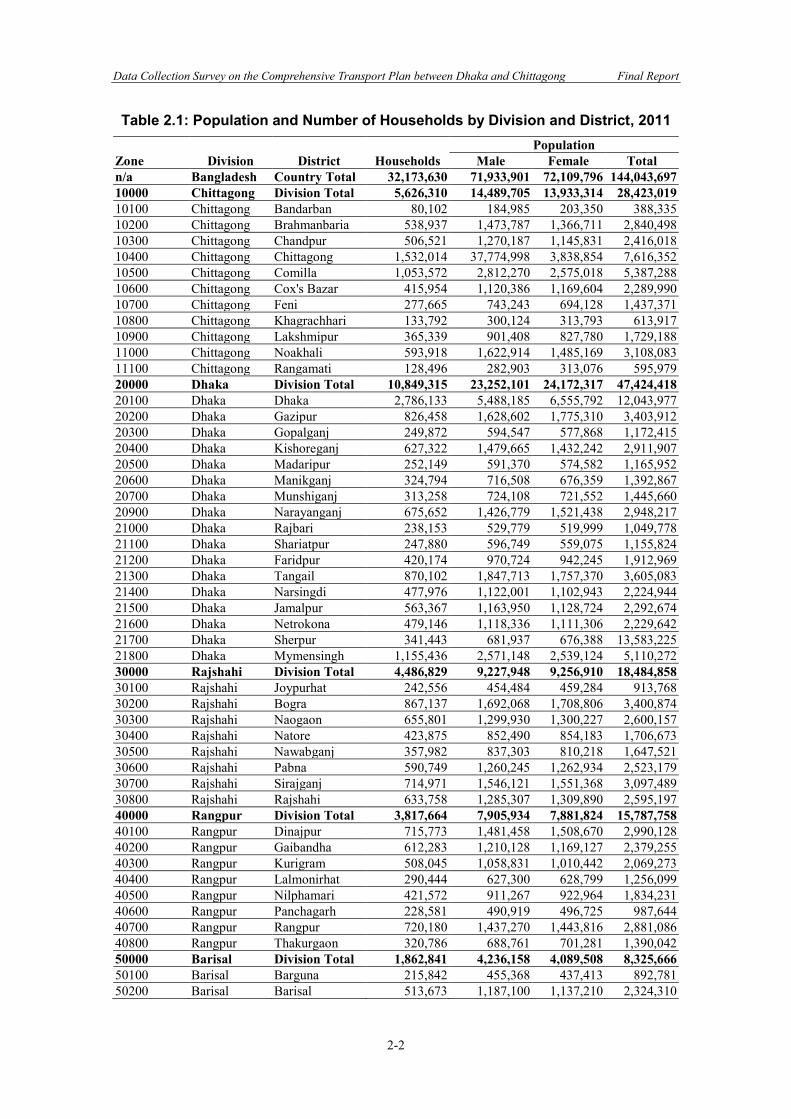
Figure 2.1: Bangladesh Urban and Rural Population 2000-2015 Population data at the District and Upazila levels exist for 2011 (Published in the 2011 Population and Housing Census). District-level data are shown in Table 2.1, whilst Upazila level data are shown in Appendix 2 (for both Chittagong and Dhaka Divisions). Data on anticipated population growth rates for the Survey Area are hard to obtain, particularly at a zonal level. Partial forecasts on population might be taken from the Governance and Infrastructure Improvement under City Governance Project for Targeted Five City Corporations being undertaken by Local Government Engineering Department (LGED) with assistance from JICA; however, these only cover parts of Chittagong (41 Wards within Chittagong City Corporation), Comilla (27 Wards within Comilla City Corporation and 10 areas in the vicinity thereof), Gazipur (57 Wards of the Gazipur City Corporation) and Narayanganj (27 Wards comprising the Narayanganj City Corporation, plus 12 Unions nearby). On the ADB project for the Dhaka–Chittagong Expressway, trip forecasting was undertaken using the envisaged GDP growth rates, which are set out in the next subsection. The same approach is intended to be used in this Study.
4 Source: World Bank, World Development Indicator
0
20
40
60
80
100
120
140
160
180
2000 2001 2002 2003 2004 2005 2006 2007 2008 2009 2010 2011 2012 2013 2014 2015
mill
ion
s o
f peo
ple
Bangladesh Population (millions)
Rural Urban
Data Collection Survey on the Comprehensive Transport Plan between Dhaka and Chittagong Final Report
2-2
Table 2.1: Population and Number of Households by Division and District, 2011
Zone Division District Households Population
Male Female Total n/a Bangladesh Country Total 32,173,630 71,933,901 72,109,796 144,043,697 10000 Chittagong Division Total 5,626,310 14,489,705 13,933,314 28,423,019 10100 Chittagong Bandarban 80,102 184,985 203,350 388,335 10200 Chittagong Brahmanbaria 538,937 1,473,787 1,366,711 2,840,498 10300 Chittagong Chandpur 506,521 1,270,187 1,145,831 2,416,018 10400 Chittagong Chittagong 1,532,014 37,774,998 3,838,854 7,616,352 10500 Chittagong Comilla 1,053,572 2,812,270 2,575,018 5,387,288 10600 Chittagong Cox's Bazar 415,954 1,120,386 1,169,604 2,289,990 10700 Chittagong Feni 277,665 743,243 694,128 1,437,371 10800 Chittagong Khagrachhari 133,792 300,124 313,793 613,917 10900 Chittagong Lakshmipur 365,339 901,408 827,780 1,729,188 11000 Chittagong Noakhali 593,918 1,622,914 1,485,169 3,108,083 11100 Chittagong Rangamati 128,496 282,903 313,076 595,979 20000 Dhaka Division Total 10,849,315 23,252,101 24,172,317 47,424,418 20100 Dhaka Dhaka 2,786,133 5,488,185 6,555,792 12,043,977 20200 Dhaka Gazipur 826,458 1,628,602 1,775,310 3,403,912 20300 Dhaka Gopalganj 249,872 594,547 577,868 1,172,415 20400 Dhaka Kishoreganj 627,322 1,479,665 1,432,242 2,911,907 20500 Dhaka Madaripur 252,149 591,370 574,582 1,165,952 20600 Dhaka Manikganj 324,794 716,508 676,359 1,392,867 20700 Dhaka Munshiganj 313,258 724,108 721,552 1,445,660 20900 Dhaka Narayanganj 675,652 1,426,779 1,521,438 2,948,217 21000 Dhaka Rajbari 238,153 529,779 519,999 1,049,778 21100 Dhaka Shariatpur 247,880 596,749 559,075 1,155,824 21200 Dhaka Faridpur 420,174 970,724 942,245 1,912,969 21300 Dhaka Tangail 870,102 1,847,713 1,757,370 3,605,083 21400 Dhaka Narsingdi 477,976 1,122,001 1,102,943 2,224,944 21500 Dhaka Jamalpur 563,367 1,163,950 1,128,724 2,292,674 21600 Dhaka Netrokona 479,146 1,118,336 1,111,306 2,229,642 21700 Dhaka Sherpur 341,443 681,937 676,388 13,583,225 21800 Dhaka Mymensingh 1,155,436 2,571,148 2,539,124 5,110,272 30000 Rajshahi Division Total 4,486,829 9,227,948 9,256,910 18,484,858 30100 Rajshahi Joypurhat 242,556 454,484 459,284 913,768 30200 Rajshahi Bogra 867,137 1,692,068 1,708,806 3,400,874 30300 Rajshahi Naogaon 655,801 1,299,930 1,300,227 2,600,157 30400 Rajshahi Natore 423,875 852,490 854,183 1,706,673 30500 Rajshahi Nawabganj 357,982 837,303 810,218 1,647,521 30600 Rajshahi Pabna 590,749 1,260,245 1,262,934 2,523,179 30700 Rajshahi Sirajganj 714,971 1,546,121 1,551,368 3,097,489 30800 Rajshahi Rajshahi 633,758 1,285,307 1,309,890 2,595,197 40000 Rangpur Division Total 3,817,664 7,905,934 7,881,824 15,787,758 40100 Rangpur Dinajpur 715,773 1,481,458 1,508,670 2,990,128 40200 Rangpur Gaibandha 612,283 1,210,128 1,169,127 2,379,255 40300 Rangpur Kurigram 508,045 1,058,831 1,010,442 2,069,273 40400 Rangpur Lalmonirhat 290,444 627,300 628,799 1,256,099 40500 Rangpur Nilphamari 421,572 911,267 922,964 1,834,231 40600 Rangpur Panchagarh 228,581 490,919 496,725 987,644 40700 Rangpur Rangpur 720,180 1,437,270 1,443,816 2,881,086 40800 Rangpur Thakurgaon 320,786 688,761 701,281 1,390,042 50000 Barisal Division Total 1,862,841 4,236,158 4,089,508 8,325,666 50100 Barisal Barguna 215,842 455,368 437,413 892,781 50200 Barisal Barisal 513,673 1,187,100 1,137,210 2,324,310
Data Collection Survey on the Comprehensive Transport Plan between Dhaka and Chittagong Final Report
2-3
Zone Division District Households Population
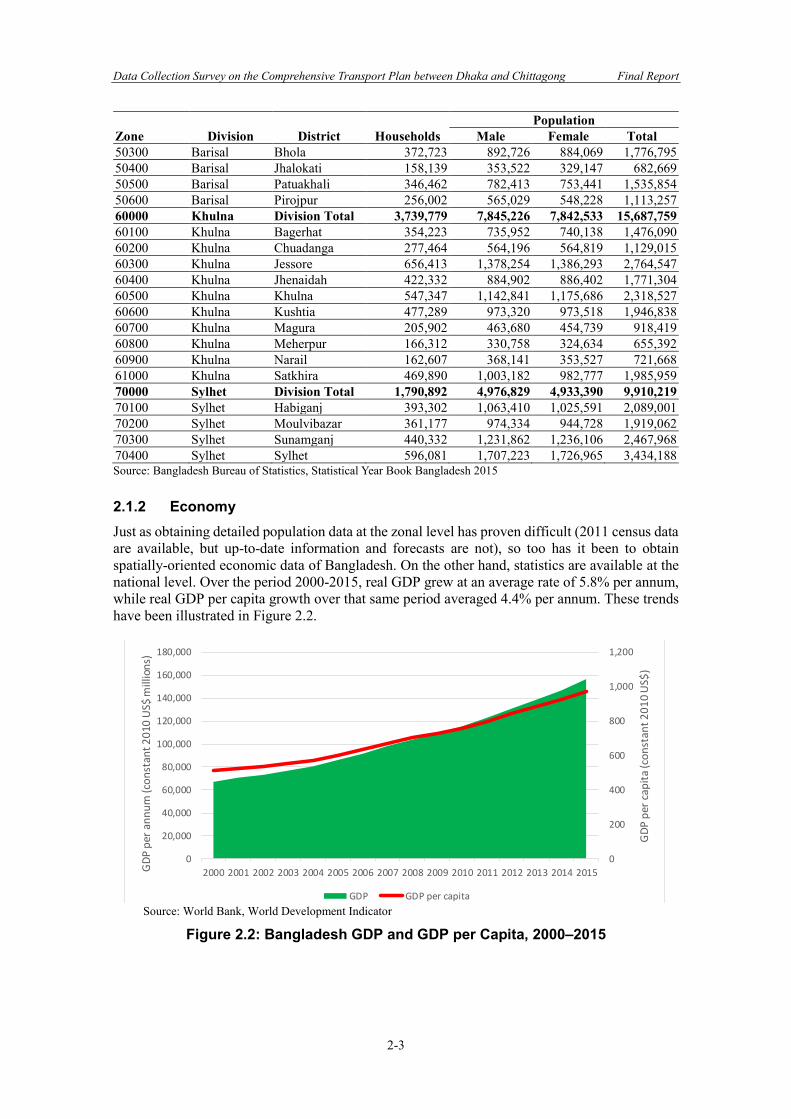
Male Female Total 50300 Barisal Bhola 372,723 892,726 884,069 1,776,795 50400 Barisal Jhalokati 158,139 353,522 329,147 682,669 50500 Barisal Patuakhali 346,462 782,413 753,441 1,535,854 50600 Barisal Pirojpur 256,002 565,029 548,228 1,113,257 60000 Khulna Division Total 3,739,779 7,845,226 7,842,533 15,687,759 60100 Khulna Bagerhat 354,223 735,952 740,138 1,476,090 60200 Khulna Chuadanga 277,464 564,196 564,819 1,129,015 60300 Khulna Jessore 656,413 1,378,254 1,386,293 2,764,547 60400 Khulna Jhenaidah 422,332 884,902 886,402 1,771,304 60500 Khulna Khulna 547,347 1,142,841 1,175,686 2,318,527 60600 Khulna Kushtia 477,289 973,320 973,518 1,946,838 60700 Khulna Magura 205,902 463,680 454,739 918,419 60800 Khulna Meherpur 166,312 330,758 324,634 655,392 60900 Khulna Narail 162,607 368,141 353,527 721,668 61000 Khulna Satkhira 469,890 1,003,182 982,777 1,985,959 70000 Sylhet Division Total 1,790,892 4,976,829 4,933,390 9,910,219 70100 Sylhet Habiganj 393,302 1,063,410 1,025,591 2,089,001 70200 Sylhet Moulvibazar 361,177 974,334 944,728 1,919,062 70300 Sylhet Sunamganj 440,332 1,231,862 1,236,106 2,467,968 70400 Sylhet Sylhet 596,081 1,707,223 1,726,965 3,434,188 Source: Bangladesh Bureau of Statistics, Statistical Year Book Bangladesh 2015 2.1.2 Economy Just as obtaining detailed population data at the zonal level has proven difficult (2011 census data are available, but up-to-date information and forecasts are not), so too has it been to obtain spatially-oriented economic data of Bangladesh. On the other hand, statistics are available at the national level. Over the period 2000-2015, real GDP grew at an average rate of 5.8% per annum, while real GDP per capita growth over that same period averaged 4.4% per annum. These trends have been illustrated in Figure 2.2.
Source: World Bank, World Development Indicator
Figure 2.2: Bangladesh GDP and GDP per Capita, 2000–2015
0
200
400
600
800
1,000
1,200
0
20,000
40,000
60,000
80,000
100,000
120,000
140,000
160,000
180,000
2000 2001 2002 2003 2004 2005 2006 2007 2008 2009 2010 2011 2012 2013 2014 2015
GD
P p
er c
apit
a (c
on
stan
t 2
01
0 U
S$)
GD
P p
er a
nn
um
(co
nst
ant
20
10 U
S$ m
illio
ns)
Bangladesh GDP and GDP per capita 2000-2015
GDP GDP per capita
Data Collection Survey on the Comprehensive Transport Plan between Dhaka and Chittagong Final Report
2-4
Moreover, as can be seen in Figure 2.3, growth in GDP per capita has been accelerating in recent years, averaging over 5% per annum over 2010-2015 (real GDP grew at 6.3% per annum over the same period).
Source: World Bank, World Development Indicator
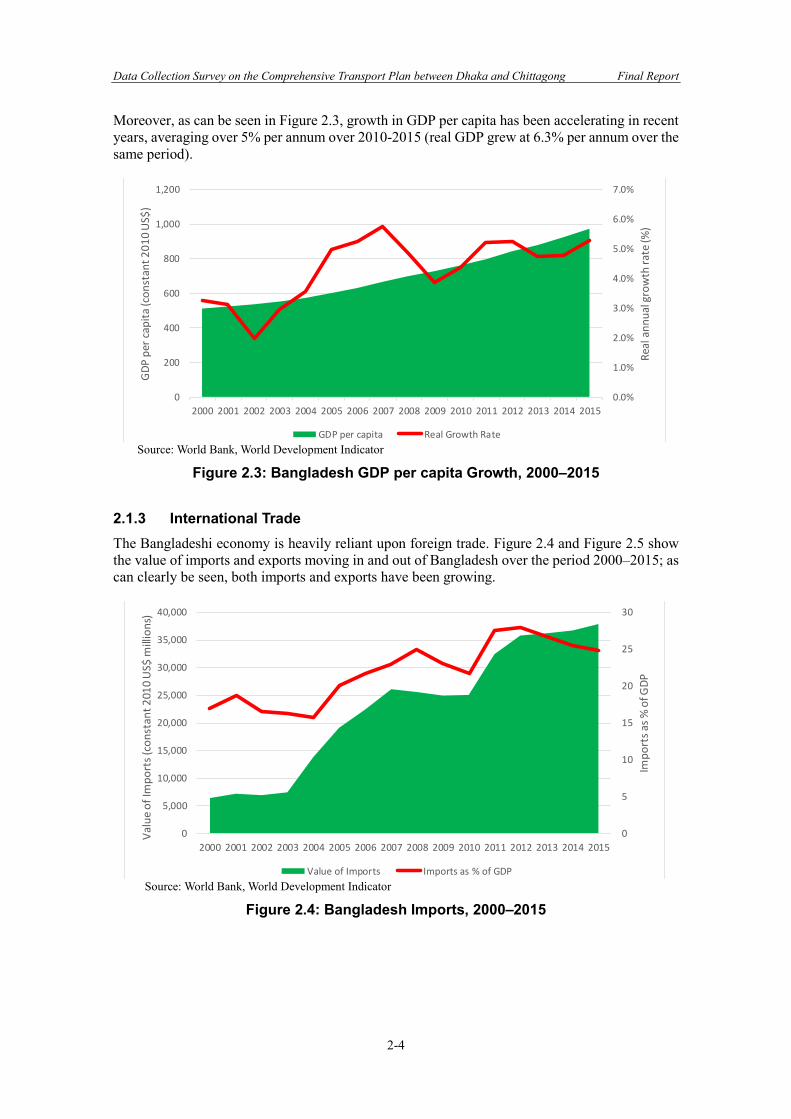
Figure 2.3: Bangladesh GDP per capita Growth, 2000–2015 2.1.3 International Trade The Bangladeshi economy is heavily reliant upon foreign trade. Figure 2.4 and Figure 2.5 show the value of imports and exports moving in and out of Bangladesh over the period 2000–2015; as can clearly be seen, both imports and exports have been growing.
Source: World Bank, World Development Indicator
Figure 2.4: Bangladesh Imports, 2000–2015
0.0%
1.0%
2.0%
3.0%
4.0%
5.0%
6.0%
7.0%
0
200
400
600
800
1,000
1,200
2000 2001 2002 2003 2004 2005 2006 2007 2008 2009 2010 2011 2012 2013 2014 2015
Rea
l an
nu
al g
row
th r
ate
(%)
GD
P p
er c
apit
a (c
on
stan
t 2
01
0 U
S$)
Bangladesh GDP per capita growth 2000-2015
GDP per capita Real Growth Rate
0
5
10
15
20
25
30
0
5,000
10,000
15,000
20,000
25,000
30,000
35,000
40,000
2000 2001 2002 2003 2004 2005 2006 2007 2008 2009 2010 2011 2012 2013 2014 2015
Imp
ort
s as
% o
f GD
P
Val
ue
of
Imp
ort
s (c
on
stan
t 2
010
US$
mill
ion
s)
Bangladesh Imports 2000-2015
Value of Imports Imports as % of GDP
Data Collection Survey on the Comprehensive Transport Plan between Dhaka and Chittagong Final Report
2-5
Source: World Bank, World Development Indicator
Figure 2.5: Bangladesh Exports, 2000–2015 As shown in Figure 2.4 and Figure 2.5, the value of imports exceeds the value of exports. Moreover, whilst growth in the value of imports has outpaced that of imports (as shown in Figure 2.6), the growth in the value of exports since 2000 has largely been in line with growth in the volume of exports (see Figure 2.7), although there was slight growth in the value of exports relative to volume of exports since 2009. Nevertheless, comparing these Figures shows that since 2000, there has been more substantial growth in exports than in imports. Consequently, it is likely that Bangladesh’s ongoing development will be reliant on this growth in exporting to continue.
Source: World Bank, World Development Indicator
Figure 2.6: Bangladesh Import Volume and Value Indices (2000 = 100), 2000–2015
0
5
10
15
20
25
0
5,000
10,000
15,000
20,000
25,000
30,000
2000 2001 2002 2003 2004 2005 2006 2007 2008 2009 2010 2011 2012 2013 2014 2015
Exp
ort
s as
% o
f GD
P
Val
ue
of
Exp
ort
s (c
on
stan
t 2
010
US$
mill
ions
)
Bangladesh Exports 2000-2015
Value of Exports Exports as % of GDP
0
100
200
300
400
500
600
2000 2003 2006 2009 2012 2015
Import Volume and Values Indices (2000=100)
Import Volume Index Import Value Index
Data Collection Survey on the Comprehensive Transport Plan between Dhaka and Chittagong Final Report
2-6
Source: World Bank, World Development Indicator
Figure 2.7: Bangladesh Export Volume and Value Indices (2000 = 100), 2000–2015 Finally, Figure 2.8 shows that foreign trade has grown as a proportion of Bangladesh GDP. In 2000, foreign trade was equivalent to 29% of GDP, whereas now it contributes over 40%; despite having declined slightly from a high in 2012 of 48%, the overall trend still remains one of growth.
Source: World Bank, World Development Indicator and JICA Study Team
Figure 2.8: Foreign Trade as Proportion of Bangladesh GDP, 2000–2015
0
100
200
300
400
500
600
2000 2003 2006 2009 2012 2015
Export Volume and Values Indices (2000=100)
Export Volume Index Export Value Index
0
10
20
30
40
50
60
2000 2003 2006 2009 2012 2015
Foreign Trade as % of Bangladesh GDP: 2000-2015)
Imports as % of GDP Exports as % of GDP Trade as % of GDP Trend
Data Collection Survey on the Comprehensive Transport Plan between Dhaka and Chittagong Final Report
2-7
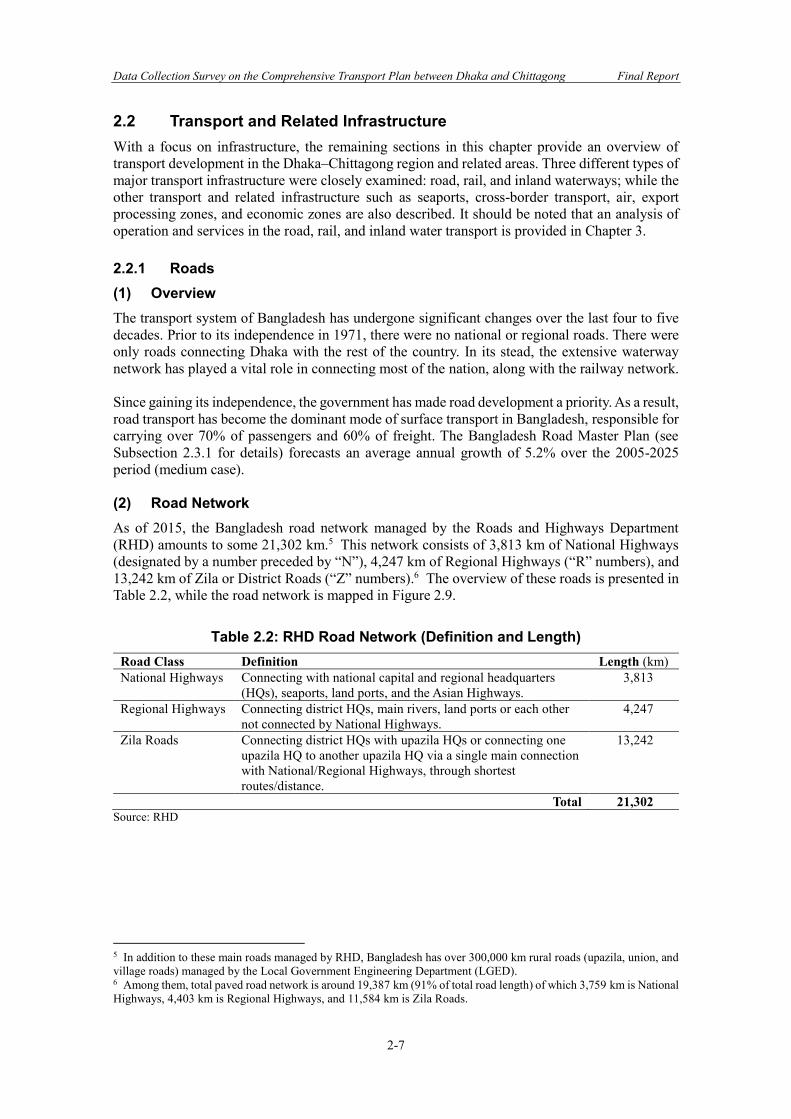
2.2 Transport and Related Infrastructure With a focus on infrastructure, the remaining sections in this chapter provide an overview of transport development in the Dhaka–Chittagong region and related areas. Three different types of major transport infrastructure were closely examined: road, rail, and inland waterways; while the other transport and related infrastructure such as seaports, cross-border transport, air, export processing zones, and economic zones are also described. It should be noted that an analysis of operation and services in the road, rail, and inland water transport is provided in Chapter 3. 2.2.1 Roads (1) Overview The transport system of Bangladesh has undergone significant changes over the last four to five decades. Prior to its independence in 1971, there were no national or regional roads. There were only roads connecting Dhaka with the rest of the country. In its stead, the extensive waterway network has played a vital role in connecting most of the nation, along with the railway network. Since gaining its independence, the government has made road development a priority. As a result, road transport has become the dominant mode of surface transport in Bangladesh, responsible for carrying over 70% of passengers and 60% of freight. The Bangladesh Road Master Plan (see Subsection 2.3.1 for details) forecasts an average annual growth of 5.2% over the 2005-2025 period (medium case). (2) Road Network As of 2015, the Bangladesh road network managed by the Roads and Highways Department (RHD) amounts to some 21,302 km.5 This network consists of 3,813 km of National Highways (designated by a number preceded by “N”), 4,247 km of Regional Highways (“R” numbers), and 13,242 km of Zila or District Roads (“Z” numbers).6 The overview of these roads is presented in Table 2.2, while the road network is mapped in Figure 2.9.
Table 2.2: RHD Road Network (Definition and Length) Road Class Definition Length (km) National Highways Connecting with national capital and regional headquarters
(HQs), seaports, land ports, and the Asian Highways. 3,813
Regional Highways Connecting district HQs, main rivers, land ports or each other not connected by National Highways.
4,247
Zila Roads Connecting district HQs with upazila HQs or connecting one upazila HQ to another upazila HQ via a single main connection with National/Regional Highways, through shortest routes/distance.
13,242
Total 21,302 Source: RHD
5 In addition to these main roads managed by RHD, Bangladesh has over 300,000 km rural roads (upazila, union, and village roads) managed by the Local Government Engineering Department (LGED). 6 Among them, total paved road network is around 19,387 km (91% of total road length) of which 3,759 km is National Highways, 4,403 km is Regional Highways, and 11,584 km is Zila Roads.
Data Collection Survey on the Comprehensive Transport Plan between Dhaka and Chittagong Final Report
2-8
Source: RHD
Figure 2.9: Road Network in Bangladesh (3) Road Conditions RHD has been assessing the actual road conditions to project the total maintenance needed for the paved road network within five years. The results of the 2015-2016 road conditions survey have been summarized in Table 2.3, indicating that a total of 16,621 km of road was surveyed, 39% of which was rated good (up from 19% in 2014-2015), 23% was fair (down from 37% in 2014-2015), while the remaining 37% was poor or worse (down from 43% in 2014-2015).7 7 The road condition has been grossly categorized into descriptive bands based on roughness measured by the International Roughness Index (IRI). These categories of National Highways for example are as follows: Good (IRI = 0–3.9), fair (IRI = 4.0–5.9), poor (IRI = 6.0–7.9), bad (IRI = 8.0–9.9), and very bad (IRI = 10.0 or above).
Data Collection Survey on the Comprehensive Transport Plan between Dhaka and Chittagong Final Report
2-9
Table 2.3: Overall RHD Road Network Conditions Surveyed in 2015-2016 Road Conditions
National Highways (km)
Regional Highways (km)
Zila Roads (km)
Total (km)
Share (%)
Good 1,977 1,688 2,845 6,509 39 Fair 935 1,040 1,930 3,905 23 Poor 490 797 2,179 3,466 21 Bad 159 246 1,494 1,900 11 Very bad 96 170 574 841 5
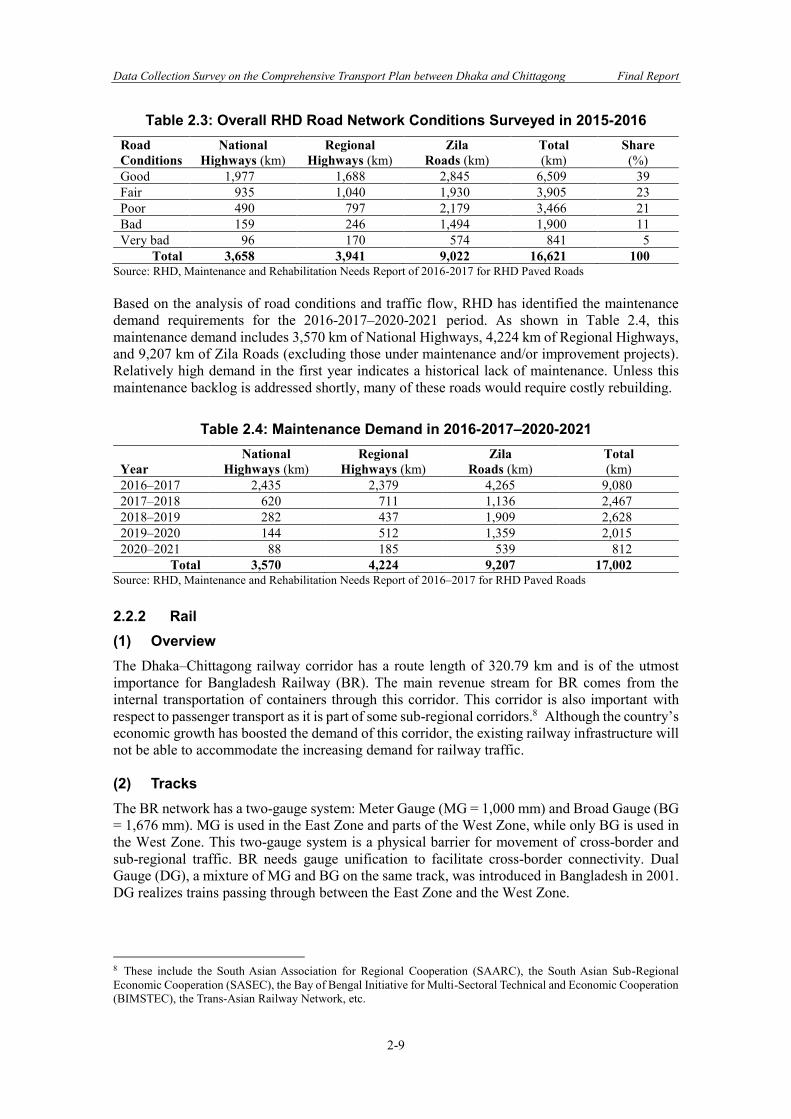
Total 3,658 3,941 9,022 16,621 100 Source: RHD, Maintenance and Rehabilitation Needs Report of 2016-2017 for RHD Paved Roads Based on the analysis of road conditions and traffic flow, RHD has identified the maintenance demand requirements for the 2016-2017–2020-2021 period. As shown in Table 2.4, this maintenance demand includes 3,570 km of National Highways, 4,224 km of Regional Highways, and 9,207 km of Zila Roads (excluding those under maintenance and/or improvement projects). Relatively high demand in the first year indicates a historical lack of maintenance. Unless this maintenance backlog is addressed shortly, many of these roads would require costly rebuilding.
Table 2.4: Maintenance Demand in 2016-2017–2020-2021
Year National
Highways (km) Regional
Highways (km) Zila
Roads (km) Total (km)
2016–2017 2,435 2,379 4,265 9,080 2017–2018 620 711 1,136 2,467 2018–2019 282 437 1,909 2,628 2019–2020 144 512 1,359 2,015 2020–2021 88 185 539 812
Total 3,570 4,224 9,207 17,002 Source: RHD, Maintenance and Rehabilitation Needs Report of 2016–2017 for RHD Paved Roads 2.2.2 Rail (1) Overview The Dhaka–Chittagong railway corridor has a route length of 320.79 km and is of the utmost importance for Bangladesh Railway (BR). The main revenue stream for BR comes from the internal transportation of containers through this corridor. This corridor is also important with respect to passenger transport as it is part of some sub-regional corridors.8 Although the country’s economic growth has boosted the demand of this corridor, the existing railway infrastructure will not be able to accommodate the increasing demand for railway traffic. (2) Tracks The BR network has a two-gauge system: Meter Gauge (MG = 1,000 mm) and Broad Gauge (BG = 1,676 mm). MG is used in the East Zone and parts of the West Zone, while only BG is used in the West Zone. This two-gauge system is a physical barrier for movement of cross-border and sub-regional traffic. BR needs gauge unification to facilitate cross-border connectivity. Dual Gauge (DG), a mixture of MG and BG on the same track, was introduced in Bangladesh in 2001. DG realizes trains passing through between the East Zone and the West Zone.
8 These include the South Asian Association for Regional Cooperation (SAARC), the South Asian Sub-Regional Economic Cooperation (SASEC), the Bay of Bengal Initiative for Multi-Sectoral Technical and Economic Cooperation (BIMSTEC), the Trans-Asian Railway Network, etc.
Data Collection Survey on the Comprehensive Transport Plan between Dhaka and Chittagong Final Report
2-10
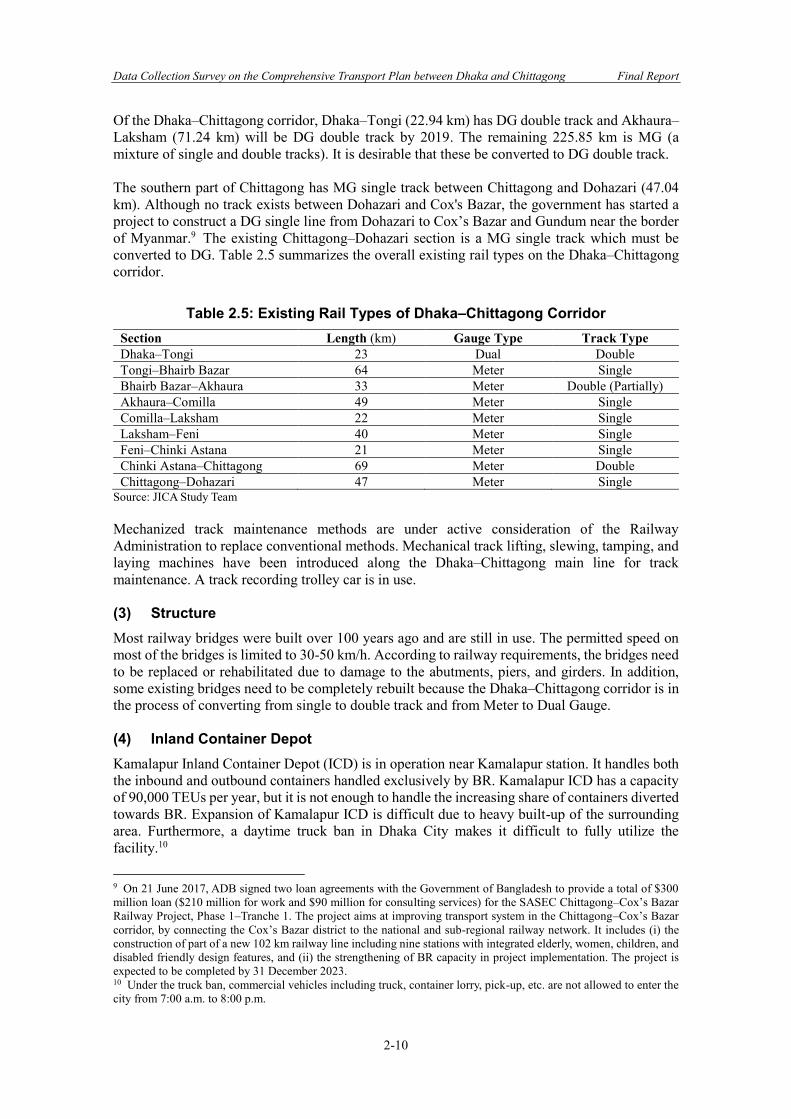
Of the Dhaka–Chittagong corridor, Dhaka–Tongi (22.94 km) has DG double track and Akhaura–Laksham (71.24 km) will be DG double track by 2019. The remaining 225.85 km is MG (a mixture of single and double tracks). It is desirable that these be converted to DG double track. The southern part of Chittagong has MG single track between Chittagong and Dohazari (47.04 km). Although no track exists between Dohazari and Cox's Bazar, the government has started a project to construct a DG single line from Dohazari to Cox’s Bazar and Gundum near the border of Myanmar.9 The existing Chittagong–Dohazari section is a MG single track which must be converted to DG. Table 2.5 summarizes the overall existing rail types on the Dhaka–Chittagong corridor.
Table 2.5: Existing Rail Types of Dhaka–Chittagong Corridor Section Length (km) Gauge Type Track Type Dhaka–Tongi 23 Dual Double Tongi–Bhairb Bazar 64 Meter Single Bhairb Bazar–Akhaura 33 Meter Double (Partially) Akhaura–Comilla 49 Meter Single Comilla–Laksham 22 Meter Single Laksham–Feni 40 Meter Single Feni–Chinki Astana 21 Meter Single Chinki Astana–Chittagong 69 Meter Double Chittagong–Dohazari 47 Meter Single
Source: JICA Study Team Mechanized track maintenance methods are under active consideration of the Railway Administration to replace conventional methods. Mechanical track lifting, slewing, tamping, and laying machines have been introduced along the Dhaka–Chittagong main line for track maintenance. A track recording trolley car is in use. (3) Structure Most railway bridges were built over 100 years ago and are still in use. The permitted speed on most of the bridges is limited to 30-50 km/h. According to railway requirements, the bridges need to be replaced or rehabilitated due to damage to the abutments, piers, and girders. In addition, some existing bridges need to be completely rebuilt because the Dhaka–Chittagong corridor is in the process of converting from single to double track and from Meter to Dual Gauge. (4) Inland Container Depot Kamalapur Inland Container Depot (ICD) is in operation near Kamalapur station. It handles both the inbound and outbound containers handled exclusively by BR. Kamalapur ICD has a capacity of 90,000 TEUs per year, but it is not enough to handle the increasing share of containers diverted towards BR. Expansion of Kamalapur ICD is difficult due to heavy built-up of the surrounding area. Furthermore, a daytime truck ban in Dhaka City makes it difficult to fully utilize the facility.10
9 On 21 June 2017, ADB signed two loan agreements with the Government of Bangladesh to provide a total of $300 million loan ($210 million for work and $90 million for consulting services) for the SASEC Chittagong–Cox’s Bazar Railway Project, Phase 1–Tranche 1. The project aims at improving transport system in the Chittagong–Cox’s Bazar corridor, by connecting the Cox’s Bazar district to the national and sub-regional railway network. It includes (i) the construction of part of a new 102 km railway line including nine stations with integrated elderly, women, children, and disabled friendly design features, and (ii) the strengthening of BR capacity in project implementation. The project is expected to be completed by 31 December 2023. 10 Under the truck ban, commercial vehicles including truck, container lorry, pick-up, etc. are not allowed to enter the city from 7:00 a.m. to 8:00 p.m.
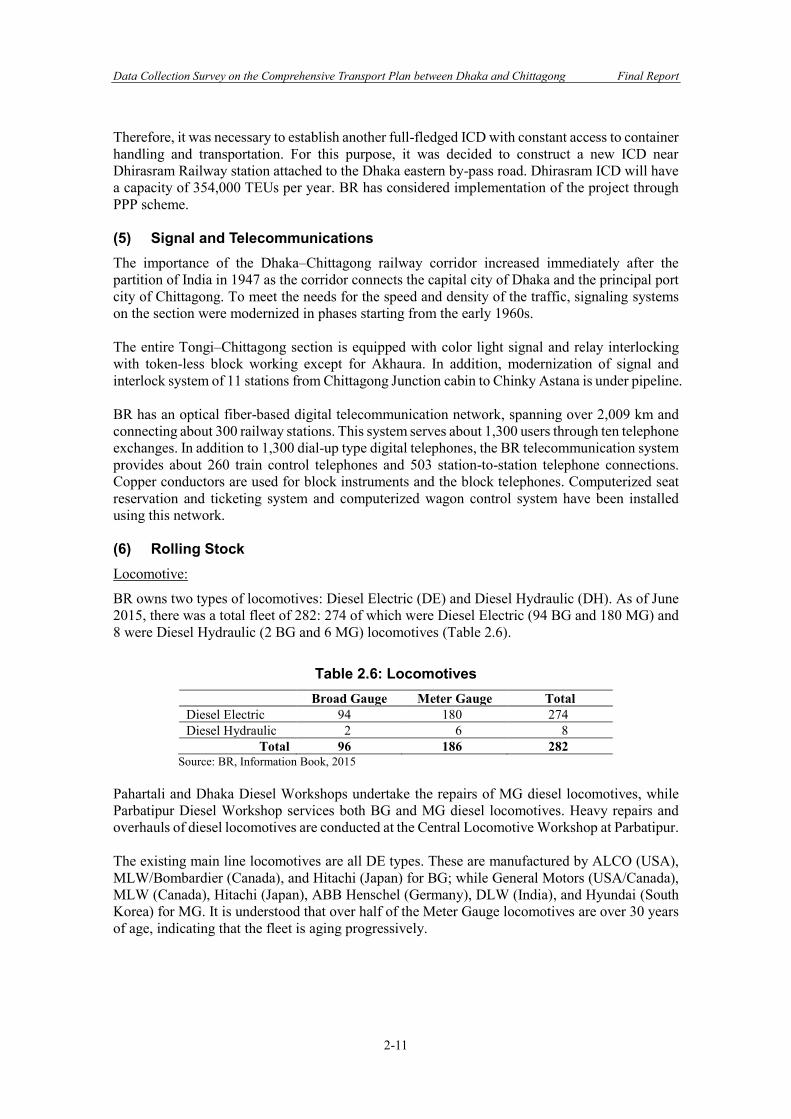
Data Collection Survey on the Comprehensive Transport Plan between Dhaka and Chittagong Final Report
2-11
Therefore, it was necessary to establish another full-fledged ICD with constant access to container handling and transportation. For this purpose, it was decided to construct a new ICD near Dhirasram Railway station attached to the Dhaka eastern by-pass road. Dhirasram ICD will have a capacity of 354,000 TEUs per year. BR has considered implementation of the project through PPP scheme. (5) Signal and Telecommunications The importance of the Dhaka–Chittagong railway corridor increased immediately after the partition of India in 1947 as the corridor connects the capital city of Dhaka and the principal port city of Chittagong. To meet the needs for the speed and density of the traffic, signaling systems on the section were modernized in phases starting from the early 1960s. The entire Tongi–Chittagong section is equipped with color light signal and relay interlocking with token-less block working except for Akhaura. In addition, modernization of signal and interlock system of 11 stations from Chittagong Junction cabin to Chinky Astana is under pipeline. BR has an optical fiber-based digital telecommunication network, spanning over 2,009 km and connecting about 300 railway stations. This system serves about 1,300 users through ten telephone exchanges. In addition to 1,300 dial-up type digital telephones, the BR telecommunication system provides about 260 train control telephones and 503 station-to-station telephone connections. Copper conductors are used for block instruments and the block telephones. Computerized seat reservation and ticketing system and computerized wagon control system have been installed using this network. (6) Rolling Stock Locomotive:
BR owns two types of locomotives: Diesel Electric (DE) and Diesel Hydraulic (DH). As of June 2015, there was a total fleet of 282: 274 of which were Diesel Electric (94 BG and 180 MG) and 8 were Diesel Hydraulic (2 BG and 6 MG) locomotives (Table 2.6).
Table 2.6: Locomotives Broad Gauge Meter Gauge Total
Diesel Electric 94 180 274 Diesel Hydraulic 2 6 8
Total 96 186 282 Source: BR, Information Book, 2015
Pahartali and Dhaka Diesel Workshops undertake the repairs of MG diesel locomotives, while Parbatipur Diesel Workshop services both BG and MG diesel locomotives. Heavy repairs and overhauls of diesel locomotives are conducted at the Central Locomotive Workshop at Parbatipur. The existing main line locomotives are all DE types. These are manufactured by ALCO (USA), MLW/Bombardier (Canada), and Hitachi (Japan) for BG; while General Motors (USA/Canada), MLW (Canada), Hitachi (Japan), ABB Henschel (Germany), DLW (India), and Hyundai (South Korea) for MG. It is understood that over half of the Meter Gauge locomotives are over 30 years of age, indicating that the fleet is aging progressively.
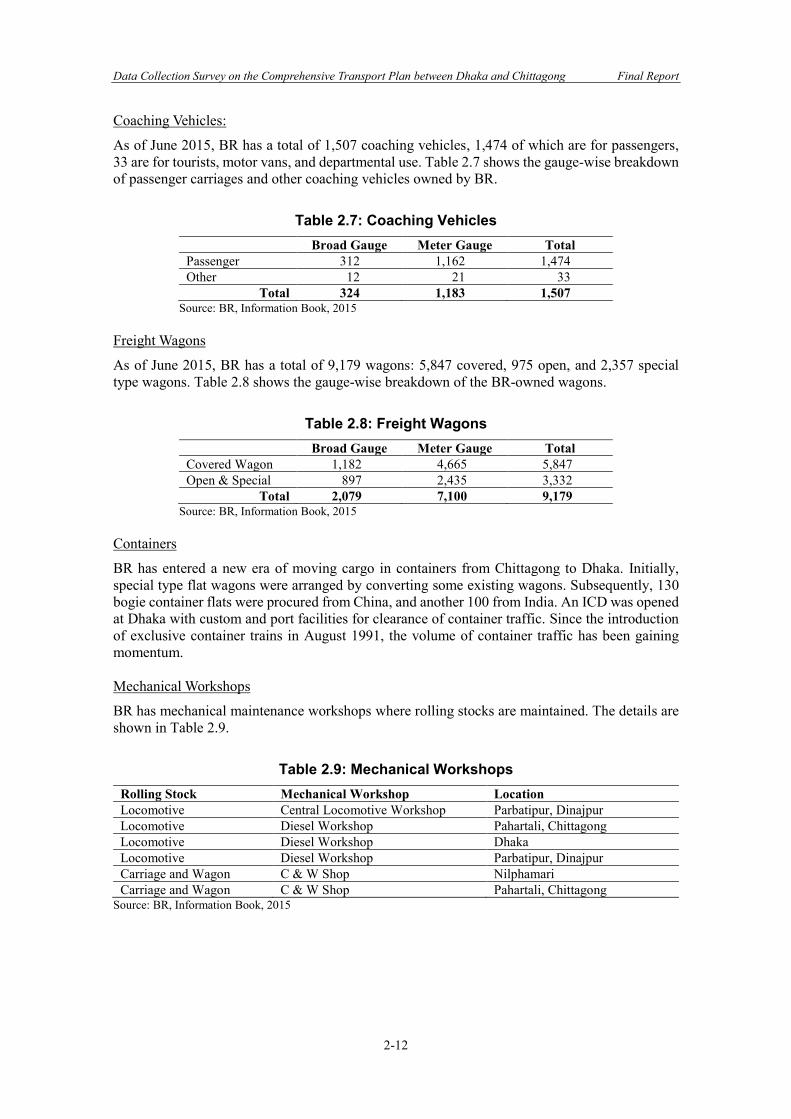
Data Collection Survey on the Comprehensive Transport Plan between Dhaka and Chittagong Final Report
2-12
Coaching Vehicles:
As of June 2015, BR has a total of 1,507 coaching vehicles, 1,474 of which are for passengers, 33 are for tourists, motor vans, and departmental use. Table 2.7 shows the gauge-wise breakdown of passenger carriages and other coaching vehicles owned by BR.
Table 2.7: Coaching Vehicles Broad Gauge Meter Gauge Total
Passenger 312 1,162 1,474 Other 12 21 33
Total 324 1,183 1,507 Source: BR, Information Book, 2015
Freight Wagons
As of June 2015, BR has a total of 9,179 wagons: 5,847 covered, 975 open, and 2,357 special type wagons. Table 2.8 shows the gauge-wise breakdown of the BR-owned wagons.
Table 2.8: Freight Wagons Broad Gauge Meter Gauge Total
Covered Wagon 1,182 4,665 5,847 Open & Special 897 2,435 3,332
Total 2,079 7,100 9,179 Source: BR, Information Book, 2015
Containers
BR has entered a new era of moving cargo in containers from Chittagong to Dhaka. Initially, special type flat wagons were arranged by converting some existing wagons. Subsequently, 130 bogie container flats were procured from China, and another 100 from India. An ICD was opened at Dhaka with custom and port facilities for clearance of container traffic. Since the introduction of exclusive container trains in August 1991, the volume of container traffic has been gaining momentum. Mechanical Workshops
BR has mechanical maintenance workshops where rolling stocks are maintained. The details are shown in Table 2.9.
Table 2.9: Mechanical Workshops Rolling Stock Mechanical Workshop Location Locomotive Central Locomotive Workshop Parbatipur, Dinajpur Locomotive Diesel Workshop Pahartali, Chittagong Locomotive Diesel Workshop Dhaka Locomotive Diesel Workshop Parbatipur, Dinajpur Carriage and Wagon C & W Shop Nilphamari Carriage and Wagon C & W Shop Pahartali, Chittagong
Source: BR, Information Book, 2015
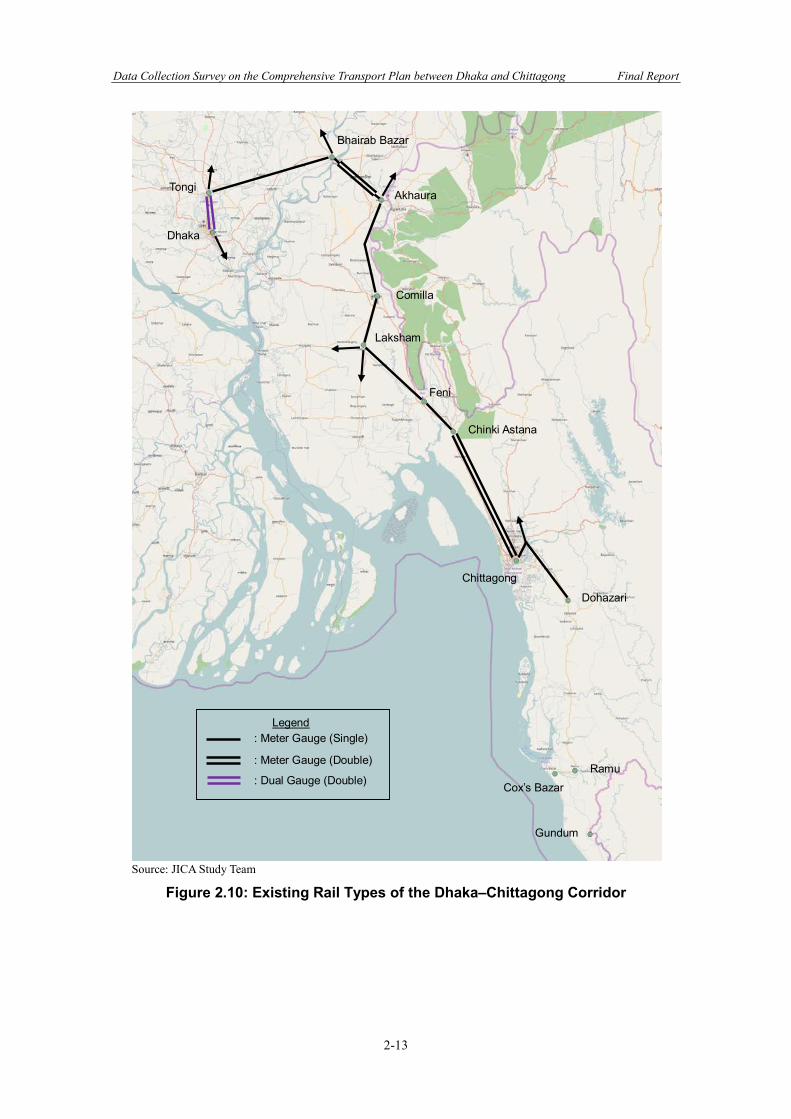
Data Collection Survey on the Comprehensive Transport Plan between Dhaka and Chittagong Final Report
2-13
Source: JICA Study Team
Figure 2.10: Existing Rail Types of the Dhaka–Chittagong Corridor
Dhaka
Tongi
Comilla
Laksham
Akhaura
Bhairab Bazar
Feni
Chinki Astana
Chittagong
Dohazari
Cox’s Bazar
Legend : Meter Gauge (Single)
: Meter Gauge (Double)
: Dual Gauge (Double) Ramu
Gundum
Data Collection Survey on the Comprehensive Transport Plan between Dhaka and Chittagong Final Report
2-14
2.2.3 Inland Water (1) Overview Bangladesh is a land that is naturally endowed with a network of inland waterways. The Dhaka–Chittagong Inland Water Transport (IWT) corridor plays an important role in this network. It connects Chittagong Port with the capital city Dhaka and Narayanganj, a major industrial and commercial hub of the country. Although the road sector has expanded tremendously since the liberation of the country in 1971, the naturally existing inland waterways have made significant contribution to economic progress of the country. The Dhaka–Chittagong IWT corridor serves as a life-line for the country. It is used for the importation of petroleum, oil, and lubricants (POL), fertilizer, raw materials for the garment factories, etc. these inputs, in turn, fuel the country’s much needed foreign exchange earners, and facilitate the export of tea, leather products, finished garments, etc. For this reason, performance of the corridor always remains a matter of concern for the government. In order to cope with rising import and export volume demand, the infrastructure of Chittagong Port has continued to develop over the years; yet even more is required. Similarly, there is a need to develop the IWT corridor which connects the port with the country’s interior regions. This is all-the-more necessary now in view of the continuously increasing traffic congestion along highways and railways. The corridor connects Chittagong Port with Dhaka and Narayanganj, where many commercial and industrial establishments are situated. Cargo vessels and fuel tankers use this route to transport import materials to factories in Dhaka, Narayanganj, and surrounding areas; similarly, products designated for export are transported from the region to the ports for shipping overseas.
The corridor is connected to Baghabari River Port which acts as a gateway to the north-western region of the country. Predominantly agricultural in character, the area serves as a granary and needs regular and timely supply of fuel to run irrigation pumps and fertilizer to grow crops. The corridor is also connected to the country’s north-eastern region via waterway. Stones, gravel and coarse sand are transported to different parts of the country using cargo vessels and country boats. The corridor constitutes a part of one of the inland waterway routes under the Protocol on Inland Water Trade and Traffic (PIWTT), a bilateral agreement signed between Bangladesh and India. The agreement allows vessels belonging to Bangladesh and India to enter either country through designated entry points and sail in the country using designated waterway routes and ports of call. (2) Inland Water Network The corridor is about 300 km and is principally comprised by the Buriganga, Dhaleswari, Lower Meghna, Hatiya Channel, Sandwip Channel, and Karnaphuli River. A part of the route crosses through open sea (the Bay of Bengal). The corridor is classified as Class-I, which means that it has a guaranteed navigation depth of at least 3.6 m. The Bangladesh Inland Water Transport Authority (BIWTA) is required to maintain this draft 24 hours a day, all throughout the year. To this end, BIWTA is expected to take all necessary measures, which includes expensive methods such as dredging. Navigation depth in the corridor is seldom allowed to fall below 3.6 m, even during low water seasons.
Data Collection Survey on the Comprehensive Transport Plan between Dhaka and Chittagong Final Report
2-15
Navigating a vessel in the stretch passing through open seas often becomes risky during monsoon season due to occasional occurrence of seasonal storms (commonly known as kal-boisakhi), cyclones and storm-surges. Sailing ships are required to heed ‘cyclone-warnings’ which announce impending high winds and cyclonic weather over radio and television channels. BIWTA provides adequate aids to navigation for day and night sailings. BIWTA also carries out ‘maintenance dredging’ as and when a fall in designated navigation depth is noted. There exist two patches of under-water sand bars, locally known as char, west of Sandwip island. These have formed over the years due to the continuous deposit of silt. Navigation depths are not adequate in this location, and thus vessels are required to sail through by taking advantage of high tides. (3) Inland Container River Terminal There is a purpose-oriented Inland Container River Terminal (ICT) at Pangaon, which is situated within port limits of Dhaka River Port. This facility is backed by Chittagong Port Authority who has provided a designated handling point for inland containers in the port itself. Chittagong Port also possesses three specialized container vessels which are in operational condition; yet there is not much container traffic in the corridor. This is mainly due to lack of interest on the side of the users. (4) Inland River Port There are major inland river ports along the corridor.11 Dhaka provides the country’s most prosperous river port. The other important river ports are situated at Narayanganj, Chandpur, and Barisal. Mirkadim is another river port that has exhibited great potential. The inland river ports are berthing and handling points along the corridor which have better passenger and freight handling facilities. Generally, they are equipped with infrastructure and service-facilities of a comparatively higher scale than those provided in launch berthing stations, also called launch stations or launch ghats, e.g., reinforced cement concrete (RCC) jetty, pontoon, separate waiting rooms and separate toilet facilities for gents and ladies, drinking water, etc.12
(5) Launch Landing/Berthing Station, Launch Station, or Launch Ghat The launch landing/berthing stations, launch stations, or launch ghats are terms used commonly as berthing points for vessels where little or no facilities could be extended, the principal reason being fund constraints. Although there is a need to provide minimum facilities for the travelling public particularly for women carrying babies, the old and infirm, and ill and disabled persons, poor funding to the sector does not allow it. There are some launch ghats with absolutely no facilities; in such places, launches are compelled to berth against the river bank and passengers use a long wooden plank, provided by the launch crew, over which they walk from vessel to shore, and vice versa. Table 2.10 is a list of more important launch stations and launch ghats lying along the corridor:
11 The inland river ports are declared as such by government gazettes. 12 Compared to launch berthing stations, launch ghats are berthing points with facilities of a lower scale.
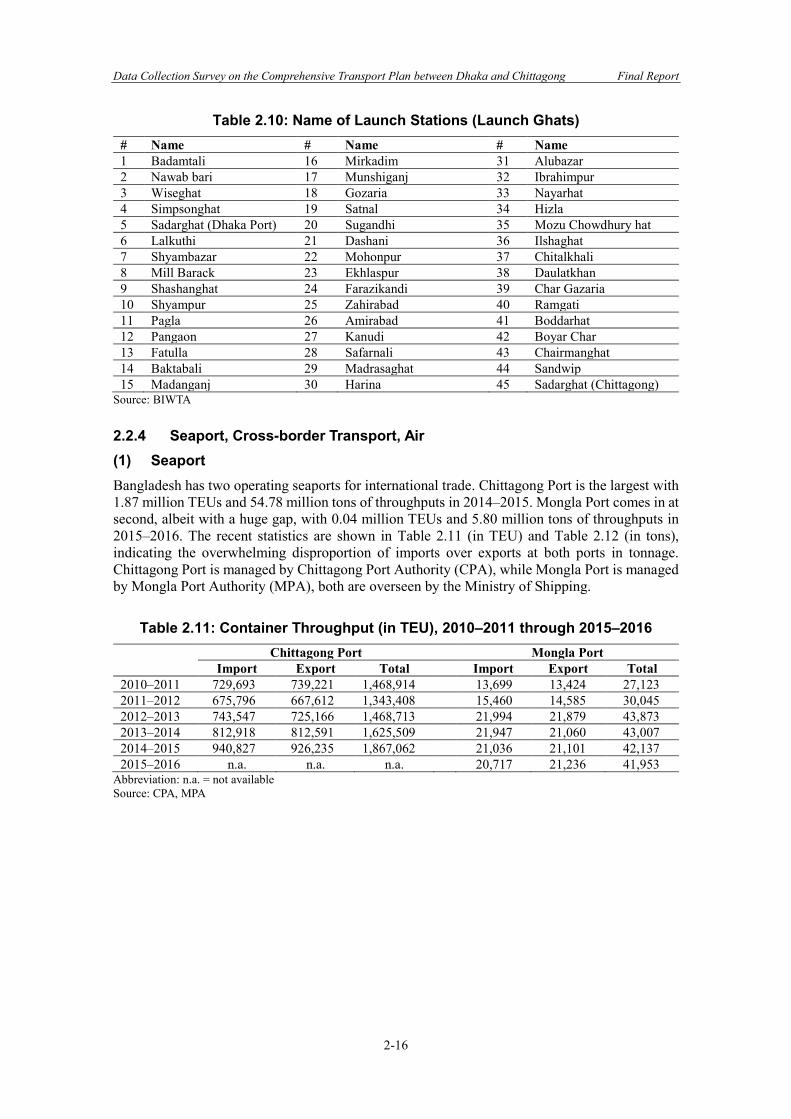
Data Collection Survey on the Comprehensive Transport Plan between Dhaka and Chittagong Final Report
2-16
Table 2.10: Name of Launch Stations (Launch Ghats) # Name # Name # Name 1 Badamtali 16 Mirkadim 31 Alubazar 2 Nawab bari 17 Munshiganj 32 Ibrahimpur 3 Wiseghat 18 Gozaria 33 Nayarhat 4 Simpsonghat 19 Satnal 34 Hizla 5 Sadarghat (Dhaka Port) 20 Sugandhi 35 Mozu Chowdhury hat 6 Lalkuthi 21 Dashani 36 Ilshaghat 7 Shyambazar 22 Mohonpur 37 Chitalkhali 8 Mill Barack 23 Ekhlaspur 38 Daulatkhan 9 Shashanghat 24 Farazikandi 39 Char Gazaria 10 Shyampur 25 Zahirabad 40 Ramgati 11 Pagla 26 Amirabad 41 Boddarhat 12 Pangaon 27 Kanudi 42 Boyar Char 13 Fatulla 28 Safarnali 43 Chairmanghat 14 Baktabali 29 Madrasaghat 44 Sandwip 15 Madanganj 30 Harina 45 Sadarghat (Chittagong)
Source: BIWTA 2.2.4 Seaport, Cross-border Transport, Air (1) Seaport Bangladesh has two operating seaports for international trade. Chittagong Port is the largest with 1.87 million TEUs and 54.78 million tons of throughputs in 2014–2015. Mongla Port comes in at second, albeit with a huge gap, with 0.04 million TEUs and 5.80 million tons of throughputs in 2015–2016. The recent statistics are shown in Table 2.11 (in TEU) and Table 2.12 (in tons), indicating the overwhelming disproportion of imports over exports at both ports in tonnage. Chittagong Port is managed by Chittagong Port Authority (CPA), while Mongla Port is managed by Mongla Port Authority (MPA), both are overseen by the Ministry of Shipping.
Table 2.11: Container Throughput (in TEU), 2010–2011 through 2015–2016
Chittagong Port Mongla Port
Import Export Total Import Export Total 2010–2011 729,693 739,221 1,468,914 13,699 13,424 27,123 2011–2012 675,796 667,612 1,343,408 15,460 14,585 30,045 2012–2013 743,547 725,166 1,468,713 21,994 21,879 43,873 2013–2014 812,918 812,591 1,625,509 21,947 21,060 43,007 2014–2015 940,827 926,235 1,867,062 21,036 21,101 42,137 2015–2016 n.a. n.a. n.a. 20,717 21,236 41,953
Abbreviation: n.a. = not available Source: CPA, MPA
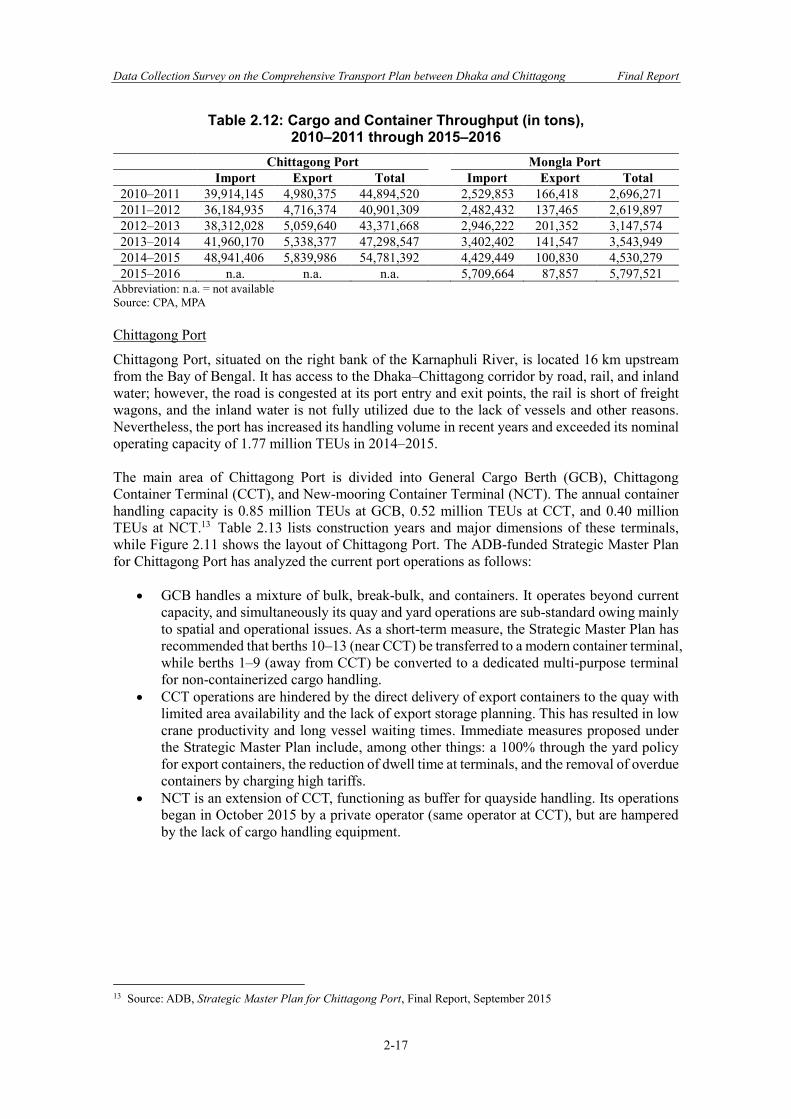
Data Collection Survey on the Comprehensive Transport Plan between Dhaka and Chittagong Final Report
2-17
Table 2.12: Cargo and Container Throughput (in tons), 2010–2011 through 2015–2016
Chittagong Port Mongla Port Import Export Total Import Export Total 2010–2011 39,914,145 4,980,375 44,894,520 2,529,853 166,418 2,696,271 2011–2012 36,184,935 4,716,374 40,901,309 2,482,432 137,465 2,619,897 2012–2013 38,312,028 5,059,640 43,371,668 2,946,222 201,352 3,147,574 2013–2014 41,960,170 5,338,377 47,298,547 3,402,402 141,547 3,543,949 2014–2015 48,941,406 5,839,986 54,781,392 4,429,449 100,830 4,530,279 2015–2016 n.a. n.a. n.a. 5,709,664 87,857 5,797,521
Abbreviation: n.a. = not available Source: CPA, MPA Chittagong Port
Chittagong Port, situated on the right bank of the Karnaphuli River, is located 16 km upstream from the Bay of Bengal. It has access to the Dhaka–Chittagong corridor by road, rail, and inland water; however, the road is congested at its port entry and exit points, the rail is short of freight wagons, and the inland water is not fully utilized due to the lack of vessels and other reasons. Nevertheless, the port has increased its handling volume in recent years and exceeded its nominal operating capacity of 1.77 million TEUs in 2014–2015. The main area of Chittagong Port is divided into General Cargo Berth (GCB), Chittagong Container Terminal (CCT), and New-mooring Container Terminal (NCT). The annual container handling capacity is 0.85 million TEUs at GCB, 0.52 million TEUs at CCT, and 0.40 million TEUs at NCT.13 Table 2.13 lists construction years and major dimensions of these terminals, while Figure 2.11 shows the layout of Chittagong Port. The ADB-funded Strategic Master Plan for Chittagong Port has analyzed the current port operations as follows:
• GCB handles a mixture of bulk, break-bulk, and containers. It operates beyond current capacity, and simultaneously its quay and yard operations are sub-standard owing mainly to spatial and operational issues. As a short-term measure, the Strategic Master Plan has recommended that berths 10–13 (near CCT) be transferred to a modern container terminal, while berths 1–9 (away from CCT) be converted to a dedicated multi-purpose terminal for non-containerized cargo handling.
• CCT operations are hindered by the direct delivery of export containers to the quay with limited area availability and the lack of export storage planning. This has resulted in low crane productivity and long vessel waiting times. Immediate measures proposed under the Strategic Master Plan include, among other things: a 100% through the yard policy for export containers, the reduction of dwell time at terminals, and the removal of overdue containers by charging high tariffs.
• NCT is an extension of CCT, functioning as buffer for quayside handling. Its operations began in October 2015 by a private operator (same operator at CCT), but are hampered by the lack of cargo handling equipment.
13 Source: ADB, Strategic Master Plan for Chittagong Port, Final Report, September 2015
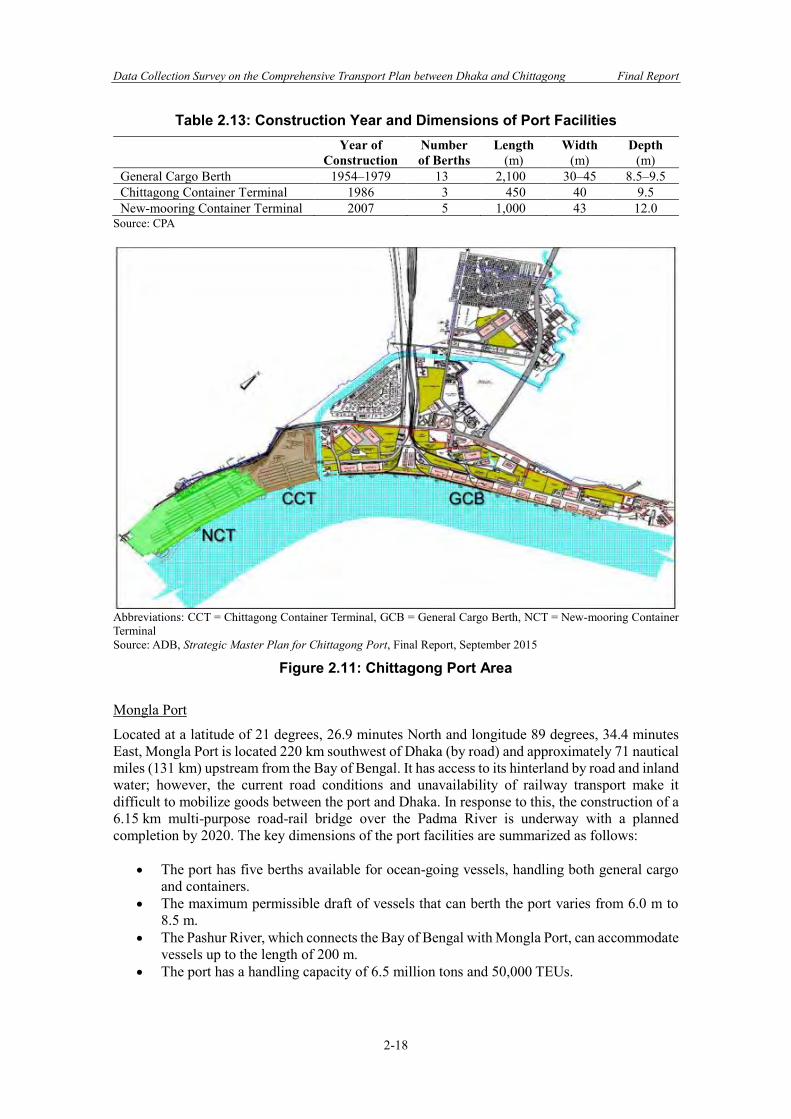
Data Collection Survey on the Comprehensive Transport Plan between Dhaka and Chittagong Final Report
2-18
Table 2.13: Construction Year and Dimensions of Port Facilities
Year of
Construction Number of Berths
Length (m)
Width (m)
Depth (m)
General Cargo Berth 1954–1979 13 2,100 30–45 8.5–9.5 Chittagong Container Terminal 1986 3 450 40 9.5 New-mooring Container Terminal 2007 5 1,000 43 12.0
Source: CPA
Abbreviations: CCT = Chittagong Container Terminal, GCB = General Cargo Berth, NCT = New-mooring Container Terminal Source: ADB, Strategic Master Plan for Chittagong Port, Final Report, September 2015
Figure 2.11: Chittagong Port Area Mongla Port
Located at a latitude of 21 degrees, 26.9 minutes North and longitude 89 degrees, 34.4 minutes East, Mongla Port is located 220 km southwest of Dhaka (by road) and approximately 71 nautical miles (131 km) upstream from the Bay of Bengal. It has access to its hinterland by road and inland water; however, the current road conditions and unavailability of railway transport make it difficult to mobilize goods between the port and Dhaka. In response to this, the construction of a 6.15 km multi-purpose road-rail bridge over the Padma River is underway with a planned completion by 2020. The key dimensions of the port facilities are summarized as follows:
• The port has five berths available for ocean-going vessels, handling both general cargo and containers.
• The maximum permissible draft of vessels that can berth the port varies from 6.0 m to 8.5 m.
• The Pashur River, which connects the Bay of Bengal with Mongla Port, can accommodate vessels up to the length of 200 m.
• The port has a handling capacity of 6.5 million tons and 50,000 TEUs.
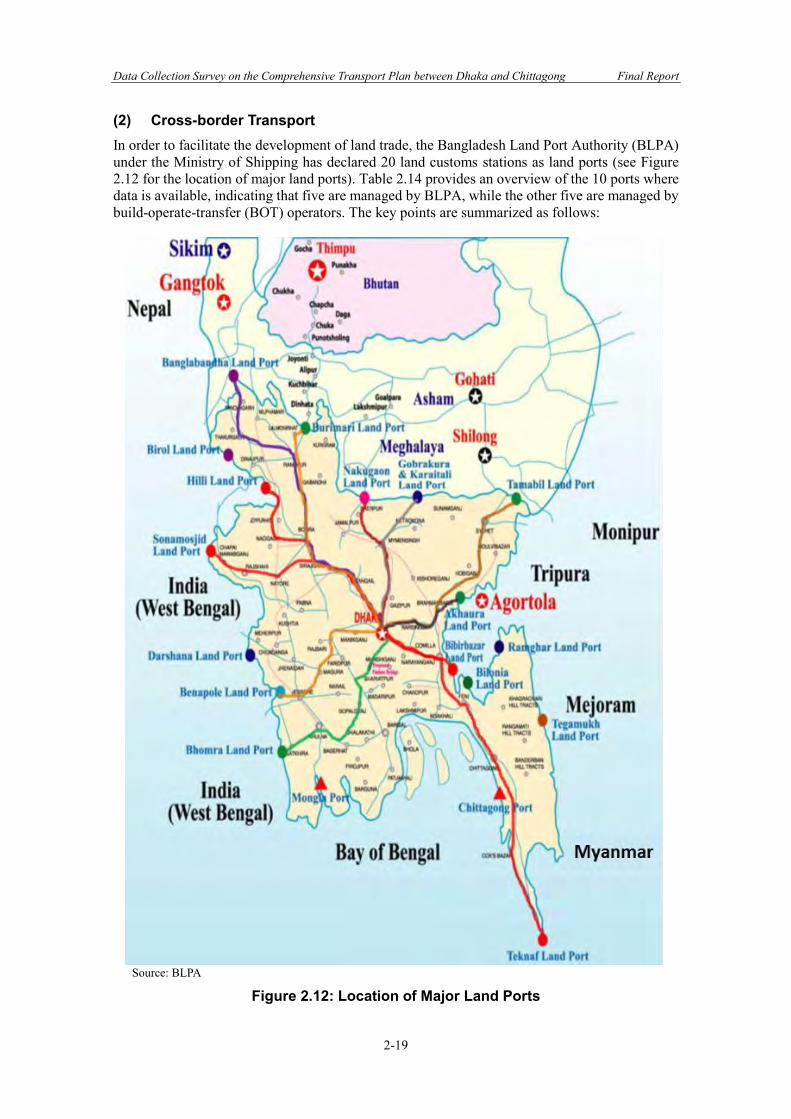
Data Collection Survey on the Comprehensive Transport Plan between Dhaka and Chittagong Final Report
2-19
(2) Cross-border Transport In order to facilitate the development of land trade, the Bangladesh Land Port Authority (BLPA) under the Ministry of Shipping has declared 20 land customs stations as land ports (see Figure 2.12 for the location of major land ports). Table 2.14 provides an overview of the 10 ports where data is available, indicating that five are managed by BLPA, while the other five are managed by build-operate-transfer (BOT) operators. The key points are summarized as follows:
Source: BLPA
Figure 2.12: Location of Major Land Ports
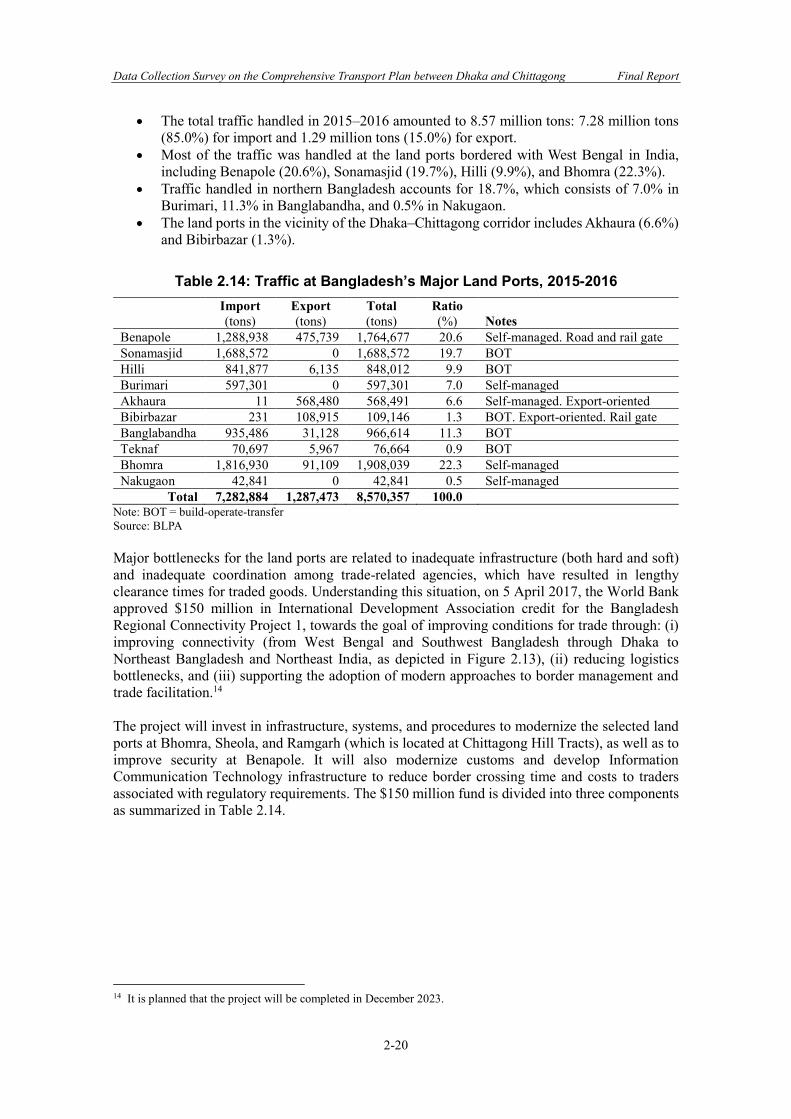
Data Collection Survey on the Comprehensive Transport Plan between Dhaka and Chittagong Final Report
2-20
• The total traffic handled in 2015–2016 amounted to 8.57 million tons: 7.28 million tons (85.0%) for import and 1.29 million tons (15.0%) for export.
• Most of the traffic was handled at the land ports bordered with West Bengal in India, including Benapole (20.6%), Sonamasjid (19.7%), Hilli (9.9%), and Bhomra (22.3%).
• Traffic handled in northern Bangladesh accounts for 18.7%, which consists of 7.0% in Burimari, 11.3% in Banglabandha, and 0.5% in Nakugaon.
• The land ports in the vicinity of the Dhaka–Chittagong corridor includes Akhaura (6.6%) and Bibirbazar (1.3%).
Table 2.14: Traffic at Bangladesh’s Major Land Ports, 2015-2016
Import (tons)
Export (tons)
Total (tons)
Ratio (%) Notes
Benapole 1,288,938 475,739 1,764,677 20.6 Self-managed. Road and rail gate Sonamasjid 1,688,572 0 1,688,572 19.7 BOT Hilli 841,877 6,135 848,012 9.9 BOT Burimari 597,301 0 597,301 7.0 Self-managed Akhaura 11 568,480 568,491 6.6 Self-managed. Export-oriented Bibirbazar 231 108,915 109,146 1.3 BOT. Export-oriented. Rail gate Banglabandha 935,486 31,128 966,614 11.3 BOT Teknaf 70,697 5,967 76,664 0.9 BOT Bhomra 1,816,930 91,109 1,908,039 22.3 Self-managed Nakugaon 42,841 0 42,841 0.5 Self-managed
Total 7,282,884 1,287,473 8,570,357 100.0 Note: BOT = build-operate-transfer Source: BLPA Major bottlenecks for the land ports are related to inadequate infrastructure (both hard and soft) and inadequate coordination among trade-related agencies, which have resulted in lengthy clearance times for traded goods. Understanding this situation, on 5 April 2017, the World Bank approved $150 million in International Development Association credit for the Bangladesh Regional Connectivity Project 1, towards the goal of improving conditions for trade through: (i) improving connectivity (from West Bengal and Southwest Bangladesh through Dhaka to Northeast Bangladesh and Northeast India, as depicted in Figure 2.13), (ii) reducing logistics bottlenecks, and (iii) supporting the adoption of modern approaches to border management and trade facilitation.14 The project will invest in infrastructure, systems, and procedures to modernize the selected land ports at Bhomra, Sheola, and Ramgarh (which is located at Chittagong Hill Tracts), as well as to improve security at Benapole. It will also modernize customs and develop Information Communication Technology infrastructure to reduce border crossing time and costs to traders associated with regulatory requirements. The $150 million fund is divided into three components as summarized in Table 2.14.
14 It is planned that the project will be completed in December 2023.
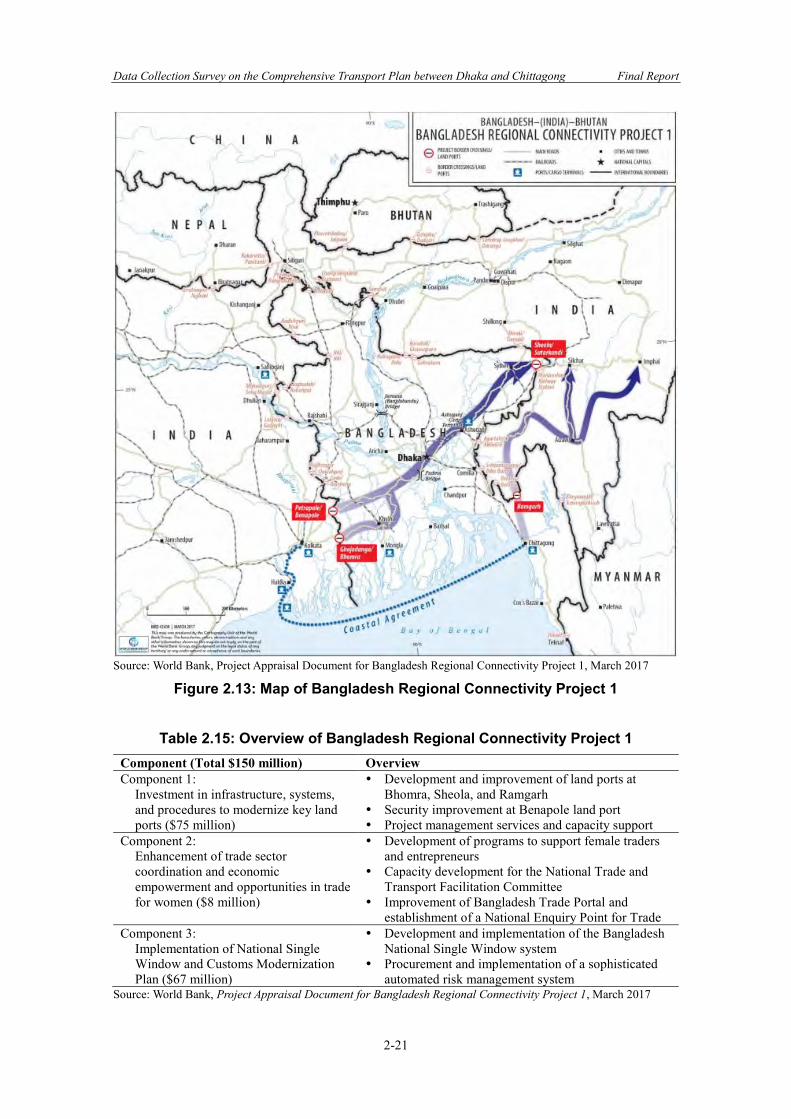
Data Collection Survey on the Comprehensive Transport Plan between Dhaka and Chittagong Final Report
2-21
Source: World Bank, Project Appraisal Document for Bangladesh Regional Connectivity Project 1, March 2017
Figure 2.13: Map of Bangladesh Regional Connectivity Project 1
Table 2.15: Overview of Bangladesh Regional Connectivity Project 1 Component (Total $150 million) Overview Component 1:
Investment in infrastructure, systems, and procedures to modernize key land ports ($75 million)
Development and improvement of land ports at Bhomra, Sheola, and Ramgarh
Security improvement at Benapole land port Project management services and capacity support
Component 2: Enhancement of trade sector coordination and economic empowerment and opportunities in trade for women ($8 million)
Development of programs to support female traders and entrepreneurs
Capacity development for the National Trade and Transport Facilitation Committee
Improvement of Bangladesh Trade Portal and establishment of a National Enquiry Point for Trade
Component 3: Implementation of National Single Window and Customs Modernization Plan ($67 million)
Development and implementation of the Bangladesh National Single Window system
Procurement and implementation of a sophisticated automated risk management system
Source: World Bank, Project Appraisal Document for Bangladesh Regional Connectivity Project 1, March 2017
Data Collection Survey on the Comprehensive Transport Plan between Dhaka and Chittagong Final Report
2-22
(3) Airport As of April 2017, Bangladesh has a total of eight operational airports: three are international airports located in Dhaka, Chittagong, and Sylhet, and five domestic airports situated in Rajshahi, Saidpur, Jessore, Cox’s Bazar, and Barisal. All are under the control of the Civil Aviation Authority of Bangladesh (CAAB), a regulatory body under the Ministry of Civil Aviation and Tourism. In addition to regulatory matters, CAAB handles traffic control (navigation), airport security, as well as airport planning, construction, operations and maintenance. Along the Dhaka–Chittagong corridor, there are airports in Dhaka, Chittagong, and Cox’s Bazar. The Hazrat Shajalal International Airport (HSIA) in Dhaka is the largest, handling about 75% of air passenger and 90% of air cargo of the country. In 2015, it handled 6.48 million passengers (14% for domestic and 86% for international) and 0.26 million tons of cargo (1% for domestic and 99% for international).15 It is anticipated that the airport will reach its passenger handling capacity of 8 million in 2018. In response to this, CAAB (with assistance from JICA) began implementing the Hazrat Shahjalal International Airport Expansion Project (I) in June 2017 to address the short-medium term capacity issues.16 The project includes the construction of a new international passenger terminal, rehabilitation of the existing cargo terminal, and development of peripheral infrastructure (e.g., approach road to the national highway); and is planned to be completed in July 2021 (at the time of service provision at the facilities). After HSIA, the second highest demand is at the Shah Amanat International Airport in Chittagong, which handled about 1 million passengers in 2014. There are 19 flights per direction per day along the Dhaka–Chittagong route, operated by the domestic airlines including Biman Bangladesh Airlines, US-Bangla Airlines, Novoair, and Regent Airways.17 The Cox’s Bazar Airport, is in the process of upgrading to an international airport to attract tourists from overseas. There are about nine flights per direction per day on the Dhaka–Cox’s Bazar route, serviced by the same companies mentioned above. 2.2.5 Export Processing Zones, Economic Zones (1) Export Processing Zones Bangladesh has eight export processing zones (EPZ) – five of them are located along the Dhaka–Chittagong corridor which include Dhaka, Adamjee, Comilla, Chittagong, and Karnaphuli. The remaining three are outside the corridor, which are Mongla, Uttara, and Ishwardi. The EPZs established in strategic locations of the corridor have been fully occupied, attracting much of the investment; while those in remote areas remain unoccupied due mainly to the lack of lines to suppliers and insufficient infrastructure services in the zones.18 All the EPZs are managed by the Bangladesh Export Processing Zones Authority (BEPZA) under the Prime Minister’s Office. Overall, the overall exports from the EPZs have increased steadily over the last five years, at an average of 12.5% per year in 2010-2011 through 2015-2016, as shown in Table 2.16. Considering the EPZ’s total exports of $6,677 million and the country’s total exports of $33,214 million in 2015-2016,19 the EPZ’s contribution to national export reached 20.1%. Over that same time
15 Source: JICA, Preparatory Survey for the Dhaka International Airport Expansion Project, Final Report, March 2017. 16 To address the long-term capacity issues, CAAB commenced the Detailed Feasibility Study for Construction of Bangabandhu Sheikh Mujib International Airport Project in September 2016, with a planned schedule of 18 months. 17 This flight number is based on the flight schedule available at the website of each airline. As domestic flights are prone to cancelation, the actual number would be a bit less than that. 18 In addition, EPZs are mostly operating as enclaves with less backward linkages to the local economy, which led to the government decision to suspend new EPZ development. The government instead launched an initiative to develop economic zones, expecting that local firms can enjoy more spillovers from foreign direct investment. 19 The country’s total export is based on the foreign trade statics data released by the Bangladesh Bureau of Statistics.
Data Collection Survey on the Comprehensive Transport Plan between Dhaka and Chittagong Final Report
2-23
frame, the exports from the five EPZs along the Dhaka–Chittagong corridor was $6,298 million, accounting for 94% of the total exports from all the EPZs.
Table 2.16: Establishment Year, Area, Export, and Growth, 2010–2011 through 2015–2016
Location Establishment
Year Area (Acre)
Export ($ million)
Growth Rate (% per year)
2010–2011 2015–2016 2010-2011 – 2015-2016 Chittagong 1983 453 1,667 2,420 7.7 Dhaka 1993 361 1,522 2,184 7.5 Comilla 2000 267 145 308 16.2 Adamjee 2006 245 165 563 27.9 Karnaphuli 2006 209 138 823 42.9 Mongla 1999 255 28 75 21.7 Uttara 2001 212 7 189 94.6 Ishwardi 2001 309 26 115 34.6
Total 2,311 3,698 6,677 12.5 Sources: BEPZA Table 2.19 provides statistics for the overall performance of EPZs from 1983 (when the first EPZ was established in Chittagong) to March 2017, indicating that a total of 462 industries operating in EPZs is and those under implementation is 129, with a cumulative investment of $4,247 million, exports of $57,630 million, and employment of 468,467.
Table 2.17: Industry, Investment, Export, and Employment up to March 2017
Location
Industry Investment ($ million)
Export ($ million) Employment In Operation
Under Implementation
Chittagong 172 12 1,530 25,857 197,713 Dhaka 102 9 1,273 22,056 91,191 Comilla 41 30 274 1,931 25,912 Adamjee 50 16 411 2,717 53,118 Karnaphuli 48 16 471 3,548 66,924 Mongla 22 15 46 476 2,112 Uttara 12 12 133 520 23,312 Ishwardi 15 19 109 526 8,185
Total 462 129 4,247 57,630 468,467 Sources: BEPZA (2) Economic Zones In recent years, the government promoted the development of economic zones (EZ) with the goal of strengthening linkages and towards integration with the domestic economy, thereby serving to promote industrial diversification. In 2010, the Bangladesh Economic Zone Authority (BEZA) was established under the Prime Minister’s Office with the objective of developing 100 EZs in the country over the next 15 years.20 These candidate sites are presented in Figure 2.14, indicating that a relatively large number of EZs are planned in the corridor from Dhaka to Chittagong, and even further to Cox’s Bazar (especially Matarbari where the construction of a new deep seaport is planned, and the development of coal-fired power plants and the surrounding infrastructure is underway with JICA assistance).
20 It also aims at generating 10 million employment and growing export from the economic zones to $ 40 billion.
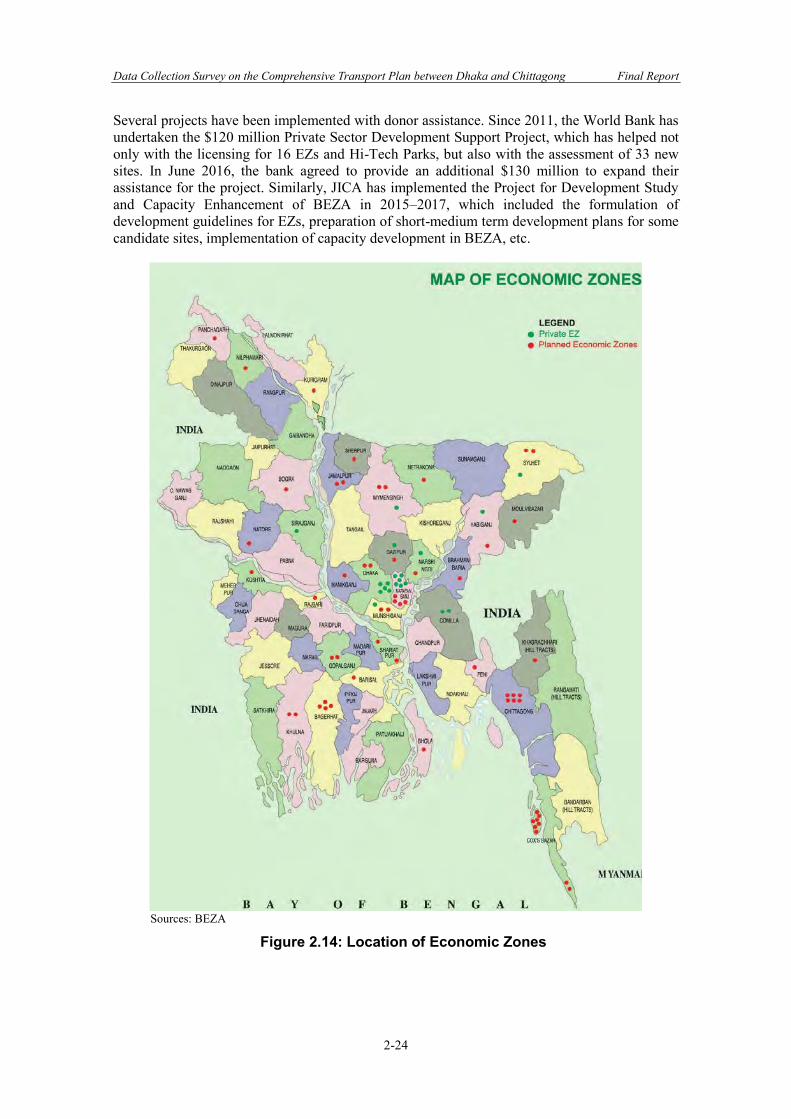
Data Collection Survey on the Comprehensive Transport Plan between Dhaka and Chittagong Final Report
2-24
Several projects have been implemented with donor assistance. Since 2011, the World Bank has undertaken the $120 million Private Sector Development Support Project, which has helped not only with the licensing for 16 EZs and Hi-Tech Parks, but also with the assessment of 33 new sites. In June 2016, the bank agreed to provide an additional $130 million to expand their assistance for the project. Similarly, JICA has implemented the Project for Development Study and Capacity Enhancement of BEZA in 2015–2017, which included the formulation of development guidelines for EZs, preparation of short-medium term development plans for some candidate sites, implementation of capacity development in BEZA, etc.
Sources: BEZA
Figure 2.14: Location of Economic Zones
Data Collection Survey on the Comprehensive Transport Plan between Dhaka and Chittagong Final Report
2-25
2.3 Development Plans and Projects 2.3.1 Road Developments (1) Road Master Plan In 2009, the Roads and Highways Department (RHD) prepared the Bangladesh Road Master Plan following the direction provided by the National Land Transport Policy (NLTP), which committed the government to developing a long-term plan. This master plan was intended to guide road sector investment over the 20 years. It has been compiled based on a thorough diagnosis of the following existing issues of the RHD road network and future challenges to be faced:
• Roads and bridges are continuously damaged from a lack of adequate maintenance and vehicle overloading;
• Continuing traffic growth that will exceed the capacity of many National Highways within the next 20 years;
• A mix of motorized and non-motorized traffic, and encroachment onto roads, leading to high accident rates;
• The country’s rural centers are not fully connected with the main road network; and • The large number of rivers that are still crossed by ferries hampers smooth movement of
traffic. The objectives of the master plan are to set out a comprehensive investment program that will:
• Protect the value of RHD’s road and bridge assets; • Improve the connectivity of the road network; • Enhance and develop the strategic road network to meet economic and traffic growth
targets; • Improve the Zila Road network to enhance connectivity to the country’s growth centers; • Improve road safety and reduce road accidents; • Provide environmental and social protection; and • Outline the institutional improvements required for RHD to deliver the above.
RHD in collaboration with LGED is planning to update the road master plan. It is considered that the update is needed due to various changes of the existing master plan scenario, including the recent government promotion of developing economic zones (see Subsection 2.2.5 (2) for details) and the increasing importance of regional connectivity, road maintenance, and traffic safety. As of August 2017, it is planned that the update will commence in 2018, with a planned study period of 13 months, and that ADB will provide technical assistance under the SASEC Road Connectivity Project II. (2) Dhaka–Chittagong Expressway Project The Asian Development Bank (ADB) assisted in designing the Dhaka–Chittagong Expressway Project for financing under a public-private partnership (PPP) scheme.21 A feasibility study has been undertaken with the objective of assessing various route alignment options in terms of technical, financial, economic, environmental, and social perspectives so that the government could decide the most advantageous alignment for the project. Key recommendations of the feasibility study are as follows:
21 According to the ADB’s Project Data Sheet for Bangladesh: Dhaka–Chittagong Expressway Public-Private Partnership Design Project (updated in March 2017), the project began in June 2013 (when the credit became effective) and is due to close in March 2018.
Data Collection Survey on the Comprehensive Transport Plan between Dhaka and Chittagong Final Report
2-26
• The project may be developed in three separate phases (i.e., Dhaka–Comilla, Comilla–Feni, and Feni–Chittagong) to reduce the upfront capital costs and increase private sector participation.
• Instead of developing the Expressway as a green field project, the government could change the project scope to include widening the existing National Highway N1 to eight lanes and operating and maintaining the highway on a PPP basis to mainly reduce the land acquisition costs.
Following the feasibility study, transaction advisory services began in September 2015. The scope of the services is to: (i) review the financial parameters and examine the viability of the project; (ii) prepare the concession agreement including the pre-qualification and bid documents; (iii) assist the Roads and Highways Department (RHD), an executing agency, in the bid process; (iv) provide advice relating to financial and legal issues, etc. As of August 2017, the transaction advisory service is underway with a planned completion by March 2018. According to RHD, the proposed alignment has a total length of 218 km, of which 83.8 km is on the Dhaka–Comilla, 53.2 km is on the Comilla–Feni, and 81 km on the Feni–Chittagong sections.22 The total project cost is estimated at $ 2,376.9 million, 30% of which is planned to be covered by the Viable Gap Financing (VGF). It is planned that construction will begin in 2018, and that the expressway will be open in 2023. The other key features of the project are summarized as follows:
• Elevated section amounts to a total of 14.49 km, accounting for 7% of the entire length. • There will be 36 flyovers, 29 bridges, 7 toll plazas, and 77 underpasses. • Access will be limited to the following seven interchanges: Madanpur, Daudkandi, North
Comilla, South Comilla, Feni, Bariyarhat, and Salimpur. • The annual average daily traffic is projected at 23,942 vehicles per day in 2030, up from
10,830 vehicles per day in 2023, assuming the average growth rate of 12.0% per annum over the 2023-2030 period.
• While the project is intended to provide a four-lane expressway, it will require six lanes in 2037 considering the traffic growth assumed in the demand forecast.
(3) Dhaka–Chittagong Multimodal Transport Corridor (Elevated Expressway) Apart from the above Dhaka–Chittagong Expressway Project being formulated under the ADB assistance, the Bangladesh Bridge Authority (BBA) is planning to undertake the feasibility study on the Dhaka–Chittagong Multimodal Transport Corridor using their own funds. Although this would include both high-speed rail and expressway, little coordination has been made between the relevant organizations. The expression of interest (EOI) for this consultancy service was issued in October 2016. As of October 2017, BBA is preparing the request for proposal (RFP) with a plan to procure a consultant in six months, and to conduct the feasibility study in another 18 months. The tentative assignments of the consultancy services include, among other things, the following:23
• Geotechnical investigation, topographic survey, as well as a hydrological and morphological study for rivers crossing the corridor.
• Traffic survey, traffic analysis, and traffic forecasts for different scenarios. 22 As of August 2017, RHD is planning to implement the Dhaka–Comilla, Comilla–Feni, and Feni–Chittagong sections simultaneously, and the request of VGH and the Detailed Project Proposal for land acquisition and utility relocation are both based on the simultaneous implementation. 23 Source: BBA, Request for Expression of Interest (EOI) for the Consultancy Services for Feasibility Study to develop the Dhaka–Chittagong Multimodal Transport Corridor (Elevated Expressway), October 2016.
Data Collection Survey on the Comprehensive Transport Plan between Dhaka and Chittagong Final Report
2-27
• Assessment of location and alignment of the main corridor, access/approach roads, ramps, etc.
• Preliminary design of the elevated expressway including high-speed train. • Cost estimate, economic and financial analysis, and risk assessment. • Environment impact assessment (EIA) and preparation of land acquisition and
resettlement action plans. • Determination of the optimal implementation model of the project. • Review of legislation related to project financing and project implementation model.
(4) Kanchpur, Meghna, and Gumti 2nd Bridges Construction and Existing Bridge
Rehabilitation Project (I) (II) In March 2013, JICA signed a loan agreement with the Government of Bangladesh to provide a Japanese ODA loan of up to 28,945 million yen ($311 million) for the Kanchpur, Meghna, and Gumti 2nd Bridges Construction and Existing Bridge Rehabilitation Project (I).24 The project aims to improve the safety of the exiting bridges concerning bridge pier corrosion and earthquake resistance, as well as to satisfy increasing transport demand, by rehabilitating and constructing the three bridges on the National Highways N1 between Dhaka and Chittagong, thereby contributing to the revitalization of the Bangladesh economy.25 The project components are as follows:26
• Repair of Kanchpur, Bridge (0.4 km, four-lane), Meghna Bridge (0.9 km, two-lane), and Gumti Bridge (1.4 km, two-lane);
• Construction of 2nd Kanchpur Bridge (four-lane), 2nd Meghna Bridge (four-lane), 2nd Gumti Bridge (four-lane), and their approach roads;
• Installation of overloading control equipment: axle load scales (two for each bridge), deck scales (one for each bridge), and an inspection vehicle (one for all bridges); and
• Consulting services, including detailed design, bidding assistance, and construction supervision.
In November 2015, an executing agency of RHD signed the contract with a joint venture of Japanese contractors. In June 2017, JICA signed another loan agreement with the government to provide an additional Japanese ODA loan of up to 52,730 million yen for the project. It is planned that the project will be completed in January 2020 (at the time of service provision at the facilities). (5) East West Elevated Expressway, Dhaka BBA is preparing the implementation of the East West Elevated Expressway Project. The 39-km proposed expressway connects N5 in the western perimeter of Dhaka with N8 in the south and further to N1 in the east, thereby removing through traffic from Dhaka and reducing traffic congestion in the capital. According to BBA, it is planned that the project is divided into two separate packages, with an estimated project cost of approximately $1 billion for each. BBA plans to implement the project by utilizing a BOT scheme, and hopes to procure funding by the end of 2018. (6) Construction of Multi-Lane Tunnel under the River Karnaphuli, Chittagong BBA is also preparing the implementation of four-lane tunnel under Karnaphuli River in Chittagong. The 9.1-km tunnel (including the length of approach roads in both sides) connects 24 The total project cost is estimated at 88,464 million yen ($ 950 million). 25 It is noted that the four laning of Dhaka–Chittagong National Highway Project (Daudkandi–Chittagong section with 192 km) was completed in July 2016. 26 Source: JICA, Ex-Ante Evaluation (for Japanese ODA Loan) for the Kanchpur, Meghna, and Gumti 2nd Bridges Construction and Existing Bridges Rehabilitation Project (I). March 2013.
Data Collection Survey on the Comprehensive Transport Plan between Dhaka and Chittagong Final Report
2-28
the Chittagong Port City with other side of the Karnaphuli River. The project cost is estimated at $ 681.84 million. The project has been planned with Chinese assistance: its feasibility study is completed in April 2013, with detailed design and land acquisition is ongoing as of April 2017. According to BBA, the project is planned to be completed in June 2020. 2.3.2 Rail Developments (1) Railway Master Plan The government has approved the Railway Master Plan prepared by Bangladesh Railway (BR) with support of the UK Department for International Development (DFID). The master plan proposes a total of 235 projects costing Taka 23 billion ($30 billion) over the 2010–2030 period. It sets out the infrastructure requirements to achieve the following goals:
• Increase railway efficiency with interventions to make best use of assets; • Extend railway (infrastructure) to meet policy objectives; • Integrate railway network through a multimodal approach; • Allow railways to pay a greater role in the overall transport sector with a view toward
contributing to economic and social development; • Prepare railways to play a role in regional and international context; • Establish Broad Gauge throughout the country to bring uniformity to the Gauge System; • Extend its network within the capital city of Dhaka by introducing metro system to reduce
traffic congestion; and • Modernize its loco-workshops and training institute with an eye towards increasing its
operation and human capacity. Nevertheless, the government has emphasized the development of the railway sector in recent years, which has led to changes in the present BR scenario from what was envisaged in the master plan. In response to this, BR has been undertaking the following activities under the ADB-funded SASEC Railway Connectivity Investment Program:
• Updating the Railway Master Plan; • Assessment of the rolling stock maintenance sector of BR and recommendations for the
future strategy, investments, and organization; • Assessment for the establishment of Mechanized Track Maintenance Unit of BR and
recommendations for the strategy, investments, and organization; and • Assessment for the establishment of a Research and Development Wing for BR
The revised master plan looks at the next 30 years until 2045. The TA outlined above came into effect in December 2014, and is planned to be completed in December 2017 as of October 2017. At present, BR has 43 development projects at the total cost of Taka 8,643 million. Annual Development Program’s (ADP) allocation in the current fiscal year is Taka 881 million, including Taka 337 million of GOB’s self-funding and Taka 544 million from Project Aid. To date, several important projects have been completed in recent years. Furthermore, construction of the dual gauge double line of Tongi–Bhairab Bazar (64 km) and Laksham–Chinki Astana (61 km) on the Dhaka–Chittagong railway corridor will be completed shortly. (2) Sub-Regional Transport Project Preparatory Facility Since 2010, ADB has been providing a $53 million technical assistance (TA) loan under Sub-Regional Transport Project Preparatory Facility to facilitate the preparation of a series of regional cooperation and integration transport projects in roads and railways. Under the TA project,
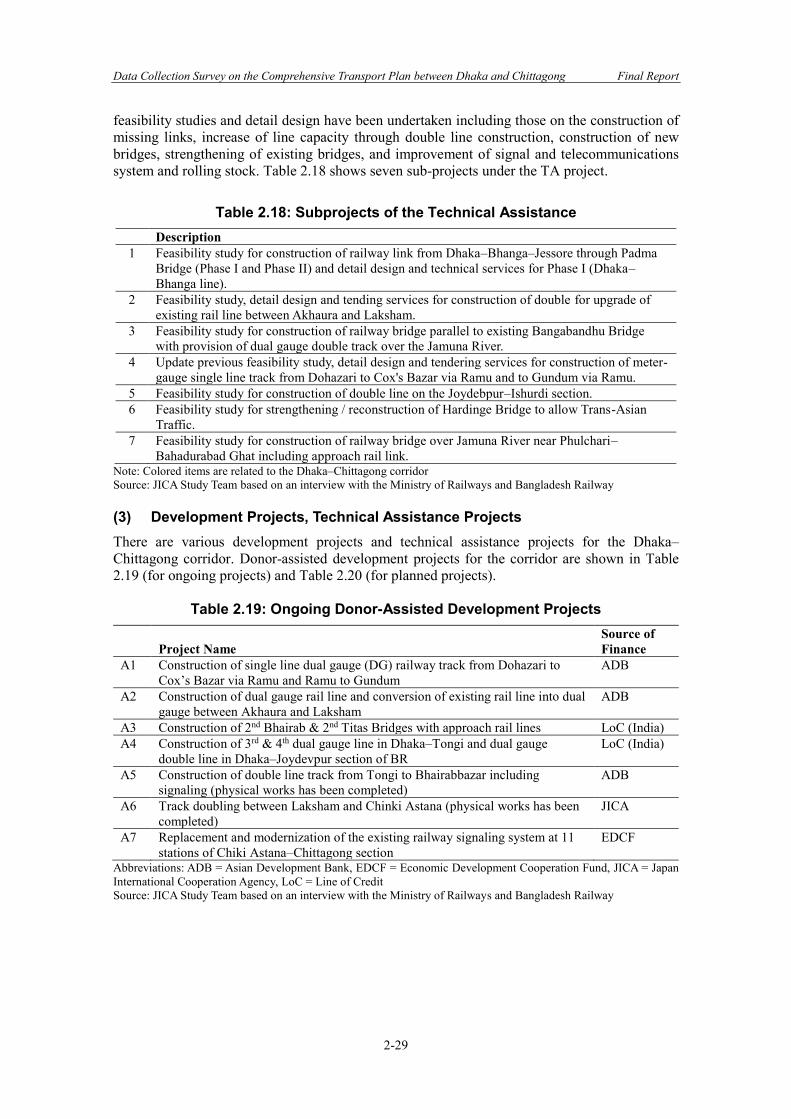
Data Collection Survey on the Comprehensive Transport Plan between Dhaka and Chittagong Final Report
2-29
feasibility studies and detail design have been undertaken including those on the construction of missing links, increase of line capacity through double line construction, construction of new bridges, strengthening of existing bridges, and improvement of signal and telecommunications system and rolling stock. Table 2.18 shows seven sub-projects under the TA project.
Table 2.18: Subprojects of the Technical Assistance Description
1 Feasibility study for construction of railway link from Dhaka–Bhanga–Jessore through Padma Bridge (Phase I and Phase II) and detail design and technical services for Phase I (Dhaka–Bhanga line).
2 Feasibility study, detail design and tending services for construction of double for upgrade of existing rail line between Akhaura and Laksham.
3 Feasibility study for construction of railway bridge parallel to existing Bangabandhu Bridge with provision of dual gauge double track over the Jamuna River.
4 Update previous feasibility study, detail design and tendering services for construction of meter-gauge single line track from Dohazari to Cox's Bazar via Ramu and to Gundum via Ramu.
5 Feasibility study for construction of double line on the Joydebpur–Ishurdi section. 6 Feasibility study for strengthening / reconstruction of Hardinge Bridge to allow Trans-Asian
Traffic. 7 Feasibility study for construction of railway bridge over Jamuna River near Phulchari–
Bahadurabad Ghat including approach rail link. Note: Colored items are related to the Dhaka–Chittagong corridor Source: JICA Study Team based on an interview with the Ministry of Railways and Bangladesh Railway (3) Development Projects, Technical Assistance Projects There are various development projects and technical assistance projects for the Dhaka–Chittagong corridor. Donor-assisted development projects for the corridor are shown in Table 2.19 (for ongoing projects) and Table 2.20 (for planned projects).
Table 2.19: Ongoing Donor-Assisted Development Projects
Project Name Source of Finance
A1 Construction of single line dual gauge (DG) railway track from Dohazari to Cox’s Bazar via Ramu and Ramu to Gundum
ADB
A2 Construction of dual gauge rail line and conversion of existing rail line into dual gauge between Akhaura and Laksham
ADB
A3 Construction of 2nd Bhairab & 2nd Titas Bridges with approach rail lines LoC (India) A4 Construction of 3rd & 4th dual gauge line in Dhaka–Tongi and dual gauge
double line in Dhaka–Joydevpur section of BR LoC (India)
A5 Construction of double line track from Tongi to Bhairabbazar including signaling (physical works has been completed)
ADB
A6 Track doubling between Laksham and Chinki Astana (physical works has been completed)
JICA
A7 Replacement and modernization of the existing railway signaling system at 11 stations of Chiki Astana–Chittagong section
EDCF
Abbreviations: ADB = Asian Development Bank, EDCF = Economic Development Cooperation Fund, JICA = Japan International Cooperation Agency, LoC = Line of Credit Source: JICA Study Team based on an interview with the Ministry of Railways and Bangladesh Railway
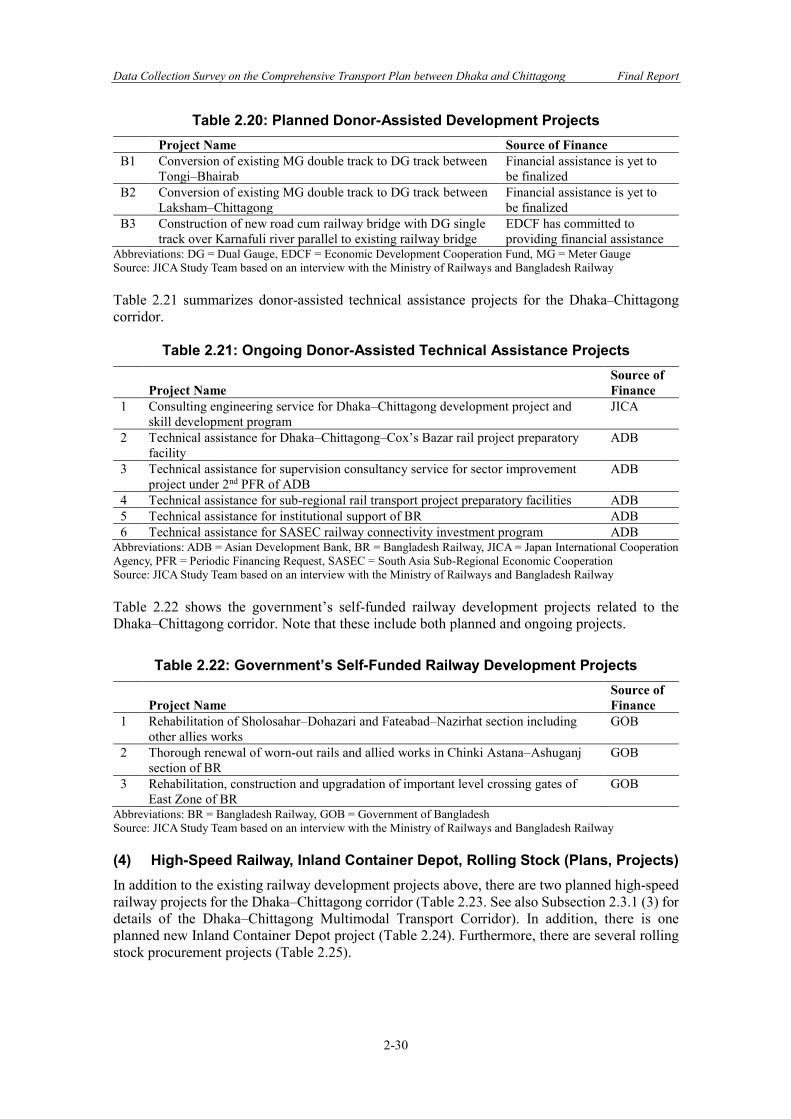
Data Collection Survey on the Comprehensive Transport Plan between Dhaka and Chittagong Final Report
2-30
Table 2.20: Planned Donor-Assisted Development Projects Project Name Source of Finance B1 Conversion of existing MG double track to DG track between
Tongi–Bhairab Financial assistance is yet to be finalized
B2 Conversion of existing MG double track to DG track between Laksham–Chittagong
Financial assistance is yet to be finalized
B3 Construction of new road cum railway bridge with DG single track over Karnafuli river parallel to existing railway bridge
EDCF has committed to providing financial assistance
Abbreviations: DG = Dual Gauge, EDCF = Economic Development Cooperation Fund, MG = Meter Gauge Source: JICA Study Team based on an interview with the Ministry of Railways and Bangladesh Railway Table 2.21 summarizes donor-assisted technical assistance projects for the Dhaka–Chittagong corridor.
Table 2.21: Ongoing Donor-Assisted Technical Assistance Projects
Project Name Source of Finance
1 Consulting engineering service for Dhaka–Chittagong development project and skill development program
JICA
2 Technical assistance for Dhaka–Chittagong–Cox’s Bazar rail project preparatory facility
ADB
3 Technical assistance for supervision consultancy service for sector improvement project under 2nd PFR of ADB
ADB
4 Technical assistance for sub-regional rail transport project preparatory facilities ADB 5 Technical assistance for institutional support of BR ADB 6 Technical assistance for SASEC railway connectivity investment program ADB
Abbreviations: ADB = Asian Development Bank, BR = Bangladesh Railway, JICA = Japan International Cooperation Agency, PFR = Periodic Financing Request, SASEC = South Asia Sub-Regional Economic Cooperation Source: JICA Study Team based on an interview with the Ministry of Railways and Bangladesh Railway Table 2.22 shows the government’s self-funded railway development projects related to the Dhaka–Chittagong corridor. Note that these include both planned and ongoing projects.
Table 2.22: Government’s Self-Funded Railway Development Projects
Project Name Source of Finance
1 Rehabilitation of Sholosahar–Dohazari and Fateabad–Nazirhat section including other allies works
GOB
2 Thorough renewal of worn-out rails and allied works in Chinki Astana–Ashuganj section of BR
GOB
3 Rehabilitation, construction and upgradation of important level crossing gates of East Zone of BR
GOB
Abbreviations: BR = Bangladesh Railway, GOB = Government of Bangladesh Source: JICA Study Team based on an interview with the Ministry of Railways and Bangladesh Railway (4) High-Speed Railway, Inland Container Depot, Rolling Stock (Plans, Projects) In addition to the existing railway development projects above, there are two planned high-speed railway projects for the Dhaka–Chittagong corridor (Table 2.23. See also Subsection 2.3.1 (3) for details of the Dhaka–Chittagong Multimodal Transport Corridor). In addition, there is one planned new Inland Container Depot project (Table 2.24). Furthermore, there are several rolling stock procurement projects (Table 2.25).
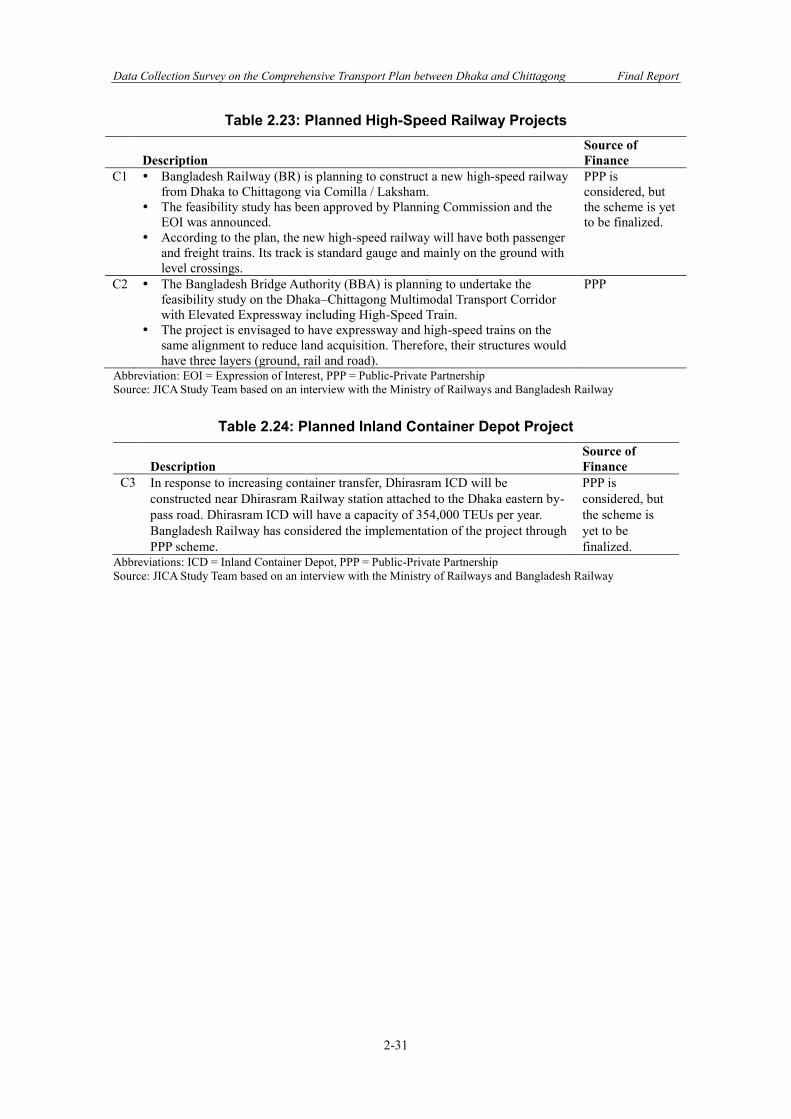
Data Collection Survey on the Comprehensive Transport Plan between Dhaka and Chittagong Final Report
2-31
Table 2.23: Planned High-Speed Railway Projects
Description Source of Finance
C1 Bangladesh Railway (BR) is planning to construct a new high-speed railway from Dhaka to Chittagong via Comilla / Laksham.
The feasibility study has been approved by Planning Commission and the EOI was announced.
According to the plan, the new high-speed railway will have both passenger and freight trains. Its track is standard gauge and mainly on the ground with level crossings.
PPP is considered, but the scheme is yet to be finalized.
C2 The Bangladesh Bridge Authority (BBA) is planning to undertake the feasibility study on the Dhaka–Chittagong Multimodal Transport Corridor with Elevated Expressway including High-Speed Train.
The project is envisaged to have expressway and high-speed trains on the same alignment to reduce land acquisition. Therefore, their structures would have three layers (ground, rail and road).
PPP
Abbreviation: EOI = Expression of Interest, PPP = Public-Private Partnership Source: JICA Study Team based on an interview with the Ministry of Railways and Bangladesh Railway
Table 2.24: Planned Inland Container Depot Project
Description Source of Finance
C3 In response to increasing container transfer, Dhirasram ICD will be constructed near Dhirasram Railway station attached to the Dhaka eastern by-pass road. Dhirasram ICD will have a capacity of 354,000 TEUs per year. Bangladesh Railway has considered the implementation of the project through PPP scheme.
PPP is considered, but the scheme is yet to be finalized.
Abbreviations: ICD = Inland Container Depot, PPP = Public-Private Partnership Source: JICA Study Team based on an interview with the Ministry of Railways and Bangladesh Railway
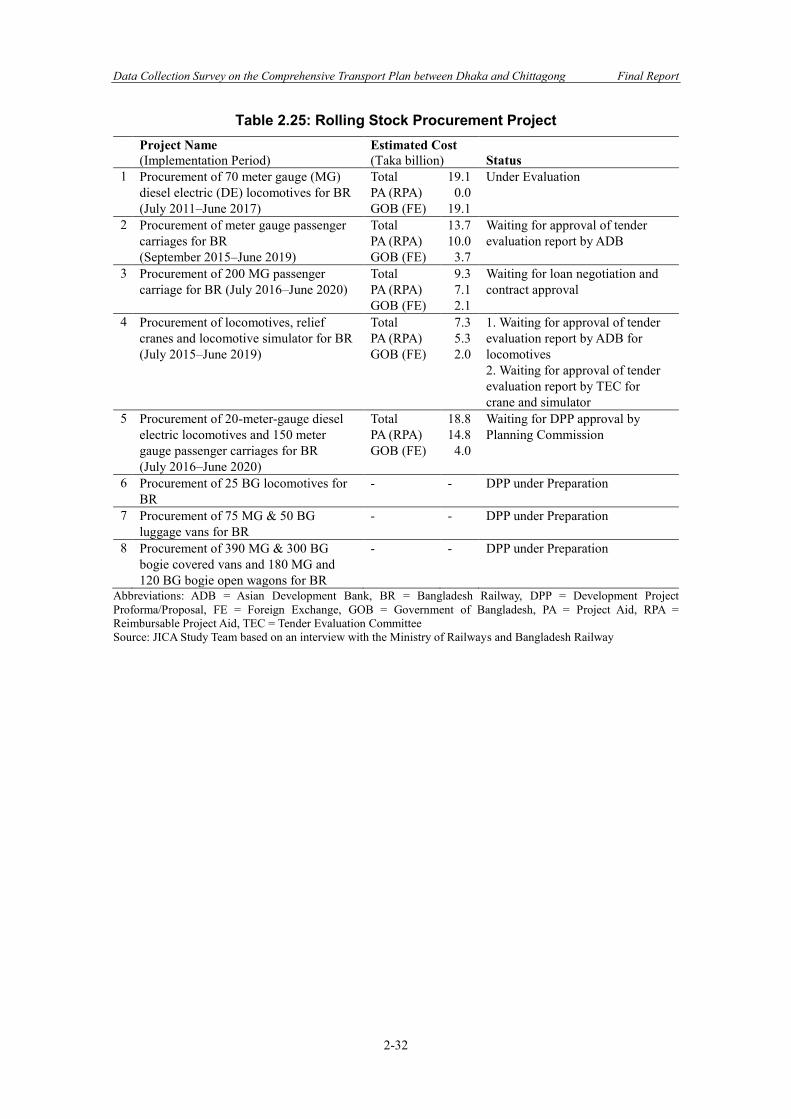
Data Collection Survey on the Comprehensive Transport Plan between Dhaka and Chittagong Final Report
2-32
Table 2.25: Rolling Stock Procurement Project Project Name
(Implementation Period) Estimated Cost (Taka billion) Status
1 Procurement of 70 meter gauge (MG) diesel electric (DE) locomotives for BR (July 2011–June 2017)
Total PA (RPA) GOB (FE)
19.1 0.0
19.1
Under Evaluation
2
Procurement of meter gauge passenger carriages for BR (September 2015–June 2019)
Total PA (RPA) GOB (FE)
13.7 10.0
3.7
Waiting for approval of tender evaluation report by ADB
3 Procurement of 200 MG passenger carriage for BR (July 2016–June 2020)
Total PA (RPA) GOB (FE)
9.3 7.1 2.1
Waiting for loan negotiation and contract approval
4 Procurement of locomotives, relief cranes and locomotive simulator for BR (July 2015–June 2019)
Total PA (RPA) GOB (FE)
7.3 5.3 2.0
1. Waiting for approval of tender evaluation report by ADB for locomotives 2. Waiting for approval of tender evaluation report by TEC for crane and simulator
5 Procurement of 20-meter-gauge diesel electric locomotives and 150 meter gauge passenger carriages for BR (July 2016–June 2020)
Total PA (RPA) GOB (FE)
18.8 14.8
4.0
Waiting for DPP approval by Planning Commission
6 Procurement of 25 BG locomotives for BR
- - DPP under Preparation
7 Procurement of 75 MG & 50 BG luggage vans for BR
- - DPP under Preparation
8 Procurement of 390 MG & 300 BG bogie covered vans and 180 MG and 120 BG bogie open wagons for BR
- - DPP under Preparation
Abbreviations: ADB = Asian Development Bank, BR = Bangladesh Railway, DPP = Development Project Proforma/Proposal, FE = Foreign Exchange, GOB = Government of Bangladesh, PA = Project Aid, RPA = Reimbursable Project Aid, TEC = Tender Evaluation Committee Source: JICA Study Team based on an interview with the Ministry of Railways and Bangladesh Railway
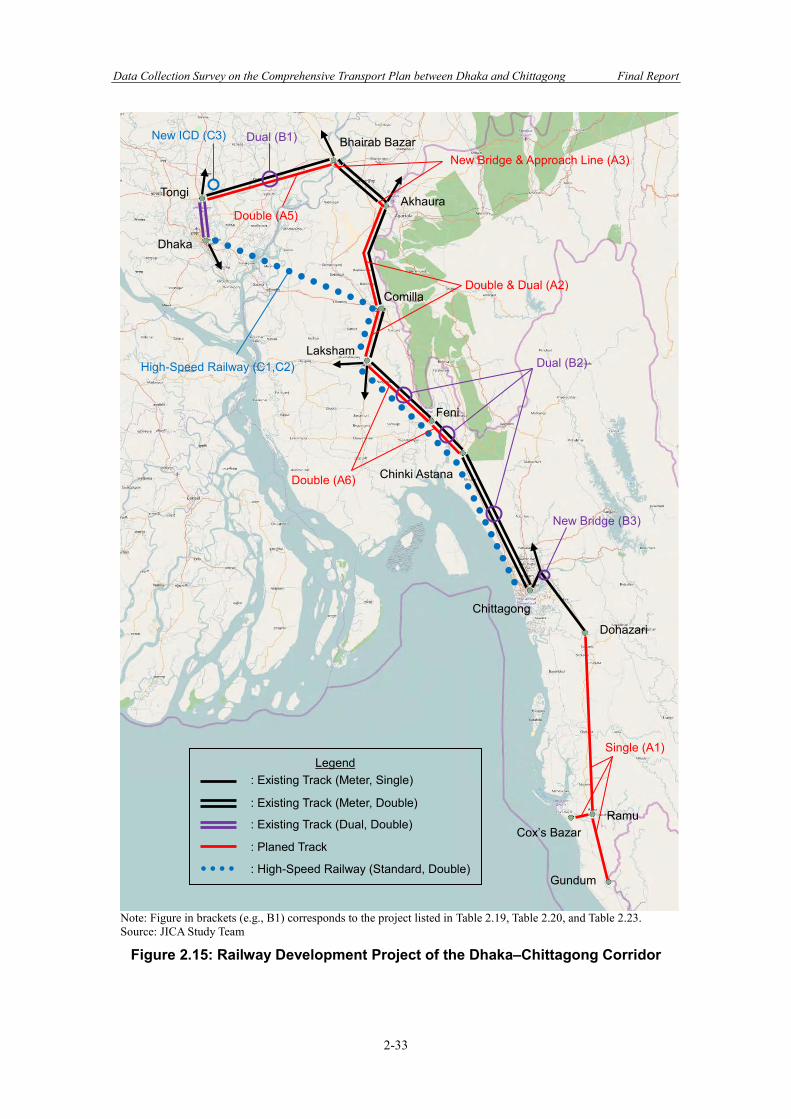
Data Collection Survey on the Comprehensive Transport Plan between Dhaka and Chittagong Final Report
2-33
Note: Figure in brackets (e.g., B1) corresponds to the project listed in Table 2.19, Table 2.20, and Table 2.23. Source: JICA Study Team
Figure 2.15: Railway Development Project of the Dhaka–Chittagong Corridor
Dhaka
Tongi
Comilla
Laksham
Akhaura
Bhairab Bazar
Feni
Chinki Astana
Chittagong
Dohazari
Cox’s Bazar
Legend : Existing Track (Meter, Single)
: Existing Track (Meter, Double)
: Existing Track (Dual, Double) Ramu
Gundum
New ICD (C3)
High-Speed Railway (C1,C2)
Double (A5)
Double & Dual (A2)
Double (A6)
Single (A1)
New Bridge (B3)
Dual (B2)
Dual (B1)
: Planed Track
: High-Speed Railway (Standard, Double)
New Bridge & Approach Line (A3)
Data Collection Survey on the Comprehensive Transport Plan between Dhaka and Chittagong Final Report
2-34
2.3.3 Inland Water Developments (1) Seventh Five Year Plan, 2016–2020 The Government of Bangladesh, cognizant of the country’s naturally advantageous network of vast inland waterways, prepared the current Seventh Five Year Plan. It principally aims to develop a low-cost, safe and environment-friendly mode of transport. The main priorities enumerated in the document are as follows:
a) Development of navigability of inland waterways by dredging and resuscitation of dead and dying river routes;
b) Maintenance of navigable waterways by regular dredging; c) Facilitating flow of passengers and cargo through development of inland river ports, and
by providing navigational aids for smooth and safe movement of cargo and passenger vessels;
d) Development of inland container river port for transportation of containers by waterways to/ from two sea-ports;
e) Develop river port handling facilities as well as storage facilities and introduce mechanical equipment for handling cargo in order to save waiting time for berthing of vessels;
f) Develop rural launch landing stations by providing pontoon facilities for smooth embarkation/ disembarkation of passenger and loading/ unloading of cargo;
g) Digitize all the services provided by BIWTA introducing web-based data base application;
h) Protect the main channel of the river by clearing and removing garbage and unauthorized encroachment; and
i) Restoration of Buriganga river and waterways around Dhaka city to make it pollution-free, navigable and wider.
The goals and targets set for the Seventh Plan are set forth in Table 2.26.
Table 2.26: Inland Water Development Program in Seventh Plan Sl. No. Goals Targets i Development of new
waterways and maintaining navigability of existing channels
• Hydrographic survey of inland waterway 6,000 km and 1,000 m2 of coaster waterways;
• Dredging of 3,600 lakh cubic meter; • Procurement of 30 dredgers; • Several lots of navigational aids; • Procurement of different no of service vessels.
ii Operation, maintenance and establishment of landing stations and river ports for cargo and container
• Construction of 10 river ports; • Modernization of 9 river ports; • Construction of 2 container terminals (ICT); • Procurement of various sizes of 135 pontoons; • Several lots of civil structure.
iii Digitization of services related to IWT system
• Introduction of e-governance; • Institutional reform and restructuring.
iv Facilitating maritime education and training
Establishment of a training institution
Source: Ministry of Shipping (2) Annual Development Program, 2016–2017 A list of projects included in the Annual Development Program (ADP), 2016–2017 is shown in Table 2.27 (for BIWTA) and Table 2.28 (for BIWTC). These fully relates to development activities in the Chittagong–Dhaka Waterway Route.
Data Collection Survey on the Comprehensive Transport Plan between Dhaka and Chittagong Final Report
2-35
Table 2.27: Inland Water Development Program by BIWTA in Annual Development Plan, 2016–2017
Sl. no.
Project Name (Execution Period)
Project cost
(mil. tk)
Progress up to Jan 2017 (%)
Financial Physical (A) Ongoing projects under development budget (2016–2020) 1 Establishment of Inland Container River Port at Ashuganj
(January 2011–June 2019) 4,610 - - (B) Ongoing projects under agency’s self-funding (2016–2017) 2 Extension of Sadarghat Terminal at Dhaka Port
(March 2014–June 2017) 191 71 % 80 % 3 Development of Sadarghat to Shasanghat Road in Dhaka
River Port (January 2015–June 2017) 199 73 % 82 % (C) Future programs (C-1) Projects proposed under annual development program 4 Establishment of 2nd Terminal Facilities at Shashan Ghat
Area under Dhaka River Port.
5 Construction of walkway and bank protection on evicted foreshore land of Rivers Buriganga, Sitalakhya and Turag (partly)
6 Development of Sadarghat to Shasanghat Road and ancillary Infrastructure under Dhaka River Port (1st revised)
(C-2) Projects proposed under foreign aid 7 Bangladesh Water Transport Project 1 (to be implemented by the World Bank fund) (C-3) Projects proposed under public-private partnership 8 Construction and Operation of Inland Container (ICT)
Terminal at Khanpur, Narayanganj
Source: BIWTA
Table 2.28: Inland Water Development Program by BIWTC in Annual Development Plan, 2016–2017
Sl. no.
Project Name (Execution Period)
Project cost
(mil. tk)
Progress (%)
Financial Physical (A) Ongoing projects under development budget (2016-2020) 1 Construction of Passenger Vessels for providing Efficient
Passenger Services in Chittagong–Sandwip–Hatiya–Barisal Coastal Route (December 2014–June 2017) 519 19% 44%
2 Procurement of two New Passenger Vessels for Dhaka–Barisal–Khulna river route (April 2015–December 2017) 722 15% 25%
3 Construction of four 108 TEU (Revised 158 TEU) Self-Propelled Multi-Purpose Inland Container Vessels (January 2010–June 2013) 1,378 99% 96%
(B) Future programs 4 Construction of a Rest House at Chittagong 5 Development of berths and improvement of passenger and
goods handling facilities at BIWTC terminals in Chittagong 1
Note: Recommended by BIWTC to the JICA Study Team at a meeting held on 7th March 2017. Source: BIWTC (3) Inland Water Transport Master Plan Study, 2009 The Planning Commission carried out a study in 2008–09 with the objective of preparing a policy paper and a master plan for overall development of the waterways in Bangladesh. Limited in scope by sparse data and information, time constraints did not allow for carrying out first-hand
Data Collection Survey on the Comprehensive Transport Plan between Dhaka and Chittagong Final Report
2-36
field and traffic surveys; however, frequent purpose-oriented field visits were made, numerous detailed discussions and formal meetings were held with officials, and stakeholders were interviewed and their opinions considered. The study took note of the fact that despite being an inexpensive and pro-poor transport mode, water transport has not received support and needs resources as does its two other competing modes (railways and roadways). This has led to its cumulative deterioration in quantity (navigable length, draft restriction, etc.) and quality (navigability, safety, pollution, etc.). The study was aimed at arresting this trend of decline and aims to maintain it at the present level. The Master Plan is still valid; it sets out a guideline for rehabilitation and maintenance of existing facilities and developing new ones over a twenty-year period (up to 2029), in phases. BIWTA has already implemented many of the recommendations and is continuing to do so. Principal actions, among many others, that have been taken by it are enumerated below:
(1) Waterways Network: BIWTA has formulated and implemented several projects for improving navigability and network efficiency. It is continuing its effort by including more such projects in the Government’s Seventh Five-Year-Plan and the Annual Development Programs (ADP).
(2) Dredging of Waterways: BIWTA continues to maintain its vast network of waterways
through capital (investment) and maintenance dredging. To this end, 8 dredgers were procured in phases, raising the fleet number to 21, which thereby increased its dredging capability. Furthermore, private sector entrepreneurs are being encouraged to enter the field and perform dredging activities as well.
(3) Inland River Ports: There were 21 inland river ports in the country in 2009. The layout,
infrastructure and operation of many of these have been rehabilitated and improved. Notable instances are Dhaka River Port, Barisal River Port, Paturia Ferry Port, Mawa Ferry Port, etc. In addition to this, eight launch landing stations have been raised in status; and now the number of (government gazetted) inland river ports is up to 29.
(4) Launch Landing Stations: A number of launch landing stations and smaller launch ghats
were improved by constructing jetties and/or installing pontoons. Such action is still being continued based upon their relative importance and user preference. Special care is being taken to ensure ease and comfort to women, aged, and disadvantaged users.
(5) Container Transport: A purpose-oriented river based container handling port has been
constructed at Pangaon for which operations have begun. Operated by Chittagong Port Authority, it is not being utilized to its full capacity; the reasons for this require identification and actions must be taken to ensure its proper utilization. A number of container handling ports are being built by entrepreneurs in the private sector. BIWTA also plans to construct and operate the terminal at Khanpur specifically for handling containers through public-private partnership (PPP). Construction of four container vessels by BIWTC is nearing completion.
(6) Cross Border IWT Traffic: The transit and in-transit trade and traffic between
Bangladesh and India via inland waterways display a tremendous degree of goodwill and cooperation between the participating countries. The Ashuganj inland river port acts as a port of call for Indian vessels in Bangladesh, and is already in use for multimodal (waterway-road and vice-versa) transport initiatives which have served to extend and upgrade its infrastructure and improve its operations further. Although some
Data Collection Survey on the Comprehensive Transport Plan between Dhaka and Chittagong Final Report
2-37
improvements have been made in cross-border multimodal transport with Bhutan, Nepal and Myanmar, further action is still required.
(7) Safety: BIWTA is cognizant of the need to ensure safety of vessels and passengers in
waterways and has created a separate department, which is managed by a departmental head, who oversees safety and related issues. There were two salvage vessels in 2009; since that time, two additional modern salvage vessels have been procured; moreover, very recently BIWTA initiated steps to build “safe shelters” for distressed vessels facing impending cyclonic storms.
(8) Environmental Issues: Other than sporadic actions taken by BIWTA for the removal of
unauthorized encroachment from foreshore areas, not much has been performed. A more concerted and coordinated effort by all organizations and individuals, both in public and private sector, is necessary.
It is apparent from the above that BIWTA is moving forward and implementing actions as per guidelines set forth in the IWT Master Plan 2009. (4) Bangladesh Regional Inland Water Transport Project 1 The Chittagong–Dhaka–Ashuganj Corridor is a priority waterway route for Bangladesh. It enjoys importance as it serves both domestic and international traffic, including Bangladesh–India bilateral trade. A major portion of the country’s IWT transport, approximately 80%, is routed through this corridor. In addition, six major inland river ports: Dhaka, Munshiganj (Mirkadim), Narayanganj, Ashuganj, Chandpur and Barisal are situated along the corridor, their role in handling passengers and freight being of great significance. A study conducted by the World Bank in 2016, found that the IWT corridor or waterway suffers from chronic siltation at places and lacks adequate navigational aids. It also found that facilities existing in inland ports and launch terminals are not adequate for berthing of vessels, handling of cargo, and fall short in maintaining the comfort and safety of passengers. The study further noted that although there is a growing trend in IWT passenger and freight transport, its performance in extending services to users has not kept pace. Project Details: The findings of the World Bank study consequently resulted in the formulation of a project. The project aims to develop safe navigation routes as well as passenger and cargo ports/terminals along the Chittagong–Dhaka IWT corridor. Estimated Project Cost is Taka 32 billion (including the Project Aid of Taka 28.8 billion). It is expected that World Bank will support its implementation. Estimated execution period is about eight years. The Ministry of Shipping is the sponsoring ministry, the executing agency being BIWTA. Overall Objective of the Project, as stated in the Development Project Proforma (DPP) is: “to improve Inland Water Transport (IWT) efficiency and safety for passengers and cargo along Chittagong–Dhaka–Ashuganj Regional Corridor and to enhance sector sustainability” Specific Objectives of the Project are to achieve the following which would contribute to reductions in travel time and cost along the corridor:
• To increase the number of days per year that the minimum advertised Least Available Depth (LAD) is available, from the current 150 to a target of 347 days per year;
• To increase the hours per day that safe navigation is possible, from the current 12 hours (day time) to 24 hours (day and night), by increasing the availability of Aids to Navigation, from the current 30 % to 95%;
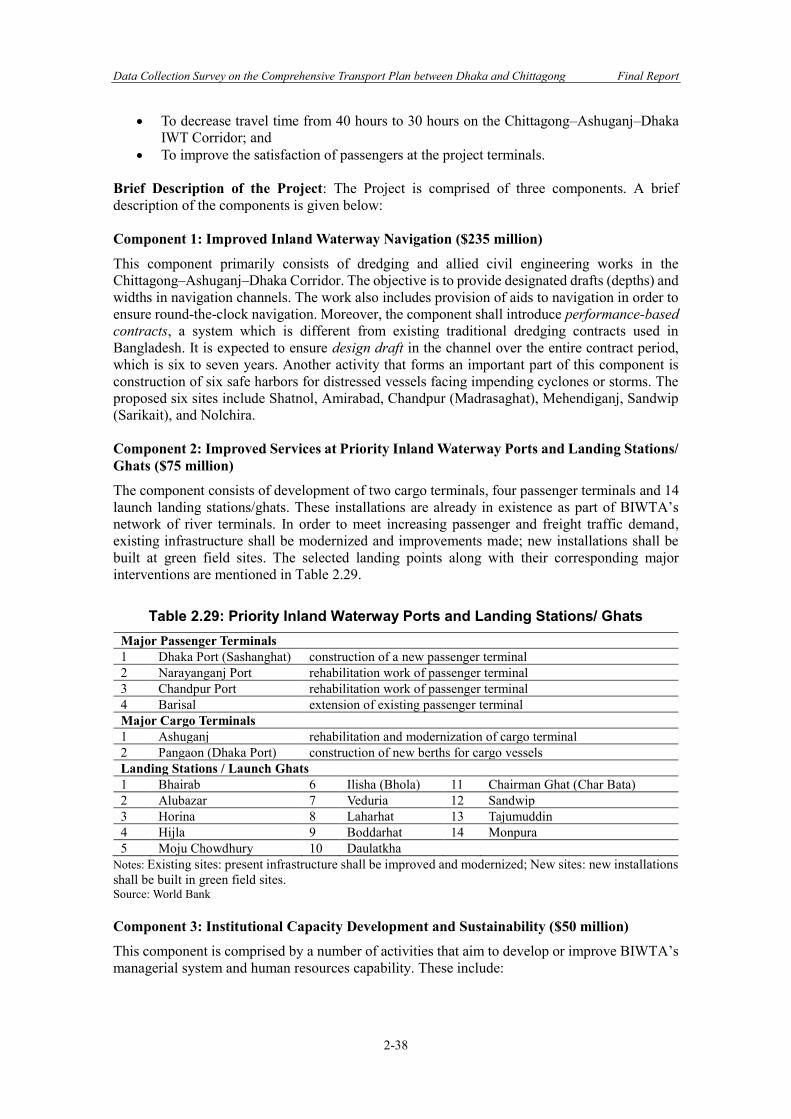
Data Collection Survey on the Comprehensive Transport Plan between Dhaka and Chittagong Final Report
2-38
• To decrease travel time from 40 hours to 30 hours on the Chittagong–Ashuganj–Dhaka IWT Corridor; and
• To improve the satisfaction of passengers at the project terminals. Brief Description of the Project: The Project is comprised of three components. A brief description of the components is given below: Component 1: Improved Inland Waterway Navigation ($235 million)
This component primarily consists of dredging and allied civil engineering works in the Chittagong–Ashuganj–Dhaka Corridor. The objective is to provide designated drafts (depths) and widths in navigation channels. The work also includes provision of aids to navigation in order to ensure round-the-clock navigation. Moreover, the component shall introduce performance-based contracts, a system which is different from existing traditional dredging contracts used in Bangladesh. It is expected to ensure design draft in the channel over the entire contract period, which is six to seven years. Another activity that forms an important part of this component is construction of six safe harbors for distressed vessels facing impending cyclones or storms. The proposed six sites include Shatnol, Amirabad, Chandpur (Madrasaghat), Mehendiganj, Sandwip (Sarikait), and Nolchira. Component 2: Improved Services at Priority Inland Waterway Ports and Landing Stations/ Ghats ($75 million)
The component consists of development of two cargo terminals, four passenger terminals and 14 launch landing stations/ghats. These installations are already in existence as part of BIWTA’s network of river terminals. In order to meet increasing passenger and freight traffic demand, existing infrastructure shall be modernized and improvements made; new installations shall be built at green field sites. The selected landing points along with their corresponding major interventions are mentioned in Table 2.29.
Table 2.29: Priority Inland Waterway Ports and Landing Stations/ Ghats Major Passenger Terminals
1 Dhaka Port (Sashanghat) construction of a new passenger terminal 2 Narayanganj Port rehabilitation work of passenger terminal 3 Chandpur Port rehabilitation work of passenger terminal 4 Barisal extension of existing passenger terminal Major Cargo Terminals 1 Ashuganj rehabilitation and modernization of cargo terminal 2 Pangaon (Dhaka Port) construction of new berths for cargo vessels Landing Stations / Launch Ghats 1 Bhairab 6 Ilisha (Bhola) 11 Chairman Ghat (Char Bata) 2 Alubazar 7 Veduria 12 Sandwip 3 Horina 8 Laharhat 13 Tajumuddin 4 Hijla 9 Boddarhat 14 Monpura 5 Moju Chowdhury 10 Daulatkha
Notes: Existing sites: present infrastructure shall be improved and modernized; New sites: new installations shall be built in green field sites. Source: World Bank Component 3: Institutional Capacity Development and Sustainability ($50 million)
This component is comprised by a number of activities that aim to develop or improve BIWTA’s managerial system and human resources capability. These include:
Data Collection Survey on the Comprehensive Transport Plan between Dhaka and Chittagong Final Report
2-39
a) Develop River Information Systems to improve data collection for planning, development and maintenance of IWT in Bangladesh; as well as to provide a Traffic Monitoring System;
b) Upgrade and modernize BIWTA’s Deck and Engine Personnel Training Center (DEPTC) into a Regional IWT Training Center and open it for all users in the region and the world,
c) Initiate a study to develop an effective Search and Rescue Organization as well as to propose its required institutional structure;
d) Initiate formation of project preparation facility to finance surveys, feasibility, design, safeguard studies, etc.;
e) Extend support to Project Management Unit for efficient implementation of the Project. A long-term and dedicated action plan in IWT sector by the Government of Bangladesh, such as this project, was long overdue. If such actions had been taken earlier, then the quantity (length) and quality of Inland Water Transport in Bangladesh would not have deteriorated to such an extent. The support extended by World Bank is commendable. It is now anticipated that Bangladesh Government supported by development partners would follow the example shown by considering taking up similar development activity in other corridors. 2.4 Related Laws and Regulations 2.4.1 Roads The basic law for the road sector is the Highways Act 1925, which has been updated in subsequent years. This act aims to establish effective administrative control over government highways and bridges as well as land within the Right of Way (ROW) and to facilitate efficient management at the time of maintenance and/or construction of highways and related structures. The Highways Act 1925 came into force on 1st July 1928. Some amendments, though not significant, were made to this act at different times over the period of 1932 to 1974. The next changes in the act were covered by the Highways (Amendment) Act 1994, which was published and notified in the Bangladesh Gazette dated 18th May 1994. Through another Gazette notification in June 2001, the government made rules titled the Highways (Security, Protection, and Restriction of Movement) Rules 2001. In a further Gazette notification dated 23rd August 2001, amendments were made in Section 2(i) of the Highways (Security, Protection and Restriction of Movement) Rules 2001 and Section 2 of the Highways Act 1925. Under ADB assistance, the Highway Acts, Rules & its amendments etc. vis-a-vis the changes required were reviewed through the Road Maintenance Improvement Project (RMIP) by a legislation consultant. A draft document for rules named the Highways (Restricted Access Highways) Rules were prepared on 20 August 2000 to be made under the Highways Act 1925 which is awaiting consideration of the government and legislation there. Table 2.30 summarizes the general rules and regulations related to the road sector.
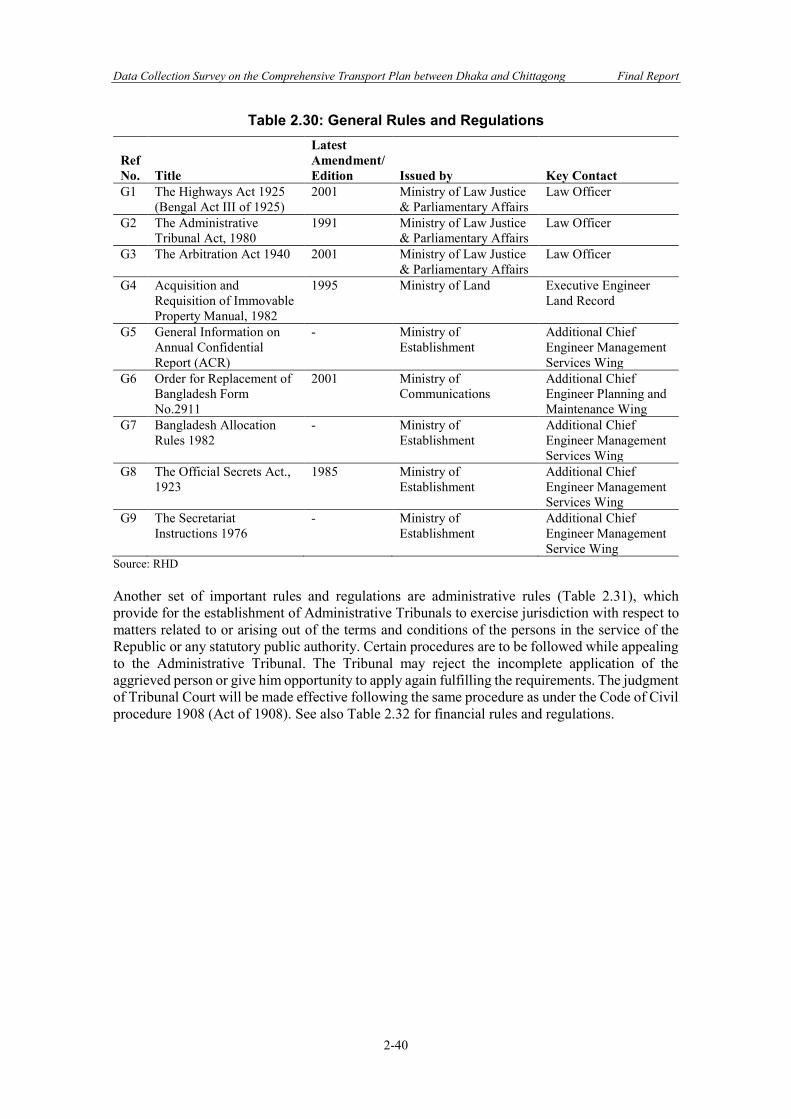
Data Collection Survey on the Comprehensive Transport Plan between Dhaka and Chittagong Final Report
2-40
Table 2.30: General Rules and Regulations
Ref No. Title
Latest Amendment/ Edition Issued by Key Contact
G1 The Highways Act 1925 (Bengal Act III of 1925)
2001 Ministry of Law Justice & Parliamentary Affairs
Law Officer
G2 The Administrative Tribunal Act, 1980
1991 Ministry of Law Justice & Parliamentary Affairs
Law Officer
G3 The Arbitration Act 1940 2001 Ministry of Law Justice & Parliamentary Affairs
Law Officer
G4 Acquisition and Requisition of Immovable Property Manual, 1982
1995 Ministry of Land Executive Engineer Land Record
G5 General Information on Annual Confidential Report (ACR)
- Ministry of Establishment
Additional Chief Engineer Management Services Wing
G6 Order for Replacement of Bangladesh Form No.2911
2001 Ministry of Communications
Additional Chief Engineer Planning and Maintenance Wing
G7 Bangladesh Allocation Rules 1982
- Ministry of Establishment
Additional Chief Engineer Management Services Wing
G8 The Official Secrets Act., 1923
1985 Ministry of Establishment
Additional Chief Engineer Management Services Wing
G9 The Secretariat Instructions 1976
- Ministry of Establishment
Additional Chief Engineer Management Service Wing
Source: RHD Another set of important rules and regulations are administrative rules (Table 2.31), which provide for the establishment of Administrative Tribunals to exercise jurisdiction with respect to matters related to or arising out of the terms and conditions of the persons in the service of the Republic or any statutory public authority. Certain procedures are to be followed while appealing to the Administrative Tribunal. The Tribunal may reject the incomplete application of the aggrieved person or give him opportunity to apply again fulfilling the requirements. The judgment of Tribunal Court will be made effective following the same procedure as under the Code of Civil procedure 1908 (Act of 1908). See also Table 2.32 for financial rules and regulations.
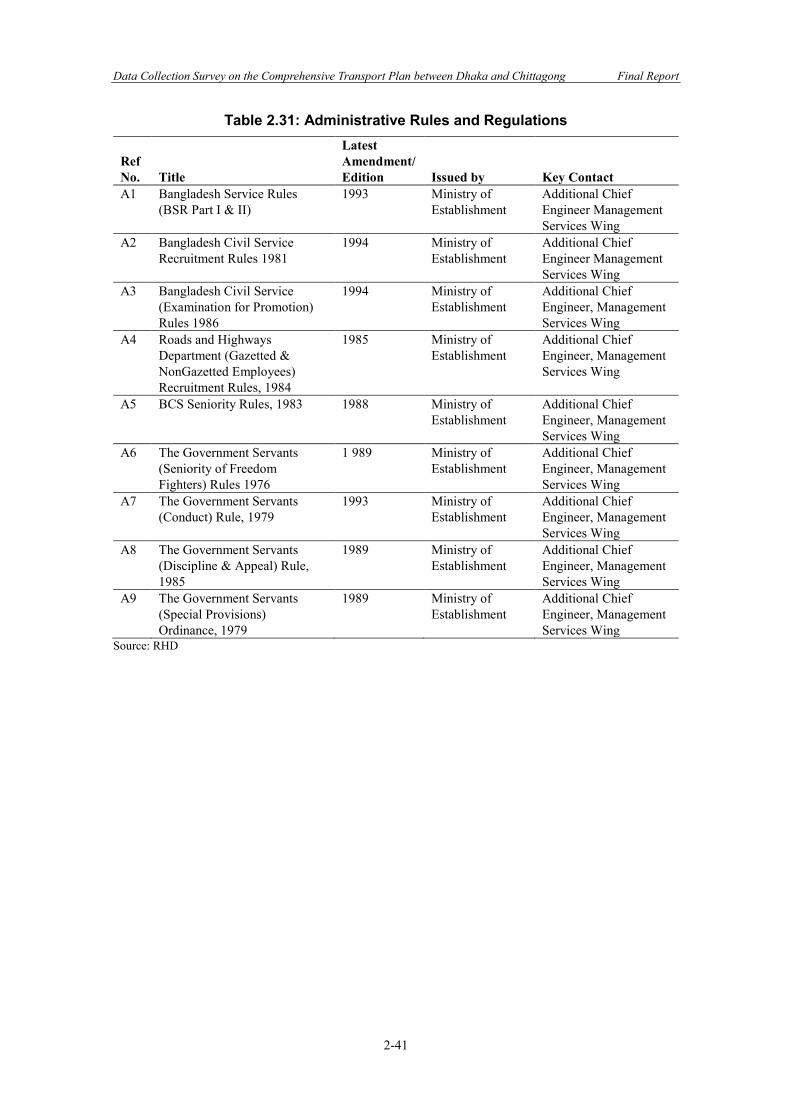
Data Collection Survey on the Comprehensive Transport Plan between Dhaka and Chittagong Final Report
2-41
Table 2.31: Administrative Rules and Regulations
Ref No. Title
Latest Amendment/ Edition Issued by Key Contact
A1 Bangladesh Service Rules (BSR Part I & II)
1993 Ministry of Establishment
Additional Chief Engineer Management Services Wing
A2 Bangladesh Civil Service Recruitment Rules 1981
1994 Ministry of Establishment
Additional Chief Engineer Management Services Wing
A3 Bangladesh Civil Service (Examination for Promotion) Rules 1986
1994 Ministry of Establishment
Additional Chief Engineer, Management Services Wing
A4 Roads and Highways Department (Gazetted & NonGazetted Employees) Recruitment Rules, 1984
1985 Ministry of Establishment
Additional Chief Engineer, Management Services Wing
A5 BCS Seniority Rules, 1983 1988 Ministry of Establishment
Additional Chief Engineer, Management Services Wing
A6 The Government Servants (Seniority of Freedom Fighters) Rules 1976
1 989 Ministry of Establishment
Additional Chief Engineer, Management Services Wing
A7 The Government Servants (Conduct) Rule, 1979
1993 Ministry of Establishment
Additional Chief Engineer, Management Services Wing
A8 The Government Servants (Discipline & Appeal) Rule, 1985
1989 Ministry of Establishment
Additional Chief Engineer, Management Services Wing
A9 The Government Servants (Special Provisions) Ordinance, 1979
1989 Ministry of Establishment
Additional Chief Engineer, Management Services Wing
Source: RHD
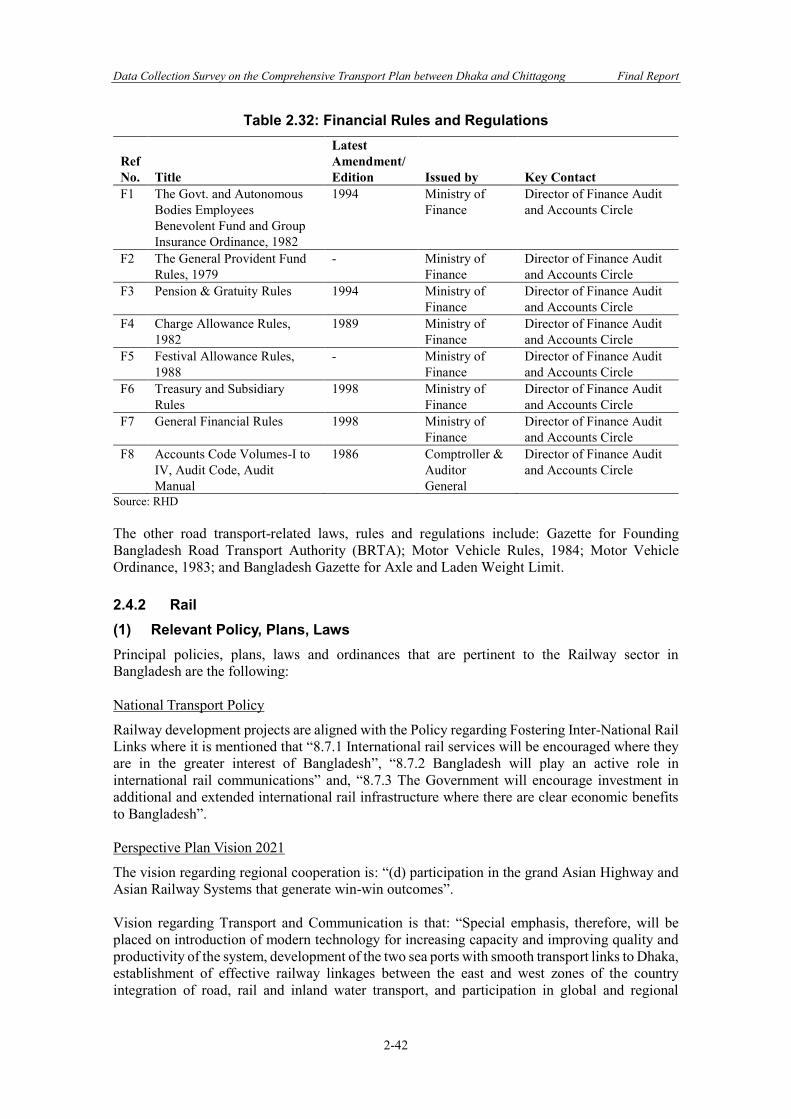
Data Collection Survey on the Comprehensive Transport Plan between Dhaka and Chittagong Final Report
2-42
Table 2.32: Financial Rules and Regulations
Ref No. Title
Latest Amendment/ Edition Issued by Key Contact
F1 The Govt. and Autonomous Bodies Employees Benevolent Fund and Group Insurance Ordinance, 1982
1994 Ministry of Finance
Director of Finance Audit and Accounts Circle
F2 The General Provident Fund Rules, 1979
- Ministry of Finance
Director of Finance Audit and Accounts Circle
F3 Pension & Gratuity Rules 1994 Ministry of Finance
Director of Finance Audit and Accounts Circle
F4 Charge Allowance Rules, 1982
1989 Ministry of Finance
Director of Finance Audit and Accounts Circle
F5 Festival Allowance Rules, 1988
- Ministry of Finance
Director of Finance Audit and Accounts Circle
F6 Treasury and Subsidiary Rules
1998 Ministry of Finance
Director of Finance Audit and Accounts Circle
F7 General Financial Rules 1998 Ministry of Finance
Director of Finance Audit and Accounts Circle
F8 Accounts Code Volumes-I to IV, Audit Code, Audit Manual
1986 Comptroller & Auditor General
Director of Finance Audit and Accounts Circle
Source: RHD The other road transport-related laws, rules and regulations include: Gazette for Founding Bangladesh Road Transport Authority (BRTA); Motor Vehicle Rules, 1984; Motor Vehicle Ordinance, 1983; and Bangladesh Gazette for Axle and Laden Weight Limit. 2.4.2 Rail (1) Relevant Policy, Plans, Laws Principal policies, plans, laws and ordinances that are pertinent to the Railway sector in Bangladesh are the following: National Transport Policy
Railway development projects are aligned with the Policy regarding Fostering Inter-National Rail Links where it is mentioned that “8.7.1 International rail services will be encouraged where they are in the greater interest of Bangladesh”, “8.7.2 Bangladesh will play an active role in international rail communications” and, “8.7.3 The Government will encourage investment in additional and extended international rail infrastructure where there are clear economic benefits to Bangladesh”. Perspective Plan Vision 2021
The vision regarding regional cooperation is: “(d) participation in the grand Asian Highway and Asian Railway Systems that generate win-win outcomes”. Vision regarding Transport and Communication is that: “Special emphasis, therefore, will be placed on introduction of modern technology for increasing capacity and improving quality and productivity of the system, development of the two sea ports with smooth transport links to Dhaka, establishment of effective railway linkages between the east and west zones of the country integration of road, rail and inland water transport, and participation in global and regional
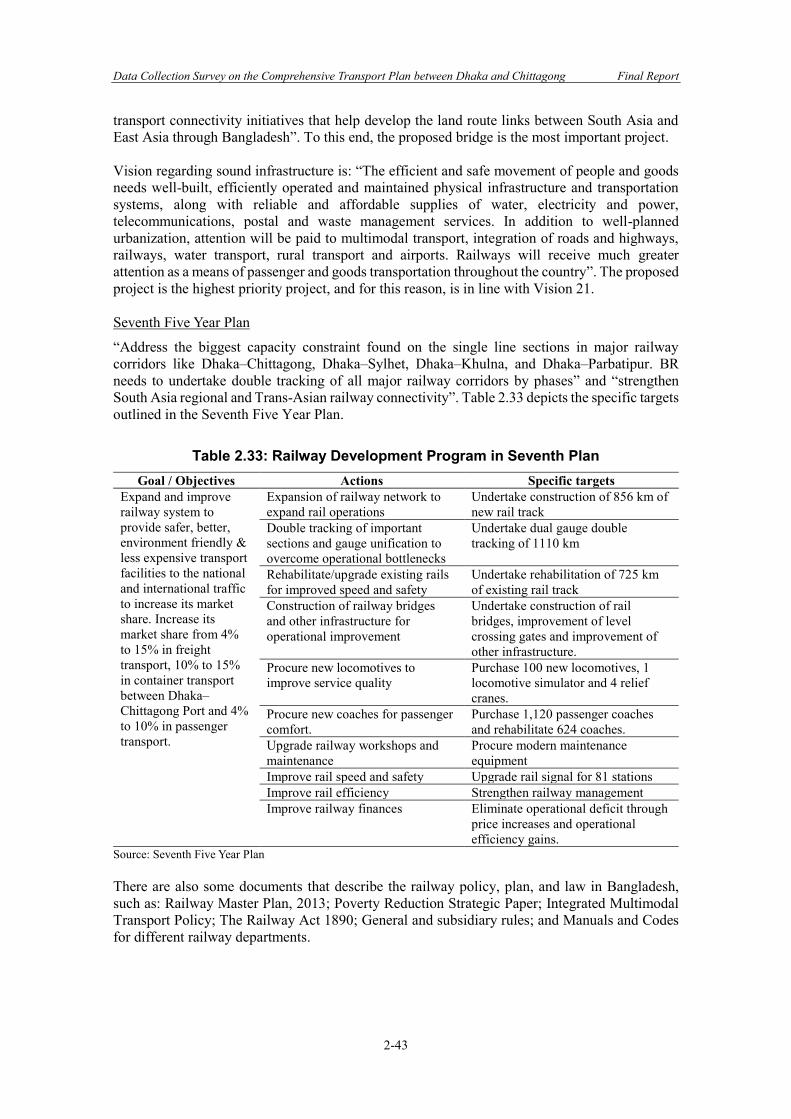
Data Collection Survey on the Comprehensive Transport Plan between Dhaka and Chittagong Final Report
2-43
transport connectivity initiatives that help develop the land route links between South Asia and East Asia through Bangladesh”. To this end, the proposed bridge is the most important project. Vision regarding sound infrastructure is: “The efficient and safe movement of people and goods needs well-built, efficiently operated and maintained physical infrastructure and transportation systems, along with reliable and affordable supplies of water, electricity and power, telecommunications, postal and waste management services. In addition to well-planned urbanization, attention will be paid to multimodal transport, integration of roads and highways, railways, water transport, rural transport and airports. Railways will receive much greater attention as a means of passenger and goods transportation throughout the country”. The proposed project is the highest priority project, and for this reason, is in line with Vision 21. Seventh Five Year Plan
“Address the biggest capacity constraint found on the single line sections in major railway corridors like Dhaka–Chittagong, Dhaka–Sylhet, Dhaka–Khulna, and Dhaka–Parbatipur. BR needs to undertake double tracking of all major railway corridors by phases” and “strengthen South Asia regional and Trans-Asian railway connectivity”. Table 2.33 depicts the specific targets outlined in the Seventh Five Year Plan.
Table 2.33: Railway Development Program in Seventh Plan Goal / Objectives Actions Specific targets
Expand and improve railway system to provide safer, better, environment friendly & less expensive transport facilities to the national and international traffic to increase its market share. Increase its market share from 4% to 15% in freight transport, 10% to 15% in container transport between Dhaka–Chittagong Port and 4% to 10% in passenger transport.
Expansion of railway network to expand rail operations
Undertake construction of 856 km of new rail track
Double tracking of important sections and gauge unification to overcome operational bottlenecks
Undertake dual gauge double tracking of 1110 km
Rehabilitate/upgrade existing rails for improved speed and safety
Undertake rehabilitation of 725 km of existing rail track
Construction of railway bridges and other infrastructure for operational improvement
Undertake construction of rail bridges, improvement of level crossing gates and improvement of other infrastructure.
Procure new locomotives to improve service quality
Purchase 100 new locomotives, 1 locomotive simulator and 4 relief cranes.
Procure new coaches for passenger comfort.
Purchase 1,120 passenger coaches and rehabilitate 624 coaches.
Upgrade railway workshops and maintenance
Procure modern maintenance equipment
Improve rail speed and safety Upgrade rail signal for 81 stations Improve rail efficiency Strengthen railway management Improve railway finances Eliminate operational deficit through
price increases and operational efficiency gains.
Source: Seventh Five Year Plan There are also some documents that describe the railway policy, plan, and law in Bangladesh, such as: Railway Master Plan, 2013; Poverty Reduction Strategic Paper; Integrated Multimodal Transport Policy; The Railway Act 1890; General and subsidiary rules; and Manuals and Codes for different railway departments.
Data Collection Survey on the Comprehensive Transport Plan between Dhaka and Chittagong Final Report
2-44
(2) Public Sector Institutions Figure 2.16 shows the current organization chart of BR.
Source: JICA Study Team
Figure 2.16: Bangladesh Railway Organization Chart 2.4.3 Inland Water (1) Relevant Policy, Plan, Law, and Ordinance Principal policies, plans, laws and ordinances that are pertinent to the IWT sector in Bangladesh are the following:
• Ports Act, 1908. Enacted as early as 1908, it addresses issues related to Ports and other berthing and handling stations as well as their management.
• Inland Shipping Ordinance 1976. It deals primarily with administration, registration, competency, etc. of inland waterways, inland ports and landing facilities, inland shipping, etc.
• Merchant Shipping Ordinance 1983. It lays down directives for use of coastal and inland shipping in Bangladesh as well as overseas shipping.
• Rules for Inland Ship Safety 1994 (Draft). The rules were drafted to protect inland waterways and related activities from impacts of air emission, handling and storage of harmful materials, waste discharges, dredging and dredge-spoil disposal, oil spill, etc.
• National Policy for Ports, Ocean Shipping and Inland Water Transport, 2000. The policy lays down guidelines for administration of inland shipping, ocean shipping, sea ports, river ports, launch stations, etc.
HON'BLE MINISTER Ministry of Railways
Secretary Ministry of Railways
Director General (DG) Bangladesh Railway
Govt. Inspector of Bangladesh Railway (GIBR)
GM ADG/I ADG/F ADG/RS ADG/M&CP ADG/OP GM East
GM West
GM Rector PD GM
Heads of Departments
JDG/P Heads of Departments
Project Management Organization
Divisional Railway Manager / Chittagong
Divisional Railway Manager / Dhaka
Div. Sup/ Workshop Pahartoli
Chief Executive / CLW, Parbatipur
Divisional Railway Manager / Paksey
Divisional Railway Manager /
Lalmonirhat
Div. Sup/ Workshop Pahartoli
Data Collection Survey on the Comprehensive Transport Plan between Dhaka and Chittagong Final Report
2-45
• National Water Management Plan (NWMP), 2001. The Plan, formulated in 2001, states that “for the NWMP the main IWT concern is with navigability” and rightly points out that, “due to inadequate maintenance dredging in the past and changing river conditions, a considerable amount of capital dredging is now required”. This statement still holds true.
• Coastal Zone Policy, 2005. The policy is enacted principally for development of the coastal zones of Bangladesh. As such it also addresses issues related to inland water transport in the area.
• National Strategy for Accelerated Poverty Reduction, 2005. The policy addresses issues related to people belonging to the lower strata of society. It lays down guidelines for reducing their poverty and improving their living standard. Inland waterways being less expensive and providing access to less developed village areas, it is not only preferred by the poor; but it also provides employment opportunities to them; therefore, improvement of inland waterways sector has a direct positive influence upon the lot of the poverty-stricken people.
• Inland Water Transport Policy 2009 (Draft). The importance of inland water transport demanded a separate policy document for its development, maintenance and operation. Drafted in 2009, the policy provides guidelines for arresting continuous deterioration of waterways and reviving it. In general, it extends recommendations for sustainable improvements of waterways, inland ports and landing facilities, inland vessel management, safety, pollution control, etc.
• National Integrated Multimodal Transport Policy (NIMTP), 2013. The policy aims at integrating all transport sectors and developing them in a balanced manner. The principal objectives of the policy are to ensure that transport meets social needs in terms of cost and accessibility to all strata of society, reduce transportation costs, improve safety, reduce adverse environmental effects, and improve the country’s fuel and energy security.
• Dredging and Dredged Material Management Policy 2013 (Draft). The policy lays down guidelines for planning and execution of dredging works, and for disposal of dredged spoils.
• Inland Water Transport Master Plan, 2009. The Master Plan is a comprehensive report on Inland Water Transport sector. Completed in 2009, it extends recommendations for need-based development over a period of 20 years. Although its efforts are limited by chronic resource constraints, BIWTA is following its guidelines and has successfully implemented many of its directives.
• Protocol on Inland Water Trade and Traffic (PIWTT), 1972 and renewed thereafter. This bilateral agreement between Bangladesh and India, first signed in 1972 and subsequently renewed, is still in force. The agreement allows vessels of one country to enter and sail safely in inland waterways of the other for trade and mutual benefit.
(2) Public Sector Institutions The principal public sector institutions that oversee and deal with activities related to Inland Water Transport (IWT) sector in the country are the following:
• Ministry of Shipping (MOS); • Department of Shipping (DOS);
Data Collection Survey on the Comprehensive Transport Plan between Dhaka and Chittagong Final Report
2-46
• Bangladesh Inland Water Transport Authority (BIWTA); and • Bangladesh Inland Water Transport Corporation (BIWTC).
Ministry of Shipping (MOS)
The Ministry of Shipping is a ministerial branch of the Government of Bangladesh. Besides its many other responsibilities, it formulates policies and oversees development, maintenance and operational activities of its parastatal bodies. A minister, who is generally a political figure and a Member of Parliament, heads the Ministry. He is supported by secretarial personnel from the civil service cadre. Department of Shipping (DOS)
The Department of Shipping is a department under the Ministry of Shipping. It generally carries out the following routine responsibilities:
• Inspection of vessel construction and issuance of completion certificate; • Registration of vessels constructed in Bangladesh and those imported from overseas; • Annual survey of vessels, and issuance/ renewal of ship survey certificates; • Approval of design and drawings of vessels; • Examination of deck and engine hands, and issuance of competency certificates; • Implementation of safety rules, regulations and orders; • Making post-accident enquiries; and • Managing ship-based IWT-related environmental aspects.
The department is headed by a Director General. He has two aids, a Chief Engineer and a Chief Nautical Ship Surveyor. There are four vessel survey stations at Dhaka, Narayanganj, Barisal and Khulna, each manned by an Engineer and Ship Surveyor. There is also an office of the Inspectorate of Inland Ships, headed by a Chief Inspector. It has a head office at Dhaka and seven regional offices at Sadarghat (Dhaka), Narayanganj, Chandpur, Barisal, Patuakhali, Khulna and Chittagong. The broad functions performed by the Inspectorate of Inland Ships are to:
• Check certificate of registration of inland vessels; • Check survey certificates; • Check certificates of competency of inland masters, engineers and drivers; • Check life-saving equipment onboard the vessels; • Check overloading in inland vessels; and • Report to Marine Court for violation of any rules including those listed above.
There is also an officer of the rank of Director, who is responsible for all administrative and secretarial work. Bangladesh Inland Water Transport Authority (BIWTA)
An autonomous body under the Ministry of Shipping, the responsibilities of BIWTA relate to development, maintenance and operation of inland waterways. Broad responsibilities vested upon it are to:
• Provide and ensure safe navigation in inland and coastal waterways; • Construct, maintain and operate inland river ports and launch landing stations; • Perform conservancy works including dredging, navigational aids, pilotage services, etc.; • Perform hydrographic and other IWT-related surveys; • Perform regulatory functions related to vessel movement in inland waterways and ports
(like passenger fare rate, time table, route permit, etc.);
Data Collection Survey on the Comprehensive Transport Plan between Dhaka and Chittagong Final Report
2-47
• Impart training to deck and engine personnel of inland and coastal vessels; and • Act as ‘Competent Authority’ on behalf of the Bangladesh Government for matters
related to Bangladesh–India Transit and Trade Protocol. BIWTA performs its responsibilities through eight functional departments, viz. Civil Engineering, Dredging, Mechanical & Marine Engineering, Hydrography, Conservancy & Pilotage Services, Ports, Marine Safety, and Planning. The activities are overseen by a Board consisting of a Chairman (who is the Chief Executive) and three other Members, all four are nominated to represent the government. Bangladesh Inland Water Transport Corporation (BIWTC)
BIWTC is an autonomous body under the Ministry of Shipping. It was established in 1972 by Presidential Order (P.O. No. 28). Its principal functions are to:
• Provide safe passenger and freight transportation services in inland and coastal waterways;
• Provide ferry services for transporting vehicles across major rivers; • Provide transport service between the mainland and the offshore islands; and • Maintain dockyards and repair yards for repair and rehabilitation of vessels.
It is a commercial organization in the public sector engaged in transporting passengers and freight in inland and coastal waterways of Bangladesh. Its affairs are managed by a Board of Directors consisting of a Chairman who acts as the Chief Executive, and four Directors. The organization carries out its activities in four separate units: passenger service unit, cargo service unit, ferry service unit, and ship repair service unit. 2.5 Summary of Major Issues The following is a summary of the major issues and challenges related to the transport infrastructure along the Dhaka–Chittagong corridor, identified through stakeholder consultation and a review of existing studies. 2.5.1 Roads (1) Lack of Integrated Planning Setting investment priorities is necessary in gaining the most effective results; however, there has been a lack of an integrated transport policy, transparent planning framework, and adequate understanding of traffic demand for prioritizing investments, as pointed out in the Seventh Five Year Plan. Some consequences of this include: (i) parallel, competing project plans for the Dhaka–Chittagong expressway, (ii) the absence of mater plan for BBA to follow, and (iii) a lack of integrated freight transport system master plan. (2) Coordination among Relevant Agencies There is also a serious deficiency in the current planning approach followed by different ministries and agencies. In the present top-down approach, transport policy is developed by the responsible government agency with very little or no cognizance of other stakeholder views. Broad participation of different interest groups and consumers is essential for the effectiveness of such planning which is absent in the present practice.
Data Collection Survey on the Comprehensive Transport Plan between Dhaka and Chittagong Final Report
2-48
(3) Road Capacity and Provision With future road transport demand growth, an additional burden will be placed on the road infrastructure which already has several constraints including: (i) insufficient capacity with no access controlled highway and with remaining bottlenecks at Kanchpur, Meghna, and Gumti Bridges, (ii) a lack of integrated planning and the absence of a clearly defined transport hierarchy, and (iii) a lack of resting places (or service areas) for truck drivers, which is a key concern raised from Bangladesh Truck & Covered Van Owners Association. (4) Traffic Congestion Without integrated planning, future traffic congestion on the Dhaka–Chittagong corridor is set to compound existing issues and further constrain the corridor. The causes of congestion are wide ranging, including increased car use; mixture of motorized and non-motorized traffic; encroachment of roadside activities onto the main carriageway; lack of road capacity and connectivity; inadequate traffic management; and lack of high quality public transport. (5) Lack of a Transport Hierarchy and Connectivity Bangladesh suffers from no clear transport hierarchy which has led to an inefficient network, congestion, lack of connectivity, and safety issues. A key concern from road users, in addition to congestion itself, is the enforcement of regulating appropriate vehicle types on national highways and other key roads (principally to remove rickshaws). In addition to congestion and no clear hierarchy, connectivity itself will worsen and constrain development. (6) Road Safety Many of the issues stated above lead to safety problems which will only intensify if left unchecked. These include: unorganized driving/parking behavior of heavy vehicle drivers, encroachment of roadside activities, poor pedestrian environments, lack of strict enforcement of traffic rules and regulations, lack of driver and pedestrian education, and lack of accident data recording. The Road Master Plan recognizes these issues and has set out a policy to improve road safety. (7) Inadequate Maintenance The sustainability of roads and bridges has been threatened due to inadequate maintenance. The Road Master Plan stresses the needs to introduce routine maintenance across the whole RHD network and to prioritize recurrent (maintenance) expenditure. Whilst JICA is providing technical assistance under Bridge Management Capacity Development Project over the 2015–2018 period, more needs to be undertaken to address this issue. It is clear from the RHD’s Maintenance and Rehabilitation Report that maintenance requirement has been identified quantitatively. In the past, there was no indicator to evaluate the level of maintenance, leading to a situation where the maintenance needs themselves were unknown or were not identified quantitatively. On the other hand, there has been undeniable lack of budget to conduct sufficient rehabilitation. Although the government has come to focus on maintenance and is trying to increase fund, these have not reached a sufficient level. Therefore, it can be said that budget implementation system is also insufficient. (8) Vehicle Overloading Vehicle overloading has continuously damaged roads and bridges. Current axle load control policy states that an overloaded vehicle needs to turn back the way the vehicle has come, which causes the road to endure further surface damage. Because of this outcome, the policy is currently
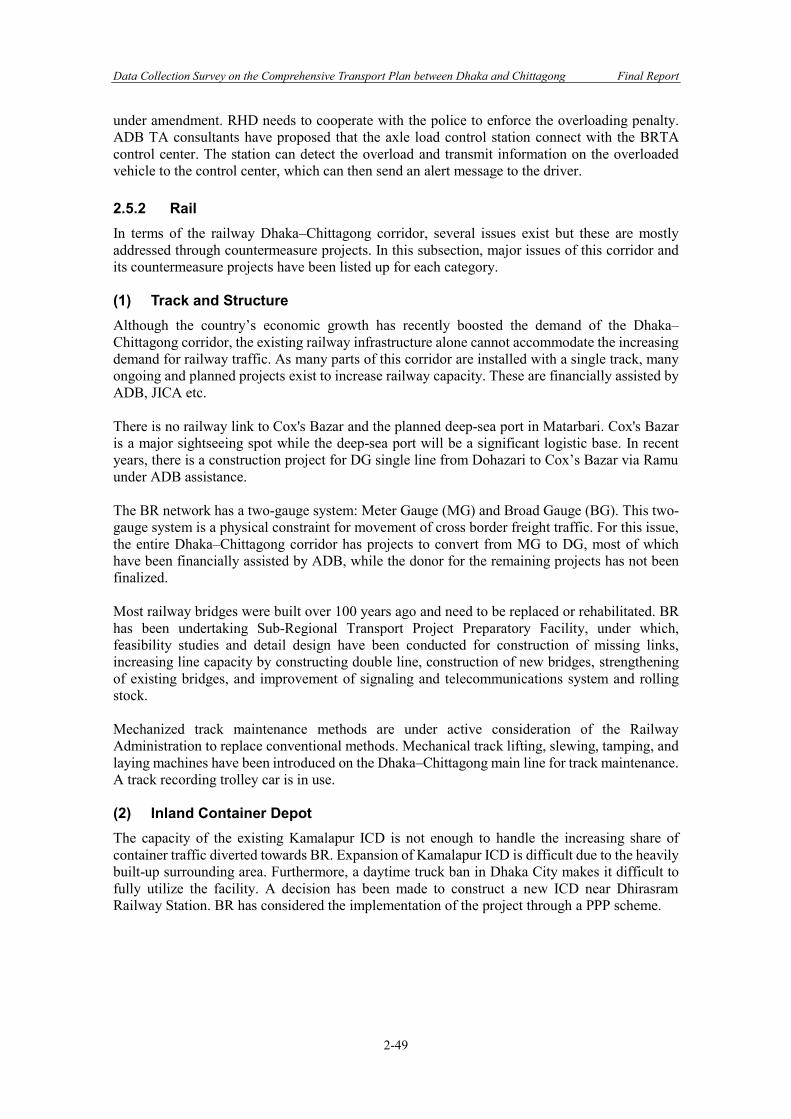
Data Collection Survey on the Comprehensive Transport Plan between Dhaka and Chittagong Final Report
2-49
under amendment. RHD needs to cooperate with the police to enforce the overloading penalty. ADB TA consultants have proposed that the axle load control station connect with the BRTA control center. The station can detect the overload and transmit information on the overloaded vehicle to the control center, which can then send an alert message to the driver. 2.5.2 Rail In terms of the railway Dhaka–Chittagong corridor, several issues exist but these are mostly addressed through countermeasure projects. In this subsection, major issues of this corridor and its countermeasure projects have been listed up for each category. (1) Track and Structure Although the country’s economic growth has recently boosted the demand of the Dhaka–Chittagong corridor, the existing railway infrastructure alone cannot accommodate the increasing demand for railway traffic. As many parts of this corridor are installed with a single track, many ongoing and planned projects exist to increase railway capacity. These are financially assisted by ADB, JICA etc. There is no railway link to Cox's Bazar and the planned deep-sea port in Matarbari. Cox's Bazar is a major sightseeing spot while the deep-sea port will be a significant logistic base. In recent years, there is a construction project for DG single line from Dohazari to Cox’s Bazar via Ramu under ADB assistance. The BR network has a two-gauge system: Meter Gauge (MG) and Broad Gauge (BG). This two-gauge system is a physical constraint for movement of cross border freight traffic. For this issue, the entire Dhaka–Chittagong corridor has projects to convert from MG to DG, most of which have been financially assisted by ADB, while the donor for the remaining projects has not been finalized. Most railway bridges were built over 100 years ago and need to be replaced or rehabilitated. BR has been undertaking Sub-Regional Transport Project Preparatory Facility, under which, feasibility studies and detail design have been conducted for construction of missing links, increasing line capacity by constructing double line, construction of new bridges, strengthening of existing bridges, and improvement of signaling and telecommunications system and rolling stock. Mechanized track maintenance methods are under active consideration of the Railway Administration to replace conventional methods. Mechanical track lifting, slewing, tamping, and laying machines have been introduced on the Dhaka–Chittagong main line for track maintenance. A track recording trolley car is in use. (2) Inland Container Depot The capacity of the existing Kamalapur ICD is not enough to handle the increasing share of container traffic diverted towards BR. Expansion of Kamalapur ICD is difficult due to the heavily built-up surrounding area. Furthermore, a daytime truck ban in Dhaka City makes it difficult to fully utilize the facility. A decision has been made to construct a new ICD near Dhirasram Railway Station. BR has considered the implementation of the project through a PPP scheme.
Data Collection Survey on the Comprehensive Transport Plan between Dhaka and Chittagong Final Report
2-50
(3) Rolling Stock The number of rolling stock is not sufficient to handle the increasing demand for rail traffic. In addition, much of the fleet is aging progressively. In response to this, BR has begun undertaking projects for the procurement of rolling stock under the financial assistance of ADB, etc. (4) Finance BR has recorded an operating deficit every year. Operating loss in 2014–2015 was Taka 7.5 billion. Figure 2.17 shows the changes in the revenues and the expenditures of BR over the period from 1997-98 to 2005-06. It indicates that the operating revenue, particularly the tariff, has not grown as much as the expense has risen, causing the increasing operating loss.
Source: Railway Master Plan 2013
Figure 2.17: Revenues and Expenditures of BR 2.5.3 Inland Water (1) Inland Waterway Network
• The most important parameter that influences efficiency and safety is navigation draft that is maintained for inland waterway channels. Proper attention was not given to this aspect in previous years due to resource constraints, leading to deterioration in the quality and quantity (length) the waterway network. The World Bank has come forward to assist Bangladesh in maintaining the Dhaka–Chittagong corridor, but there exist other important corridors, including dead and dying waterways, which need attention.
• Prescribed vertical and horizontal clearances are not adhered to during construction of
bridges and other river-crossing infrastructure; this constricts the channel and generates hazards to navigating vessels.
• The present ‘waterways classification’ was completed in 1989 and has now outgrown its
usefulness; the system requires to be re-classified so that investment needs and priorities can be properly determined.
• Navigational aids and night navigation are not provided in a major portion of the waterways transport network. This reduces its capacity and contributes to the higher frequency of accidents.
• The IWT sector suffers from a serious lack of reliable data and information, particularly
those related to traffic and user preferences, which is of vital importance to determine investment priorities and to solicit development partners. It was learned that BIWTA has set up recently an Information Technology Cell which constitutes an important step that can support this much-needed activity. It is now necessary that due importance is given
Data Collection Survey on the Comprehensive Transport Plan between Dhaka and Chittagong Final Report
2-51
and necessary institutional and budgetary arrangements are set up in order to carry out related surveys, data collection, and storage on a regular basis.
(2) River Ports, Launch Landing Stations, and Launch Ghats
• Main Inland River Ports do not have proper access roads and adequate vehicular parking space. There is also no adequate loading/unloading spaces, which force the labors to stack goods on jetties, road-sides and side-walks.
• Dhaka Inland River Port is the largest in Bangladesh in terms of size and traffic. Its development could not keep pace with its continuously increasing demand. Presently it faces congestion both on land and in water. The access roads are narrow and cannot cope with the heavy vehicular and pedestrian traffic. The water side also suffers from congestion --- ships usually cannot berth alongside and resort to nose-berthing. This causes discomfort to passengers and coolies. As there is little scope for making improvements here, additional terminals may be built elsewhere.
• Buriganga River Pollution: Dhaka river port is situated on bank of Buriganga river which suffers from acute pollution and pungent smelling water. This is a source of passenger discomfort and an acute health hazard for city citizens.
• Ashuganj Inland River Port: also acts as a port of call under the Protocol on Inland Water Trade and Traffic. It is playing a significant role in Bangladesh–India IWT sector. It is providing multimodal transport facilities in recent days. In order to enhance its efficiency its facilities and services must be upgraded and modernized.
(3) Regional Waterway Traffic • Inland waterways in use under Protocol on Inland Water Trade and Traffic (PIWTT) often
suffer from inadequate navigation drafts. There is also a shortage of aids to navigation as well as night navigation, etc.
• The ports of call lack proper berthing and handling facilities. There is also a need for trade facilitation to reduce paper work at borders and removing other non-physical barriers.
(4) Vessels • The average vessel size has increased over time. Competing among themselves, the
owners continue to build bigger and bigger ships. It is common to see passenger vessels which are more than 250 feet in length and three-stories high. These do not necessarily have the maneuverability to negotiate some narrower channels. The controlling authority is DOS which should enforce necessary control over their activities.
• DOS annually carries out fitness inspection of vessels, but there is a lack of capacity to do this in a strict manner.
(5) Container Transport by Inland Waterways
• There is growing congestion in Dhaka–Chittagong highway and railway corridors. Although both concerned government bodies are implementing and planning future developments, the congestion may not be fully resolved in the near future. In view of emerging trends of container handling at the sea ports, the inland water corridor offers an alternative for transporting containers to Dhaka, Narayanganj, and surrounding areas, where an overwhelmingly large proportion of containers originate or are destined. A
Data Collection Survey on the Comprehensive Transport Plan between Dhaka and Chittagong Final Report
2-52
container handling river terminal (ICT) has been constructed at Pangaon (near Dhaka city) and a few container-carrying vessels have been procured by the public sector, but these are not properly utilized. The government should look into the matter and encourage enterprising entrepreneurs to transport containers by waterways through the extension of incentives like reduced tariffs, soft loans, tax holidays, etc.
(6) Country Boats
• Country boats do not need large-scale investment in infrastructure – passenger services often operate without using formal landing stations, often using very rudimentary ghats. Cargo-carrying country boats have little need to use formal ports. Small shoals can disrupt the free movement of country boats. In some ways, the vibrancy and growth in the sector represents a response to the lack of investment in the formal sector. However, they have suffered from navigation channels in rural areas being cut by indiscriminate and uncoordinated road building.
(7) Bulkheads (Sand Carriers) and Engine Boats
• Bulkheads are locally constructed mechanized vessels used for carrying sand. Crude and unwieldy, these cannot be maneuvered properly and are a hazard to other sailing vessels. DOS is the responsible organization to oversee their fitness for use and regulate them.
• Engine boats are traditional country boats fitted with shallow tube-well pumps. These have no back-gears and cannot move away quickly from the path of on-coming ships which lead to accidents. As hazard to safe navigation, engine boats should be regulated.
(8) Unhealthy Living Conditions of River Port Personnel • Due to the essential nature of their service, officers and employees engaged in
maintaining and operating river ports live near the ports. This allows them to be available at short notice, particularly during natural calamities like seasonal storms. There exist such dwelling places at Chandpur and Barisal which were developed during pre-liberation period (i.e. prior to 1971). However, these buildings have outgrown their use and are presently in damaged condition. As necessary funds are not forthcoming for their repair and/or rehabilitation, they are now in a damaged and unhealthy state. Consequently, the personnel suffer, which in turn affects their workability.
• The residents and employees working in offices situated in Barisal estate suffer the most. Unplanned urbanization has caused the surrounding areas to be built up at a higher level, causing its premises to get flooded and waterlogged even during the slightest rainfall. The drainage system has also grown old and passes through heavily built-up living quarters and needs to be re-designed and re-aligned
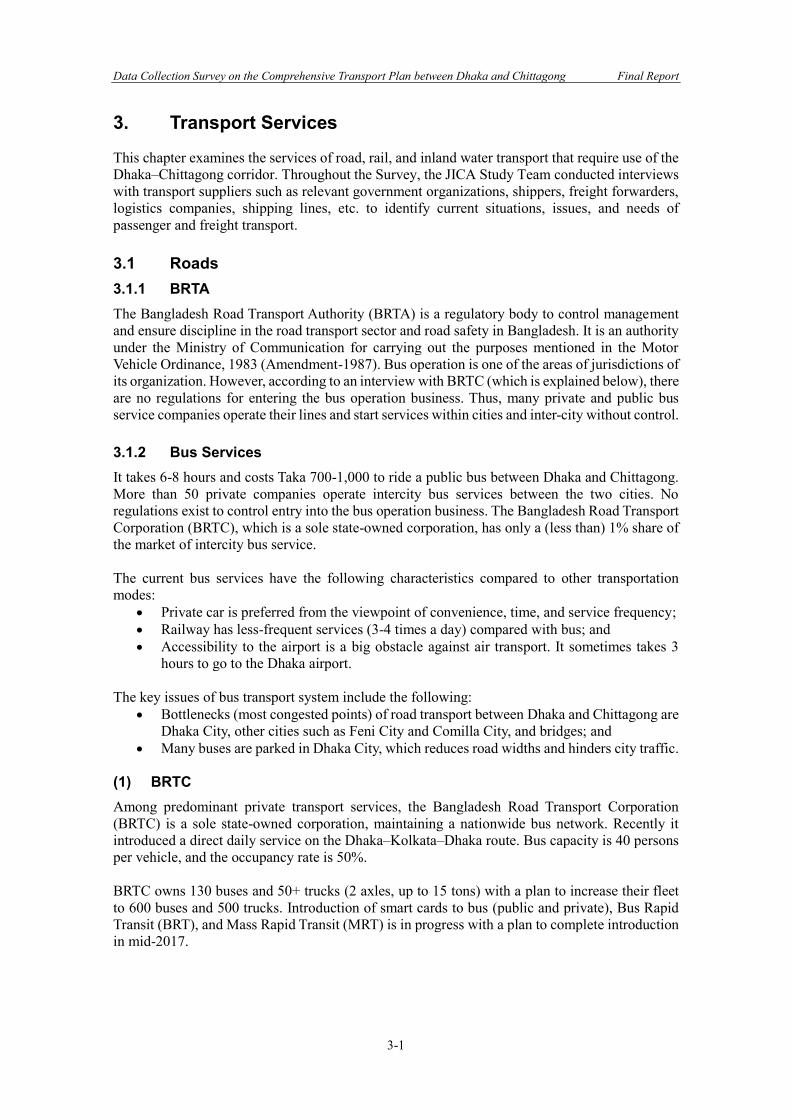
Data Collection Survey on the Comprehensive Transport Plan between Dhaka and Chittagong Final Report
3-1
3. Transport Services
This chapter examines the services of road, rail, and inland water transport that require use of the Dhaka–Chittagong corridor. Throughout the Survey, the JICA Study Team conducted interviews with transport suppliers such as relevant government organizations, shippers, freight forwarders, logistics companies, shipping lines, etc. to identify current situations, issues, and needs of passenger and freight transport. 3.1 Roads 3.1.1 BRTA The Bangladesh Road Transport Authority (BRTA) is a regulatory body to control management and ensure discipline in the road transport sector and road safety in Bangladesh. It is an authority under the Ministry of Communication for carrying out the purposes mentioned in the Motor Vehicle Ordinance, 1983 (Amendment-1987). Bus operation is one of the areas of jurisdictions of its organization. However, according to an interview with BRTC (which is explained below), there are no regulations for entering the bus operation business. Thus, many private and public bus service companies operate their lines and start services within cities and inter-city without control. 3.1.2 Bus Services It takes 6-8 hours and costs Taka 700-1,000 to ride a public bus between Dhaka and Chittagong. More than 50 private companies operate intercity bus services between the two cities. No regulations exist to control entry into the bus operation business. The Bangladesh Road Transport Corporation (BRTC), which is a sole state-owned corporation, has only a (less than) 1% share of the market of intercity bus service. The current bus services have the following characteristics compared to other transportation modes:
• Private car is preferred from the viewpoint of convenience, time, and service frequency; • Railway has less-frequent services (3-4 times a day) compared with bus; and • Accessibility to the airport is a big obstacle against air transport. It sometimes takes 3
hours to go to the Dhaka airport. The key issues of bus transport system include the following:
• Bottlenecks (most congested points) of road transport between Dhaka and Chittagong are Dhaka City, other cities such as Feni City and Comilla City, and bridges; and
• Many buses are parked in Dhaka City, which reduces road widths and hinders city traffic. (1) BRTC Among predominant private transport services, the Bangladesh Road Transport Corporation (BRTC) is a sole state-owned corporation, maintaining a nationwide bus network. Recently it introduced a direct daily service on the Dhaka–Kolkata–Dhaka route. Bus capacity is 40 persons per vehicle, and the occupancy rate is 50%. BRTC owns 130 buses and 50+ trucks (2 axles, up to 15 tons) with a plan to increase their fleet to 600 buses and 500 trucks. Introduction of smart cards to bus (public and private), Bus Rapid Transit (BRT), and Mass Rapid Transit (MRT) is in progress with a plan to complete introduction in mid-2017.
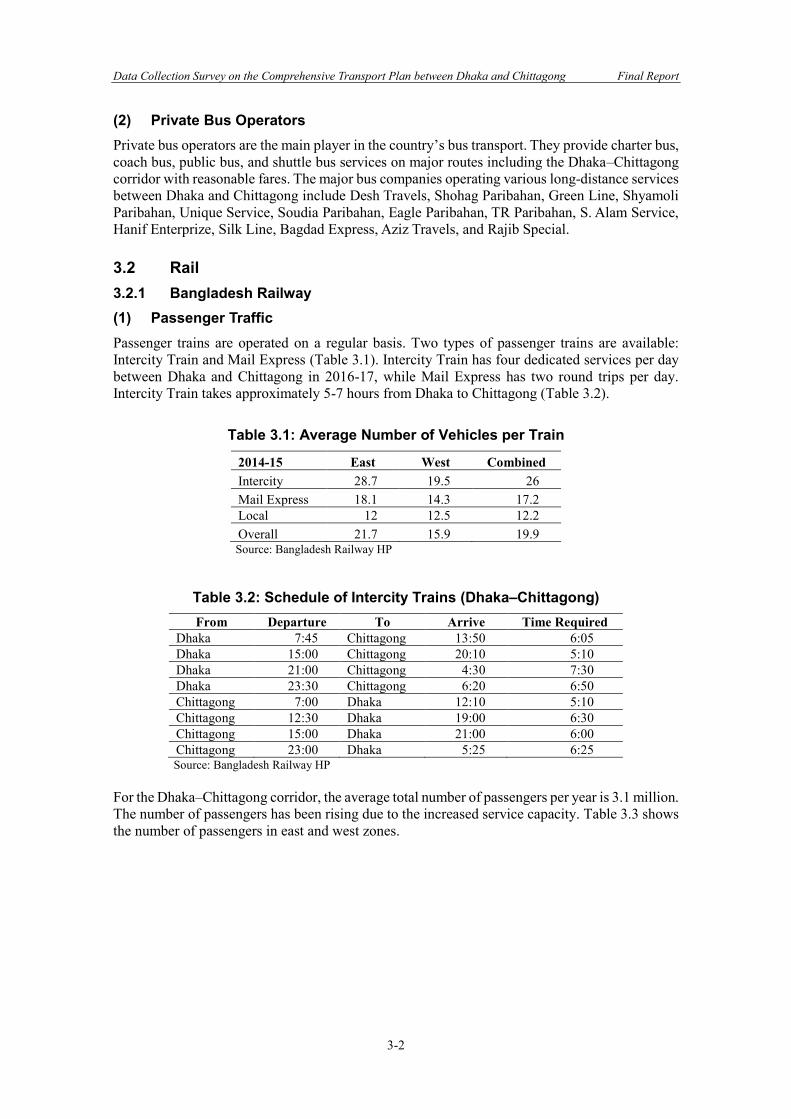
Data Collection Survey on the Comprehensive Transport Plan between Dhaka and Chittagong Final Report
3-2
(2) Private Bus Operators Private bus operators are the main player in the country’s bus transport. They provide charter bus, coach bus, public bus, and shuttle bus services on major routes including the Dhaka–Chittagong corridor with reasonable fares. The major bus companies operating various long-distance services between Dhaka and Chittagong include Desh Travels, Shohag Paribahan, Green Line, Shyamoli Paribahan, Unique Service, Soudia Paribahan, Eagle Paribahan, TR Paribahan, S. Alam Service, Hanif Enterprize, Silk Line, Bagdad Express, Aziz Travels, and Rajib Special. 3.2 Rail 3.2.1 Bangladesh Railway (1) Passenger Traffic Passenger trains are operated on a regular basis. Two types of passenger trains are available: Intercity Train and Mail Express (Table 3.1). Intercity Train has four dedicated services per day between Dhaka and Chittagong in 2016-17, while Mail Express has two round trips per day. Intercity Train takes approximately 5-7 hours from Dhaka to Chittagong (Table 3.2).
Table 3.1: Average Number of Vehicles per Train
2014-15 East West Combined Intercity 28.7 19.5 26 Mail Express 18.1 14.3 17.2 Local 12 12.5 12.2 Overall 21.7 15.9 19.9 Source: Bangladesh Railway HP
Table 3.2: Schedule of Intercity Trains (Dhaka–Chittagong) From Departure To Arrive Time Required
Dhaka 7:45 Chittagong 13:50 6:05 Dhaka 15:00 Chittagong 20:10 5:10 Dhaka 21:00 Chittagong 4:30 7:30 Dhaka 23:30 Chittagong 6:20 6:50 Chittagong 7:00 Dhaka 12:10 5:10 Chittagong 12:30 Dhaka 19:00 6:30 Chittagong 15:00 Dhaka 21:00 6:00 Chittagong 23:00 Dhaka 5:25 6:25 Source: Bangladesh Railway HP
For the Dhaka–Chittagong corridor, the average total number of passengers per year is 3.1 million. The number of passengers has been rising due to the increased service capacity. Table 3.3 shows the number of passengers in east and west zones.
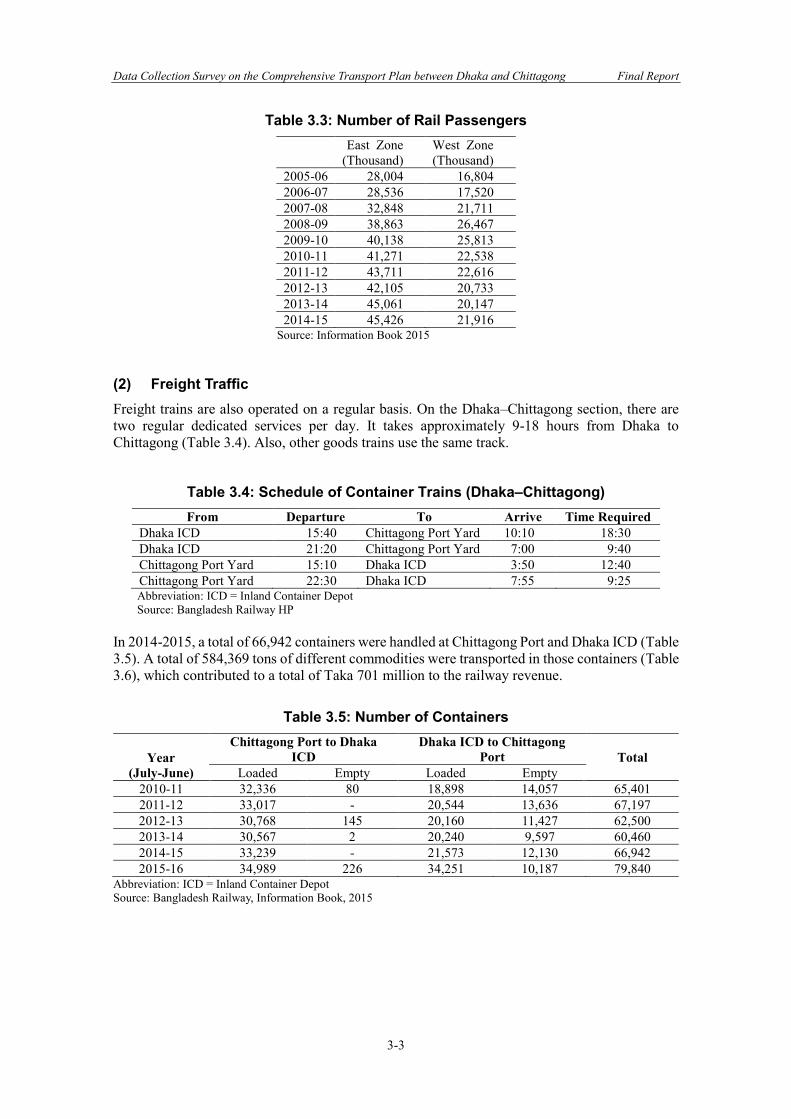
Data Collection Survey on the Comprehensive Transport Plan between Dhaka and Chittagong Final Report
3-3
Table 3.3: Number of Rail Passengers
East Zone (Thousand)
West Zone (Thousand)
2005-06 28,004 16,804 2006-07 28,536 17,520 2007-08 32,848 21,711 2008-09 38,863 26,467 2009-10 40,138 25,813 2010-11 41,271 22,538 2011-12 43,711 22,616 2012-13 42,105 20,733 2013-14 45,061 20,147 2014-15 45,426 21,916
Source: Information Book 2015 (2) Freight Traffic Freight trains are also operated on a regular basis. On the Dhaka–Chittagong section, there are two regular dedicated services per day. It takes approximately 9-18 hours from Dhaka to Chittagong (Table 3.4). Also, other goods trains use the same track.
Table 3.4: Schedule of Container Trains (Dhaka–Chittagong) From Departure To Arrive Time Required
Dhaka ICD 15:40 Chittagong Port Yard 10:10 18:30 Dhaka ICD 21:20 Chittagong Port Yard 7:00 9:40 Chittagong Port Yard 15:10 Dhaka ICD 3:50 12:40 Chittagong Port Yard 22:30 Dhaka ICD 7:55 9:25 Abbreviation: ICD = Inland Container Depot Source: Bangladesh Railway HP
In 2014-2015, a total of 66,942 containers were handled at Chittagong Port and Dhaka ICD (Table 3.5). A total of 584,369 tons of different commodities were transported in those containers (Table 3.6), which contributed to a total of Taka 701 million to the railway revenue.
Table 3.5: Number of Containers
Year (July-June)
Chittagong Port to Dhaka ICD
Dhaka ICD to Chittagong Port Total
Loaded Empty Loaded Empty 2010-11 32,336 80 18,898 14,057 65,401 2011-12 33,017 - 20,544 13,636 67,197 2012-13 30,768 145 20,160 11,427 62,500 2013-14 30,567 2 20,240 9,597 60,460 2014-15 33,239 - 21,573 12,130 66,942 2015-16 34,989 226 34,251 10,187 79,840
Abbreviation: ICD = Inland Container Depot Source: Bangladesh Railway, Information Book, 2015
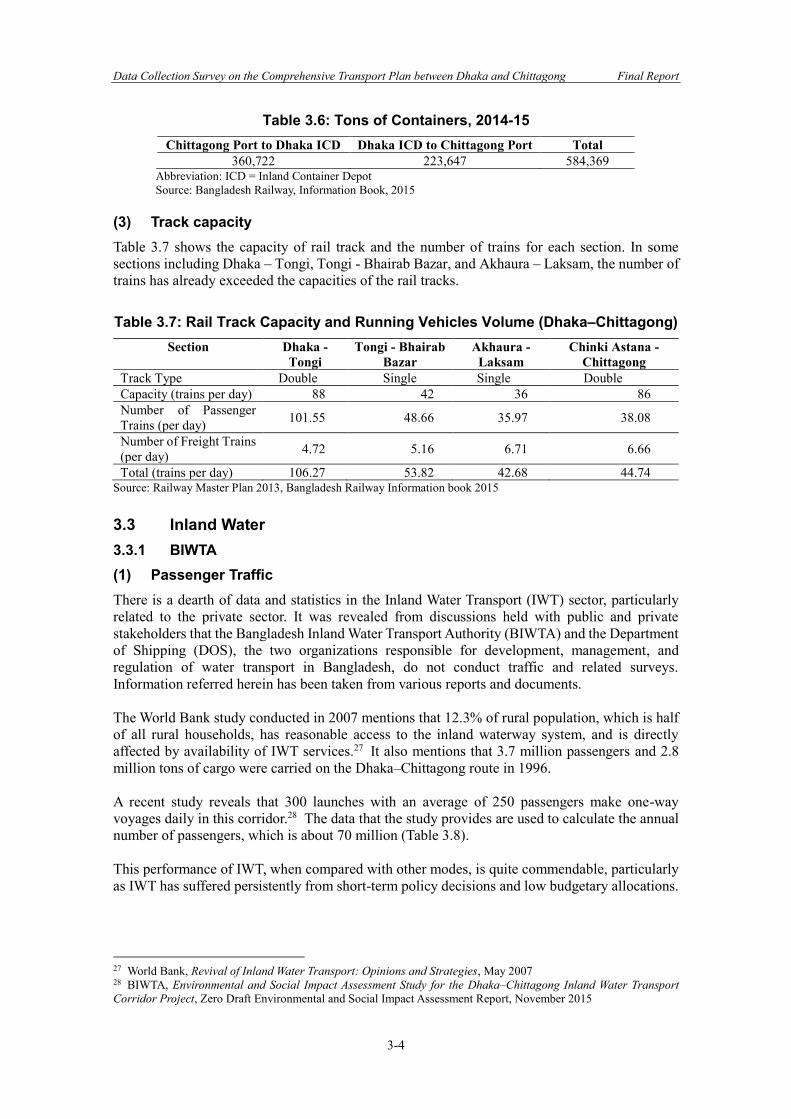
Data Collection Survey on the Comprehensive Transport Plan between Dhaka and Chittagong Final Report
3-4
Table 3.6: Tons of Containers, 2014-15 Chittagong Port to Dhaka ICD Dhaka ICD to Chittagong Port Total
360,722 223,647 584,369 Abbreviation: ICD = Inland Container Depot Source: Bangladesh Railway, Information Book, 2015
(3) Track capacity Table 3.7 shows the capacity of rail track and the number of trains for each section. In some sections including Dhaka – Tongi, Tongi - Bhairab Bazar, and Akhaura – Laksam, the number of trains has already exceeded the capacities of the rail tracks.
Table 3.7: Rail Track Capacity and Running Vehicles Volume (Dhaka–Chittagong) Section Dhaka -
Tongi Tongi - Bhairab
Bazar Akhaura - Laksam
Chinki Astana - Chittagong
Track Type Double Single Single Double Capacity (trains per day) 88 42 36 86 Number of Passenger Trains (per day) 101.55 48.66 35.97 38.08
Number of Freight Trains (per day) 4.72 5.16 6.71 6.66
Total (trains per day) 106.27 53.82 42.68 44.74 Source: Railway Master Plan 2013, Bangladesh Railway Information book 2015 3.3 Inland Water 3.3.1 BIWTA (1) Passenger Traffic There is a dearth of data and statistics in the Inland Water Transport (IWT) sector, particularly related to the private sector. It was revealed from discussions held with public and private stakeholders that the Bangladesh Inland Water Transport Authority (BIWTA) and the Department of Shipping (DOS), the two organizations responsible for development, management, and regulation of water transport in Bangladesh, do not conduct traffic and related surveys. Information referred herein has been taken from various reports and documents. The World Bank study conducted in 2007 mentions that 12.3% of rural population, which is half of all rural households, has reasonable access to the inland waterway system, and is directly affected by availability of IWT services.27 It also mentions that 3.7 million passengers and 2.8 million tons of cargo were carried on the Dhaka–Chittagong route in 1996. A recent study reveals that 300 launches with an average of 250 passengers make one-way voyages daily in this corridor.28 The data that the study provides are used to calculate the annual number of passengers, which is about 70 million (Table 3.8). This performance of IWT, when compared with other modes, is quite commendable, particularly as IWT has suffered persistently from short-term policy decisions and low budgetary allocations.
27 World Bank, Revival of Inland Water Transport: Opinions and Strategies, May 2007 28 BIWTA, Environmental and Social Impact Assessment Study for the Dhaka–Chittagong Inland Water Transport Corridor Project, Zero Draft Environmental and Social Impact Assessment Report, November 2015
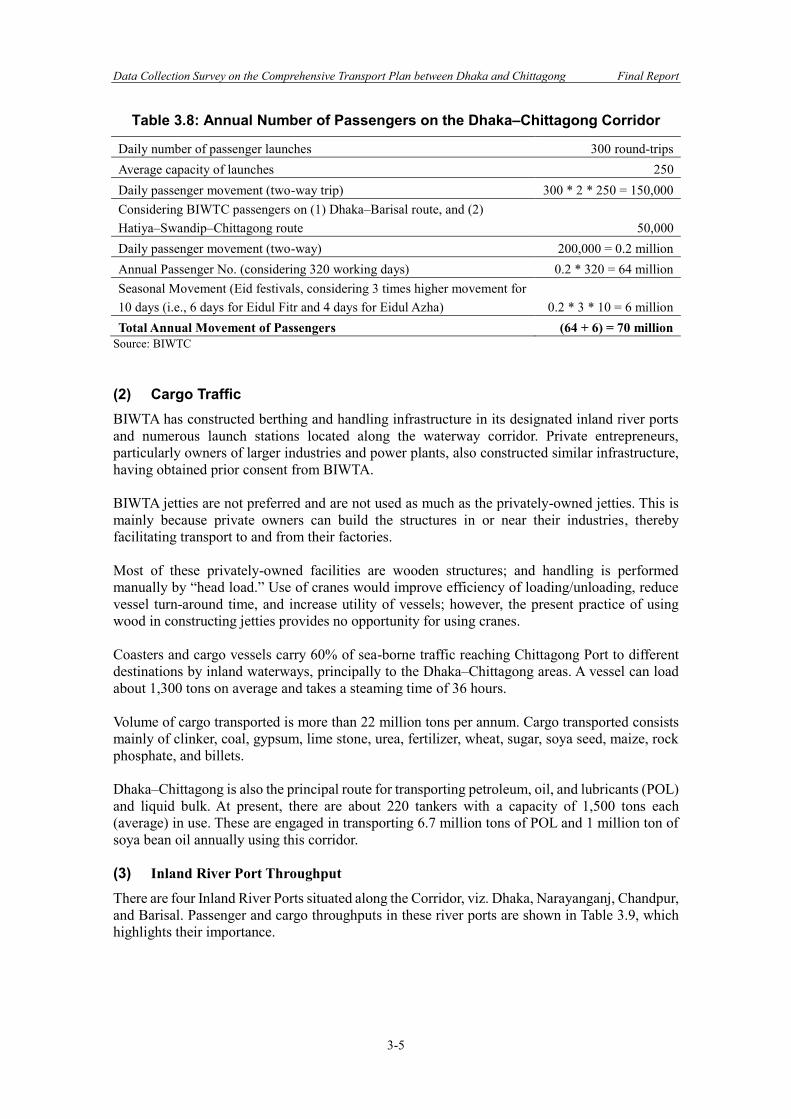
Data Collection Survey on the Comprehensive Transport Plan between Dhaka and Chittagong Final Report
3-5
Table 3.8: Annual Number of Passengers on the Dhaka–Chittagong Corridor
Daily number of passenger launches 300 round-trips Average capacity of launches 250 Daily passenger movement (two-way trip) 300 * 2 * 250 = 150,000 Considering BIWTC passengers on (1) Dhaka–Barisal route, and (2) Hatiya–Swandip–Chittagong route 50,000 Daily passenger movement (two-way) 200,000 = 0.2 million Annual Passenger No. (considering 320 working days) 0.2 * 320 = 64 million Seasonal Movement (Eid festivals, considering 3 times higher movement for 10 days (i.e., 6 days for Eidul Fitr and 4 days for Eidul Azha) 0.2 * 3 * 10 = 6 million Total Annual Movement of Passengers (64 + 6) = 70 million
Source: BIWTC (2) Cargo Traffic BIWTA has constructed berthing and handling infrastructure in its designated inland river ports and numerous launch stations located along the waterway corridor. Private entrepreneurs, particularly owners of larger industries and power plants, also constructed similar infrastructure, having obtained prior consent from BIWTA. BIWTA jetties are not preferred and are not used as much as the privately-owned jetties. This is mainly because private owners can build the structures in or near their industries, thereby facilitating transport to and from their factories. Most of these privately-owned facilities are wooden structures; and handling is performed manually by “head load.” Use of cranes would improve efficiency of loading/unloading, reduce vessel turn-around time, and increase utility of vessels; however, the present practice of using wood in constructing jetties provides no opportunity for using cranes. Coasters and cargo vessels carry 60% of sea-borne traffic reaching Chittagong Port to different destinations by inland waterways, principally to the Dhaka–Chittagong areas. A vessel can load about 1,300 tons on average and takes a steaming time of 36 hours. Volume of cargo transported is more than 22 million tons per annum. Cargo transported consists mainly of clinker, coal, gypsum, lime stone, urea, fertilizer, wheat, sugar, soya seed, maize, rock phosphate, and billets. Dhaka–Chittagong is also the principal route for transporting petroleum, oil, and lubricants (POL) and liquid bulk. At present, there are about 220 tankers with a capacity of 1,500 tons each (average) in use. These are engaged in transporting 6.7 million tons of POL and 1 million ton of soya bean oil annually using this corridor. (3) Inland River Port Throughput
There are four Inland River Ports situated along the Corridor, viz. Dhaka, Narayanganj, Chandpur, and Barisal. Passenger and cargo throughputs in these river ports are shown in Table 3.9, which highlights their importance.
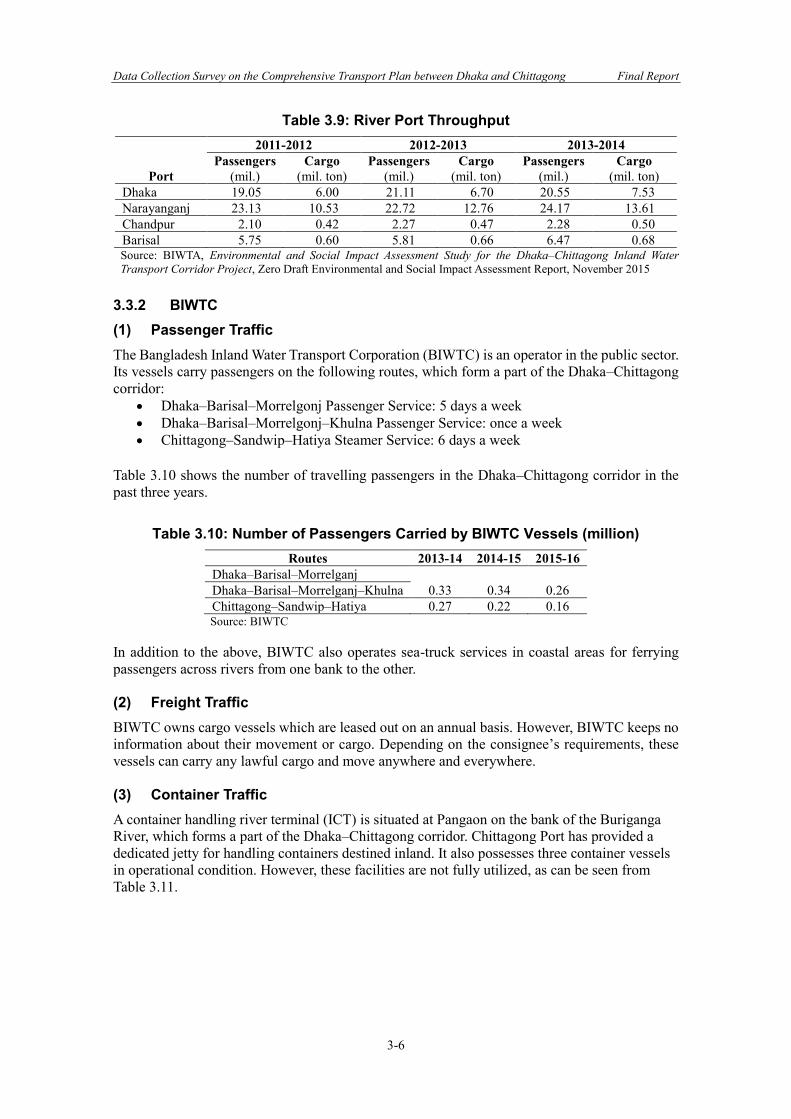
Data Collection Survey on the Comprehensive Transport Plan between Dhaka and Chittagong Final Report
3-6
Table 3.9: River Port Throughput
Port
2011-2012 2012-2013 2013-2014 Passengers
(mil.) Cargo
(mil. ton) Passengers
(mil.) Cargo
(mil. ton) Passengers
(mil.) Cargo
(mil. ton) Dhaka 19.05 6.00 21.11 6.70 20.55 7.53 Narayanganj 23.13 10.53 22.72 12.76 24.17 13.61 Chandpur 2.10 0.42 2.27 0.47 2.28 0.50 Barisal 5.75 0.60 5.81 0.66 6.47 0.68 Source: BIWTA, Environmental and Social Impact Assessment Study for the Dhaka–Chittagong Inland Water Transport Corridor Project, Zero Draft Environmental and Social Impact Assessment Report, November 2015
3.3.2 BIWTC (1) Passenger Traffic The Bangladesh Inland Water Transport Corporation (BIWTC) is an operator in the public sector. Its vessels carry passengers on the following routes, which form a part of the Dhaka–Chittagong corridor:
• Dhaka–Barisal–Morrelgonj Passenger Service: 5 days a week • Dhaka–Barisal–Morrelgonj–Khulna Passenger Service: once a week • Chittagong–Sandwip–Hatiya Steamer Service: 6 days a week
Table 3.10 shows the number of travelling passengers in the Dhaka–Chittagong corridor in the past three years.
Table 3.10: Number of Passengers Carried by BIWTC Vessels (million) Routes 2013-14 2014-15 2015-16
Dhaka–Barisal–Morrelganj 0.33 0.34 0.26 Dhaka–Barisal–Morrelganj–Khulna
Chittagong–Sandwip–Hatiya 0.27 0.22 0.16 Source: BIWTC
In addition to the above, BIWTC also operates sea-truck services in coastal areas for ferrying passengers across rivers from one bank to the other. (2) Freight Traffic BIWTC owns cargo vessels which are leased out on an annual basis. However, BIWTC keeps no information about their movement or cargo. Depending on the consignee’s requirements, these vessels can carry any lawful cargo and move anywhere and everywhere. (3) Container Traffic A container handling river terminal (ICT) is situated at Pangaon on the bank of the Buriganga River, which forms a part of the Dhaka–Chittagong corridor. Chittagong Port has provided a dedicated jetty for handling containers destined inland. It also possesses three container vessels in operational condition. However, these facilities are not fully utilized, as can be seen from Table 3.11.
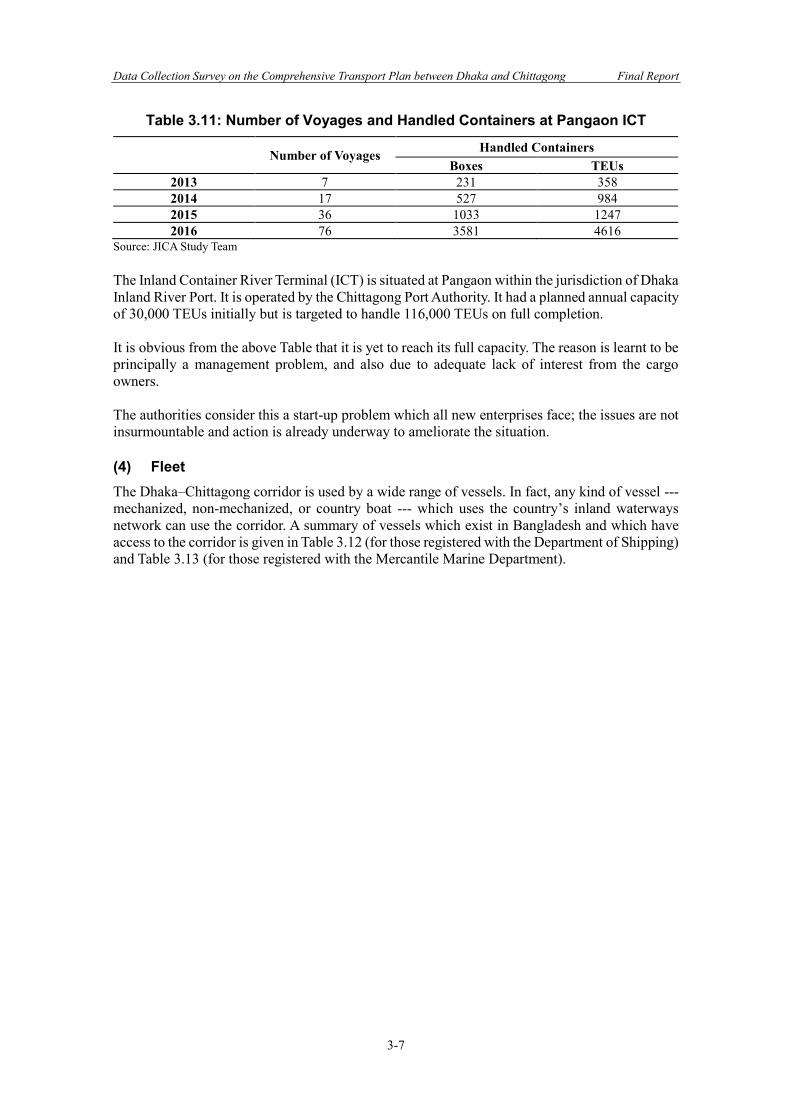
Data Collection Survey on the Comprehensive Transport Plan between Dhaka and Chittagong Final Report
3-7
Table 3.11: Number of Voyages and Handled Containers at Pangaon ICT
Number of Voyages Handled Containers Boxes TEUs
2013 7 231 358 2014 17 527 984 2015 36 1033 1247 2016 76 3581 4616
Source: JICA Study Team The Inland Container River Terminal (ICT) is situated at Pangaon within the jurisdiction of Dhaka Inland River Port. It is operated by the Chittagong Port Authority. It had a planned annual capacity of 30,000 TEUs initially but is targeted to handle 116,000 TEUs on full completion. It is obvious from the above Table that it is yet to reach its full capacity. The reason is learnt to be principally a management problem, and also due to adequate lack of interest from the cargo owners. The authorities consider this a start-up problem which all new enterprises face; the issues are not insurmountable and action is already underway to ameliorate the situation. (4) Fleet The Dhaka–Chittagong corridor is used by a wide range of vessels. In fact, any kind of vessel --- mechanized, non-mechanized, or country boat --- which uses the country’s inland waterways network can use the corridor. A summary of vessels which exist in Bangladesh and which have access to the corridor is given in Table 3.12 (for those registered with the Department of Shipping) and Table 3.13 (for those registered with the Mercantile Marine Department).
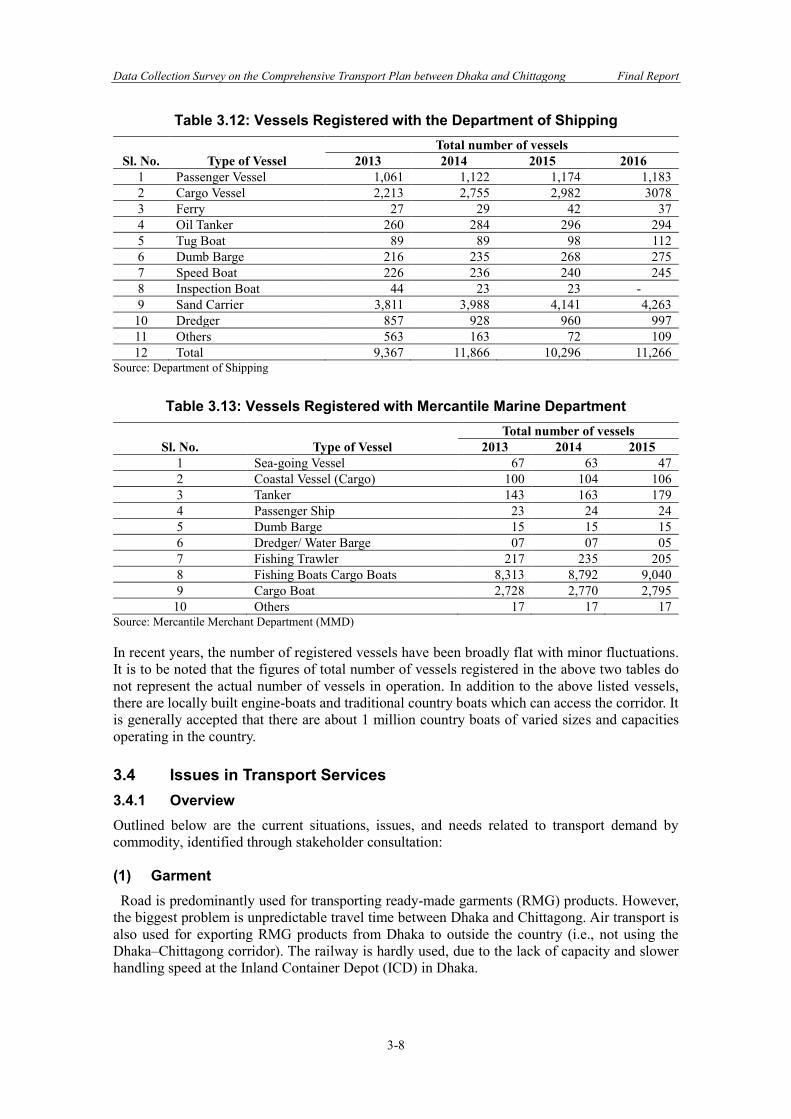
Data Collection Survey on the Comprehensive Transport Plan between Dhaka and Chittagong Final Report
3-8
Table 3.12: Vessels Registered with the Department of Shipping
Sl. No. Type of Vessel Total number of vessels
2013 2014 2015 2016 1 Passenger Vessel 1,061 1,122 1,174 1,183 2 Cargo Vessel 2,213 2,755 2,982 3078 3 Ferry 27 29 42 37 4 Oil Tanker 260 284 296 294 5 Tug Boat 89 89 98 112 6 Dumb Barge 216 235 268 275 7 Speed Boat 226 236 240 245 8 Inspection Boat 44 23 23 - 9 Sand Carrier 3,811 3,988 4,141 4,263
10 Dredger 857 928 960 997 11 Others 563 163 72 109 12 Total 9,367 11,866 10,296 11,266
Source: Department of Shipping
Table 3.13: Vessels Registered with Mercantile Marine Department
Sl. No. Type of Vessel Total number of vessels
2013 2014 2015 1 Sea-going Vessel 67 63 47 2 Coastal Vessel (Cargo) 100 104 106 3 Tanker 143 163 179 4 Passenger Ship 23 24 24 5 Dumb Barge 15 15 15 6 Dredger/ Water Barge 07 07 05 7 Fishing Trawler 217 235 205 8 Fishing Boats Cargo Boats 8,313 8,792 9,040 9 Cargo Boat 2,728 2,770 2,795
10 Others 17 17 17 Source: Mercantile Merchant Department (MMD) In recent years, the number of registered vessels have been broadly flat with minor fluctuations. It is to be noted that the figures of total number of vessels registered in the above two tables do not represent the actual number of vessels in operation. In addition to the above listed vessels, there are locally built engine-boats and traditional country boats which can access the corridor. It is generally accepted that there are about 1 million country boats of varied sizes and capacities operating in the country. 3.4 Issues in Transport Services 3.4.1 Overview Outlined below are the current situations, issues, and needs related to transport demand by commodity, identified through stakeholder consultation: (1) Garment Road is predominantly used for transporting ready-made garments (RMG) products. However, the biggest problem is unpredictable travel time between Dhaka and Chittagong. Air transport is also used for exporting RMG products from Dhaka to outside the country (i.e., not using the Dhaka–Chittagong corridor). The railway is hardly used, due to the lack of capacity and slower handling speed at the Inland Container Depot (ICD) in Dhaka.
Data Collection Survey on the Comprehensive Transport Plan between Dhaka and Chittagong Final Report
3-9
The Bangladesh Garments Manufacture and Export Association (BGMEA) simply put that if travel time reliability is improved, an increase of transport costs would not be a problem. BGMEA also recognizes that the following measures, among other things, are of utmost importance: the development of access control highways, the development of ICD, and improvement of handling efficiency at ICD. (2) Knitwear The Inland Container River Terminal (ICT) at Pangaon is used for importing cotton. The ICT has been strongly promoted by the government, but it is not fully utilized, due to (i) narrow roads in its surrounding, (ii) lack of container vessels, (iii) necessity of customs clearance at both Chittagong and Mongla, and (iv) lower level of workers compared to Chittagong. On the other hand, the road is basically used to transport knitwear from Dhaka to Chittagong for export. The railway is not much used because it requires arrangement of another transport between ICT and factories and reservation a week in advance (which makes it difficult to deal with urgent demand). The Bangladesh Knitwear Manufacturers and Exporters Association (BKMEA) expressed their intention to utilize inland waterways, and has requested the government to develop jetties along the Dhaka–Chittagong corridor. (3) Automobiles The railway is the major mode for transporting new automobiles from Chittagong to Dhaka. It is used for carrying automobiles that fit in the wagon, while the road is also used for transporting large vehicles (that do not fit in the wagon). There is one railway service available for transporting automobiles per direction per day between Dhaka and Chittagong, and three wagons are allocated to the automobile industry (one wagon can accommodate up to three automobiles). Automobile carrier trailers are not allowed in Bangladesh; thus, large vehicles are transported by a company’s own drivers. Similarly, loading onto wagons in Chittagong and unloading from wagons in Dhaka are undertaken by a company’s own drivers to ensure no scratches, although loading/unloading charges are paid to the authority. Truck overloading is a problem, so it is desirable that an appropriate regulation be enforced. (4) Liquefied Petroleum Gas Liquefied Petroleum Gas (LPG) is imported through Chittagong Port and mostly transported to Dhaka, which is a major marketing area. It is sailed to Kumira (Sitakundu), discharged at the bottling plant through a 1.2 km long pipe-line, and then transported to Dhaka using trucks (both company’s own and leased trucks). The railway is not used, due to its lack of reliability. As large vessels are used to transport LPG, high expectation is given to the development of Matarbari Port, including the development of an access road and rail spur. (5) Cement The modal split of transporting cement is 90% for road and 10% for inland water. However, it is considered that the inland water share should be increased to 20-30% in the future. There is a tendency for transporting cement by company’s own trucks, especially among those handling large volume. 3.4.2 Roads (1) Inadequate traffic management While some traffic management measures are being developed, there is a lack of traffic management. This leads to a situation where rickshaws and other vehicles obstruct traffic, causing
Data Collection Survey on the Comprehensive Transport Plan between Dhaka and Chittagong Final Report
3-10
congestion and safety problems. Additionally, a long-term plan for freight management is needed to better rationalize truck movements (e.g., separation of through traffic in Chittagong, installation of an automated signal system, etc.). The truck ban is in place in Dhaka, but a wider strategy is needed, as freight traffic and road maintenance issues are a continuing concern. (2) Truck ban Trucks are prohibited from entering Dhaka City from 8:00 a.m. to 8:00 p.m. They are parked at distant locations (e.g., in Comilla) to await lifting of the ban, which causes a traffic problem. In recent years, several roads have been developed to enable trucks to bypass Dhaka, and new garment factories are generally opening in areas where the ban does not apply. Some are moving, but others remain in Dhaka, with trucking operations constrained by the ban. (3) Truck size At present, many containers arriving at Chittagong Port are de-stuffed of their contents to be loaded onto trucks, as relatively few trucks can take containers. This takes time (typically taking up to 4 hours per container). In addition, whilst Bangladesh allows up to 40-foot containers on roads, the reality is that many of the containers are carried by 20-foot trucks. The large number of trucks on roads could raise customs problems, and further exacerbate traffic. With road improvement enabling the transport of large trucks (including automobile carrier trailers), the number of trucks would be reduced and congestion mitigated. 3.4.3 Rail (1) Insufficient service provision The railway accounts for approximately 60% of the passenger traffic between Dhaka and Chittagong. Nevertheless, there are only four intercity train services (both directions) per day between the two cities, and their occupancy ratios exceed 100%, indicating insufficient service provision vis-a-vis the demand. In response to this, the government is in the process of converting the Dhaka–Chittagong corridor from single to double track to increase capacity. (2) Diverted route and slow speed Even the fastest passenger trains take approximately 5.2 hours between Dhaka and Chittagong, because of the detoured route and slow speed. The actual route length is 110 km longer than the straight length between the two cities (i.e., 320 km for the route length and 210 km for the straight length), while the scheduled speed of the fastest passenger train is limited to approximately 60 km/h. In respond to these circumstances, the government is planning to develop a high-speed railway system. 3.4.4 Inland Water (1) Lack of unloading facilities
Inland river ports and launch stations (or launch ghats) lack necessary infrastructure facilities. Services provided by even developed ones like Dhaka River Port are much lower than expected. Level of services needs to be raised up in order to provide comfort and safety to the travelling public, including the old, the infirm, and the disabled. About 95% of all cargo is loaded or unloaded manually by head load at most jetties owned by factory owners themselves. This increases the dwelling time of vessels at the jetty.
Data Collection Survey on the Comprehensive Transport Plan between Dhaka and Chittagong Final Report
4-1
4. Transport Surveys
The JICA Study Team reviewed the existing survey reports to understand the current transport patterns between Dhaka and Chittagong and to determine the scope of traffic survey needed to complement the lack of data. Then, the JICA Study Team conducted transport surveys to grasp the information on transport service and demand. The results of this analysis will provide part of the basis for the demand forecast to follow in Chapter 5. 4.1 Review of Existing Studies and Scope of Transport Survey The existing relevant surveys are listed in Table 4.1. First, under the Cross-Border Road survey, JICA conducted traffic count surveys at several points on the roads leading to the neighboring countries and implemented country-wide road traffic forecast. Second, under The Project on the Revision and Updating of the Strategic Transport Plan for Dhaka, JICA conducted cordon line surveys at the roadside and counting surveys with OD interviews at terminals of the railway, airport, bus, and ferry. The results of the cordon line surveys help the JICA Study Team to understand the passengers’ choice of transport mode from Dhaka City to its outside. Third, under the ADB Technical PPP F/S of the Expressway, ADB conducted a traffic counts survey at several points on the current N1 and the road traffic forecast with the Upazila-unit OD table. Fourth, under the Transactional PPP F/S of the Expressway, RHD has decided the alignment of the planned Dhaka–Chittagong Expressway, forecasted the traffic volume, estimated the project cost, and evaluated the financial feasibility using scenario analysis. Lastly, under the ADB Strategic M/P for Chittagong Port, ADB assessed the capacities of its hinterland transport (Table 4.2) The JICA Study Team conducted three kinds of surveys to complement the lack of information. One is transport surveys to investigate the current rail and IWT traffic by interviewing terminal administers and operators. Surveyors visited the major stations and terminals to collect necessary information such as traffic volume and level of services at the stations. Another is Revealed Preference (RP) and Stated Preference (SP) surveys of travelers at major terminals and stations. A traveler is currently experiencing that behavior and making a choice based on his or her knowledge of the available travel options. The RP survey was conducted to capture travelers’ current travel behavior, which included actual mode a traveler was using, actual travel times, and OD data. Meanwhile, the SP data were also collected, in which hypothetical situations were presented to the respondents, who were then asked to choose based on the given attributes for each alternative. The SP survey assumed the situation where High-Speed Rail would be developed between Dhaka and Chittagong. The other survey was an interview survey with freight forwarders and major cargo owners in Dhaka and Chittagong. This survey collected their current choice of transport mode, reasons for mode preference, current transport time and cost, and their thoughts on necessary improvements for railway and IWT in freight services.
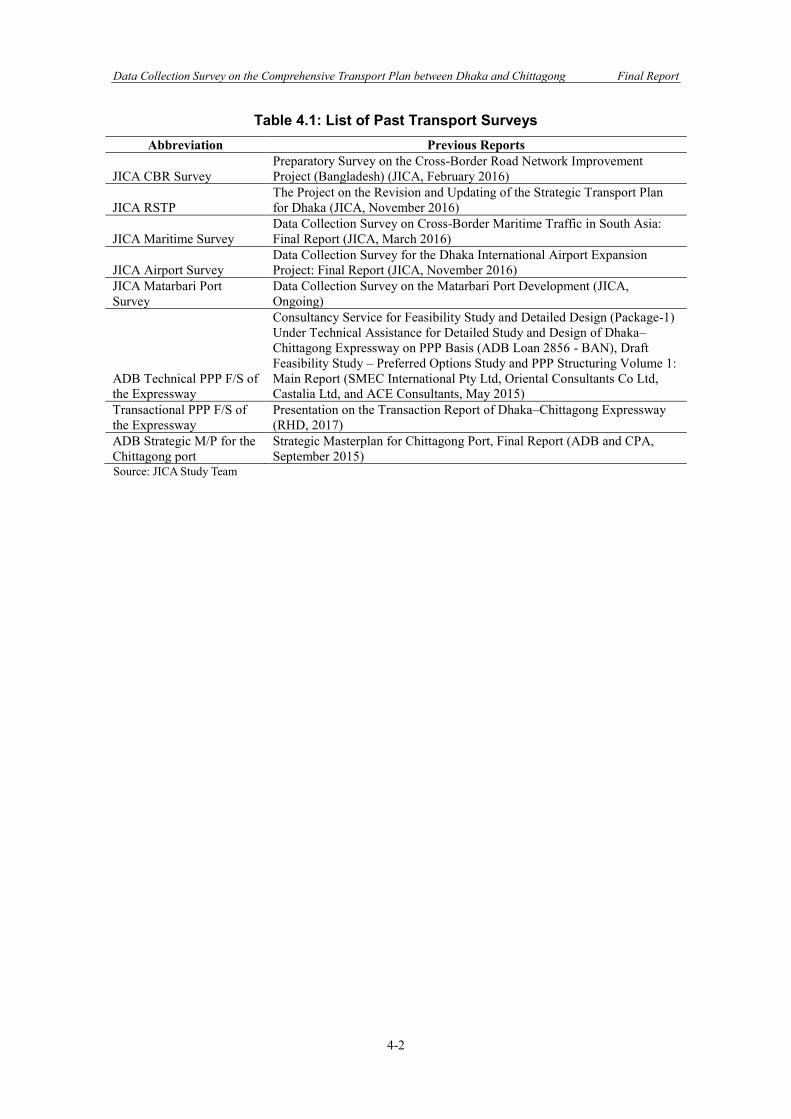
Data Collection Survey on the Comprehensive Transport Plan between Dhaka and Chittagong Final Report
4-2
Table 4.1: List of Past Transport Surveys Abbreviation Previous Reports
JICA CBR Survey Preparatory Survey on the Cross-Border Road Network Improvement Project (Bangladesh) (JICA, February 2016)
JICA RSTP The Project on the Revision and Updating of the Strategic Transport Plan for Dhaka (JICA, November 2016)
JICA Maritime Survey Data Collection Survey on Cross-Border Maritime Traffic in South Asia: Final Report (JICA, March 2016)
JICA Airport Survey Data Collection Survey for the Dhaka International Airport Expansion Project: Final Report (JICA, November 2016)
JICA Matarbari Port Survey
Data Collection Survey on the Matarbari Port Development (JICA, Ongoing)
ADB Technical PPP F/S of the Expressway
Consultancy Service for Feasibility Study and Detailed Design (Package-1) Under Technical Assistance for Detailed Study and Design of Dhaka–Chittagong Expressway on PPP Basis (ADB Loan 2856 - BAN), Draft Feasibility Study – Preferred Options Study and PPP Structuring Volume 1: Main Report (SMEC International Pty Ltd, Oriental Consultants Co Ltd, Castalia Ltd, and ACE Consultants, May 2015)
Transactional PPP F/S of the Expressway
Presentation on the Transaction Report of Dhaka–Chittagong Expressway (RHD, 2017)
ADB Strategic M/P for the Chittagong port
Strategic Masterplan for Chittagong Port, Final Report (ADB and CPA, September 2015)
Source: JICA Study Team
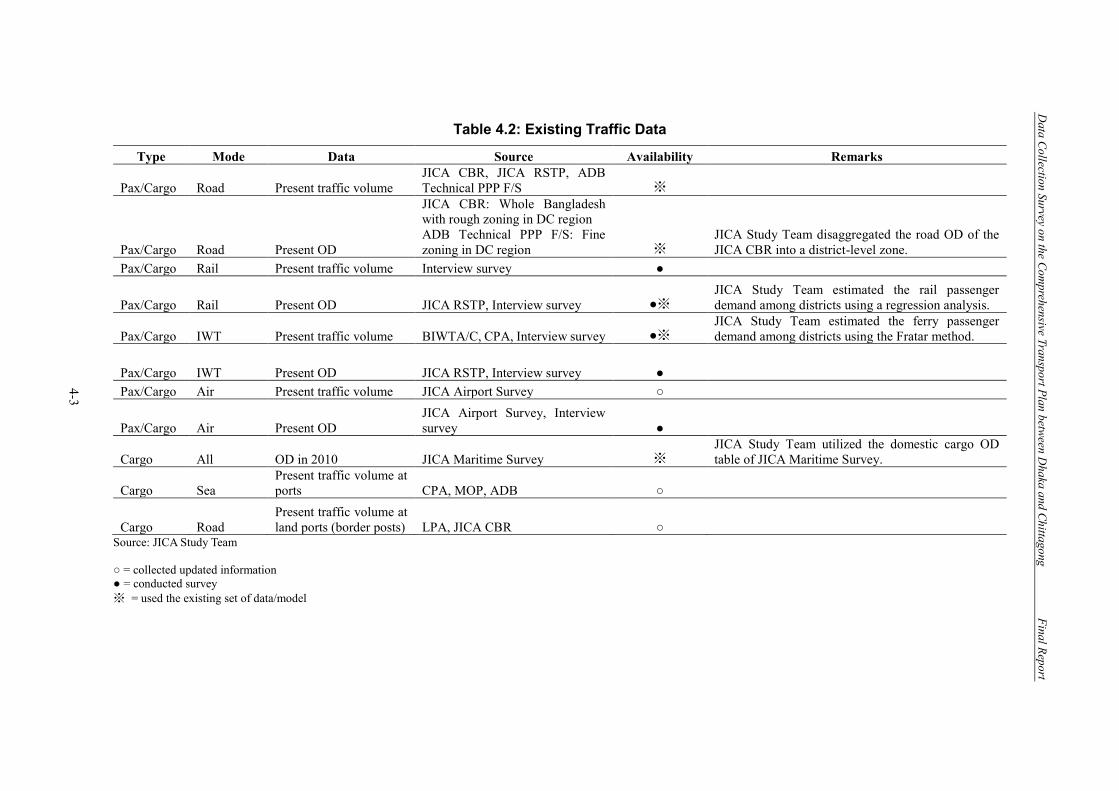
Data Collection Survey on the Com
prehensive Transport Plan between Dhaka and Chittagong
Final Report
4-3
Table 4.2: Existing Traffic Data
Type Mode Data Source Availability Remarks
Pax/Cargo Road Present traffic volume JICA CBR, JICA RSTP, ADB Technical PPP F/S ※
Pax/Cargo Road Present OD
JICA CBR: Whole Bangladesh with rough zoning in DC region ADB Technical PPP F/S: Fine zoning in DC region ※
JICA Study Team disaggregated the road OD of the JICA CBR into a district-level zone.
Pax/Cargo Rail Present traffic volume Interview survey ●
Pax/Cargo Rail Present OD JICA RSTP, Interview survey ●※ JICA Study Team estimated the rail passenger demand among districts using a regression analysis.
Pax/Cargo IWT Present traffic volume BIWTA/C, CPA, Interview survey ●※ JICA Study Team estimated the ferry passenger demand among districts using the Fratar method.
Pax/Cargo IWT Present OD JICA RSTP, Interview survey ● Pax/Cargo Air Present traffic volume JICA Airport Survey ○
Pax/Cargo Air Present OD JICA Airport Survey, Interview survey ●
Cargo All OD in 2010 JICA Maritime Survey ※ JICA Study Team utilized the domestic cargo OD table of JICA Maritime Survey.
Cargo Sea Present traffic volume at ports CPA, MOP, ADB ○
Cargo Road Present traffic volume at land ports (border posts) LPA, JICA CBR ○
Source: JICA Study Team ○ = collected updated information ● = conducted survey ※ = used the existing set of data/model
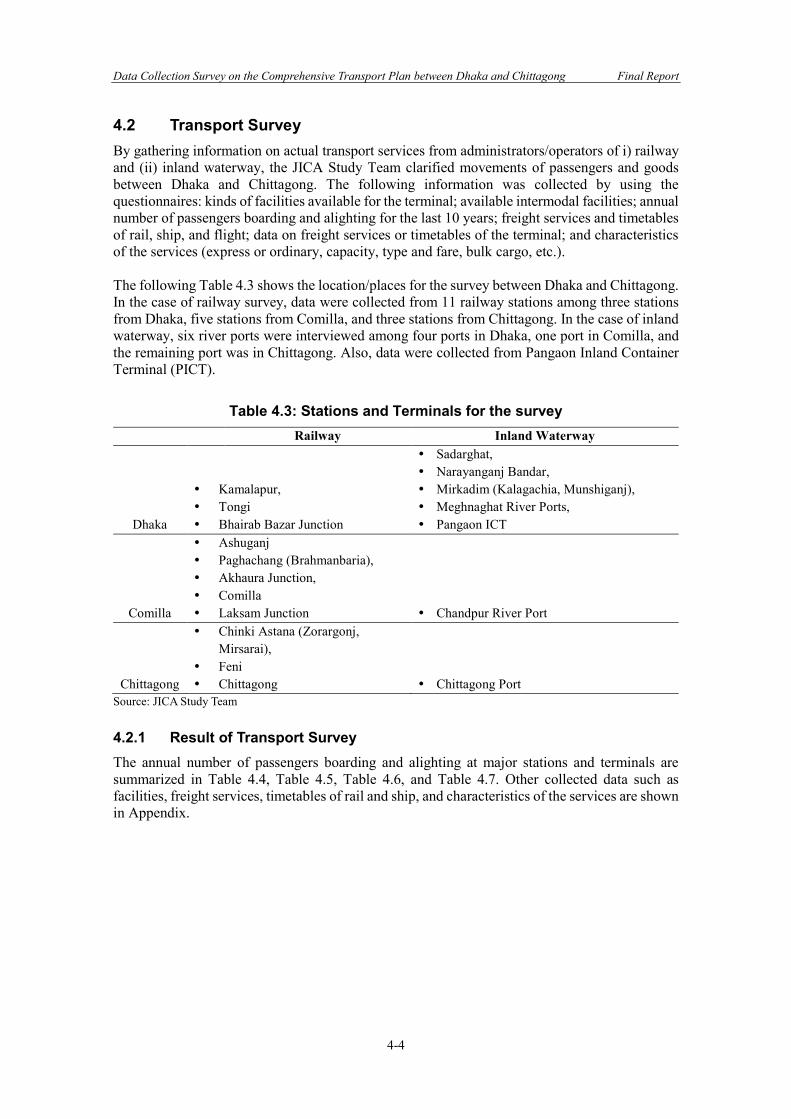
Data Collection Survey on the Comprehensive Transport Plan between Dhaka and Chittagong Final Report
4-4
4.2 Transport Survey By gathering information on actual transport services from administrators/operators of i) railway and (ii) inland waterway, the JICA Study Team clarified movements of passengers and goods between Dhaka and Chittagong. The following information was collected by using the questionnaires: kinds of facilities available for the terminal; available intermodal facilities; annual number of passengers boarding and alighting for the last 10 years; freight services and timetables of rail, ship, and flight; data on freight services or timetables of the terminal; and characteristics of the services (express or ordinary, capacity, type and fare, bulk cargo, etc.). The following Table 4.3 shows the location/places for the survey between Dhaka and Chittagong. In the case of railway survey, data were collected from 11 railway stations among three stations from Dhaka, five stations from Comilla, and three stations from Chittagong. In the case of inland waterway, six river ports were interviewed among four ports in Dhaka, one port in Comilla, and the remaining port was in Chittagong. Also, data were collected from Pangaon Inland Container Terminal (PICT).
Table 4.3: Stations and Terminals for the survey
Railway Inland Waterway
Dhaka
Kamalapur, Tongi Bhairab Bazar Junction
Sadarghat, Narayanganj Bandar, Mirkadim (Kalagachia, Munshiganj), Meghnaghat River Ports, Pangaon ICT
Comilla
Ashuganj Paghachang (Brahmanbaria), Akhaura Junction, Comilla Laksam Junction Chandpur River Port
Chittagong
Chinki Astana (Zorargonj, Mirsarai),
Feni Chittagong Chittagong Port
Source: JICA Study Team 4.2.1 Result of Transport Survey The annual number of passengers boarding and alighting at major stations and terminals are summarized in Table 4.4, Table 4.5, Table 4.6, and Table 4.7. Other collected data such as facilities, freight services, timetables of rail and ship, and characteristics of the services are shown in Appendix.
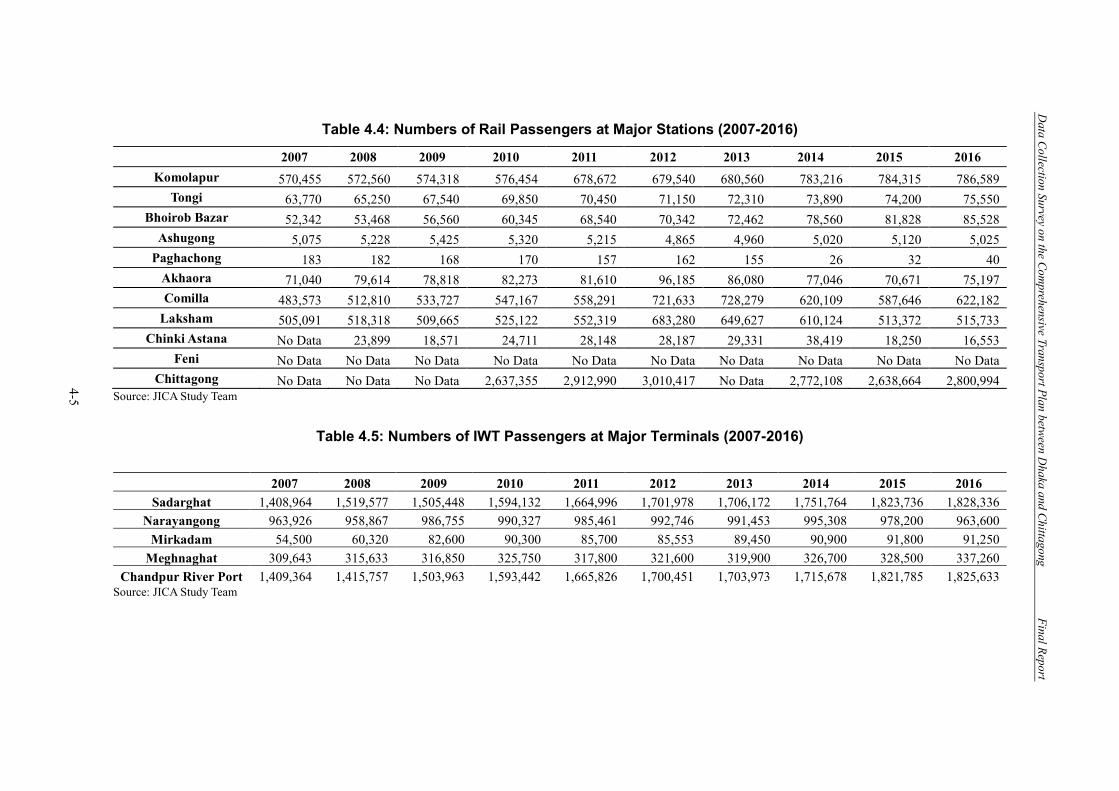
Data Collection Survey on the Com
prehensive Transport Plan between Dhaka and Chittagong
Final Report
4-5
Table 4.4: Numbers of Rail Passengers at Major Stations (2007-2016)
Source: JICA Study Team
Table 4.5: Numbers of IWT Passengers at Major Terminals (2007-2016)
Source: JICA Study Team
2007 2008 2009 2010 2011 2012 2013 2014 2015 2016 Komolapur 570,455 572,560 574,318 576,454 678,672 679,540 680,560 783,216 784,315 786,589
Tongi 63,770 65,250 67,540 69,850 70,450 71,150 72,310 73,890 74,200 75,550 Bhoirob Bazar 52,342 53,468 56,560 60,345 68,540 70,342 72,462 78,560 81,828 85,528
Ashugong 5,075 5,228 5,425 5,320 5,215 4,865 4,960 5,020 5,120 5,025 Paghachong 183 182 168 170 157 162 155 26 32 40
Akhaora 71,040 79,614 78,818 82,273 81,610 96,185 86,080 77,046 70,671 75,197 Comilla 483,573 512,810 533,727 547,167 558,291 721,633 728,279 620,109 587,646 622,182
Laksham 505,091 518,318 509,665 525,122 552,319 683,280 649,627 610,124 513,372 515,733 Chinki Astana No Data 23,899 18,571 24,711 28,148 28,187 29,331 38,419 18,250 16,553
Feni No Data No Data No Data No Data No Data No Data No Data No Data No Data No Data Chittagong No Data No Data No Data 2,637,355 2,912,990 3,010,417 No Data 2,772,108 2,638,664 2,800,994
2007 2008 2009 2010 2011 2012 2013 2014 2015 2016 Sadarghat 1,408,964 1,519,577 1,505,448 1,594,132 1,664,996 1,701,978 1,706,172 1,751,764 1,823,736 1,828,336
Narayangong 963,926 958,867 986,755 990,327 985,461 992,746 991,453 995,308 978,200 963,600 Mirkadam 54,500 60,320 82,600 90,300 85,700 85,553 89,450 90,900 91,800 91,250
Meghnaghat 309,643 315,633 316,850 325,750 317,800 321,600 319,900 326,700 328,500 337,260 Chandpur River Port 1,409,364 1,415,757 1,503,963 1,593,442 1,665,826 1,700,451 1,703,973 1,715,678 1,821,785 1,825,633
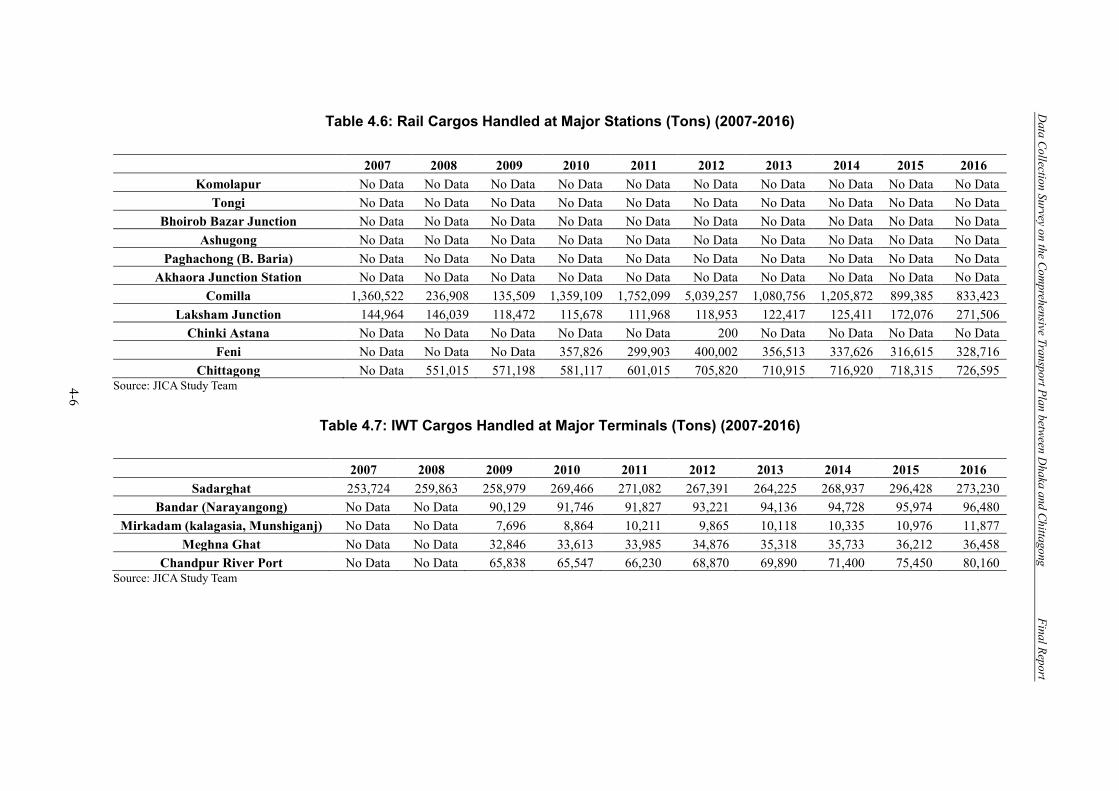
Data Collection Survey on the Com
prehensive Transport Plan between Dhaka and Chittagong
Final Report
4-6
Table 4.6: Rail Cargos Handled at Major Stations (Tons) (2007-2016)
2007 2008 2009 2010 2011 2012 2013 2014 2015 2016 Komolapur No Data No Data No Data No Data No Data No Data No Data No Data No Data No Data
Tongi No Data No Data No Data No Data No Data No Data No Data No Data No Data No Data Bhoirob Bazar Junction No Data No Data No Data No Data No Data No Data No Data No Data No Data No Data
Ashugong No Data No Data No Data No Data No Data No Data No Data No Data No Data No Data Paghachong (B. Baria) No Data No Data No Data No Data No Data No Data No Data No Data No Data No Data
Akhaora Junction Station No Data No Data No Data No Data No Data No Data No Data No Data No Data No Data Comilla 1,360,522 236,908 135,509 1,359,109 1,752,099 5,039,257 1,080,756 1,205,872 899,385 833,423
Laksham Junction 144,964 146,039 118,472 115,678 111,968 118,953 122,417 125,411 172,076 271,506 Chinki Astana No Data No Data No Data No Data No Data 200 No Data No Data No Data No Data
Feni No Data No Data No Data 357,826 299,903 400,002 356,513 337,626 316,615 328,716 Chittagong No Data 551,015 571,198 581,117 601,015 705,820 710,915 716,920 718,315 726,595
Source: JICA Study Team
Table 4.7: IWT Cargos Handled at Major Terminals (Tons) (2007-2016)
2007 2008 2009 2010 2011 2012 2013 2014 2015 2016 Sadarghat 253,724 259,863 258,979 269,466 271,082 267,391 264,225 268,937 296,428 273,230
Bandar (Narayangong) No Data No Data 90,129 91,746 91,827 93,221 94,136 94,728 95,974 96,480 Mirkadam (kalagasia, Munshiganj) No Data No Data 7,696 8,864 10,211 9,865 10,118 10,335 10,976 11,877
Meghna Ghat No Data No Data 32,846 33,613 33,985 34,876 35,318 35,733 36,212 36,458 Chandpur River Port No Data No Data 65,838 65,547 66,230 68,870 69,890 71,400 75,450 80,160
Source: JICA Study Team
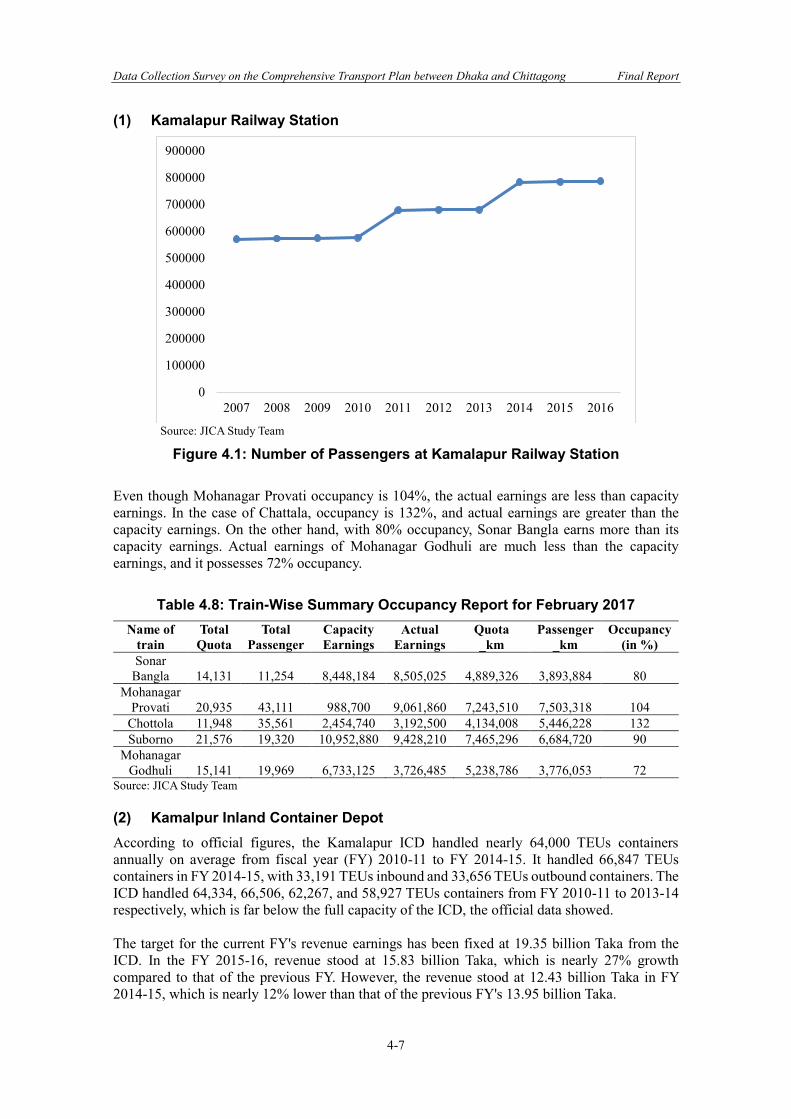
Data Collection Survey on the Comprehensive Transport Plan between Dhaka and Chittagong Final Report
4-7
(1) Kamalapur Railway Station
Source: JICA Study Team
Figure 4.1: Number of Passengers at Kamalapur Railway Station Even though Mohanagar Provati occupancy is 104%, the actual earnings are less than capacity earnings. In the case of Chattala, occupancy is 132%, and actual earnings are greater than the capacity earnings. On the other hand, with 80% occupancy, Sonar Bangla earns more than its capacity earnings. Actual earnings of Mohanagar Godhuli are much less than the capacity earnings, and it possesses 72% occupancy.
Table 4.8: Train-Wise Summary Occupancy Report for February 2017 Name of
train Total Quota
Total Passenger
Capacity Earnings
Actual Earnings
Quota _km
Passenger _km
Occupancy (in %)
Sonar Bangla 14,131 11,254 8,448,184 8,505,025 4,889,326 3,893,884 80
Mohanagar Provati 20,935 43,111 988,700 9,061,860 7,243,510 7,503,318 104
Chottola 11,948 35,561 2,454,740 3,192,500 4,134,008 5,446,228 132 Suborno 21,576 19,320 10,952,880 9,428,210 7,465,296 6,684,720 90
Mohanagar Godhuli 15,141 19,969 6,733,125 3,726,485 5,238,786 3,776,053 72
Source: JICA Study Team (2) Kamalpur Inland Container Depot According to official figures, the Kamalapur ICD handled nearly 64,000 TEUs containers annually on average from fiscal year (FY) 2010-11 to FY 2014-15. It handled 66,847 TEUs containers in FY 2014-15, with 33,191 TEUs inbound and 33,656 TEUs outbound containers. The ICD handled 64,334, 66,506, 62,267, and 58,927 TEUs containers from FY 2010-11 to 2013-14 respectively, which is far below the full capacity of the ICD, the official data showed. The target for the current FY's revenue earnings has been fixed at 19.35 billion Taka from the ICD. In the FY 2015-16, revenue stood at 15.83 billion Taka, which is nearly 27% growth compared to that of the previous FY. However, the revenue stood at 12.43 billion Taka in FY 2014-15, which is nearly 12% lower than that of the previous FY's 13.95 billion Taka.
0
100000
200000
300000
400000
500000
600000
700000
800000
900000
2007 2008 2009 2010 2011 2012 2013 2014 2015 2016
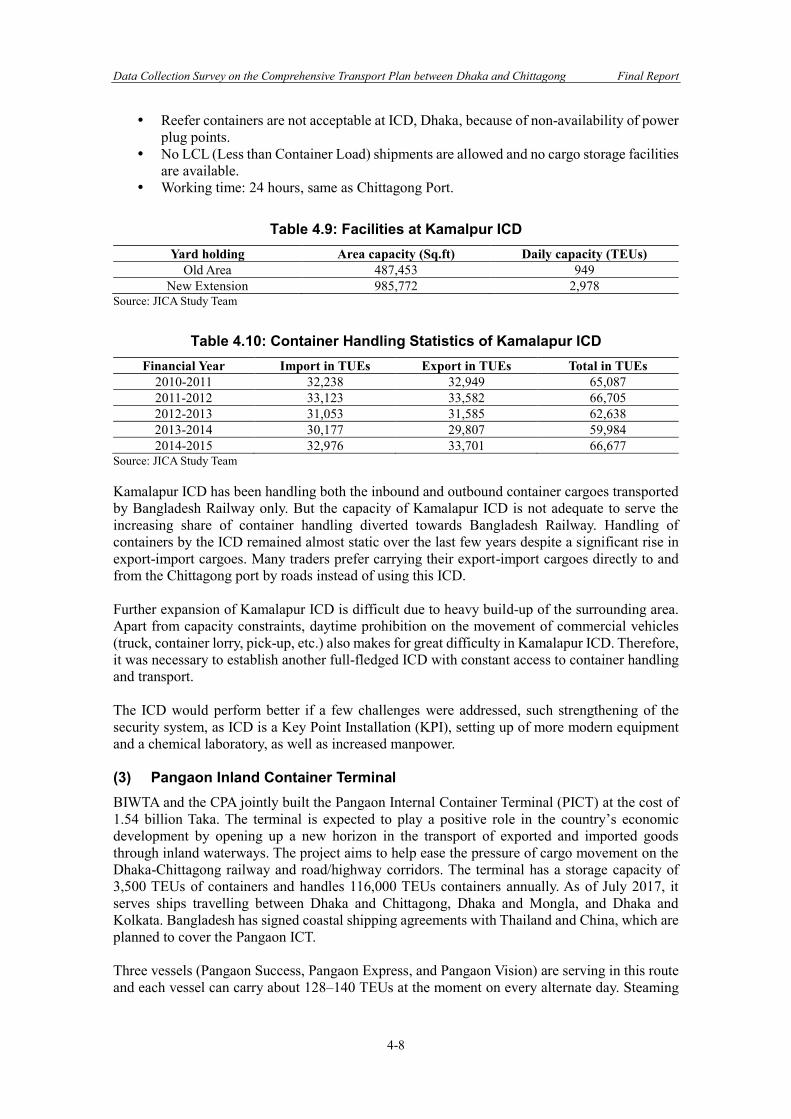
Data Collection Survey on the Comprehensive Transport Plan between Dhaka and Chittagong Final Report
4-8
Reefer containers are not acceptable at ICD, Dhaka, because of non-availability of power plug points.
No LCL (Less than Container Load) shipments are allowed and no cargo storage facilities are available.
Working time: 24 hours, same as Chittagong Port.
Table 4.9: Facilities at Kamalpur ICD Yard holding Area capacity (Sq.ft) Daily capacity (TEUs)
Old Area 487,453 949 New Extension 985,772 2,978
Source: JICA Study Team
Table 4.10: Container Handling Statistics of Kamalapur ICD Financial Year Import in TUEs Export in TUEs Total in TUEs
2010-2011 32,238 32,949 65,087 2011-2012 33,123 33,582 66,705 2012-2013 31,053 31,585 62,638 2013-2014 30,177 29,807 59,984 2014-2015 32,976 33,701 66,677
Source: JICA Study Team Kamalapur ICD has been handling both the inbound and outbound container cargoes transported by Bangladesh Railway only. But the capacity of Kamalapur ICD is not adequate to serve the increasing share of container handling diverted towards Bangladesh Railway. Handling of containers by the ICD remained almost static over the last few years despite a significant rise in export-import cargoes. Many traders prefer carrying their export-import cargoes directly to and from the Chittagong port by roads instead of using this ICD. Further expansion of Kamalapur ICD is difficult due to heavy build-up of the surrounding area. Apart from capacity constraints, daytime prohibition on the movement of commercial vehicles (truck, container lorry, pick-up, etc.) also makes for great difficulty in Kamalapur ICD. Therefore, it was necessary to establish another full-fledged ICD with constant access to container handling and transport. The ICD would perform better if a few challenges were addressed, such strengthening of the security system, as ICD is a Key Point Installation (KPI), setting up of more modern equipment and a chemical laboratory, as well as increased manpower. (3) Pangaon Inland Container Terminal BIWTA and the CPA jointly built the Pangaon Internal Container Terminal (PICT) at the cost of 1.54 billion Taka. The terminal is expected to play a positive role in the country’s economic development by opening up a new horizon in the transport of exported and imported goods through inland waterways. The project aims to help ease the pressure of cargo movement on the Dhaka-Chittagong railway and road/highway corridors. The terminal has a storage capacity of 3,500 TEUs of containers and handles 116,000 TEUs containers annually. As of July 2017, it serves ships travelling between Dhaka and Chittagong, Dhaka and Mongla, and Dhaka and Kolkata. Bangladesh has signed coastal shipping agreements with Thailand and China, which are planned to cover the Pangaon ICT. Three vessels (Pangaon Success, Pangaon Express, and Pangaon Vision) are serving in this route and each vessel can carry about 128–140 TEUs at the moment on every alternate day. Steaming
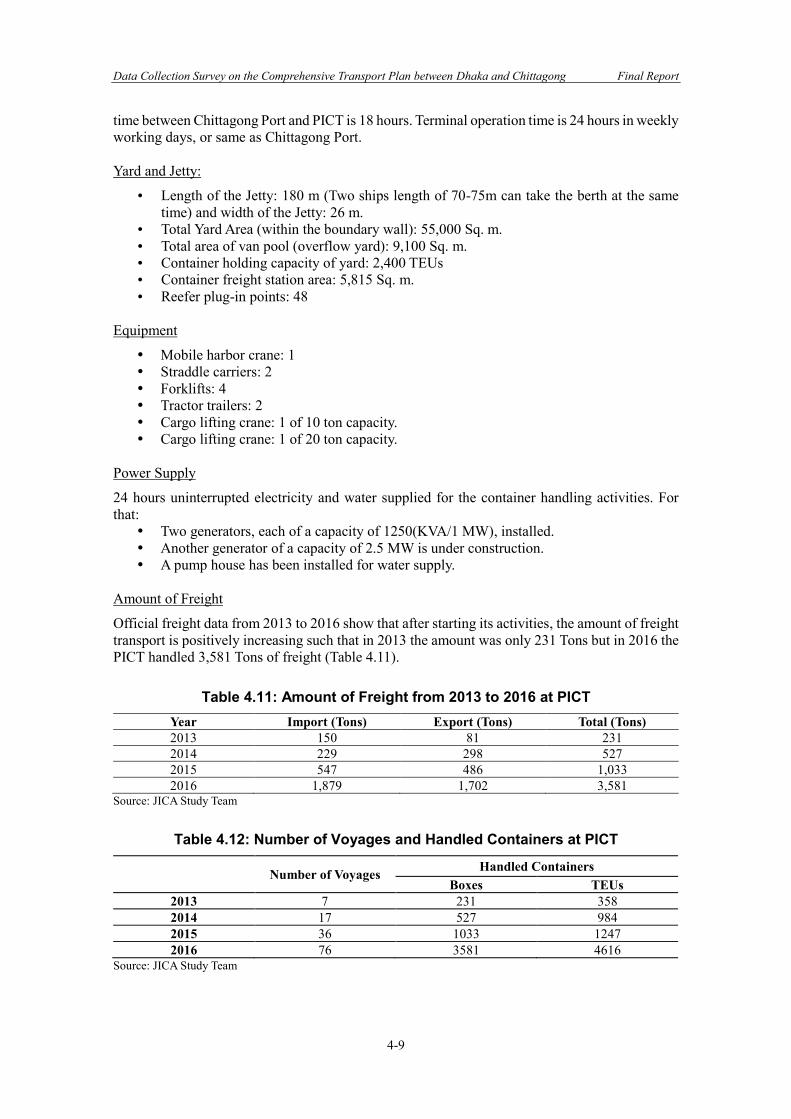
Data Collection Survey on the Comprehensive Transport Plan between Dhaka and Chittagong Final Report
4-9
time between Chittagong Port and PICT is 18 hours. Terminal operation time is 24 hours in weekly working days, or same as Chittagong Port. Yard and Jetty:
Length of the Jetty: 180 m (Two ships length of 70-75m can take the berth at the same time) and width of the Jetty: 26 m.
Total Yard Area (within the boundary wall): 55,000 Sq. m. Total area of van pool (overflow yard): 9,100 Sq. m. Container holding capacity of yard: 2,400 TEUs Container freight station area: 5,815 Sq. m. Reefer plug-in points: 48
Equipment
Mobile harbor crane: 1 Straddle carriers: 2 Forklifts: 4 Tractor trailers: 2 Cargo lifting crane: 1 of 10 ton capacity. Cargo lifting crane: 1 of 20 ton capacity.
Power Supply
24 hours uninterrupted electricity and water supplied for the container handling activities. For that:
Two generators, each of a capacity of 1250(KVA/1 MW), installed. Another generator of a capacity of 2.5 MW is under construction. A pump house has been installed for water supply.
Amount of Freight
Official freight data from 2013 to 2016 show that after starting its activities, the amount of freight transport is positively increasing such that in 2013 the amount was only 231 Tons but in 2016 the PICT handled 3,581 Tons of freight (Table 4.11).
Table 4.11: Amount of Freight from 2013 to 2016 at PICT Year Import (Tons) Export (Tons) Total (Tons) 2013 150 81 231 2014 229 298 527 2015 547 486 1,033 2016 1,879 1,702 3,581
Source: JICA Study Team
Table 4.12: Number of Voyages and Handled Containers at PICT
Number of Voyages Handled Containers Boxes TEUs
2013 7 231 358 2014 17 527 984 2015 36 1033 1247 2016 76 3581 4616
Source: JICA Study Team
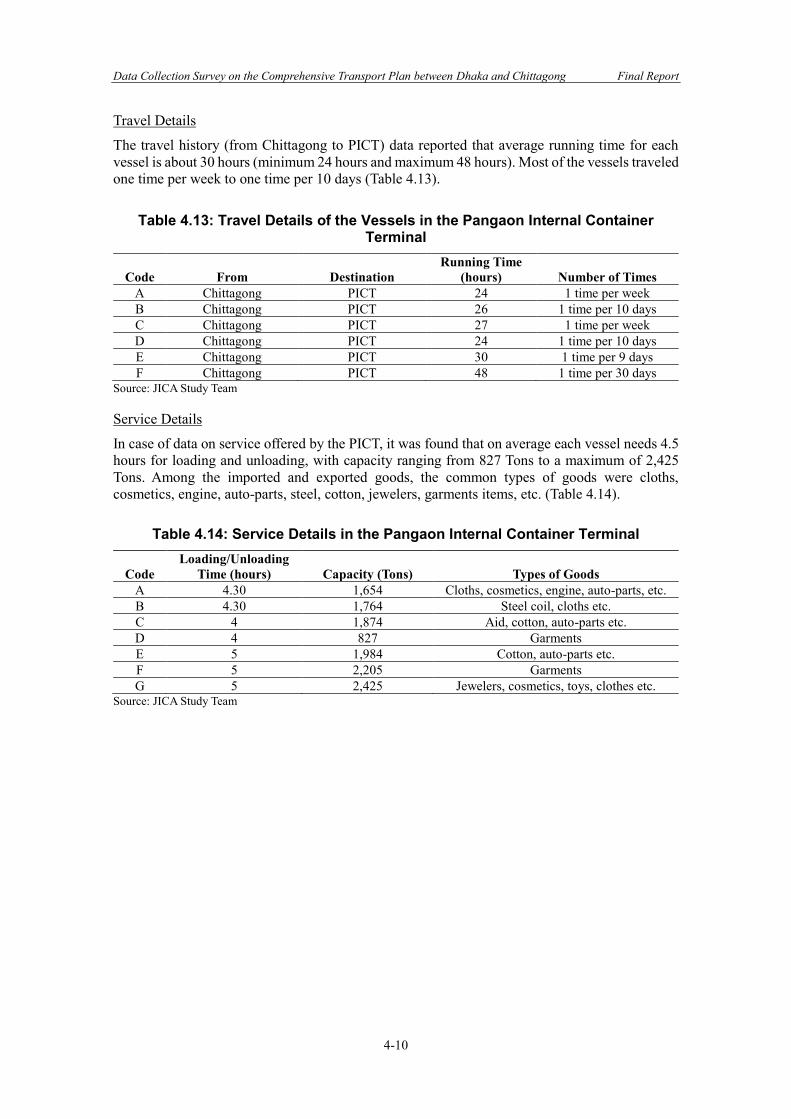
Data Collection Survey on the Comprehensive Transport Plan between Dhaka and Chittagong Final Report
4-10
Travel Details
The travel history (from Chittagong to PICT) data reported that average running time for each vessel is about 30 hours (minimum 24 hours and maximum 48 hours). Most of the vessels traveled one time per week to one time per 10 days (Table 4.13).
Table 4.13: Travel Details of the Vessels in the Pangaon Internal Container Terminal
Code From Destination Running Time
(hours) Number of Times A Chittagong PICT 24 1 time per week B Chittagong PICT 26 1 time per 10 days C Chittagong PICT 27 1 time per week D Chittagong PICT 24 1 time per 10 days E Chittagong PICT 30 1 time per 9 days F Chittagong PICT 48 1 time per 30 days
Source: JICA Study Team Service Details
In case of data on service offered by the PICT, it was found that on average each vessel needs 4.5 hours for loading and unloading, with capacity ranging from 827 Tons to a maximum of 2,425 Tons. Among the imported and exported goods, the common types of goods were cloths, cosmetics, engine, auto-parts, steel, cotton, jewelers, garments items, etc. (Table 4.14).
Table 4.14: Service Details in the Pangaon Internal Container Terminal
Code Loading/Unloading
Time (hours) Capacity (Tons) Types of Goods A 4.30 1,654 Cloths, cosmetics, engine, auto-parts, etc. B 4.30 1,764 Steel coil, cloths etc. C 4 1,874 Aid, cotton, auto-parts etc. D 4 827 Garments E 5 1,984 Cotton, auto-parts etc. F 5 2,205 Garments G 5 2,425 Jewelers, cosmetics, toys, clothes etc.
Source: JICA Study Team
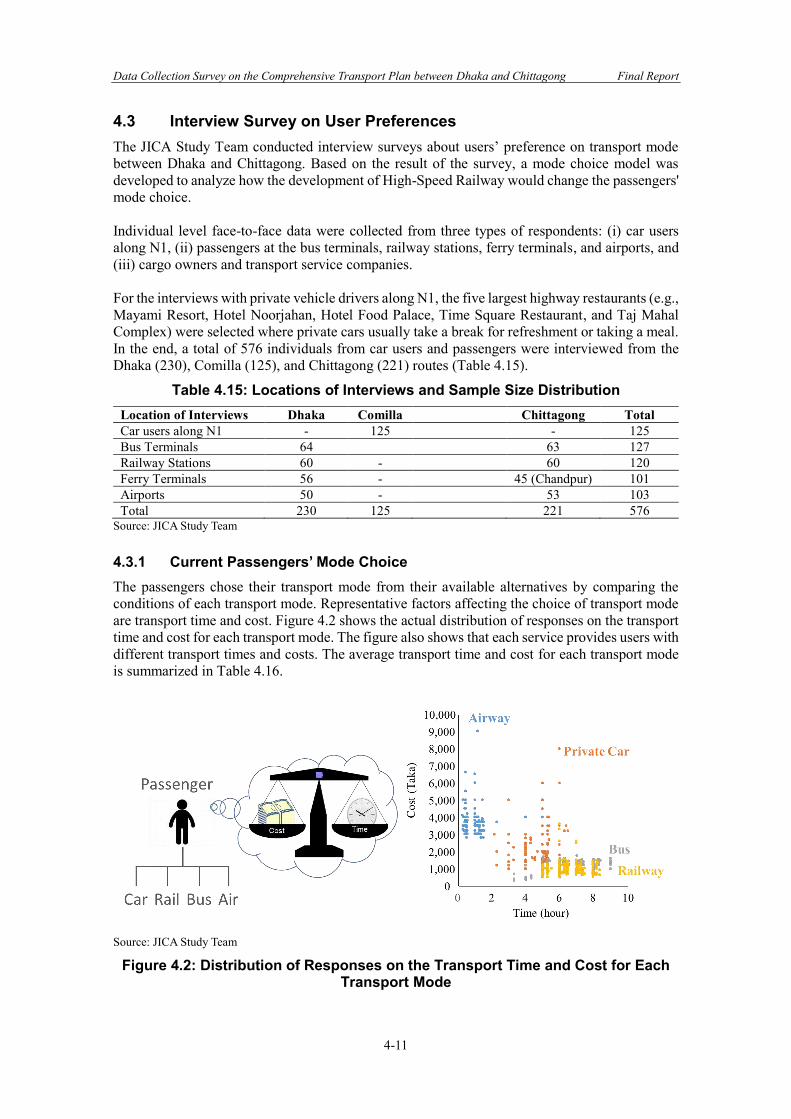
Data Collection Survey on the Comprehensive Transport Plan between Dhaka and Chittagong Final Report
4-11
4.3 Interview Survey on User Preferences The JICA Study Team conducted interview surveys about users’ preference on transport mode between Dhaka and Chittagong. Based on the result of the survey, a mode choice model was developed to analyze how the development of High-Speed Railway would change the passengers' mode choice. Individual level face-to-face data were collected from three types of respondents: (i) car users along N1, (ii) passengers at the bus terminals, railway stations, ferry terminals, and airports, and (iii) cargo owners and transport service companies. For the interviews with private vehicle drivers along N1, the five largest highway restaurants (e.g., Mayami Resort, Hotel Noorjahan, Hotel Food Palace, Time Square Restaurant, and Taj Mahal Complex) were selected where private cars usually take a break for refreshment or taking a meal. In the end, a total of 576 individuals from car users and passengers were interviewed from the Dhaka (230), Comilla (125), and Chittagong (221) routes (Table 4.15).
Table 4.15: Locations of Interviews and Sample Size Distribution Location of Interviews Dhaka Comilla Chittagong Total Car users along N1 - 125 - 125 Bus Terminals 64 63 127 Railway Stations 60 - 60 120 Ferry Terminals 56 - 45 (Chandpur) 101 Airports 50 - 53 103 Total 230 125 221 576
Source: JICA Study Team 4.3.1 Current Passengers’ Mode Choice The passengers chose their transport mode from their available alternatives by comparing the conditions of each transport mode. Representative factors affecting the choice of transport mode are transport time and cost. Figure 4.2 shows the actual distribution of responses on the transport time and cost for each transport mode. The figure also shows that each service provides users with different transport times and costs. The average transport time and cost for each transport mode is summarized in Table 4.16.
Source: JICA Study Team
Figure 4.2: Distribution of Responses on the Transport Time and Cost for Each Transport Mode
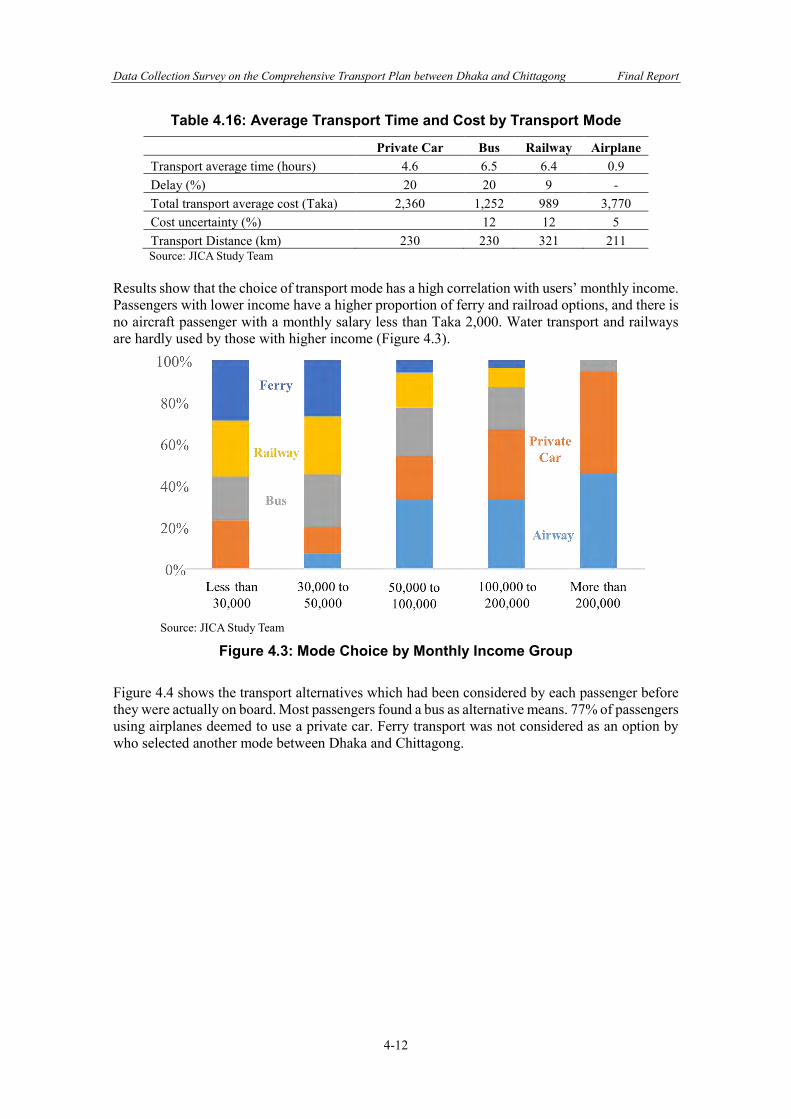
Data Collection Survey on the Comprehensive Transport Plan between Dhaka and Chittagong Final Report
4-12
Table 4.16: Average Transport Time and Cost by Transport Mode
Private Car Bus Railway Airplane Transport average time (hours) 4.6 6.5 6.4 0.9 Delay (%) 20 20 9 - Total transport average cost (Taka) 2,360 1,252 989 3,770 Cost uncertainty (%) 12 12 5 Transport Distance (km) 230 230 321 211 Source: JICA Study Team
Results show that the choice of transport mode has a high correlation with users’ monthly income. Passengers with lower income have a higher proportion of ferry and railroad options, and there is no aircraft passenger with a monthly salary less than Taka 2,000. Water transport and railways are hardly used by those with higher income (Figure 4.3).
Source: JICA Study Team
Figure 4.3: Mode Choice by Monthly Income Group Figure 4.4 shows the transport alternatives which had been considered by each passenger before they were actually on board. Most passengers found a bus as alternative means. 77% of passengers using airplanes deemed to use a private car. Ferry transport was not considered as an option by who selected another mode between Dhaka and Chittagong.
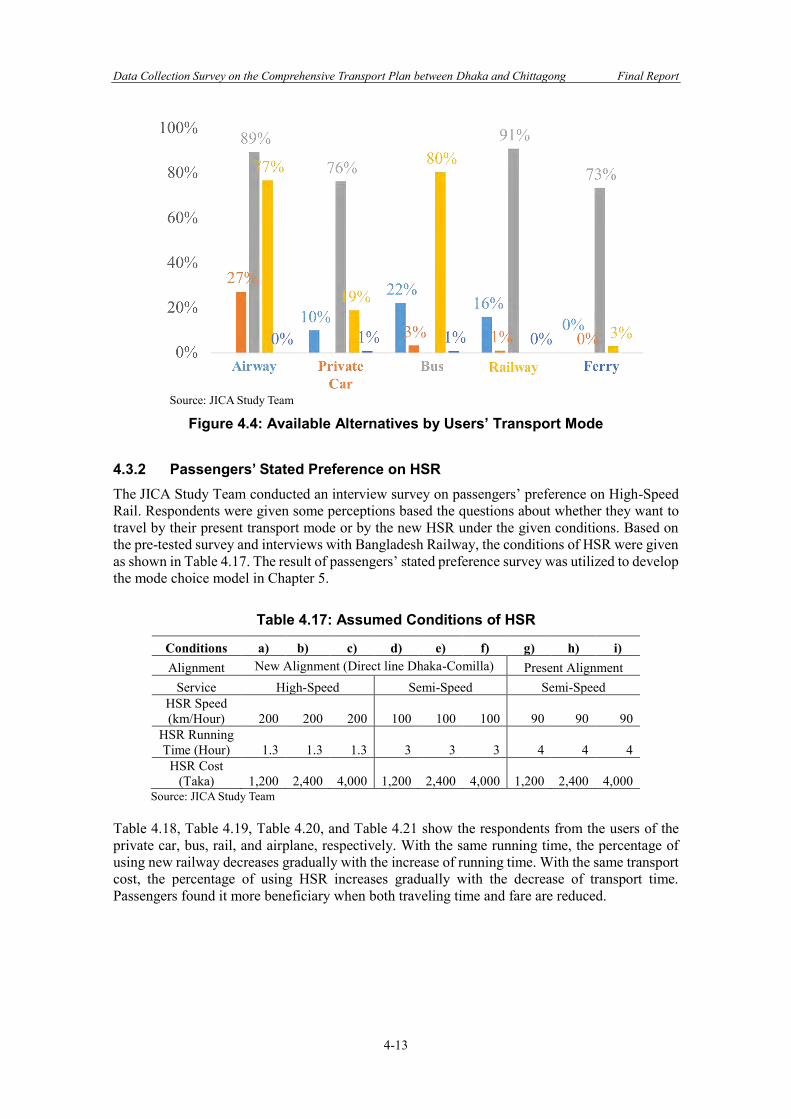
Data Collection Survey on the Comprehensive Transport Plan between Dhaka and Chittagong Final Report
4-13
Source: JICA Study Team
Figure 4.4: Available Alternatives by Users’ Transport Mode 4.3.2 Passengers’ Stated Preference on HSR The JICA Study Team conducted an interview survey on passengers’ preference on High-Speed Rail. Respondents were given some perceptions based the questions about whether they want to travel by their present transport mode or by the new HSR under the given conditions. Based on the pre-tested survey and interviews with Bangladesh Railway, the conditions of HSR were given as shown in Table 4.17. The result of passengers’ stated preference survey was utilized to develop the mode choice model in Chapter 5.
Table 4.17: Assumed Conditions of HSR
Conditions a) b) c) d) e) f) g) h) i) Alignment New Alignment (Direct line Dhaka-Comilla) Present Alignment
Service High-Speed Semi-Speed Semi-Speed HSR Speed (km/Hour) 200 200 200 100 100 100 90 90 90
HSR Running Time (Hour) 1.3 1.3 1.3 3 3 3 4 4 4
HSR Cost (Taka) 1,200 2,400 4,000 1,200 2,400 4,000 1,200 2,400 4,000
Source: JICA Study Team Table 4.18, Table 4.19, Table 4.20, and Table 4.21 show the respondents from the users of the private car, bus, rail, and airplane, respectively. With the same running time, the percentage of using new railway decreases gradually with the increase of running time. With the same transport cost, the percentage of using HSR increases gradually with the decrease of transport time. Passengers found it more beneficiary when both traveling time and fare are reduced.
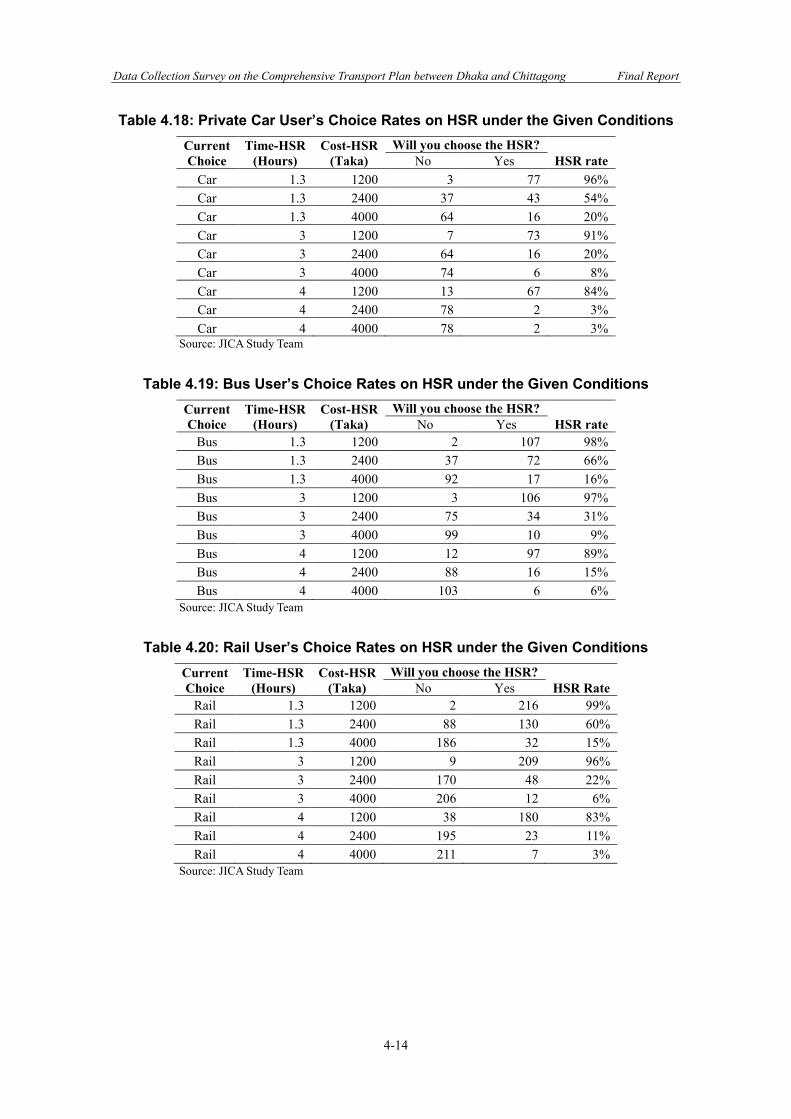
Data Collection Survey on the Comprehensive Transport Plan between Dhaka and Chittagong Final Report
4-14
Table 4.18: Private Car User’s Choice Rates on HSR under the Given Conditions Current Choice
Time-HSR (Hours)
Cost-HSR (Taka)
Will you choose the HSR? HSR rate No Yes
Car 1.3 1200 3 77 96% Car 1.3 2400 37 43 54% Car 1.3 4000 64 16 20% Car 3 1200 7 73 91% Car 3 2400 64 16 20% Car 3 4000 74 6 8% Car 4 1200 13 67 84% Car 4 2400 78 2 3% Car 4 4000 78 2 3%
Source: JICA Study Team
Table 4.19: Bus User’s Choice Rates on HSR under the Given Conditions Current Choice
Time-HSR (Hours)
Cost-HSR (Taka)
Will you choose the HSR? HSR rate No Yes
Bus 1.3 1200 2 107 98% Bus 1.3 2400 37 72 66% Bus 1.3 4000 92 17 16% Bus 3 1200 3 106 97% Bus 3 2400 75 34 31% Bus 3 4000 99 10 9% Bus 4 1200 12 97 89% Bus 4 2400 88 16 15% Bus 4 4000 103 6 6%
Source: JICA Study Team
Table 4.20: Rail User’s Choice Rates on HSR under the Given Conditions Current Choice
Time-HSR (Hours)
Cost-HSR (Taka)
Will you choose the HSR? HSR Rate No Yes
Rail 1.3 1200 2 216 99% Rail 1.3 2400 88 130 60% Rail 1.3 4000 186 32 15% Rail 3 1200 9 209 96% Rail 3 2400 170 48 22% Rail 3 4000 206 12 6% Rail 4 1200 38 180 83% Rail 4 2400 195 23 11% Rail 4 4000 211 7 3%
Source: JICA Study Team
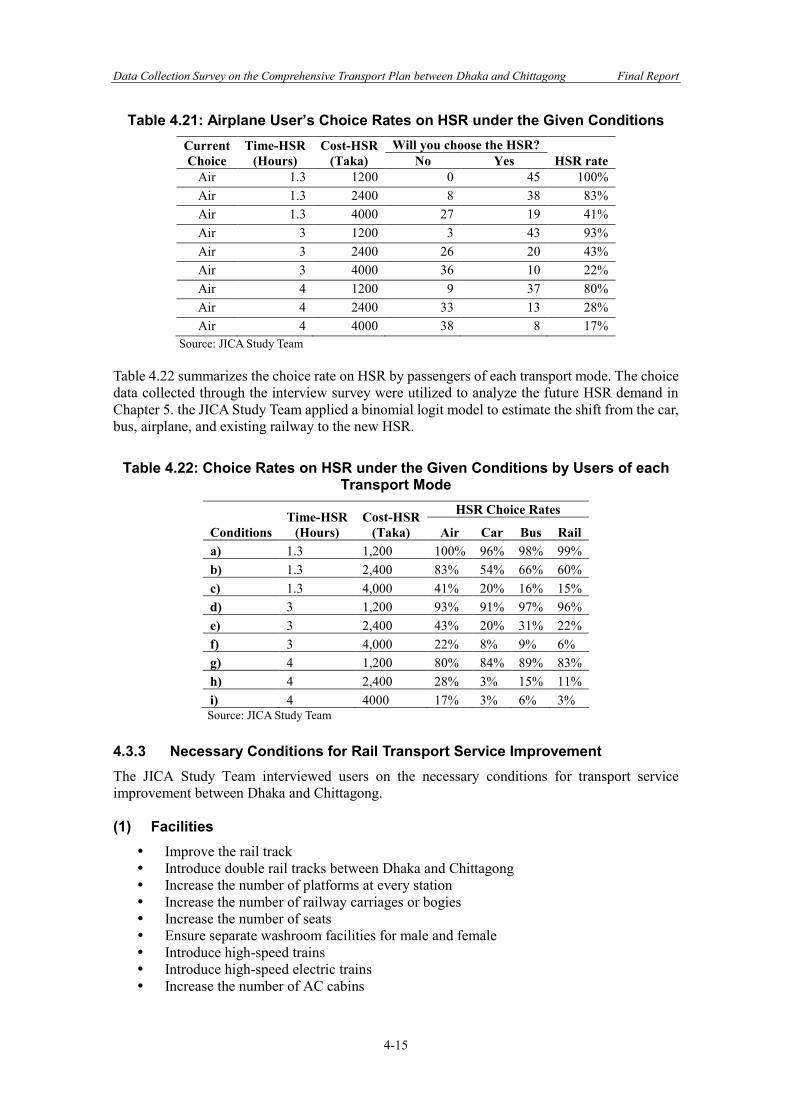
Data Collection Survey on the Comprehensive Transport Plan between Dhaka and Chittagong Final Report
4-15
Table 4.21: Airplane User’s Choice Rates on HSR under the Given Conditions Current Choice
Time-HSR (Hours)
Cost-HSR (Taka)
Will you choose the HSR? HSR rate No Yes
Air 1.3 1200 0 45 100% Air 1.3 2400 8 38 83% Air 1.3 4000 27 19 41% Air 3 1200 3 43 93% Air 3 2400 26 20 43% Air 3 4000 36 10 22% Air 4 1200 9 37 80% Air 4 2400 33 13 28% Air 4 4000 38 8 17%
Source: JICA Study Team Table 4.22 summarizes the choice rate on HSR by passengers of each transport mode. The choice data collected through the interview survey were utilized to analyze the future HSR demand in Chapter 5. the JICA Study Team applied a binomial logit model to estimate the shift from the car, bus, airplane, and existing railway to the new HSR.
Table 4.22: Choice Rates on HSR under the Given Conditions by Users of each Transport Mode
Conditions Time-HSR
(Hours) Cost-HSR
(Taka)
HSR Choice Rates
Air Car Bus Rail a) 1.3 1,200 100% 96% 98% 99% b) 1.3 2,400 83% 54% 66% 60% c) 1.3 4,000 41% 20% 16% 15% d) 3 1,200 93% 91% 97% 96% e) 3 2,400 43% 20% 31% 22% f) 3 4,000 22% 8% 9% 6% g) 4 1,200 80% 84% 89% 83% h) 4 2,400 28% 3% 15% 11% i) 4 4000 17% 3% 6% 3% Source: JICA Study Team
4.3.3 Necessary Conditions for Rail Transport Service Improvement The JICA Study Team interviewed users on the necessary conditions for transport service improvement between Dhaka and Chittagong. (1) Facilities
Improve the rail track Introduce double rail tracks between Dhaka and Chittagong Increase the number of platforms at every station Increase the number of railway carriages or bogies Increase the number of seats Ensure separate washroom facilities for male and female Introduce high-speed trains Introduce high-speed electric trains Increase the number of AC cabins
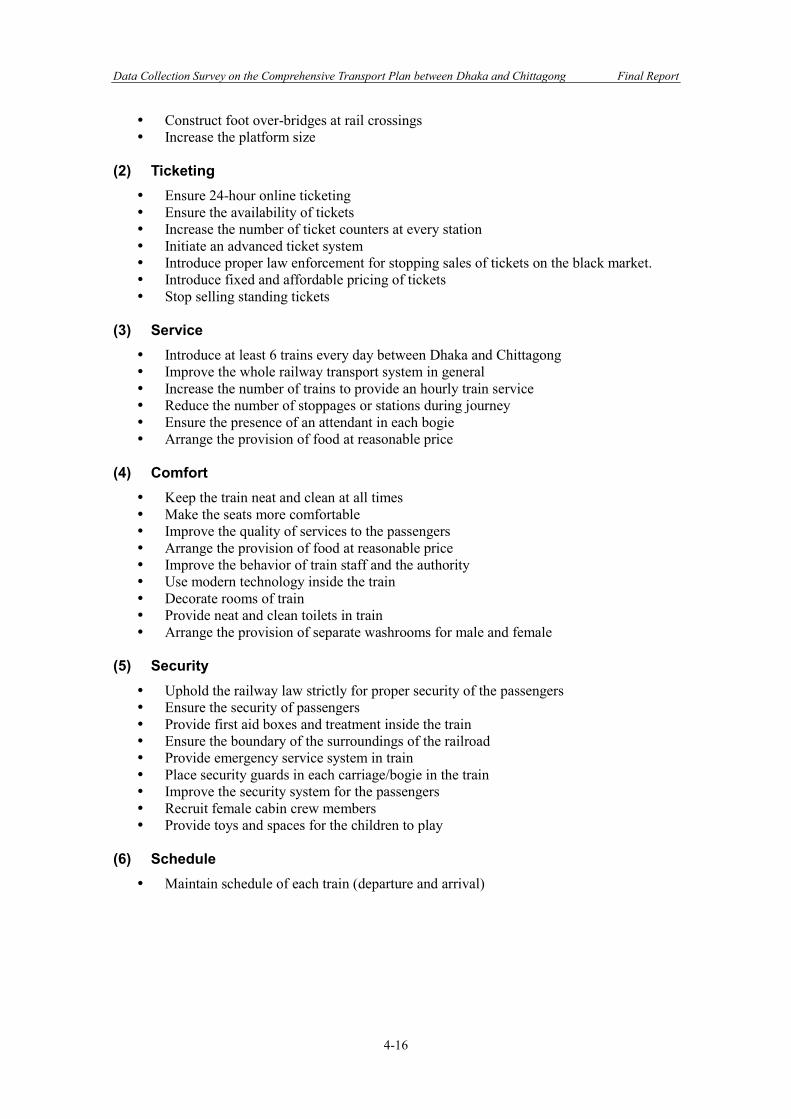
Data Collection Survey on the Comprehensive Transport Plan between Dhaka and Chittagong Final Report
4-16
Construct foot over-bridges at rail crossings Increase the platform size
(2) Ticketing
Ensure 24-hour online ticketing Ensure the availability of tickets Increase the number of ticket counters at every station Initiate an advanced ticket system Introduce proper law enforcement for stopping sales of tickets on the black market. Introduce fixed and affordable pricing of tickets Stop selling standing tickets
(3) Service
Introduce at least 6 trains every day between Dhaka and Chittagong Improve the whole railway transport system in general Increase the number of trains to provide an hourly train service Reduce the number of stoppages or stations during journey Ensure the presence of an attendant in each bogie Arrange the provision of food at reasonable price
(4) Comfort
Keep the train neat and clean at all times Make the seats more comfortable Improve the quality of services to the passengers Arrange the provision of food at reasonable price Improve the behavior of train staff and the authority Use modern technology inside the train Decorate rooms of train Provide neat and clean toilets in train Arrange the provision of separate washrooms for male and female
(5) Security Uphold the railway law strictly for proper security of the passengers Ensure the security of passengers Provide first aid boxes and treatment inside the train Ensure the boundary of the surroundings of the railroad Provide emergency service system in train Place security guards in each carriage/bogie in the train Improve the security system for the passengers Recruit female cabin crew members Provide toys and spaces for the children to play
(6) Schedule
Maintain schedule of each train (departure and arrival)
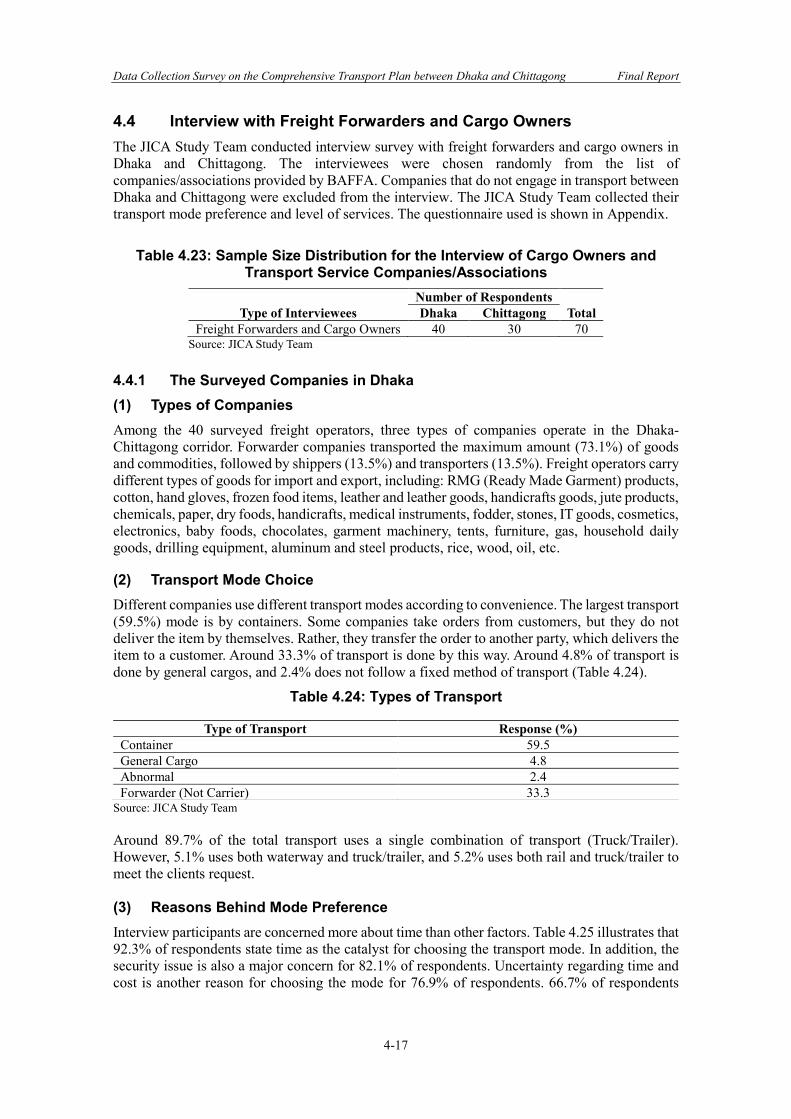
Data Collection Survey on the Comprehensive Transport Plan between Dhaka and Chittagong Final Report
4-17
4.4 Interview with Freight Forwarders and Cargo Owners The JICA Study Team conducted interview survey with freight forwarders and cargo owners in Dhaka and Chittagong. The interviewees were chosen randomly from the list of companies/associations provided by BAFFA. Companies that do not engage in transport between Dhaka and Chittagong were excluded from the interview. The JICA Study Team collected their transport mode preference and level of services. The questionnaire used is shown in Appendix.
Table 4.23: Sample Size Distribution for the Interview of Cargo Owners and Transport Service Companies/Associations
Type of Interviewees Number of Respondents
Total Dhaka Chittagong Freight Forwarders and Cargo Owners 40 30 70
Source: JICA Study Team 4.4.1 The Surveyed Companies in Dhaka (1) Types of Companies Among the 40 surveyed freight operators, three types of companies operate in the Dhaka-Chittagong corridor. Forwarder companies transported the maximum amount (73.1%) of goods and commodities, followed by shippers (13.5%) and transporters (13.5%). Freight operators carry different types of goods for import and export, including: RMG (Ready Made Garment) products, cotton, hand gloves, frozen food items, leather and leather goods, handicrafts goods, jute products, chemicals, paper, dry foods, handicrafts, medical instruments, fodder, stones, IT goods, cosmetics, electronics, baby foods, chocolates, garment machinery, tents, furniture, gas, household daily goods, drilling equipment, aluminum and steel products, rice, wood, oil, etc. (2) Transport Mode Choice Different companies use different transport modes according to convenience. The largest transport (59.5%) mode is by containers. Some companies take orders from customers, but they do not deliver the item by themselves. Rather, they transfer the order to another party, which delivers the item to a customer. Around 33.3% of transport is done by this way. Around 4.8% of transport is done by general cargos, and 2.4% does not follow a fixed method of transport (Table 4.24).
Table 4.24: Types of Transport
Source: JICA Study Team Around 89.7% of the total transport uses a single combination of transport (Truck/Trailer). However, 5.1% uses both waterway and truck/trailer, and 5.2% uses both rail and truck/trailer to meet the clients request. (3) Reasons Behind Mode Preference Interview participants are concerned more about time than other factors. Table 4.25 illustrates that 92.3% of respondents state time as the catalyst for choosing the transport mode. In addition, the security issue is also a major concern for 82.1% of respondents. Uncertainty regarding time and cost is another reason for choosing the mode for 76.9% of respondents. 66.7% of respondents
Type of Transport Response (%) Container 59.5 General Cargo 4.8 Abnormal 2.4 Forwarder (Not Carrier) 33.3
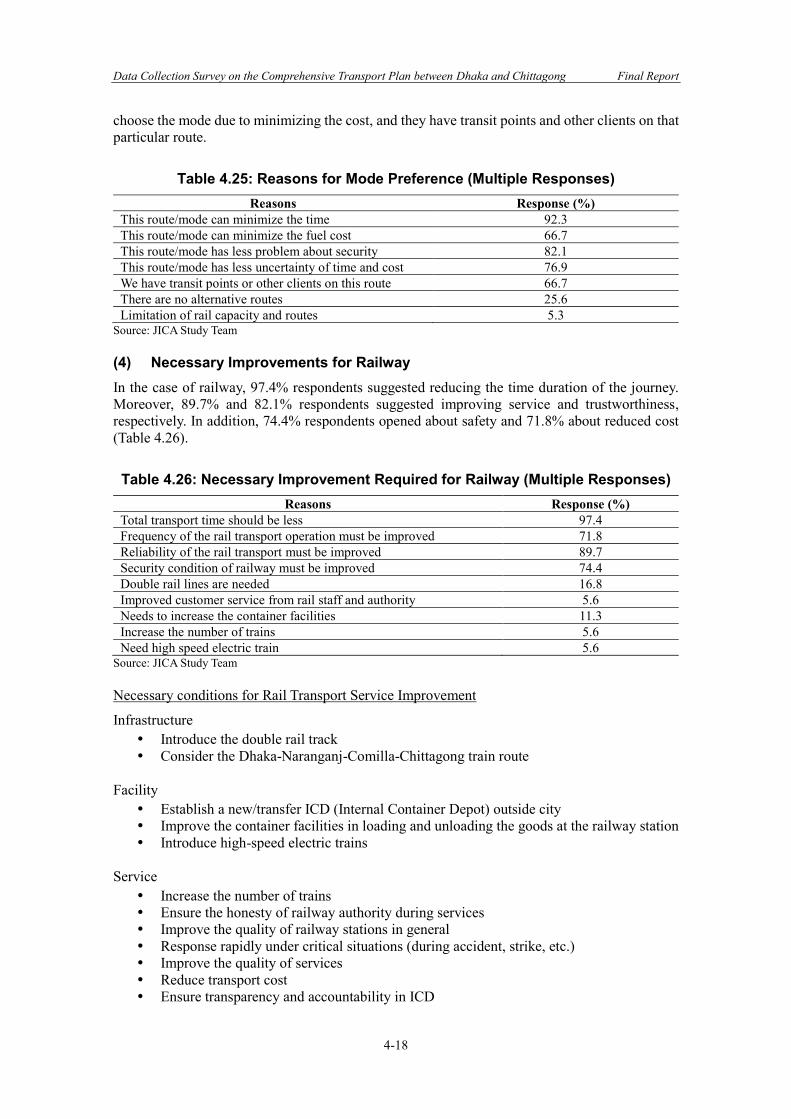
Data Collection Survey on the Comprehensive Transport Plan between Dhaka and Chittagong Final Report
4-18
choose the mode due to minimizing the cost, and they have transit points and other clients on that particular route.
Table 4.25: Reasons for Mode Preference (Multiple Responses) Reasons Response (%)
This route/mode can minimize the time 92.3 This route/mode can minimize the fuel cost 66.7 This route/mode has less problem about security 82.1 This route/mode has less uncertainty of time and cost 76.9 We have transit points or other clients on this route 66.7 There are no alternative routes 25.6 Limitation of rail capacity and routes 5.3
Source: JICA Study Team (4) Necessary Improvements for Railway In the case of railway, 97.4% respondents suggested reducing the time duration of the journey. Moreover, 89.7% and 82.1% respondents suggested improving service and trustworthiness, respectively. In addition, 74.4% respondents opened about safety and 71.8% about reduced cost (Table 4.26).
Table 4.26: Necessary Improvement Required for Railway (Multiple Responses) Reasons Response (%)
Total transport time should be less 97.4 Frequency of the rail transport operation must be improved 71.8 Reliability of the rail transport must be improved 89.7 Security condition of railway must be improved 74.4 Double rail lines are needed 16.8 Improved customer service from rail staff and authority 5.6 Needs to increase the container facilities 11.3 Increase the number of trains 5.6 Need high speed electric train 5.6
Source: JICA Study Team Necessary conditions for Rail Transport Service Improvement
Infrastructure Introduce the double rail track Consider the Dhaka-Naranganj-Comilla-Chittagong train route
Facility Establish a new/transfer ICD (Internal Container Depot) outside city Improve the container facilities in loading and unloading the goods at the railway station Introduce high-speed electric trains
Service
Increase the number of trains Ensure the honesty of railway authority during services Improve the quality of railway stations in general Response rapidly under critical situations (during accident, strike, etc.) Improve the quality of services Reduce transport cost Ensure transparency and accountability in ICD
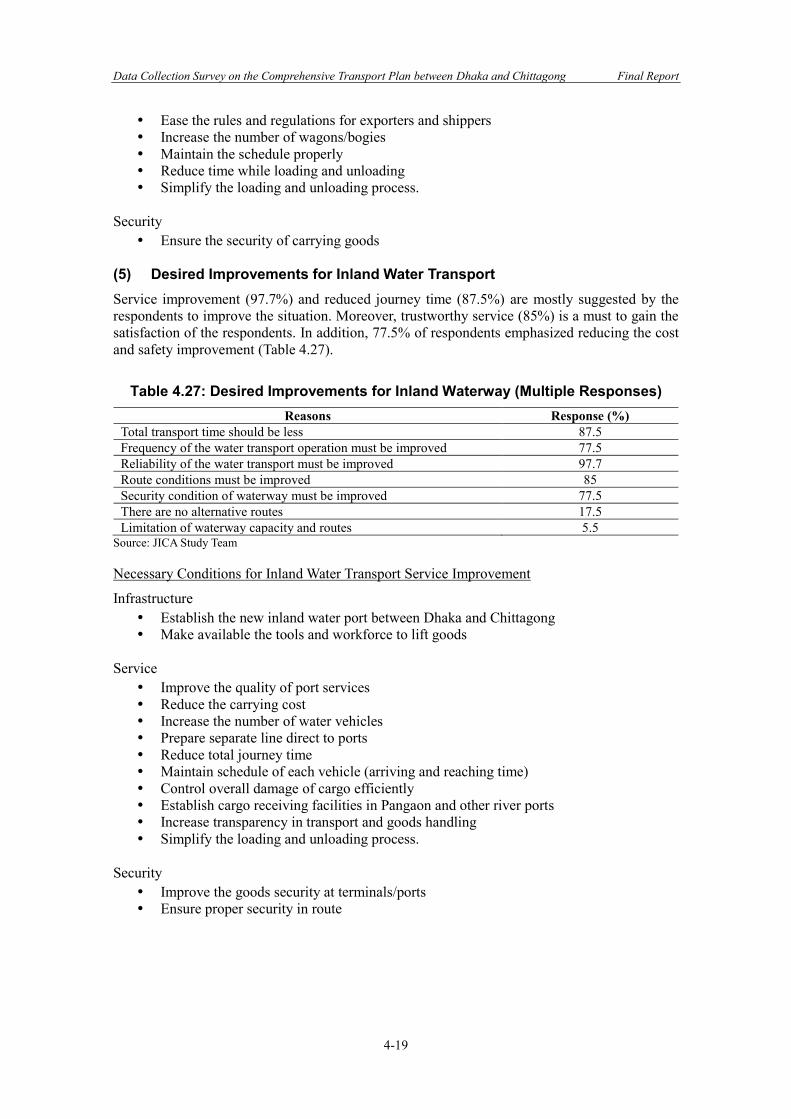
Data Collection Survey on the Comprehensive Transport Plan between Dhaka and Chittagong Final Report
4-19
Ease the rules and regulations for exporters and shippers Increase the number of wagons/bogies Maintain the schedule properly Reduce time while loading and unloading Simplify the loading and unloading process.
Security
Ensure the security of carrying goods (5) Desired Improvements for Inland Water Transport Service improvement (97.7%) and reduced journey time (87.5%) are mostly suggested by the respondents to improve the situation. Moreover, trustworthy service (85%) is a must to gain the satisfaction of the respondents. In addition, 77.5% of respondents emphasized reducing the cost and safety improvement (Table 4.27).
Table 4.27: Desired Improvements for Inland Waterway (Multiple Responses) Reasons Response (%)
Total transport time should be less 87.5 Frequency of the water transport operation must be improved 77.5 Reliability of the water transport must be improved 97.7 Route conditions must be improved 85 Security condition of waterway must be improved 77.5 There are no alternative routes 17.5 Limitation of waterway capacity and routes 5.5
Source: JICA Study Team
Necessary Conditions for Inland Water Transport Service Improvement
Infrastructure Establish the new inland water port between Dhaka and Chittagong Make available the tools and workforce to lift goods
Service
Improve the quality of port services Reduce the carrying cost Increase the number of water vehicles Prepare separate line direct to ports Reduce total journey time Maintain schedule of each vehicle (arriving and reaching time) Control overall damage of cargo efficiently Establish cargo receiving facilities in Pangaon and other river ports Increase transparency in transport and goods handling Simplify the loading and unloading process.
Security
Improve the goods security at terminals/ports Ensure proper security in route
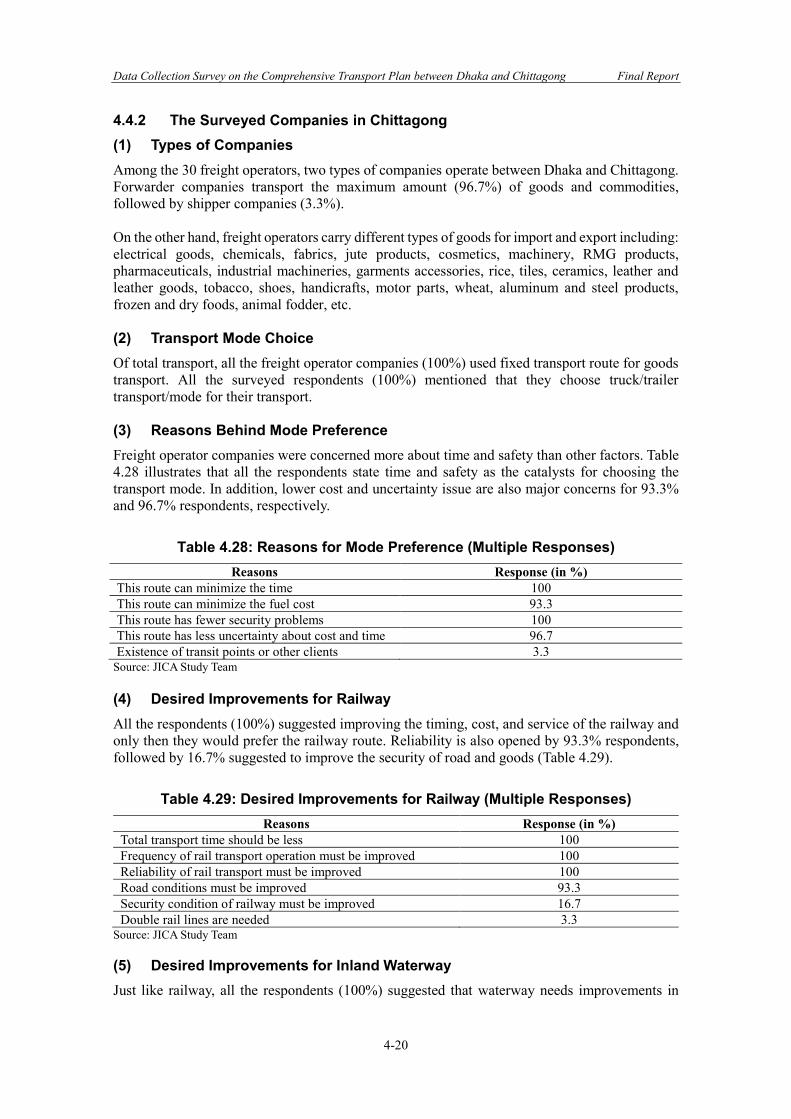
Data Collection Survey on the Comprehensive Transport Plan between Dhaka and Chittagong Final Report
4-20
4.4.2 The Surveyed Companies in Chittagong (1) Types of Companies Among the 30 freight operators, two types of companies operate between Dhaka and Chittagong. Forwarder companies transport the maximum amount (96.7%) of goods and commodities, followed by shipper companies (3.3%). On the other hand, freight operators carry different types of goods for import and export including: electrical goods, chemicals, fabrics, jute products, cosmetics, machinery, RMG products, pharmaceuticals, industrial machineries, garments accessories, rice, tiles, ceramics, leather and leather goods, tobacco, shoes, handicrafts, motor parts, wheat, aluminum and steel products, frozen and dry foods, animal fodder, etc. (2) Transport Mode Choice Of total transport, all the freight operator companies (100%) used fixed transport route for goods transport. All the surveyed respondents (100%) mentioned that they choose truck/trailer transport/mode for their transport. (3) Reasons Behind Mode Preference Freight operator companies were concerned more about time and safety than other factors. Table 4.28 illustrates that all the respondents state time and safety as the catalysts for choosing the transport mode. In addition, lower cost and uncertainty issue are also major concerns for 93.3% and 96.7% respondents, respectively.
Table 4.28: Reasons for Mode Preference (Multiple Responses) Reasons Response (in %)
This route can minimize the time 100 This route can minimize the fuel cost 93.3 This route has fewer security problems 100 This route has less uncertainty about cost and time 96.7 Existence of transit points or other clients 3.3
Source: JICA Study Team (4) Desired Improvements for Railway All the respondents (100%) suggested improving the timing, cost, and service of the railway and only then they would prefer the railway route. Reliability is also opened by 93.3% respondents, followed by 16.7% suggested to improve the security of road and goods (Table 4.29).
Table 4.29: Desired Improvements for Railway (Multiple Responses) Reasons Response (in %)
Total transport time should be less 100 Frequency of rail transport operation must be improved 100 Reliability of rail transport must be improved 100 Road conditions must be improved 93.3 Security condition of railway must be improved 16.7 Double rail lines are needed 3.3
Source: JICA Study Team
(5) Desired Improvements for Inland Waterway Just like railway, all the respondents (100%) suggested that waterway needs improvements in
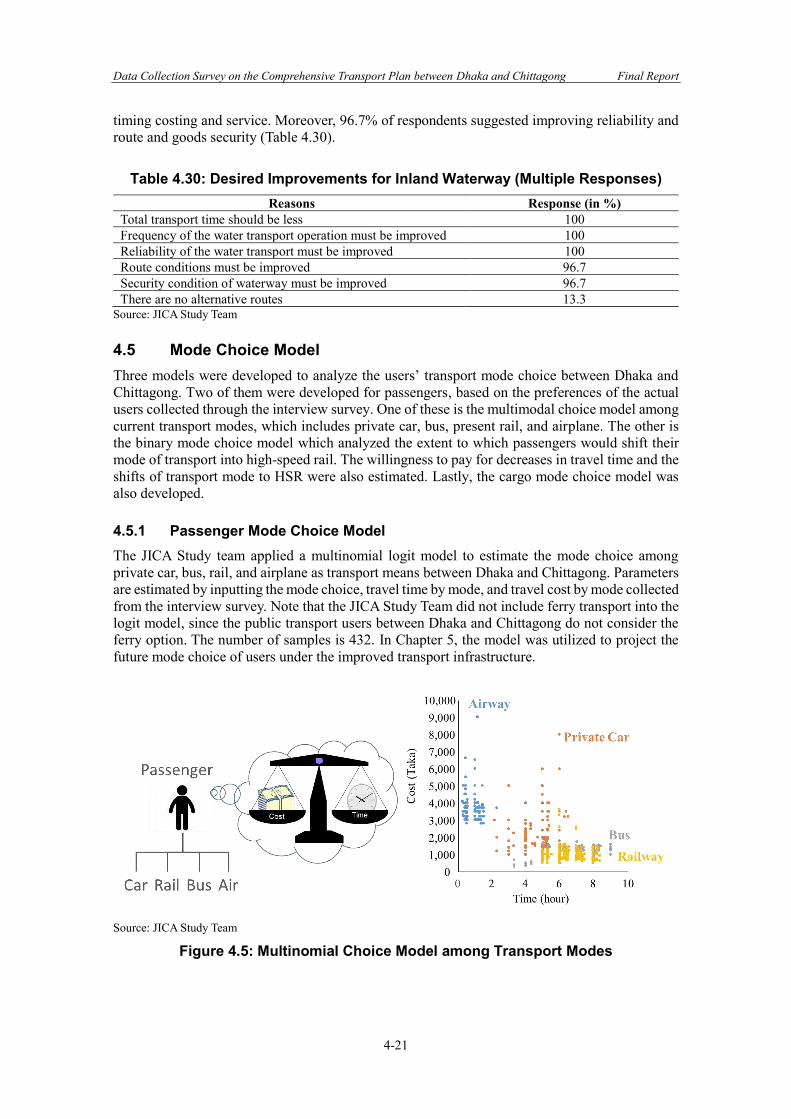
Data Collection Survey on the Comprehensive Transport Plan between Dhaka and Chittagong Final Report
4-21
timing costing and service. Moreover, 96.7% of respondents suggested improving reliability and route and goods security (Table 4.30).
Table 4.30: Desired Improvements for Inland Waterway (Multiple Responses) Reasons Response (in %)
Total transport time should be less 100 Frequency of the water transport operation must be improved 100 Reliability of the water transport must be improved 100 Route conditions must be improved 96.7 Security condition of waterway must be improved 96.7 There are no alternative routes 13.3
Source: JICA Study Team
4.5 Mode Choice Model Three models were developed to analyze the users’ transport mode choice between Dhaka and Chittagong. Two of them were developed for passengers, based on the preferences of the actual users collected through the interview survey. One of these is the multimodal choice model among current transport modes, which includes private car, bus, present rail, and airplane. The other is the binary mode choice model which analyzed the extent to which passengers would shift their mode of transport into high-speed rail. The willingness to pay for decreases in travel time and the shifts of transport mode to HSR were also estimated. Lastly, the cargo mode choice model was also developed. 4.5.1 Passenger Mode Choice Model The JICA Study team applied a multinomial logit model to estimate the mode choice among private car, bus, rail, and airplane as transport means between Dhaka and Chittagong. Parameters are estimated by inputting the mode choice, travel time by mode, and travel cost by mode collected from the interview survey. Note that the JICA Study Team did not include ferry transport into the logit model, since the public transport users between Dhaka and Chittagong do not consider the ferry option. The number of samples is 432. In Chapter 5, the model was utilized to project the future mode choice of users under the improved transport infrastructure.
Source: JICA Study Team
Figure 4.5: Multinomial Choice Model among Transport Modes
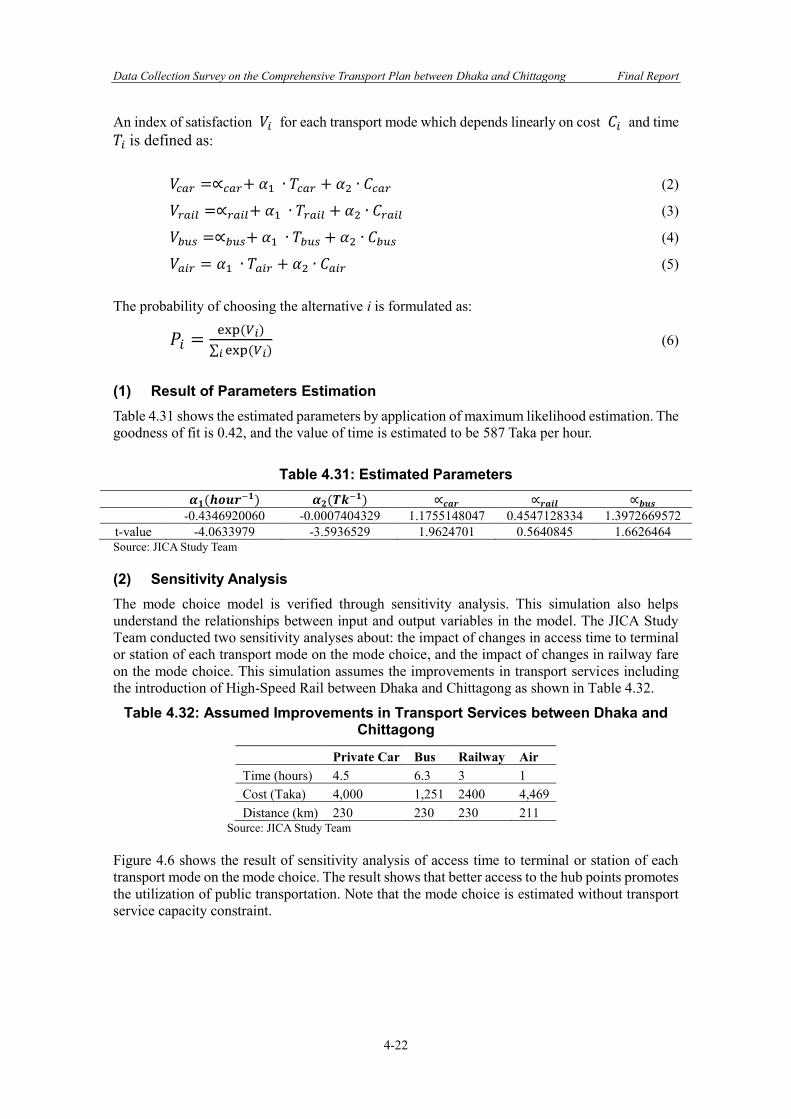
Data Collection Survey on the Comprehensive Transport Plan between Dhaka and Chittagong Final Report
4-22
An index of satisfaction 𝑉𝑖 for each transport mode which depends linearly on cost 𝐶𝑖 and time 𝑇𝑖 is defined as:
𝑉𝑐𝑎𝑟 =∝𝑐𝑎𝑟+ 𝛼1 ∙ 𝑇𝑐𝑎𝑟 + 𝛼2 ∙ 𝐶𝑐𝑎𝑟 (2)
𝑉𝑟𝑎𝑖𝑙 =∝𝑟𝑎𝑖𝑙+ 𝛼1 ∙ 𝑇𝑟𝑎𝑖𝑙 + 𝛼2 ∙ 𝐶𝑟𝑎𝑖𝑙 (3)
𝑉𝑏𝑢𝑠 =∝𝑏𝑢𝑠+ 𝛼1 ∙ 𝑇𝑏𝑢𝑠 + 𝛼2 ∙ 𝐶𝑏𝑢𝑠 (4)
𝑉𝑎𝑖𝑟 = 𝛼1 ∙ 𝑇𝑎𝑖𝑟 + 𝛼2 ∙ 𝐶𝑎𝑖𝑟 (5) The probability of choosing the alternative i is formulated as:
𝑃𝑖 =exp (𝑉𝑖)
∑ exp (𝑉𝑖)𝑖 (6)
(1) Result of Parameters Estimation Table 4.31 shows the estimated parameters by application of maximum likelihood estimation. The goodness of fit is 0.42, and the value of time is estimated to be 587 Taka per hour.
Table 4.31: Estimated Parameters 𝜶𝟏(𝒉𝒐𝒖𝒓−𝟏) 𝜶𝟐(𝑻𝒌−𝟏) ∝𝒄𝒂𝒓 ∝𝒓𝒂𝒊𝒍 ∝𝒃𝒖𝒔 -0.4346920060 -0.0007404329 1.1755148047 0.4547128334 1.3972669572
t-value -4.0633979 -3.5936529 1.9624701 0.5640845 1.6626464 Source: JICA Study Team (2) Sensitivity Analysis The mode choice model is verified through sensitivity analysis. This simulation also helps understand the relationships between input and output variables in the model. The JICA Study Team conducted two sensitivity analyses about: the impact of changes in access time to terminal or station of each transport mode on the mode choice, and the impact of changes in railway fare on the mode choice. This simulation assumes the improvements in transport services including the introduction of High-Speed Rail between Dhaka and Chittagong as shown in Table 4.32.
Table 4.32: Assumed Improvements in Transport Services between Dhaka and Chittagong
Private Car Bus Railway Air Time (hours) 4.5 6.3 3 1 Cost (Taka) 4,000 1,251 2400 4,469 Distance (km) 230 230 230 211
Source: JICA Study Team Figure 4.6 shows the result of sensitivity analysis of access time to terminal or station of each transport mode on the mode choice. The result shows that better access to the hub points promotes the utilization of public transportation. Note that the mode choice is estimated without transport service capacity constraint.
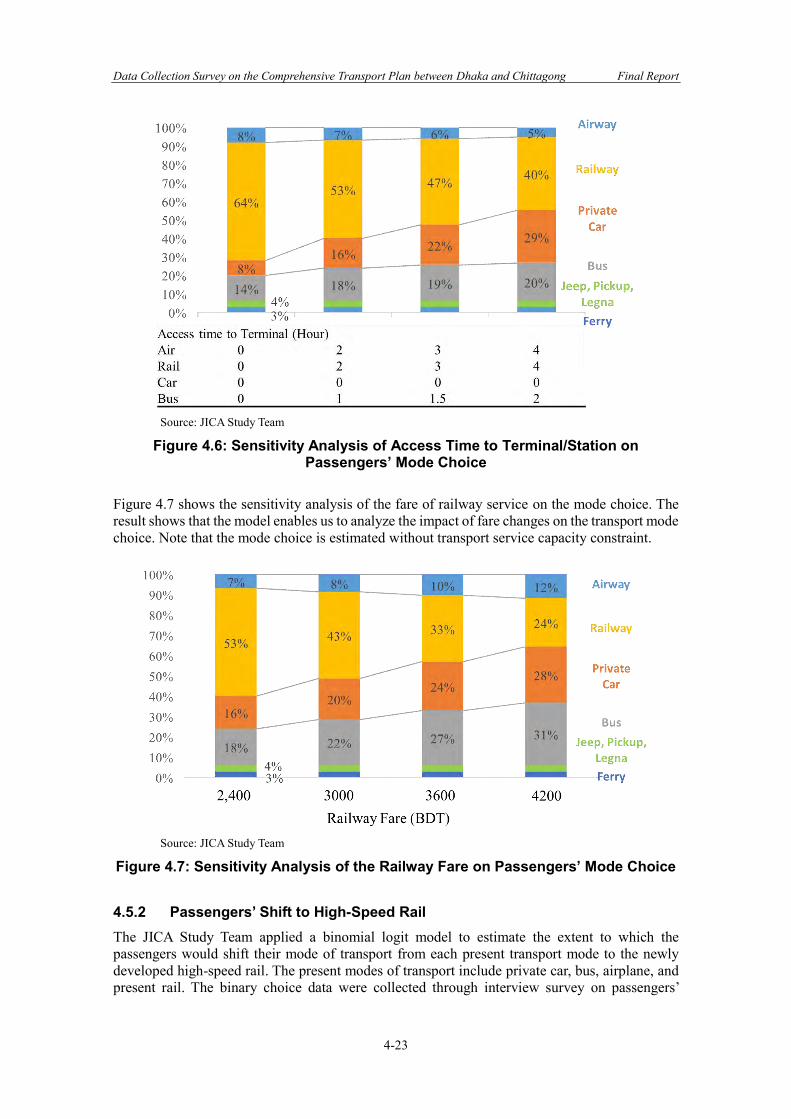
Data Collection Survey on the Comprehensive Transport Plan between Dhaka and Chittagong Final Report
4-23
Source: JICA Study Team
Figure 4.6: Sensitivity Analysis of Access Time to Terminal/Station on Passengers’ Mode Choice
Figure 4.7 shows the sensitivity analysis of the fare of railway service on the mode choice. The result shows that the model enables us to analyze the impact of fare changes on the transport mode choice. Note that the mode choice is estimated without transport service capacity constraint.
Source: JICA Study Team
Figure 4.7: Sensitivity Analysis of the Railway Fare on Passengers’ Mode Choice 4.5.2 Passengers’ Shift to High-Speed Rail The JICA Study Team applied a binomial logit model to estimate the extent to which the passengers would shift their mode of transport from each present transport mode to the newly developed high-speed rail. The present modes of transport include private car, bus, airplane, and present rail. The binary choice data were collected through interview survey on passengers’
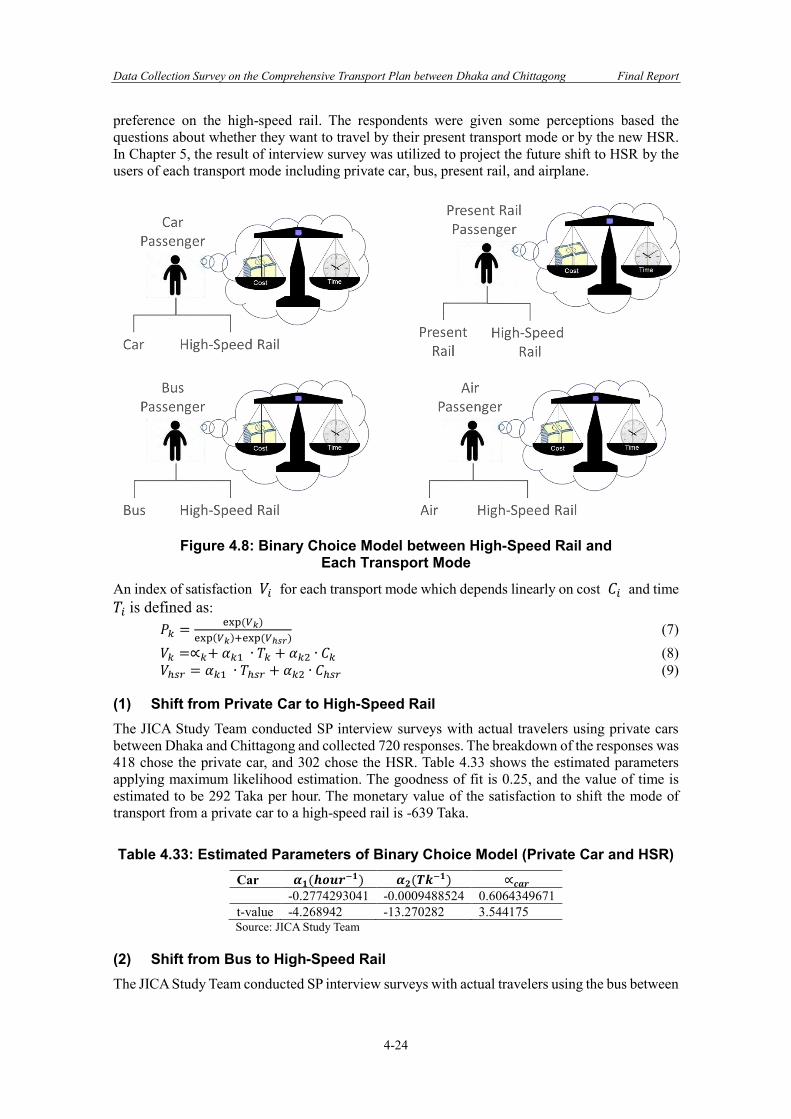
Data Collection Survey on the Comprehensive Transport Plan between Dhaka and Chittagong Final Report
4-24
preference on the high-speed rail. The respondents were given some perceptions based the questions about whether they want to travel by their present transport mode or by the new HSR. In Chapter 5, the result of interview survey was utilized to project the future shift to HSR by the users of each transport mode including private car, bus, present rail, and airplane.
Figure 4.8: Binary Choice Model between High-Speed Rail and
Each Transport Mode An index of satisfaction 𝑉𝑖 for each transport mode which depends linearly on cost 𝐶𝑖 and time 𝑇𝑖 is defined as:
𝑃𝑘 =exp (𝑉𝑘)
exp(𝑉𝑘)+exp (𝑉ℎ𝑠𝑟) (7)
𝑉𝑘 =∝𝑘+ 𝛼𝑘1 ∙ 𝑇𝑘 + 𝛼𝑘2 ∙ 𝐶𝑘 (8) 𝑉ℎ𝑠𝑟 = 𝛼𝑘1 ∙ 𝑇ℎ𝑠𝑟 + 𝛼𝑘2 ∙ 𝐶ℎ𝑠𝑟 (9)
(1) Shift from Private Car to High-Speed Rail The JICA Study Team conducted SP interview surveys with actual travelers using private cars between Dhaka and Chittagong and collected 720 responses. The breakdown of the responses was 418 chose the private car, and 302 chose the HSR. Table 4.33 shows the estimated parameters applying maximum likelihood estimation. The goodness of fit is 0.25, and the value of time is estimated to be 292 Taka per hour. The monetary value of the satisfaction to shift the mode of transport from a private car to a high-speed rail is -639 Taka.
Table 4.33: Estimated Parameters of Binary Choice Model (Private Car and HSR) Car 𝜶𝟏(𝒉𝒐𝒖𝒓−𝟏) 𝜶𝟐(𝑻𝒌−𝟏) ∝𝒄𝒂𝒓 -0.2774293041 -0.0009488524 0.6064349671 t-value -4.268942 -13.270282 3.544175 Source: JICA Study Team
(2) Shift from Bus to High-Speed Rail The JICA Study Team conducted SP interview surveys with actual travelers using the bus between
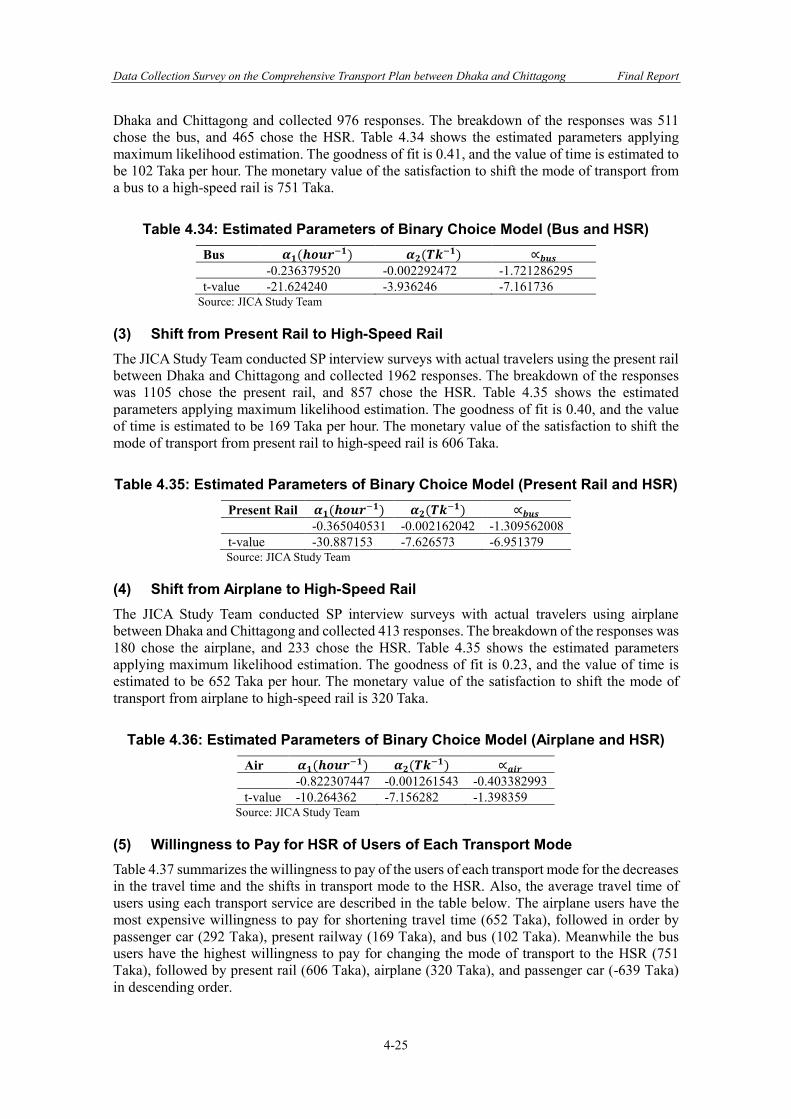
Data Collection Survey on the Comprehensive Transport Plan between Dhaka and Chittagong Final Report
4-25
Dhaka and Chittagong and collected 976 responses. The breakdown of the responses was 511 chose the bus, and 465 chose the HSR. Table 4.34 shows the estimated parameters applying maximum likelihood estimation. The goodness of fit is 0.41, and the value of time is estimated to be 102 Taka per hour. The monetary value of the satisfaction to shift the mode of transport from a bus to a high-speed rail is 751 Taka.
Table 4.34: Estimated Parameters of Binary Choice Model (Bus and HSR) Bus 𝜶𝟏(𝒉𝒐𝒖𝒓−𝟏) 𝜶𝟐(𝑻𝒌−𝟏) ∝𝒃𝒖𝒔 -0.236379520 -0.002292472 -1.721286295 t-value -21.624240 -3.936246 -7.161736
Source: JICA Study Team (3) Shift from Present Rail to High-Speed Rail The JICA Study Team conducted SP interview surveys with actual travelers using the present rail between Dhaka and Chittagong and collected 1962 responses. The breakdown of the responses was 1105 chose the present rail, and 857 chose the HSR. Table 4.35 shows the estimated parameters applying maximum likelihood estimation. The goodness of fit is 0.40, and the value of time is estimated to be 169 Taka per hour. The monetary value of the satisfaction to shift the mode of transport from present rail to high-speed rail is 606 Taka.
Table 4.35: Estimated Parameters of Binary Choice Model (Present Rail and HSR) Present Rail 𝜶𝟏(𝒉𝒐𝒖𝒓−𝟏) 𝜶𝟐(𝑻𝒌−𝟏) ∝𝒃𝒖𝒔 -0.365040531 -0.002162042 -1.309562008 t-value -30.887153 -7.626573 -6.951379 Source: JICA Study Team
(4) Shift from Airplane to High-Speed Rail The JICA Study Team conducted SP interview surveys with actual travelers using airplane between Dhaka and Chittagong and collected 413 responses. The breakdown of the responses was 180 chose the airplane, and 233 chose the HSR. Table 4.35 shows the estimated parameters applying maximum likelihood estimation. The goodness of fit is 0.23, and the value of time is estimated to be 652 Taka per hour. The monetary value of the satisfaction to shift the mode of transport from airplane to high-speed rail is 320 Taka.
Table 4.36: Estimated Parameters of Binary Choice Model (Airplane and HSR) Air 𝜶𝟏(𝒉𝒐𝒖𝒓−𝟏) 𝜶𝟐(𝑻𝒌−𝟏) ∝𝒂𝒊𝒓 -0.822307447 -0.001261543 -0.403382993 t-value -10.264362 -7.156282 -1.398359
Source: JICA Study Team (5) Willingness to Pay for HSR of Users of Each Transport Mode Table 4.37 summarizes the willingness to pay of the users of each transport mode for the decreases in the travel time and the shifts in transport mode to the HSR. Also, the average travel time of users using each transport service are described in the table below. The airplane users have the most expensive willingness to pay for shortening travel time (652 Taka), followed in order by passenger car (292 Taka), present railway (169 Taka), and bus (102 Taka). Meanwhile the bus users have the highest willingness to pay for changing the mode of transport to the HSR (751 Taka), followed by present rail (606 Taka), airplane (320 Taka), and passenger car (-639 Taka) in descending order.
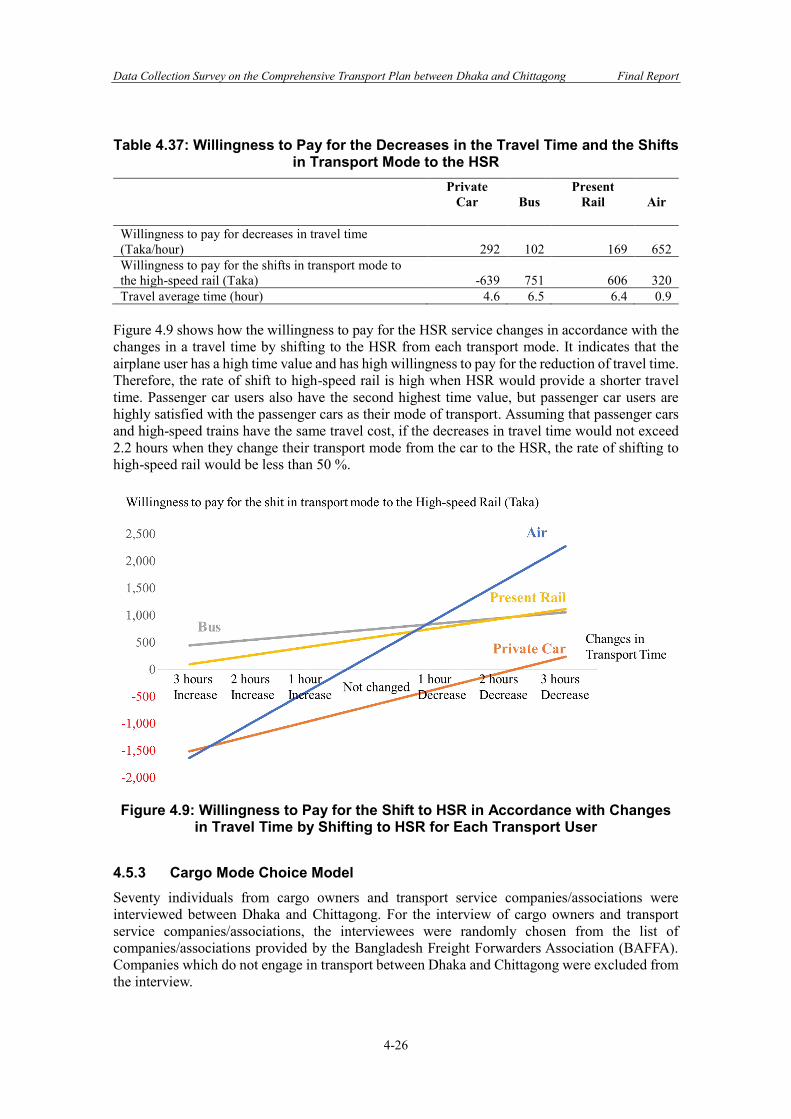
Data Collection Survey on the Comprehensive Transport Plan between Dhaka and Chittagong Final Report
4-26
Table 4.37: Willingness to Pay for the Decreases in the Travel Time and the Shifts in Transport Mode to the HSR
Private Car Bus
Present Rail Air
Willingness to pay for decreases in travel time (Taka/hour) 292 102 169 652 Willingness to pay for the shifts in transport mode to the high-speed rail (Taka) -639 751 606 320 Travel average time (hour) 4.6 6.5 6.4 0.9
Figure 4.9 shows how the willingness to pay for the HSR service changes in accordance with the changes in a travel time by shifting to the HSR from each transport mode. It indicates that the airplane user has a high time value and has high willingness to pay for the reduction of travel time. Therefore, the rate of shift to high-speed rail is high when HSR would provide a shorter travel time. Passenger car users also have the second highest time value, but passenger car users are highly satisfied with the passenger cars as their mode of transport. Assuming that passenger cars and high-speed trains have the same travel cost, if the decreases in travel time would not exceed 2.2 hours when they change their transport mode from the car to the HSR, the rate of shifting to high-speed rail would be less than 50 %.
Figure 4.9: Willingness to Pay for the Shift to HSR in Accordance with Changes
in Travel Time by Shifting to HSR for Each Transport User 4.5.3 Cargo Mode Choice Model Seventy individuals from cargo owners and transport service companies/associations were interviewed between Dhaka and Chittagong. For the interview of cargo owners and transport service companies/associations, the interviewees were randomly chosen from the list of companies/associations provided by the Bangladesh Freight Forwarders Association (BAFFA). Companies which do not engage in transport between Dhaka and Chittagong were excluded from the interview.
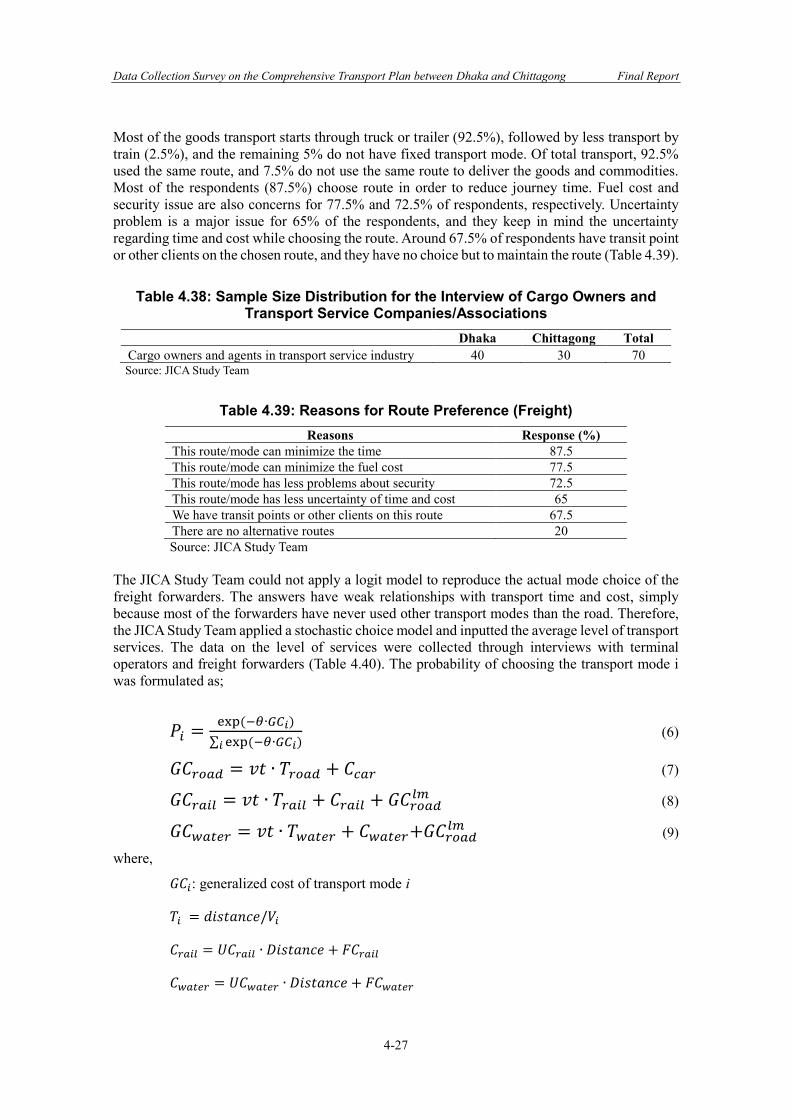
Data Collection Survey on the Comprehensive Transport Plan between Dhaka and Chittagong Final Report
4-27
Most of the goods transport starts through truck or trailer (92.5%), followed by less transport by train (2.5%), and the remaining 5% do not have fixed transport mode. Of total transport, 92.5% used the same route, and 7.5% do not use the same route to deliver the goods and commodities. Most of the respondents (87.5%) choose route in order to reduce journey time. Fuel cost and security issue are also concerns for 77.5% and 72.5% of respondents, respectively. Uncertainty problem is a major issue for 65% of the respondents, and they keep in mind the uncertainty regarding time and cost while choosing the route. Around 67.5% of respondents have transit point or other clients on the chosen route, and they have no choice but to maintain the route (Table 4.39).
Table 4.38: Sample Size Distribution for the Interview of Cargo Owners and Transport Service Companies/Associations
Dhaka Chittagong Total Cargo owners and agents in transport service industry 40 30 70 Source: JICA Study Team
Table 4.39: Reasons for Route Preference (Freight) Reasons Response (%)
This route/mode can minimize the time 87.5 This route/mode can minimize the fuel cost 77.5 This route/mode has less problems about security 72.5 This route/mode has less uncertainty of time and cost 65 We have transit points or other clients on this route 67.5 There are no alternative routes 20 Source: JICA Study Team
The JICA Study Team could not apply a logit model to reproduce the actual mode choice of the freight forwarders. The answers have weak relationships with transport time and cost, simply because most of the forwarders have never used other transport modes than the road. Therefore, the JICA Study Team applied a stochastic choice model and inputted the average level of transport services. The data on the level of services were collected through interviews with terminal operators and freight forwarders (Table 4.40). The probability of choosing the transport mode i was formulated as;
𝑃𝑖 =exp (−𝜃∙𝐺𝐶𝑖)
∑ exp (−𝜃∙𝐺𝐶𝑖)𝑖 (6)
𝐺𝐶𝑟𝑜𝑎𝑑 = 𝑣𝑡 ∙ 𝑇𝑟𝑜𝑎𝑑 + 𝐶𝑐𝑎𝑟 (7)
𝐺𝐶𝑟𝑎𝑖𝑙 = 𝑣𝑡 ∙ 𝑇𝑟𝑎𝑖𝑙 + 𝐶𝑟𝑎𝑖𝑙 + 𝐺𝐶𝑟𝑜𝑎𝑑𝑙𝑚 (8)
𝐺𝐶𝑤𝑎𝑡𝑒𝑟 = 𝑣𝑡 ∙ 𝑇𝑤𝑎𝑡𝑒𝑟 + 𝐶𝑤𝑎𝑡𝑒𝑟+𝐺𝐶𝑟𝑜𝑎𝑑𝑙𝑚 (9)
where,
𝐺𝐶𝑖: generalized cost of transport mode i
𝑇𝑖 = 𝑑𝑖𝑠𝑡𝑎𝑛𝑐𝑒/𝑉𝑖
𝐶𝑟𝑎𝑖𝑙 = 𝑈𝐶𝑟𝑎𝑖𝑙 ∙ 𝐷𝑖𝑠𝑡𝑎𝑛𝑐𝑒 + 𝐹𝐶𝑟𝑎𝑖𝑙
𝐶𝑤𝑎𝑡𝑒𝑟 = 𝑈𝐶𝑤𝑎𝑡𝑒𝑟 ∙ 𝐷𝑖𝑠𝑡𝑎𝑛𝑐𝑒 + 𝐹𝐶𝑤𝑎𝑡𝑒𝑟
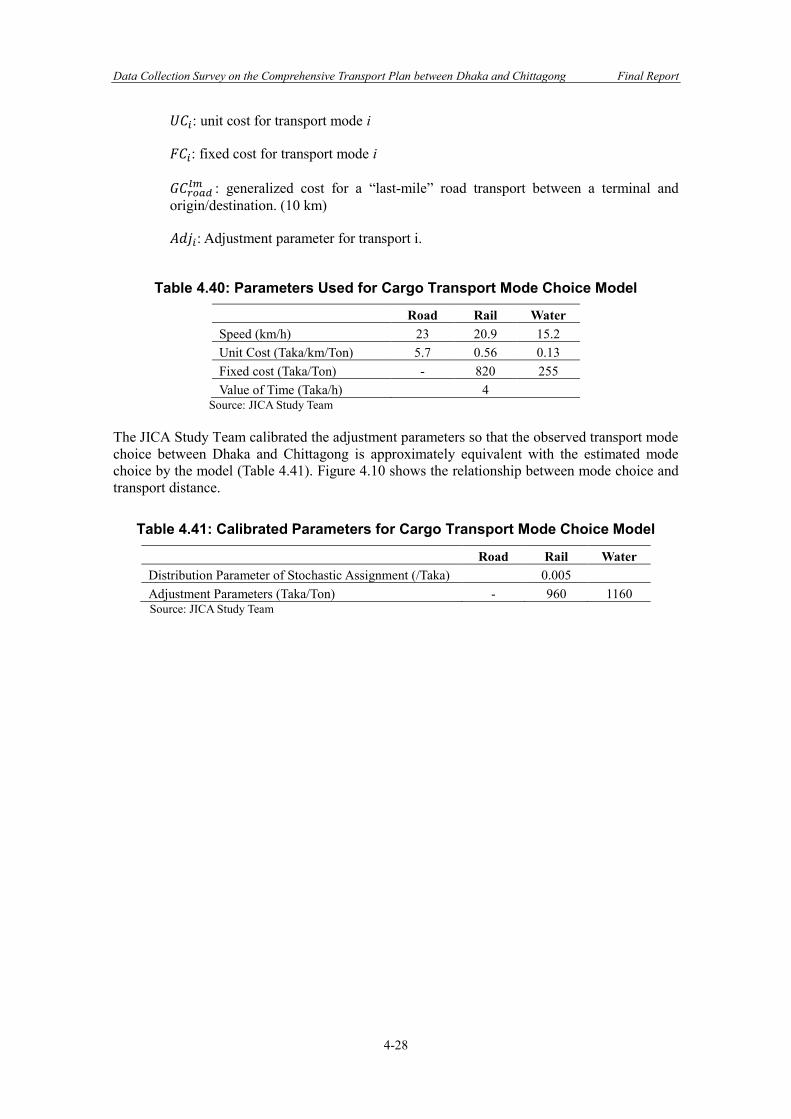
Data Collection Survey on the Comprehensive Transport Plan between Dhaka and Chittagong Final Report
4-28
𝑈𝐶𝑖: unit cost for transport mode i
𝐹𝐶𝑖: fixed cost for transport mode i
𝐺𝐶𝑟𝑜𝑎𝑑𝑙𝑚 : generalized cost for a “last-mile” road transport between a terminal and
origin/destination. (10 km)
𝐴𝑑𝑗𝑖: Adjustment parameter for transport i.
Table 4.40: Parameters Used for Cargo Transport Mode Choice Model
Road Rail Water Speed (km/h) 23 20.9 15.2 Unit Cost (Taka/km/Ton) 5.7 0.56 0.13 Fixed cost (Taka/Ton) - 820 255 Value of Time (Taka/h) 4
Source: JICA Study Team The JICA Study Team calibrated the adjustment parameters so that the observed transport mode choice between Dhaka and Chittagong is approximately equivalent with the estimated mode choice by the model (Table 4.41). Figure 4.10 shows the relationship between mode choice and transport distance.
Table 4.41: Calibrated Parameters for Cargo Transport Mode Choice Model
Road Rail Water Distribution Parameter of Stochastic Assignment (/Taka) 0.005 Adjustment Parameters (Taka/Ton) - 960 1160 Source: JICA Study Team
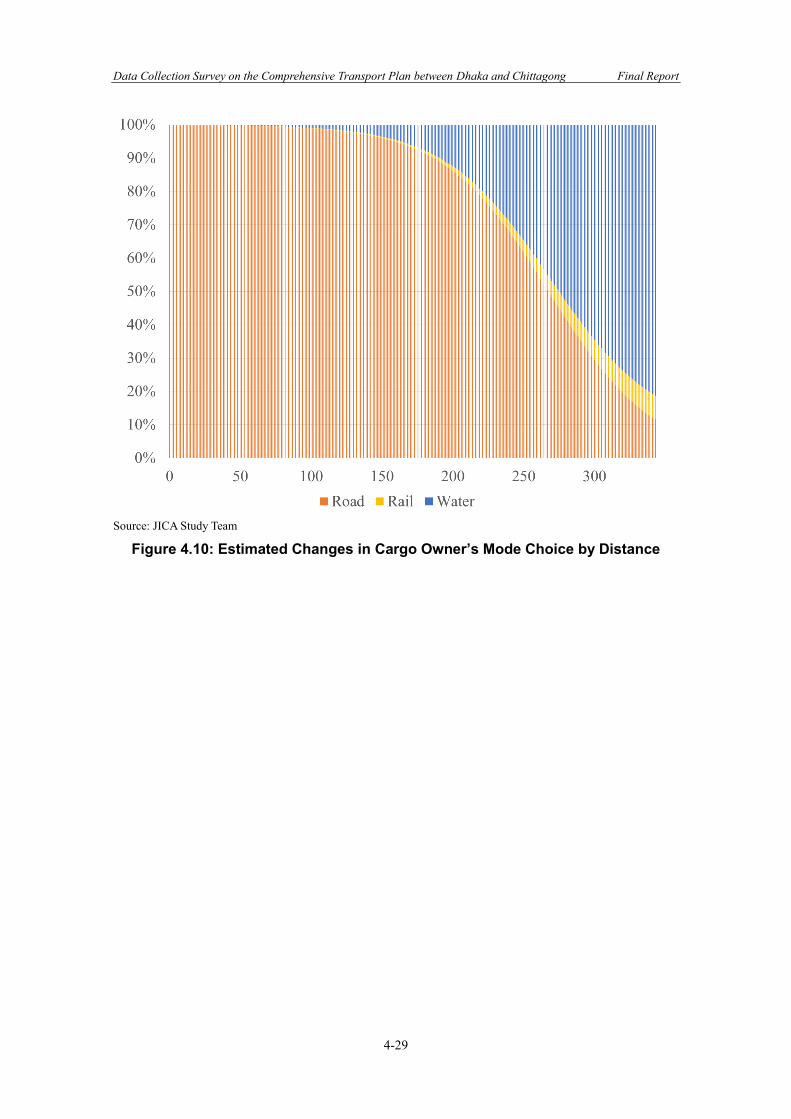
Data Collection Survey on the Comprehensive Transport Plan between Dhaka and Chittagong Final Report
4-29
Source: JICA Study Team
Figure 4.10: Estimated Changes in Cargo Owner’s Mode Choice by Distance

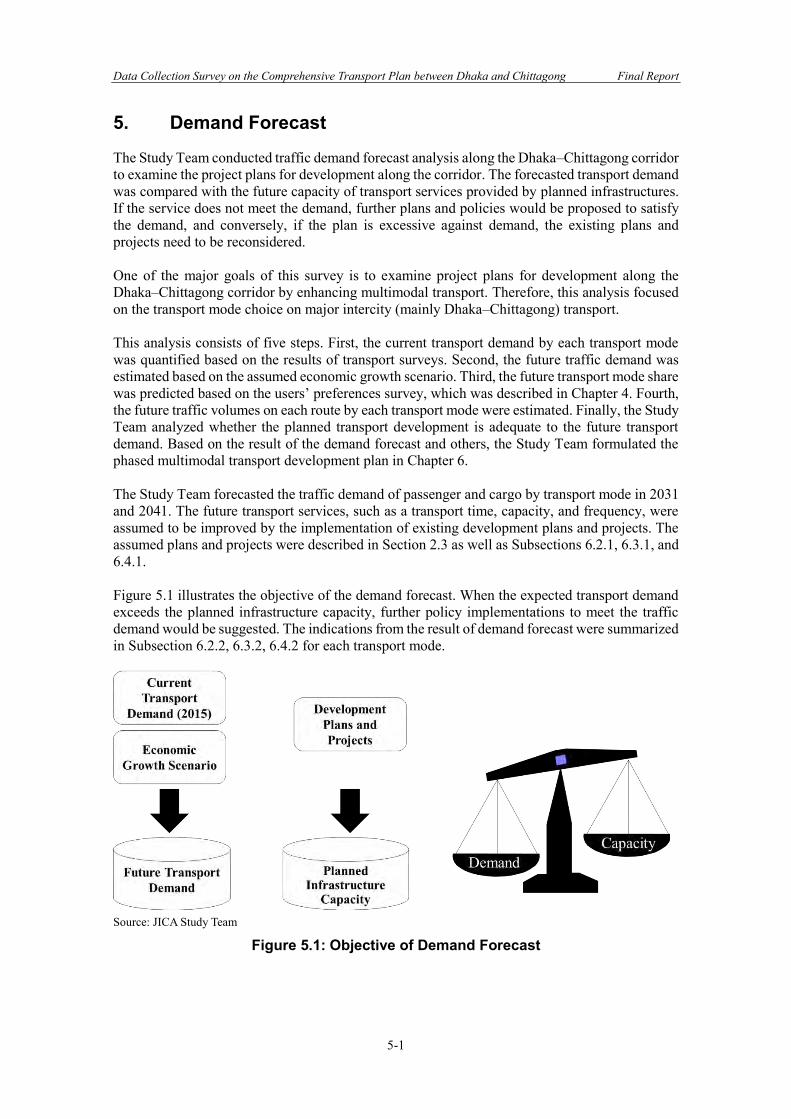
Data Collection Survey on the Comprehensive Transport Plan between Dhaka and Chittagong Final Report
5-1
5. Demand Forecast
The Study Team conducted traffic demand forecast analysis along the Dhaka–Chittagong corridor to examine the project plans for development along the corridor. The forecasted transport demand was compared with the future capacity of transport services provided by planned infrastructures. If the service does not meet the demand, further plans and policies would be proposed to satisfy the demand, and conversely, if the plan is excessive against demand, the existing plans and projects need to be reconsidered. One of the major goals of this survey is to examine project plans for development along the Dhaka–Chittagong corridor by enhancing multimodal transport. Therefore, this analysis focused on the transport mode choice on major intercity (mainly Dhaka–Chittagong) transport. This analysis consists of five steps. First, the current transport demand by each transport mode was quantified based on the results of transport surveys. Second, the future traffic demand was estimated based on the assumed economic growth scenario. Third, the future transport mode share was predicted based on the users’ preferences survey, which was described in Chapter 4. Fourth, the future traffic volumes on each route by each transport mode were estimated. Finally, the Study Team analyzed whether the planned transport development is adequate to the future transport demand. Based on the result of the demand forecast and others, the Study Team formulated the phased multimodal transport development plan in Chapter 6. The Study Team forecasted the traffic demand of passenger and cargo by transport mode in 2031 and 2041. The future transport services, such as a transport time, capacity, and frequency, were assumed to be improved by the implementation of existing development plans and projects. The assumed plans and projects were described in Section 2.3 as well as Subsections 6.2.1, 6.3.1, and 6.4.1. Figure 5.1 illustrates the objective of the demand forecast. When the expected transport demand exceeds the planned infrastructure capacity, further policy implementations to meet the traffic demand would be suggested. The indications from the result of demand forecast were summarized in Subsection 6.2.2, 6.3.2, 6.4.2 for each transport mode.
Source: JICA Study Team
Figure 5.1: Objective of Demand Forecast
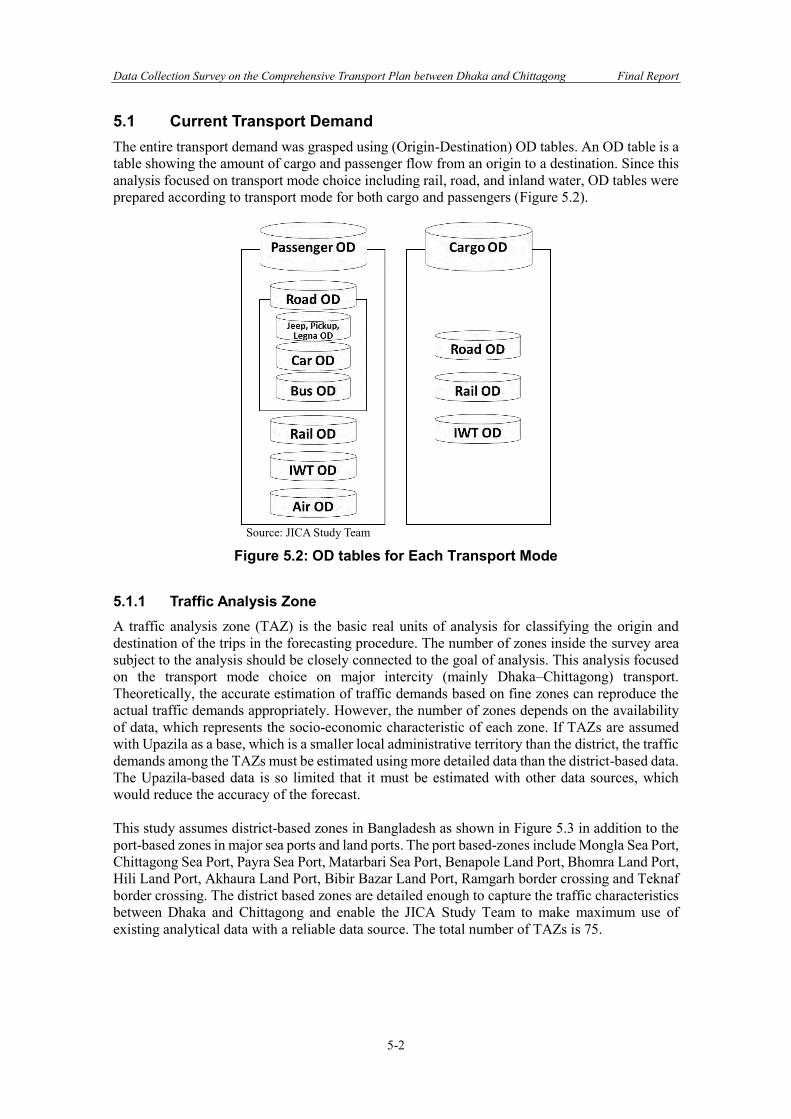
Data Collection Survey on the Comprehensive Transport Plan between Dhaka and Chittagong Final Report
5-2
5.1 Current Transport Demand The entire transport demand was grasped using (Origin-Destination) OD tables. An OD table is a table showing the amount of cargo and passenger flow from an origin to a destination. Since this analysis focused on transport mode choice including rail, road, and inland water, OD tables were prepared according to transport mode for both cargo and passengers (Figure 5.2).
Source: JICA Study Team
Figure 5.2: OD tables for Each Transport Mode 5.1.1 Traffic Analysis Zone A traffic analysis zone (TAZ) is the basic real units of analysis for classifying the origin and destination of the trips in the forecasting procedure. The number of zones inside the survey area subject to the analysis should be closely connected to the goal of analysis. This analysis focused on the transport mode choice on major intercity (mainly Dhaka–Chittagong) transport. Theoretically, the accurate estimation of traffic demands based on fine zones can reproduce the actual traffic demands appropriately. However, the number of zones depends on the availability of data, which represents the socio-economic characteristic of each zone. If TAZs are assumed with Upazila as a base, which is a smaller local administrative territory than the district, the traffic demands among the TAZs must be estimated using more detailed data than the district-based data. The Upazila-based data is so limited that it must be estimated with other data sources, which would reduce the accuracy of the forecast. This study assumes district-based zones in Bangladesh as shown in Figure 5.3 in addition to the port-based zones in major sea ports and land ports. The port based-zones include Mongla Sea Port, Chittagong Sea Port, Payra Sea Port, Matarbari Sea Port, Benapole Land Port, Bhomra Land Port, Hili Land Port, Akhaura Land Port, Bibir Bazar Land Port, Ramgarh border crossing and Teknaf border crossing. The district based zones are detailed enough to capture the traffic characteristics between Dhaka and Chittagong and enable the JICA Study Team to make maximum use of existing analytical data with a reliable data source. The total number of TAZs is 75.
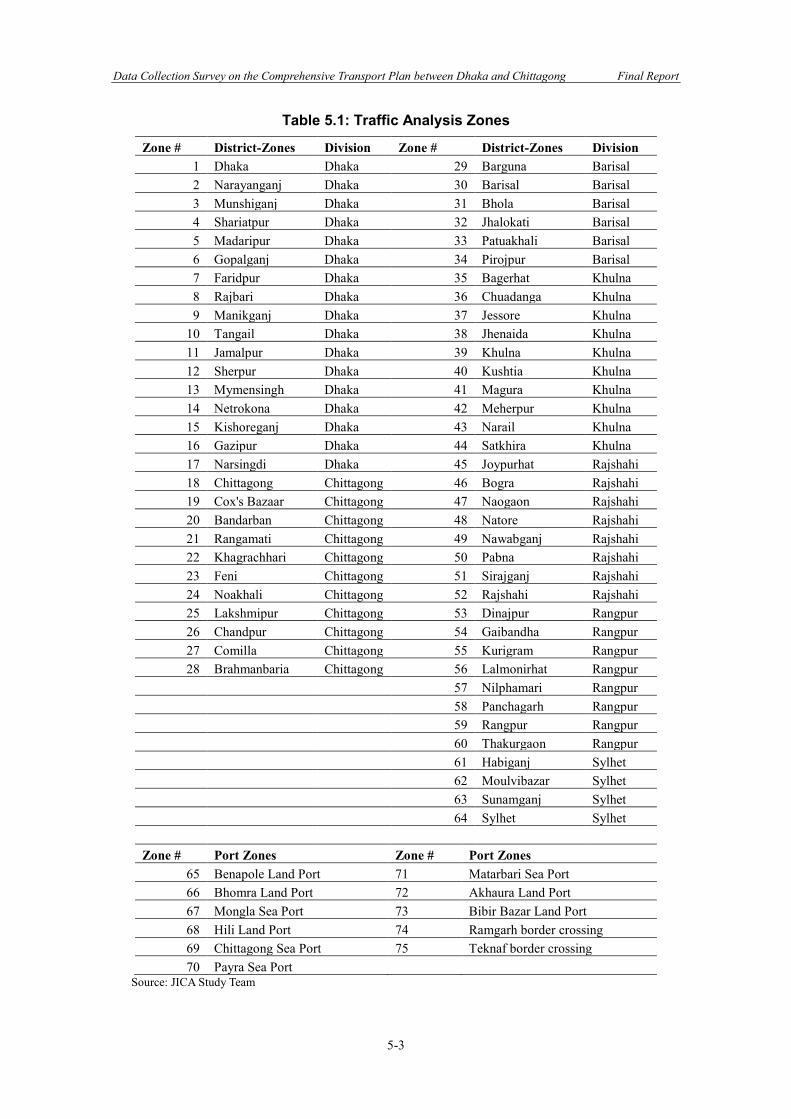
Data Collection Survey on the Comprehensive Transport Plan between Dhaka and Chittagong Final Report
5-3
Table 5.1: Traffic Analysis Zones
Zone # District-Zones Division Zone # District-Zones Division 1 Dhaka Dhaka 29 Barguna Barisal 2 Narayanganj Dhaka 30 Barisal Barisal 3 Munshiganj Dhaka 31 Bhola Barisal 4 Shariatpur Dhaka 32 Jhalokati Barisal 5 Madaripur Dhaka 33 Patuakhali Barisal 6 Gopalganj Dhaka 34 Pirojpur Barisal 7 Faridpur Dhaka 35 Bagerhat Khulna 8 Rajbari Dhaka 36 Chuadanga Khulna 9 Manikganj Dhaka 37 Jessore Khulna
10 Tangail Dhaka 38 Jhenaida Khulna 11 Jamalpur Dhaka 39 Khulna Khulna 12 Sherpur Dhaka 40 Kushtia Khulna 13 Mymensingh Dhaka 41 Magura Khulna 14 Netrokona Dhaka 42 Meherpur Khulna 15 Kishoreganj Dhaka 43 Narail Khulna 16 Gazipur Dhaka 44 Satkhira Khulna 17 Narsingdi Dhaka 45 Joypurhat Rajshahi 18 Chittagong Chittagong 46 Bogra Rajshahi 19 Cox's Bazaar Chittagong 47 Naogaon Rajshahi 20 Bandarban Chittagong 48 Natore Rajshahi 21 Rangamati Chittagong 49 Nawabganj Rajshahi 22 Khagrachhari Chittagong 50 Pabna Rajshahi 23 Feni Chittagong 51 Sirajganj Rajshahi 24 Noakhali Chittagong 52 Rajshahi Rajshahi 25 Lakshmipur Chittagong 53 Dinajpur Rangpur 26 Chandpur Chittagong 54 Gaibandha Rangpur 27 Comilla Chittagong 55 Kurigram Rangpur 28 Brahmanbaria Chittagong 56 Lalmonirhat Rangpur
57 Nilphamari Rangpur 58 Panchagarh Rangpur 59 Rangpur Rangpur 60 Thakurgaon Rangpur 61 Habiganj Sylhet 62 Moulvibazar Sylhet 63 Sunamganj Sylhet 64 Sylhet Sylhet Zone # Port Zones Zone # Port Zones
65 Benapole Land Port 71 Matarbari Sea Port 66 Bhomra Land Port 72 Akhaura Land Port 67 Mongla Sea Port 73 Bibir Bazar Land Port 68 Hili Land Port 74 Ramgarh border crossing 69 Chittagong Sea Port 75 Teknaf border crossing 70 Payra Sea Port
Source: JICA Study Team
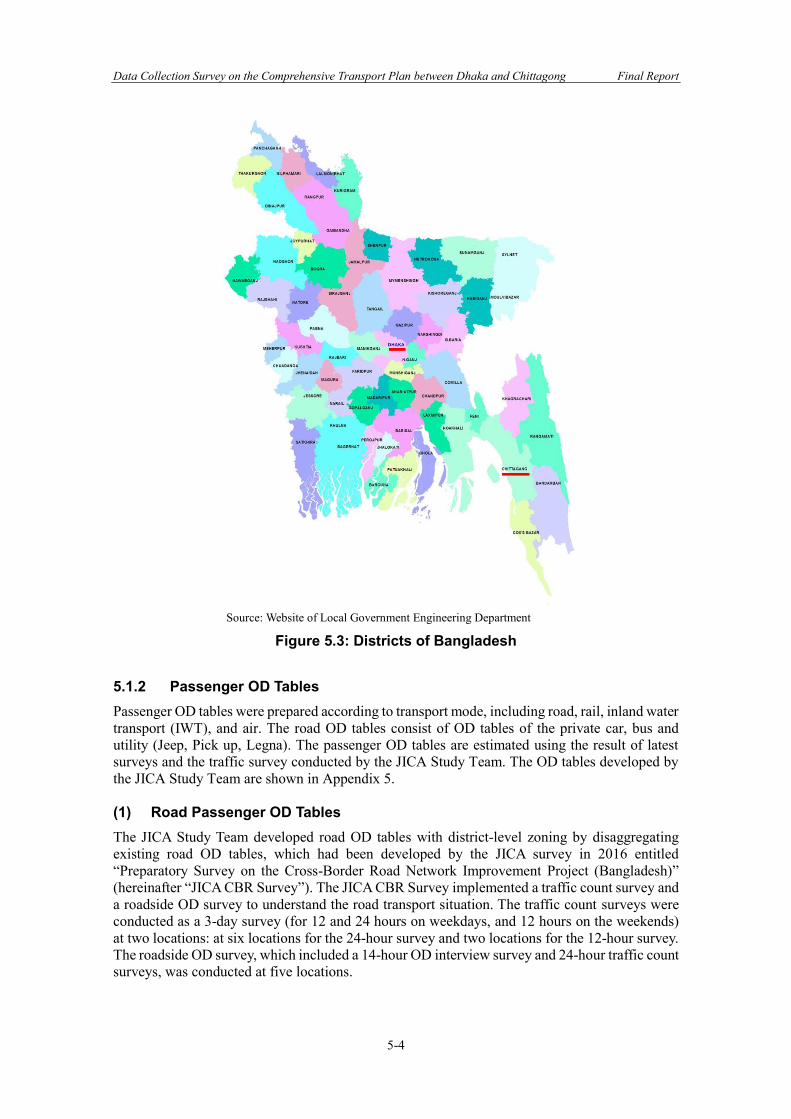
Data Collection Survey on the Comprehensive Transport Plan between Dhaka and Chittagong Final Report
5-4
Source: Website of Local Government Engineering Department
Figure 5.3: Districts of Bangladesh 5.1.2 Passenger OD Tables Passenger OD tables were prepared according to transport mode, including road, rail, inland water transport (IWT), and air. The road OD tables consist of OD tables of the private car, bus and utility (Jeep, Pick up, Legna). The passenger OD tables are estimated using the result of latest surveys and the traffic survey conducted by the JICA Study Team. The OD tables developed by the JICA Study Team are shown in Appendix 5. (1) Road Passenger OD Tables The JICA Study Team developed road OD tables with district-level zoning by disaggregating existing road OD tables, which had been developed by the JICA survey in 2016 entitled “Preparatory Survey on the Cross-Border Road Network Improvement Project (Bangladesh)” (hereinafter “JICA CBR Survey”). The JICA CBR Survey implemented a traffic count survey and a roadside OD survey to understand the road transport situation. The traffic count surveys were conducted as a 3-day survey (for 12 and 24 hours on weekdays, and 12 hours on the weekends) at two locations: at six locations for the 24-hour survey and two locations for the 12-hour survey. The roadside OD survey, which included a 14-hour OD interview survey and 24-hour traffic count surveys, was conducted at five locations.
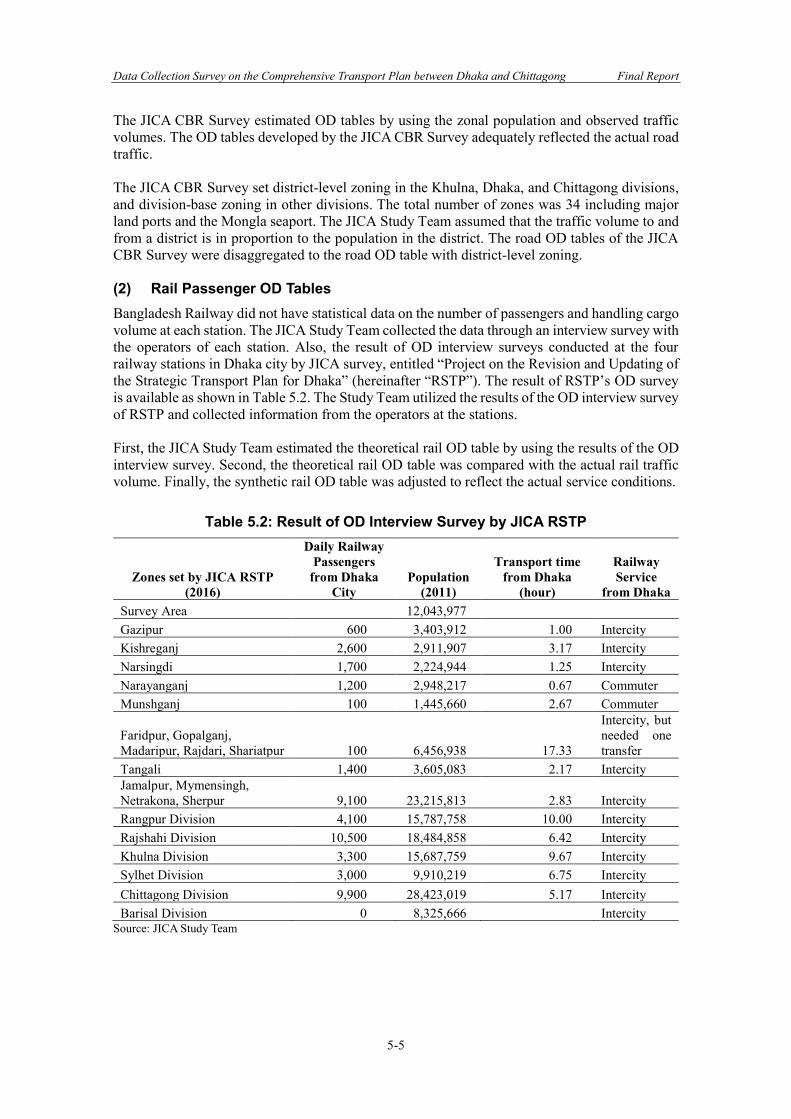
Data Collection Survey on the Comprehensive Transport Plan between Dhaka and Chittagong Final Report
5-5
The JICA CBR Survey estimated OD tables by using the zonal population and observed traffic volumes. The OD tables developed by the JICA CBR Survey adequately reflected the actual road traffic. The JICA CBR Survey set district-level zoning in the Khulna, Dhaka, and Chittagong divisions, and division-base zoning in other divisions. The total number of zones was 34 including major land ports and the Mongla seaport. The JICA Study Team assumed that the traffic volume to and from a district is in proportion to the population in the district. The road OD tables of the JICA CBR Survey were disaggregated to the road OD table with district-level zoning. (2) Rail Passenger OD Tables Bangladesh Railway did not have statistical data on the number of passengers and handling cargo volume at each station. The JICA Study Team collected the data through an interview survey with the operators of each station. Also, the result of OD interview surveys conducted at the four railway stations in Dhaka city by JICA survey, entitled “Project on the Revision and Updating of the Strategic Transport Plan for Dhaka” (hereinafter “RSTP”). The result of RSTP’s OD survey is available as shown in Table 5.2. The Study Team utilized the results of the OD interview survey of RSTP and collected information from the operators at the stations. First, the JICA Study Team estimated the theoretical rail OD table by using the results of the OD interview survey. Second, the theoretical rail OD table was compared with the actual rail traffic volume. Finally, the synthetic rail OD table was adjusted to reflect the actual service conditions.
Table 5.2: Result of OD Interview Survey by JICA RSTP
Zones set by JICA RSTP (2016)
Daily Railway Passengers
from Dhaka City
Population (2011)
Transport time from Dhaka
(hour)
Railway Service
from Dhaka Survey Area 12,043,977 Gazipur 600 3,403,912 1.00 Intercity Kishreganj 2,600 2,911,907 3.17 Intercity Narsingdi 1,700 2,224,944 1.25 Intercity Narayanganj 1,200 2,948,217 0.67 Commuter Munshganj 100 1,445,660 2.67 Commuter
Faridpur, Gopalganj, Madaripur, Rajdari, Shariatpur 100 6,456,938 17.33
Intercity, but needed one transfer
Tangali 1,400 3,605,083 2.17 Intercity Jamalpur, Mymensingh, Netrakona, Sherpur 9,100 23,215,813 2.83 Intercity Rangpur Division 4,100 15,787,758 10.00 Intercity Rajshahi Division 10,500 18,484,858 6.42 Intercity Khulna Division 3,300 15,687,759 9.67 Intercity Sylhet Division 3,000 9,910,219 6.75 Intercity Chittagong Division 9,900 28,423,019 5.17 Intercity Barisal Division 0 8,325,666 Intercity
Source: JICA Study Team
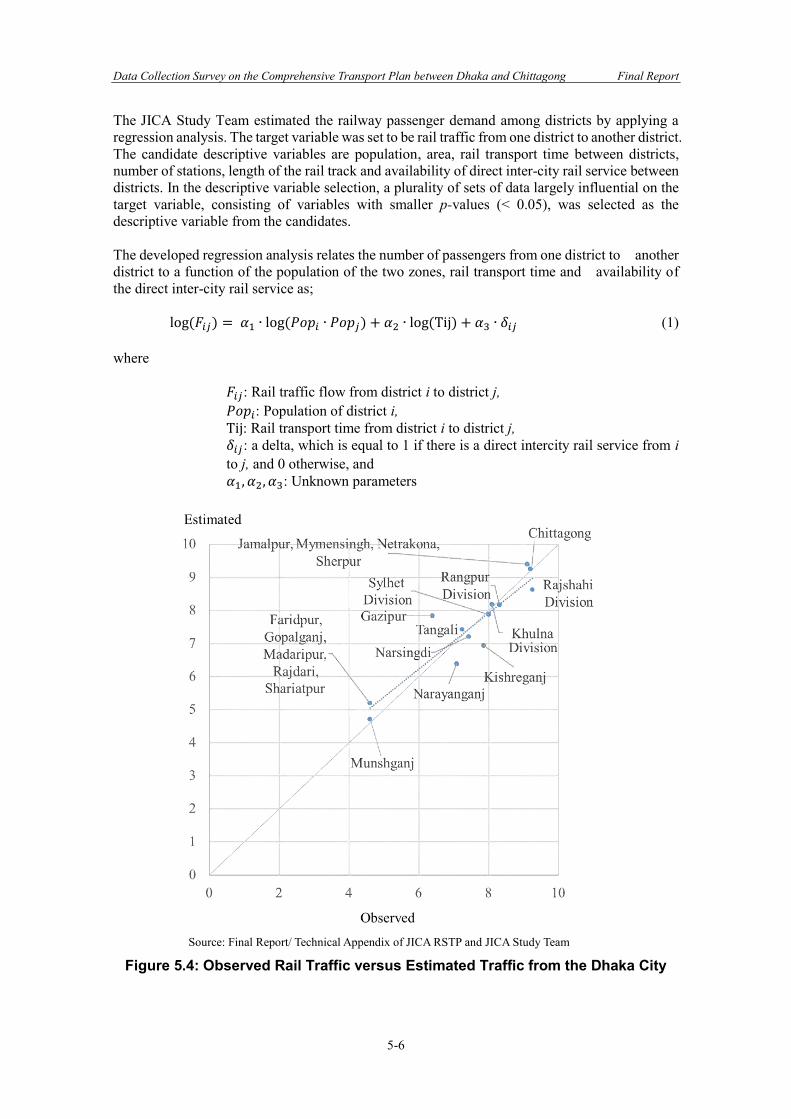
Data Collection Survey on the Comprehensive Transport Plan between Dhaka and Chittagong Final Report
5-6
The JICA Study Team estimated the railway passenger demand among districts by applying a regression analysis. The target variable was set to be rail traffic from one district to another district. The candidate descriptive variables are population, area, rail transport time between districts, number of stations, length of the rail track and availability of direct inter-city rail service between districts. In the descriptive variable selection, a plurality of sets of data largely influential on the target variable, consisting of variables with smaller p-values (< 0.05), was selected as the descriptive variable from the candidates. The developed regression analysis relates the number of passengers from one district to another district to a function of the population of the two zones, rail transport time and availability of the direct inter-city rail service as;
log(𝐹𝑖𝑗) = 𝛼1 ∙ log(𝑃𝑜𝑝𝑖 ∙ 𝑃𝑜𝑝𝑗) + 𝛼2 ∙ log(Tij) + 𝛼3 ∙ 𝛿𝑖𝑗 (1) where
𝐹𝑖𝑗: Rail traffic flow from district i to district j, 𝑃𝑜𝑝𝑖: Population of district i, Tij: Rail transport time from district i to district j, 𝛿𝑖𝑗: a delta, which is equal to 1 if there is a direct intercity rail service from i to j, and 0 otherwise, and 𝛼1, 𝛼2, 𝛼3: Unknown parameters
Source: Final Report/ Technical Appendix of JICA RSTP and JICA Study Team
Figure 5.4: Observed Rail Traffic versus Estimated Traffic from the Dhaka City
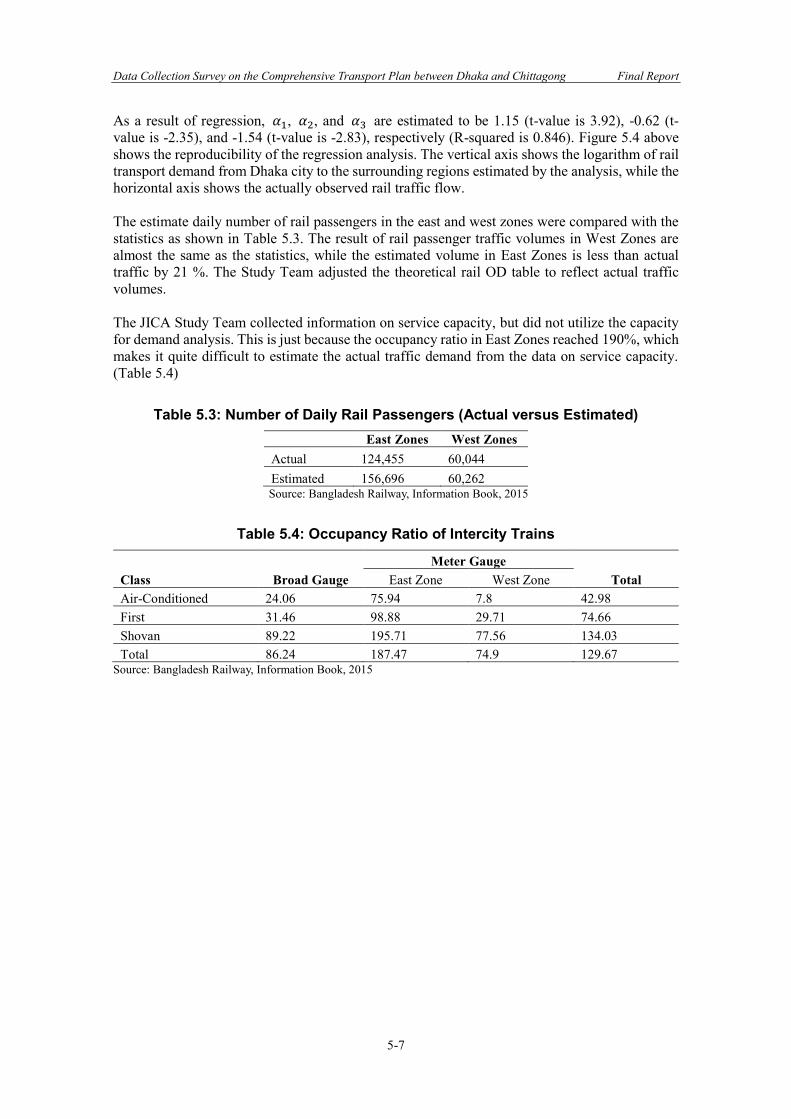
Data Collection Survey on the Comprehensive Transport Plan between Dhaka and Chittagong Final Report
5-7
As a result of regression, 𝛼1, 𝛼2, and 𝛼3 are estimated to be 1.15 (t-value is 3.92), -0.62 (t-value is -2.35), and -1.54 (t-value is -2.83), respectively (R-squared is 0.846). Figure 5.4 above shows the reproducibility of the regression analysis. The vertical axis shows the logarithm of rail transport demand from Dhaka city to the surrounding regions estimated by the analysis, while the horizontal axis shows the actually observed rail traffic flow. The estimate daily number of rail passengers in the east and west zones were compared with the statistics as shown in Table 5.3. The result of rail passenger traffic volumes in West Zones are almost the same as the statistics, while the estimated volume in East Zones is less than actual traffic by 21 %. The Study Team adjusted the theoretical rail OD table to reflect actual traffic volumes. The JICA Study Team collected information on service capacity, but did not utilize the capacity for demand analysis. This is just because the occupancy ratio in East Zones reached 190%, which makes it quite difficult to estimate the actual traffic demand from the data on service capacity. (Table 5.4)
Table 5.3: Number of Daily Rail Passengers (Actual versus Estimated) East Zones West Zones Actual 124,455 60,044 Estimated 156,696 60,262 Source: Bangladesh Railway, Information Book, 2015
Table 5.4: Occupancy Ratio of Intercity Trains
Class Broad Gauge Meter Gauge
Total East Zone West Zone Air-Conditioned 24.06 75.94 7.8 42.98 First 31.46 98.88 29.71 74.66 Shovan 89.22 195.71 77.56 134.03 Total 86.24 187.47 74.9 129.67
Source: Bangladesh Railway, Information Book, 2015
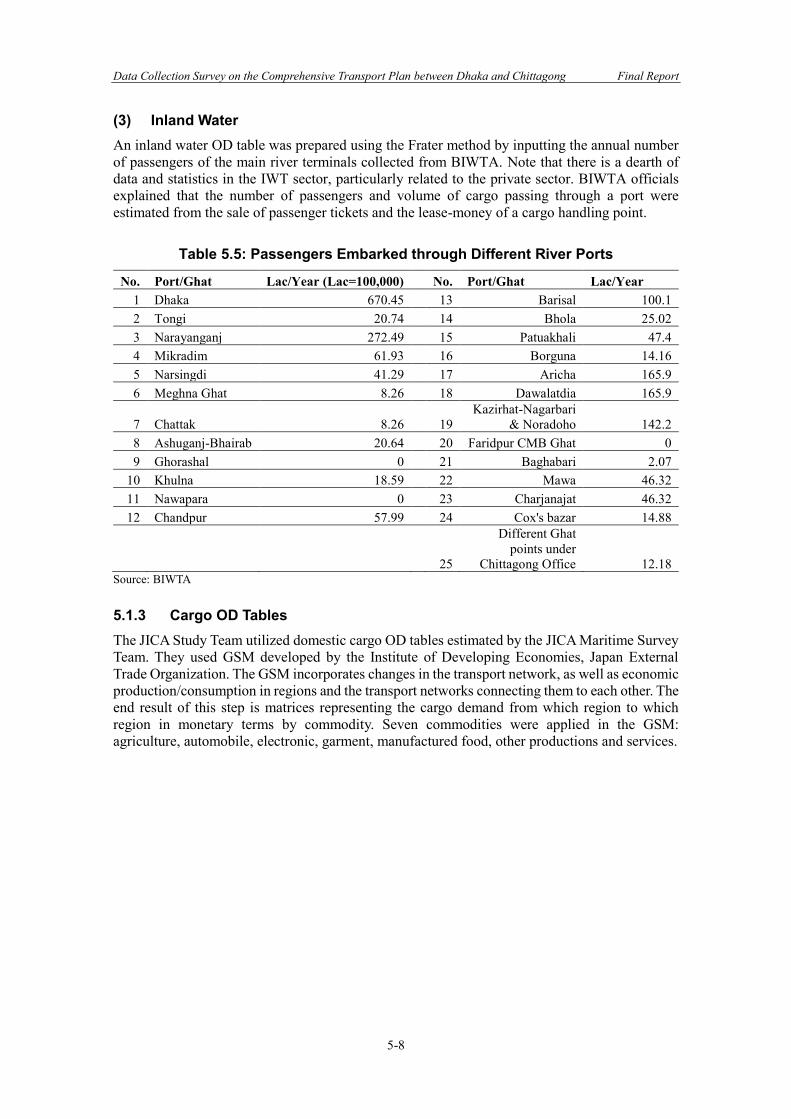
Data Collection Survey on the Comprehensive Transport Plan between Dhaka and Chittagong Final Report
5-8
(3) Inland Water An inland water OD table was prepared using the Frater method by inputting the annual number of passengers of the main river terminals collected from BIWTA. Note that there is a dearth of data and statistics in the IWT sector, particularly related to the private sector. BIWTA officials explained that the number of passengers and volume of cargo passing through a port were estimated from the sale of passenger tickets and the lease-money of a cargo handling point.
Table 5.5: Passengers Embarked through Different River Ports
No. Port/Ghat Lac/Year (Lac=100,000) No. Port/Ghat Lac/Year 1 Dhaka 670.45 13 Barisal 100.1 2 Tongi 20.74 14 Bhola 25.02 3 Narayanganj 272.49 15 Patuakhali 47.4 4 Mikradim 61.93 16 Borguna 14.16 5 Narsingdi 41.29 17 Aricha 165.9 6 Meghna Ghat 8.26 18 Dawalatdia 165.9
7 Chattak 8.26 19 Kazirhat-Nagarbari
& Noradoho 142.2 8 Ashuganj-Bhairab 20.64 20 Faridpur CMB Ghat 0 9 Ghorashal 0 21 Baghabari 2.07
10 Khulna 18.59 22 Mawa 46.32 11 Nawapara 0 23 Charjanajat 46.32 12 Chandpur 57.99 24 Cox's bazar 14.88
25
Different Ghat points under
Chittagong Office 12.18 Source: BIWTA 5.1.3 Cargo OD Tables The JICA Study Team utilized domestic cargo OD tables estimated by the JICA Maritime Survey Team. They used GSM developed by the Institute of Developing Economies, Japan External Trade Organization. The GSM incorporates changes in the transport network, as well as economic production/consumption in regions and the transport networks connecting them to each other. The end result of this step is matrices representing the cargo demand from which region to which region in monetary terms by commodity. Seven commodities were applied in the GSM: agriculture, automobile, electronic, garment, manufactured food, other productions and services.
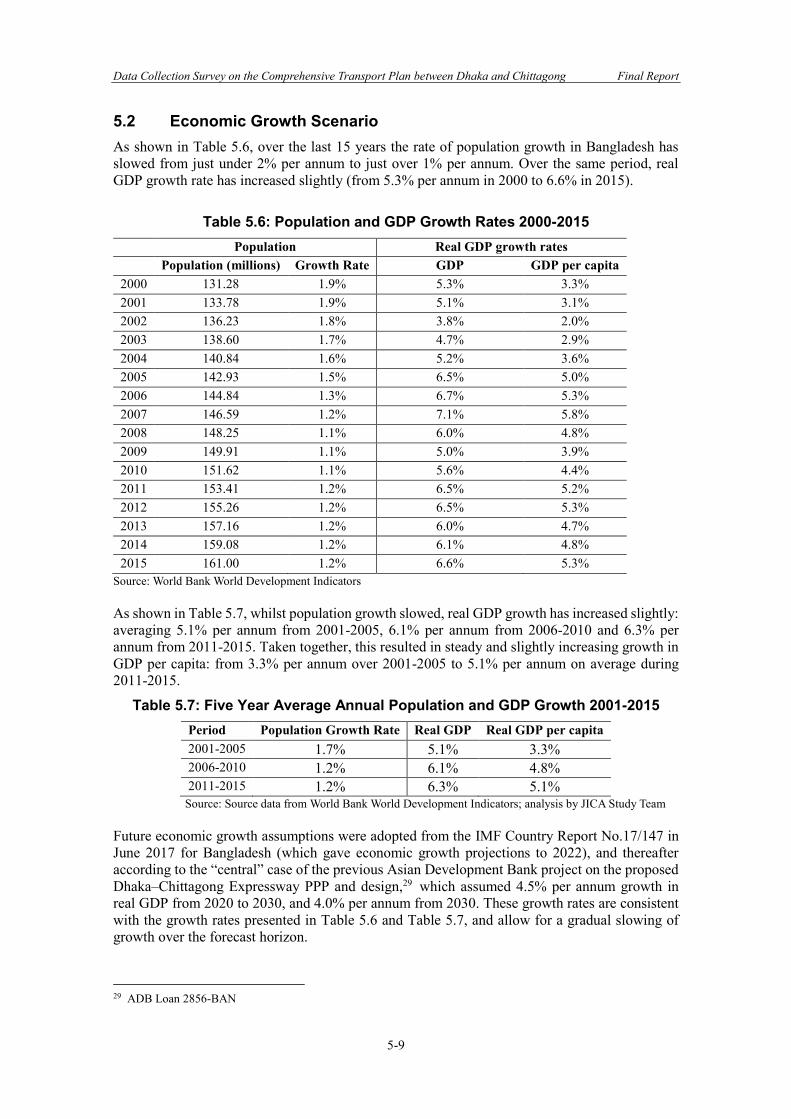
Data Collection Survey on the Comprehensive Transport Plan between Dhaka and Chittagong Final Report
5-9
5.2 Economic Growth Scenario As shown in Table 5.6, over the last 15 years the rate of population growth in Bangladesh has slowed from just under 2% per annum to just over 1% per annum. Over the same period, real GDP growth rate has increased slightly (from 5.3% per annum in 2000 to 6.6% in 2015).
Table 5.6: Population and GDP Growth Rates 2000-2015 Population Real GDP growth rates
Population (millions) Growth Rate GDP GDP per capita 2000 131.28 1.9% 5.3% 3.3% 2001 133.78 1.9% 5.1% 3.1% 2002 136.23 1.8% 3.8% 2.0% 2003 138.60 1.7% 4.7% 2.9% 2004 140.84 1.6% 5.2% 3.6% 2005 142.93 1.5% 6.5% 5.0% 2006 144.84 1.3% 6.7% 5.3% 2007 146.59 1.2% 7.1% 5.8% 2008 148.25 1.1% 6.0% 4.8% 2009 149.91 1.1% 5.0% 3.9% 2010 151.62 1.1% 5.6% 4.4% 2011 153.41 1.2% 6.5% 5.2% 2012 155.26 1.2% 6.5% 5.3% 2013 157.16 1.2% 6.0% 4.7% 2014 159.08 1.2% 6.1% 4.8% 2015 161.00 1.2% 6.6% 5.3%
Source: World Bank World Development Indicators As shown in Table 5.7, whilst population growth slowed, real GDP growth has increased slightly: averaging 5.1% per annum from 2001-2005, 6.1% per annum from 2006-2010 and 6.3% per annum from 2011-2015. Taken together, this resulted in steady and slightly increasing growth in GDP per capita: from 3.3% per annum over 2001-2005 to 5.1% per annum on average during 2011-2015.
Table 5.7: Five Year Average Annual Population and GDP Growth 2001-2015 Period Population Growth Rate Real GDP Real GDP per capita 2001-2005 1.7% 5.1% 3.3% 2006-2010 1.2% 6.1% 4.8% 2011-2015 1.2% 6.3% 5.1%
Source: Source data from World Bank World Development Indicators; analysis by JICA Study Team Future economic growth assumptions were adopted from the IMF Country Report No.17/147 in June 2017 for Bangladesh (which gave economic growth projections to 2022), and thereafter according to the “central” case of the previous Asian Development Bank project on the proposed Dhaka–Chittagong Expressway PPP and design,29 which assumed 4.5% per annum growth in real GDP from 2020 to 2030, and 4.0% per annum from 2030. These growth rates are consistent with the growth rates presented in Table 5.6 and Table 5.7, and allow for a gradual slowing of growth over the forecast horizon.
29 ADB Loan 2856-BAN
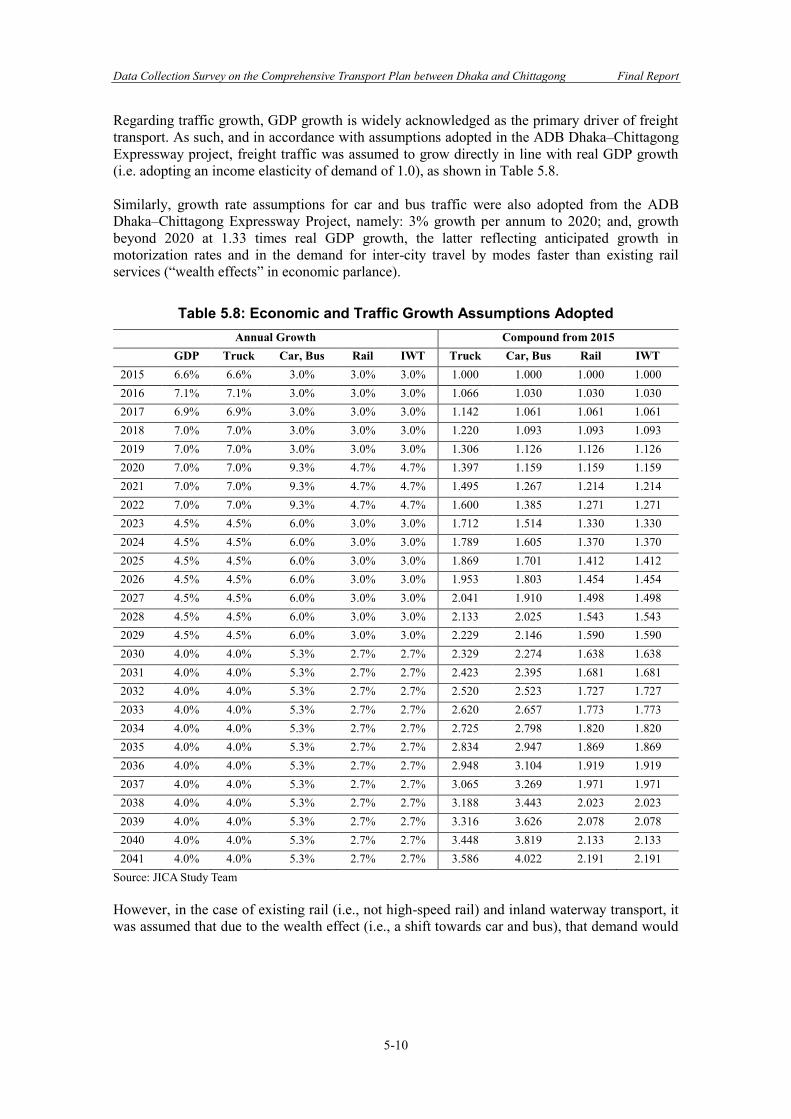
Data Collection Survey on the Comprehensive Transport Plan between Dhaka and Chittagong Final Report
5-10
Regarding traffic growth, GDP growth is widely acknowledged as the primary driver of freight transport. As such, and in accordance with assumptions adopted in the ADB Dhaka–Chittagong Expressway project, freight traffic was assumed to grow directly in line with real GDP growth (i.e. adopting an income elasticity of demand of 1.0), as shown in Table 5.8. Similarly, growth rate assumptions for car and bus traffic were also adopted from the ADB Dhaka–Chittagong Expressway Project, namely: 3% growth per annum to 2020; and, growth beyond 2020 at 1.33 times real GDP growth, the latter reflecting anticipated growth in motorization rates and in the demand for inter-city travel by modes faster than existing rail services (“wealth effects” in economic parlance).
Table 5.8: Economic and Traffic Growth Assumptions Adopted Annual Growth Compound from 2015
GDP Truck Car, Bus Rail IWT Truck Car, Bus Rail IWT 2015 6.6% 6.6% 3.0% 3.0% 3.0% 1.000 1.000 1.000 1.000 2016 7.1% 7.1% 3.0% 3.0% 3.0% 1.066 1.030 1.030 1.030 2017 6.9% 6.9% 3.0% 3.0% 3.0% 1.142 1.061 1.061 1.061 2018 7.0% 7.0% 3.0% 3.0% 3.0% 1.220 1.093 1.093 1.093 2019 7.0% 7.0% 3.0% 3.0% 3.0% 1.306 1.126 1.126 1.126 2020 7.0% 7.0% 9.3% 4.7% 4.7% 1.397 1.159 1.159 1.159 2021 7.0% 7.0% 9.3% 4.7% 4.7% 1.495 1.267 1.214 1.214 2022 7.0% 7.0% 9.3% 4.7% 4.7% 1.600 1.385 1.271 1.271 2023 4.5% 4.5% 6.0% 3.0% 3.0% 1.712 1.514 1.330 1.330 2024 4.5% 4.5% 6.0% 3.0% 3.0% 1.789 1.605 1.370 1.370 2025 4.5% 4.5% 6.0% 3.0% 3.0% 1.869 1.701 1.412 1.412 2026 4.5% 4.5% 6.0% 3.0% 3.0% 1.953 1.803 1.454 1.454 2027 4.5% 4.5% 6.0% 3.0% 3.0% 2.041 1.910 1.498 1.498 2028 4.5% 4.5% 6.0% 3.0% 3.0% 2.133 2.025 1.543 1.543 2029 4.5% 4.5% 6.0% 3.0% 3.0% 2.229 2.146 1.590 1.590 2030 4.0% 4.0% 5.3% 2.7% 2.7% 2.329 2.274 1.638 1.638 2031 4.0% 4.0% 5.3% 2.7% 2.7% 2.423 2.395 1.681 1.681 2032 4.0% 4.0% 5.3% 2.7% 2.7% 2.520 2.523 1.727 1.727 2033 4.0% 4.0% 5.3% 2.7% 2.7% 2.620 2.657 1.773 1.773 2034 4.0% 4.0% 5.3% 2.7% 2.7% 2.725 2.798 1.820 1.820 2035 4.0% 4.0% 5.3% 2.7% 2.7% 2.834 2.947 1.869 1.869 2036 4.0% 4.0% 5.3% 2.7% 2.7% 2.948 3.104 1.919 1.919 2037 4.0% 4.0% 5.3% 2.7% 2.7% 3.065 3.269 1.971 1.971 2038 4.0% 4.0% 5.3% 2.7% 2.7% 3.188 3.443 2.023 2.023 2039 4.0% 4.0% 5.3% 2.7% 2.7% 3.316 3.626 2.078 2.078 2040 4.0% 4.0% 5.3% 2.7% 2.7% 3.448 3.819 2.133 2.133 2041 4.0% 4.0% 5.3% 2.7% 2.7% 3.586 4.022 2.191 2.191
Source: JICA Study Team However, in the case of existing rail (i.e., not high-speed rail) and inland waterway transport, it was assumed that due to the wealth effect (i.e., a shift towards car and bus), that demand would
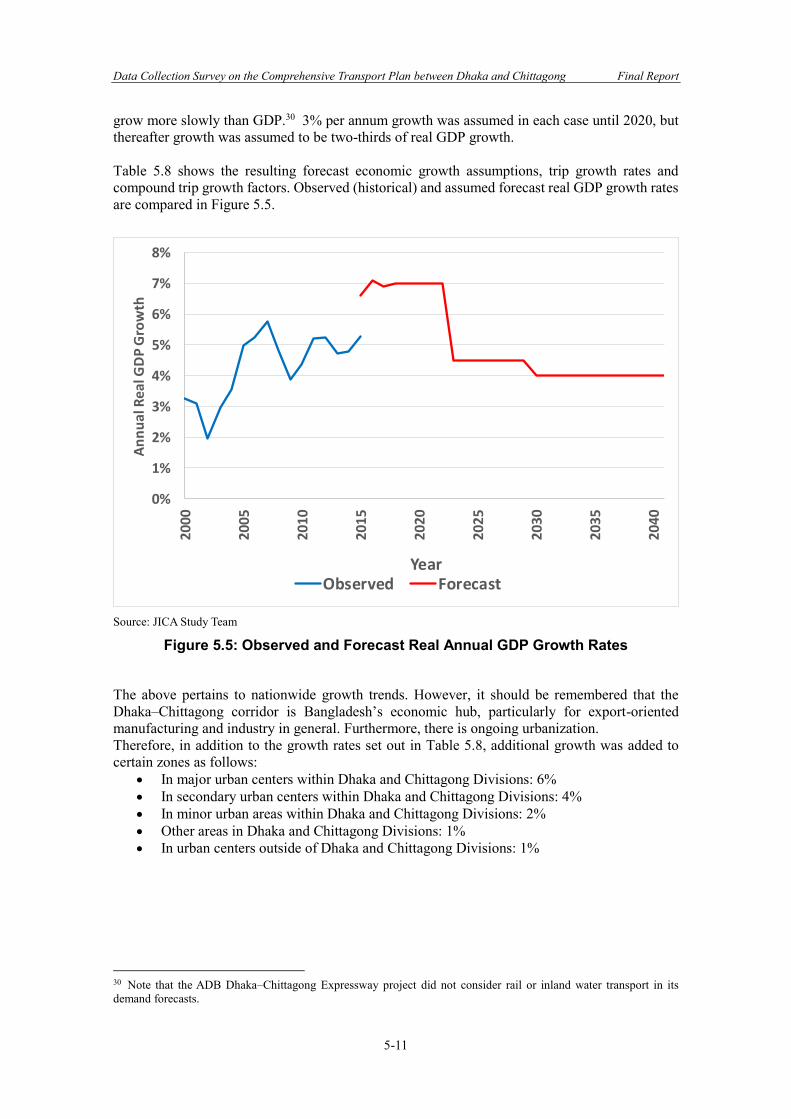
Data Collection Survey on the Comprehensive Transport Plan between Dhaka and Chittagong Final Report
5-11
grow more slowly than GDP.30 3% per annum growth was assumed in each case until 2020, but thereafter growth was assumed to be two-thirds of real GDP growth. Table 5.8 shows the resulting forecast economic growth assumptions, trip growth rates and compound trip growth factors. Observed (historical) and assumed forecast real GDP growth rates are compared in Figure 5.5.
Source: JICA Study Team
Figure 5.5: Observed and Forecast Real Annual GDP Growth Rates
The above pertains to nationwide growth trends. However, it should be remembered that the Dhaka–Chittagong corridor is Bangladesh’s economic hub, particularly for export-oriented manufacturing and industry in general. Furthermore, there is ongoing urbanization. Therefore, in addition to the growth rates set out in Table 5.8, additional growth was added to certain zones as follows:
• In major urban centers within Dhaka and Chittagong Divisions: 6% • In secondary urban centers within Dhaka and Chittagong Divisions: 4% • In minor urban areas within Dhaka and Chittagong Divisions: 2% • Other areas in Dhaka and Chittagong Divisions: 1% • In urban centers outside of Dhaka and Chittagong Divisions: 1%
30 Note that the ADB Dhaka–Chittagong Expressway project did not consider rail or inland water transport in its demand forecasts.
0%
1%
2%
3%
4%
5%
6%
7%
8%
2000
2005
2010
2015
2020
2025
2030
2035
2040
An
nu
al R
eal G
DP
Gro
wth
YearObserved Forecast
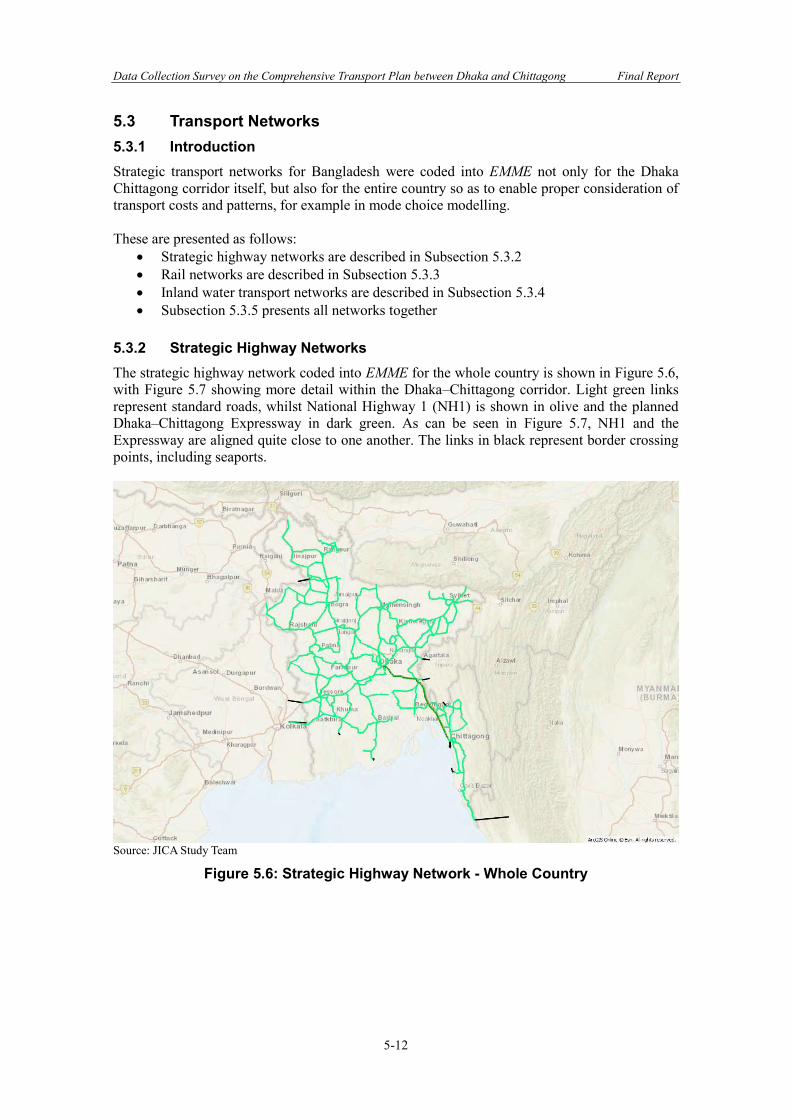
Data Collection Survey on the Comprehensive Transport Plan between Dhaka and Chittagong Final Report
5-12
5.3 Transport Networks 5.3.1 Introduction Strategic transport networks for Bangladesh were coded into EMME not only for the Dhaka Chittagong corridor itself, but also for the entire country so as to enable proper consideration of transport costs and patterns, for example in mode choice modelling. These are presented as follows:
• Strategic highway networks are described in Subsection 5.3.2 • Rail networks are described in Subsection 5.3.3 • Inland water transport networks are described in Subsection 5.3.4 • Subsection 5.3.5 presents all networks together
5.3.2 Strategic Highway Networks The strategic highway network coded into EMME for the whole country is shown in Figure 5.6, with Figure 5.7 showing more detail within the Dhaka–Chittagong corridor. Light green links represent standard roads, whilst National Highway 1 (NH1) is shown in olive and the planned Dhaka–Chittagong Expressway in dark green. As can be seen in Figure 5.7, NH1 and the Expressway are aligned quite close to one another. The links in black represent border crossing points, including seaports.
Source: JICA Study Team
Figure 5.6: Strategic Highway Network - Whole Country
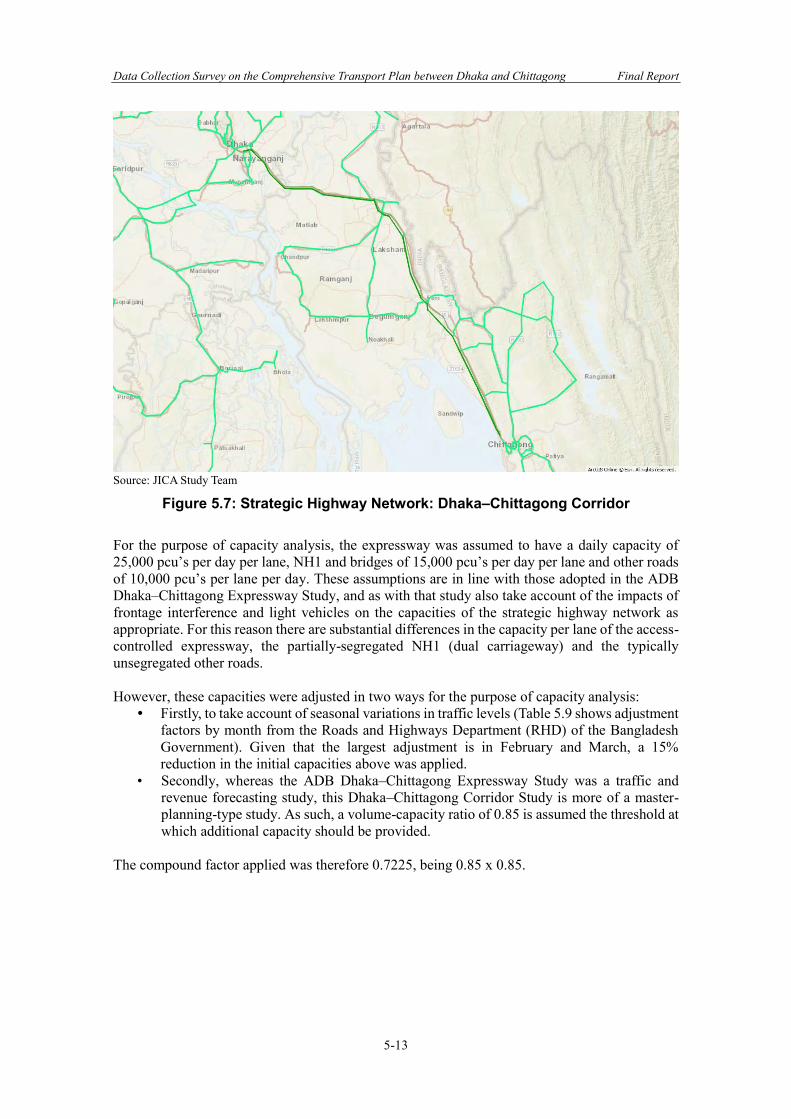
Data Collection Survey on the Comprehensive Transport Plan between Dhaka and Chittagong Final Report
5-13
Source: JICA Study Team
Figure 5.7: Strategic Highway Network: Dhaka–Chittagong Corridor For the purpose of capacity analysis, the expressway was assumed to have a daily capacity of 25,000 pcu’s per day per lane, NH1 and bridges of 15,000 pcu’s per day per lane and other roads of 10,000 pcu’s per lane per day. These assumptions are in line with those adopted in the ADB Dhaka–Chittagong Expressway Study, and as with that study also take account of the impacts of frontage interference and light vehicles on the capacities of the strategic highway network as appropriate. For this reason there are substantial differences in the capacity per lane of the access-controlled expressway, the partially-segregated NH1 (dual carriageway) and the typically unsegregated other roads. However, these capacities were adjusted in two ways for the purpose of capacity analysis:
Firstly, to take account of seasonal variations in traffic levels (Table 5.9 shows adjustment factors by month from the Roads and Highways Department (RHD) of the Bangladesh Government). Given that the largest adjustment is in February and March, a 15% reduction in the initial capacities above was applied.
• Secondly, whereas the ADB Dhaka–Chittagong Expressway Study was a traffic and revenue forecasting study, this Dhaka–Chittagong Corridor Study is more of a master-planning-type study. As such, a volume-capacity ratio of 0.85 is assumed the threshold at which additional capacity should be provided.
The compound factor applied was therefore 0.7225, being 0.85 x 0.85.
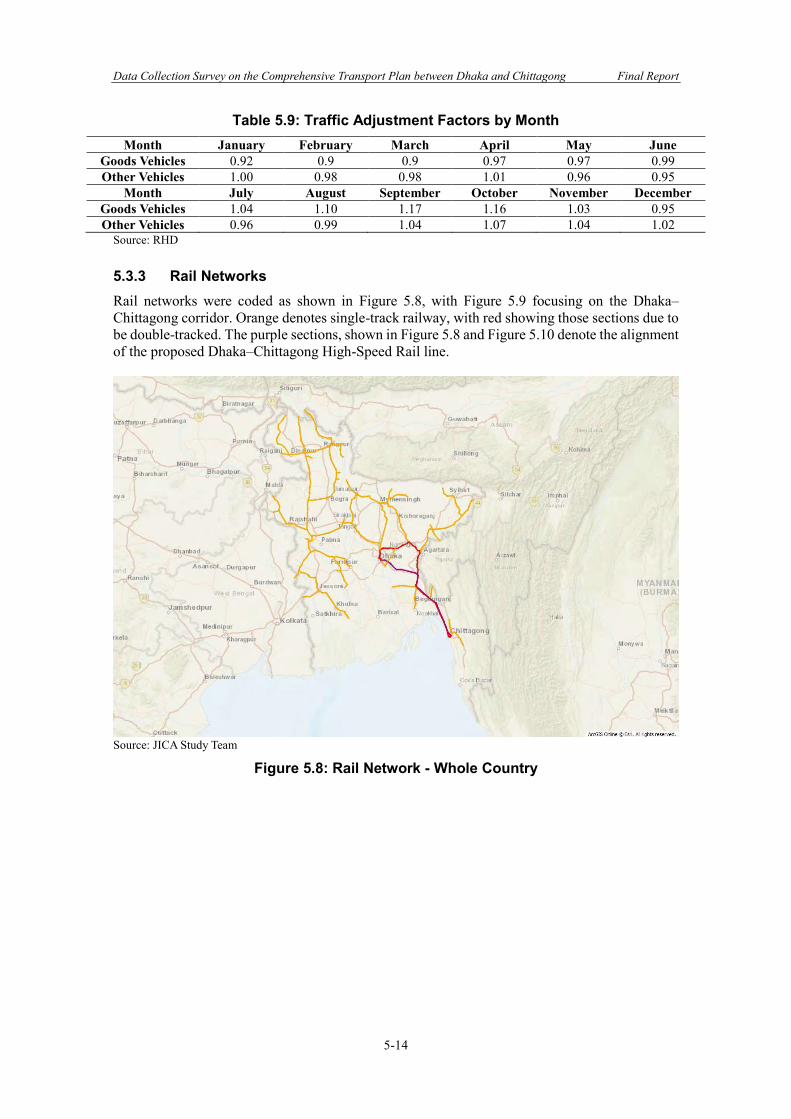
Data Collection Survey on the Comprehensive Transport Plan between Dhaka and Chittagong Final Report
5-14
Table 5.9: Traffic Adjustment Factors by Month Month January February March April May June
Goods Vehicles 0.92 0.9 0.9 0.97 0.97 0.99 Other Vehicles 1.00 0.98 0.98 1.01 0.96 0.95
Month July August September October November December Goods Vehicles 1.04 1.10 1.17 1.16 1.03 0.95 Other Vehicles 0.96 0.99 1.04 1.07 1.04 1.02
Source: RHD 5.3.3 Rail Networks Rail networks were coded as shown in Figure 5.8, with Figure 5.9 focusing on the Dhaka–Chittagong corridor. Orange denotes single-track railway, with red showing those sections due to be double-tracked. The purple sections, shown in Figure 5.8 and Figure 5.10 denote the alignment of the proposed Dhaka–Chittagong High-Speed Rail line.
Source: JICA Study Team
Figure 5.8: Rail Network - Whole Country
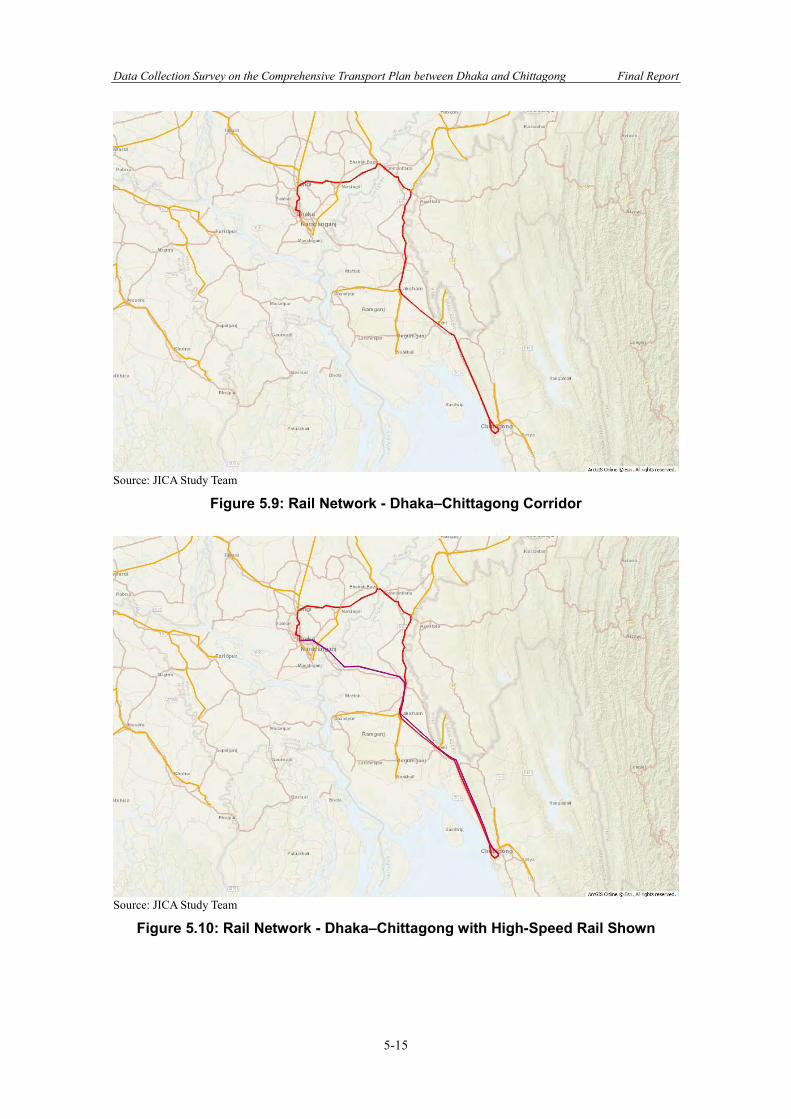
Data Collection Survey on the Comprehensive Transport Plan between Dhaka and Chittagong Final Report
5-15
Source: JICA Study Team
Figure 5.9: Rail Network - Dhaka–Chittagong Corridor
Source: JICA Study Team
Figure 5.10: Rail Network - Dhaka–Chittagong with High-Speed Rail Shown
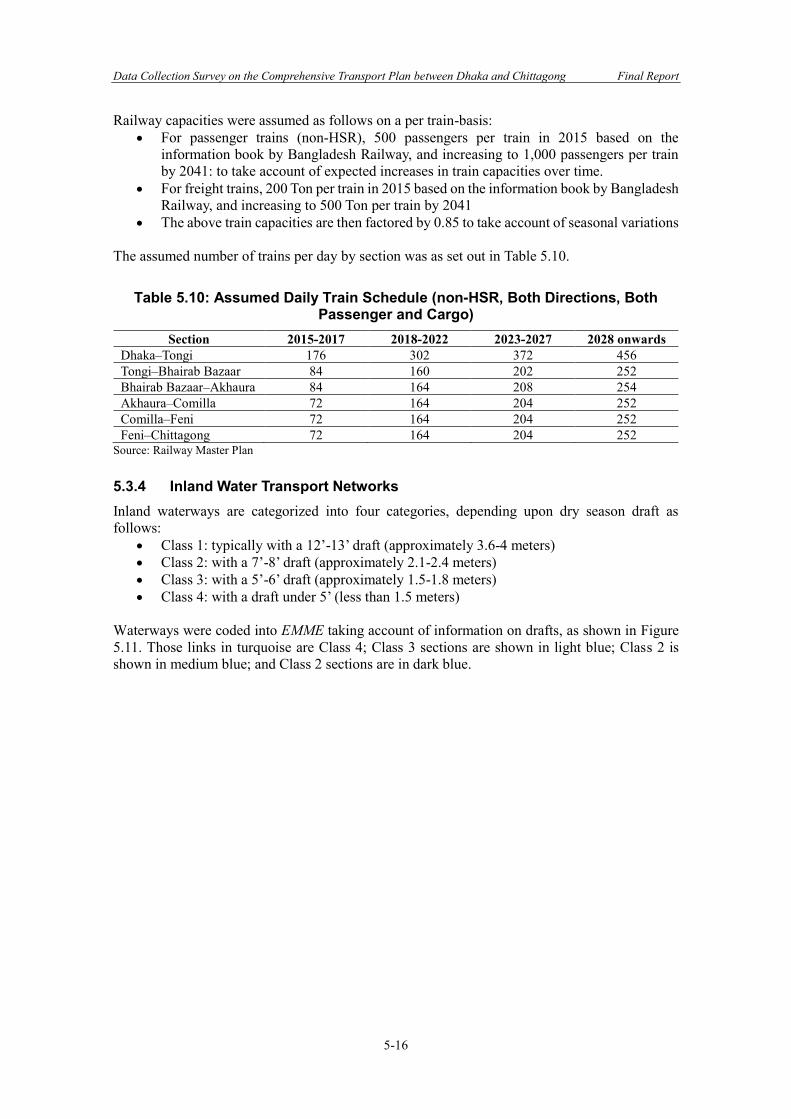
Data Collection Survey on the Comprehensive Transport Plan between Dhaka and Chittagong Final Report
5-16
Railway capacities were assumed as follows on a per train-basis: • For passenger trains (non-HSR), 500 passengers per train in 2015 based on the
information book by Bangladesh Railway, and increasing to 1,000 passengers per train by 2041: to take account of expected increases in train capacities over time.
• For freight trains, 200 Ton per train in 2015 based on the information book by Bangladesh Railway, and increasing to 500 Ton per train by 2041
• The above train capacities are then factored by 0.85 to take account of seasonal variations The assumed number of trains per day by section was as set out in Table 5.10.
Table 5.10: Assumed Daily Train Schedule (non-HSR, Both Directions, Both Passenger and Cargo)
Section 2015-2017 2018-2022 2023-2027 2028 onwards Dhaka–Tongi 176 302 372 456 Tongi–Bhairab Bazaar 84 160 202 252 Bhairab Bazaar–Akhaura 84 164 208 254 Akhaura–Comilla 72 164 204 252 Comilla–Feni 72 164 204 252 Feni–Chittagong 72 164 204 252
Source: Railway Master Plan 5.3.4 Inland Water Transport Networks Inland waterways are categorized into four categories, depending upon dry season draft as follows:
• Class 1: typically with a 12’-13’ draft (approximately 3.6-4 meters) • Class 2: with a 7’-8’ draft (approximately 2.1-2.4 meters) • Class 3: with a 5’-6’ draft (approximately 1.5-1.8 meters) • Class 4: with a draft under 5’ (less than 1.5 meters)
Waterways were coded into EMME taking account of information on drafts, as shown in Figure 5.11. Those links in turquoise are Class 4; Class 3 sections are shown in light blue; Class 2 is shown in medium blue; and Class 2 sections are in dark blue.
Data Collection Survey on the Comprehensive Transport Plan between Dhaka and Chittagong Final Report
5-17
Source: JICA Study Team
Figure 5.11: Inland and Coastal Water Transport Networks 5.3.5 Combined Transport Networks Bringing together the mode-specific networks explained above, Figure 5.12 shows the multi-modal transport networks coded for Bangladesh as a whole. Figure 5.13 shows networks for the Dhaka–Chittagong corridor itself, with further detail shown in Figure 5.14 (Dhaka and surrounding areas to Comilla) and Figure 5.15 (Comilla to Chittagong).
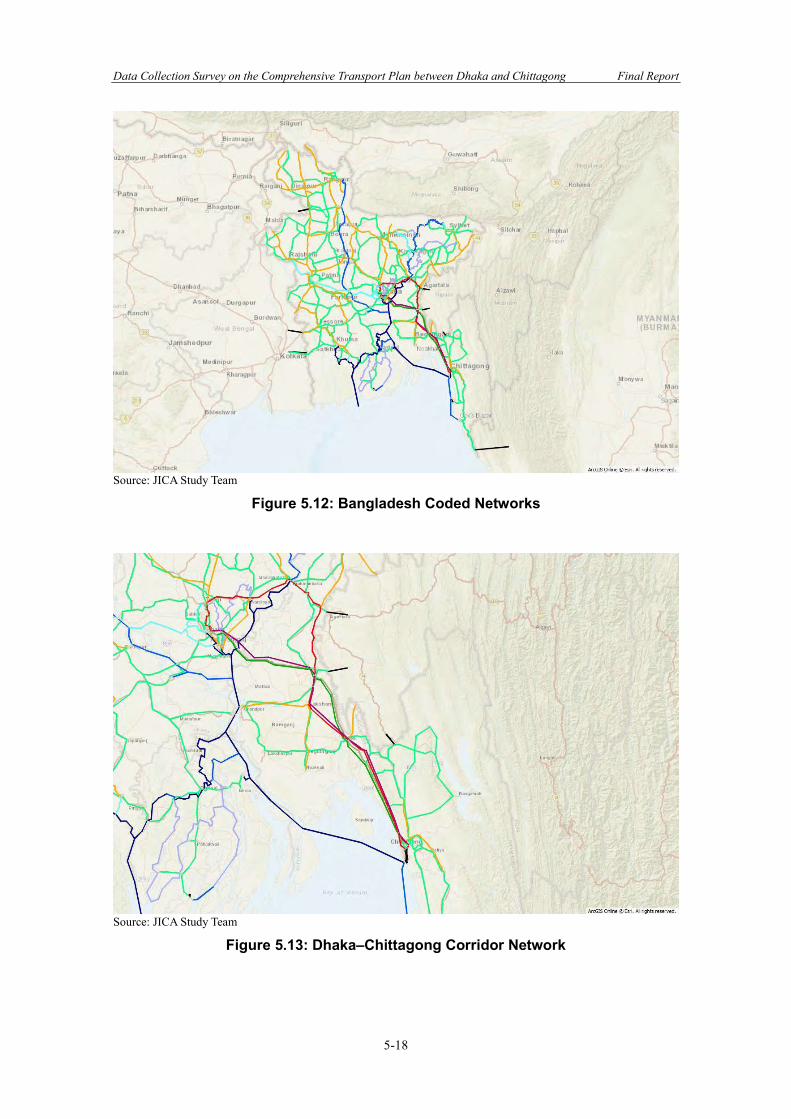
Data Collection Survey on the Comprehensive Transport Plan between Dhaka and Chittagong Final Report
5-18
Source: JICA Study Team
Figure 5.12: Bangladesh Coded Networks
Source: JICA Study Team
Figure 5.13: Dhaka–Chittagong Corridor Network
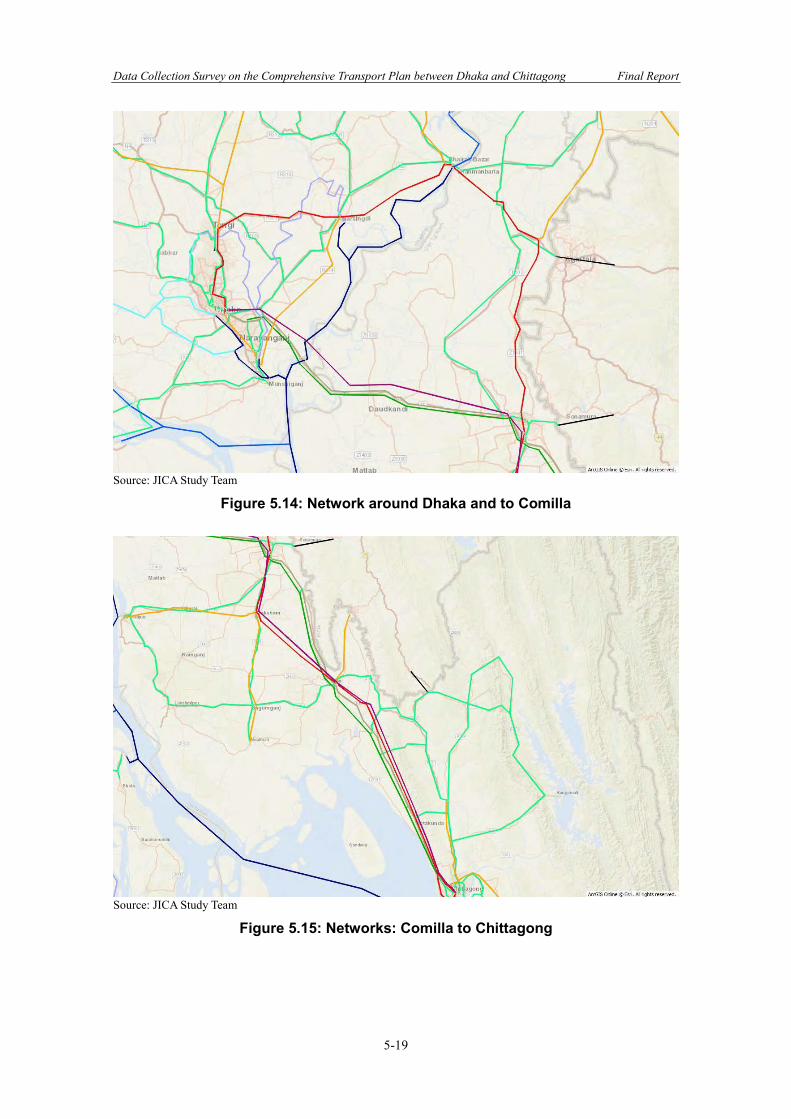
Data Collection Survey on the Comprehensive Transport Plan between Dhaka and Chittagong Final Report
5-19
Source: JICA Study Team
Figure 5.14: Network around Dhaka and to Comilla
Source: JICA Study Team
Figure 5.15: Networks: Comilla to Chittagong
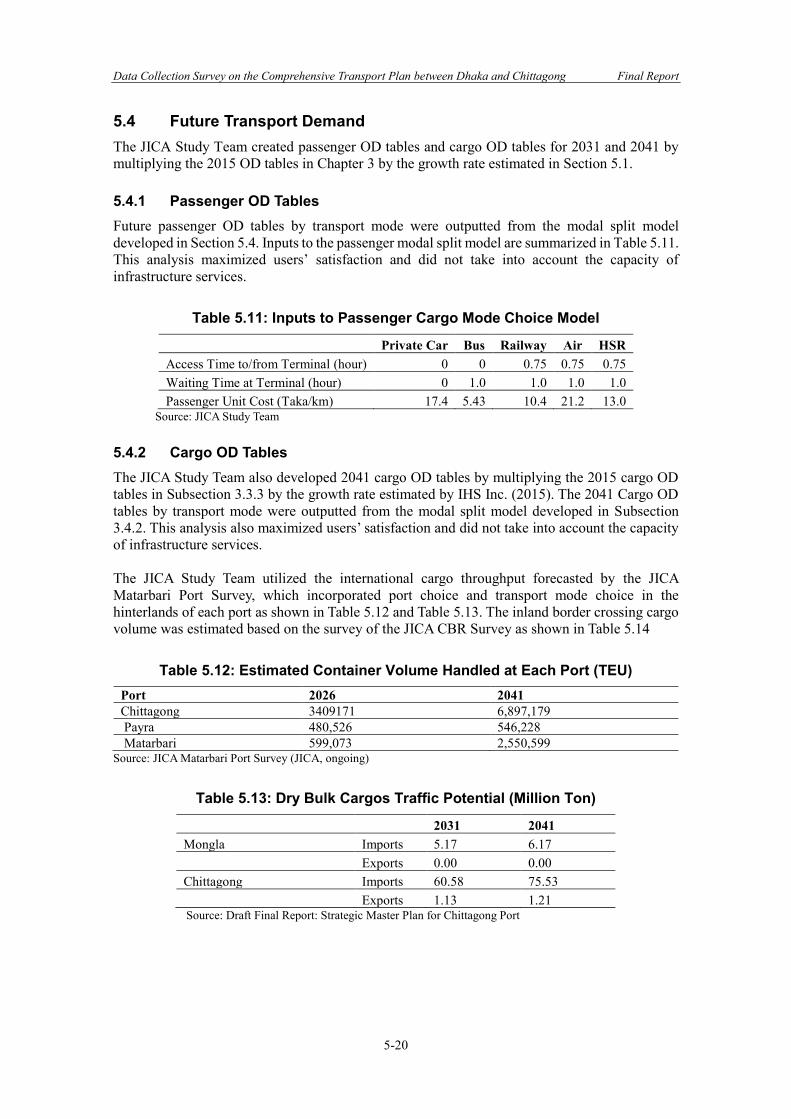
Data Collection Survey on the Comprehensive Transport Plan between Dhaka and Chittagong Final Report
5-20
5.4 Future Transport Demand The JICA Study Team created passenger OD tables and cargo OD tables for 2031 and 2041 by multiplying the 2015 OD tables in Chapter 3 by the growth rate estimated in Section 5.1. 5.4.1 Passenger OD Tables Future passenger OD tables by transport mode were outputted from the modal split model developed in Section 5.4. Inputs to the passenger modal split model are summarized in Table 5.11. This analysis maximized users’ satisfaction and did not take into account the capacity of infrastructure services.
Table 5.11: Inputs to Passenger Cargo Mode Choice Model
Private Car Bus Railway Air HSR Access Time to/from Terminal (hour) 0 0 0.75 0.75 0.75 Waiting Time at Terminal (hour) 0 1.0 1.0 1.0 1.0 Passenger Unit Cost (Taka/km) 17.4 5.43 10.4 21.2 13.0
Source: JICA Study Team 5.4.2 Cargo OD Tables The JICA Study Team also developed 2041 cargo OD tables by multiplying the 2015 cargo OD tables in Subsection 3.3.3 by the growth rate estimated by IHS Inc. (2015). The 2041 Cargo OD tables by transport mode were outputted from the modal split model developed in Subsection 3.4.2. This analysis also maximized users’ satisfaction and did not take into account the capacity of infrastructure services. The JICA Study Team utilized the international cargo throughput forecasted by the JICA Matarbari Port Survey, which incorporated port choice and transport mode choice in the hinterlands of each port as shown in Table 5.12 and Table 5.13. The inland border crossing cargo volume was estimated based on the survey of the JICA CBR Survey as shown in Table 5.14
Table 5.12: Estimated Container Volume Handled at Each Port (TEU) Port 2026 2041 Chittagong 3409171 6,897,179 Payra 480,526 546,228 Matarbari 599,073 2,550,599
Source: JICA Matarbari Port Survey (JICA, ongoing)
Table 5.13: Dry Bulk Cargos Traffic Potential (Million Ton)
2031 2041 Mongla Imports 5.17 6.17 Exports 0.00 0.00 Chittagong Imports 60.58 75.53 Exports 1.13 1.21 Source: Draft Final Report: Strategic Master Plan for Chittagong Port
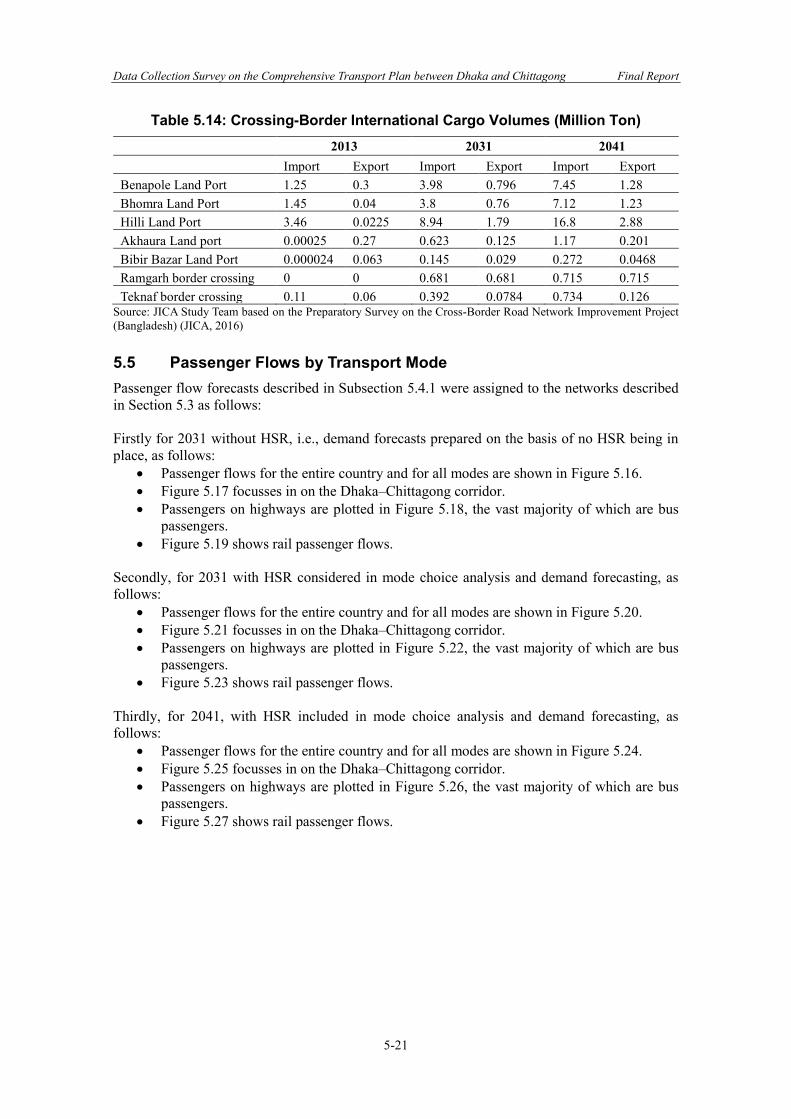
Data Collection Survey on the Comprehensive Transport Plan between Dhaka and Chittagong Final Report
5-21
Table 5.14: Crossing-Border International Cargo Volumes (Million Ton)
2013 2031 2041
Import Export Import Export Import Export Benapole Land Port 1.25 0.3 3.98 0.796 7.45 1.28 Bhomra Land Port 1.45 0.04 3.8 0.76 7.12 1.23 Hilli Land Port 3.46 0.0225 8.94 1.79 16.8 2.88 Akhaura Land port 0.00025 0.27 0.623 0.125 1.17 0.201 Bibir Bazar Land Port 0.000024 0.063 0.145 0.029 0.272 0.0468 Ramgarh border crossing 0 0 0.681 0.681 0.715 0.715 Teknaf border crossing 0.11 0.06 0.392 0.0784 0.734 0.126
Source: JICA Study Team based on the Preparatory Survey on the Cross-Border Road Network Improvement Project (Bangladesh) (JICA, 2016) 5.5 Passenger Flows by Transport Mode Passenger flow forecasts described in Subsection 5.4.1 were assigned to the networks described in Section 5.3 as follows: Firstly for 2031 without HSR, i.e., demand forecasts prepared on the basis of no HSR being in place, as follows:
• Passenger flows for the entire country and for all modes are shown in Figure 5.16. • Figure 5.17 focusses in on the Dhaka–Chittagong corridor. • Passengers on highways are plotted in Figure 5.18, the vast majority of which are bus
passengers. • Figure 5.19 shows rail passenger flows.
Secondly, for 2031 with HSR considered in mode choice analysis and demand forecasting, as follows:
• Passenger flows for the entire country and for all modes are shown in Figure 5.20. • Figure 5.21 focusses in on the Dhaka–Chittagong corridor. • Passengers on highways are plotted in Figure 5.22, the vast majority of which are bus
passengers. • Figure 5.23 shows rail passenger flows.
Thirdly, for 2041, with HSR included in mode choice analysis and demand forecasting, as follows:
• Passenger flows for the entire country and for all modes are shown in Figure 5.24. • Figure 5.25 focusses in on the Dhaka–Chittagong corridor. • Passengers on highways are plotted in Figure 5.26, the vast majority of which are bus
passengers. • Figure 5.27 shows rail passenger flows.
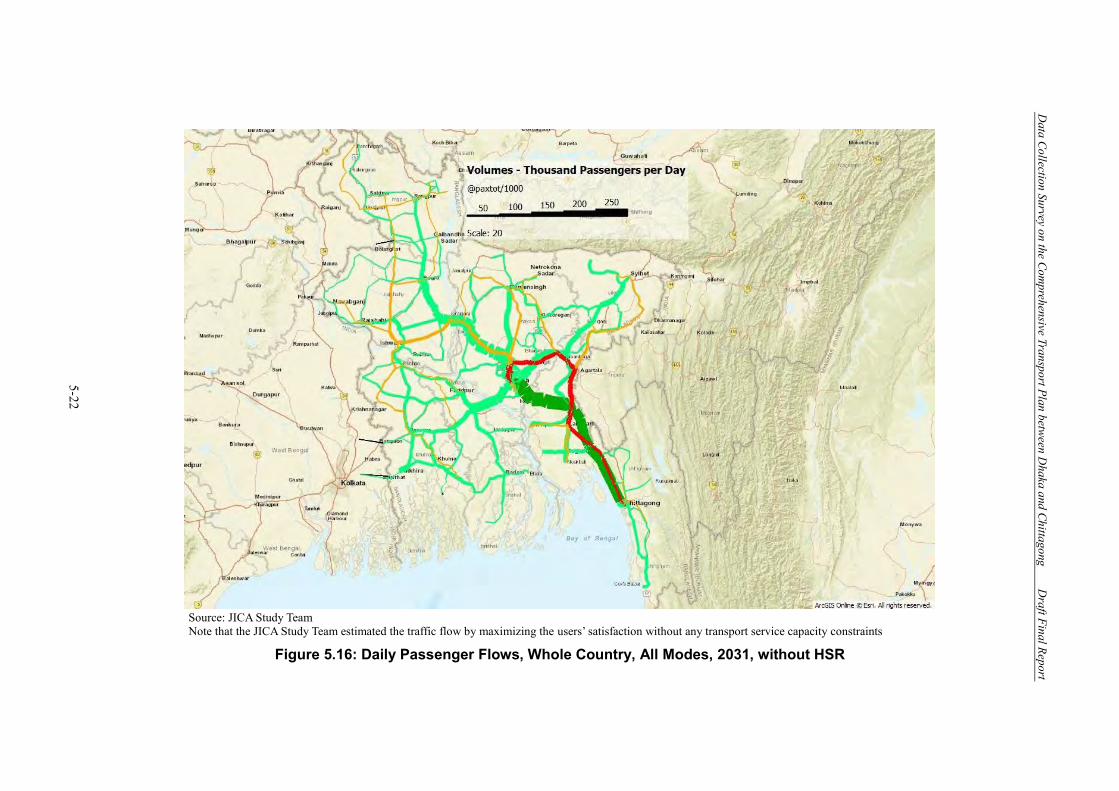
Data Collection Survey on the Com
prehensive Transport Plan between Dhaka and Chittagong
Draft Final Report
5-22
Source: JICA Study Team Note that the JICA Study Team estimated the traffic flow by maximizing the users’ satisfaction without any transport service capacity constraints
Figure 5.16: Daily Passenger Flows, Whole Country, All Modes, 2031, without HSR
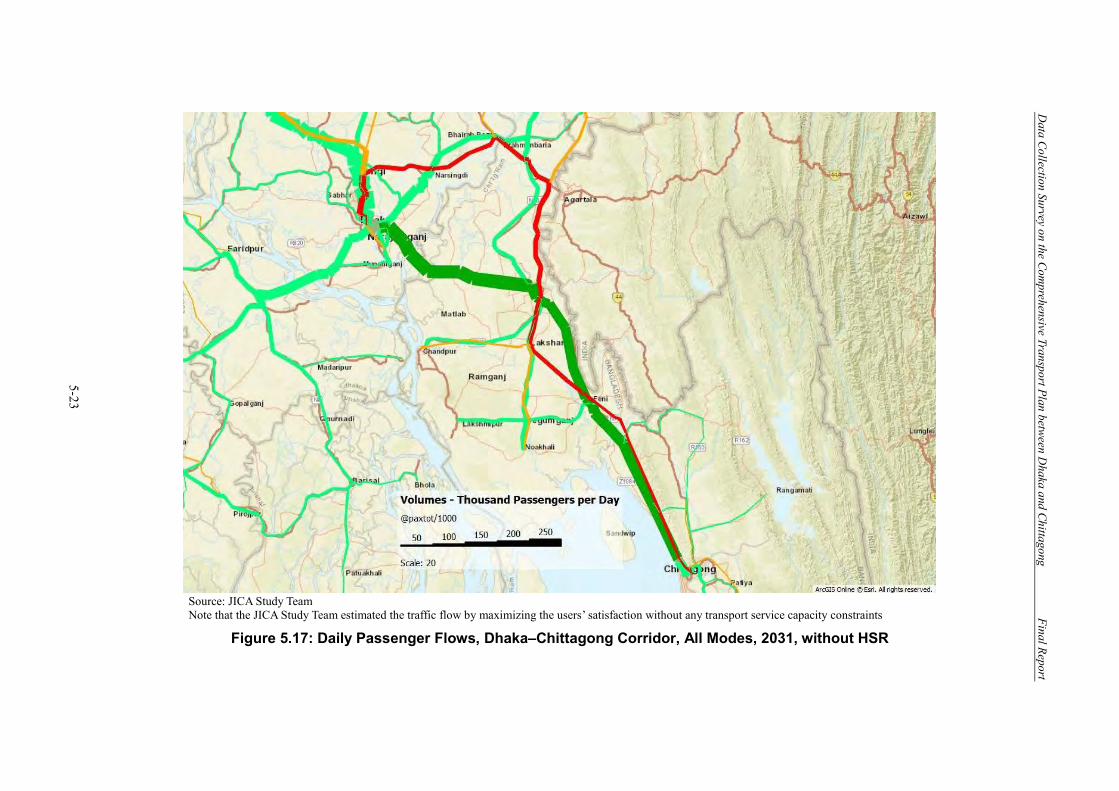
Data Collection Survey on the Com
prehensive Transport Plan between Dhaka and Chittagong
Final Report
5-23
Source: JICA Study Team Note that the JICA Study Team estimated the traffic flow by maximizing the users’ satisfaction without any transport service capacity constraints
Figure 5.17: Daily Passenger Flows, Dhaka–Chittagong Corridor, All Modes, 2031, without HSR
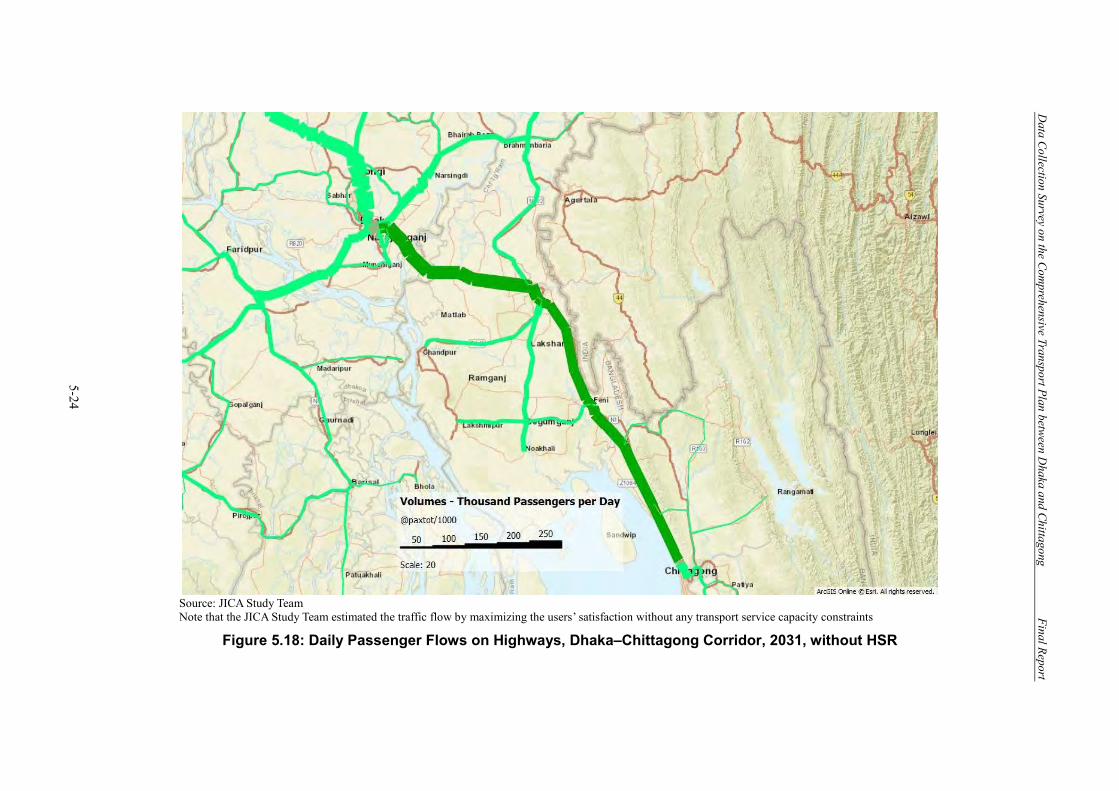
Data Collection Survey on the Com
prehensive Transport Plan between Dhaka and Chittagong
Final Report
5-24
Source: JICA Study Team Note that the JICA Study Team estimated the traffic flow by maximizing the users’ satisfaction without any transport service capacity constraints
Figure 5.18: Daily Passenger Flows on Highways, Dhaka–Chittagong Corridor, 2031, without HSR

Data Collection Survey on the Com
prehensive Transport Plan between Dhaka and Chittagong
Final Report
5-25
Source: JICA Study Team Note that the JICA Study Team estimated the traffic flow by maximizing the users’ satisfaction without any transport service capacity constraints
Figure 5.19: Daily Passenger Flows on Railways, Dhaka–Chittagong Corridor, 2031, without HSR
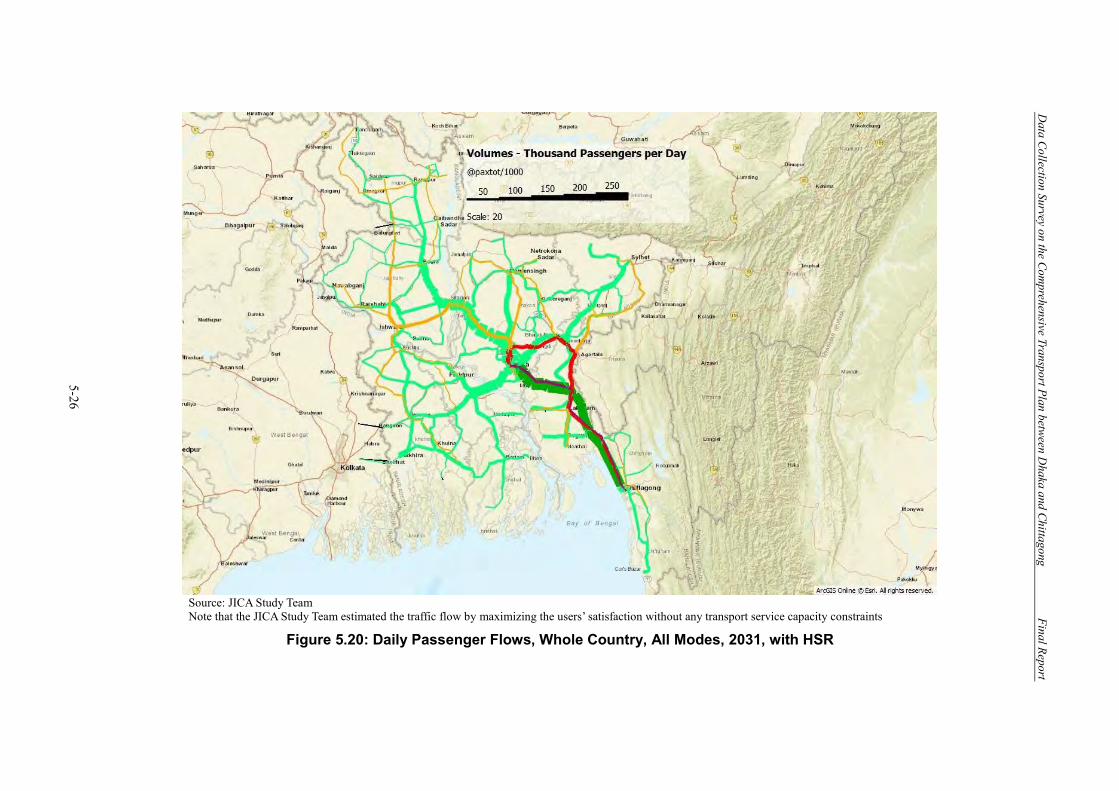
Data Collection Survey on the Com
prehensive Transport Plan between Dhaka and Chittagong
Final Report
5-26
Source: JICA Study Team Note that the JICA Study Team estimated the traffic flow by maximizing the users’ satisfaction without any transport service capacity constraints
Figure 5.20: Daily Passenger Flows, Whole Country, All Modes, 2031, with HSR
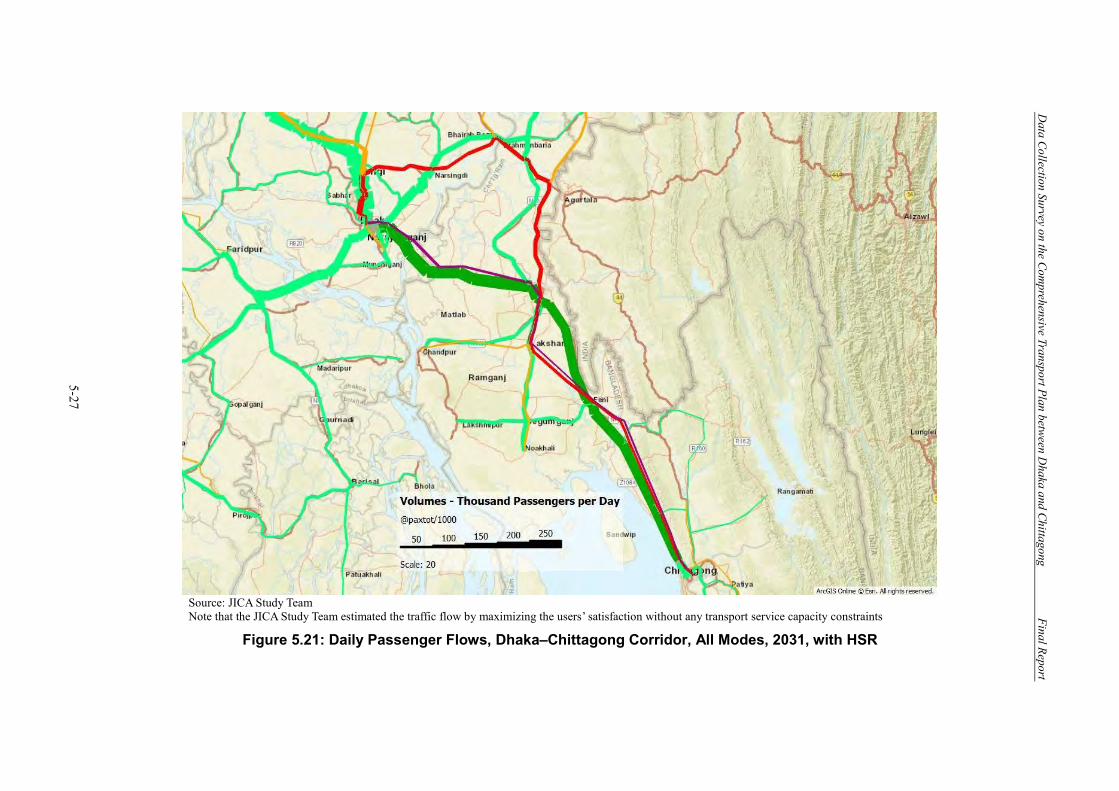
Data Collection Survey on the Com
prehensive Transport Plan between Dhaka and Chittagong
Final Report
5-27
Source: JICA Study Team Note that the JICA Study Team estimated the traffic flow by maximizing the users’ satisfaction without any transport service capacity constraints
Figure 5.21: Daily Passenger Flows, Dhaka–Chittagong Corridor, All Modes, 2031, with HSR
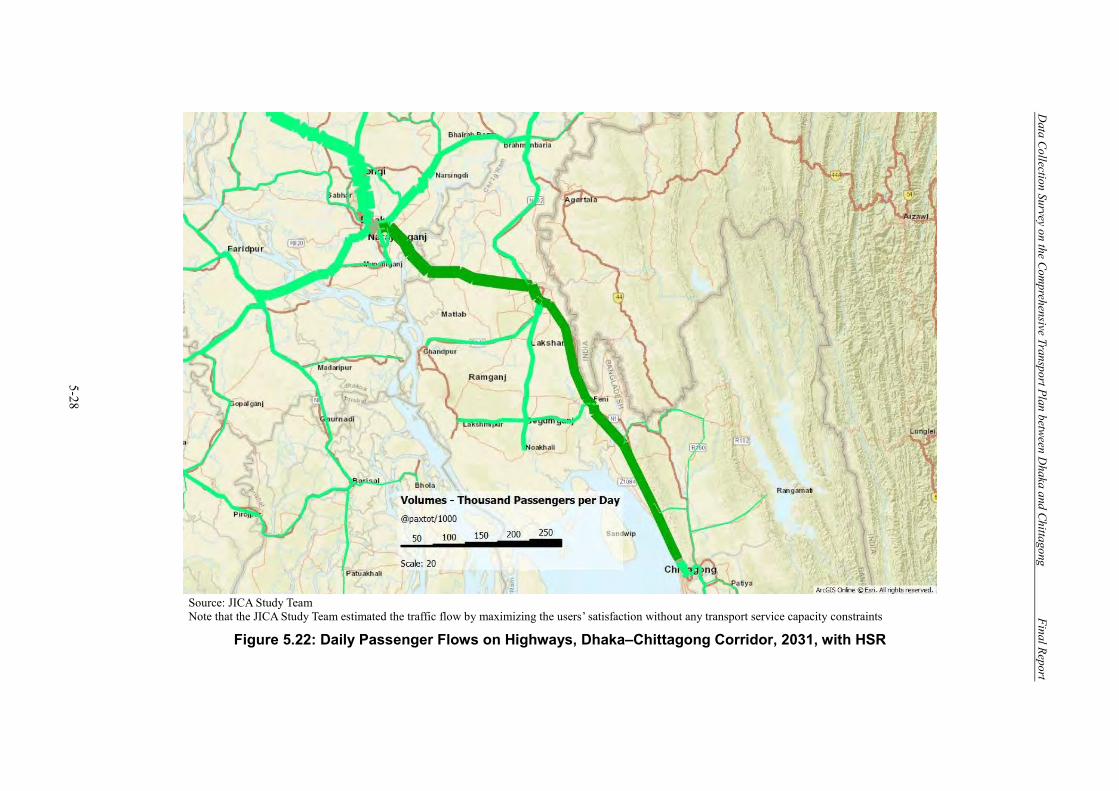
Data Collection Survey on the Com
prehensive Transport Plan between Dhaka and Chittagong
Final Report
5-28
Source: JICA Study Team Note that the JICA Study Team estimated the traffic flow by maximizing the users’ satisfaction without any transport service capacity constraints
Figure 5.22: Daily Passenger Flows on Highways, Dhaka–Chittagong Corridor, 2031, with HSR
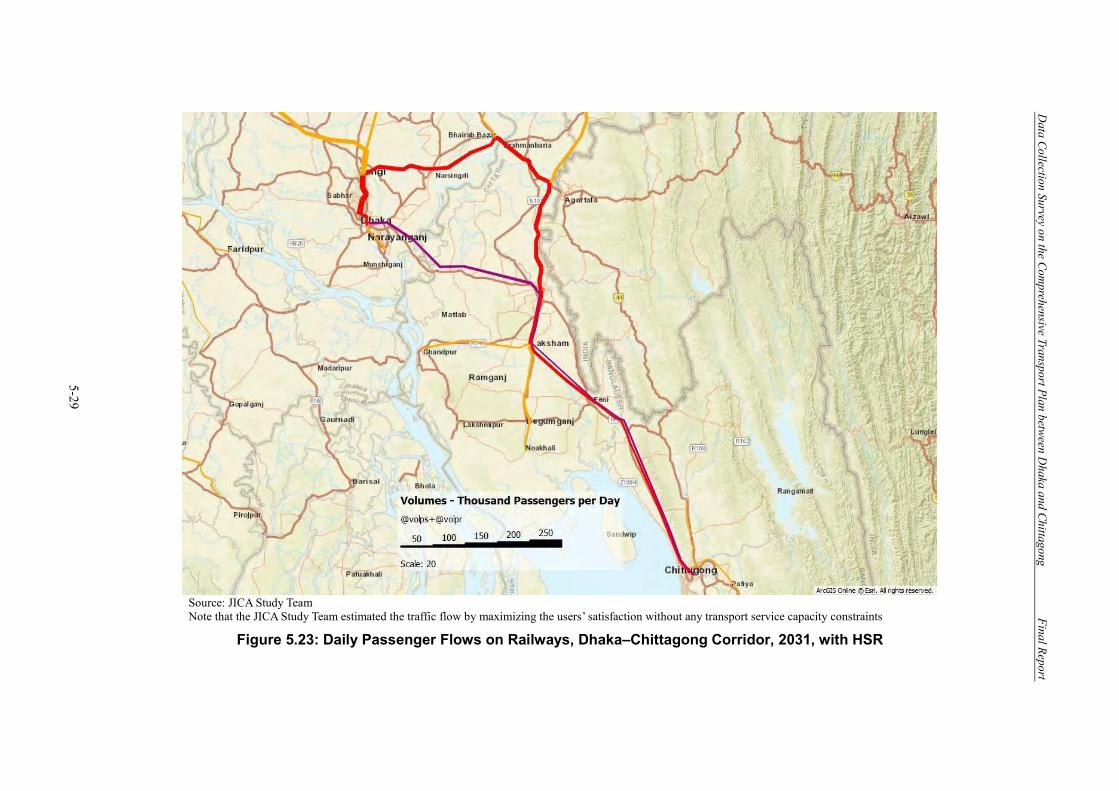
Data Collection Survey on the Com
prehensive Transport Plan between Dhaka and Chittagong
Final Report
5-29
Source: JICA Study Team Note that the JICA Study Team estimated the traffic flow by maximizing the users’ satisfaction without any transport service capacity constraints
Figure 5.23: Daily Passenger Flows on Railways, Dhaka–Chittagong Corridor, 2031, with HSR
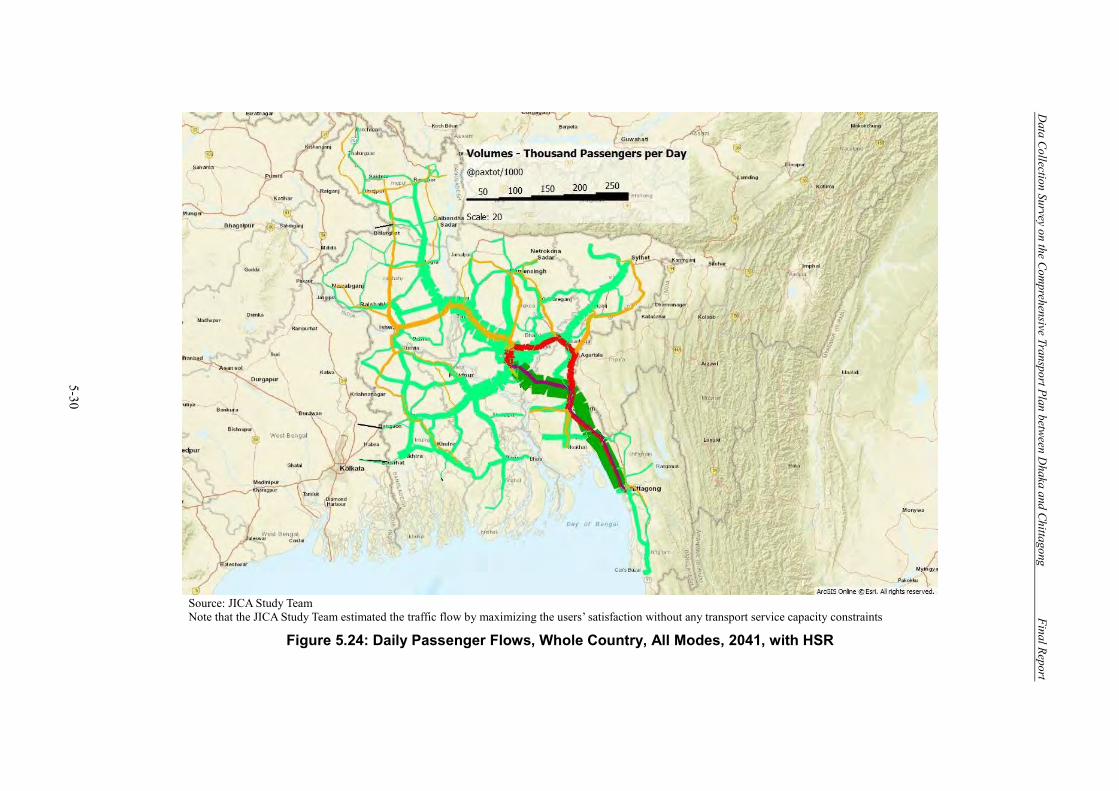
Data Collection Survey on the Com
prehensive Transport Plan between Dhaka and Chittagong
Final Report
5-30
Source: JICA Study Team Note that the JICA Study Team estimated the traffic flow by maximizing the users’ satisfaction without any transport service capacity constraints
Figure 5.24: Daily Passenger Flows, Whole Country, All Modes, 2041, with HSR
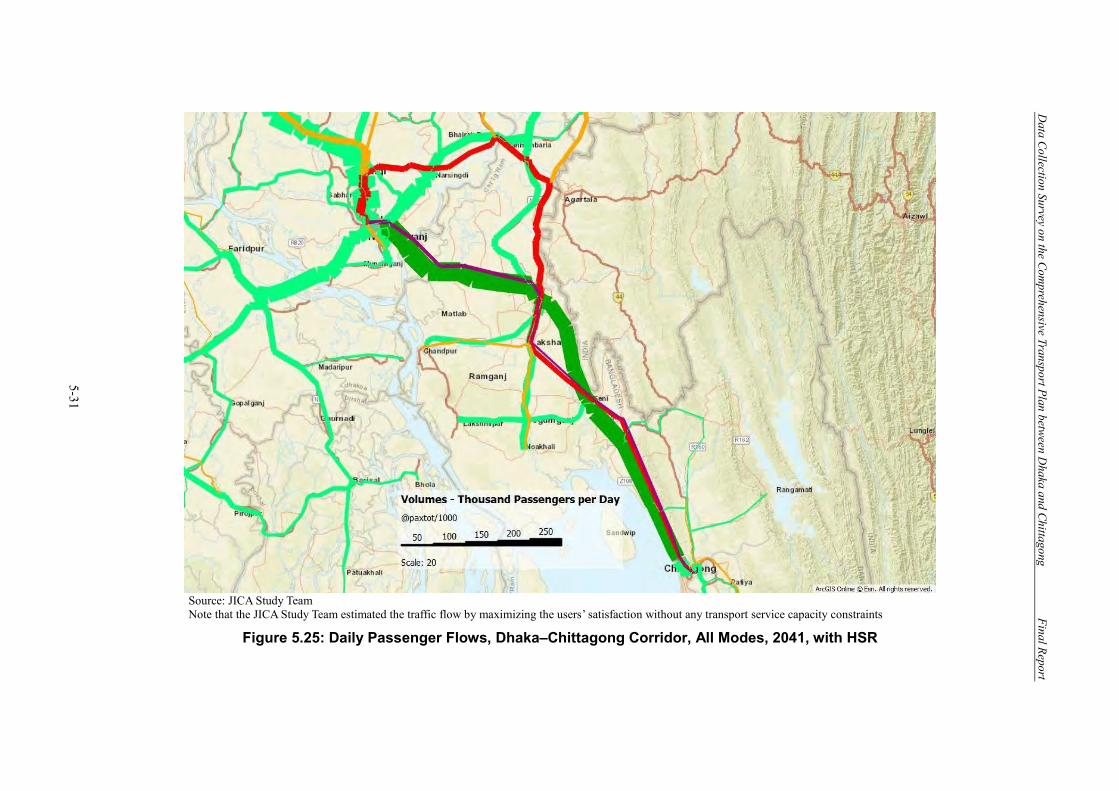
Data Collection Survey on the Com
prehensive Transport Plan between Dhaka and Chittagong
Final Report
5-31
Source: JICA Study Team Note that the JICA Study Team estimated the traffic flow by maximizing the users’ satisfaction without any transport service capacity constraints
Figure 5.25: Daily Passenger Flows, Dhaka–Chittagong Corridor, All Modes, 2041, with HSR
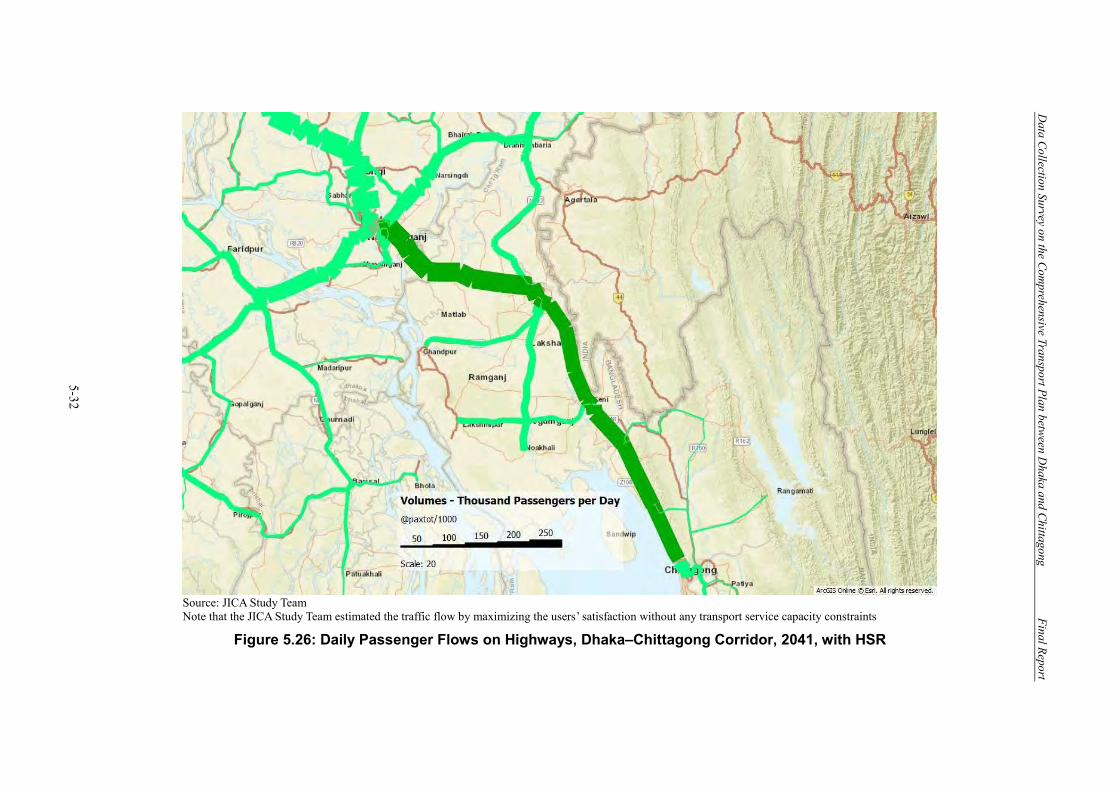
Data Collection Survey on the Com
prehensive Transport Plan between Dhaka and Chittagong
Final Report
5-32
Source: JICA Study Team Note that the JICA Study Team estimated the traffic flow by maximizing the users’ satisfaction without any transport service capacity constraints
Figure 5.26: Daily Passenger Flows on Highways, Dhaka–Chittagong Corridor, 2041, with HSR
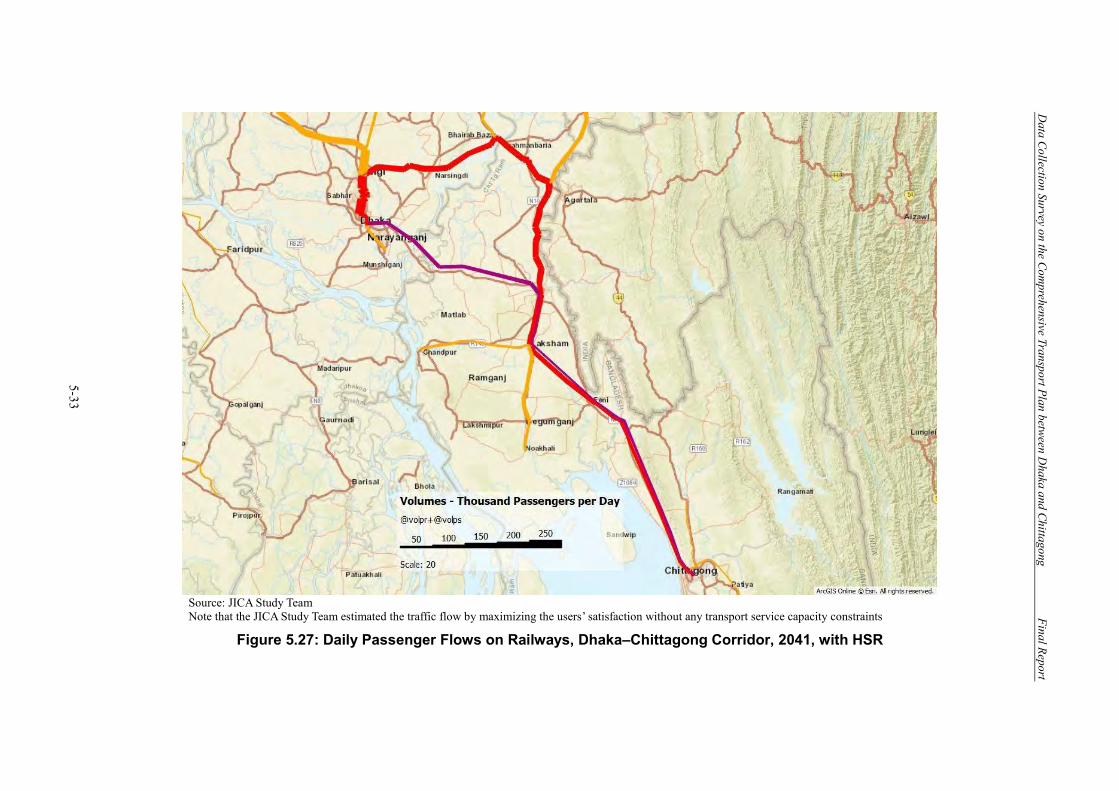
Data Collection Survey on the Com
prehensive Transport Plan between Dhaka and Chittagong
Final Report
5-33
Source: JICA Study Team Note that the JICA Study Team estimated the traffic flow by maximizing the users’ satisfaction without any transport service capacity constraints
Figure 5.27: Daily Passenger Flows on Railways, Dhaka–Chittagong Corridor, 2041, with HSR
Data Collection Survey on the Comprehensive Transport Plan between Dhaka and Chittagong Final Report
5-34
5.6 Cargo Flows by Transport Mode Passenger flow forecasts described in Section 5.4.1 were assigned to the networks described in Section 5.3 as follows: Firstly for 2031, as follows:
• Cargo flows for the entire country and for all modes are shown in Figure 5.28. • Figure 5.29 focusses in on the Dhaka-Chittagong corridor. • Tonnages on highways are plotted in Figure 5.30. • Figure 5.31 shows rail cargo flows. • Inland water cargo tonnages are shown in Figure 5.32.
Note that as High-Speed Rail is a passenger-only mode, it does not affect freight mode share. And secondly, for 2041, as follows:
• Cargo flows for the entire country and for all modes are shown in Figure 5.33. • Figure 5.34 focusses in on the Dhaka-Chittagong corridor. • Tonnages on highways are plotted in Figure 5.35. • Figure 5.36 shows rail cargo flows. • Inland water cargo tonnages are shown in Figure 5.37.
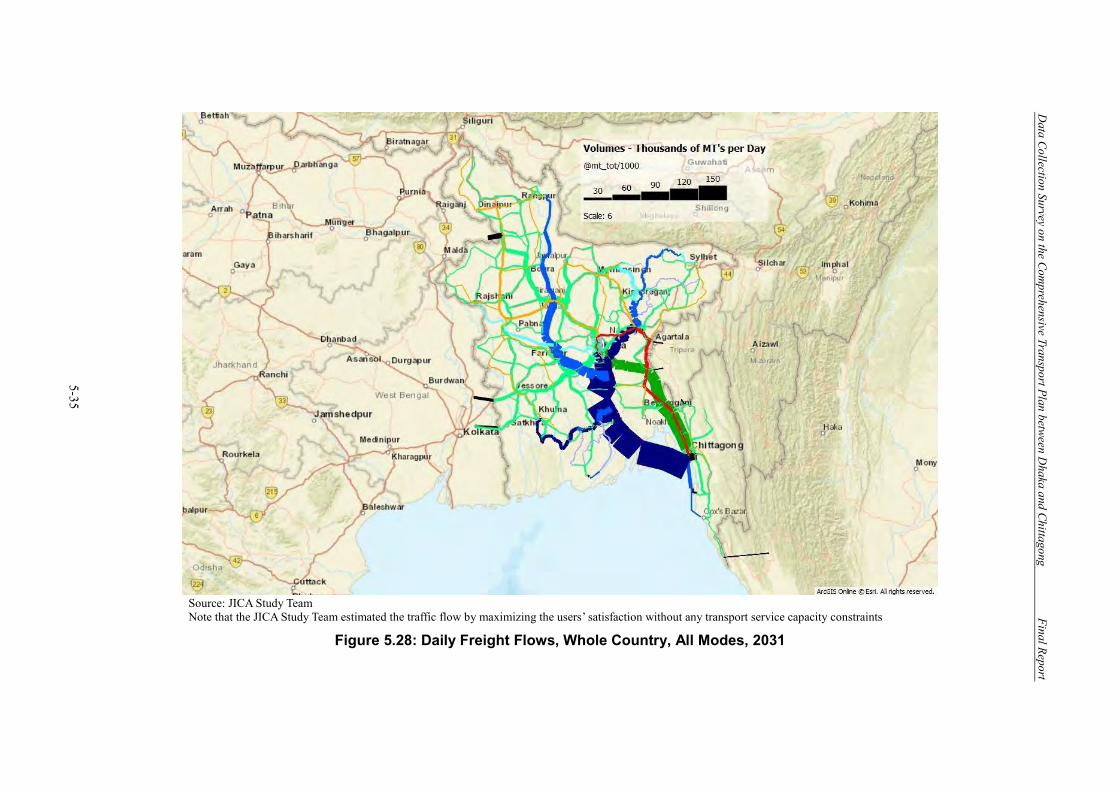
Data Collection Survey on the Com
prehensive Transport Plan between Dhaka and Chittagong
Final Report
5-35
Source: JICA Study Team Note that the JICA Study Team estimated the traffic flow by maximizing the users’ satisfaction without any transport service capacity constraints
Figure 5.28: Daily Freight Flows, Whole Country, All Modes, 2031
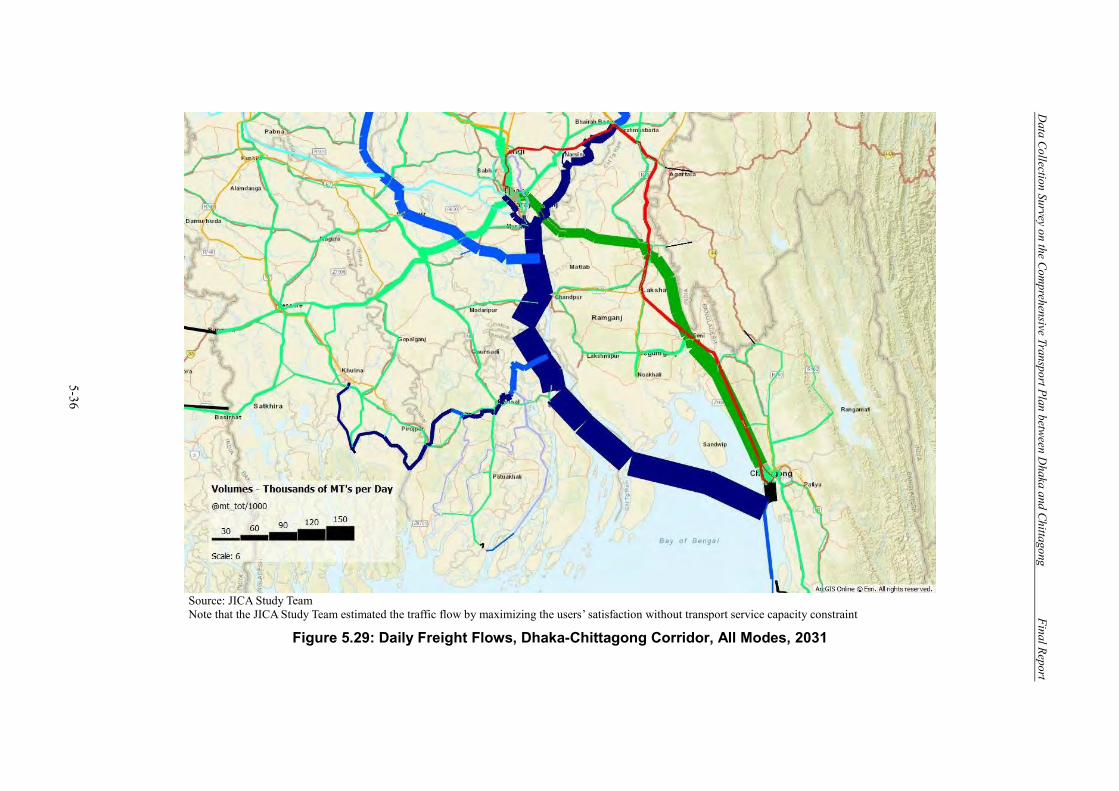
Data Collection Survey on the Com
prehensive Transport Plan between Dhaka and Chittagong
Final Report
5-36
Source: JICA Study Team Note that the JICA Study Team estimated the traffic flow by maximizing the users’ satisfaction without transport service capacity constraint
Figure 5.29: Daily Freight Flows, Dhaka-Chittagong Corridor, All Modes, 2031
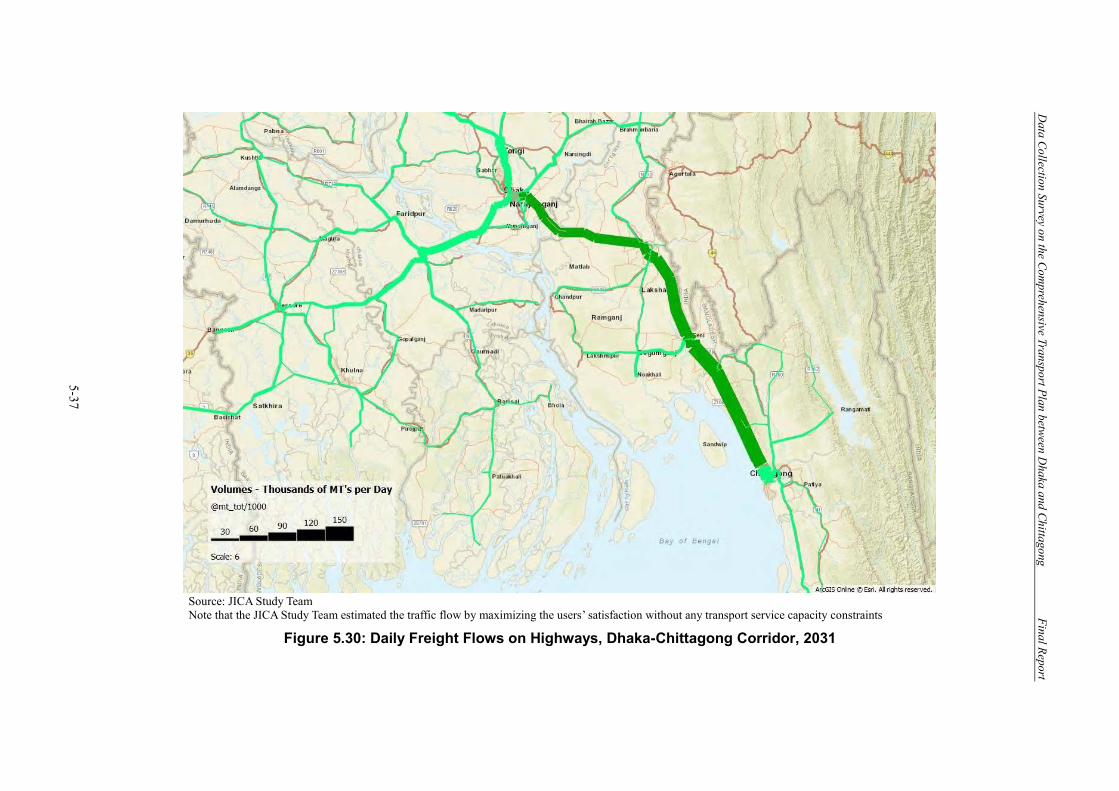
Data Collection Survey on the Com
prehensive Transport Plan between Dhaka and Chittagong
Final Report
5-37
Source: JICA Study Team Note that the JICA Study Team estimated the traffic flow by maximizing the users’ satisfaction without any transport service capacity constraints
Figure 5.30: Daily Freight Flows on Highways, Dhaka-Chittagong Corridor, 2031
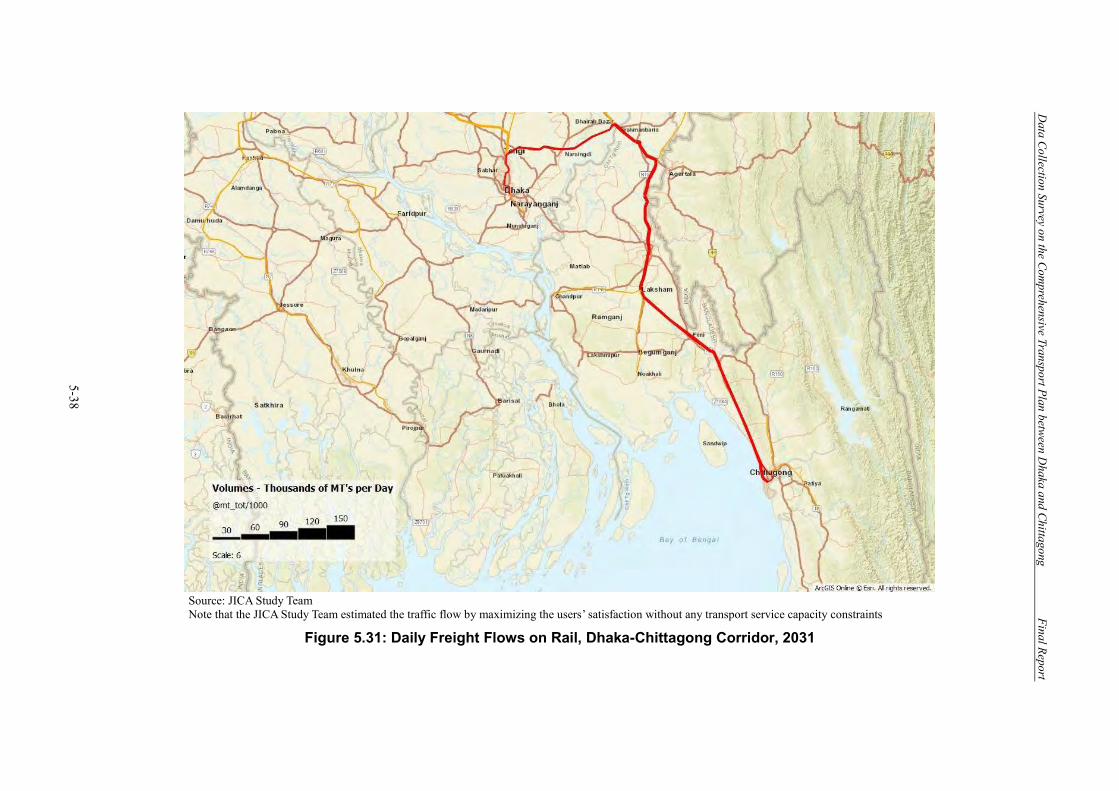
Data Collection Survey on the Com
prehensive Transport Plan between Dhaka and Chittagong
Final Report
5-38
Source: JICA Study Team Note that the JICA Study Team estimated the traffic flow by maximizing the users’ satisfaction without any transport service capacity constraints
Figure 5.31: Daily Freight Flows on Rail, Dhaka-Chittagong Corridor, 2031
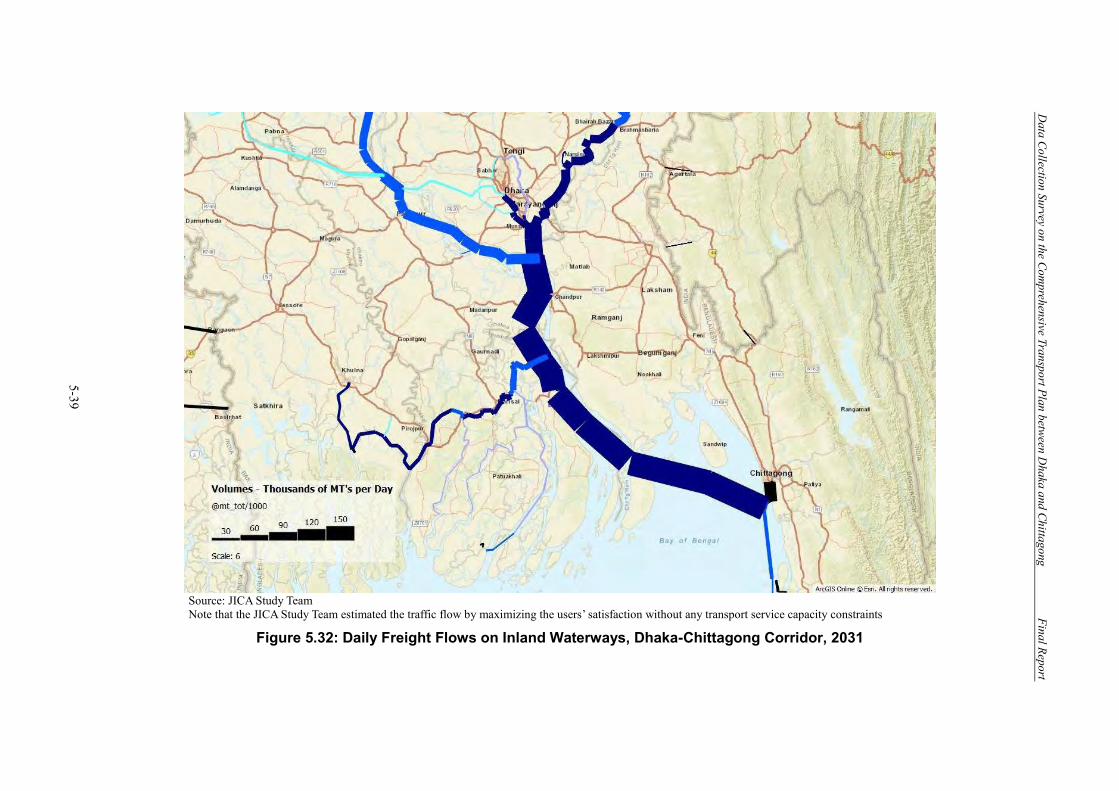
Data Collection Survey on the Com
prehensive Transport Plan between Dhaka and Chittagong
Final Report
5-39
Source: JICA Study Team Note that the JICA Study Team estimated the traffic flow by maximizing the users’ satisfaction without any transport service capacity constraints
Figure 5.32: Daily Freight Flows on Inland Waterways, Dhaka-Chittagong Corridor, 2031
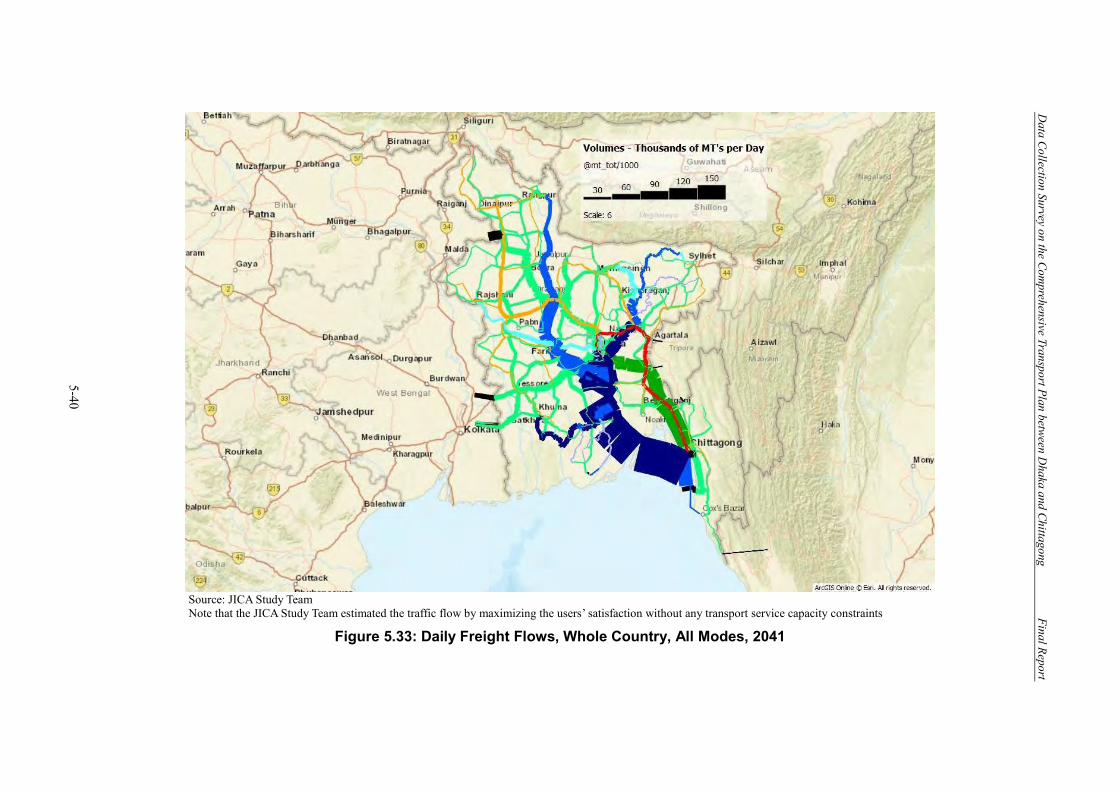
Data Collection Survey on the Com
prehensive Transport Plan between Dhaka and Chittagong
Final Report
5-40
Source: JICA Study Team Note that the JICA Study Team estimated the traffic flow by maximizing the users’ satisfaction without any transport service capacity constraints
Figure 5.33: Daily Freight Flows, Whole Country, All Modes, 2041
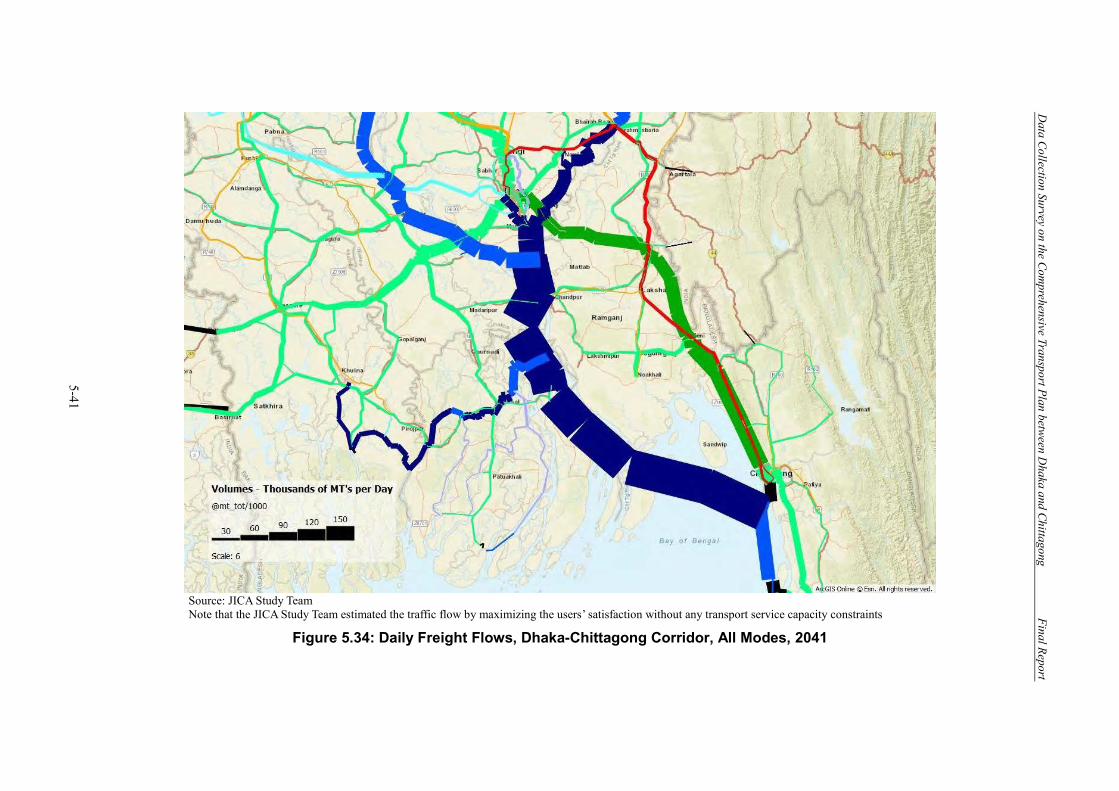
Data Collection Survey on the Com
prehensive Transport Plan between Dhaka and Chittagong
Final Report
5-41
Source: JICA Study Team Note that the JICA Study Team estimated the traffic flow by maximizing the users’ satisfaction without any transport service capacity constraints
Figure 5.34: Daily Freight Flows, Dhaka-Chittagong Corridor, All Modes, 2041
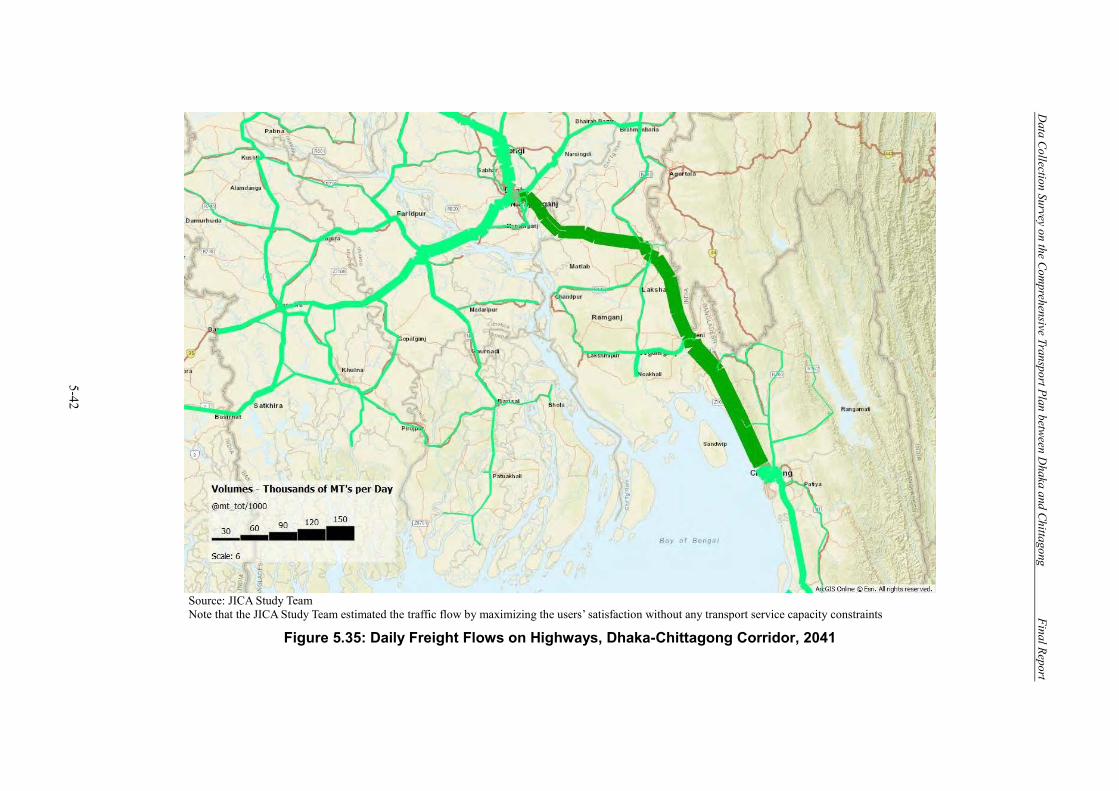
Data Collection Survey on the Com
prehensive Transport Plan between Dhaka and Chittagong
Final Report
5-42
Source: JICA Study Team Note that the JICA Study Team estimated the traffic flow by maximizing the users’ satisfaction without any transport service capacity constraints
Figure 5.35: Daily Freight Flows on Highways, Dhaka-Chittagong Corridor, 2041
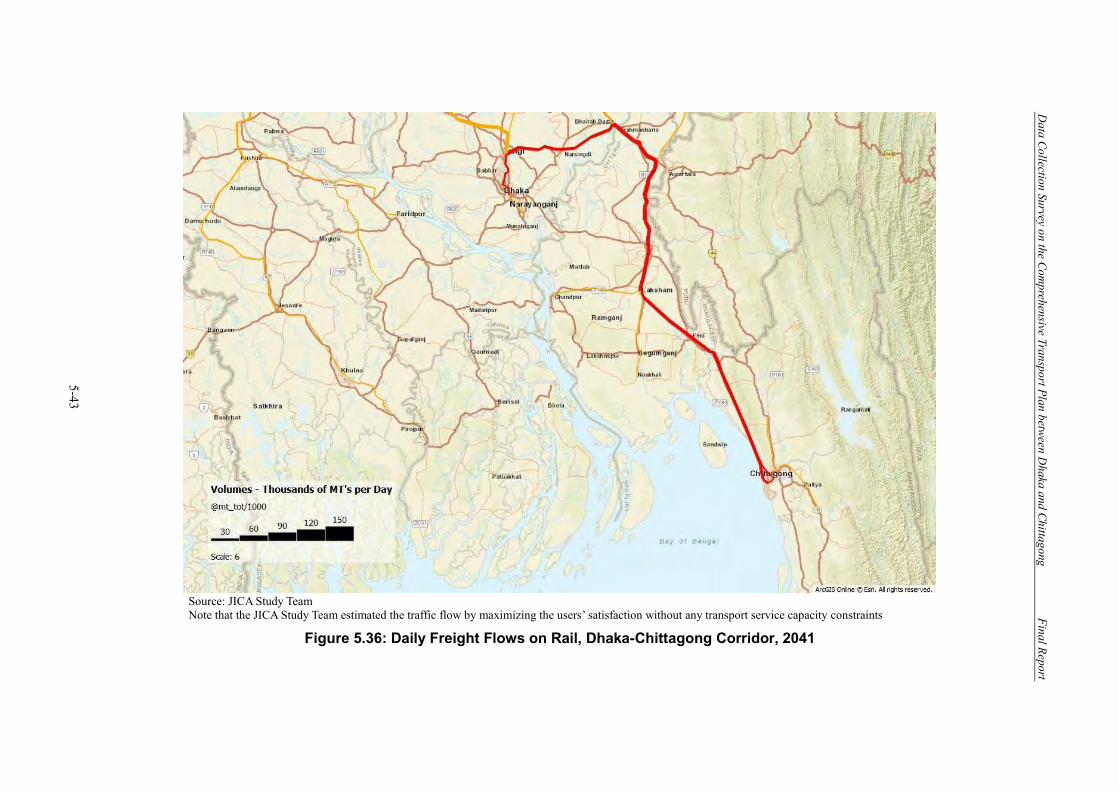
Data Collection Survey on the Com
prehensive Transport Plan between Dhaka and Chittagong
Final Report
5-43
Source: JICA Study Team Note that the JICA Study Team estimated the traffic flow by maximizing the users’ satisfaction without any transport service capacity constraints
Figure 5.36: Daily Freight Flows on Rail, Dhaka-Chittagong Corridor, 2041
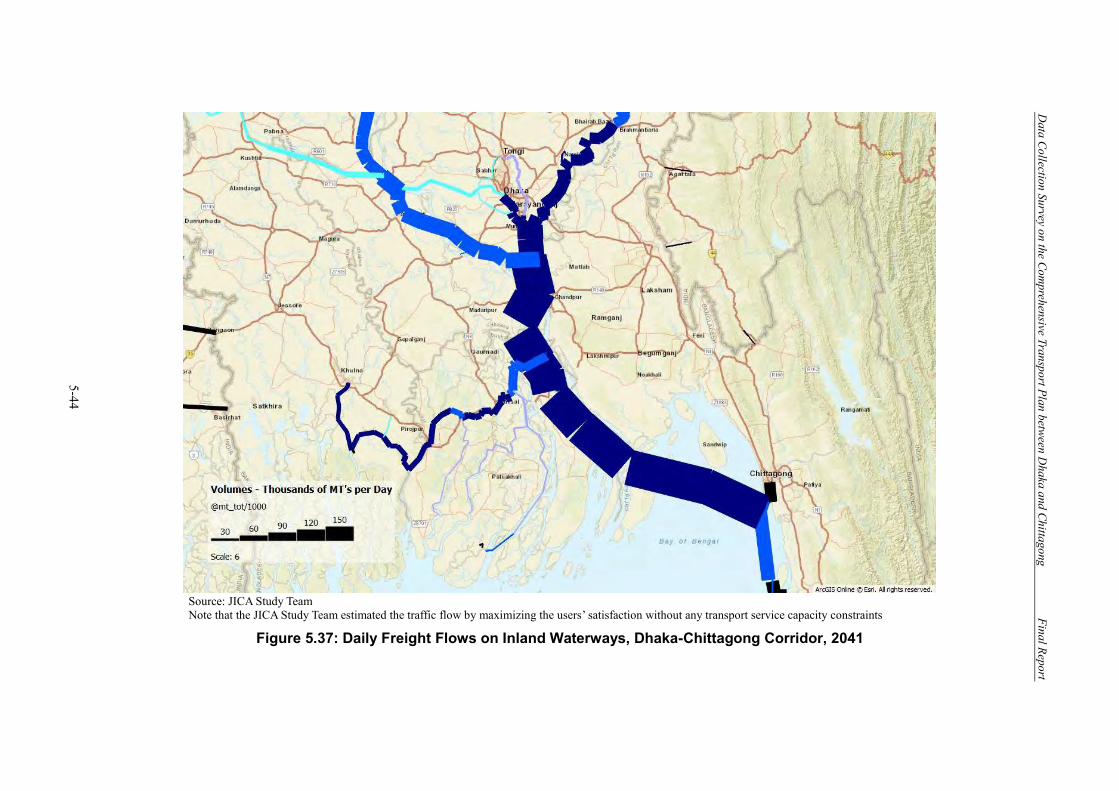
Data Collection Survey on the Com
prehensive Transport Plan between Dhaka and Chittagong
Final Report
5-44
Source: JICA Study Team Note that the JICA Study Team estimated the traffic flow by maximizing the users’ satisfaction without any transport service capacity constraints
Figure 5.37: Daily Freight Flows on Inland Waterways, Dhaka-Chittagong Corridor, 2041
Data Collection Survey on the Comprehensive Transport Plan between Dhaka and Chittagong Final Report
6-1
6. Transport Development Plan
6.1 Overview This chapter sets out a major output of the Survey: the formulation of a phased multimodal transport development plan for unleashing the development potential along the Dhaka–Chittagong corridor. The transport development plan is prepared following (i) the identification of transport infrastructure projects (roads, rail, and inland water) needed for the corridor development, and (ii) the evaluation of the planned and proposed projects using multi-criteria analysis. This plan includes short-term, medium-term, and long-term development initiatives and projects.31 In summary, the key steps involved in preparing the transport development plan are as follows:
(i) Identification of projects: Transport infrastructure projects (roads, rail, and inland water) needed for the Dhaka–Chittagong corridor were identified based on the ongoing and planned project plans, future transport network, and demand forecast results.
(ii) Evaluation of projects: The projects identified above (except those under implementation) were evaluated and prioritized using the following evaluation indicators: (i) urgency, (ii) (potential) effect, (iii) implementability, and (iv) environmental and social considerations.
(iii) Preparation of phased development plan: The short-term, medium-term, and long-term phased multimodal transport development plan was formulated based on the above evaluation of planned and proposed projects.
6.2 Roads 6.2.1 Identification of Projects Outlined in Table 6.1 is a summary of road infrastructure projects, identified through stakeholder consultation and a review of existing studies. These projects include expressways, roads, bridges, tunnels, and other. While the bridges and tunnel projects are under implementation with external assistance; the expressways, roads, and other projects have either been planned (but not secured funding) or been proposed by the Study Team. In the subsequent Section 6.5, the projects under implementation are excluded, and those in the proposed or planning stage are evaluated and prioritized.
31 The target year is 2021 for short term, 2031 for medium term, and 2041 for long term.
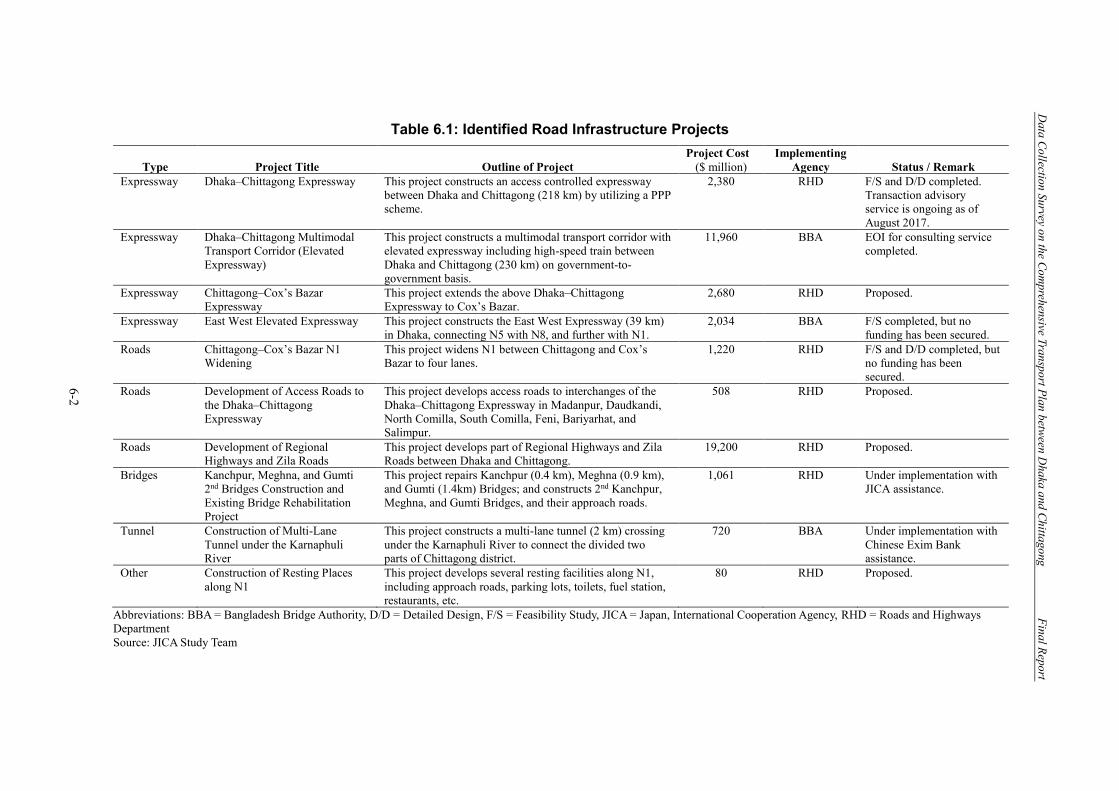
Data Collection Survey on the Com
prehensive Transport Plan between Dhaka and Chittagong
Final Report
6-2
Table 6.1: Identified Road Infrastructure Projects
Type Project Title Outline of Project Project Cost
($ million) Implementing
Agency Status / Remark Expressway Dhaka–Chittagong Expressway This project constructs an access controlled expressway
between Dhaka and Chittagong (218 km) by utilizing a PPP scheme.
2,380 RHD F/S and D/D completed. Transaction advisory service is ongoing as of August 2017.
Expressway Dhaka–Chittagong Multimodal Transport Corridor (Elevated Expressway)
This project constructs a multimodal transport corridor with elevated expressway including high-speed train between Dhaka and Chittagong (230 km) on government-to-government basis.
11,960 BBA EOI for consulting service completed.
Expressway Chittagong–Cox’s Bazar Expressway
This project extends the above Dhaka–Chittagong Expressway to Cox’s Bazar.
2,680 RHD Proposed.
Expressway East West Elevated Expressway This project constructs the East West Expressway (39 km) in Dhaka, connecting N5 with N8, and further with N1.
2,034 BBA F/S completed, but no funding has been secured.
Roads Chittagong–Cox’s Bazar N1 Widening
This project widens N1 between Chittagong and Cox’s Bazar to four lanes.
1,220 RHD F/S and D/D completed, but no funding has been secured.
Roads Development of Access Roads to the Dhaka–Chittagong Expressway
This project develops access roads to interchanges of the Dhaka–Chittagong Expressway in Madanpur, Daudkandi, North Comilla, South Comilla, Feni, Bariyarhat, and Salimpur.
508 RHD Proposed.
Roads Development of Regional Highways and Zila Roads
This project develops part of Regional Highways and Zila Roads between Dhaka and Chittagong.
19,200 RHD Proposed.
Bridges Kanchpur, Meghna, and Gumti 2nd Bridges Construction and Existing Bridge Rehabilitation Project
This project repairs Kanchpur (0.4 km), Meghna (0.9 km), and Gumti (1.4km) Bridges; and constructs 2nd Kanchpur, Meghna, and Gumti Bridges, and their approach roads.
1,061 RHD Under implementation with JICA assistance.
Tunnel Construction of Multi-Lane Tunnel under the Karnaphuli River
This project constructs a multi-lane tunnel (2 km) crossing under the Karnaphuli River to connect the divided two parts of Chittagong district.
720 BBA Under implementation with Chinese Exim Bank assistance.
Other Construction of Resting Places along N1
This project develops several resting facilities along N1, including approach roads, parking lots, toilets, fuel station, restaurants, etc.
80 RHD Proposed.
Abbreviations: BBA = Bangladesh Bridge Authority, D/D = Detailed Design, F/S = Feasibility Study, JICA = Japan, International Cooperation Agency, RHD = Roads and Highways Department Source: JICA Study Team
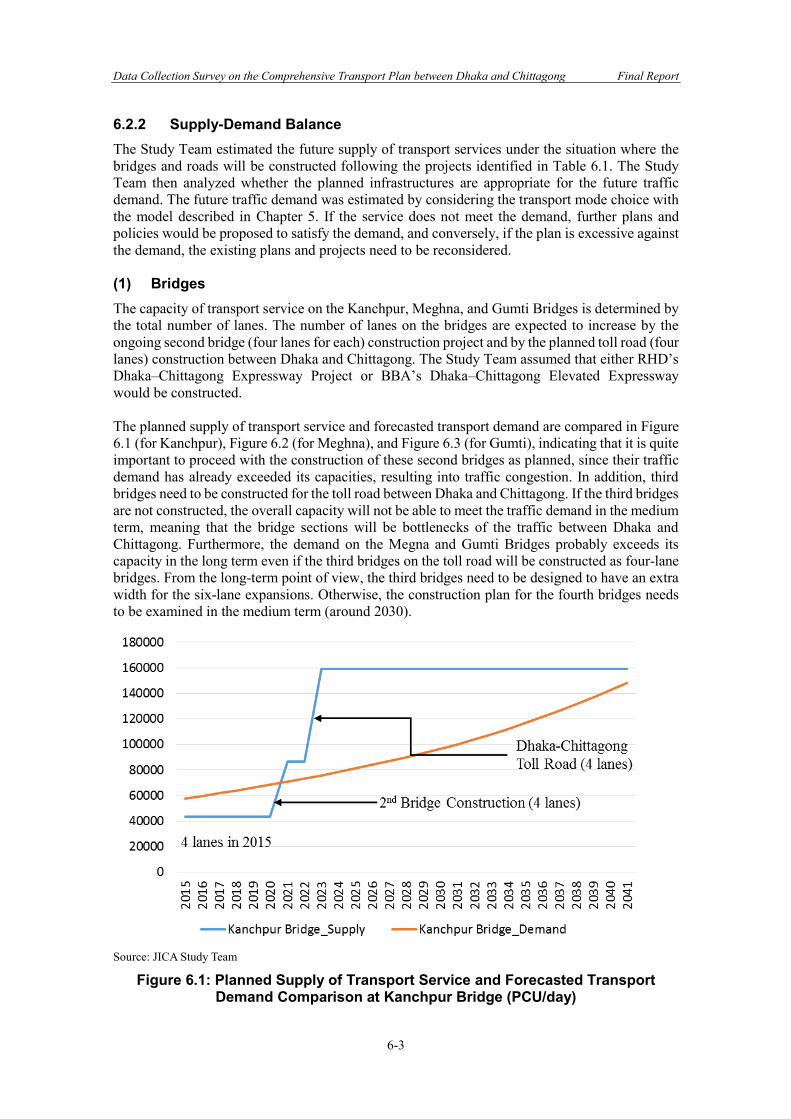
Data Collection Survey on the Comprehensive Transport Plan between Dhaka and Chittagong Final Report
6-3
6.2.2 Supply-Demand Balance The Study Team estimated the future supply of transport services under the situation where the bridges and roads will be constructed following the projects identified in Table 6.1. The Study Team then analyzed whether the planned infrastructures are appropriate for the future traffic demand. The future traffic demand was estimated by considering the transport mode choice with the model described in Chapter 5. If the service does not meet the demand, further plans and policies would be proposed to satisfy the demand, and conversely, if the plan is excessive against the demand, the existing plans and projects need to be reconsidered. (1) Bridges The capacity of transport service on the Kanchpur, Meghna, and Gumti Bridges is determined by the total number of lanes. The number of lanes on the bridges are expected to increase by the ongoing second bridge (four lanes for each) construction project and by the planned toll road (four lanes) construction between Dhaka and Chittagong. The Study Team assumed that either RHD’s Dhaka–Chittagong Expressway Project or BBA’s Dhaka–Chittagong Elevated Expressway would be constructed. The planned supply of transport service and forecasted transport demand are compared in Figure 6.1 (for Kanchpur), Figure 6.2 (for Meghna), and Figure 6.3 (for Gumti), indicating that it is quite important to proceed with the construction of these second bridges as planned, since their traffic demand has already exceeded its capacities, resulting into traffic congestion. In addition, third bridges need to be constructed for the toll road between Dhaka and Chittagong. If the third bridges are not constructed, the overall capacity will not be able to meet the traffic demand in the medium term, meaning that the bridge sections will be bottlenecks of the traffic between Dhaka and Chittagong. Furthermore, the demand on the Megna and Gumti Bridges probably exceeds its capacity in the long term even if the third bridges on the toll road will be constructed as four-lane bridges. From the long-term point of view, the third bridges need to be designed to have an extra width for the six-lane expansions. Otherwise, the construction plan for the fourth bridges needs to be examined in the medium term (around 2030).
Source: JICA Study Team
Figure 6.1: Planned Supply of Transport Service and Forecasted Transport Demand Comparison at Kanchpur Bridge (PCU/day)
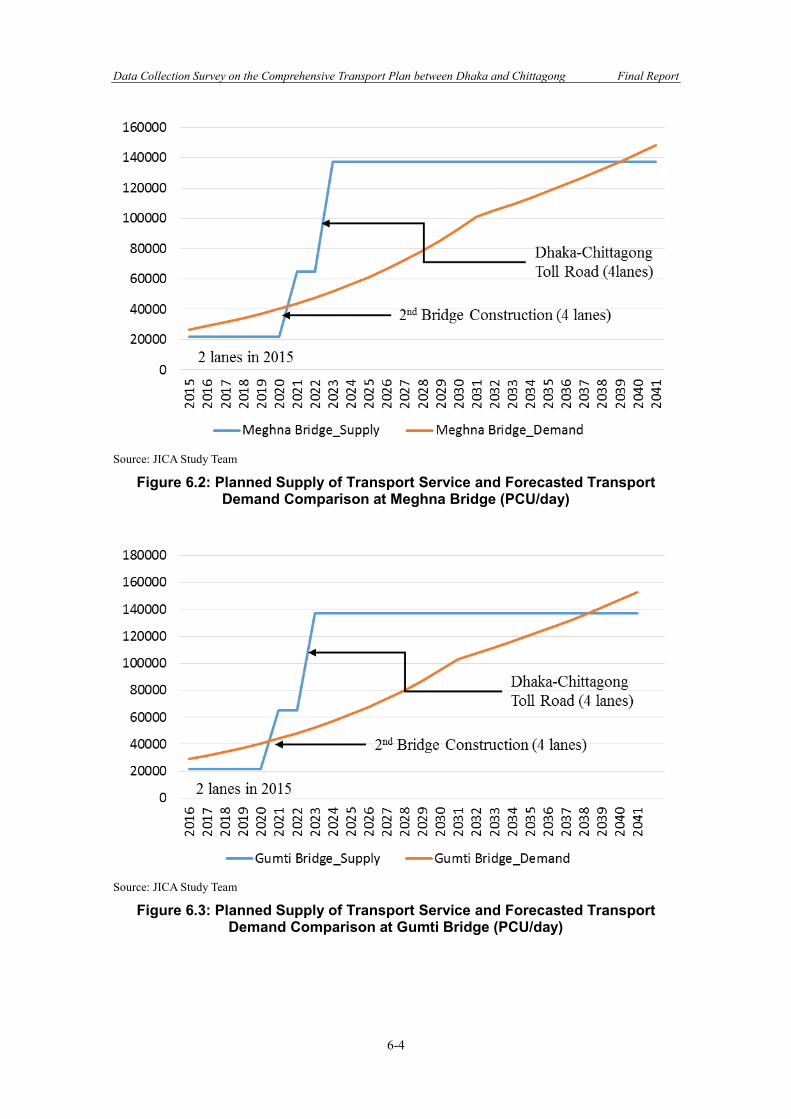
Data Collection Survey on the Comprehensive Transport Plan between Dhaka and Chittagong Final Report
6-4
Source: JICA Study Team
Figure 6.2: Planned Supply of Transport Service and Forecasted Transport Demand Comparison at Meghna Bridge (PCU/day)
Source: JICA Study Team
Figure 6.3: Planned Supply of Transport Service and Forecasted Transport Demand Comparison at Gumti Bridge (PCU/day)
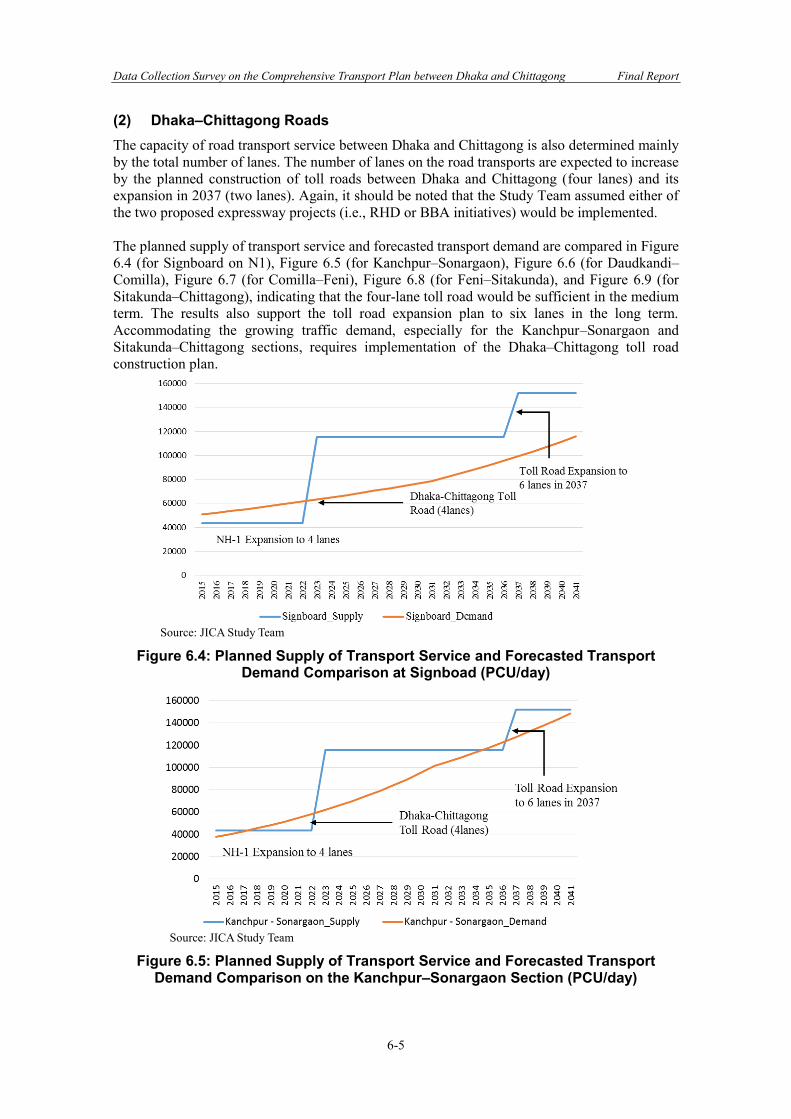
Data Collection Survey on the Comprehensive Transport Plan between Dhaka and Chittagong Final Report
6-5
(2) Dhaka–Chittagong Roads The capacity of road transport service between Dhaka and Chittagong is also determined mainly by the total number of lanes. The number of lanes on the road transports are expected to increase by the planned construction of toll roads between Dhaka and Chittagong (four lanes) and its expansion in 2037 (two lanes). Again, it should be noted that the Study Team assumed either of the two proposed expressway projects (i.e., RHD or BBA initiatives) would be implemented. The planned supply of transport service and forecasted transport demand are compared in Figure 6.4 (for Signboard on N1), Figure 6.5 (for Kanchpur–Sonargaon), Figure 6.6 (for Daudkandi–Comilla), Figure 6.7 (for Comilla–Feni), Figure 6.8 (for Feni–Sitakunda), and Figure 6.9 (for Sitakunda–Chittagong), indicating that the four-lane toll road would be sufficient in the medium term. The results also support the toll road expansion plan to six lanes in the long term. Accommodating the growing traffic demand, especially for the Kanchpur–Sonargaon and Sitakunda–Chittagong sections, requires implementation of the Dhaka–Chittagong toll road construction plan.
Source: JICA Study Team
Figure 6.4: Planned Supply of Transport Service and Forecasted Transport Demand Comparison at Signboad (PCU/day)
Source: JICA Study Team
Figure 6.5: Planned Supply of Transport Service and Forecasted Transport Demand Comparison on the Kanchpur–Sonargaon Section (PCU/day)
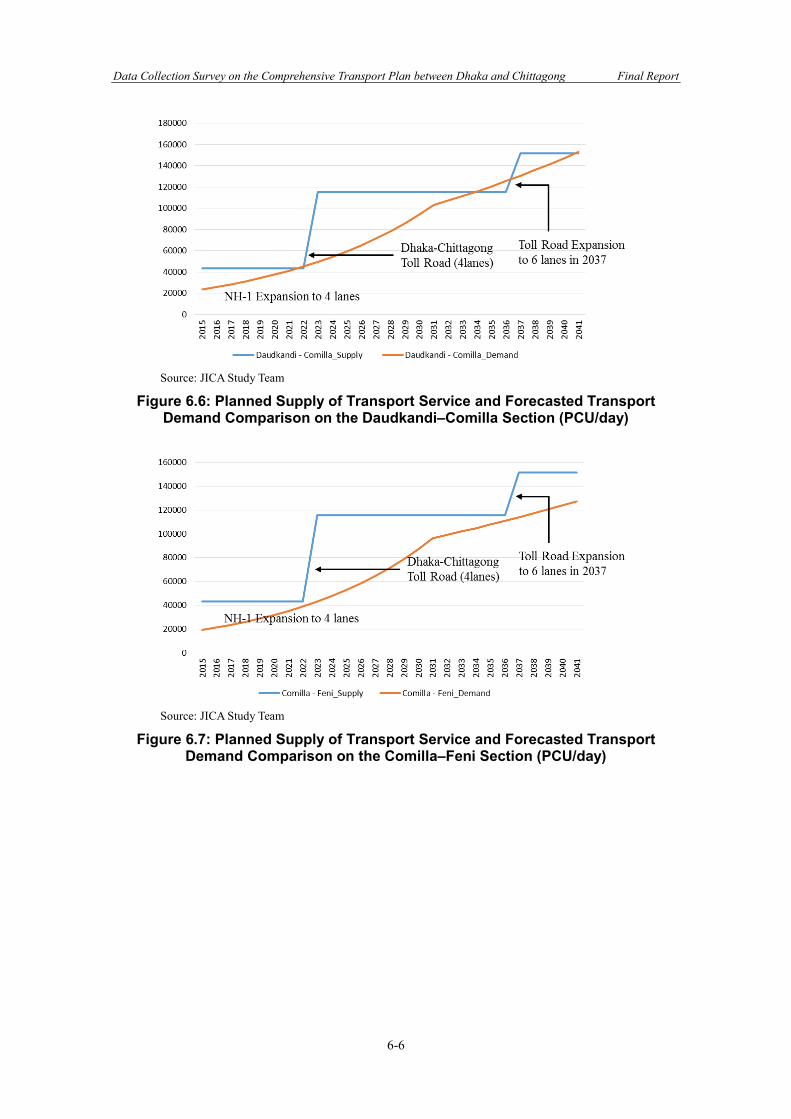
Data Collection Survey on the Comprehensive Transport Plan between Dhaka and Chittagong Final Report
6-6
Source: JICA Study Team
Figure 6.6: Planned Supply of Transport Service and Forecasted Transport Demand Comparison on the Daudkandi–Comilla Section (PCU/day)
Source: JICA Study Team
Figure 6.7: Planned Supply of Transport Service and Forecasted Transport Demand Comparison on the Comilla–Feni Section (PCU/day)
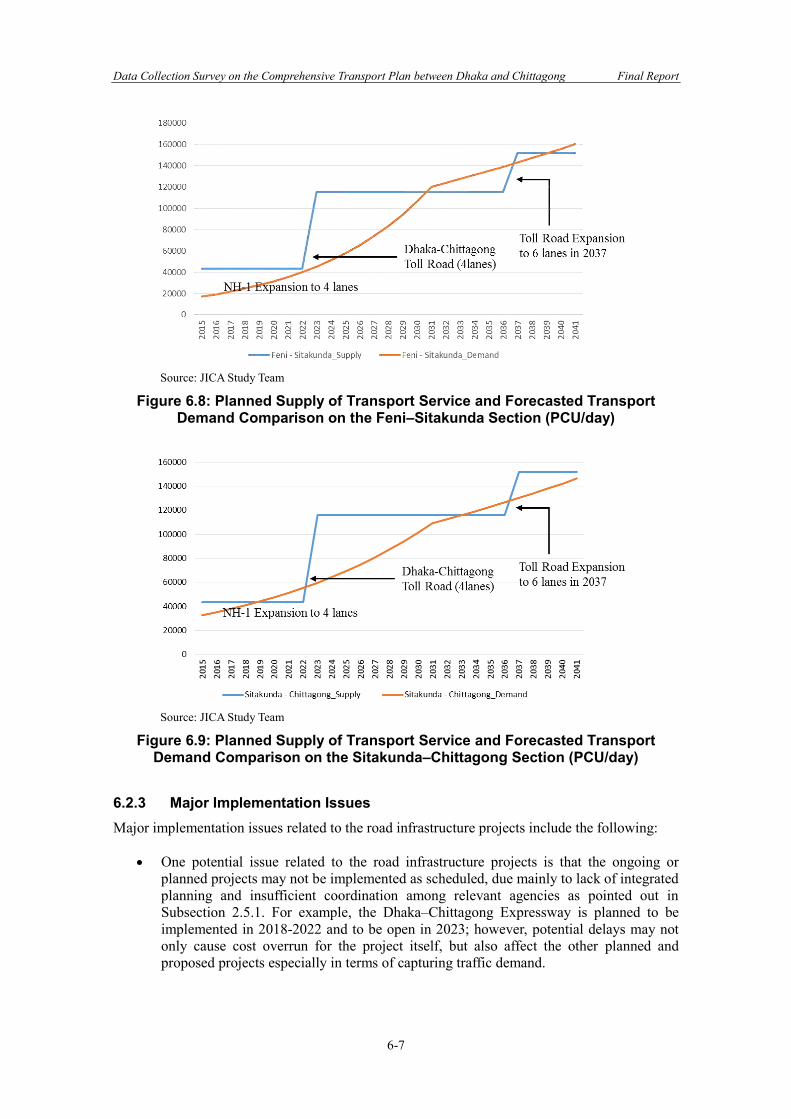
Data Collection Survey on the Comprehensive Transport Plan between Dhaka and Chittagong Final Report
6-7
Source: JICA Study Team
Figure 6.8: Planned Supply of Transport Service and Forecasted Transport Demand Comparison on the Feni–Sitakunda Section (PCU/day)
Source: JICA Study Team
Figure 6.9: Planned Supply of Transport Service and Forecasted Transport Demand Comparison on the Sitakunda–Chittagong Section (PCU/day)
6.2.3 Major Implementation Issues Major implementation issues related to the road infrastructure projects include the following:
• One potential issue related to the road infrastructure projects is that the ongoing or planned projects may not be implemented as scheduled, due mainly to lack of integrated planning and insufficient coordination among relevant agencies as pointed out in Subsection 2.5.1. For example, the Dhaka–Chittagong Expressway is planned to be implemented in 2018-2022 and to be open in 2023; however, potential delays may not only cause cost overrun for the project itself, but also affect the other planned and proposed projects especially in terms of capturing traffic demand.
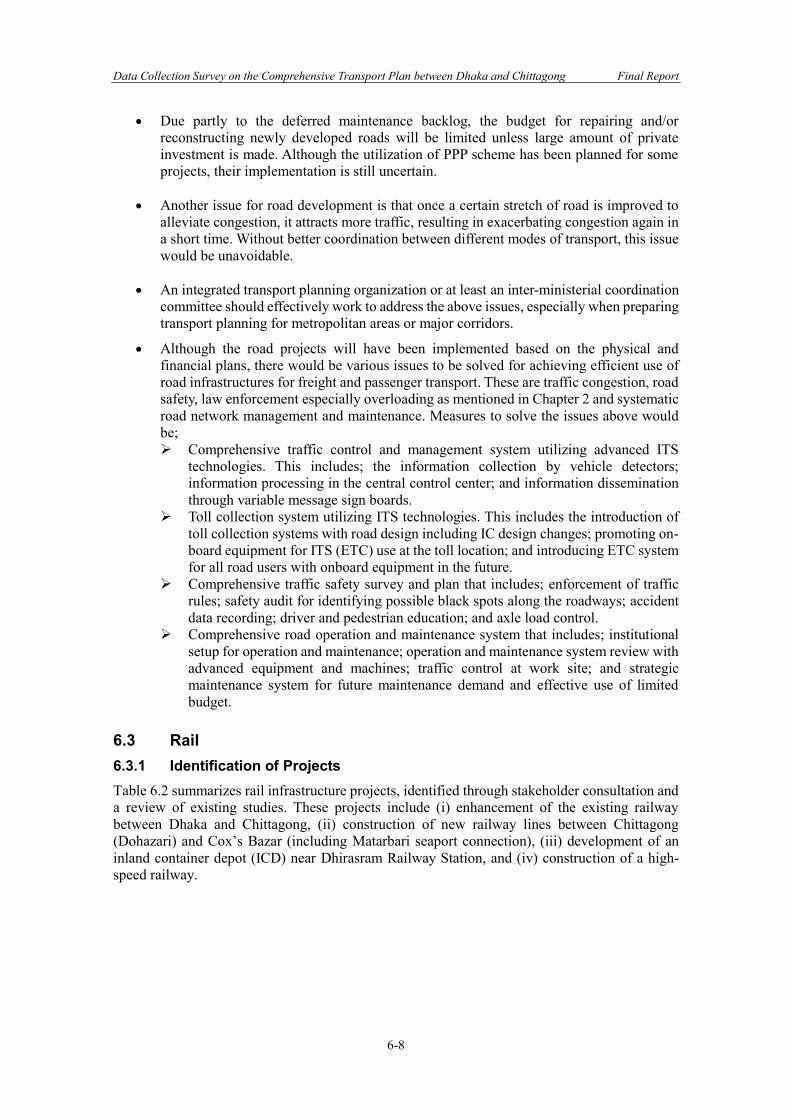
Data Collection Survey on the Comprehensive Transport Plan between Dhaka and Chittagong Final Report
6-8
• Due partly to the deferred maintenance backlog, the budget for repairing and/or reconstructing newly developed roads will be limited unless large amount of private investment is made. Although the utilization of PPP scheme has been planned for some projects, their implementation is still uncertain.
• Another issue for road development is that once a certain stretch of road is improved to alleviate congestion, it attracts more traffic, resulting in exacerbating congestion again in a short time. Without better coordination between different modes of transport, this issue would be unavoidable.
• An integrated transport planning organization or at least an inter-ministerial coordination committee should effectively work to address the above issues, especially when preparing transport planning for metropolitan areas or major corridors.
• Although the road projects will have been implemented based on the physical and financial plans, there would be various issues to be solved for achieving efficient use of road infrastructures for freight and passenger transport. These are traffic congestion, road safety, law enforcement especially overloading as mentioned in Chapter 2 and systematic road network management and maintenance. Measures to solve the issues above would be; ➢ Comprehensive traffic control and management system utilizing advanced ITS
technologies. This includes; the information collection by vehicle detectors; information processing in the central control center; and information dissemination through variable message sign boards.
➢ Toll collection system utilizing ITS technologies. This includes the introduction of toll collection systems with road design including IC design changes; promoting on-board equipment for ITS (ETC) use at the toll location; and introducing ETC system for all road users with onboard equipment in the future.
➢ Comprehensive traffic safety survey and plan that includes; enforcement of traffic rules; safety audit for identifying possible black spots along the roadways; accident data recording; driver and pedestrian education; and axle load control.
➢ Comprehensive road operation and maintenance system that includes; institutional setup for operation and maintenance; operation and maintenance system review with advanced equipment and machines; traffic control at work site; and strategic maintenance system for future maintenance demand and effective use of limited budget.
6.3 Rail 6.3.1 Identification of Projects Table 6.2 summarizes rail infrastructure projects, identified through stakeholder consultation and a review of existing studies. These projects include (i) enhancement of the existing railway between Dhaka and Chittagong, (ii) construction of new railway lines between Chittagong (Dohazari) and Cox’s Bazar (including Matarbari seaport connection), (iii) development of an inland container depot (ICD) near Dhirasram Railway Station, and (iv) construction of a high-speed railway.
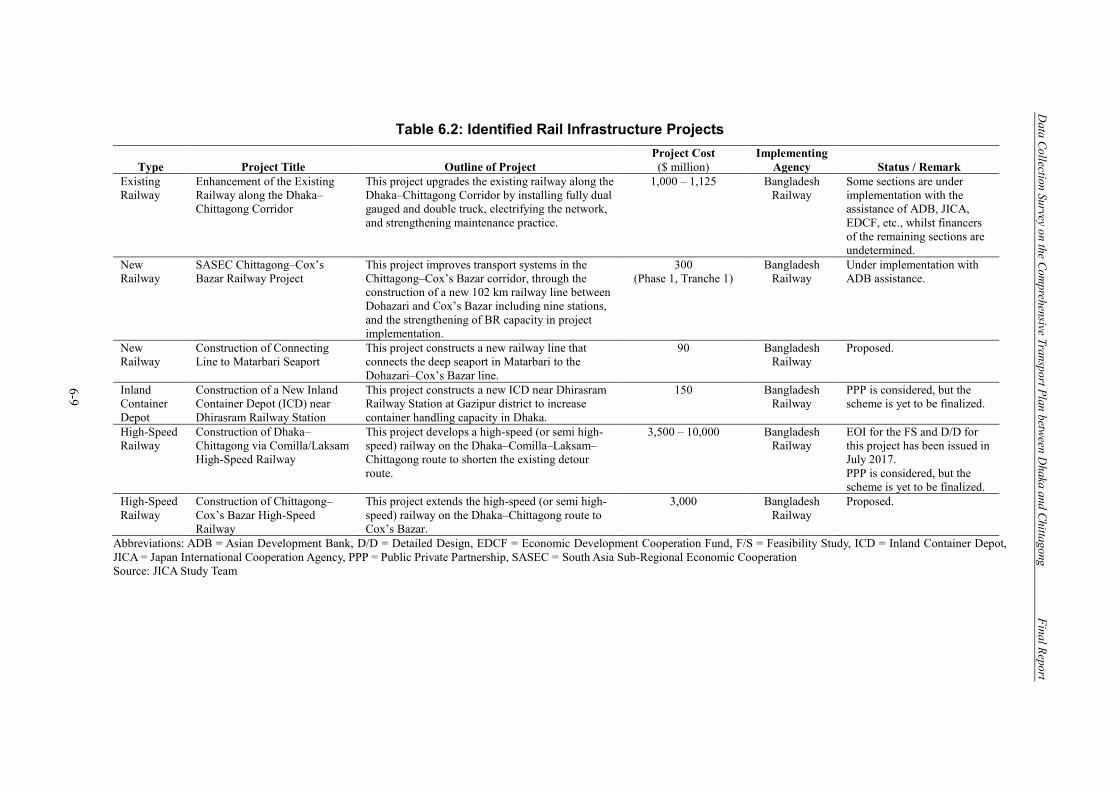
Data Collection Survey on the Com
prehensive Transport Plan between Dhaka and Chittagong
Final Report
6-9
Table 6.2: Identified Rail Infrastructure Projects
Type Project Title Outline of Project Project Cost ($ million)
Implementing Agency Status / Remark
Existing Railway
Enhancement of the Existing Railway along the Dhaka–Chittagong Corridor
This project upgrades the existing railway along the Dhaka–Chittagong Corridor by installing fully dual gauged and double truck, electrifying the network, and strengthening maintenance practice.
1,000 – 1,125 Bangladesh Railway
Some sections are under implementation with the assistance of ADB, JICA, EDCF, etc., whilst financers of the remaining sections are undetermined.
New Railway
SASEC Chittagong–Cox’s Bazar Railway Project
This project improves transport systems in the Chittagong–Cox’s Bazar corridor, through the construction of a new 102 km railway line between Dohazari and Cox’s Bazar including nine stations, and the strengthening of BR capacity in project implementation.
300 (Phase 1, Tranche 1)
Bangladesh Railway
Under implementation with ADB assistance.
New Railway
Construction of Connecting Line to Matarbari Seaport
This project constructs a new railway line that connects the deep seaport in Matarbari to the Dohazari–Cox’s Bazar line.
90 Bangladesh Railway
Proposed.
Inland Container Depot
Construction of a New Inland Container Depot (ICD) near Dhirasram Railway Station
This project constructs a new ICD near Dhirasram Railway Station at Gazipur district to increase container handling capacity in Dhaka.
150 Bangladesh Railway
PPP is considered, but the scheme is yet to be finalized.
High-Speed Railway
Construction of Dhaka–Chittagong via Comilla/Laksam High-Speed Railway
This project develops a high-speed (or semi high-speed) railway on the Dhaka–Comilla–Laksam–Chittagong route to shorten the existing detour route.
3,500 – 10,000 Bangladesh Railway
EOI for the FS and D/D for this project has been issued in July 2017. PPP is considered, but the scheme is yet to be finalized.
High-Speed Railway
Construction of Chittagong–Cox’s Bazar High-Speed Railway
This project extends the high-speed (or semi high-speed) railway on the Dhaka–Chittagong route to Cox’s Bazar.
3,000 Bangladesh Railway
Proposed.
Abbreviations: ADB = Asian Development Bank, D/D = Detailed Design, EDCF = Economic Development Cooperation Fund, F/S = Feasibility Study, ICD = Inland Container Depot, JICA = Japan International Cooperation Agency, PPP = Public Private Partnership, SASEC = South Asia Sub-Regional Economic Cooperation Source: JICA Study Team
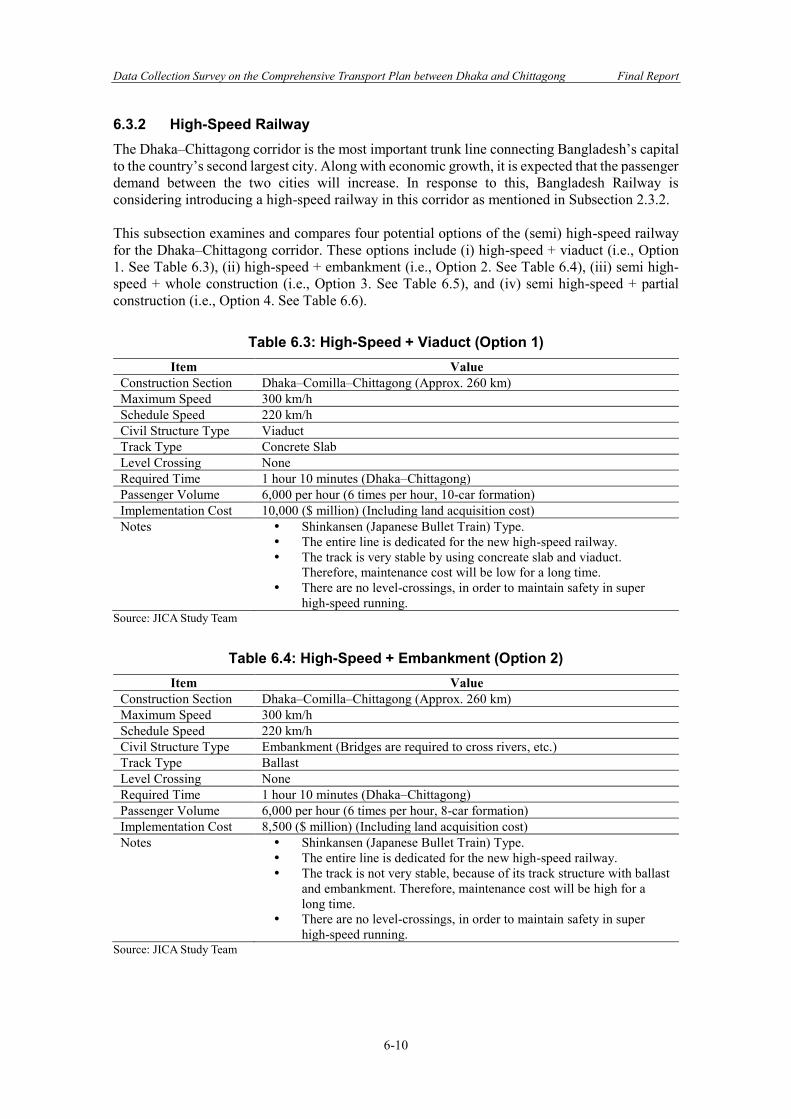
Data Collection Survey on the Comprehensive Transport Plan between Dhaka and Chittagong Final Report
6-10
6.3.2 High-Speed Railway The Dhaka–Chittagong corridor is the most important trunk line connecting Bangladesh’s capital to the country’s second largest city. Along with economic growth, it is expected that the passenger demand between the two cities will increase. In response to this, Bangladesh Railway is considering introducing a high-speed railway in this corridor as mentioned in Subsection 2.3.2. This subsection examines and compares four potential options of the (semi) high-speed railway for the Dhaka–Chittagong corridor. These options include (i) high-speed + viaduct (i.e., Option 1. See Table 6.3), (ii) high-speed + embankment (i.e., Option 2. See Table 6.4), (iii) semi high-speed + whole construction (i.e., Option 3. See Table 6.5), and (iv) semi high-speed + partial construction (i.e., Option 4. See Table 6.6).
Table 6.3: High-Speed + Viaduct (Option 1) Item Value
Construction Section Dhaka–Comilla–Chittagong (Approx. 260 km) Maximum Speed 300 km/h Schedule Speed 220 km/h Civil Structure Type Viaduct Track Type Concrete Slab Level Crossing None Required Time 1 hour 10 minutes (Dhaka–Chittagong) Passenger Volume 6,000 per hour (6 times per hour, 10-car formation) Implementation Cost 10,000 ($ million) (Including land acquisition cost) Notes Shinkansen (Japanese Bullet Train) Type.
The entire line is dedicated for the new high-speed railway. The track is very stable by using concreate slab and viaduct.
Therefore, maintenance cost will be low for a long time. There are no level-crossings, in order to maintain safety in super
high-speed running. Source: JICA Study Team
Table 6.4: High-Speed + Embankment (Option 2) Item Value
Construction Section Dhaka–Comilla–Chittagong (Approx. 260 km) Maximum Speed 300 km/h Schedule Speed 220 km/h Civil Structure Type Embankment (Bridges are required to cross rivers, etc.) Track Type Ballast Level Crossing None Required Time 1 hour 10 minutes (Dhaka–Chittagong) Passenger Volume 6,000 per hour (6 times per hour, 8-car formation) Implementation Cost 8,500 ($ million) (Including land acquisition cost) Notes Shinkansen (Japanese Bullet Train) Type.
The entire line is dedicated for the new high-speed railway. The track is not very stable, because of its track structure with ballast
and embankment. Therefore, maintenance cost will be high for a long time.
There are no level-crossings, in order to maintain safety in super high-speed running.
Source: JICA Study Team
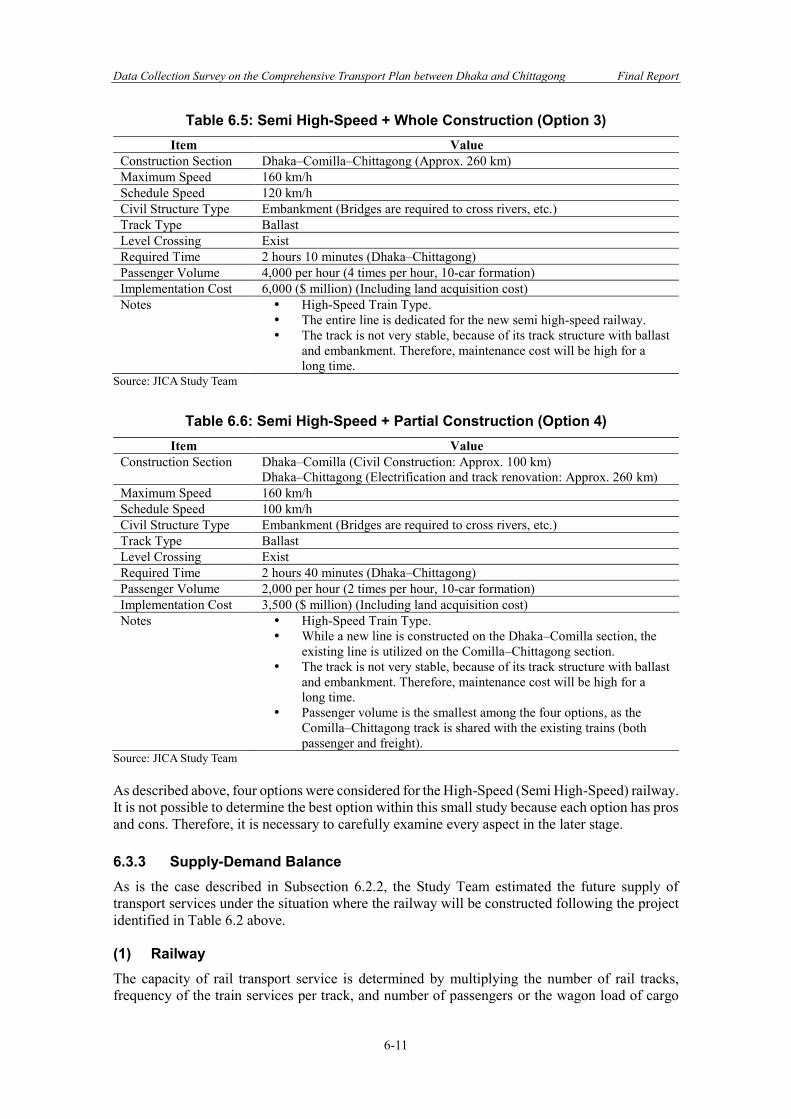
Data Collection Survey on the Comprehensive Transport Plan between Dhaka and Chittagong Final Report
6-11
Table 6.5: Semi High-Speed + Whole Construction (Option 3) Item Value
Construction Section Dhaka–Comilla–Chittagong (Approx. 260 km) Maximum Speed 160 km/h Schedule Speed 120 km/h Civil Structure Type Embankment (Bridges are required to cross rivers, etc.) Track Type Ballast Level Crossing Exist Required Time 2 hours 10 minutes (Dhaka–Chittagong) Passenger Volume 4,000 per hour (4 times per hour, 10-car formation) Implementation Cost 6,000 ($ million) (Including land acquisition cost) Notes High-Speed Train Type.
The entire line is dedicated for the new semi high-speed railway. The track is not very stable, because of its track structure with ballast
and embankment. Therefore, maintenance cost will be high for a long time.
Source: JICA Study Team
Table 6.6: Semi High-Speed + Partial Construction (Option 4) Item Value
Construction Section Dhaka–Comilla (Civil Construction: Approx. 100 km) Dhaka–Chittagong (Electrification and track renovation: Approx. 260 km)
Maximum Speed 160 km/h Schedule Speed 100 km/h Civil Structure Type Embankment (Bridges are required to cross rivers, etc.) Track Type Ballast Level Crossing Exist Required Time 2 hours 40 minutes (Dhaka–Chittagong) Passenger Volume 2,000 per hour (2 times per hour, 10-car formation) Implementation Cost 3,500 ($ million) (Including land acquisition cost) Notes High-Speed Train Type.
While a new line is constructed on the Dhaka–Comilla section, the existing line is utilized on the Comilla–Chittagong section.
The track is not very stable, because of its track structure with ballast and embankment. Therefore, maintenance cost will be high for a long time.
Passenger volume is the smallest among the four options, as the Comilla–Chittagong track is shared with the existing trains (both passenger and freight).
Source: JICA Study Team As described above, four options were considered for the High-Speed (Semi High-Speed) railway. It is not possible to determine the best option within this small study because each option has pros and cons. Therefore, it is necessary to carefully examine every aspect in the later stage. 6.3.3 Supply-Demand Balance As is the case described in Subsection 6.2.2, the Study Team estimated the future supply of transport services under the situation where the railway will be constructed following the project identified in Table 6.2 above. (1) Railway The capacity of rail transport service is determined by multiplying the number of rail tracks, frequency of the train services per track, and number of passengers or the wagon load of cargo
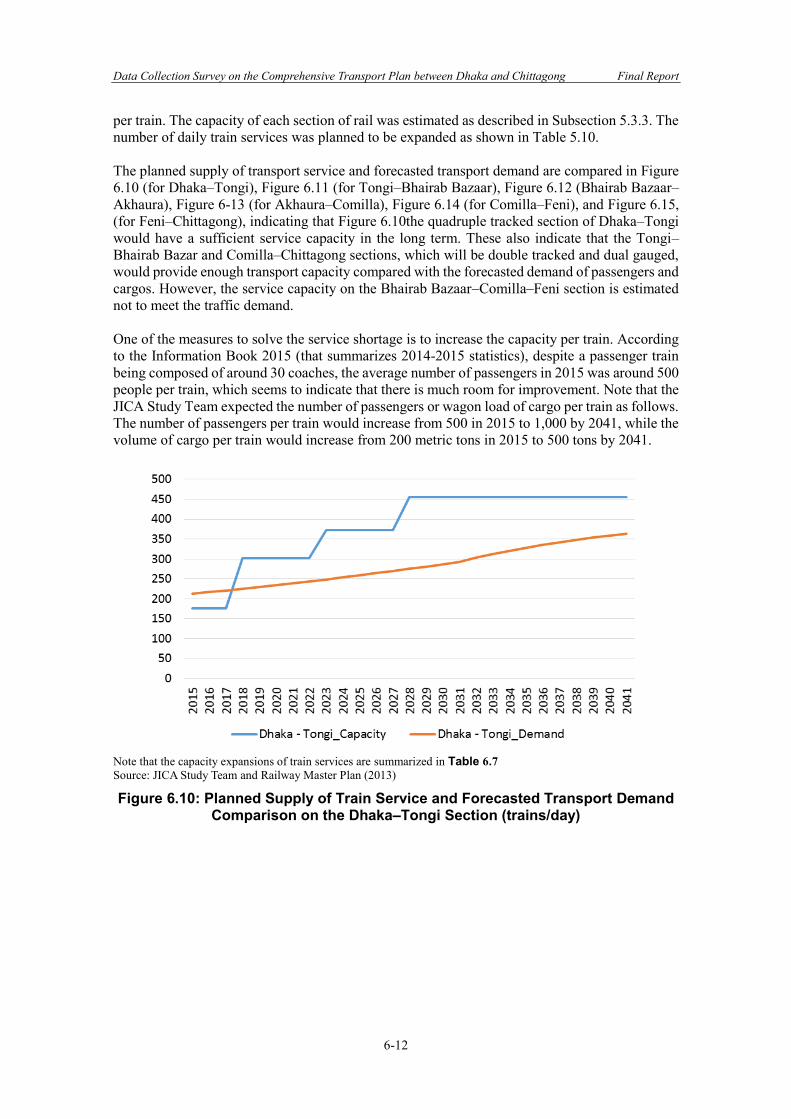
Data Collection Survey on the Comprehensive Transport Plan between Dhaka and Chittagong Final Report
6-12
per train. The capacity of each section of rail was estimated as described in Subsection 5.3.3. The number of daily train services was planned to be expanded as shown in Table 5.10. The planned supply of transport service and forecasted transport demand are compared in Figure 6.10 (for Dhaka–Tongi), Figure 6.11 (for Tongi–Bhairab Bazaar), Figure 6.12 (Bhairab Bazaar–Akhaura), Figure 6-13 (for Akhaura–Comilla), Figure 6.14 (for Comilla–Feni), and Figure 6.15, (for Feni–Chittagong), indicating that Figure 6.10the quadruple tracked section of Dhaka–Tongi would have a sufficient service capacity in the long term. These also indicate that the Tongi–Bhairab Bazar and Comilla–Chittagong sections, which will be double tracked and dual gauged, would provide enough transport capacity compared with the forecasted demand of passengers and cargos. However, the service capacity on the Bhairab Bazaar–Comilla–Feni section is estimated not to meet the traffic demand. One of the measures to solve the service shortage is to increase the capacity per train. According to the Information Book 2015 (that summarizes 2014-2015 statistics), despite a passenger train being composed of around 30 coaches, the average number of passengers in 2015 was around 500 people per train, which seems to indicate that there is much room for improvement. Note that the JICA Study Team expected the number of passengers or wagon load of cargo per train as follows. The number of passengers per train would increase from 500 in 2015 to 1,000 by 2041, while the volume of cargo per train would increase from 200 metric tons in 2015 to 500 tons by 2041.
Note that the capacity expansions of train services are summarized in Table 6.7 Source: JICA Study Team and Railway Master Plan (2013)
Figure 6.10: Planned Supply of Train Service and Forecasted Transport Demand Comparison on the Dhaka–Tongi Section (trains/day)
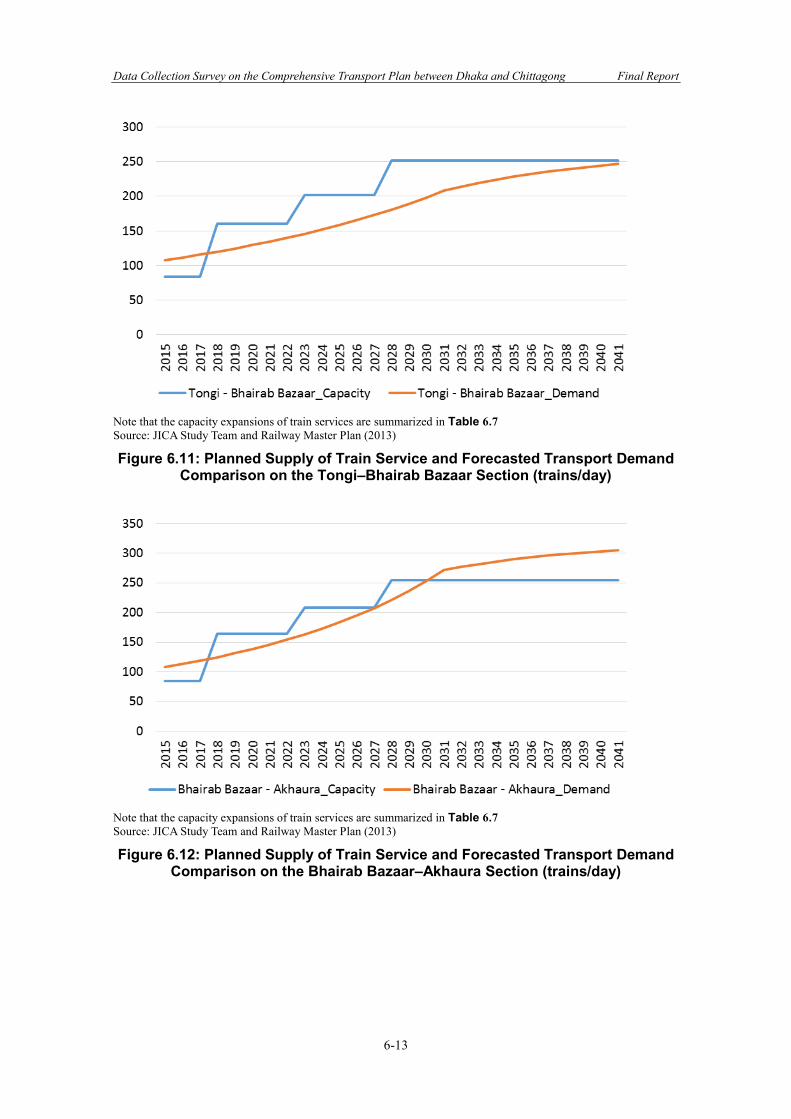
Data Collection Survey on the Comprehensive Transport Plan between Dhaka and Chittagong Final Report
6-13
Note that the capacity expansions of train services are summarized in Table 6.7 Source: JICA Study Team and Railway Master Plan (2013)
Figure 6.11: Planned Supply of Train Service and Forecasted Transport Demand Comparison on the Tongi–Bhairab Bazaar Section (trains/day)
Note that the capacity expansions of train services are summarized in Table 6.7 Source: JICA Study Team and Railway Master Plan (2013)
Figure 6.12: Planned Supply of Train Service and Forecasted Transport Demand Comparison on the Bhairab Bazaar–Akhaura Section (trains/day)
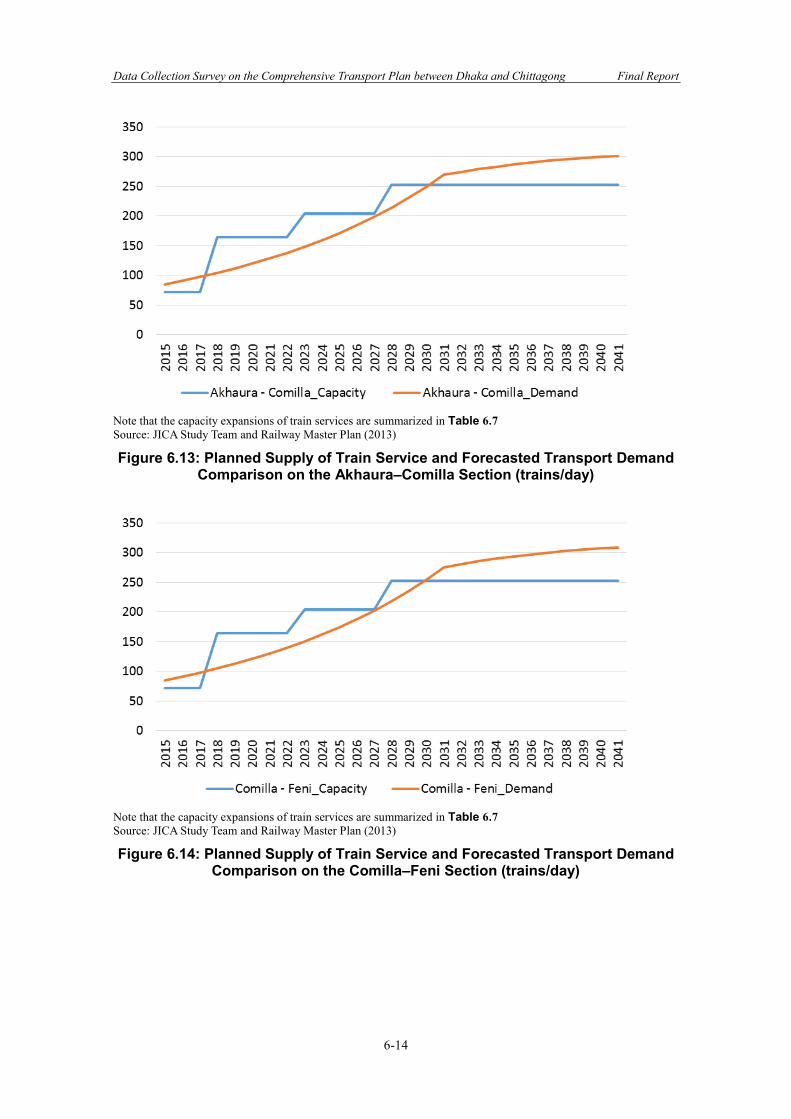
Data Collection Survey on the Comprehensive Transport Plan between Dhaka and Chittagong Final Report
6-14
Note that the capacity expansions of train services are summarized in Table 6.7 Source: JICA Study Team and Railway Master Plan (2013)
Figure 6.13: Planned Supply of Train Service and Forecasted Transport Demand Comparison on the Akhaura–Comilla Section (trains/day)
Note that the capacity expansions of train services are summarized in Table 6.7 Source: JICA Study Team and Railway Master Plan (2013)
Figure 6.14: Planned Supply of Train Service and Forecasted Transport Demand Comparison on the Comilla–Feni Section (trains/day)
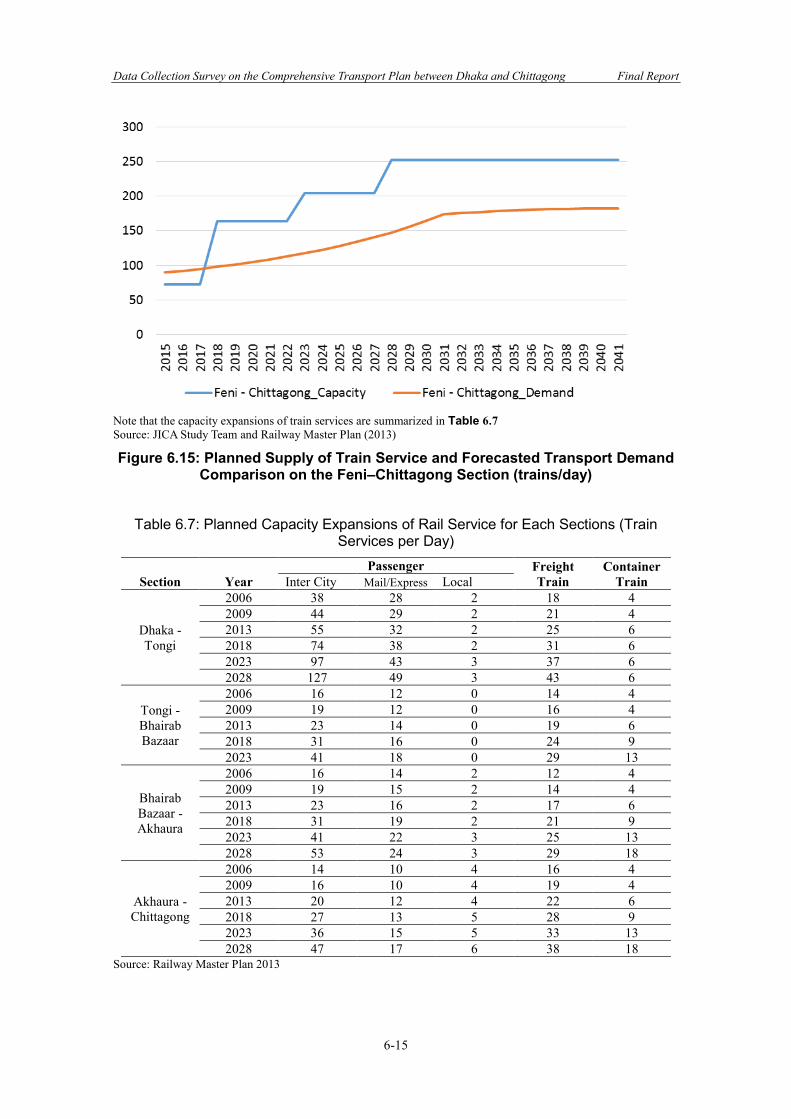
Data Collection Survey on the Comprehensive Transport Plan between Dhaka and Chittagong Final Report
6-15
Note that the capacity expansions of train services are summarized in Table 6.7 Source: JICA Study Team and Railway Master Plan (2013)
Figure 6.15: Planned Supply of Train Service and Forecasted Transport Demand Comparison on the Feni–Chittagong Section (trains/day)
Table 6.7: Planned Capacity Expansions of Rail Service for Each Sections (Train Services per Day)
Section Year Passenger Freight
Train Container
Train Inter City Mail/Express Local
Dhaka - Tongi
2006 38 28 2 18 4 2009 44 29 2 21 4 2013 55 32 2 25 6 2018 74 38 2 31 6 2023 97 43 3 37 6 2028 127 49 3 43 6
Tongi - Bhairab Bazaar
2006 16 12 0 14 4 2009 19 12 0 16 4 2013 23 14 0 19 6 2018 31 16 0 24 9 2023 41 18 0 29 13
Bhairab Bazaar - Akhaura
2006 16 14 2 12 4 2009 19 15 2 14 4 2013 23 16 2 17 6 2018 31 19 2 21 9 2023 41 22 3 25 13 2028 53 24 3 29 18
Akhaura - Chittagong
2006 14 10 4 16 4 2009 16 10 4 19 4 2013 20 12 4 22 6 2018 27 13 5 28 9 2023 36 15 5 33 13 2028 47 17 6 38 18
Source: Railway Master Plan 2013
Data Collection Survey on the Comprehensive Transport Plan between Dhaka and Chittagong Final Report
6-16
(2) High-Speed Railway The demand of high-speed railway (HSR) was forecast under the situation where the HSR is expected to be opened in 2030, operated at 120 km/hour, and utilized at the fare of 3,000 Taka (present value). The Study Team conducted the forecast of the HSR demand with the expected level of the HSR service corresponding to option 3 in 6.3.2. This analysis was conducted to forecast the HSR demand when the HSR service is provided with the semi high-speed operation and the newly constructed track. Note that it does not propose option 3 as a reasonable standard for HSR. The methodology of demand forecast of HSR was described in Chapter 5 in detail. First, the total of future traffic demand between Dhaka and Chittagong was estimated based on both the current traffic demand and the assumed economic growth. Then, the future transport mode choice was estimated. The mode choice model based on the results of the users’ preference survey distributed the total volume into the different modes, and determined how much of the passengers of passenger car, bus, present rail, and aviation, choose the high-speed railway. Details are described in Section 4.5. The demand by section is shown in Figure 6.16 (for Dhaka–Comilla), Figure 6.17 (for Comilla–Feni), and Figure 6.18 (for Feni–Chittagong). The demand between Dhaka and Comilla was estimated at 60,000 passengers per day, which is equivalent to the service capacity by the operation with two times per hour and 10-car formation. However, the demand between Comilla and Feni would account for only 50% of capacity, and that between Feni and Chittagong for 75%. These results indicate that it would be better to operate the additional train service only between Dhaka and Comilla. This analysis was conducted based on the result of the interview survey to the passengers using a variety of modes of transport. A higher proportion of the users of passenger cars and airlines was estimated to shift their mode of transport to HSR under the given conditions. The result of interviews showed that the mode choice behavior was sensitive to the time and cost of their movements. If the fare of HSR is raised from 3,000 Taka to 3,500 Taka, the estimated HSR passengers will be reduced to 76% in 2031 (Figure 6.19). If a low-cost carrier (LCC) service is introduced in about 15% of the total airline service between Dhaka and Chittagong, the HSR passengers will be reduced by 2%. The impact of LCC service introduction on the number of HSR is limited, because the number of airline passengers is relatively small in 2031 compared to that of the expected HSR passengers.
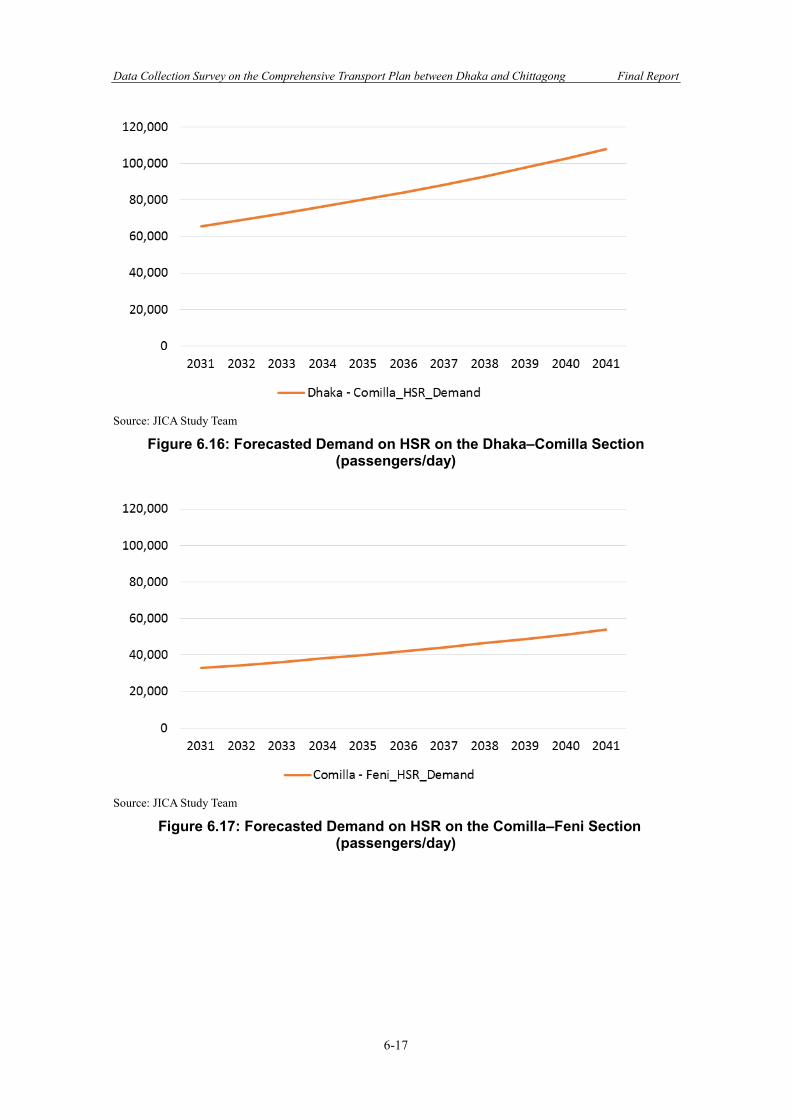
Data Collection Survey on the Comprehensive Transport Plan between Dhaka and Chittagong Final Report
6-17
Source: JICA Study Team
Figure 6.16: Forecasted Demand on HSR on the Dhaka–Comilla Section (passengers/day)
Source: JICA Study Team
Figure 6.17: Forecasted Demand on HSR on the Comilla–Feni Section (passengers/day)
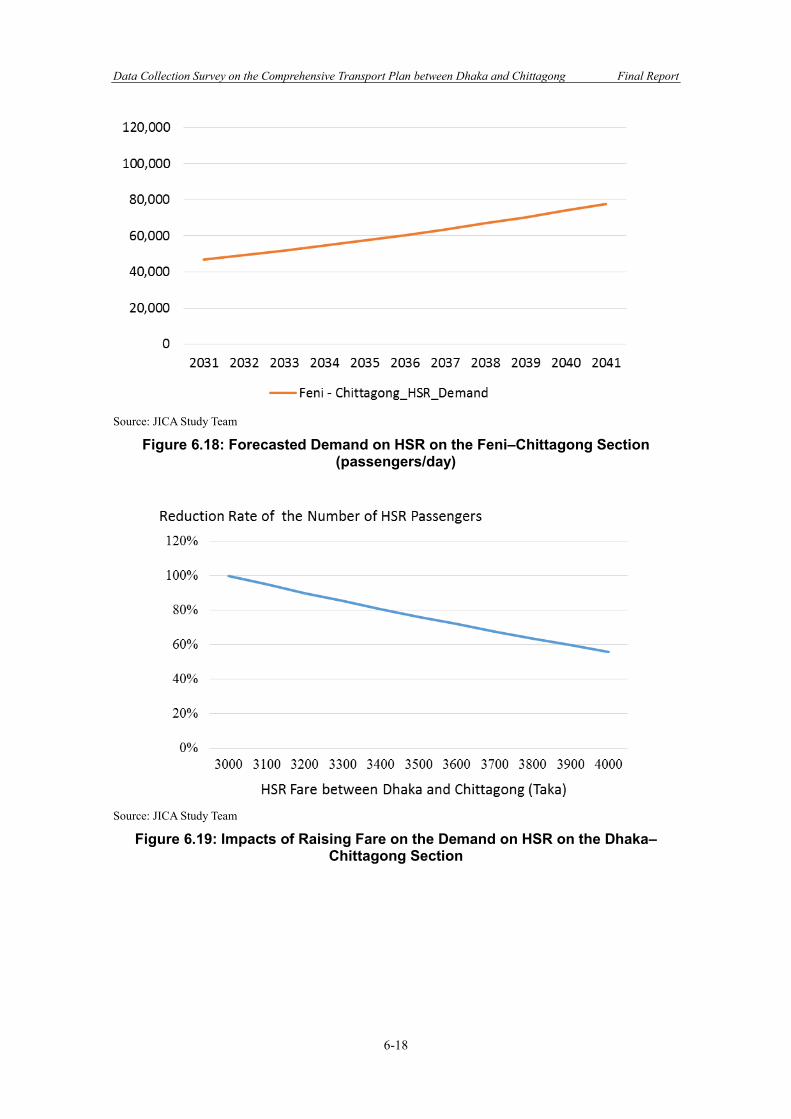
Data Collection Survey on the Comprehensive Transport Plan between Dhaka and Chittagong Final Report
6-18
Source: JICA Study Team
Figure 6.18: Forecasted Demand on HSR on the Feni–Chittagong Section (passengers/day)
Source: JICA Study Team
Figure 6.19: Impacts of Raising Fare on the Demand on HSR on the Dhaka–Chittagong Section
Data Collection Survey on the Comprehensive Transport Plan between Dhaka and Chittagong Final Report
6-19
6.3.4 Major Implementation Issues Major implementation issues related to the rail infrastructure projects include land acquisition and personnel skills, with details summarized as follows: Railway construction projects require continuous land from starting point to ending point.
Even if one part of the whole line could not be acquired, the railway system could not operate. Therefore, land acquisition takes time, which is an important factor during the construction period. In order to address this issue, prompt land acquisition is essential. As detailed acquisition site information can be a cause of corruption, thorough information control is needed.
High-speed railway projects require many skilled personnel throughout the planning and operational phase. As these projects are special, unlike ordinary and traditional railways, adoption of technical and operational standards for high-speed railway is essential. Because of this, it is important to hire consultants with sufficient experience of high-speed railway in the planning and design phase, while also obtaining instructions from a railway operator with experience of high-speed railway.
6.4 Inland Water Transport 6.4.1 Identification of Projects Table 6.8 summarizes inland water infrastructure projects, identified through stakeholder consultation and a review of existing studies. These projects include (i) development of infrastructure including waterway, quay wall, terminal, and associated facilities, (ii) procurement of vessels including passenger transfer crafts, and (iii) others including installation of a vessel tracking system. Note that these focus on infrastructure, and recommendations on policy and institution are described in Subsection 6.4.4.
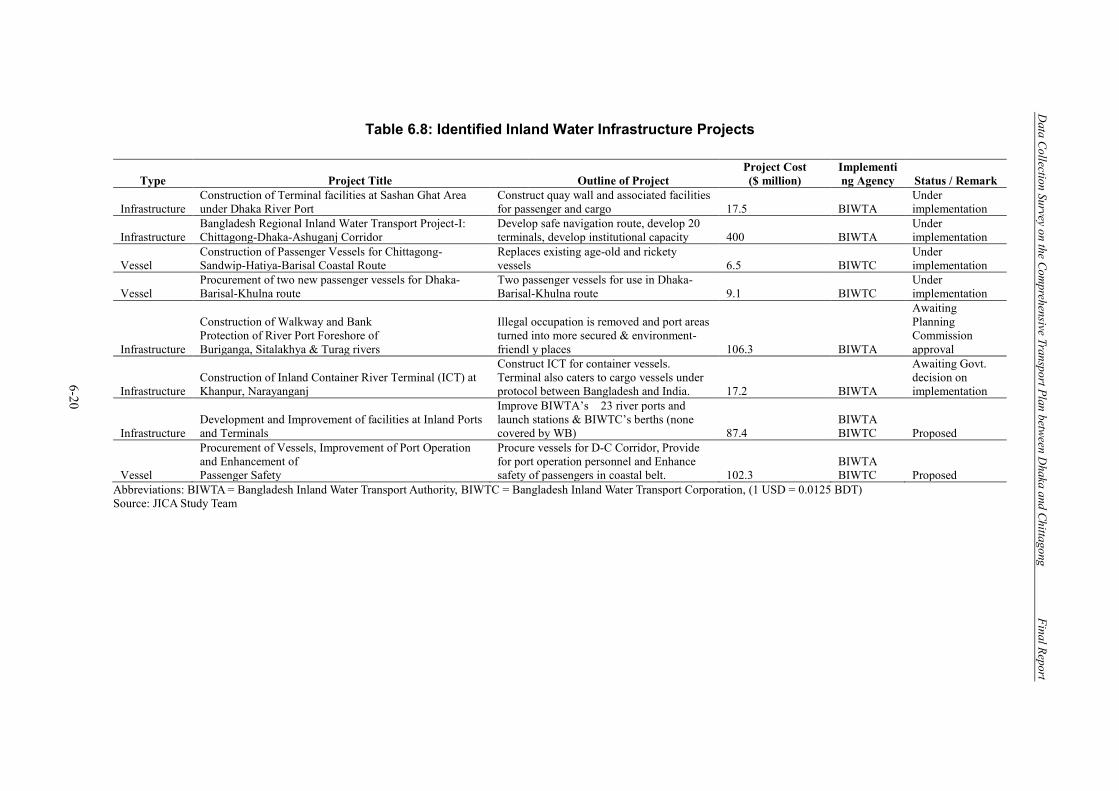
Data Collection Survey on the Com
prehensive Transport Plan between Dhaka and Chittagong
Final Report
6-20
Table 6.8: Identified Inland Water Infrastructure Projects
Type Project Title Outline of Project Project Cost ($ million)
Implementing Agency Status / Remark
Infrastructure Construction of Terminal facilities at Sashan Ghat Area under Dhaka River Port
Construct quay wall and associated facilities for passenger and cargo
17.5
BIWTA
Under implementation
Infrastructure Bangladesh Regional Inland Water Transport Project-I: Chittagong-Dhaka-Ashuganj Corridor
Develop safe navigation route, develop 20 terminals, develop institutional capacity
400
BIWTA
Under implementation
Vessel
Construction of Passenger Vessels for Chittagong-Sandwip-Hatiya-Barisal Coastal Route
Replaces existing age-old and rickety vessels
6.5
BIWTC
Under implementation
Vessel Procurement of two new passenger vessels for Dhaka-Barisal-Khulna route
Two passenger vessels for use in Dhaka-Barisal-Khulna route 9.1 BIWTC
Under implementation
Infrastructure
Construction of Walkway and Bank Protection of River Port Foreshore of Buriganga, Sitalakhya & Turag rivers
Illegal occupation is removed and port areas turned into more secured & environment- friendl y places
106.3
BIWTA
Awaiting Planning Commission approval
Infrastructure Construction of Inland Container River Terminal (ICT) at Khanpur, Narayanganj
Construct ICT for container vessels. Terminal also caters to cargo vessels under protocol between Bangladesh and India.
17.2
BIWTA
Awaiting Govt. decision on implementation
Infrastructure Development and Improvement of facilities at Inland Ports and Terminals
Improve BIWTA’s 23 river ports and launch stations & BIWTC’s berths (none covered by WB)
87.4
BIWTA BIWTC
Proposed
Vessel
Procurement of Vessels, Improvement of Port Operation and Enhancement of Passenger Safety
Procure vessels for D-C Corridor, Provide for port operation personnel and Enhance safety of passengers in coastal belt.
102.3
BIWTA BIWTC
Proposed
Abbreviations: BIWTA = Bangladesh Inland Water Transport Authority, BIWTC = Bangladesh Inland Water Transport Corporation, (1 USD = 0.0125 BDT) Source: JICA Study Team
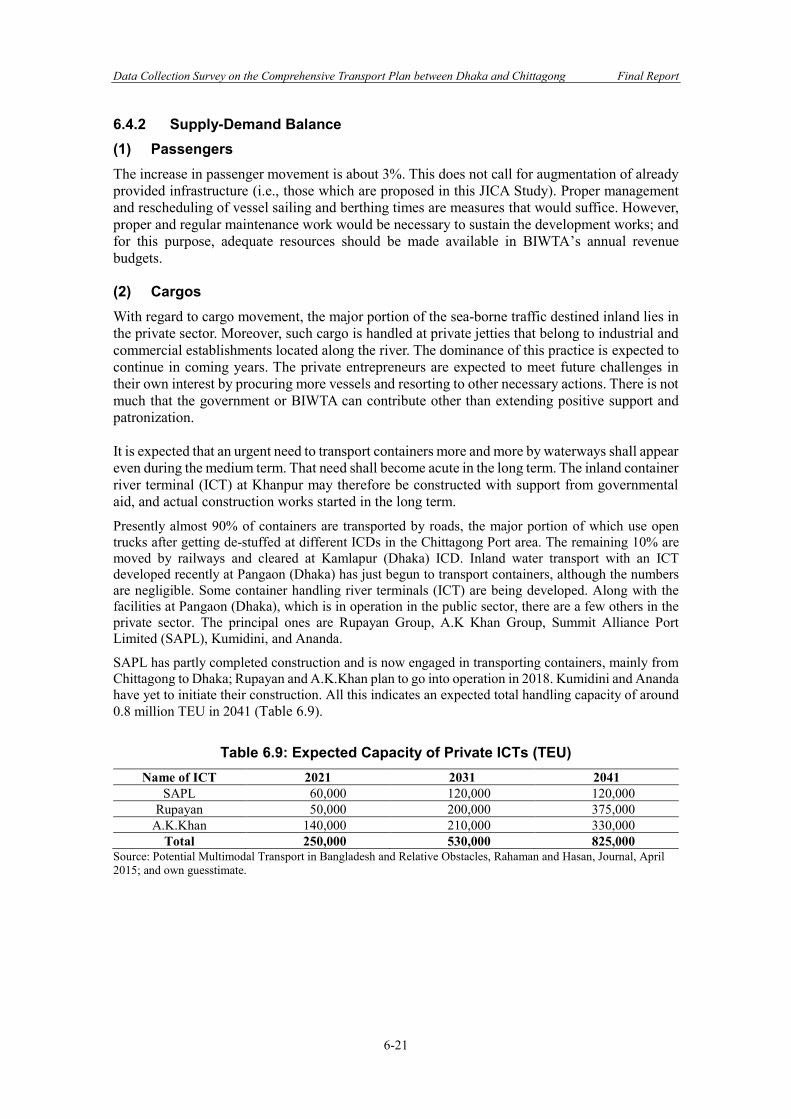
Data Collection Survey on the Comprehensive Transport Plan between Dhaka and Chittagong Final Report
6-21
6.4.2 Supply-Demand Balance (1) Passengers The increase in passenger movement is about 3%. This does not call for augmentation of already provided infrastructure (i.e., those which are proposed in this JICA Study). Proper management and rescheduling of vessel sailing and berthing times are measures that would suffice. However, proper and regular maintenance work would be necessary to sustain the development works; and for this purpose, adequate resources should be made available in BIWTA’s annual revenue budgets. (2) Cargos
With regard to cargo movement, the major portion of the sea-borne traffic destined inland lies in the private sector. Moreover, such cargo is handled at private jetties that belong to industrial and commercial establishments located along the river. The dominance of this practice is expected to continue in coming years. The private entrepreneurs are expected to meet future challenges in their own interest by procuring more vessels and resorting to other necessary actions. There is not much that the government or BIWTA can contribute other than extending positive support and patronization. It is expected that an urgent need to transport containers more and more by waterways shall appear even during the medium term. That need shall become acute in the long term. The inland container river terminal (ICT) at Khanpur may therefore be constructed with support from governmental aid, and actual construction works started in the long term. Presently almost 90% of containers are transported by roads, the major portion of which use open trucks after getting de-stuffed at different ICDs in the Chittagong Port area. The remaining 10% are moved by railways and cleared at Kamlapur (Dhaka) ICD. Inland water transport with an ICT developed recently at Pangaon (Dhaka) has just begun to transport containers, although the numbers are negligible. Some container handling river terminals (ICT) are being developed. Along with the facilities at Pangaon (Dhaka), which is in operation in the public sector, there are a few others in the private sector. The principal ones are Rupayan Group, A.K Khan Group, Summit Alliance Port Limited (SAPL), Kumidini, and Ananda.
SAPL has partly completed construction and is now engaged in transporting containers, mainly from Chittagong to Dhaka; Rupayan and A.K.Khan plan to go into operation in 2018. Kumidini and Ananda have yet to initiate their construction. All this indicates an expected total handling capacity of around 0.8 million TEU in 2041 (Table 6.9).
Table 6.9: Expected Capacity of Private ICTs (TEU) Name of ICT 2021 2031 2041
SAPL 60,000 120,000 120,000 Rupayan 50,000 200,000 375,000
A.K.Khan 140,000 210,000 330,000 Total 250,000 530,000 825,000
Source: Potential Multimodal Transport in Bangladesh and Relative Obstacles, Rahaman and Hasan, Journal, April 2015; and own guesstimate.
Data Collection Survey on the Comprehensive Transport Plan between Dhaka and Chittagong Final Report
6-22
6.4.3 Major Implementation Issues Major implementation issues related to the inland water infrastructure projects include design, institutional capacity, and political interference, with details summarized as follows:
• The components of each project must be designed properly and good specification of works formulated. Designing marine structures is a specialized job, and consultants who have little or no experience in the field may create undue risk.
• BIWTA, the implementing agency, has dedicated engineers and technical personnel with the ability to supervise works. However, its Civil Engineering Department, which was formed many years ago, needs to be overhauled and restructured. Additional engineers and support staff also must be inducted to cope with the gradually increasing work volume and high-profile projects. This is an issue that would generally receive the least attention, but it is an essential one to guarantee quality of works.
• Undue pressure created by political individuals may create obstacles in efficient management of works. Influential persons living in the vicinity of the work-site also may interfere.
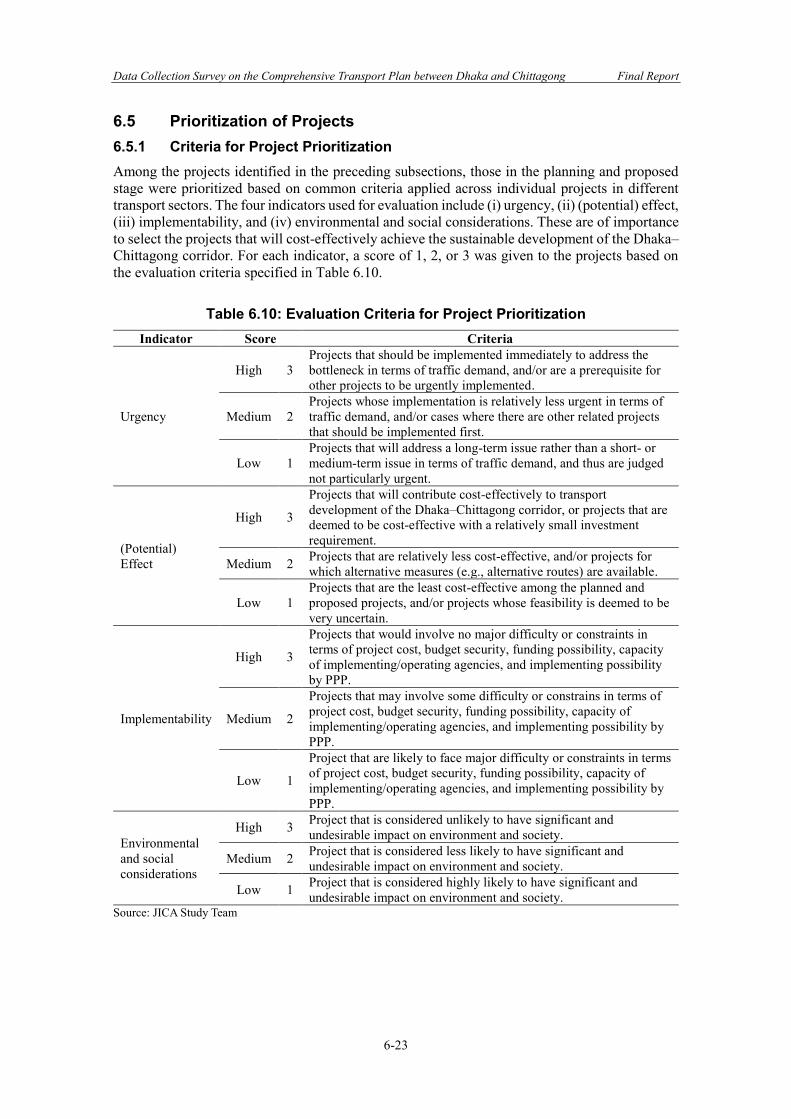
Data Collection Survey on the Comprehensive Transport Plan between Dhaka and Chittagong Final Report
6-23
6.5 Prioritization of Projects 6.5.1 Criteria for Project Prioritization Among the projects identified in the preceding subsections, those in the planning and proposed stage were prioritized based on common criteria applied across individual projects in different transport sectors. The four indicators used for evaluation include (i) urgency, (ii) (potential) effect, (iii) implementability, and (iv) environmental and social considerations. These are of importance to select the projects that will cost-effectively achieve the sustainable development of the Dhaka–Chittagong corridor. For each indicator, a score of 1, 2, or 3 was given to the projects based on the evaluation criteria specified in Table 6.10.
Table 6.10: Evaluation Criteria for Project Prioritization Indicator Score Criteria
Urgency
High 3 Projects that should be implemented immediately to address the bottleneck in terms of traffic demand, and/or are a prerequisite for other projects to be urgently implemented.
Medium 2 Projects whose implementation is relatively less urgent in terms of traffic demand, and/or cases where there are other related projects that should be implemented first.
Low 1 Projects that will address a long-term issue rather than a short- or medium-term issue in terms of traffic demand, and thus are judged not particularly urgent.
(Potential) Effect
High 3
Projects that will contribute cost-effectively to transport development of the Dhaka–Chittagong corridor, or projects that are deemed to be cost-effective with a relatively small investment requirement.
Medium 2 Projects that are relatively less cost-effective, and/or projects for which alternative measures (e.g., alternative routes) are available.
Low 1 Projects that are the least cost-effective among the planned and proposed projects, and/or projects whose feasibility is deemed to be very uncertain.
Implementability
High 3
Projects that would involve no major difficulty or constraints in terms of project cost, budget security, funding possibility, capacity of implementing/operating agencies, and implementing possibility by PPP.
Medium 2
Projects that may involve some difficulty or constrains in terms of project cost, budget security, funding possibility, capacity of implementing/operating agencies, and implementing possibility by PPP.
Low 1
Project that are likely to face major difficulty or constraints in terms of project cost, budget security, funding possibility, capacity of implementing/operating agencies, and implementing possibility by PPP.
Environmental and social considerations
High 3 Project that is considered unlikely to have significant and undesirable impact on environment and society.
Medium 2 Project that is considered less likely to have significant and undesirable impact on environment and society.
Low 1 Project that is considered highly likely to have significant and undesirable impact on environment and society.
Source: JICA Study Team
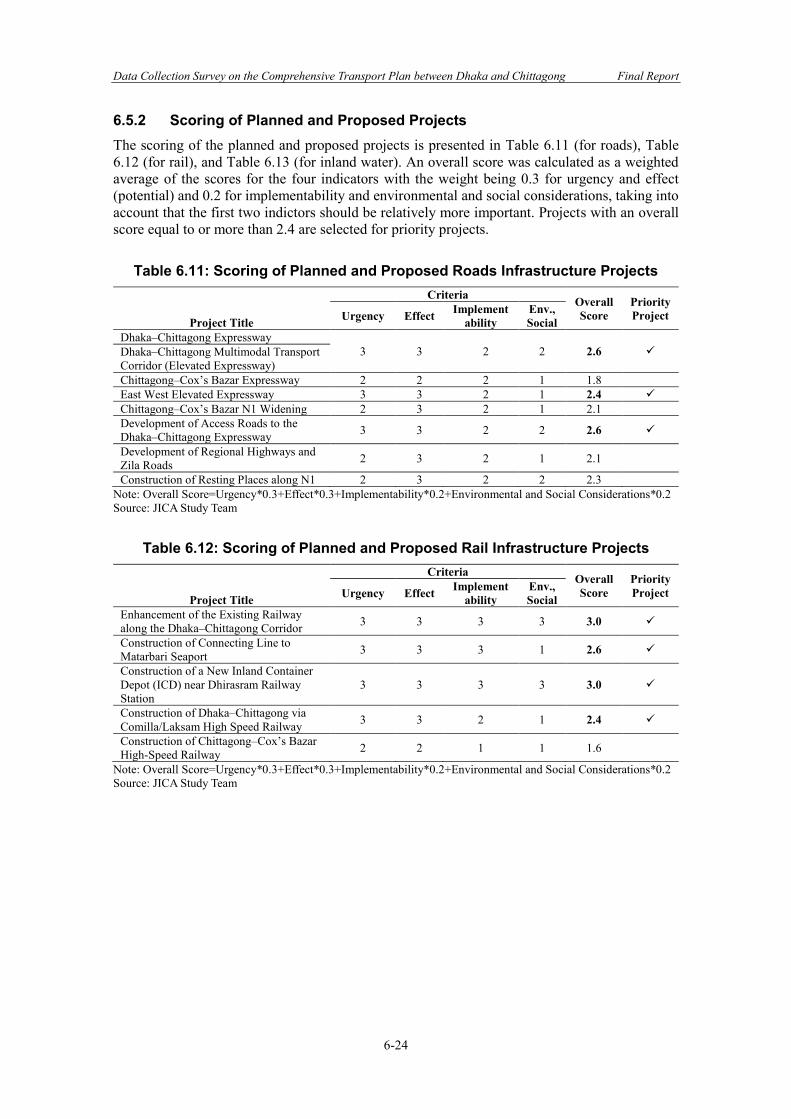
Data Collection Survey on the Comprehensive Transport Plan between Dhaka and Chittagong Final Report
6-24
6.5.2 Scoring of Planned and Proposed Projects The scoring of the planned and proposed projects is presented in Table 6.11 (for roads), Table 6.12 (for rail), and Table 6.13 (for inland water). An overall score was calculated as a weighted average of the scores for the four indicators with the weight being 0.3 for urgency and effect (potential) and 0.2 for implementability and environmental and social considerations, taking into account that the first two indictors should be relatively more important. Projects with an overall score equal to or more than 2.4 are selected for priority projects.
Table 6.11: Scoring of Planned and Proposed Roads Infrastructure Projects
Project Title
Criteria Overall Score
Priority Project Urgency Effect Implement
ability Env., Social
Dhaka–Chittagong Expressway 3 3 2 2 2.6 ✓ Dhaka–Chittagong Multimodal Transport
Corridor (Elevated Expressway) Chittagong–Cox’s Bazar Expressway 2 2 2 1 1.8 East West Elevated Expressway 3 3 2 1 2.4 ✓ Chittagong–Cox’s Bazar N1 Widening 2 3 2 1 2.1 Development of Access Roads to the Dhaka–Chittagong Expressway 3 3 2 2 2.6 ✓
Development of Regional Highways and Zila Roads 2 3 2 1 2.1
Construction of Resting Places along N1 2 3 2 2 2.3 Note: Overall Score=Urgency*0.3+Effect*0.3+Implementability*0.2+Environmental and Social Considerations*0.2 Source: JICA Study Team
Table 6.12: Scoring of Planned and Proposed Rail Infrastructure Projects
Project Title
Criteria Overall Score
Priority Project Urgency Effect Implement
ability Env., Social
Enhancement of the Existing Railway along the Dhaka–Chittagong Corridor 3 3 3 3 3.0 ✓
Construction of Connecting Line to Matarbari Seaport 3 3 3 1 2.6 ✓
Construction of a New Inland Container Depot (ICD) near Dhirasram Railway Station
3 3 3 3 3.0 ✓
Construction of Dhaka–Chittagong via Comilla/Laksam High Speed Railway 3 3 2 1 2.4 ✓
Construction of Chittagong–Cox’s Bazar High-Speed Railway 2 2 1 1 1.6
Note: Overall Score=Urgency*0.3+Effect*0.3+Implementability*0.2+Environmental and Social Considerations*0.2 Source: JICA Study Team
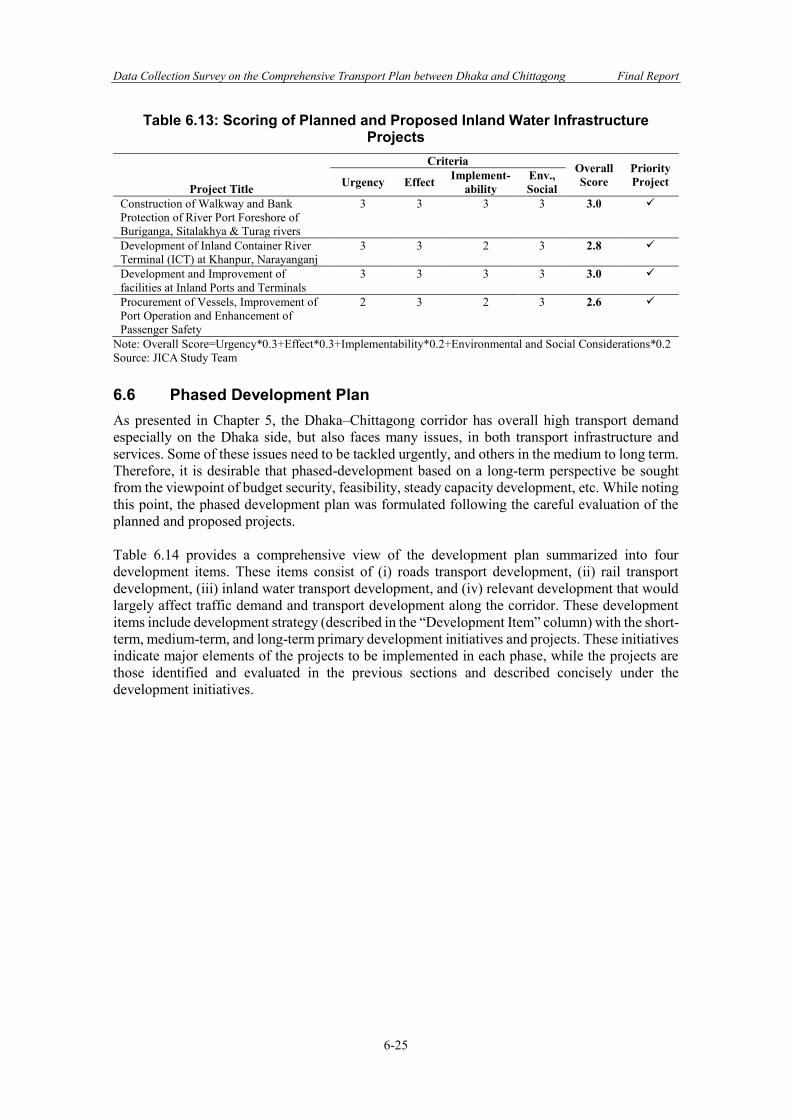
Data Collection Survey on the Comprehensive Transport Plan between Dhaka and Chittagong Final Report
6-25
Table 6.13: Scoring of Planned and Proposed Inland Water Infrastructure Projects
Project Title
Criteria Overall Score
Priority Project Urgency Effect Implement-
ability Env., Social
Construction of Walkway and Bank Protection of River Port Foreshore of Buriganga, Sitalakhya & Turag rivers
3 3 3 3 3.0 ✓
Development of Inland Container River Terminal (ICT) at Khanpur, Narayanganj
3 3 2 3 2.8 ✓
Development and Improvement of facilities at Inland Ports and Terminals
3 3 3 3 3.0 ✓
Procurement of Vessels, Improvement of Port Operation and Enhancement of Passenger Safety
2 3 2 3 2.6 ✓
Note: Overall Score=Urgency*0.3+Effect*0.3+Implementability*0.2+Environmental and Social Considerations*0.2 Source: JICA Study Team 6.6 Phased Development Plan As presented in Chapter 5, the Dhaka–Chittagong corridor has overall high transport demand especially on the Dhaka side, but also faces many issues, in both transport infrastructure and services. Some of these issues need to be tackled urgently, and others in the medium to long term. Therefore, it is desirable that phased-development based on a long-term perspective be sought from the viewpoint of budget security, feasibility, steady capacity development, etc. While noting this point, the phased development plan was formulated following the careful evaluation of the planned and proposed projects. Table 6.14 provides a comprehensive view of the development plan summarized into four development items. These items consist of (i) roads transport development, (ii) rail transport development, (iii) inland water transport development, and (iv) relevant development that would largely affect traffic demand and transport development along the corridor. These development items include development strategy (described in the “Development Item” column) with the short-term, medium-term, and long-term primary development initiatives and projects. These initiatives indicate major elements of the projects to be implemented in each phase, while the projects are those identified and evaluated in the previous sections and described concisely under the development initiatives.
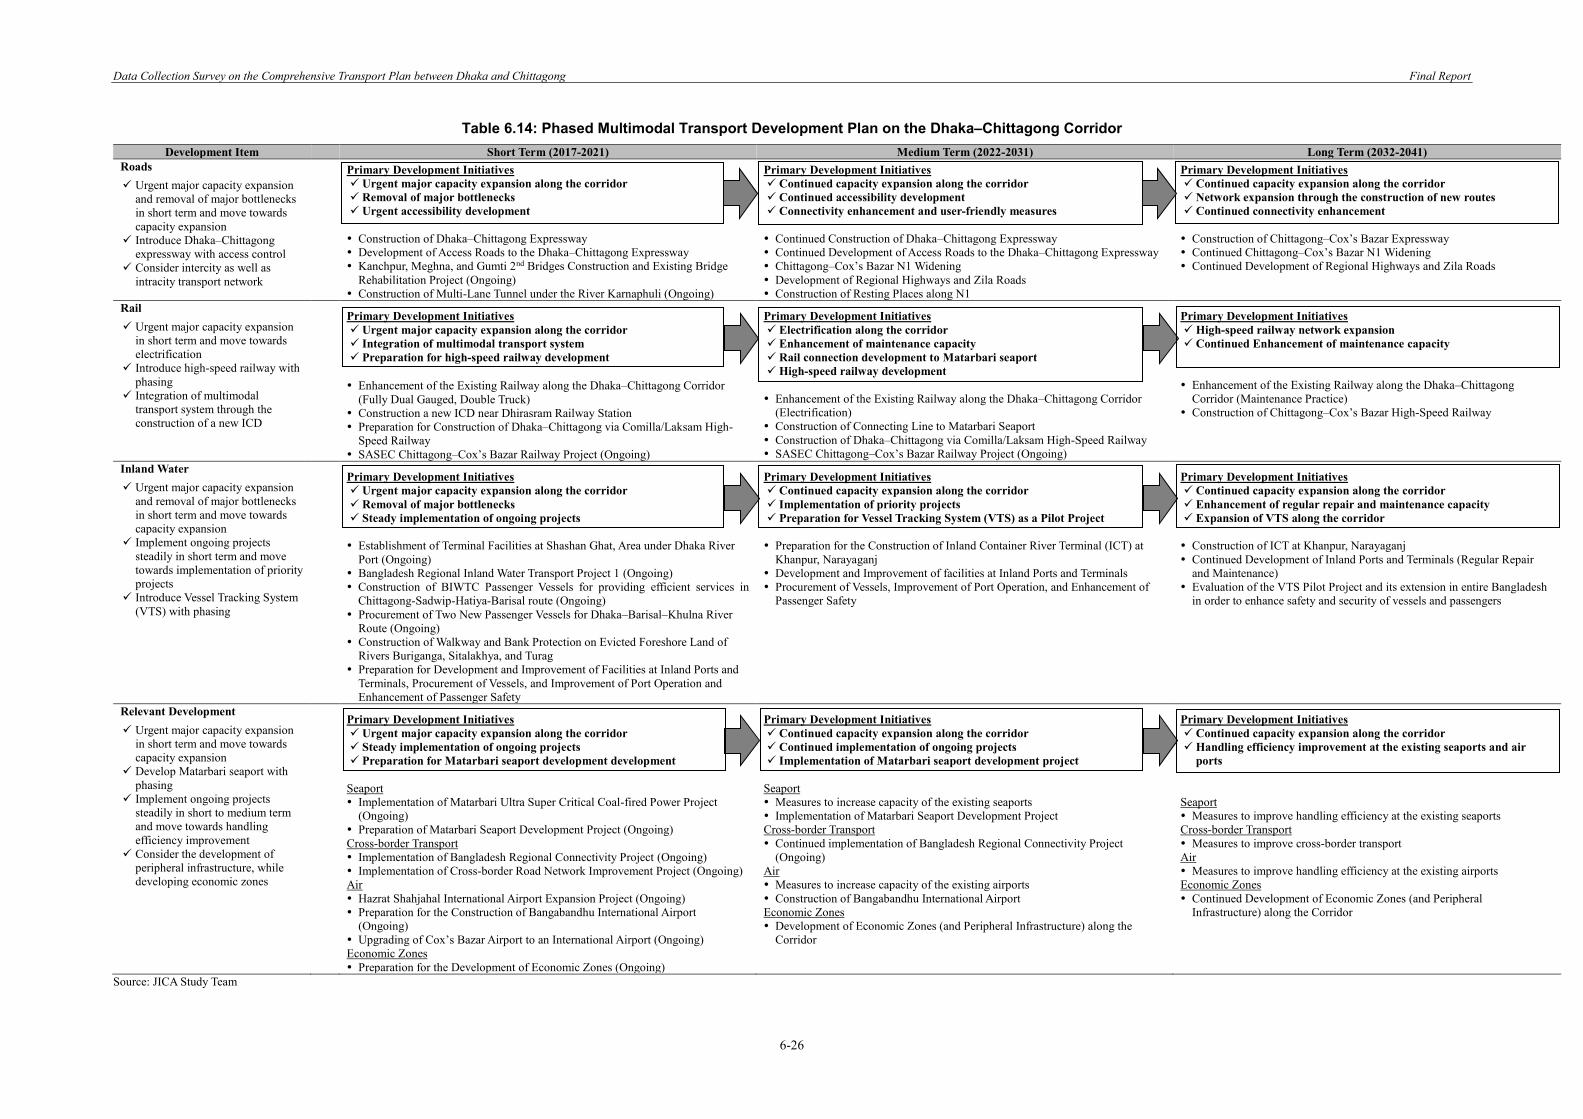
Data Collection Survey on the Comprehensive Transport Plan between Dhaka and Chittagong Final Report
6-26
Table 6.14: Phased Multimodal Transport Development Plan on the Dhaka–Chittagong Corridor Development Item Short Term (2017-2021) Medium Term (2022-2031) Long Term (2032-2041)
Roads ✓ Urgent major capacity expansion
and removal of major bottlenecks in short term and move towards capacity expansion
✓ Introduce Dhaka–Chittagong expressway with access control
✓ Consider intercity as well as intracity transport network
Primary Development Initiatives ✓ Urgent major capacity expansion along the corridor ✓ Removal of major bottlenecks ✓ Urgent accessibility development
Construction of Dhaka–Chittagong Expressway Development of Access Roads to the Dhaka–Chittagong Expressway Kanchpur, Meghna, and Gumti 2nd Bridges Construction and Existing Bridge
Rehabilitation Project (Ongoing) Construction of Multi-Lane Tunnel under the River Karnaphuli (Ongoing)
Primary Development Initiatives ✓ Continued capacity expansion along the corridor ✓ Continued accessibility development ✓ Connectivity enhancement and user-friendly measures
Continued Construction of Dhaka–Chittagong Expressway Continued Development of Access Roads to the Dhaka–Chittagong Expressway Chittagong–Cox’s Bazar N1 Widening Development of Regional Highways and Zila Roads Construction of Resting Places along N1
Primary Development Initiatives ✓ Continued capacity expansion along the corridor ✓ Network expansion through the construction of new routes ✓ Continued connectivity enhancement
Construction of Chittagong–Cox’s Bazar Expressway Continued Chittagong–Cox’s Bazar N1 Widening Continued Development of Regional Highways and Zila Roads
Rail ✓ Urgent major capacity expansion
in short term and move towards electrification
✓ Introduce high-speed railway with phasing
✓ Integration of multimodal transport system through the construction of a new ICD
Primary Development Initiatives ✓ Urgent major capacity expansion along the corridor ✓ Integration of multimodal transport system ✓ Preparation for high-speed railway development
Enhancement of the Existing Railway along the Dhaka–Chittagong Corridor
(Fully Dual Gauged, Double Truck) Construction a new ICD near Dhirasram Railway Station Preparation for Construction of Dhaka–Chittagong via Comilla/Laksam High-
Speed Railway SASEC Chittagong–Cox’s Bazar Railway Project (Ongoing)
Primary Development Initiatives ✓ Electrification along the corridor ✓ Enhancement of maintenance capacity ✓ Rail connection development to Matarbari seaport ✓ High-speed railway development
Enhancement of the Existing Railway along the Dhaka–Chittagong Corridor
(Electrification) Construction of Connecting Line to Matarbari Seaport Construction of Dhaka–Chittagong via Comilla/Laksam High-Speed Railway SASEC Chittagong–Cox’s Bazar Railway Project (Ongoing)
Primary Development Initiatives ✓ High-speed railway network expansion ✓ Continued Enhancement of maintenance capacity
Enhancement of the Existing Railway along the Dhaka–Chittagong
Corridor (Maintenance Practice) Construction of Chittagong–Cox’s Bazar High-Speed Railway
Inland Water ✓ Urgent major capacity expansion
and removal of major bottlenecks in short term and move towards capacity expansion
✓ Implement ongoing projects steadily in short term and move towards implementation of priority projects
✓ Introduce Vessel Tracking System (VTS) with phasing
Primary Development Initiatives ✓ Urgent major capacity expansion along the corridor ✓ Removal of major bottlenecks ✓ Steady implementation of ongoing projects
Establishment of Terminal Facilities at Shashan Ghat, Area under Dhaka River
Port (Ongoing) Bangladesh Regional Inland Water Transport Project 1 (Ongoing) Construction of BIWTC Passenger Vessels for providing efficient services in
Chittagong-Sadwip-Hatiya-Barisal route (Ongoing) Procurement of Two New Passenger Vessels for Dhaka–Barisal–Khulna River
Route (Ongoing) Construction of Walkway and Bank Protection on Evicted Foreshore Land of
Rivers Buriganga, Sitalakhya, and Turag Preparation for Development and Improvement of Facilities at Inland Ports and
Terminals, Procurement of Vessels, and Improvement of Port Operation and Enhancement of Passenger Safety
Primary Development Initiatives ✓ Continued capacity expansion along the corridor ✓ Implementation of priority projects ✓ Preparation for Vessel Tracking System (VTS) as a Pilot Project
Preparation for the Construction of Inland Container River Terminal (ICT) at
Khanpur, Narayaganj Development and Improvement of facilities at Inland Ports and Terminals Procurement of Vessels, Improvement of Port Operation, and Enhancement of
Passenger Safety
Primary Development Initiatives ✓ Continued capacity expansion along the corridor ✓ Enhancement of regular repair and maintenance capacity ✓ Expansion of VTS along the corridor
Construction of ICT at Khanpur, Narayaganj Continued Development of Inland Ports and Terminals (Regular Repair
and Maintenance) Evaluation of the VTS Pilot Project and its extension in entire Bangladesh
in order to enhance safety and security of vessels and passengers
Relevant Development ✓ Urgent major capacity expansion
in short term and move towards capacity expansion
✓ Develop Matarbari seaport with phasing
✓ Implement ongoing projects steadily in short to medium term and move towards handling efficiency improvement
✓ Consider the development of peripheral infrastructure, while developing economic zones
Primary Development Initiatives ✓ Urgent major capacity expansion along the corridor ✓ Steady implementation of ongoing projects ✓ Preparation for Matarbari seaport development development
Seaport Implementation of Matarbari Ultra Super Critical Coal-fired Power Project
(Ongoing) Preparation of Matarbari Seaport Development Project (Ongoing) Cross-border Transport Implementation of Bangladesh Regional Connectivity Project (Ongoing) Implementation of Cross-border Road Network Improvement Project (Ongoing) Air Hazrat Shahjahal International Airport Expansion Project (Ongoing) Preparation for the Construction of Bangabandhu International Airport
(Ongoing) Upgrading of Cox’s Bazar Airport to an International Airport (Ongoing) Economic Zones Preparation for the Development of Economic Zones (Ongoing)
Primary Development Initiatives ✓ Continued capacity expansion along the corridor ✓ Continued implementation of ongoing projects ✓ Implementation of Matarbari seaport development project
Seaport Measures to increase capacity of the existing seaports Implementation of Matarbari Seaport Development Project Cross-border Transport Continued implementation of Bangladesh Regional Connectivity Project
(Ongoing) Air Measures to increase capacity of the existing airports Construction of Bangabandhu International Airport Economic Zones Development of Economic Zones (and Peripheral Infrastructure) along the
Corridor
Primary Development Initiatives ✓ Continued capacity expansion along the corridor ✓ Handling efficiency improvement at the existing seaports and air
ports
Seaport Measures to improve handling efficiency at the existing seaports Cross-border Transport Measures to improve cross-border transport Air Measures to improve handling efficiency at the existing airports Economic Zones Continued Development of Economic Zones (and Peripheral
Infrastructure) along the Corridor
Source: JICA Study Team

Appendices

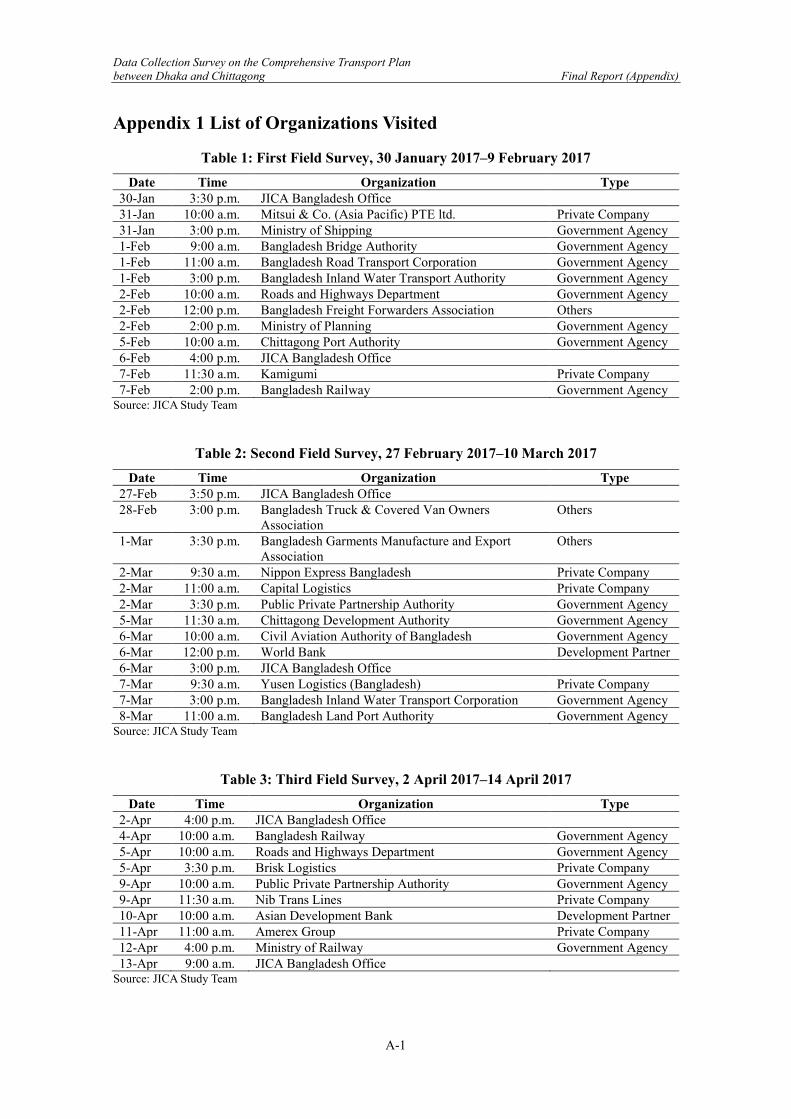
Data Collection Survey on the Comprehensive Transport Plan between Dhaka and Chittagong Final Report (Appendix)
A-1
Appendix 1 List of Organizations Visited
Table 1: First Field Survey, 30 January 2017–9 February 2017 Date Time Organization Type
30-Jan 3:30 p.m. JICA Bangladesh Office
31-Jan 10:00 a.m. Mitsui & Co. (Asia Pacific) PTE ltd. Private Company 31-Jan 3:00 p.m. Ministry of Shipping Government Agency 1-Feb 9:00 a.m. Bangladesh Bridge Authority Government Agency 1-Feb 11:00 a.m. Bangladesh Road Transport Corporation Government Agency 1-Feb 3:00 p.m. Bangladesh Inland Water Transport Authority Government Agency 2-Feb 10:00 a.m. Roads and Highways Department Government Agency 2-Feb 12:00 p.m. Bangladesh Freight Forwarders Association Others 2-Feb 2:00 p.m. Ministry of Planning Government Agency 5-Feb 10:00 a.m. Chittagong Port Authority Government Agency 6-Feb 4:00 p.m. JICA Bangladesh Office 7-Feb 11:30 a.m. Kamigumi Private Company 7-Feb 2:00 p.m. Bangladesh Railway Government Agency
Source: JICA Study Team
Table 2: Second Field Survey, 27 February 2017–10 March 2017 Date Time Organization Type
27-Feb 3:50 p.m. JICA Bangladesh Office
28-Feb 3:00 p.m. Bangladesh Truck & Covered Van Owners Association
Others
1-Mar 3:30 p.m. Bangladesh Garments Manufacture and Export Association
Others
2-Mar 9:30 a.m. Nippon Express Bangladesh Private Company 2-Mar 11:00 a.m. Capital Logistics Private Company 2-Mar 3:30 p.m. Public Private Partnership Authority Government Agency 5-Mar 11:30 a.m. Chittagong Development Authority Government Agency 6-Mar 10:00 a.m. Civil Aviation Authority of Bangladesh Government Agency 6-Mar 12:00 p.m. World Bank Development Partner 6-Mar 3:00 p.m. JICA Bangladesh Office 7-Mar 9:30 a.m. Yusen Logistics (Bangladesh) Private Company 7-Mar 3:00 p.m. Bangladesh Inland Water Transport Corporation Government Agency 8-Mar 11:00 a.m. Bangladesh Land Port Authority Government Agency
Source: JICA Study Team
Table 3: Third Field Survey, 2 April 2017–14 April 2017 Date Time Organization Type
2-Apr 4:00 p.m. JICA Bangladesh Office
4-Apr 10:00 a.m. Bangladesh Railway Government Agency 5-Apr 10:00 a.m. Roads and Highways Department Government Agency 5-Apr 3:30 p.m. Brisk Logistics Private Company 9-Apr 10:00 a.m. Public Private Partnership Authority Government Agency 9-Apr 11:30 a.m. Nib Trans Lines Private Company 10-Apr 10:00 a.m. Asian Development Bank Development Partner 11-Apr 11:00 a.m. Amerex Group Private Company 12-Apr 4:00 p.m. Ministry of Railway Government Agency 13-Apr 9:00 a.m. JICA Bangladesh Office
Source: JICA Study Team
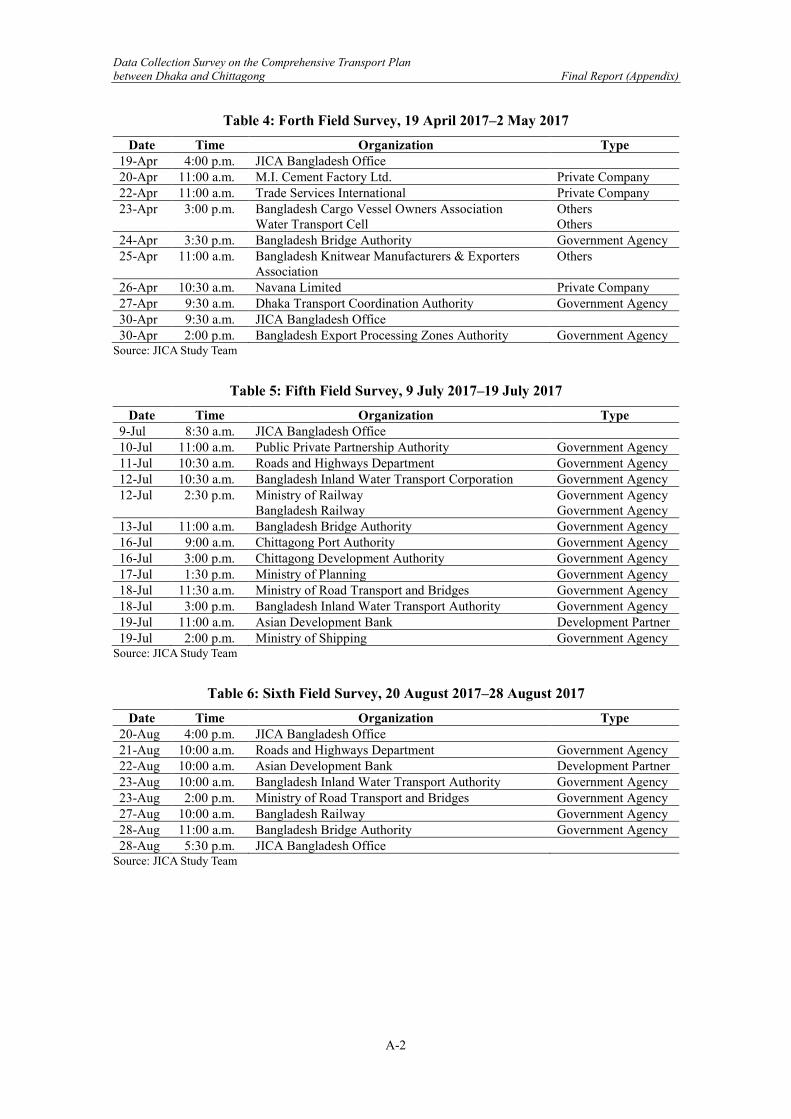
Data Collection Survey on the Comprehensive Transport Plan between Dhaka and Chittagong Final Report (Appendix)
A-2
Table 4: Forth Field Survey, 19 April 2017–2 May 2017 Date Time Organization Type
19-Apr 4:00 p.m. JICA Bangladesh Office
20-Apr 11:00 a.m. M.I. Cement Factory Ltd. Private Company 22-Apr 11:00 a.m. Trade Services International Private Company 23-Apr 3:00 p.m. Bangladesh Cargo Vessel Owners Association
Water Transport Cell Others Others
24-Apr 3:30 p.m. Bangladesh Bridge Authority Government Agency 25-Apr 11:00 a.m. Bangladesh Knitwear Manufacturers & Exporters
Association Others
26-Apr 10:30 a.m. Navana Limited Private Company 27-Apr 9:30 a.m. Dhaka Transport Coordination Authority Government Agency 30-Apr 9:30 a.m. JICA Bangladesh Office 30-Apr 2:00 p.m. Bangladesh Export Processing Zones Authority Government Agency
Source: JICA Study Team
Table 5: Fifth Field Survey, 9 July 2017–19 July 2017 Date Time Organization Type
9-Jul 8:30 a.m. JICA Bangladesh Office
10-Jul 11:00 a.m. Public Private Partnership Authority Government Agency 11-Jul 10:30 a.m. Roads and Highways Department Government Agency 12-Jul 10:30 a.m. Bangladesh Inland Water Transport Corporation Government Agency 12-Jul 2:30 p.m. Ministry of Railway
Bangladesh Railway Government Agency Government Agency
13-Jul 11:00 a.m. Bangladesh Bridge Authority Government Agency 16-Jul 9:00 a.m. Chittagong Port Authority Government Agency 16-Jul 3:00 p.m. Chittagong Development Authority Government Agency 17-Jul 1:30 p.m. Ministry of Planning Government Agency 18-Jul 11:30 a.m. Ministry of Road Transport and Bridges Government Agency 18-Jul 3:00 p.m. Bangladesh Inland Water Transport Authority Government Agency 19-Jul 11:00 a.m. Asian Development Bank Development Partner 19-Jul 2:00 p.m. Ministry of Shipping Government Agency
Source: JICA Study Team
Table 6: Sixth Field Survey, 20 August 2017–28 August 2017 Date Time Organization Type
20-Aug 4:00 p.m. JICA Bangladesh Office
21-Aug 10:00 a.m. Roads and Highways Department Government Agency 22-Aug 10:00 a.m. Asian Development Bank Development Partner 23-Aug 10:00 a.m. Bangladesh Inland Water Transport Authority Government Agency 23-Aug 2:00 p.m. Ministry of Road Transport and Bridges Government Agency 27-Aug 10:00 a.m. Bangladesh Railway Government Agency 28-Aug 11:00 a.m. Bangladesh Bridge Authority Government Agency 28-Aug 5:30 p.m. JICA Bangladesh Office
Source: JICA Study Team
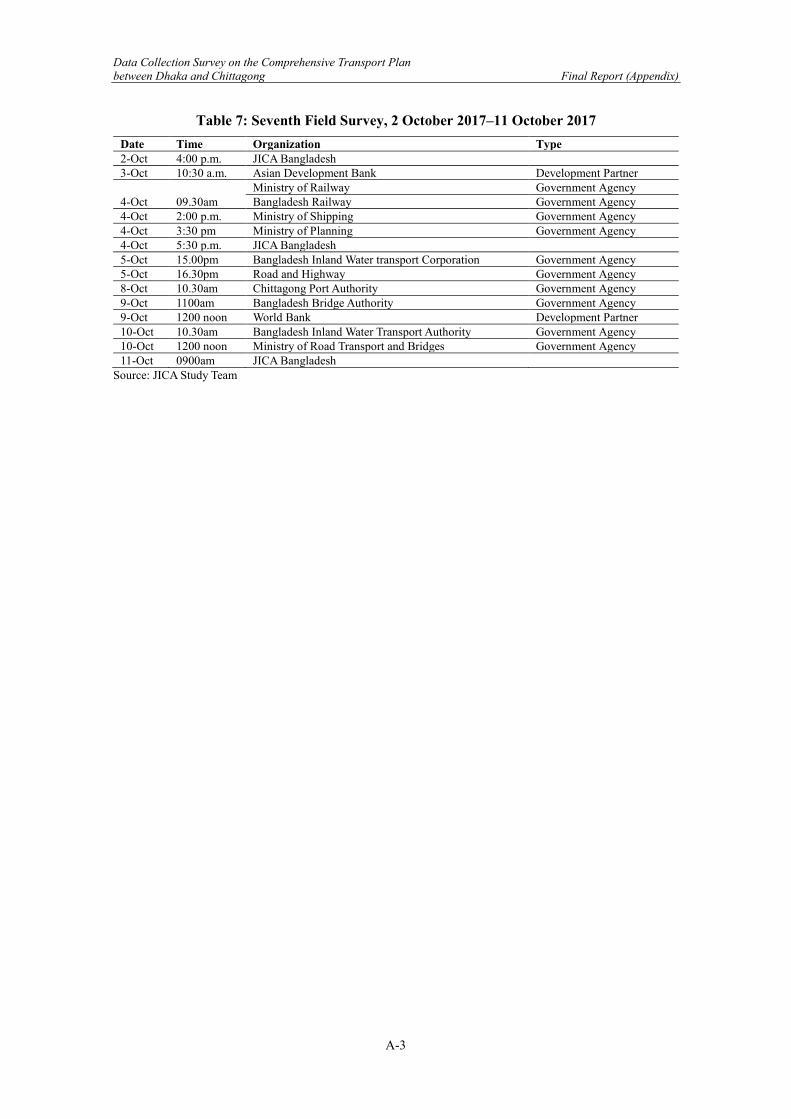
Data Collection Survey on the Comprehensive Transport Plan between Dhaka and Chittagong Final Report (Appendix)
A-3
Table 7: Seventh Field Survey, 2 October 2017–11 October 2017 Date Time Organization Type 2-Oct 4:00 p.m. JICA Bangladesh 3-Oct 10:30 a.m. Asian Development Bank Development Partner
4-Oct 09.30am Ministry of Railway Government Agency Bangladesh Railway Government Agency
4-Oct 2:00 p.m. Ministry of Shipping Government Agency 4-Oct 3:30 pm Ministry of Planning Government Agency 4-Oct 5:30 p.m. JICA Bangladesh 5-Oct 15.00pm Bangladesh Inland Water transport Corporation Government Agency 5-Oct 16.30pm Road and Highway Government Agency 8-Oct 10.30am Chittagong Port Authority Government Agency 9-Oct 1100am Bangladesh Bridge Authority Government Agency 9-Oct 1200 noon World Bank Development Partner 10-Oct 10.30am Bangladesh Inland Water Transport Authority Government Agency 10-Oct 1200 noon Ministry of Road Transport and Bridges Government Agency 11-Oct 0900am JICA Bangladesh
Source: JICA Study Team
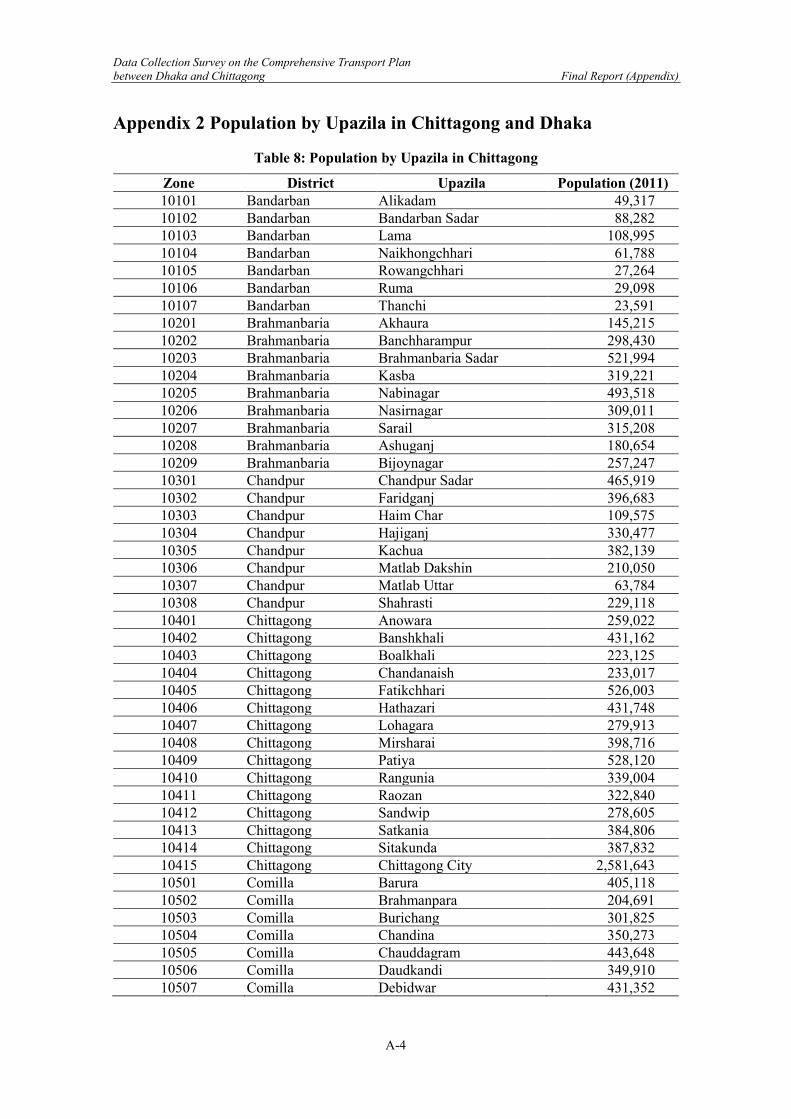
Data Collection Survey on the Comprehensive Transport Plan between Dhaka and Chittagong Final Report (Appendix)
A-4
Appendix 2 Population by Upazila in Chittagong and Dhaka
Table 8: Population by Upazila in Chittagong
Zone District Upazila Population (2011) 10101 Bandarban Alikadam 49,317 10102 Bandarban Bandarban Sadar 88,282 10103 Bandarban Lama 108,995 10104 Bandarban Naikhongchhari 61,788 10105 Bandarban Rowangchhari 27,264 10106 Bandarban Ruma 29,098 10107 Bandarban Thanchi 23,591 10201 Brahmanbaria Akhaura 145,215 10202 Brahmanbaria Banchharampur 298,430 10203 Brahmanbaria Brahmanbaria Sadar 521,994 10204 Brahmanbaria Kasba 319,221 10205 Brahmanbaria Nabinagar 493,518 10206 Brahmanbaria Nasirnagar 309,011 10207 Brahmanbaria Sarail 315,208 10208 Brahmanbaria Ashuganj 180,654 10209 Brahmanbaria Bijoynagar 257,247 10301 Chandpur Chandpur Sadar 465,919 10302 Chandpur Faridganj 396,683 10303 Chandpur Haim Char 109,575 10304 Chandpur Hajiganj 330,477 10305 Chandpur Kachua 382,139 10306 Chandpur Matlab Dakshin 210,050 10307 Chandpur Matlab Uttar 63,784 10308 Chandpur Shahrasti 229,118 10401 Chittagong Anowara 259,022 10402 Chittagong Banshkhali 431,162 10403 Chittagong Boalkhali 223,125 10404 Chittagong Chandanaish 233,017 10405 Chittagong Fatikchhari 526,003 10406 Chittagong Hathazari 431,748 10407 Chittagong Lohagara 279,913 10408 Chittagong Mirsharai 398,716 10409 Chittagong Patiya 528,120 10410 Chittagong Rangunia 339,004 10411 Chittagong Raozan 322,840 10412 Chittagong Sandwip 278,605 10413 Chittagong Satkania 384,806 10414 Chittagong Sitakunda 387,832 10415 Chittagong Chittagong City 2,581,643 10501 Comilla Barura 405,118 10502 Comilla Brahmanpara 204,691 10503 Comilla Burichang 301,825 10504 Comilla Chandina 350,273 10505 Comilla Chauddagram 443,648 10506 Comilla Daudkandi 349,910 10507 Comilla Debidwar 431,352
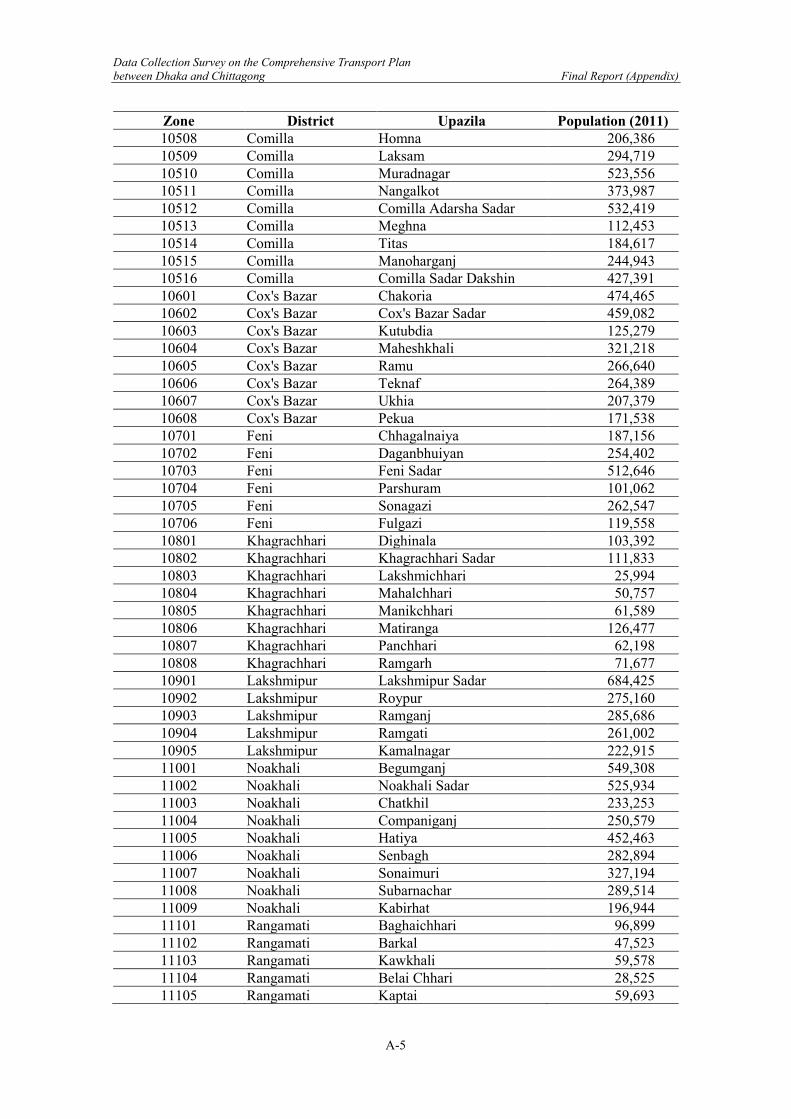
Data Collection Survey on the Comprehensive Transport Plan between Dhaka and Chittagong Final Report (Appendix)
A-5
Zone District Upazila Population (2011) 10508 Comilla Homna 206,386 10509 Comilla Laksam 294,719 10510 Comilla Muradnagar 523,556 10511 Comilla Nangalkot 373,987 10512 Comilla Comilla Adarsha Sadar 532,419 10513 Comilla Meghna 112,453 10514 Comilla Titas 184,617 10515 Comilla Manoharganj 244,943 10516 Comilla Comilla Sadar Dakshin 427,391 10601 Cox's Bazar Chakoria 474,465 10602 Cox's Bazar Cox's Bazar Sadar 459,082 10603 Cox's Bazar Kutubdia 125,279 10604 Cox's Bazar Maheshkhali 321,218 10605 Cox's Bazar Ramu 266,640 10606 Cox's Bazar Teknaf 264,389 10607 Cox's Bazar Ukhia 207,379 10608 Cox's Bazar Pekua 171,538 10701 Feni Chhagalnaiya 187,156 10702 Feni Daganbhuiyan 254,402 10703 Feni Feni Sadar 512,646 10704 Feni Parshuram 101,062 10705 Feni Sonagazi 262,547 10706 Feni Fulgazi 119,558 10801 Khagrachhari Dighinala 103,392 10802 Khagrachhari Khagrachhari Sadar 111,833 10803 Khagrachhari Lakshmichhari 25,994 10804 Khagrachhari Mahalchhari 50,757 10805 Khagrachhari Manikchhari 61,589 10806 Khagrachhari Matiranga 126,477 10807 Khagrachhari Panchhari 62,198 10808 Khagrachhari Ramgarh 71,677 10901 Lakshmipur Lakshmipur Sadar 684,425 10902 Lakshmipur Roypur 275,160 10903 Lakshmipur Ramganj 285,686 10904 Lakshmipur Ramgati 261,002 10905 Lakshmipur Kamalnagar 222,915 11001 Noakhali Begumganj 549,308 11002 Noakhali Noakhali Sadar 525,934 11003 Noakhali Chatkhil 233,253 11004 Noakhali Companiganj 250,579 11005 Noakhali Hatiya 452,463 11006 Noakhali Senbagh 282,894 11007 Noakhali Sonaimuri 327,194 11008 Noakhali Subarnachar 289,514 11009 Noakhali Kabirhat 196,944 11101 Rangamati Baghaichhari 96,899 11102 Rangamati Barkal 47,523 11103 Rangamati Kawkhali 59,578 11104 Rangamati Belai Chhari 28,525 11105 Rangamati Kaptai 59,693
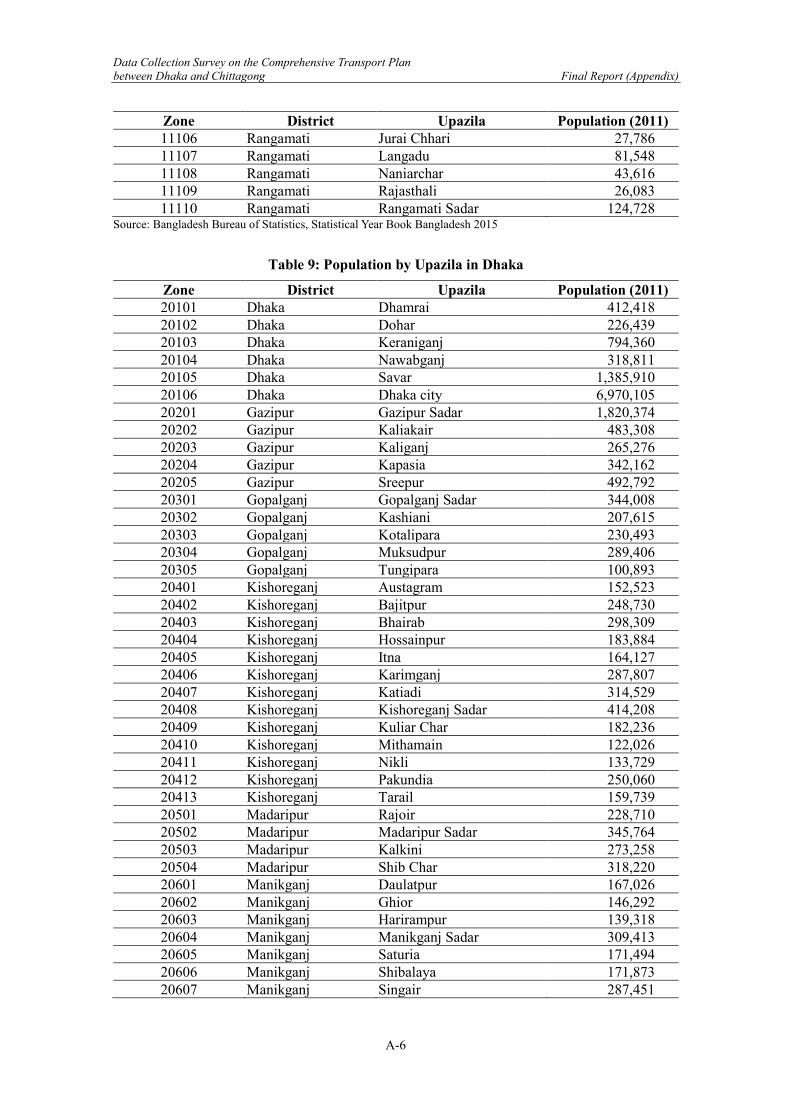
Data Collection Survey on the Comprehensive Transport Plan between Dhaka and Chittagong Final Report (Appendix)
A-6
Zone District Upazila Population (2011) 11106 Rangamati Jurai Chhari 27,786 11107 Rangamati Langadu 81,548 11108 Rangamati Naniarchar 43,616 11109 Rangamati Rajasthali 26,083 11110 Rangamati Rangamati Sadar 124,728
Source: Bangladesh Bureau of Statistics, Statistical Year Book Bangladesh 2015
Table 9: Population by Upazila in Dhaka
Zone District Upazila Population (2011) 20101 Dhaka Dhamrai 412,418 20102 Dhaka Dohar 226,439 20103 Dhaka Keraniganj 794,360 20104 Dhaka Nawabganj 318,811 20105 Dhaka Savar 1,385,910 20106 Dhaka Dhaka city 6,970,105 20201 Gazipur Gazipur Sadar 1,820,374 20202 Gazipur Kaliakair 483,308 20203 Gazipur Kaliganj 265,276 20204 Gazipur Kapasia 342,162 20205 Gazipur Sreepur 492,792 20301 Gopalganj Gopalganj Sadar 344,008 20302 Gopalganj Kashiani 207,615 20303 Gopalganj Kotalipara 230,493 20304 Gopalganj Muksudpur 289,406 20305 Gopalganj Tungipara 100,893 20401 Kishoreganj Austagram 152,523 20402 Kishoreganj Bajitpur 248,730 20403 Kishoreganj Bhairab 298,309 20404 Kishoreganj Hossainpur 183,884 20405 Kishoreganj Itna 164,127 20406 Kishoreganj Karimganj 287,807 20407 Kishoreganj Katiadi 314,529 20408 Kishoreganj Kishoreganj Sadar 414,208 20409 Kishoreganj Kuliar Char 182,236 20410 Kishoreganj Mithamain 122,026 20411 Kishoreganj Nikli 133,729 20412 Kishoreganj Pakundia 250,060 20413 Kishoreganj Tarail 159,739 20501 Madaripur Rajoir 228,710 20502 Madaripur Madaripur Sadar 345,764 20503 Madaripur Kalkini 273,258 20504 Madaripur Shib Char 318,220 20601 Manikganj Daulatpur 167,026 20602 Manikganj Ghior 146,292 20603 Manikganj Harirampur 139,318 20604 Manikganj Manikganj Sadar 309,413 20605 Manikganj Saturia 171,494 20606 Manikganj Shibalaya 171,873 20607 Manikganj Singair 287,451
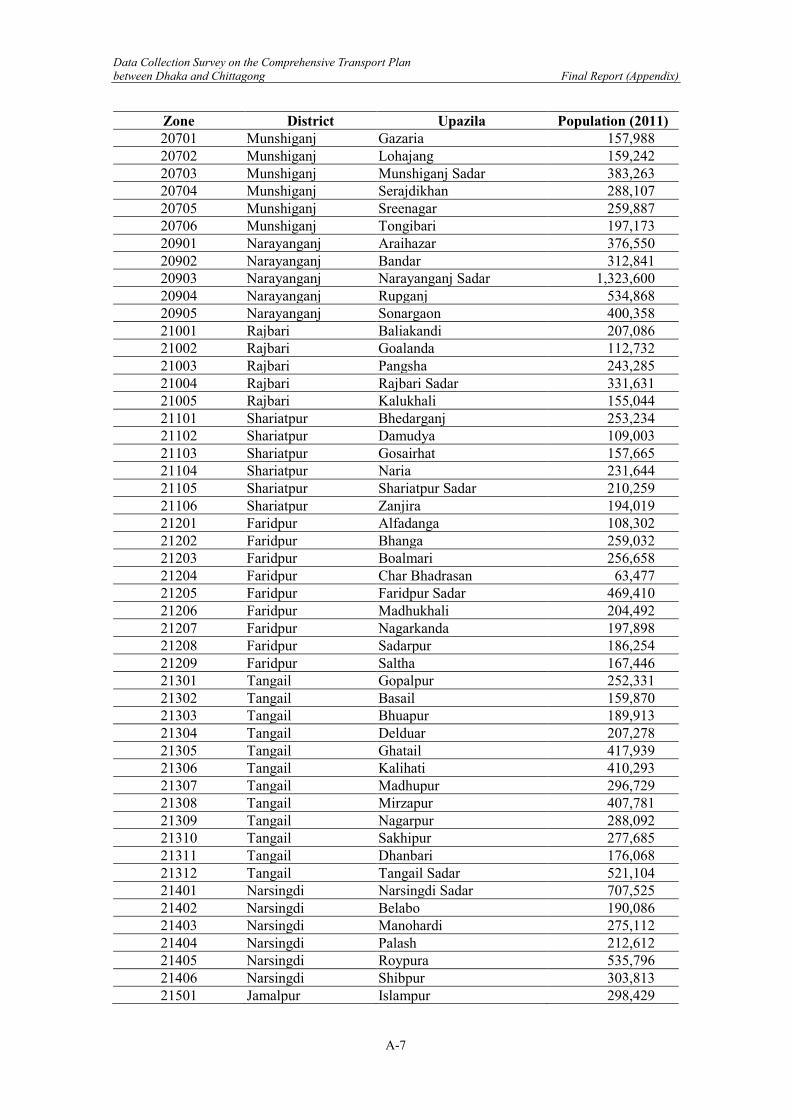
Data Collection Survey on the Comprehensive Transport Plan between Dhaka and Chittagong Final Report (Appendix)
A-7
Zone District Upazila Population (2011) 20701 Munshiganj Gazaria 157,988 20702 Munshiganj Lohajang 159,242 20703 Munshiganj Munshiganj Sadar 383,263 20704 Munshiganj Serajdikhan 288,107 20705 Munshiganj Sreenagar 259,887 20706 Munshiganj Tongibari 197,173 20901 Narayanganj Araihazar 376,550 20902 Narayanganj Bandar 312,841 20903 Narayanganj Narayanganj Sadar 1,323,600 20904 Narayanganj Rupganj 534,868 20905 Narayanganj Sonargaon 400,358 21001 Rajbari Baliakandi 207,086 21002 Rajbari Goalanda 112,732 21003 Rajbari Pangsha 243,285 21004 Rajbari Rajbari Sadar 331,631 21005 Rajbari Kalukhali 155,044 21101 Shariatpur Bhedarganj 253,234 21102 Shariatpur Damudya 109,003 21103 Shariatpur Gosairhat 157,665 21104 Shariatpur Naria 231,644 21105 Shariatpur Shariatpur Sadar 210,259 21106 Shariatpur Zanjira 194,019 21201 Faridpur Alfadanga 108,302 21202 Faridpur Bhanga 259,032 21203 Faridpur Boalmari 256,658 21204 Faridpur Char Bhadrasan 63,477 21205 Faridpur Faridpur Sadar 469,410 21206 Faridpur Madhukhali 204,492 21207 Faridpur Nagarkanda 197,898 21208 Faridpur Sadarpur 186,254 21209 Faridpur Saltha 167,446 21301 Tangail Gopalpur 252,331 21302 Tangail Basail 159,870 21303 Tangail Bhuapur 189,913 21304 Tangail Delduar 207,278 21305 Tangail Ghatail 417,939 21306 Tangail Kalihati 410,293 21307 Tangail Madhupur 296,729 21308 Tangail Mirzapur 407,781 21309 Tangail Nagarpur 288,092 21310 Tangail Sakhipur 277,685 21311 Tangail Dhanbari 176,068 21312 Tangail Tangail Sadar 521,104 21401 Narsingdi Narsingdi Sadar 707,525 21402 Narsingdi Belabo 190,086 21403 Narsingdi Manohardi 275,112 21404 Narsingdi Palash 212,612 21405 Narsingdi Roypura 535,796 21406 Narsingdi Shibpur 303,813 21501 Jamalpur Islampur 298,429
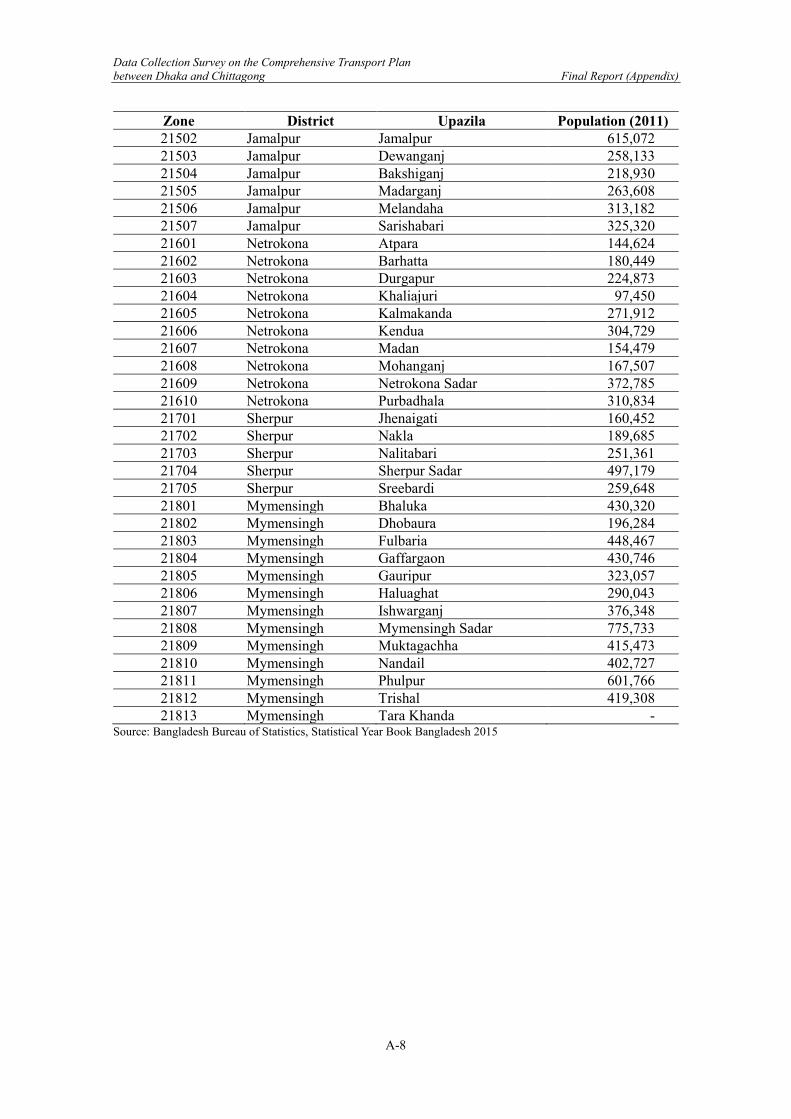
Data Collection Survey on the Comprehensive Transport Plan between Dhaka and Chittagong Final Report (Appendix)
A-8
Zone District Upazila Population (2011) 21502 Jamalpur Jamalpur 615,072 21503 Jamalpur Dewanganj 258,133 21504 Jamalpur Bakshiganj 218,930 21505 Jamalpur Madarganj 263,608 21506 Jamalpur Melandaha 313,182 21507 Jamalpur Sarishabari 325,320 21601 Netrokona Atpara 144,624 21602 Netrokona Barhatta 180,449 21603 Netrokona Durgapur 224,873 21604 Netrokona Khaliajuri 97,450 21605 Netrokona Kalmakanda 271,912 21606 Netrokona Kendua 304,729 21607 Netrokona Madan 154,479 21608 Netrokona Mohanganj 167,507 21609 Netrokona Netrokona Sadar 372,785 21610 Netrokona Purbadhala 310,834 21701 Sherpur Jhenaigati 160,452 21702 Sherpur Nakla 189,685 21703 Sherpur Nalitabari 251,361 21704 Sherpur Sherpur Sadar 497,179 21705 Sherpur Sreebardi 259,648 21801 Mymensingh Bhaluka 430,320 21802 Mymensingh Dhobaura 196,284 21803 Mymensingh Fulbaria 448,467 21804 Mymensingh Gaffargaon 430,746 21805 Mymensingh Gauripur 323,057 21806 Mymensingh Haluaghat 290,043 21807 Mymensingh Ishwarganj 376,348 21808 Mymensingh Mymensingh Sadar 775,733 21809 Mymensingh Muktagachha 415,473 21810 Mymensingh Nandail 402,727 21811 Mymensingh Phulpur 601,766 21812 Mymensingh Trishal 419,308 21813 Mymensingh Tara Khanda -
Source: Bangladesh Bureau of Statistics, Statistical Year Book Bangladesh 2015
Data Collection Survey on the Comprehensive Transport Plan between Dhaka and Chittagong Final Report (Appendix)
A-9
Appendix 3 Collected Data of Transport Survey
Available upon request to [email protected] with a permission by JICA.
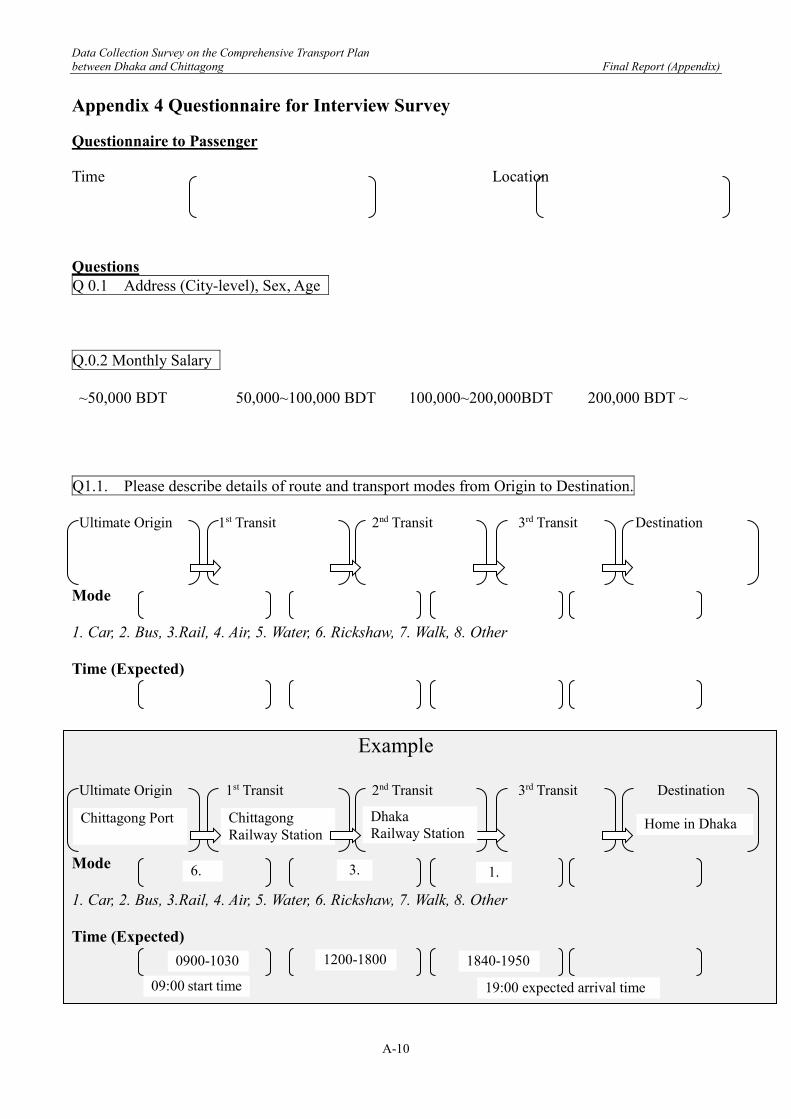
Data Collection Survey on the Comprehensive Transport Plan between Dhaka and Chittagong Final Report (Appendix)
A-10
Appendix 4 Questionnaire for Interview Survey
Questionnaire to Passenger Time Location Questions Q 0.1 Address (City-level), Sex, Age Q.0.2 Monthly Salary ~50,000 BDT 50,000~100,000 BDT 100,000~200,000BDT 200,000 BDT ~
Q1.1. Please describe details of route and transport modes from Origin to Destination. Ultimate Origin 1st Transit 2nd Transit 3rd Transit Destination Mode 1. Car, 2. Bus, 3.Rail, 4. Air, 5. Water, 6. Rickshaw, 7. Walk, 8. Other Time (Expected)
Example Ultimate Origin 1st Transit 2nd Transit 3rd Transit Destination Mode 1. Car, 2. Bus, 3.Rail, 4. Air, 5. Water, 6. Rickshaw, 7. Walk, 8. Other Time (Expected)
Home in Dhaka
6.
Chittagong Railway Station
3. 1.
Chittagong Port Dhaka Railway Station
0900-1030 1200-1800 1840-1950
09:00 start time 19:00 expected arrival time
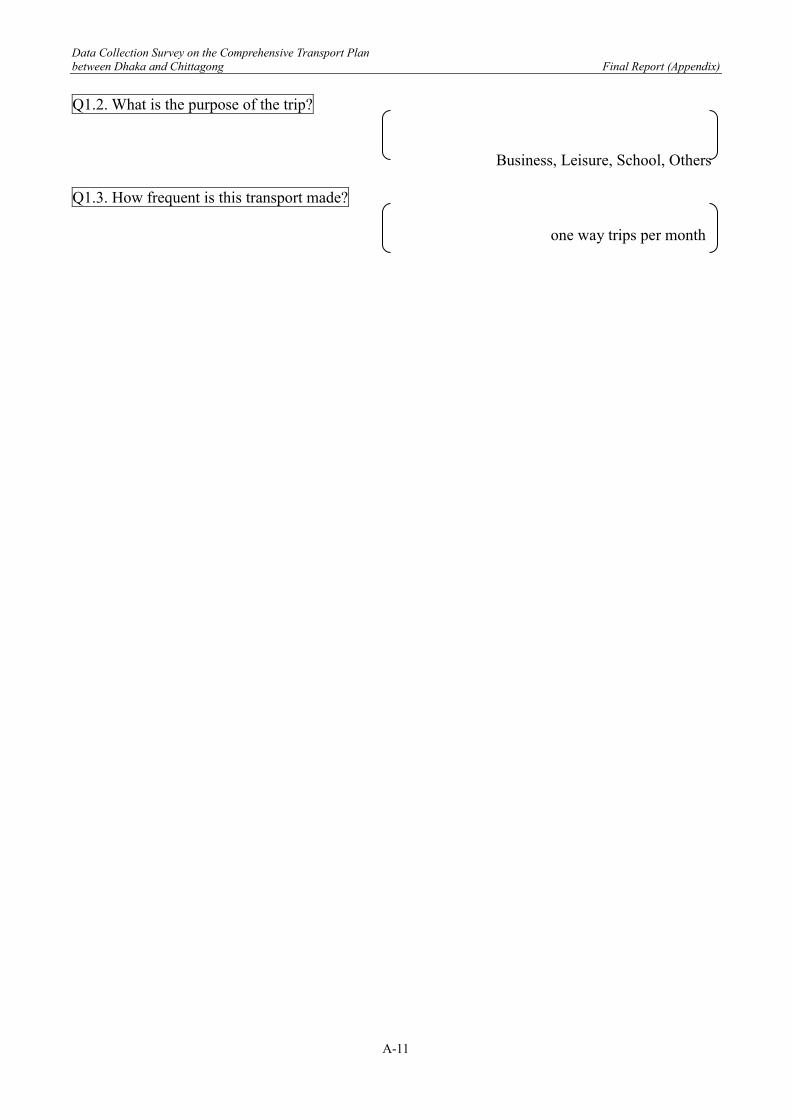
Data Collection Survey on the Comprehensive Transport Plan between Dhaka and Chittagong Final Report (Appendix)
A-11
Q1.2. What is the purpose of the trip?
Business, Leisure, School, Others
Q1.3. How frequent is this transport made?
one way trips per month
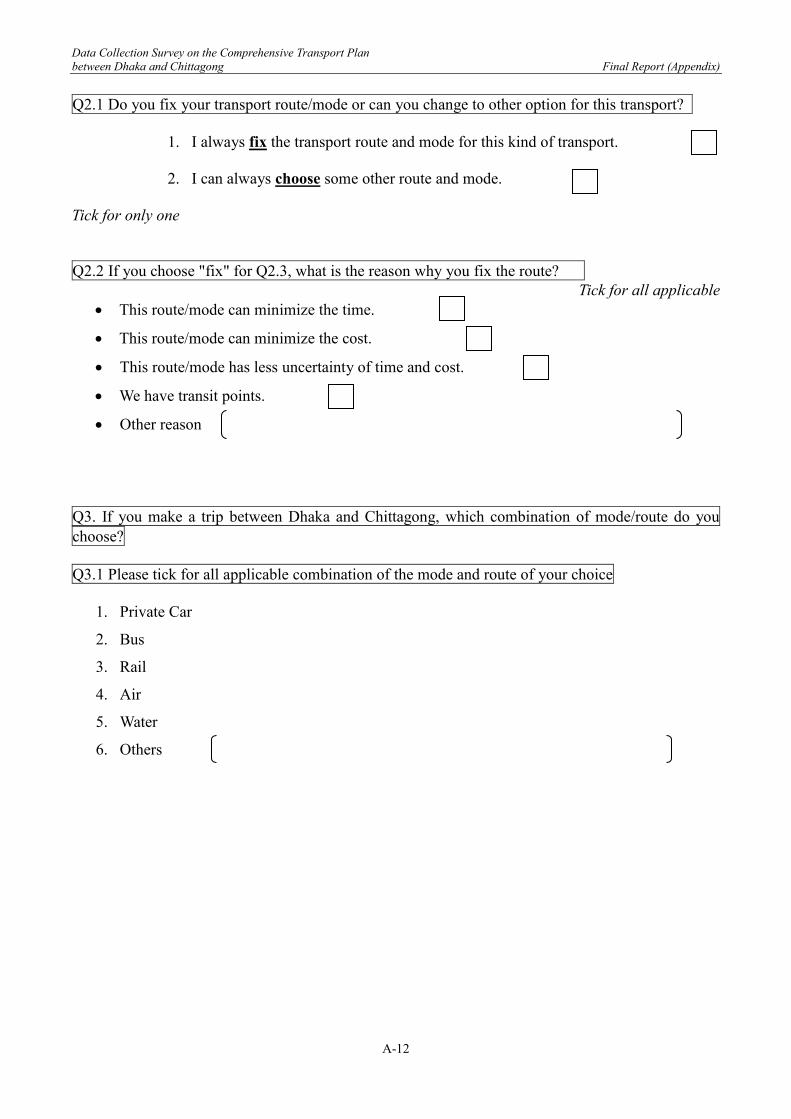
Data Collection Survey on the Comprehensive Transport Plan between Dhaka and Chittagong Final Report (Appendix)
A-12
Q2.1 Do you fix your transport route/mode or can you change to other option for this transport?
1. I always fix the transport route and mode for this kind of transport.
2. I can always choose some other route and mode. Tick for only one Q2.2 If you choose "fix" for Q2.3, what is the reason why you fix the route?
Tick for all applicable • This route/mode can minimize the time.
• This route/mode can minimize the cost.
• This route/mode has less uncertainty of time and cost.
• We have transit points.
• Other reason
Q3. If you make a trip between Dhaka and Chittagong, which combination of mode/route do you choose? Q3.1 Please tick for all applicable combination of the mode and route of your choice
1. Private Car
2. Bus
3. Rail
4. Air
5. Water
6. Others
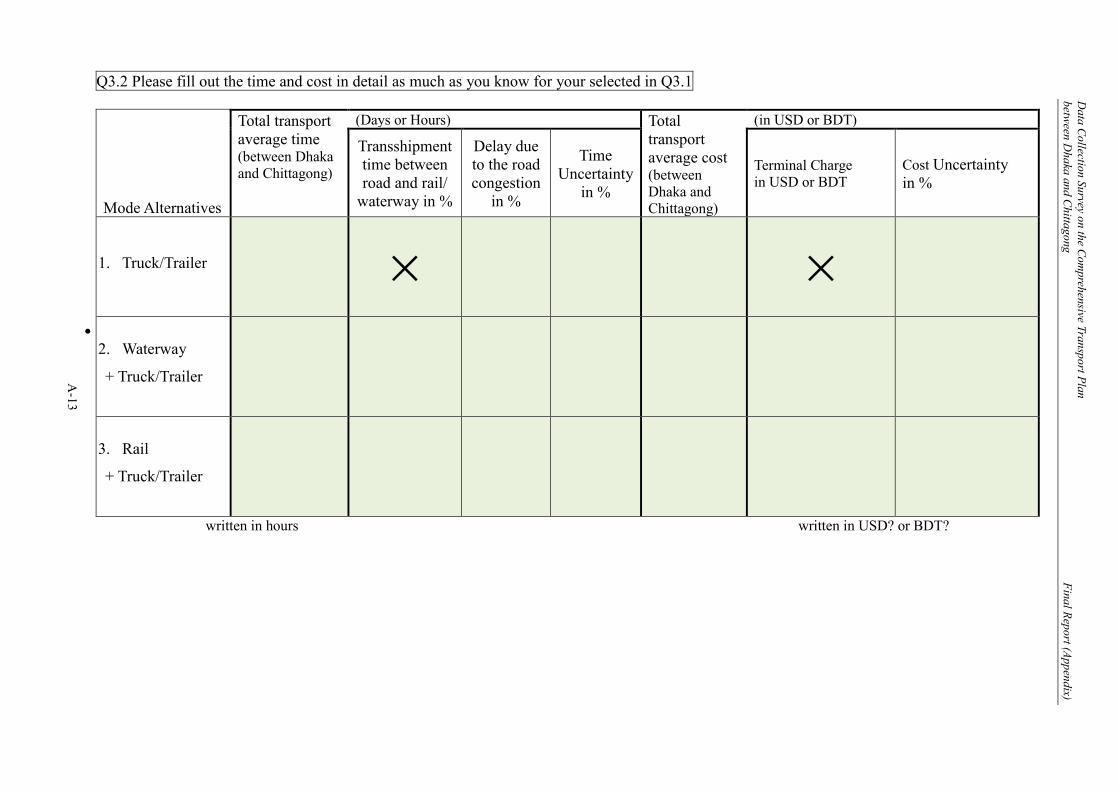
Data Collection Survey on the Com
prehensive Transport Plan betw
een Dhaka and C
hittagong Final Report (Appendix)
•
A-13
Q3.2 Please fill out the time and cost in detail as much as you know for your selected in Q3.1
Mode Alternatives
Total transport average time (between Dhaka and Chittagong)
(Days or Hours) Total transport average cost (between Dhaka and Chittagong)
(in USD or BDT)
Transshipment time between road and rail/
waterway in %
Delay due to the road congestion
in %
Time Uncertainty
in %
Terminal Charge in USD or BDT
Cost Uncertainty in %
1. Truck/Trailer
×
×
2. Waterway
+ Truck/Trailer
3. Rail
+ Truck/Trailer
written in hours written in USD? or BDT?
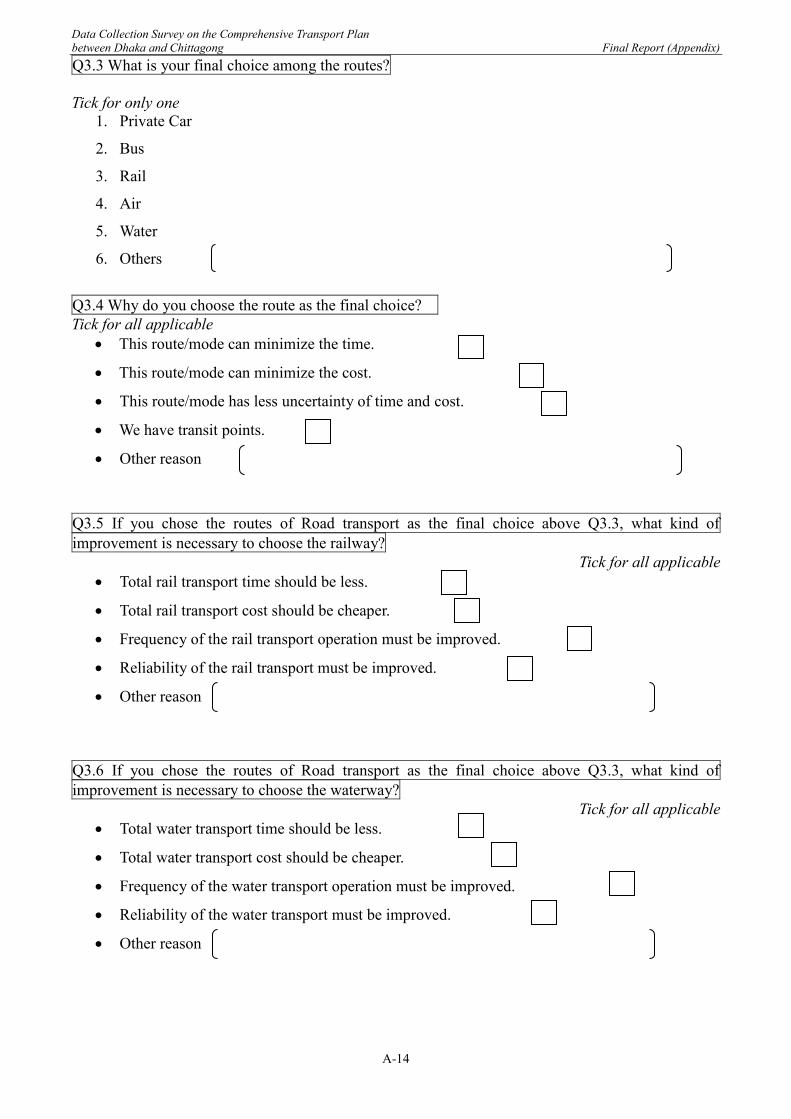
Data Collection Survey on the Comprehensive Transport Plan between Dhaka and Chittagong Final Report (Appendix)
A-14
Q3.3 What is your final choice among the routes? Tick for only one
1. Private Car
2. Bus
3. Rail
4. Air
5. Water
6. Others
Q3.4 Why do you choose the route as the final choice? Tick for all applicable
• This route/mode can minimize the time.
• This route/mode can minimize the cost.
• This route/mode has less uncertainty of time and cost.
• We have transit points.
• Other reason
Q3.5 If you chose the routes of Road transport as the final choice above Q3.3, what kind of improvement is necessary to choose the railway?
Tick for all applicable • Total rail transport time should be less.
• Total rail transport cost should be cheaper.
• Frequency of the rail transport operation must be improved.
• Reliability of the rail transport must be improved.
• Other reason
Q3.6 If you chose the routes of Road transport as the final choice above Q3.3, what kind of improvement is necessary to choose the waterway?
Tick for all applicable • Total water transport time should be less.
• Total water transport cost should be cheaper.
• Frequency of the water transport operation must be improved.
• Reliability of the water transport must be improved.
• Other reason
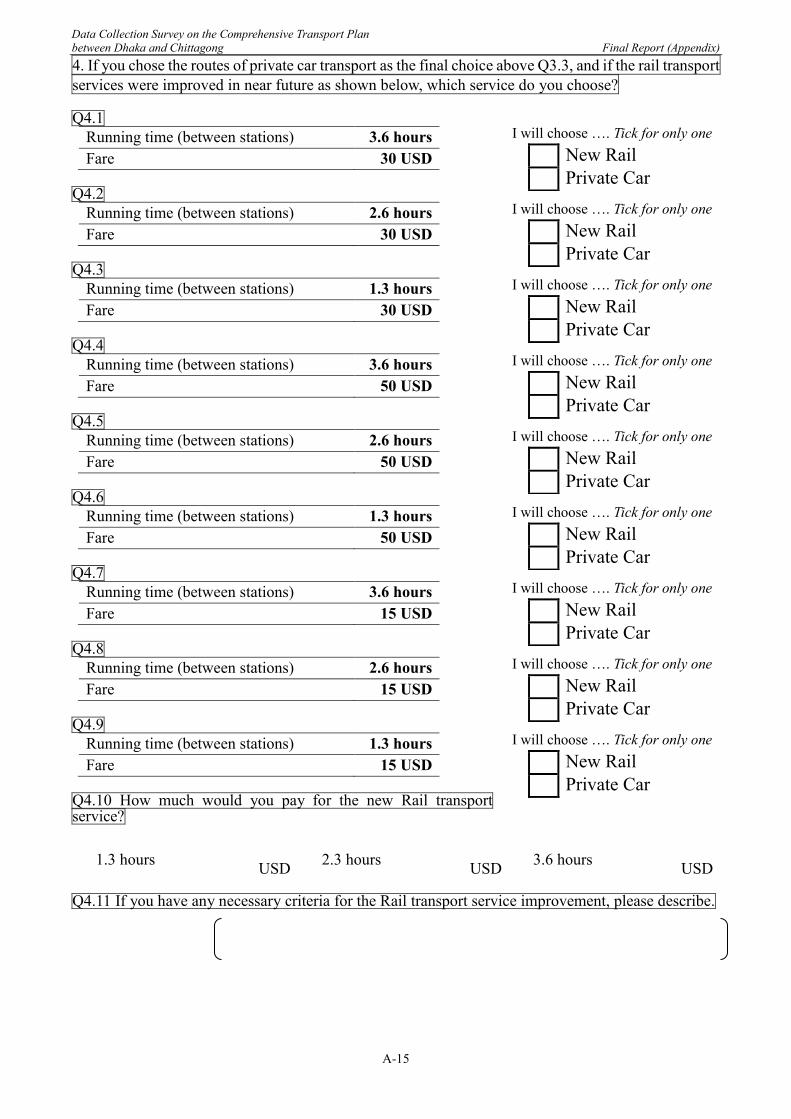
Data Collection Survey on the Comprehensive Transport Plan between Dhaka and Chittagong Final Report (Appendix)
A-15
4. If you chose the routes of private car transport as the final choice above Q3.3, and if the rail transport services were improved in near future as shown below, which service do you choose? Q4.1
Running time (between stations) 3.6 hours Fare 30 USD
Q4.2
Running time (between stations) 2.6 hours Fare 30 USD
Q4.3
Running time (between stations) 1.3 hours Fare 30 USD
Q4.4
Running time (between stations) 3.6 hours Fare 50 USD
Q4.5
Running time (between stations) 2.6 hours Fare 50 USD
Q4.6
Running time (between stations) 1.3 hours Fare 50 USD
Q4.7
Running time (between stations) 3.6 hours Fare 15 USD
Q4.8
Running time (between stations) 2.6 hours Fare 15 USD
Q4.9
Running time (between stations) 1.3 hours Fare 15 USD
Q4.10 How much would you pay for the new Rail transport service?
1.3 hours USD 2.3 hours USD 3.6 hours USD
Q4.11 If you have any necessary criteria for the Rail transport service improvement, please describe.
I will choose …. Tick for only one New Rail Private Car I will choose …. Tick for only one New Rail Private Car I will choose …. Tick for only one New Rail Private Car I will choose …. Tick for only one New Rail Private Car I will choose …. Tick for only one New Rail Private Car I will choose …. Tick for only one New Rail Private Car I will choose …. Tick for only one New Rail Private Car I will choose …. Tick for only one New Rail Private Car I will choose …. Tick for only one New Rail Private Car
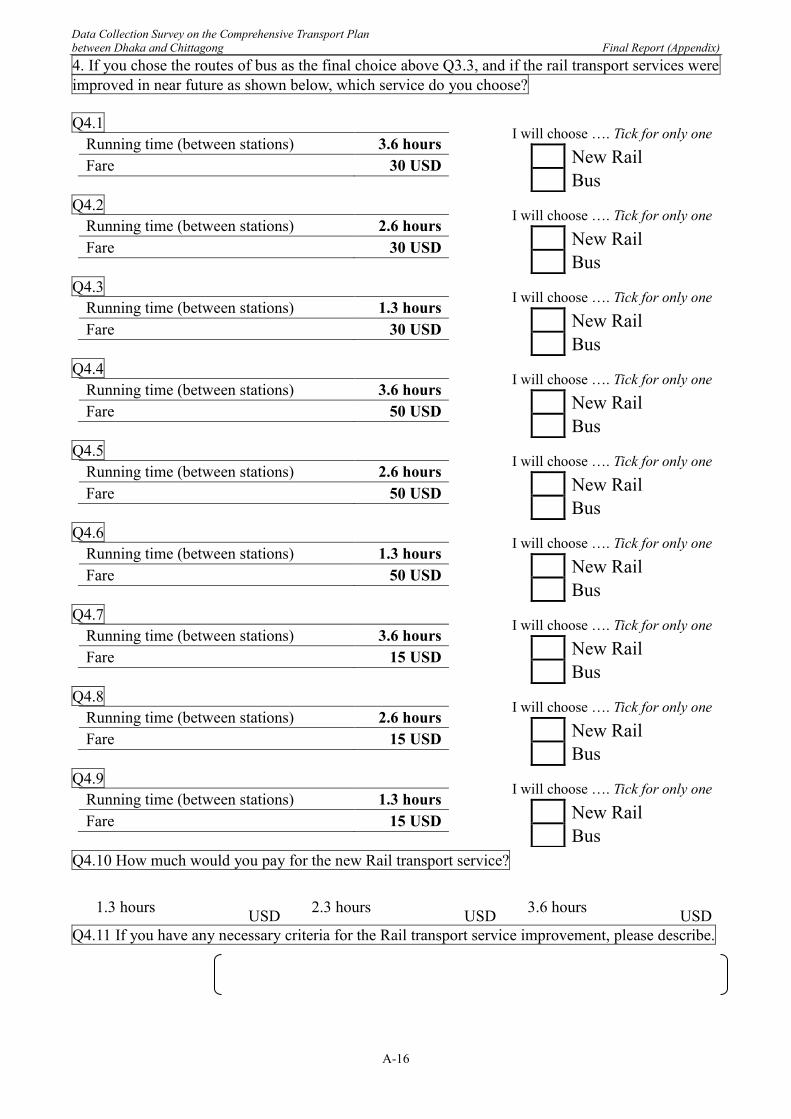
Data Collection Survey on the Comprehensive Transport Plan between Dhaka and Chittagong Final Report (Appendix)
A-16
4. If you chose the routes of bus as the final choice above Q3.3, and if the rail transport services were improved in near future as shown below, which service do you choose? Q4.1
Running time (between stations) 3.6 hours Fare 30 USD
Q4.2
Running time (between stations) 2.6 hours Fare 30 USD
Q4.3
Running time (between stations) 1.3 hours Fare 30 USD
Q4.4
Running time (between stations) 3.6 hours Fare 50 USD
Q4.5
Running time (between stations) 2.6 hours Fare 50 USD
Q4.6
Running time (between stations) 1.3 hours Fare 50 USD
Q4.7
Running time (between stations) 3.6 hours Fare 15 USD
Q4.8
Running time (between stations) 2.6 hours Fare 15 USD
Q4.9
Running time (between stations) 1.3 hours Fare 15 USD
Q4.10 How much would you pay for the new Rail transport service?
1.3 hours USD 2.3 hours USD 3.6 hours USD
Q4.11 If you have any necessary criteria for the Rail transport service improvement, please describe.
I will choose …. Tick for only one New Rail Bus
I will choose …. Tick for only one New Rail Bus
I will choose …. Tick for only one New Rail Bus
I will choose …. Tick for only one New Rail Bus
I will choose …. Tick for only one New Rail Bus
I will choose …. Tick for only one New Rail Bus
I will choose …. Tick for only one New Rail Bus
I will choose …. Tick for only one New Rail Bus
I will choose …. Tick for only one New Rail Bus
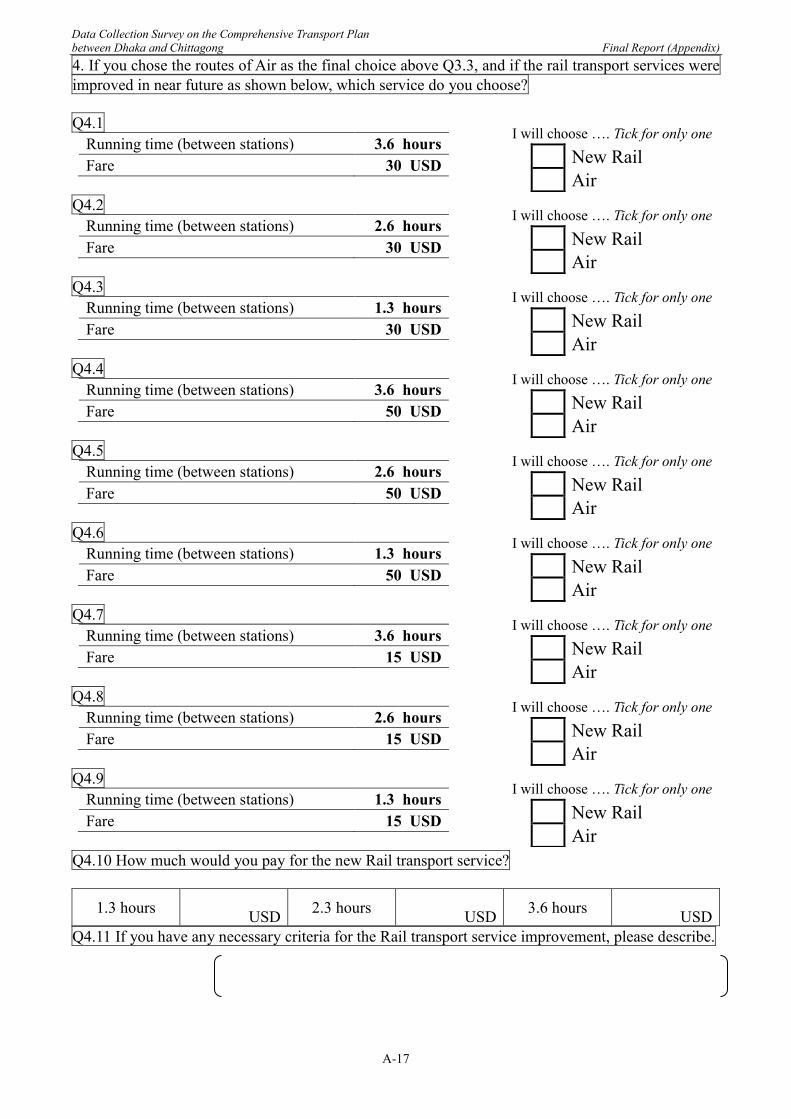
Data Collection Survey on the Comprehensive Transport Plan between Dhaka and Chittagong Final Report (Appendix)
A-17
4. If you chose the routes of Air as the final choice above Q3.3, and if the rail transport services were improved in near future as shown below, which service do you choose? Q4.1
Running time (between stations) 3.6 hours Fare 30 USD
Q4.2
Running time (between stations) 2.6 hours Fare 30 USD
Q4.3
Running time (between stations) 1.3 hours Fare 30 USD
Q4.4
Running time (between stations) 3.6 hours Fare 50 USD
Q4.5
Running time (between stations) 2.6 hours Fare 50 USD
Q4.6
Running time (between stations) 1.3 hours Fare 50 USD
Q4.7
Running time (between stations) 3.6 hours Fare 15 USD
Q4.8
Running time (between stations) 2.6 hours Fare 15 USD
Q4.9
Running time (between stations) 1.3 hours Fare 15 USD
Q4.10 How much would you pay for the new Rail transport service?
1.3 hours USD 2.3 hours USD 3.6 hours USD
Q4.11 If you have any necessary criteria for the Rail transport service improvement, please describe.
I will choose …. Tick for only one New Rail Air
I will choose …. Tick for only one New Rail Air
I will choose …. Tick for only one New Rail Air
I will choose …. Tick for only one New Rail Air
I will choose …. Tick for only one New Rail Air
I will choose …. Tick for only one New Rail Air
I will choose …. Tick for only one New Rail Air
I will choose …. Tick for only one New Rail Air
I will choose …. Tick for only one New Rail Air
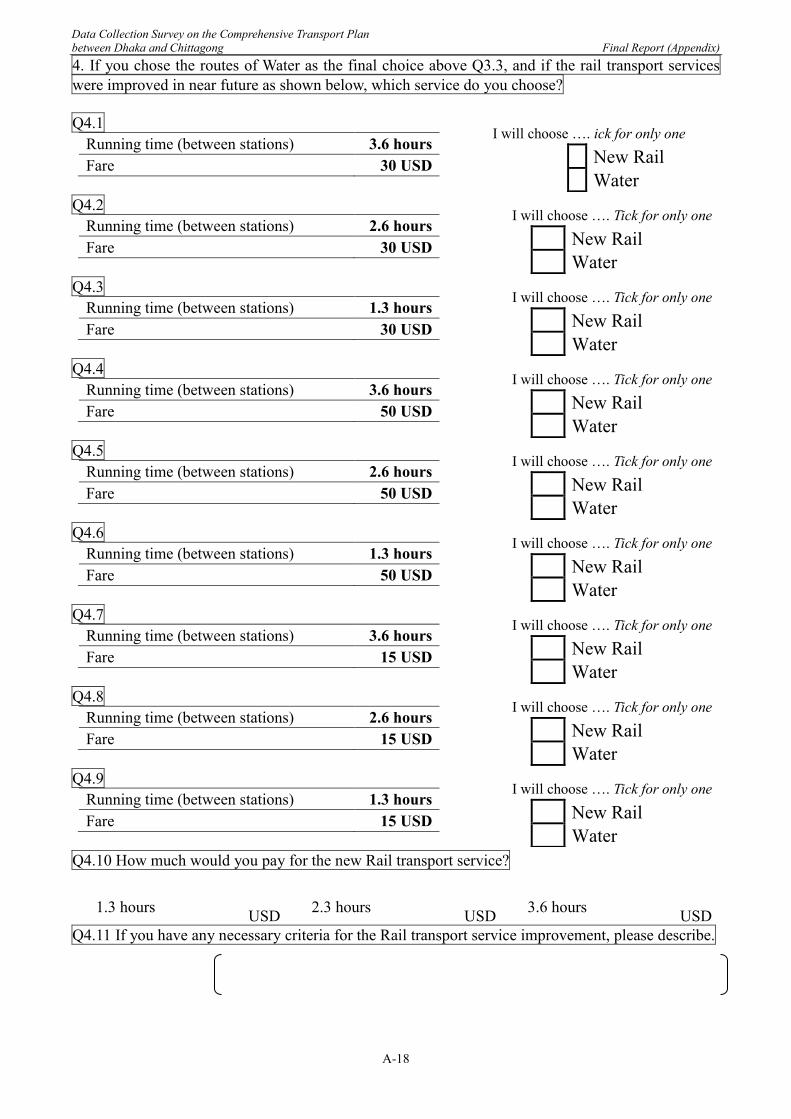
Data Collection Survey on the Comprehensive Transport Plan between Dhaka and Chittagong Final Report (Appendix)
A-18
4. If you chose the routes of Water as the final choice above Q3.3, and if the rail transport services were improved in near future as shown below, which service do you choose? Q4.1
Running time (between stations) 3.6 hours Fare 30 USD
Q4.2
Running time (between stations) 2.6 hours Fare 30 USD
Q4.3
Running time (between stations) 1.3 hours Fare 30 USD
Q4.4
Running time (between stations) 3.6 hours Fare 50 USD
Q4.5
Running time (between stations) 2.6 hours Fare 50 USD
Q4.6
Running time (between stations) 1.3 hours Fare 50 USD
Q4.7
Running time (between stations) 3.6 hours Fare 15 USD
Q4.8
Running time (between stations) 2.6 hours Fare 15 USD
Q4.9
Running time (between stations) 1.3 hours Fare 15 USD
Q4.10 How much would you pay for the new Rail transport service?
1.3 hours USD 2.3 hours USD 3.6 hours USD
Q4.11 If you have any necessary criteria for the Rail transport service improvement, please describe.
I will choose …. ick for only one New Rail Water
I will choose …. Tick for only one New Rail Water
I will choose …. Tick for only one New Rail Water
I will choose …. Tick for only one New Rail Water
I will choose …. Tick for only one New Rail Water
I will choose …. Tick for only one New Rail Water
I will choose …. Tick for only one New Rail Water
I will choose …. Tick for only one New Rail Water
I will choose …. Tick for only one New Rail Water
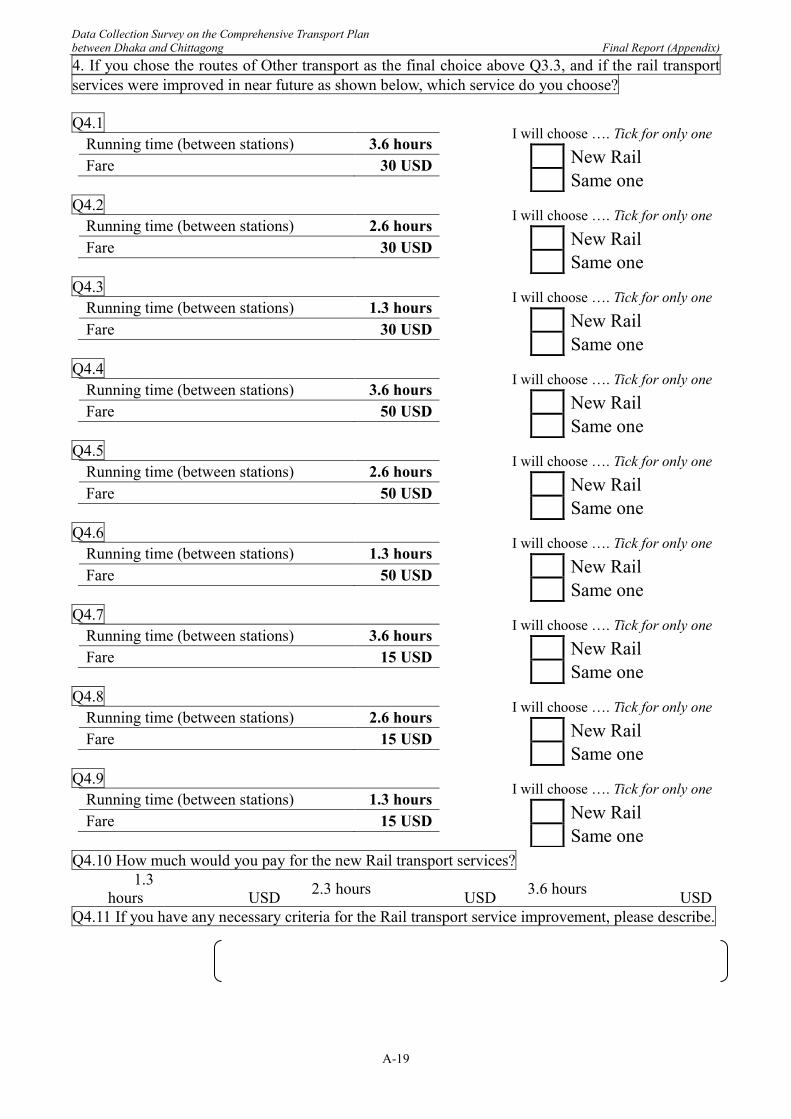
Data Collection Survey on the Comprehensive Transport Plan between Dhaka and Chittagong Final Report (Appendix)
A-19
4. If you chose the routes of Other transport as the final choice above Q3.3, and if the rail transport services were improved in near future as shown below, which service do you choose? Q4.1
Running time (between stations) 3.6 hours Fare 30 USD
Q4.2
Running time (between stations) 2.6 hours Fare 30 USD
Q4.3
Running time (between stations) 1.3 hours Fare 30 USD
Q4.4
Running time (between stations) 3.6 hours Fare 50 USD
Q4.5
Running time (between stations) 2.6 hours Fare 50 USD
Q4.6
Running time (between stations) 1.3 hours Fare 50 USD
Q4.7
Running time (between stations) 3.6 hours Fare 15 USD
Q4.8
Running time (between stations) 2.6 hours Fare 15 USD
Q4.9
Running time (between stations) 1.3 hours Fare 15 USD
Q4.10 How much would you pay for the new Rail transport services?
1.3 hours
USD 2.3 hours USD 3.6 hours USD
Q4.11 If you have any necessary criteria for the Rail transport service improvement, please describe.
I will choose …. Tick for only one New Rail Same one
I will choose …. Tick for only one New Rail Same one
I will choose …. Tick for only one New Rail Same one
I will choose …. Tick for only one New Rail Same one
I will choose …. Tick for only one New Rail Same one
I will choose …. Tick for only one New Rail Same one
I will choose …. Tick for only one New Rail Same one
I will choose …. Tick for only one New Rail Same one
I will choose …. Tick for only one New Rail Same one
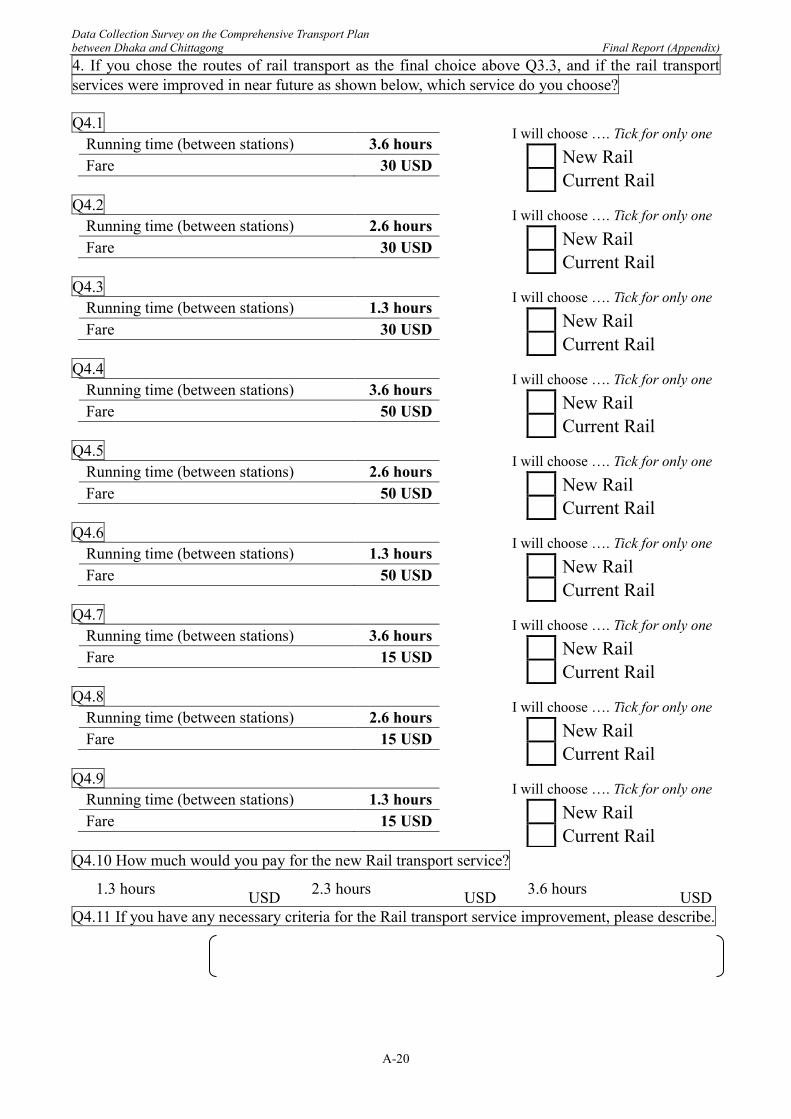
Data Collection Survey on the Comprehensive Transport Plan between Dhaka and Chittagong Final Report (Appendix)
A-20
4. If you chose the routes of rail transport as the final choice above Q3.3, and if the rail transport services were improved in near future as shown below, which service do you choose? Q4.1
Running time (between stations) 3.6 hours Fare 30 USD
Q4.2
Running time (between stations) 2.6 hours Fare 30 USD
Q4.3
Running time (between stations) 1.3 hours Fare 30 USD
Q4.4
Running time (between stations) 3.6 hours Fare 50 USD
Q4.5
Running time (between stations) 2.6 hours Fare 50 USD
Q4.6
Running time (between stations) 1.3 hours Fare 50 USD
Q4.7
Running time (between stations) 3.6 hours Fare 15 USD
Q4.8
Running time (between stations) 2.6 hours Fare 15 USD
Q4.9
Running time (between stations) 1.3 hours Fare 15 USD
Q4.10 How much would you pay for the new Rail transport service?
1.3 hours USD 2.3 hours USD 3.6 hours USD
Q4.11 If you have any necessary criteria for the Rail transport service improvement, please describe.
I will choose …. Tick for only one New Rail Current Rail
I will choose …. Tick for only one New Rail Current Rail
I will choose …. Tick for only one New Rail Current Rail
I will choose …. Tick for only one New Rail Current Rail
I will choose …. Tick for only one New Rail Current Rail
I will choose …. Tick for only one New Rail Current Rail
I will choose …. Tick for only one New Rail Current Rail
I will choose …. Tick for only one New Rail Current Rail
I will choose …. Tick for only one New Rail Current Rail
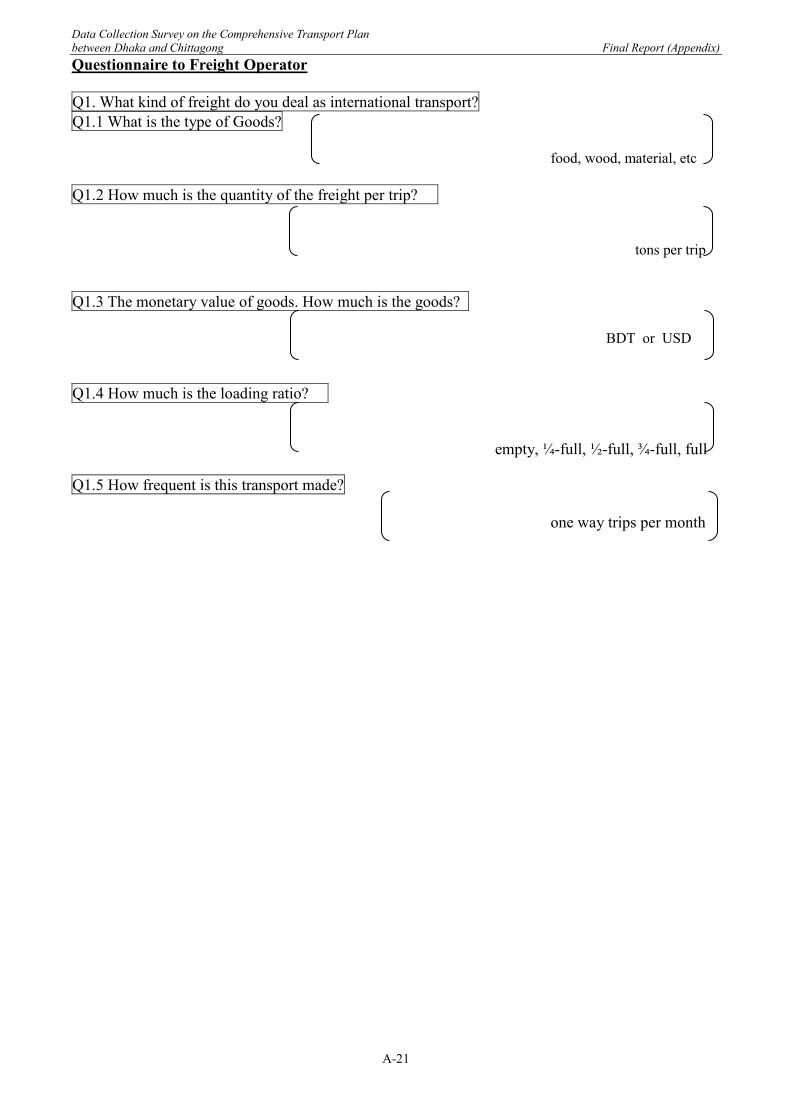
Data Collection Survey on the Comprehensive Transport Plan between Dhaka and Chittagong Final Report (Appendix)
A-21
Questionnaire to Freight Operator Q1. What kind of freight do you deal as international transport? Q1.1 What is the type of Goods?
food, wood, material, etc Q1.2 How much is the quantity of the freight per trip?
tons per trip
Q1.3 The monetary value of goods. How much is the goods?
BDT or USD Q1.4 How much is the loading ratio?
empty, ¼-full, ½-full, ¾-full, full
Q1.5 How frequent is this transport made?
one way trips per month
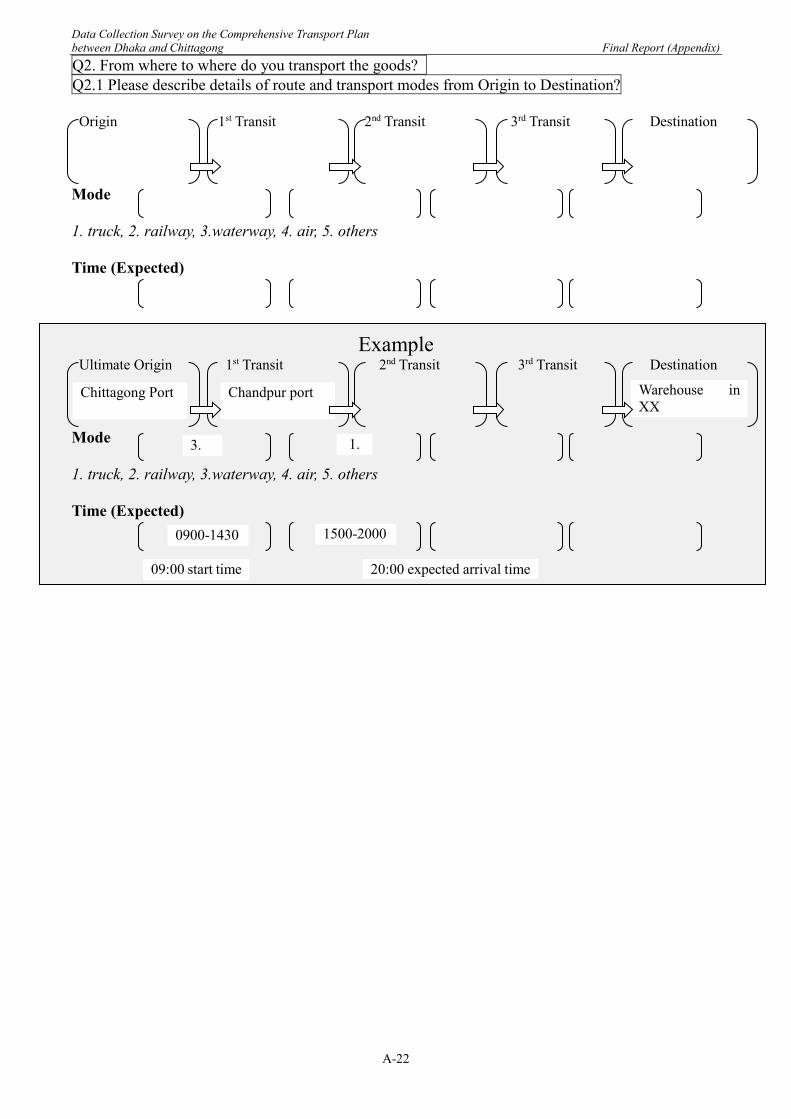
Data Collection Survey on the Comprehensive Transport Plan between Dhaka and Chittagong Final Report (Appendix)
A-22
Q2. From where to where do you transport the goods? Q2.1 Please describe details of route and transport modes from Origin to Destination? Origin 1st Transit 2nd Transit 3rd Transit Destination Mode 1. truck, 2. railway, 3.waterway, 4. air, 5. others Time (Expected)
Example Ultimate Origin 1st Transit 2nd Transit 3rd Transit Destination Mode 1. truck, 2. railway, 3.waterway, 4. air, 5. others Time (Expected)
Warehouse in XX
3.
Chandpur port
1.
Chittagong Port
0900-1430 1500-2000
09:00 start time 20:00 expected arrival time
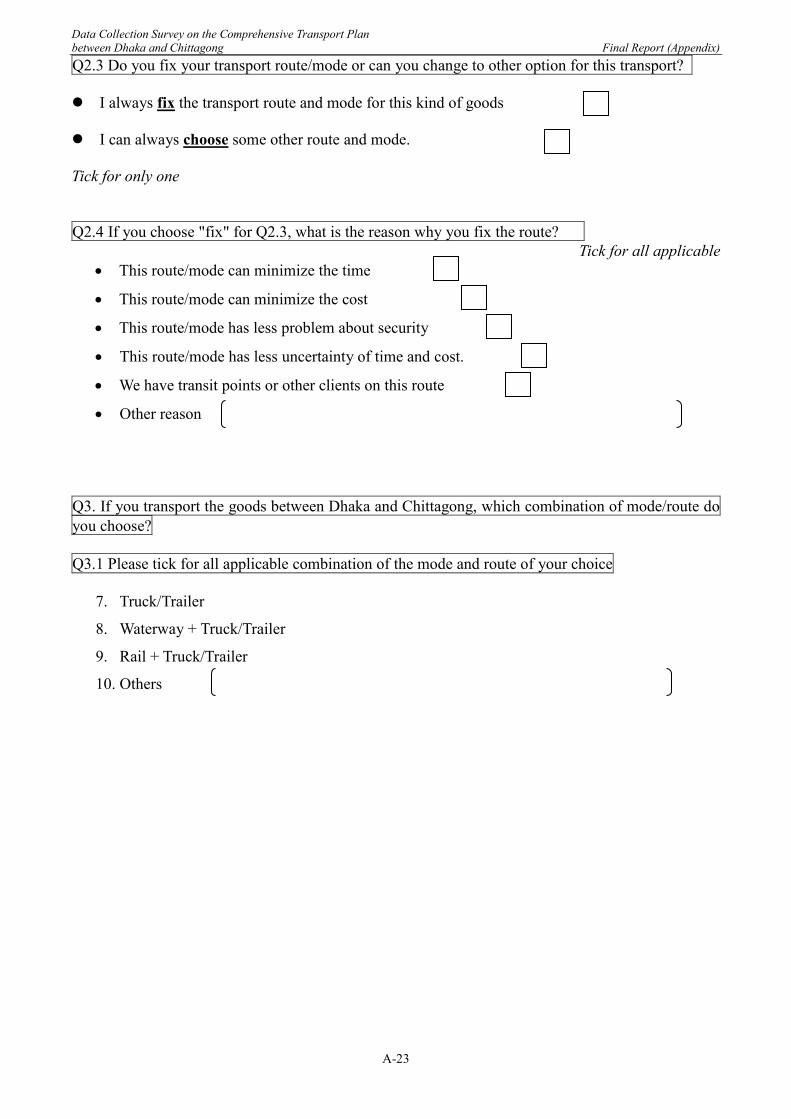
Data Collection Survey on the Comprehensive Transport Plan between Dhaka and Chittagong Final Report (Appendix)
A-23
Q2.3 Do you fix your transport route/mode or can you change to other option for this transport? I always fix the transport route and mode for this kind of goods
I can always choose some other route and mode. Tick for only one Q2.4 If you choose "fix" for Q2.3, what is the reason why you fix the route?
Tick for all applicable • This route/mode can minimize the time
• This route/mode can minimize the cost
• This route/mode has less problem about security
• This route/mode has less uncertainty of time and cost.
• We have transit points or other clients on this route
• Other reason
Q3. If you transport the goods between Dhaka and Chittagong, which combination of mode/route do you choose? Q3.1 Please tick for all applicable combination of the mode and route of your choice
7. Truck/Trailer
8. Waterway + Truck/Trailer
9. Rail + Truck/Trailer
10. Others
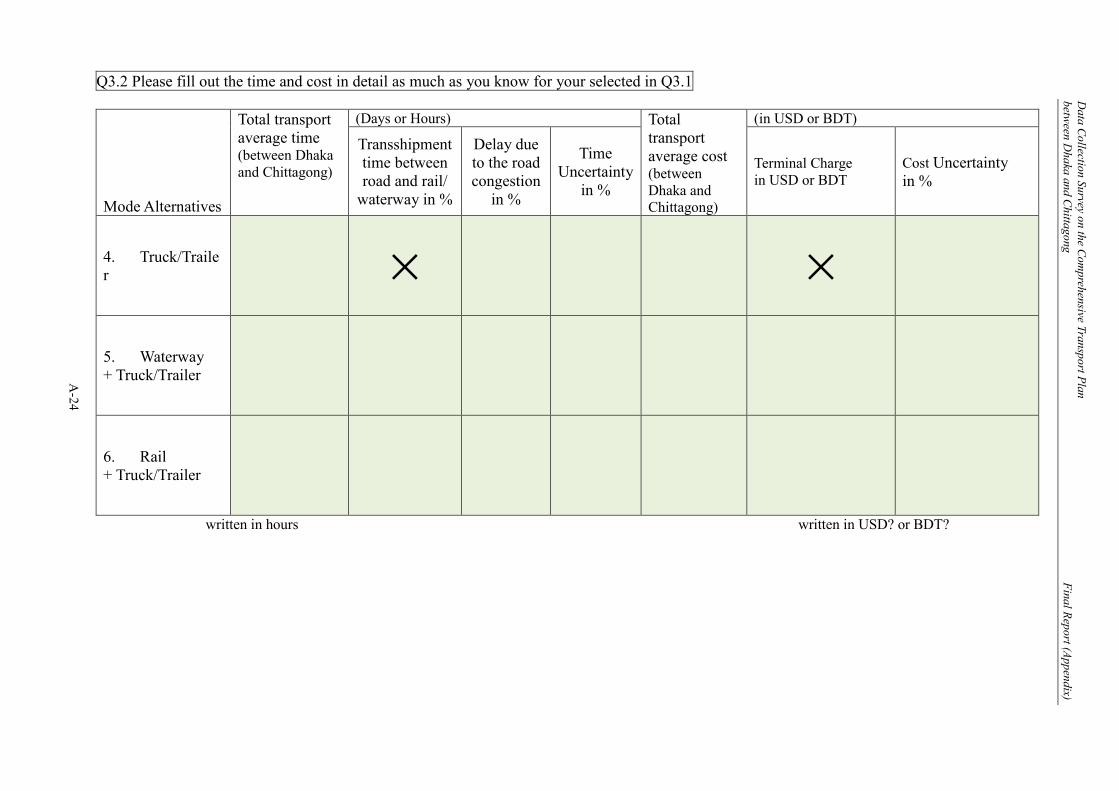
A
-24
Data Collection Survey on the Com
prehensive Transport Plan betw
een Dhaka and C
hittagong Final Report (Appendix)
Q3.2 Please fill out the time and cost in detail as much as you know for your selected in Q3.1
Mode Alternatives
Total transport average time (between Dhaka and Chittagong)
(Days or Hours) Total transport average cost (between Dhaka and Chittagong)
(in USD or BDT)
Transshipment time between road and rail/
waterway in %
Delay due to the road congestion
in %
Time Uncertainty
in %
Terminal Charge in USD or BDT
Cost Uncertainty in %
4. Truck/Trailer
×
×
5. Waterway + Truck/Trailer
6. Rail + Truck/Trailer
written in hours written in USD? or BDT?
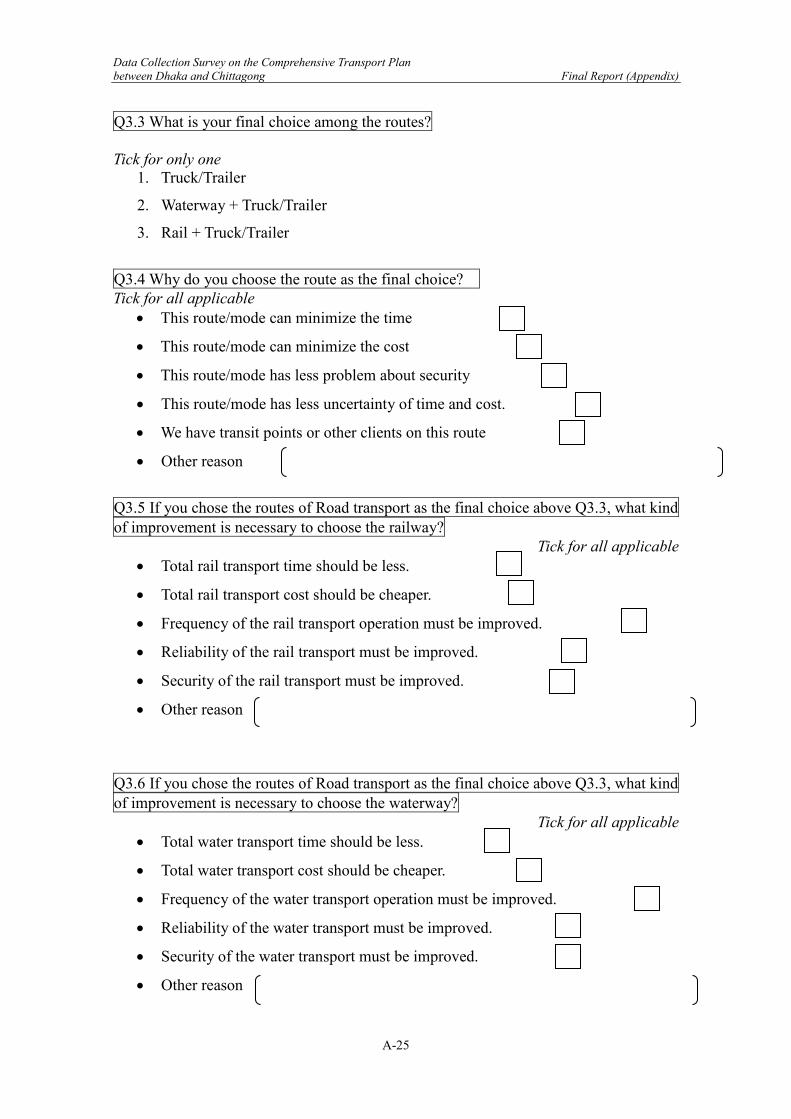
Data Collection Survey on the Comprehensive Transport Plan between Dhaka and Chittagong Final Report (Appendix)
A-25
Q3.3 What is your final choice among the routes? Tick for only one
1. Truck/Trailer
2. Waterway + Truck/Trailer
3. Rail + Truck/Trailer
Q3.4 Why do you choose the route as the final choice? Tick for all applicable
• This route/mode can minimize the time
• This route/mode can minimize the cost
• This route/mode has less problem about security
• This route/mode has less uncertainty of time and cost.
• We have transit points or other clients on this route
• Other reason
Q3.5 If you chose the routes of Road transport as the final choice above Q3.3, what kind of improvement is necessary to choose the railway?
Tick for all applicable • Total rail transport time should be less.
• Total rail transport cost should be cheaper.
• Frequency of the rail transport operation must be improved.
• Reliability of the rail transport must be improved.
• Security of the rail transport must be improved.
• Other reason
Q3.6 If you chose the routes of Road transport as the final choice above Q3.3, what kind of improvement is necessary to choose the waterway?
Tick for all applicable • Total water transport time should be less.
• Total water transport cost should be cheaper.
• Frequency of the water transport operation must be improved.
• Reliability of the water transport must be improved.
• Security of the water transport must be improved.
• Other reason
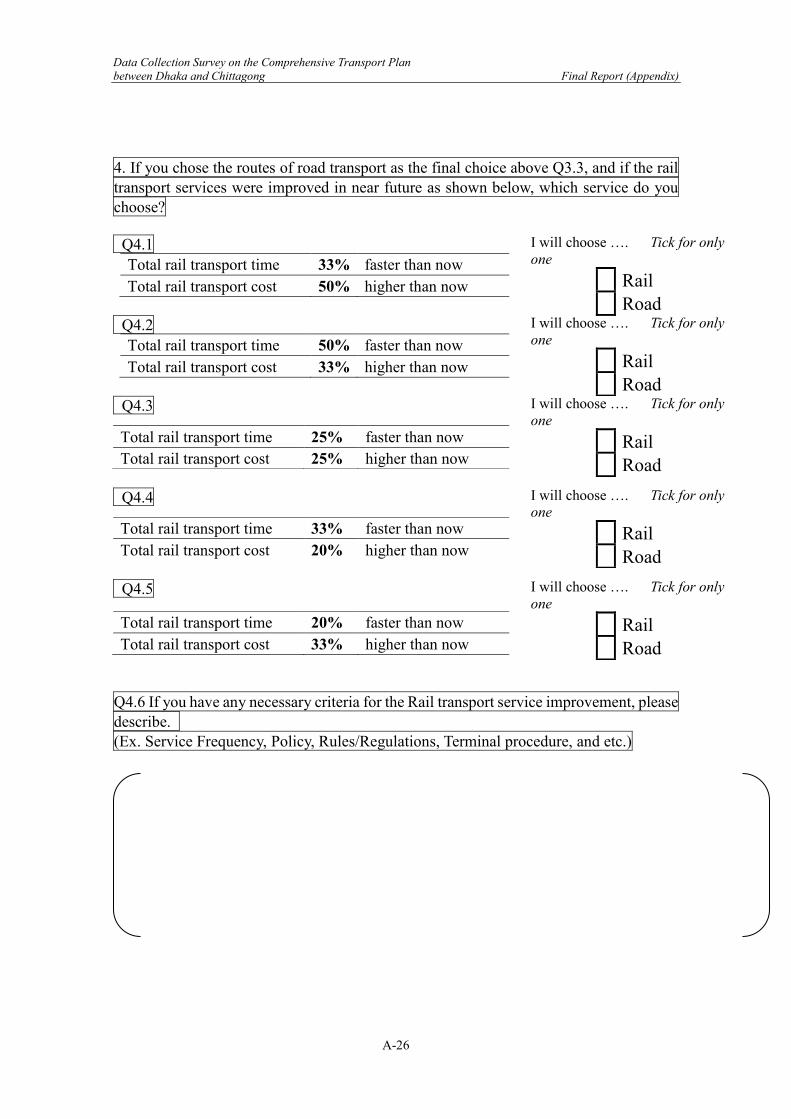
Data Collection Survey on the Comprehensive Transport Plan between Dhaka and Chittagong Final Report (Appendix)
A-26
4. If you chose the routes of road transport as the final choice above Q3.3, and if the rail transport services were improved in near future as shown below, which service do you choose? Q4.1
Total rail transport time 33% faster than now Total rail transport cost 50% higher than now
Q4.2
Total rail transport time 50% faster than now Total rail transport cost 33% higher than now
Q4.3
Q4.4
Q4.5
Q4.6 If you have any necessary criteria for the Rail transport service improvement, please describe. (Ex. Service Frequency, Policy, Rules/Regulations, Terminal procedure, and etc.)
I will choose …. Tick for only one Rail Road I will choose …. Tick for only one Rail Road I will choose …. Tick for only one Rail Road
Total rail transport time 25% faster than now Total rail transport cost 25% higher than now
I will choose …. Tick for only one Rail Road
Total rail transport time 33% faster than now Total rail transport cost 20% higher than now
I will choose …. Tick for only one Rail Road
Total rail transport time 20% faster than now Total rail transport cost 33% higher than now
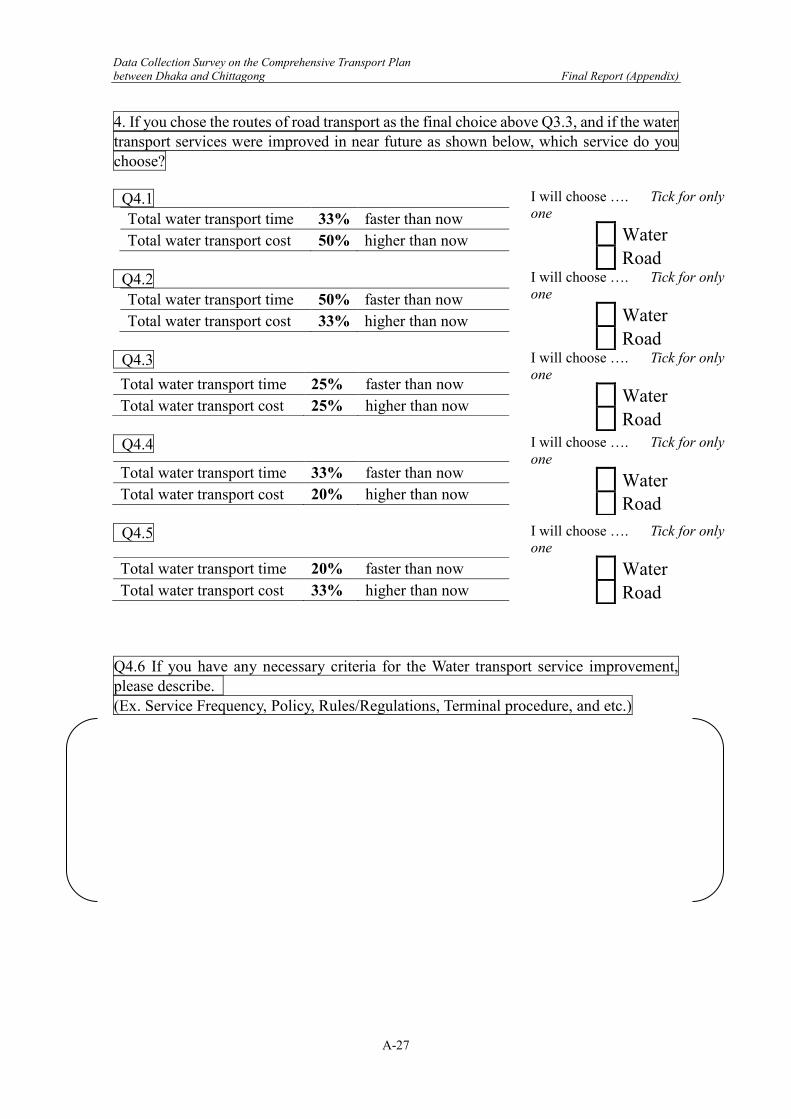
Data Collection Survey on the Comprehensive Transport Plan between Dhaka and Chittagong Final Report (Appendix)
A-27
4. If you chose the routes of road transport as the final choice above Q3.3, and if the water transport services were improved in near future as shown below, which service do you choose? Q4.1
Total water transport time 33% faster than now Total water transport cost 50% higher than now
Q4.2
Total water transport time 50% faster than now Total water transport cost 33% higher than now
Q4.3
Q4.4
Q4.5
Q4.6 If you have any necessary criteria for the Water transport service improvement, please describe. (Ex. Service Frequency, Policy, Rules/Regulations, Terminal procedure, and etc.)
I will choose …. Tick for only one Water Road I will choose …. Tick for only one Water Road I will choose …. Tick for only one Water Road
Total water transport time 25% faster than now Total water transport cost 25% higher than now
I will choose …. Tick for only one Water Road
Total water transport time 33% faster than now Total water transport cost 20% higher than now
I will choose …. Tick for only one Water Road
Total water transport time 20% faster than now Total water transport cost 33% higher than now
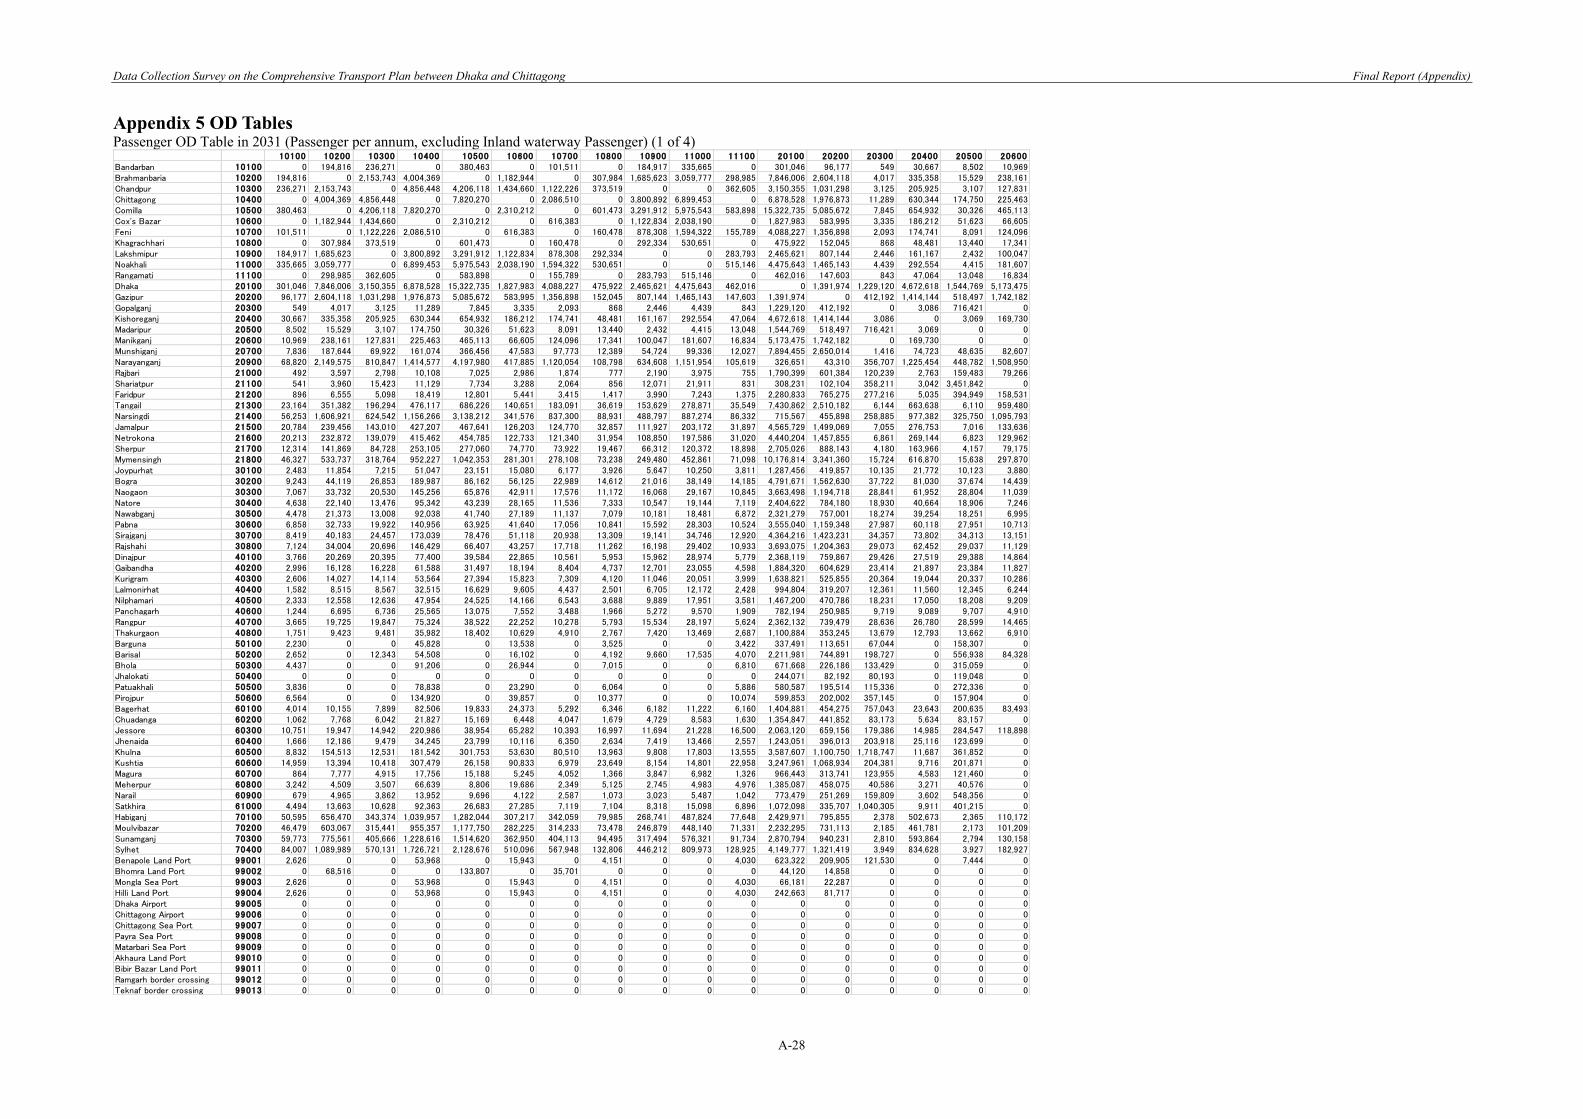
Data Collection Survey on the Comprehensive Transport Plan between Dhaka and Chittagong Final Report (Appendix)
A-28
Appendix 5 OD Tables Passenger OD Table in 2031 (Passenger per annum, excluding Inland waterway Passenger) (1 of 4)
10100 10200 10300 10400 10500 10600 10700 10800 10900 11000 11100 20100 20200 20300 20400 20500 20600Bandarban 10100 0 194,816 236,271 0 380,463 0 101,511 0 184,917 335,665 0 301,046 96,177 549 30,667 8,502 10,969Brahmanbaria 10200 194,816 0 2,153,743 4,004,369 0 1,182,944 0 307,984 1,685,623 3,059,777 298,985 7,846,006 2,604,118 4,017 335,358 15,529 238,161Chandpur 10300 236,271 2,153,743 0 4,856,448 4,206,118 1,434,660 1,122,226 373,519 0 0 362,605 3,150,355 1,031,298 3,125 205,925 3,107 127,831Chittagong 10400 0 4,004,369 4,856,448 0 7,820,270 0 2,086,510 0 3,800,892 6,899,453 0 6,878,528 1,976,873 11,289 630,344 174,750 225,463Comilla 10500 380,463 0 4,206,118 7,820,270 0 2,310,212 0 601,473 3,291,912 5,975,543 583,898 15,322,735 5,085,672 7,845 654,932 30,326 465,113Cox's Bazar 10600 0 1,182,944 1,434,660 0 2,310,212 0 616,383 0 1,122,834 2,038,190 0 1,827,983 583,995 3,335 186,212 51,623 66,605Feni 10700 101,511 0 1,122,226 2,086,510 0 616,383 0 160,478 878,308 1,594,322 155,789 4,088,227 1,356,898 2,093 174,741 8,091 124,096Khagrachhari 10800 0 307,984 373,519 0 601,473 0 160,478 0 292,334 530,651 0 475,922 152,045 868 48,481 13,440 17,341Lakshmipur 10900 184,917 1,685,623 0 3,800,892 3,291,912 1,122,834 878,308 292,334 0 0 283,793 2,465,621 807,144 2,446 161,167 2,432 100,047Noakhali 11000 335,665 3,059,777 0 6,899,453 5,975,543 2,038,190 1,594,322 530,651 0 0 515,146 4,475,643 1,465,143 4,439 292,554 4,415 181,607Rangamati 11100 0 298,985 362,605 0 583,898 0 155,789 0 283,793 515,146 0 462,016 147,603 843 47,064 13,048 16,834Dhaka 20100 301,046 7,846,006 3,150,355 6,878,528 15,322,735 1,827,983 4,088,227 475,922 2,465,621 4,475,643 462,016 0 1,391,974 1,229,120 4,672,618 1,544,769 5,173,475Gazipur 20200 96,177 2,604,118 1,031,298 1,976,873 5,085,672 583,995 1,356,898 152,045 807,144 1,465,143 147,603 1,391,974 0 412,192 1,414,144 518,497 1,742,182Gopalganj 20300 549 4,017 3,125 11,289 7,845 3,335 2,093 868 2,446 4,439 843 1,229,120 412,192 0 3,086 716,421 0Kishoreganj 20400 30,667 335,358 205,925 630,344 654,932 186,212 174,741 48,481 161,167 292,554 47,064 4,672,618 1,414,144 3,086 0 3,069 169,730Madaripur 20500 8,502 15,529 3,107 174,750 30,326 51,623 8,091 13,440 2,432 4,415 13,048 1,544,769 518,497 716,421 3,069 0 0Manikganj 20600 10,969 238,161 127,831 225,463 465,113 66,605 124,096 17,341 100,047 181,607 16,834 5,173,475 1,742,182 0 169,730 0 0Munshiganj 20700 7,836 187,644 69,922 161,074 366,456 47,583 97,773 12,389 54,724 99,336 12,027 7,894,455 2,650,014 1,416 74,723 48,635 82,607Narayanganj 20900 68,820 2,149,575 810,847 1,414,577 4,197,980 417,885 1,120,054 108,798 634,608 1,151,954 105,619 326,651 43,310 356,707 1,225,454 448,782 1,508,950Rajbari 21000 492 3,597 2,798 10,108 7,025 2,986 1,874 777 2,190 3,975 755 1,790,399 601,384 120,239 2,763 159,483 79,266Shariatpur 21100 541 3,960 15,423 11,129 7,734 3,288 2,064 856 12,071 21,911 831 308,231 102,104 358,211 3,042 3,451,842 0Faridpur 21200 896 6,555 5,098 18,419 12,801 5,441 3,415 1,417 3,990 7,243 1,375 2,280,833 765,275 277,216 5,035 394,949 158,531Tangail 21300 23,164 351,382 196,294 476,117 686,226 140,651 183,091 36,619 153,629 278,871 35,549 7,430,862 2,510,182 6,144 663,638 6,110 959,480Narsingdi 21400 56,253 1,606,921 624,542 1,156,266 3,138,212 341,576 837,300 88,931 488,797 887,274 86,332 715,567 455,898 258,885 977,382 325,750 1,095,793Jamalpur 21500 20,784 239,456 143,010 427,207 467,641 126,203 124,770 32,857 111,927 203,172 31,897 4,565,729 1,499,069 7,055 276,753 7,016 133,636Netrokona 21600 20,213 232,872 139,079 415,462 454,785 122,733 121,340 31,954 108,850 197,586 31,020 4,440,204 1,457,855 6,861 269,144 6,823 129,962Sherpur 21700 12,314 141,869 84,728 253,105 277,060 74,770 73,922 19,467 66,312 120,372 18,898 2,705,026 888,143 4,180 163,966 4,157 79,175Mymensingh 21800 46,327 533,737 318,764 952,227 1,042,353 281,301 278,108 73,238 249,480 452,861 71,098 10,176,814 3,341,360 15,724 616,870 15,638 297,870Joypurhat 30100 2,483 11,854 7,215 51,047 23,151 15,080 6,177 3,926 5,647 10,250 3,811 1,287,456 419,857 10,135 21,772 10,123 3,880Bogra 30200 9,243 44,119 26,853 189,987 86,162 56,125 22,989 14,612 21,016 38,149 14,185 4,791,671 1,562,630 37,722 81,030 37,674 14,439Naogaon 30300 7,067 33,732 20,530 145,256 65,876 42,911 17,576 11,172 16,068 29,167 10,845 3,663,498 1,194,718 28,841 61,952 28,804 11,039Natore 30400 4,638 22,140 13,476 95,342 43,239 28,165 11,536 7,333 10,547 19,144 7,119 2,404,622 784,180 18,930 40,664 18,906 7,246Nawabganj 30500 4,478 21,373 13,008 92,038 41,740 27,189 11,137 7,079 10,181 18,481 6,872 2,321,279 757,001 18,274 39,254 18,251 6,995Pabna 30600 6,858 32,733 19,922 140,956 63,925 41,640 17,056 10,841 15,592 28,303 10,524 3,555,040 1,159,348 27,987 60,118 27,951 10,713Sirajganj 30700 8,419 40,183 24,457 173,039 78,476 51,118 20,938 13,309 19,141 34,746 12,920 4,364,216 1,423,231 34,357 73,802 34,313 13,151Rajshahi 30800 7,124 34,004 20,696 146,429 66,407 43,257 17,718 11,262 16,198 29,402 10,933 3,693,075 1,204,363 29,073 62,452 29,037 11,129Dinajpur 40100 3,766 20,269 20,395 77,400 39,584 22,865 10,561 5,953 15,962 28,974 5,779 2,368,119 759,867 29,426 27,519 29,388 14,864Gaibandha 40200 2,996 16,128 16,228 61,588 31,497 18,194 8,404 4,737 12,701 23,055 4,598 1,884,320 604,629 23,414 21,897 23,384 11,827Kurigram 40300 2,606 14,027 14,114 53,564 27,394 15,823 7,309 4,120 11,046 20,051 3,999 1,638,821 525,855 20,364 19,044 20,337 10,286Lalmonirhat 40400 1,582 8,515 8,567 32,515 16,629 9,605 4,437 2,501 6,705 12,172 2,428 994,804 319,207 12,361 11,560 12,345 6,244Nilphamari 40500 2,333 12,558 12,636 47,954 24,525 14,166 6,543 3,688 9,889 17,951 3,581 1,467,200 470,786 18,231 17,050 18,208 9,209Panchagarh 40600 1,244 6,695 6,736 25,565 13,075 7,552 3,488 1,966 5,272 9,570 1,909 782,194 250,985 9,719 9,089 9,707 4,910Rangpur 40700 3,665 19,725 19,847 75,324 38,522 22,252 10,278 5,793 15,534 28,197 5,624 2,362,132 739,479 28,636 26,780 28,599 14,465Thakurgaon 40800 1,751 9,423 9,481 35,982 18,402 10,629 4,910 2,767 7,420 13,469 2,687 1,100,884 353,245 13,679 12,793 13,662 6,910Barguna 50100 2,230 0 0 45,828 0 13,538 0 3,525 0 0 3,422 337,491 113,651 67,044 0 158,307 0Barisal 50200 2,652 0 12,343 54,508 0 16,102 0 4,192 9,660 17,535 4,070 2,211,981 744,891 198,727 0 556,938 84,328Bhola 50300 4,437 0 0 91,206 0 26,944 0 7,015 0 0 6,810 671,668 226,186 133,429 0 315,059 0Jhalokati 50400 0 0 0 0 0 0 0 0 0 0 0 244,071 82,192 80,193 0 119,048 0Patuakhali 50500 3,836 0 0 78,838 0 23,290 0 6,064 0 0 5,886 580,587 195,514 115,336 0 272,336 0Pirojpur 50600 6,564 0 0 134,920 0 39,857 0 10,377 0 0 10,074 599,853 202,002 357,145 0 157,904 0Bagerhat 60100 4,014 10,155 7,899 82,506 19,833 24,373 5,292 6,346 6,182 11,222 6,160 1,404,881 454,275 757,043 23,643 200,635 83,493Chuadanga 60200 1,062 7,768 6,042 21,827 15,169 6,448 4,047 1,679 4,729 8,583 1,630 1,354,847 441,852 83,173 5,634 83,157 0Jessore 60300 10,751 19,947 14,942 220,986 38,954 65,282 10,393 16,997 11,694 21,228 16,500 2,063,120 659,156 179,386 14,985 284,547 118,898Jhenaida 60400 1,666 12,186 9,479 34,245 23,799 10,116 6,350 2,634 7,419 13,466 2,557 1,243,051 396,013 203,918 25,116 123,699 0Khulna 60500 8,832 154,513 12,531 181,542 301,753 53,630 80,510 13,963 9,808 17,803 13,555 3,587,607 1,100,750 1,718,747 11,687 361,852 0Kushtia 60600 14,959 13,394 10,418 307,479 26,158 90,833 6,979 23,649 8,154 14,801 22,958 3,247,961 1,068,934 204,381 9,716 201,871 0Magura 60700 864 7,777 4,915 17,756 15,188 5,245 4,052 1,366 3,847 6,982 1,326 966,443 313,741 123,955 4,583 121,460 0Meherpur 60800 3,242 4,509 3,507 66,639 8,806 19,686 2,349 5,125 2,745 4,983 4,976 1,385,087 458,075 40,586 3,271 40,576 0Narail 60900 679 4,965 3,862 13,952 9,696 4,122 2,587 1,073 3,023 5,487 1,042 773,479 251,269 159,809 3,602 548,356 0Satkhira 61000 4,494 13,663 10,628 92,363 26,683 27,285 7,119 7,104 8,318 15,098 6,896 1,072,098 335,707 1,040,305 9,911 401,215 0Habiganj 70100 50,595 656,470 343,374 1,039,957 1,282,044 307,217 342,059 79,985 268,741 487,824 77,648 2,429,971 795,855 2,378 502,673 2,365 110,172Moulvibazar 70200 46,479 603,067 315,441 955,357 1,177,750 282,225 314,233 73,478 246,879 448,140 71,331 2,232,295 731,113 2,185 461,781 2,173 101,209Sunamganj 70300 59,773 775,561 405,666 1,228,616 1,514,620 362,950 404,113 94,495 317,494 576,321 91,734 2,870,794 940,231 2,810 593,864 2,794 130,158Sylhet 70400 84,007 1,089,989 570,131 1,726,721 2,128,676 510,096 567,948 132,806 446,212 809,973 128,925 4,149,777 1,321,419 3,949 834,628 3,927 182,927Benapole Land Port 99001 2,626 0 0 53,968 0 15,943 0 4,151 0 0 4,030 623,322 209,905 121,530 0 7,444 0Bhomra Land Port 99002 0 68,516 0 0 133,807 0 35,701 0 0 0 0 44,120 14,858 0 0 0 0Mongla Sea Port 99003 2,626 0 0 53,968 0 15,943 0 4,151 0 0 4,030 66,181 22,287 0 0 0 0Hilli Land Port 99004 2,626 0 0 53,968 0 15,943 0 4,151 0 0 4,030 242,663 81,717 0 0 0 0Dhaka Airport 99005 0 0 0 0 0 0 0 0 0 0 0 0 0 0 0 0 0Chittagong Airport 99006 0 0 0 0 0 0 0 0 0 0 0 0 0 0 0 0 0Chittagong Sea Port 99007 0 0 0 0 0 0 0 0 0 0 0 0 0 0 0 0 0Payra Sea Port 99008 0 0 0 0 0 0 0 0 0 0 0 0 0 0 0 0 0Matarbari Sea Port 99009 0 0 0 0 0 0 0 0 0 0 0 0 0 0 0 0 0Akhaura Land Port 99010 0 0 0 0 0 0 0 0 0 0 0 0 0 0 0 0 0Bibir Bazar Land Port 99011 0 0 0 0 0 0 0 0 0 0 0 0 0 0 0 0 0Ramgarh border crossing 99012 0 0 0 0 0 0 0 0 0 0 0 0 0 0 0 0 0Teknaf border crossing 99013 0 0 0 0 0 0 0 0 0 0 0 0 0 0 0 0 0
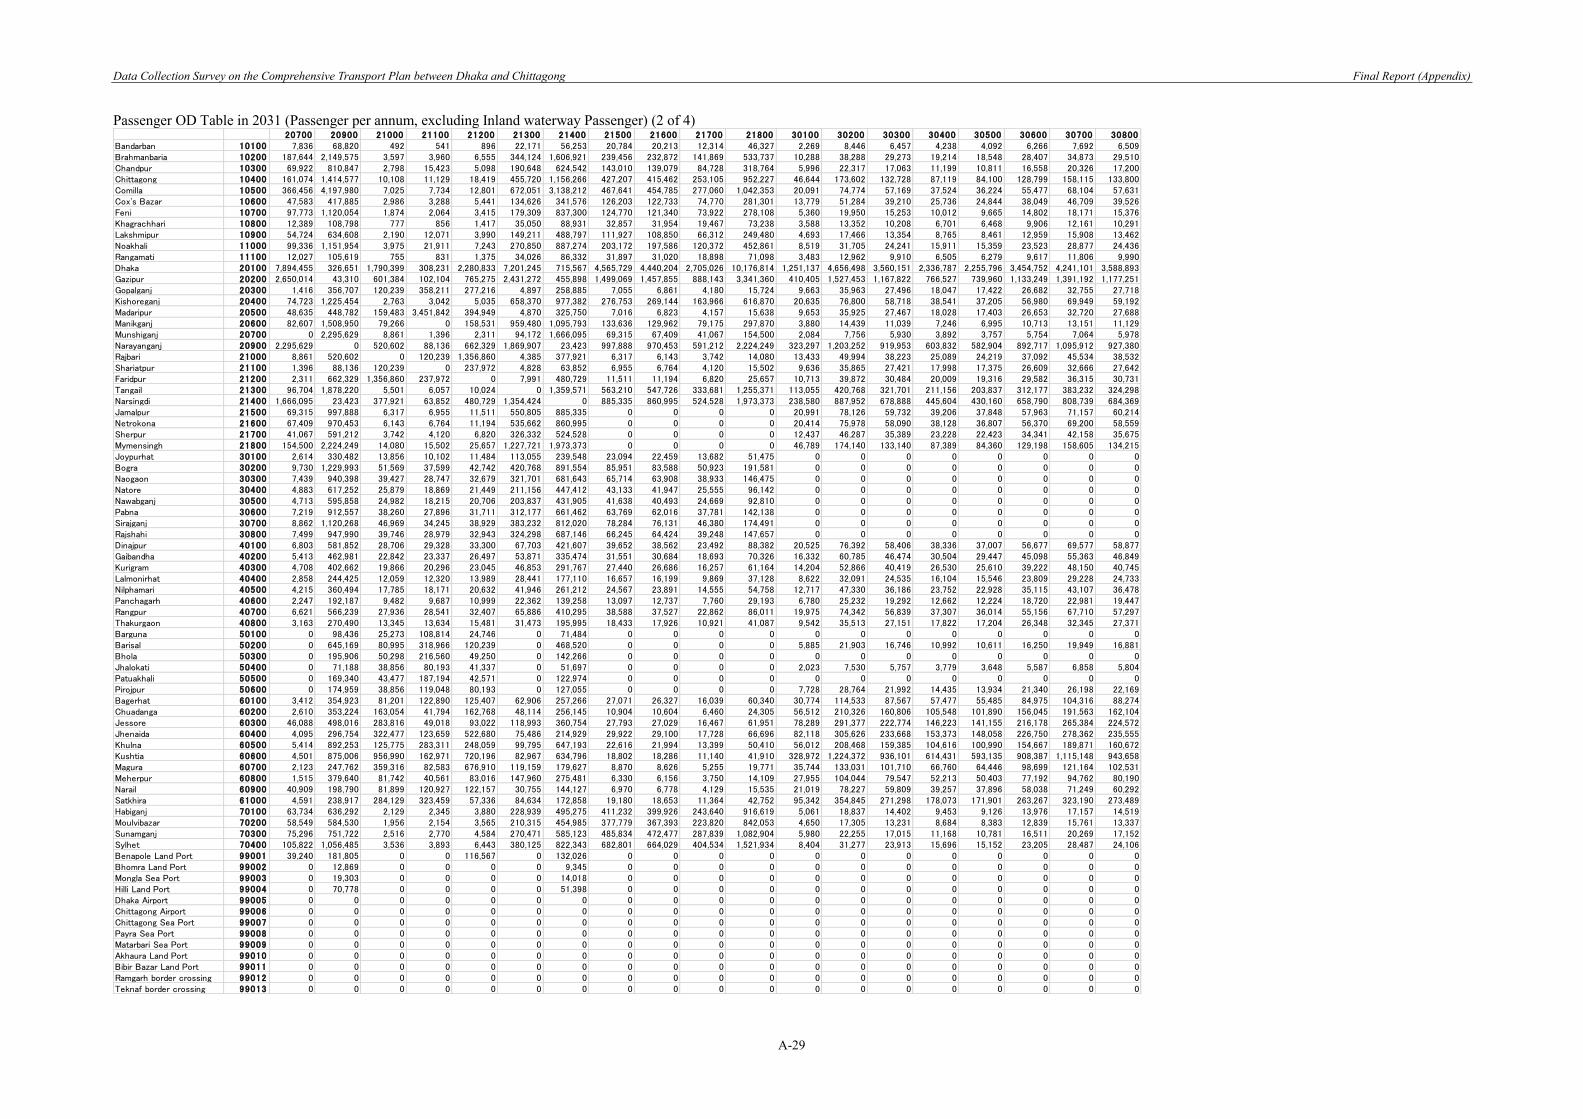
Data Collection Survey on the Comprehensive Transport Plan between Dhaka and Chittagong Final Report (Appendix)
A-29
Passenger OD Table in 2031 (Passenger per annum, excluding Inland waterway Passenger) (2 of 4)
20700 20900 21000 21100 21200 21300 21400 21500 21600 21700 21800 30100 30200 30300 30400 30500 30600 30700 30800Bandarban 10100 7,836 68,820 492 541 896 22,171 56,253 20,784 20,213 12,314 46,327 2,269 8,446 6,457 4,238 4,092 6,266 7,692 6,509Brahmanbaria 10200 187,644 2,149,575 3,597 3,960 6,555 344,124 1,606,921 239,456 232,872 141,869 533,737 10,288 38,288 29,273 19,214 18,548 28,407 34,873 29,510Chandpur 10300 69,922 810,847 2,798 15,423 5,098 190,648 624,542 143,010 139,079 84,728 318,764 5,996 22,317 17,063 11,199 10,811 16,558 20,326 17,200Chittagong 10400 161,074 1,414,577 10,108 11,129 18,419 455,720 1,156,266 427,207 415,462 253,105 952,227 46,644 173,602 132,728 87,119 84,100 128,799 158,115 133,800Comilla 10500 366,456 4,197,980 7,025 7,734 12,801 672,051 3,138,212 467,641 454,785 277,060 1,042,353 20,091 74,774 57,169 37,524 36,224 55,477 68,104 57,631Cox's Bazar 10600 47,583 417,885 2,986 3,288 5,441 134,626 341,576 126,203 122,733 74,770 281,301 13,779 51,284 39,210 25,736 24,844 38,049 46,709 39,526Feni 10700 97,773 1,120,054 1,874 2,064 3,415 179,309 837,300 124,770 121,340 73,922 278,108 5,360 19,950 15,253 10,012 9,665 14,802 18,171 15,376Khagrachhari 10800 12,389 108,798 777 856 1,417 35,050 88,931 32,857 31,954 19,467 73,238 3,588 13,352 10,208 6,701 6,468 9,906 12,161 10,291Lakshmipur 10900 54,724 634,608 2,190 12,071 3,990 149,211 488,797 111,927 108,850 66,312 249,480 4,693 17,466 13,354 8,765 8,461 12,959 15,908 13,462Noakhali 11000 99,336 1,151,954 3,975 21,911 7,243 270,850 887,274 203,172 197,586 120,372 452,861 8,519 31,705 24,241 15,911 15,359 23,523 28,877 24,436Rangamati 11100 12,027 105,619 755 831 1,375 34,026 86,332 31,897 31,020 18,898 71,098 3,483 12,962 9,910 6,505 6,279 9,617 11,806 9,990Dhaka 20100 7,894,455 326,651 1,790,399 308,231 2,280,833 7,201,245 715,567 4,565,729 4,440,204 2,705,026 10,176,814 1,251,137 4,656,498 3,560,151 2,336,787 2,255,796 3,454,752 4,241,101 3,588,893Gazipur 20200 2,650,014 43,310 601,384 102,104 765,275 2,431,272 455,898 1,499,069 1,457,855 888,143 3,341,360 410,405 1,527,453 1,167,822 766,527 739,960 1,133,249 1,391,192 1,177,251Gopalganj 20300 1,416 356,707 120,239 358,211 277,216 4,897 258,885 7,055 6,861 4,180 15,724 9,663 35,963 27,496 18,047 17,422 26,682 32,755 27,718Kishoreganj 20400 74,723 1,225,454 2,763 3,042 5,035 658,370 977,382 276,753 269,144 163,966 616,870 20,635 76,800 58,718 38,541 37,205 56,980 69,949 59,192Madaripur 20500 48,635 448,782 159,483 3,451,842 394,949 4,870 325,750 7,016 6,823 4,157 15,638 9,653 35,925 27,467 18,028 17,403 26,653 32,720 27,688Manikganj 20600 82,607 1,508,950 79,266 0 158,531 959,480 1,095,793 133,636 129,962 79,175 297,870 3,880 14,439 11,039 7,246 6,995 10,713 13,151 11,129Munshiganj 20700 0 2,295,629 8,861 1,396 2,311 94,172 1,666,095 69,315 67,409 41,067 154,500 2,084 7,756 5,930 3,892 3,757 5,754 7,064 5,978Narayanganj 20900 2,295,629 0 520,602 88,136 662,329 1,869,907 23,423 997,888 970,453 591,212 2,224,249 323,297 1,203,252 919,953 603,832 582,904 892,717 1,095,912 927,380Rajbari 21000 8,861 520,602 0 120,239 1,356,860 4,385 377,921 6,317 6,143 3,742 14,080 13,433 49,994 38,223 25,089 24,219 37,092 45,534 38,532Shariatpur 21100 1,396 88,136 120,239 0 237,972 4,828 63,852 6,955 6,764 4,120 15,502 9,636 35,865 27,421 17,998 17,375 26,609 32,666 27,642Faridpur 21200 2,311 662,329 1,356,860 237,972 0 7,991 480,729 11,511 11,194 6,820 25,657 10,713 39,872 30,484 20,009 19,316 29,582 36,315 30,731Tangail 21300 96,704 1,878,220 5,501 6,057 10,024 0 1,359,571 563,210 547,726 333,681 1,255,371 113,055 420,768 321,701 211,156 203,837 312,177 383,232 324,298Narsingdi 21400 1,666,095 23,423 377,921 63,852 480,729 1,354,424 0 885,335 860,995 524,528 1,973,373 238,580 887,952 678,888 445,604 430,160 658,790 808,739 684,369Jamalpur 21500 69,315 997,888 6,317 6,955 11,511 550,805 885,335 0 0 0 0 20,991 78,126 59,732 39,206 37,848 57,963 71,157 60,214Netrokona 21600 67,409 970,453 6,143 6,764 11,194 535,662 860,995 0 0 0 0 20,414 75,978 58,090 38,128 36,807 56,370 69,200 58,559Sherpur 21700 41,067 591,212 3,742 4,120 6,820 326,332 524,528 0 0 0 0 12,437 46,287 35,389 23,228 22,423 34,341 42,158 35,675Mymensingh 21800 154,500 2,224,249 14,080 15,502 25,657 1,227,721 1,973,373 0 0 0 0 46,789 174,140 133,140 87,389 84,360 129,198 158,605 134,215Joypurhat 30100 2,614 330,482 13,856 10,102 11,484 113,055 239,548 23,094 22,459 13,682 51,475 0 0 0 0 0 0 0 0Bogra 30200 9,730 1,229,993 51,569 37,599 42,742 420,768 891,554 85,951 83,588 50,923 191,581 0 0 0 0 0 0 0 0Naogaon 30300 7,439 940,398 39,427 28,747 32,679 321,701 681,643 65,714 63,908 38,933 146,475 0 0 0 0 0 0 0 0Natore 30400 4,883 617,252 25,879 18,869 21,449 211,156 447,412 43,133 41,947 25,555 96,142 0 0 0 0 0 0 0 0Nawabganj 30500 4,713 595,858 24,982 18,215 20,706 203,837 431,905 41,638 40,493 24,669 92,810 0 0 0 0 0 0 0 0Pabna 30600 7,219 912,557 38,260 27,896 31,711 312,177 661,462 63,769 62,016 37,781 142,138 0 0 0 0 0 0 0 0Sirajganj 30700 8,862 1,120,268 46,969 34,245 38,929 383,232 812,020 78,284 76,131 46,380 174,491 0 0 0 0 0 0 0 0Rajshahi 30800 7,499 947,990 39,746 28,979 32,943 324,298 687,146 66,245 64,424 39,248 147,657 0 0 0 0 0 0 0 0Dinajpur 40100 6,803 581,852 28,706 29,328 33,300 67,703 421,607 39,652 38,562 23,492 88,382 20,525 76,392 58,406 38,336 37,007 56,677 69,577 58,877Gaibandha 40200 5,413 462,981 22,842 23,337 26,497 53,871 335,474 31,551 30,684 18,693 70,326 16,332 60,785 46,474 30,504 29,447 45,098 55,363 46,849Kurigram 40300 4,708 402,662 19,866 20,296 23,045 46,853 291,767 27,440 26,686 16,257 61,164 14,204 52,866 40,419 26,530 25,610 39,222 48,150 40,745Lalmonirhat 40400 2,858 244,425 12,059 12,320 13,989 28,441 177,110 16,657 16,199 9,869 37,128 8,622 32,091 24,535 16,104 15,546 23,809 29,228 24,733Nilphamari 40500 4,215 360,494 17,785 18,171 20,632 41,946 261,212 24,567 23,891 14,555 54,758 12,717 47,330 36,186 23,752 22,928 35,115 43,107 36,478Panchagarh 40600 2,247 192,187 9,482 9,687 10,999 22,362 139,258 13,097 12,737 7,760 29,193 6,780 25,232 19,292 12,662 12,224 18,720 22,981 19,447Rangpur 40700 6,621 566,239 27,936 28,541 32,407 65,886 410,295 38,588 37,527 22,862 86,011 19,975 74,342 56,839 37,307 36,014 55,156 67,710 57,297Thakurgaon 40800 3,163 270,490 13,345 13,634 15,481 31,473 195,995 18,433 17,926 10,921 41,087 9,542 35,513 27,151 17,822 17,204 26,348 32,345 27,371Barguna 50100 0 98,436 25,273 108,814 24,746 0 71,484 0 0 0 0 0 0 0 0 0 0 0 0Barisal 50200 0 645,169 80,995 318,966 120,239 0 468,520 0 0 0 0 5,885 21,903 16,746 10,992 10,611 16,250 19,949 16,881Bhola 50300 0 195,906 50,298 216,560 49,250 0 142,266 0 0 0 0 0 0 0 0 0 0 0 0Jhalokati 50400 0 71,188 38,856 80,193 41,337 0 51,697 0 0 0 0 2,023 7,530 5,757 3,779 3,648 5,587 6,858 5,804Patuakhali 50500 0 169,340 43,477 187,194 42,571 0 122,974 0 0 0 0 0 0 0 0 0 0 0 0Pirojpur 50600 0 174,959 38,856 119,048 80,193 0 127,055 0 0 0 0 7,728 28,764 21,992 14,435 13,934 21,340 26,198 22,169Bagerhat 60100 3,412 354,923 81,201 122,890 125,407 62,906 257,266 27,071 26,327 16,039 60,340 30,774 114,533 87,567 57,477 55,485 84,975 104,316 88,274Chuadanga 60200 2,610 353,224 163,054 41,794 162,768 48,114 256,145 10,904 10,604 6,460 24,305 56,512 210,326 160,806 105,548 101,890 156,045 191,563 162,104Jessore 60300 46,088 498,016 283,816 49,018 93,022 118,993 360,754 27,793 27,029 16,467 61,951 78,289 291,377 222,774 146,223 141,155 216,178 265,384 224,572Jhenaida 60400 4,095 296,754 322,477 123,659 522,680 75,486 214,929 29,922 29,100 17,728 66,696 82,118 305,626 233,668 153,373 148,058 226,750 278,362 235,555Khulna 60500 5,414 892,253 125,775 283,311 248,059 99,795 647,193 22,616 21,994 13,399 50,410 56,012 208,468 159,385 104,616 100,990 154,667 189,871 160,672Kushtia 60600 4,501 875,006 956,990 162,971 720,196 82,967 634,796 18,802 18,286 11,140 41,910 328,972 1,224,372 936,101 614,431 593,135 908,387 1,115,148 943,658Magura 60700 2,123 247,762 359,316 82,583 676,910 119,159 179,627 8,870 8,626 5,255 19,771 35,744 133,031 101,710 66,760 64,446 98,699 121,164 102,531Meherpur 60800 1,515 379,640 81,742 40,561 83,016 147,960 275,481 6,330 6,156 3,750 14,109 27,955 104,044 79,547 52,213 50,403 77,192 94,762 80,190Narail 60900 40,909 198,790 81,899 120,927 122,157 30,755 144,127 6,970 6,778 4,129 15,535 21,019 78,227 59,809 39,257 37,896 58,038 71,249 60,292Satkhira 61000 4,591 238,917 284,129 323,459 57,336 84,634 172,858 19,180 18,653 11,364 42,752 95,342 354,845 271,298 178,073 171,901 263,267 323,190 273,489Habiganj 70100 63,734 636,292 2,129 2,345 3,880 228,939 495,275 411,232 399,926 243,640 916,619 5,061 18,837 14,402 9,453 9,126 13,976 17,157 14,519Moulvibazar 70200 58,549 584,530 1,956 2,154 3,565 210,315 454,985 377,779 367,393 223,820 842,053 4,650 17,305 13,231 8,684 8,383 12,839 15,761 13,337Sunamganj 70300 75,296 751,722 2,516 2,770 4,584 270,471 585,123 485,834 472,477 287,839 1,082,904 5,980 22,255 17,015 11,168 10,781 16,511 20,269 17,152Sylhet 70400 105,822 1,056,485 3,536 3,893 6,443 380,125 822,343 682,801 664,029 404,534 1,521,934 8,404 31,277 23,913 15,696 15,152 23,205 28,487 24,106Benapole Land Port 99001 39,240 181,805 0 0 116,567 0 132,026 0 0 0 0 0 0 0 0 0 0 0 0Bhomra Land Port 99002 0 12,869 0 0 0 0 9,345 0 0 0 0 0 0 0 0 0 0 0 0Mongla Sea Port 99003 0 19,303 0 0 0 0 14,018 0 0 0 0 0 0 0 0 0 0 0 0Hilli Land Port 99004 0 70,778 0 0 0 0 51,398 0 0 0 0 0 0 0 0 0 0 0 0Dhaka Airport 99005 0 0 0 0 0 0 0 0 0 0 0 0 0 0 0 0 0 0 0Chittagong Airport 99006 0 0 0 0 0 0 0 0 0 0 0 0 0 0 0 0 0 0 0Chittagong Sea Port 99007 0 0 0 0 0 0 0 0 0 0 0 0 0 0 0 0 0 0 0Payra Sea Port 99008 0 0 0 0 0 0 0 0 0 0 0 0 0 0 0 0 0 0 0Matarbari Sea Port 99009 0 0 0 0 0 0 0 0 0 0 0 0 0 0 0 0 0 0 0Akhaura Land Port 99010 0 0 0 0 0 0 0 0 0 0 0 0 0 0 0 0 0 0 0Bibir Bazar Land Port 99011 0 0 0 0 0 0 0 0 0 0 0 0 0 0 0 0 0 0 0Ramgarh border crossing 99012 0 0 0 0 0 0 0 0 0 0 0 0 0 0 0 0 0 0 0Teknaf border crossing 99013 0 0 0 0 0 0 0 0 0 0 0 0 0 0 0 0 0 0 0

Data Collection Survey on the Comprehensive Transport Plan between Dhaka and Chittagong Final Report (Appendix)
A-30
Passenger OD Table in 2031 (Passenger per annum, excluding Inland waterway Passenger) (3 of 4)
40100 40200 40300 40400 40500 40600 40700 40800 50100 50200 50300 50400 50500 50600 60100 60200 60300 60400 60500 60600Bandarban 10100 3,203 2,549 2,217 1,346 1,985 1,058 3,117 1,489 2,230 2,652 4,437 0 3,836 6,564 3,732 846 10,218 1,328 8,385 14,588Brahmanbaria 10200 16,157 12,856 11,181 6,787 10,010 5,337 15,723 7,511 0 0 0 0 0 0 8,095 6,192 16,049 9,714 151,244 10,677Chandpur 10300 17,196 13,683 11,900 7,224 10,654 5,680 16,735 7,994 0 12,343 0 0 0 0 6,297 4,816 11,911 7,556 9,989 8,305Chittagong 10400 65,845 52,393 45,567 27,660 40,795 21,749 64,078 30,610 45,828 54,508 91,206 0 78,838 134,920 76,716 17,399 210,035 27,298 172,358 299,843Comilla 10500 31,553 25,107 21,836 13,255 19,549 10,422 30,707 14,668 0 0 0 0 0 0 15,809 12,092 31,343 18,971 295,370 20,851Cox's Bazar 10600 19,452 15,478 13,461 8,171 12,051 6,425 18,930 9,043 13,538 16,102 26,944 0 23,290 39,857 22,663 5,140 62,047 8,064 50,917 88,578Feni 10700 8,419 6,699 5,826 3,537 5,216 2,781 8,193 3,914 0 0 0 0 0 0 4,218 3,226 8,363 5,062 78,807 5,563Khagrachhari 10800 5,064 4,030 3,505 2,127 3,138 1,673 4,928 2,354 3,525 4,192 7,015 0 6,064 10,377 5,900 1,338 16,154 2,100 13,256 23,062Lakshmipur 10900 13,459 10,709 9,314 5,654 8,338 4,445 13,097 6,257 0 9,660 0 0 0 0 4,928 3,769 9,322 5,914 7,818 6,500Noakhali 11000 24,430 19,439 16,907 10,263 15,136 8,069 23,775 11,357 0 17,535 0 0 0 0 8,945 6,842 16,921 10,734 14,191 11,798Rangamati 11100 4,916 3,912 3,402 2,065 3,046 1,624 4,784 2,285 3,422 4,070 6,810 0 5,886 10,074 5,728 1,299 15,682 2,038 12,869 22,388Dhaka 20100 2,279,999 1,814,203 1,577,839 957,787 1,412,603 753,087 2,276,376 1,059,919 337,491 2,211,981 671,668 244,071 580,587 599,853 1,360,496 1,320,898 1,979,160 1,189,788 3,517,193 3,189,421Gazipur 20200 737,821 587,087 510,598 309,946 457,127 243,704 718,024 342,996 113,651 744,891 226,186 82,192 195,514 202,002 443,147 433,340 638,106 382,660 1,083,096 1,054,257Gopalganj 20300 28,030 22,304 19,398 11,775 17,366 9,258 27,278 13,031 67,044 198,727 133,429 80,193 115,336 357,145 756,253 82,569 177,891 202,969 1,717,493 203,338Kishoreganj 20400 24,537 19,524 16,981 10,308 15,202 8,105 23,879 11,407 0 0 0 0 0 0 22,149 4,491 12,158 23,323 9,316 7,745Madaripur 20500 28,000 22,280 19,377 11,762 17,348 9,248 27,249 13,017 158,307 556,938 315,059 119,048 272,336 157,904 199,849 82,556 283,060 122,756 360,605 200,834Manikganj 20600 14,864 11,827 10,286 6,244 9,209 4,910 14,465 6,910 0 84,328 0 0 0 0 83,493 0 118,898 0 0 0Munshiganj 20700 5,423 4,315 3,753 2,278 3,360 1,791 5,277 2,521 0 0 0 0 0 0 2,720 2,081 44,778 3,264 4,315 3,588Narayanganj 20900 578,234 460,103 400,158 242,906 358,253 190,992 562,719 268,808 98,436 645,169 195,906 71,188 169,340 174,959 353,102 351,832 494,572 294,569 889,365 872,605Rajbari 21000 27,457 21,847 19,001 11,534 17,011 9,069 26,720 12,764 25,273 80,995 50,298 38,856 43,477 38,856 80,493 162,513 282,477 321,627 124,652 956,056Shariatpur 21100 27,953 22,242 19,344 11,742 17,318 9,233 27,203 12,994 108,814 318,966 216,560 80,193 187,194 119,048 122,111 41,198 47,543 122,723 282,074 161,943Faridpur 21200 31,023 24,685 21,469 13,032 19,221 10,247 30,191 14,422 24,746 120,239 49,250 41,337 42,571 80,193 124,117 161,781 90,582 521,132 246,012 718,494Tangail 21300 67,703 53,871 46,853 28,441 41,946 22,362 65,886 31,473 0 0 0 0 0 0 62,906 48,114 118,993 75,486 99,795 82,967Narsingdi 21400 419,169 333,534 290,080 176,085 259,702 138,452 407,922 194,862 71,484 468,520 142,266 51,697 122,974 127,055 256,041 255,208 358,437 213,459 645,250 633,180Jamalpur 21500 33,656 26,780 23,291 14,138 20,852 11,117 32,753 15,646 0 0 0 0 0 0 24,179 8,692 22,323 26,452 18,028 14,988Netrokona 21600 32,730 26,044 22,651 13,749 20,279 10,811 31,852 15,216 0 0 0 0 0 0 23,514 8,453 21,709 25,724 17,532 14,576Sherpur 21700 19,940 15,866 13,799 8,376 12,354 6,586 19,405 9,270 0 0 0 0 0 0 14,325 5,150 13,225 15,672 10,681 8,880Mymensingh 21800 75,017 59,691 51,915 31,513 46,478 24,778 73,004 34,874 0 0 0 0 0 0 53,894 19,374 49,756 58,960 40,183 33,407Joypurhat 30100 20,525 16,332 14,204 8,622 12,717 6,780 19,975 9,542 0 5,885 0 2,023 0 7,728 30,774 56,512 78,289 82,118 56,012 328,972Bogra 30200 76,392 60,785 52,866 32,091 47,330 25,232 74,342 35,513 0 21,903 0 7,530 0 28,764 114,533 210,326 291,377 305,626 208,468 1,224,372Naogaon 30300 58,406 46,474 40,419 24,535 36,186 19,292 56,839 27,151 0 16,746 0 5,757 0 21,992 87,567 160,806 222,774 233,668 159,385 936,101Natore 30400 38,336 30,504 26,530 16,104 23,752 12,662 37,307 17,822 0 10,992 0 3,779 0 14,435 57,477 105,548 146,223 153,373 104,616 614,431Nawabganj 30500 37,007 29,447 25,610 15,546 22,928 12,224 36,014 17,204 0 10,611 0 3,648 0 13,934 55,485 101,890 141,155 148,058 100,990 593,135Pabna 30600 56,677 45,098 39,222 23,809 35,115 18,720 55,156 26,348 0 16,250 0 5,587 0 21,340 84,975 156,045 216,178 226,750 154,667 908,387Sirajganj 30700 69,577 55,363 48,150 29,228 43,107 22,981 67,710 32,345 0 19,949 0 6,858 0 26,198 104,316 191,563 265,384 278,362 189,871 1,115,148Rajshahi 30800 58,877 46,849 40,745 24,733 36,478 19,447 57,297 27,371 0 16,881 0 5,804 0 22,169 88,274 162,104 224,572 235,555 160,672 943,658Dinajpur 40100 5,520 4,392 3,820 2,319 3,420 1,823 5,372 2,566 1,547 14,718 3,078 7,752 2,661 22,324 32,356 52,321 85,209 79,010 60,540 221,434Gaibandha 40200 4,392 3,495 3,040 1,845 2,721 1,451 4,274 2,042 1,231 11,711 2,450 6,168 2,117 17,763 25,746 41,632 67,801 62,869 48,172 176,195Kurigram 40300 3,820 3,040 2,644 1,605 2,367 1,262 3,717 1,776 1,070 10,185 2,130 5,364 1,841 15,449 22,392 36,208 58,967 54,678 41,896 153,240Lalmonirhat 40400 2,319 1,845 1,605 974 1,437 766 2,257 1,078 650 6,183 1,293 3,256 1,118 9,378 13,592 21,979 35,795 33,191 25,432 93,020Nilphamari 40500 3,420 2,721 2,367 1,437 2,119 1,130 3,328 1,590 958 9,119 1,907 4,803 1,649 13,831 20,047 32,416 52,792 48,952 37,508 137,192Panchagarh 40600 1,823 1,451 1,262 766 1,130 602 1,774 848 511 4,861 1,017 2,560 879 7,374 10,687 17,282 28,145 26,097 19,996 73,140Rangpur 40700 5,372 4,274 3,717 2,257 3,328 1,774 5,228 2,497 1,505 14,323 2,996 7,544 2,590 21,725 31,488 50,917 82,922 76,890 58,915 215,492Thakurgaon 40800 2,566 2,042 1,776 1,078 1,590 848 2,497 1,193 719 6,842 1,431 3,604 1,237 10,378 15,042 24,323 39,612 36,730 28,144 102,939Barguna 50100 1,547 1,231 1,070 650 958 511 1,505 719 0 1,135,529 0 335,029 0 233,373 133,281 25,023 74,766 50,046 150,585 91,403Barisal 50200 14,718 11,711 10,185 6,183 9,119 4,861 14,323 6,842 1,135,529 0 2,259,907 4,164,215 1,953,454 869,714 434,857 41,337 86,007 119,048 397,455 157,904Bhola 50300 3,078 2,450 2,130 1,293 1,907 1,017 2,996 1,431 0 2,259,907 0 666,768 0 464,454 265,254 49,800 148,797 99,600 299,691 181,908Jhalokati 50400 7,752 6,168 5,364 3,256 4,803 2,560 7,544 3,604 335,029 4,164,215 666,768 0 576,352 630,277 235,740 0 119,048 38,471 199,241 38,471Patuakhali 50500 2,661 2,117 1,841 1,118 1,649 879 2,590 1,237 0 1,953,454 0 576,352 0 401,472 229,284 43,047 128,620 86,094 259,052 157,240Pirojpur 50600 22,324 17,763 15,449 9,378 13,831 7,374 21,725 10,378 233,373 869,714 464,454 630,277 401,472 0 4,271,955 79,399 432,375 156,341 1,620,379 158,798Bagerhat 60100 32,356 25,746 22,392 13,592 20,047 10,687 31,488 15,042 133,281 434,857 265,254 235,740 229,284 4,271,955 0 79,399 748,184 235,740 5,524,164 197,269Chuadanga 60200 52,321 41,632 36,208 21,979 32,416 17,282 50,917 24,323 25,023 41,337 49,800 0 43,047 79,399 79,399 0 828,376 2,595,592 276,953 2,982,758Jessore 60300 85,209 67,801 58,967 35,795 52,792 28,145 82,922 39,612 74,766 86,007 148,797 119,048 128,620 432,375 748,184 828,376 0 3,745,881 3,086,112 1,579,041Jhenaida 60400 79,010 62,869 54,678 33,191 48,952 26,097 76,890 36,730 50,046 119,048 99,600 38,471 86,094 156,341 235,740 2,595,592 3,745,881 0 634,098 3,492,709Khulna 60500 60,540 48,172 41,896 25,432 37,508 19,996 58,915 28,144 150,585 397,455 299,691 199,241 259,052 1,620,379 5,524,164 276,953 3,086,112 634,098 0 512,568Kushtia 60600 221,434 176,195 153,240 93,020 137,192 73,140 215,492 102,939 91,403 157,904 181,908 38,471 157,240 158,798 197,269 2,982,758 1,579,041 3,492,709 512,568 0Magura 60700 36,317 28,898 25,133 15,256 22,501 11,996 35,343 16,883 33,712 80,193 67,092 38,471 57,994 79,399 117,870 471,479 2,089,128 3,615,492 354,664 745,690Meherpur 60800 27,244 21,678 18,854 11,445 16,879 8,999 26,513 12,665 8,689 38,856 17,292 0 14,947 38,471 38,471 1,934,215 276,953 514,864 119,048 1,101,756Narail 60900 27,229 21,666 18,843 11,438 16,870 8,994 26,498 12,658 33,712 80,193 67,092 38,471 57,994 158,798 235,740 156,341 3,755,807 394,537 952,388 235,740Satkhira 61000 162,944 129,655 112,763 68,450 100,954 53,821 158,572 75,749 276,295 476,194 549,876 197,269 475,311 1,022,357 1,693,562 550,878 6,020,209 1,299,024 6,746,907 904,487Habiganj 70100 12,371 9,844 8,561 5,197 7,665 4,086 12,039 5,751 0 0 0 0 0 0 4,651 3,558 8,799 38,019 7,379 54,791Moulvibazar 70200 11,365 9,043 7,865 4,774 7,041 3,754 11,060 5,283 0 0 0 0 0 0 4,273 3,268 8,083 34,926 6,779 50,334Sunamganj 70300 14,616 11,630 10,115 6,140 9,055 4,828 14,224 6,795 0 0 0 0 0 0 5,495 4,203 10,395 44,916 8,718 64,731Sylhet 70400 20,541 16,345 14,215 8,629 12,727 6,785 19,990 9,549 0 0 0 0 0 0 7,723 5,907 14,609 63,126 12,252 90,974Benapole Land Port 99001 0 0 0 0 0 0 0 0 0 7,444 0 0 0 0 0 0 0 0 0 0Bhomra Land Port 99002 0 0 0 0 0 0 0 0 0 0 0 0 0 0 0 0 0 0 0 0Mongla Sea Port 99003 0 0 0 0 0 0 0 0 0 0 0 0 0 0 0 0 0 0 0 0Hilli Land Port 99004 0 0 0 0 0 0 0 0 0 0 0 0 0 0 0 0 0 0 0 0Dhaka Airport 99005 0 0 0 0 0 0 0 0 0 0 0 0 0 0 0 0 0 0 0 0Chittagong Airport 99006 0 0 0 0 0 0 0 0 0 0 0 0 0 0 0 0 0 0 0 0Chittagong Sea Port 99007 0 0 0 0 0 0 0 0 0 0 0 0 0 0 0 0 0 0 0 0Payra Sea Port 99008 0 0 0 0 0 0 0 0 0 0 0 0 0 0 0 0 0 0 0 0Matarbari Sea Port 99009 0 0 0 0 0 0 0 0 0 0 0 0 0 0 0 0 0 0 0 0Akhaura Land Port 99010 0 0 0 0 0 0 0 0 0 0 0 0 0 0 0 0 0 0 0 0Bibir Bazar Land Port 99011 0 0 0 0 0 0 0 0 0 0 0 0 0 0 0 0 0 0 0 0Ramgarh border crossing 99012 0 0 0 0 0 0 0 0 0 0 0 0 0 0 0 0 0 0 0 0Teknaf border crossing 99013 0 0 0 0 0 0 0 0 0 0 0 0 0 0 0 0 0 0 0 0

Data Collection Survey on the Comprehensive Transport Plan between Dhaka and Chittagong Final Report (Appendix)
A-31
Passenger OD Table in 2031 (Passenger per annum, excluding Inland waterway Passenger) (4 of 4)
60700 60800 60900 61000 70100 70200 70300 70400 99001 99002 99003 99004 99005 99006 99007 99008 99009 99010 99011 99012 99013Bandarban 10100 689 3,117 541 4,115 50,595 46,479 59,773 84,007 2,626 0 2,626 2,626 0 0 0 0 0 0 0 0 0Brahmanbaria 10200 6,495 3,594 3,958 10,891 656,470 603,067 775,561 1,089,989 0 68,516 0 0 0 0 0 0 0 0 0 0 0Chandpur 10300 3,918 2,796 3,078 8,472 343,374 315,441 405,666 570,131 0 0 0 0 0 0 0 0 0 0 0 0 0Chittagong 10400 14,154 64,068 11,122 84,574 1,039,957 955,357 1,228,616 1,726,721 53,968 0 53,968 53,968 0 0 0 0 0 0 0 0 0Comilla 10500 12,685 7,019 7,729 21,270 1,282,044 1,177,750 1,514,620 2,128,676 0 133,807 0 0 0 0 0 0 0 0 0 0 0Cox's Bazar 10600 4,181 18,927 3,285 24,984 307,217 282,225 362,950 510,096 15,943 0 15,943 15,943 0 0 0 0 0 0 0 0 0Feni 10700 3,384 1,873 2,062 5,675 342,059 314,233 404,113 567,948 0 35,701 0 0 0 0 0 0 0 0 0 0 0Khagrachhari 10800 1,089 4,928 855 6,505 79,985 73,478 94,495 132,806 4,151 0 4,151 4,151 0 0 0 0 0 0 0 0 0Lakshmipur 10900 3,066 2,188 2,409 6,630 268,741 246,879 317,494 446,212 0 0 0 0 0 0 0 0 0 0 0 0 0Noakhali 11000 5,566 3,972 4,373 12,035 487,824 448,140 576,321 809,973 0 0 0 0 0 0 0 0 0 0 0 0 0Rangamati 11100 1,057 4,784 830 6,315 77,648 71,331 91,734 128,925 4,030 0 4,030 4,030 0 0 0 0 0 0 0 0 0Dhaka 20100 938,827 1,365,380 751,779 1,012,381 2,429,971 2,232,295 2,870,794 4,149,777 623,322 44,120 66,181 242,663 0 0 0 0 0 0 0 0 0Gazipur 20200 306,817 453,134 245,828 320,735 795,855 731,113 940,231 1,321,419 209,905 14,858 22,287 81,717 0 0 0 0 0 0 0 0 0Gopalganj 20300 123,463 40,235 159,423 1,039,241 2,378 2,185 2,810 3,949 121,530 0 0 0 0 0 0 0 0 0 0 0 0Kishoreganj 20400 3,654 2,607 2,871 7,900 502,673 461,781 593,864 834,628 0 0 0 0 0 0 0 0 0 0 0 0 0Madaripur 20500 120,971 40,227 547,971 400,157 2,365 2,173 2,794 3,927 7,444 0 0 0 0 0 0 0 0 0 0 0 0Manikganj 20600 0 0 0 0 110,172 101,209 130,158 182,927 0 0 0 0 0 0 0 0 0 0 0 0 0Munshiganj 20700 1,692 1,208 40,570 3,660 63,734 58,549 75,296 105,822 39,240 0 0 0 0 0 0 0 0 0 0 0 0Narayanganj 20900 246,629 378,832 197,900 236,468 636,292 584,530 751,722 1,056,485 181,805 12,869 19,303 70,778 0 0 0 0 0 0 0 0 0Rajbari 21000 358,876 81,428 81,553 283,176 2,129 1,956 2,516 3,536 0 0 0 0 0 0 0 0 0 0 0 0 0Shariatpur 21100 82,098 40,215 120,546 322,410 2,345 2,154 2,770 3,893 0 0 0 0 0 0 0 0 0 0 0 0 0Faridpur 21200 676,107 82,443 121,526 55,601 3,880 3,565 4,584 6,443 116,567 0 0 0 0 0 0 0 0 0 0 0 0Tangail 21300 119,159 147,960 30,755 84,634 232,448 213,538 274,616 385,951 0 0 0 0 0 0 0 0 0 0 0 0 0Narsingdi 21400 178,864 274,937 143,528 171,210 495,275 454,985 585,123 822,343 132,026 9,345 14,018 51,398 0 0 0 0 0 0 0 0 0Jamalpur 21500 7,071 5,046 5,556 15,289 411,232 377,779 485,834 682,801 0 0 0 0 0 0 0 0 0 0 0 0 0Netrokona 21600 6,876 4,907 5,403 14,869 399,926 367,393 472,477 664,029 0 0 0 0 0 0 0 0 0 0 0 0 0Sherpur 21700 4,189 2,989 3,292 9,058 243,640 223,820 287,839 404,534 0 0 0 0 0 0 0 0 0 0 0 0 0Mymensingh 21800 15,760 11,246 12,384 34,079 916,619 842,053 1,082,904 1,521,934 0 0 0 0 0 0 0 0 0 0 0 0 0Joypurhat 30100 35,744 27,955 21,019 95,342 5,941 5,458 7,019 9,865 0 0 0 0 0 0 0 0 0 0 0 0 0Bogra 30200 133,031 104,044 78,227 354,845 22,113 20,314 26,124 36,716 0 0 0 0 0 0 0 0 0 0 0 0 0Naogaon 30300 101,710 79,547 59,809 271,298 16,907 15,531 19,974 28,071 0 0 0 0 0 0 0 0 0 0 0 0 0Natore 30400 66,760 52,213 39,257 178,073 11,097 10,194 13,110 18,425 0 0 0 0 0 0 0 0 0 0 0 0 0Nawabganj 30500 64,446 50,403 37,896 171,901 10,712 9,841 12,656 17,787 0 0 0 0 0 0 0 0 0 0 0 0 0Pabna 30600 98,699 77,192 58,038 263,267 16,406 15,071 19,382 27,240 0 0 0 0 0 0 0 0 0 0 0 0 0Sirajganj 30700 121,164 94,762 71,249 323,190 20,140 18,502 23,794 33,440 0 0 0 0 0 0 0 0 0 0 0 0 0Rajshahi 30800 102,531 80,190 60,292 273,489 17,043 15,657 20,135 28,298 0 0 0 0 0 0 0 0 0 0 0 0 0Dinajpur 40100 36,317 27,244 27,229 162,944 14,738 13,539 17,412 24,471 0 0 0 0 0 0 0 0 0 0 0 0 0Gaibandha 40200 28,898 21,678 21,666 129,655 11,727 10,773 13,855 19,472 0 0 0 0 0 0 0 0 0 0 0 0 0Kurigram 40300 25,133 18,854 18,843 112,763 10,199 9,370 12,050 16,935 0 0 0 0 0 0 0 0 0 0 0 0 0Lalmonirhat 40400 15,256 11,445 11,438 68,450 6,191 5,688 7,314 10,280 0 0 0 0 0 0 0 0 0 0 0 0 0Nilphamari 40500 22,501 16,879 16,870 100,954 9,131 8,388 10,788 15,161 0 0 0 0 0 0 0 0 0 0 0 0 0Panchagarh 40600 11,996 8,999 8,994 53,821 4,868 4,472 5,751 8,083 0 0 0 0 0 0 0 0 0 0 0 0 0Rangpur 40700 35,343 26,513 26,498 158,572 14,343 13,176 16,945 23,814 0 0 0 0 0 0 0 0 0 0 0 0 0Thakurgaon 40800 16,883 12,665 12,658 75,749 6,851 6,294 8,094 11,376 0 0 0 0 0 0 0 0 0 0 0 0 0Barguna 50100 33,712 8,689 33,712 276,295 0 0 0 0 0 0 0 0 0 0 0 0 0 0 0 0 0Barisal 50200 80,193 38,856 80,193 476,194 0 0 0 0 7,444 0 0 0 0 0 0 0 0 0 0 0 0Bhola 50300 67,092 17,292 67,092 549,876 0 0 0 0 0 0 0 0 0 0 0 0 0 0 0 0 0Jhalokati 50400 38,471 0 38,471 197,269 0 0 0 0 0 0 0 0 0 0 0 0 0 0 0 0 0Patuakhali 50500 57,994 14,947 57,994 475,311 0 0 0 0 0 0 0 0 0 0 0 0 0 0 0 0 0Pirojpur 50600 79,399 38,471 158,798 1,022,357 0 0 0 0 0 0 0 0 0 0 0 0 0 0 0 0 0Bagerhat 60100 117,870 38,471 235,740 1,693,562 5,835 5,361 6,894 9,689 0 0 0 0 0 0 0 0 0 0 0 0 0Chuadanga 60200 471,479 1,934,215 156,341 550,878 4,463 4,100 5,273 7,411 0 0 0 0 0 0 0 0 0 0 0 0 0Jessore 60300 2,089,128 276,953 3,755,807 6,020,209 11,038 10,140 13,040 18,327 0 0 0 0 0 0 0 0 0 0 0 0 0Jhenaida 60400 3,615,492 514,864 394,537 1,299,024 39,440 36,231 46,595 65,485 0 0 0 0 0 0 0 0 0 0 0 0 0Khulna 60500 354,664 119,048 952,388 6,746,907 9,257 8,504 10,937 15,371 0 0 0 0 0 0 0 0 0 0 0 0 0Kushtia 60600 745,690 1,101,756 235,740 904,487 56,353 51,768 66,576 93,567 0 0 0 0 0 0 0 0 0 0 0 0 0Magura 60700 0 156,341 315,138 709,676 3,631 3,335 4,289 6,028 0 0 0 0 0 0 0 0 0 0 0 0 0Meherpur 60800 156,341 0 79,399 238,196 18,810 17,280 22,222 31,231 0 0 0 0 0 0 0 0 0 0 0 0 0Narail 60900 315,138 79,399 0 750,603 2,853 2,621 3,370 4,737 0 0 0 0 0 0 0 0 0 0 0 0 0Satkhira 61000 709,676 238,196 750,603 0 7,851 7,212 9,275 13,035 0 0 0 0 0 0 0 0 0 0 0 0 0Habiganj 70100 2,894 18,284 2,274 6,258 0 0 0 0 0 0 0 0 0 0 0 0 0 0 0 0 0Moulvibazar 70200 2,659 16,797 2,089 5,749 0 0 0 0 0 0 0 0 0 0 0 0 0 0 0 0 0Sunamganj 70300 3,419 21,601 2,687 7,393 0 0 0 0 0 0 0 0 0 0 0 0 0 0 0 0 0Sylhet 70400 4,805 30,358 3,776 10,391 0 0 0 0 0 0 0 0 0 0 0 0 0 0 0 0 0Benapole Land Port 99001 0 0 0 0 0 0 0 0 0 0 0 0 0 0 0 0 0 0 0 0 0Bhomra Land Port 99002 0 0 0 0 0 0 0 0 0 0 0 0 0 0 0 0 0 0 0 0 0Mongla Sea Port 99003 0 0 0 0 0 0 0 0 0 0 0 0 0 0 0 0 0 0 0 0 0Hilli Land Port 99004 0 0 0 0 0 0 0 0 0 0 0 0 0 0 0 0 0 0 0 0 0Dhaka Airport 99005 0 0 0 0 0 0 0 0 0 0 0 0 0 0 0 0 0 0 0 0 0Chittagong Airport 99006 0 0 0 0 0 0 0 0 0 0 0 0 0 0 0 0 0 0 0 0 0Chittagong Sea Port 99007 0 0 0 0 0 0 0 0 0 0 0 0 0 0 0 0 0 0 0 0 0Payra Sea Port 99008 0 0 0 0 0 0 0 0 0 0 0 0 0 0 0 0 0 0 0 0 0Matarbari Sea Port 99009 0 0 0 0 0 0 0 0 0 0 0 0 0 0 0 0 0 0 0 0 0Akhaura Land Port 99010 0 0 0 0 0 0 0 0 0 0 0 0 0 0 0 0 0 0 0 0 0Bibir Bazar Land Port 99011 0 0 0 0 0 0 0 0 0 0 0 0 0 0 0 0 0 0 0 0 0Ramgarh border crossing 99012 0 0 0 0 0 0 0 0 0 0 0 0 0 0 0 0 0 0 0 0 0Teknaf border crossing 99013 0 0 0 0 0 0 0 0 0 0 0 0 0 0 0 0 0 0 0 0 0
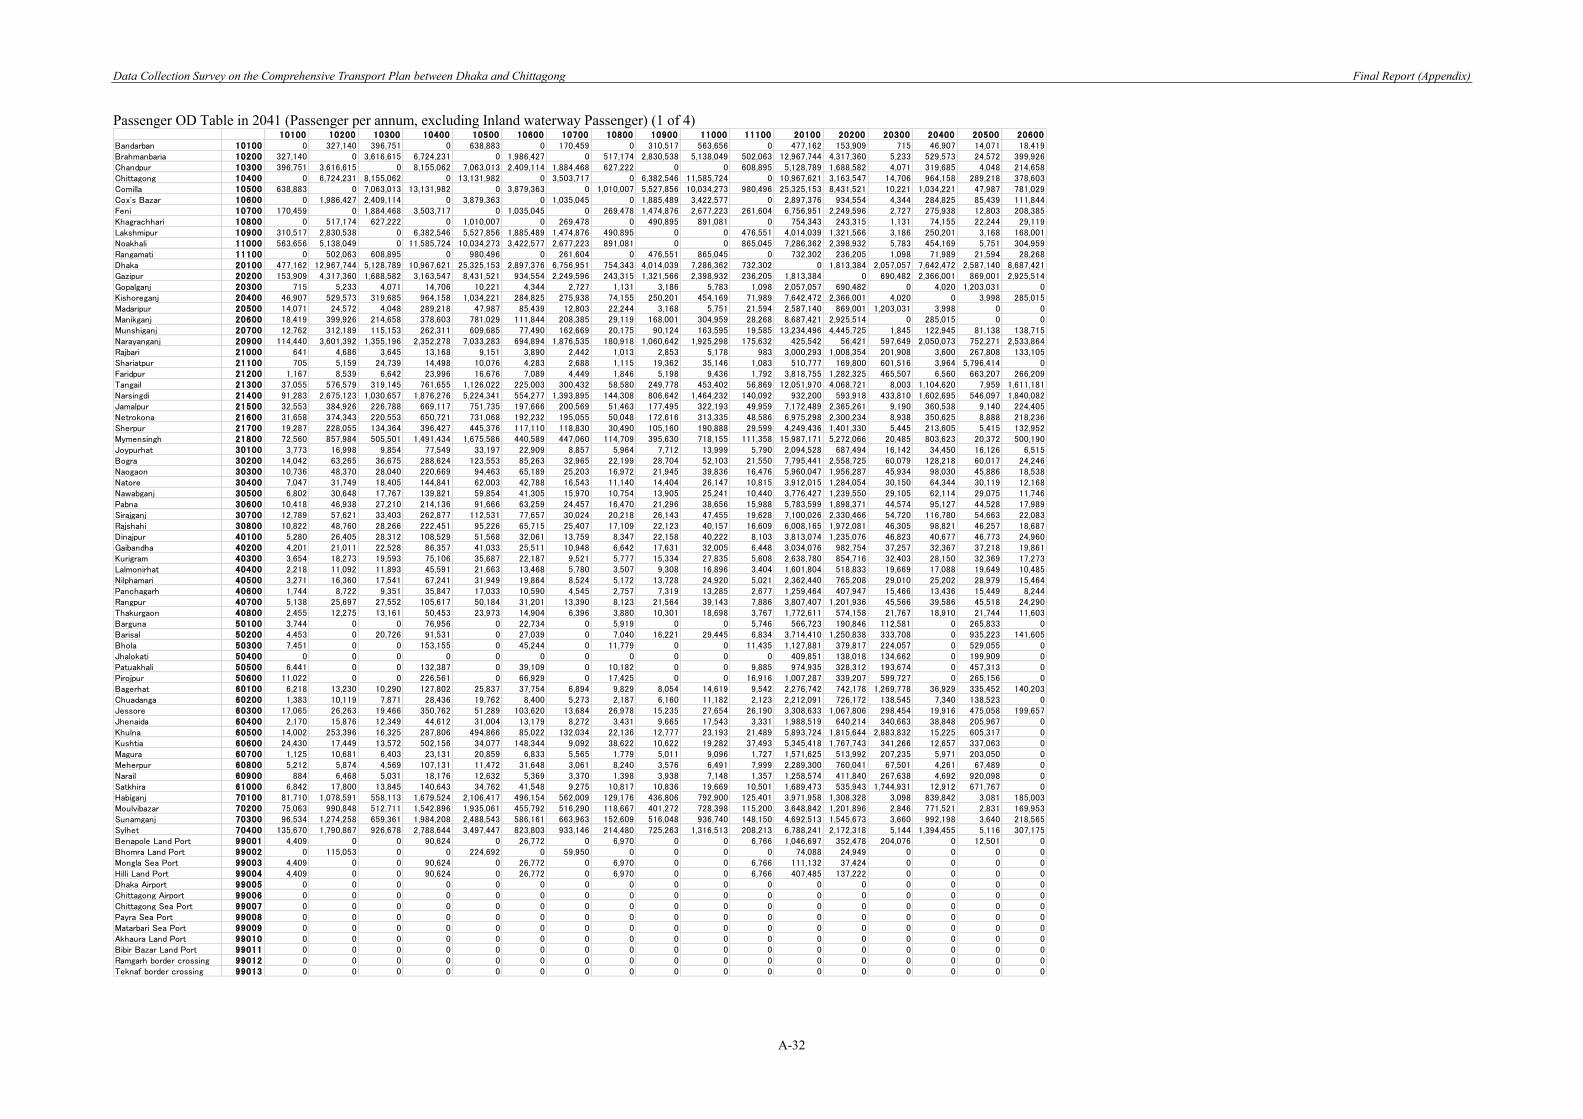
Data Collection Survey on the Comprehensive Transport Plan between Dhaka and Chittagong Final Report (Appendix)
A-32
Passenger OD Table in 2041 (Passenger per annum, excluding Inland waterway Passenger) (1 of 4)
10100 10200 10300 10400 10500 10600 10700 10800 10900 11000 11100 20100 20200 20300 20400 20500 20600Bandarban 10100 0 327,140 396,751 0 638,883 0 170,459 0 310,517 563,656 0 477,162 153,909 715 46,907 14,071 18,419Brahmanbaria 10200 327,140 0 3,616,615 6,724,231 0 1,986,427 0 517,174 2,830,538 5,138,049 502,063 12,967,744 4,317,360 5,233 529,573 24,572 399,926Chandpur 10300 396,751 3,616,615 0 8,155,062 7,063,013 2,409,114 1,884,468 627,222 0 0 608,895 5,128,789 1,688,582 4,071 319,685 4,048 214,658Chittagong 10400 0 6,724,231 8,155,062 0 13,131,982 0 3,503,717 0 6,382,546 11,585,724 0 10,967,621 3,163,547 14,706 964,158 289,218 378,603Comilla 10500 638,883 0 7,063,013 13,131,982 0 3,879,363 0 1,010,007 5,527,856 10,034,273 980,496 25,325,153 8,431,521 10,221 1,034,221 47,987 781,029Cox's Bazar 10600 0 1,986,427 2,409,114 0 3,879,363 0 1,035,045 0 1,885,489 3,422,577 0 2,897,376 934,554 4,344 284,825 85,439 111,844Feni 10700 170,459 0 1,884,468 3,503,717 0 1,035,045 0 269,478 1,474,876 2,677,223 261,604 6,756,951 2,249,596 2,727 275,938 12,803 208,385Khagrachhari 10800 0 517,174 627,222 0 1,010,007 0 269,478 0 490,895 891,081 0 754,343 243,315 1,131 74,155 22,244 29,119Lakshmipur 10900 310,517 2,830,538 0 6,382,546 5,527,856 1,885,489 1,474,876 490,895 0 0 476,551 4,014,039 1,321,566 3,186 250,201 3,168 168,001Noakhali 11000 563,656 5,138,049 0 11,585,724 10,034,273 3,422,577 2,677,223 891,081 0 0 865,045 7,286,362 2,398,932 5,783 454,169 5,751 304,959Rangamati 11100 0 502,063 608,895 0 980,496 0 261,604 0 476,551 865,045 0 732,302 236,205 1,098 71,989 21,594 28,268Dhaka 20100 477,162 12,967,744 5,128,789 10,967,621 25,325,153 2,897,376 6,756,951 754,343 4,014,039 7,286,362 732,302 0 1,813,384 2,057,057 7,642,472 2,587,140 8,687,421Gazipur 20200 153,909 4,317,360 1,688,582 3,163,547 8,431,521 934,554 2,249,596 243,315 1,321,566 2,398,932 236,205 1,813,384 0 690,482 2,366,001 869,001 2,925,514Gopalganj 20300 715 5,233 4,071 14,706 10,221 4,344 2,727 1,131 3,186 5,783 1,098 2,057,057 690,482 0 4,020 1,203,031 0Kishoreganj 20400 46,907 529,573 319,685 964,158 1,034,221 284,825 275,938 74,155 250,201 454,169 71,989 7,642,472 2,366,001 4,020 0 3,998 285,015Madaripur 20500 14,071 24,572 4,048 289,218 47,987 85,439 12,803 22,244 3,168 5,751 21,594 2,587,140 869,001 1,203,031 3,998 0 0Manikganj 20600 18,419 399,926 214,658 378,603 781,029 111,844 208,385 29,119 168,001 304,959 28,268 8,687,421 2,925,514 0 285,015 0 0Munshiganj 20700 12,762 312,189 115,153 262,311 609,685 77,490 162,669 20,175 90,124 163,595 19,585 13,234,496 4,445,725 1,845 122,945 81,138 138,715Narayanganj 20900 114,440 3,601,392 1,355,196 2,352,278 7,033,283 694,894 1,876,535 180,918 1,060,642 1,925,298 175,632 425,542 56,421 597,649 2,050,073 752,271 2,533,864Rajbari 21000 641 4,686 3,645 13,168 9,151 3,890 2,442 1,013 2,853 5,178 983 3,000,293 1,008,354 201,908 3,600 267,808 133,105Shariatpur 21100 705 5,159 24,739 14,498 10,076 4,283 2,688 1,115 19,362 35,146 1,083 510,777 169,800 601,516 3,964 5,796,414 0Faridpur 21200 1,167 8,539 6,642 23,996 16,676 7,089 4,449 1,846 5,198 9,436 1,792 3,818,755 1,282,325 465,507 6,560 663,207 266,209Tangail 21300 37,055 576,579 319,145 761,655 1,126,022 225,003 300,432 58,580 249,778 453,402 56,869 12,051,970 4,068,721 8,003 1,104,620 7,959 1,611,181Narsingdi 21400 91,283 2,675,123 1,030,657 1,876,276 5,224,341 554,277 1,393,895 144,308 806,642 1,464,232 140,092 932,200 593,918 433,810 1,602,695 546,097 1,840,082Jamalpur 21500 32,553 384,926 226,788 669,117 751,735 197,666 200,569 51,463 177,495 322,193 49,959 7,172,489 2,365,261 9,190 360,538 9,140 224,405Netrokona 21600 31,658 374,343 220,553 650,721 731,068 192,232 195,055 50,048 172,616 313,335 48,586 6,975,298 2,300,234 8,938 350,625 8,888 218,236Sherpur 21700 19,287 228,055 134,364 396,427 445,376 117,110 118,830 30,490 105,160 190,888 29,599 4,249,436 1,401,330 5,445 213,605 5,415 132,952Mymensingh 21800 72,560 857,984 505,501 1,491,434 1,675,586 440,589 447,060 114,709 395,630 718,155 111,358 15,987,171 5,272,066 20,485 803,623 20,372 500,190Joypurhat 30100 3,773 16,998 9,854 77,549 33,197 22,909 8,857 5,964 7,712 13,999 5,790 2,094,528 687,494 16,142 34,450 16,126 6,515Bogra 30200 14,042 63,265 36,675 288,624 123,553 85,263 32,965 22,199 28,704 52,103 21,550 7,795,441 2,558,725 60,079 128,218 60,017 24,246Naogaon 30300 10,736 48,370 28,040 220,669 94,463 65,189 25,203 16,972 21,945 39,836 16,476 5,960,047 1,956,287 45,934 98,030 45,886 18,538Natore 30400 7,047 31,749 18,405 144,841 62,003 42,788 16,543 11,140 14,404 26,147 10,815 3,912,015 1,284,054 30,150 64,344 30,119 12,168Nawabganj 30500 6,802 30,648 17,767 139,821 59,854 41,305 15,970 10,754 13,905 25,241 10,440 3,776,427 1,239,550 29,105 62,114 29,075 11,746Pabna 30600 10,418 46,938 27,210 214,136 91,666 63,259 24,457 16,470 21,296 38,656 15,988 5,783,599 1,898,371 44,574 95,127 44,528 17,989Sirajganj 30700 12,789 57,621 33,403 262,877 112,531 77,657 30,024 20,218 26,143 47,455 19,628 7,100,026 2,330,466 54,720 116,780 54,663 22,083Rajshahi 30800 10,822 48,760 28,266 222,451 95,226 65,715 25,407 17,109 22,123 40,157 16,609 6,008,165 1,972,081 46,305 98,821 46,257 18,687Dinajpur 40100 5,280 26,405 28,312 108,529 51,568 32,061 13,759 8,347 22,158 40,222 8,103 3,813,074 1,235,076 46,823 40,677 46,773 24,960Gaibandha 40200 4,201 21,011 22,528 86,357 41,033 25,511 10,948 6,642 17,631 32,005 6,448 3,034,076 982,754 37,257 32,367 37,218 19,861Kurigram 40300 3,654 18,273 19,593 75,106 35,687 22,187 9,521 5,777 15,334 27,835 5,608 2,638,780 854,716 32,403 28,150 32,369 17,273Lalmonirhat 40400 2,218 11,092 11,893 45,591 21,663 13,468 5,780 3,507 9,308 16,896 3,404 1,601,804 518,833 19,669 17,088 19,649 10,485Nilphamari 40500 3,271 16,360 17,541 67,241 31,949 19,864 8,524 5,172 13,728 24,920 5,021 2,362,440 765,208 29,010 25,202 28,979 15,464Panchagarh 40600 1,744 8,722 9,351 35,847 17,033 10,590 4,545 2,757 7,319 13,285 2,677 1,259,464 407,947 15,466 13,436 15,449 8,244Rangpur 40700 5,138 25,697 27,552 105,617 50,184 31,201 13,390 8,123 21,564 39,143 7,886 3,807,407 1,201,936 45,566 39,586 45,518 24,290Thakurgaon 40800 2,455 12,275 13,161 50,453 23,973 14,904 6,396 3,880 10,301 18,698 3,767 1,772,611 574,158 21,767 18,910 21,744 11,603Barguna 50100 3,744 0 0 76,956 0 22,734 0 5,919 0 0 5,746 566,723 190,846 112,581 0 265,833 0Barisal 50200 4,453 0 20,726 91,531 0 27,039 0 7,040 16,221 29,445 6,834 3,714,410 1,250,838 333,708 0 935,223 141,605Bhola 50300 7,451 0 0 153,155 0 45,244 0 11,779 0 0 11,435 1,127,881 379,817 224,057 0 529,055 0Jhalokati 50400 0 0 0 0 0 0 0 0 0 0 0 409,851 138,018 134,662 0 199,909 0Patuakhali 50500 6,441 0 0 132,387 0 39,109 0 10,182 0 0 9,885 974,935 328,312 193,674 0 457,313 0Pirojpur 50600 11,022 0 0 226,561 0 66,929 0 17,425 0 0 16,916 1,007,287 339,207 599,727 0 265,156 0Bagerhat 60100 6,218 13,230 10,290 127,802 25,837 37,754 6,894 9,829 8,054 14,619 9,542 2,276,742 742,178 1,269,778 36,929 335,452 140,203Chuadanga 60200 1,383 10,119 7,871 28,436 19,762 8,400 5,273 2,187 6,160 11,182 2,123 2,212,091 726,172 138,545 7,340 138,523 0Jessore 60300 17,065 26,263 19,466 350,762 51,289 103,620 13,684 26,978 15,235 27,654 26,190 3,308,633 1,067,806 298,454 19,916 475,058 199,657Jhenaida 60400 2,170 15,876 12,349 44,612 31,004 13,179 8,272 3,431 9,665 17,543 3,331 1,988,519 640,214 340,663 38,848 205,967 0Khulna 60500 14,002 253,396 16,325 287,806 494,866 85,022 132,034 22,136 12,777 23,193 21,489 5,893,724 1,815,644 2,883,832 15,225 605,317 0Kushtia 60600 24,430 17,449 13,572 502,156 34,077 148,344 9,092 38,622 10,622 19,282 37,493 5,345,418 1,767,743 341,266 12,657 337,063 0Magura 60700 1,125 10,681 6,403 23,131 20,859 6,833 5,565 1,779 5,011 9,096 1,727 1,571,625 513,992 207,235 5,971 203,050 0Meherpur 60800 5,212 5,874 4,569 107,131 11,472 31,648 3,061 8,240 3,576 6,491 7,999 2,289,300 760,041 67,501 4,261 67,489 0Narail 60900 884 6,468 5,031 18,176 12,632 5,369 3,370 1,398 3,938 7,148 1,357 1,258,574 411,840 267,638 4,692 920,098 0Satkhira 61000 6,842 17,800 13,845 140,643 34,762 41,548 9,275 10,817 10,836 19,669 10,501 1,689,473 535,943 1,744,931 12,912 671,767 0Habiganj 70100 81,710 1,078,591 558,113 1,679,524 2,106,417 496,154 562,009 129,176 436,806 792,900 125,401 3,971,958 1,308,328 3,098 839,842 3,081 185,003Moulvibazar 70200 75,063 990,848 512,711 1,542,896 1,935,061 455,792 516,290 118,667 401,272 728,398 115,200 3,648,842 1,201,896 2,846 771,521 2,831 169,953Sunamganj 70300 96,534 1,274,258 659,361 1,984,208 2,488,543 586,161 663,963 152,609 516,048 936,740 148,150 4,692,513 1,545,673 3,660 992,198 3,640 218,565Sylhet 70400 135,670 1,790,867 926,678 2,788,644 3,497,447 823,803 933,146 214,480 725,263 1,316,513 208,213 6,788,241 2,172,318 5,144 1,394,455 5,116 307,175Benapole Land Port 99001 4,409 0 0 90,624 0 26,772 0 6,970 0 0 6,766 1,046,697 352,478 204,076 0 12,501 0Bhomra Land Port 99002 0 115,053 0 0 224,692 0 59,950 0 0 0 0 74,088 24,949 0 0 0 0Mongla Sea Port 99003 4,409 0 0 90,624 0 26,772 0 6,970 0 0 6,766 111,132 37,424 0 0 0 0Hilli Land Port 99004 4,409 0 0 90,624 0 26,772 0 6,970 0 0 6,766 407,485 137,222 0 0 0 0Dhaka Airport 99005 0 0 0 0 0 0 0 0 0 0 0 0 0 0 0 0 0Chittagong Airport 99006 0 0 0 0 0 0 0 0 0 0 0 0 0 0 0 0 0Chittagong Sea Port 99007 0 0 0 0 0 0 0 0 0 0 0 0 0 0 0 0 0Payra Sea Port 99008 0 0 0 0 0 0 0 0 0 0 0 0 0 0 0 0 0Matarbari Sea Port 99009 0 0 0 0 0 0 0 0 0 0 0 0 0 0 0 0 0Akhaura Land Port 99010 0 0 0 0 0 0 0 0 0 0 0 0 0 0 0 0 0Bibir Bazar Land Port 99011 0 0 0 0 0 0 0 0 0 0 0 0 0 0 0 0 0Ramgarh border crossing 99012 0 0 0 0 0 0 0 0 0 0 0 0 0 0 0 0 0Teknaf border crossing 99013 0 0 0 0 0 0 0 0 0 0 0 0 0 0 0 0 0
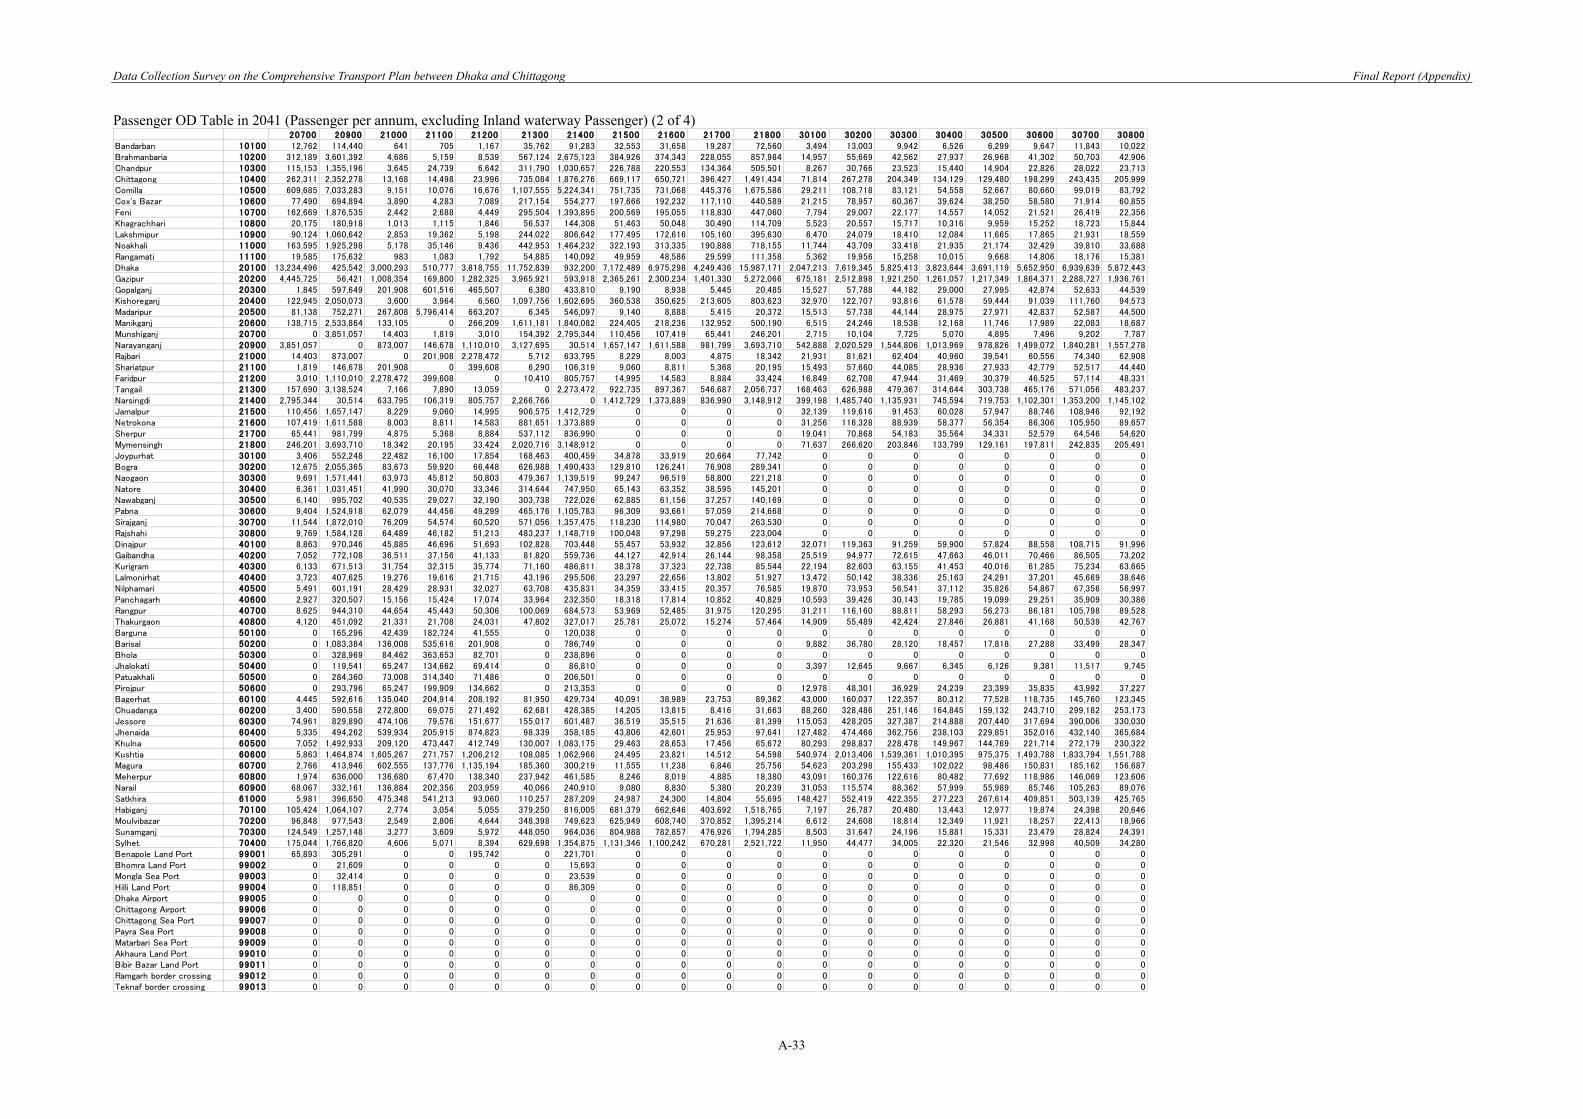
Data Collection Survey on the Comprehensive Transport Plan between Dhaka and Chittagong Final Report (Appendix)
A-33
Passenger OD Table in 2041 (Passenger per annum, excluding Inland waterway Passenger) (2 of 4)
20700 20900 21000 21100 21200 21300 21400 21500 21600 21700 21800 30100 30200 30300 30400 30500 30600 30700 30800Bandarban 10100 12,762 114,440 641 705 1,167 35,762 91,283 32,553 31,658 19,287 72,560 3,494 13,003 9,942 6,526 6,299 9,647 11,843 10,022Brahmanbaria 10200 312,189 3,601,392 4,686 5,159 8,539 567,124 2,675,123 384,926 374,343 228,055 857,984 14,957 55,669 42,562 27,937 26,968 41,302 50,703 42,906Chandpur 10300 115,153 1,355,196 3,645 24,739 6,642 311,790 1,030,657 226,788 220,553 134,364 505,501 8,267 30,766 23,523 15,440 14,904 22,826 28,022 23,713Chittagong 10400 262,311 2,352,278 13,168 14,498 23,996 735,084 1,876,276 669,117 650,721 396,427 1,491,434 71,814 267,278 204,349 134,129 129,480 198,299 243,435 205,999Comilla 10500 609,685 7,033,283 9,151 10,076 16,676 1,107,555 5,224,341 751,735 731,068 445,376 1,675,586 29,211 108,718 83,121 54,558 52,667 80,660 99,019 83,792Cox's Bazar 10600 77,490 694,894 3,890 4,283 7,089 217,154 554,277 197,666 192,232 117,110 440,589 21,215 78,957 60,367 39,624 38,250 58,580 71,914 60,855Feni 10700 162,669 1,876,535 2,442 2,688 4,449 295,504 1,393,895 200,569 195,055 118,830 447,060 7,794 29,007 22,177 14,557 14,052 21,521 26,419 22,356Khagrachhari 10800 20,175 180,918 1,013 1,115 1,846 56,537 144,308 51,463 50,048 30,490 114,709 5,523 20,557 15,717 10,316 9,959 15,252 18,723 15,844Lakshmipur 10900 90,124 1,060,642 2,853 19,362 5,198 244,022 806,642 177,495 172,616 105,160 395,630 6,470 24,079 18,410 12,084 11,665 17,865 21,931 18,559Noakhali 11000 163,595 1,925,298 5,178 35,146 9,436 442,953 1,464,232 322,193 313,335 190,888 718,155 11,744 43,709 33,418 21,935 21,174 32,429 39,810 33,688Rangamati 11100 19,585 175,632 983 1,083 1,792 54,885 140,092 49,959 48,586 29,599 111,358 5,362 19,956 15,258 10,015 9,668 14,806 18,176 15,381Dhaka 20100 13,234,496 425,542 3,000,293 510,777 3,818,755 11,752,839 932,200 7,172,489 6,975,298 4,249,436 15,987,171 2,047,213 7,619,345 5,825,413 3,823,644 3,691,119 5,652,950 6,939,639 5,872,443Gazipur 20200 4,445,725 56,421 1,008,354 169,800 1,282,325 3,965,921 593,918 2,365,261 2,300,234 1,401,330 5,272,066 675,181 2,512,898 1,921,250 1,261,057 1,217,349 1,864,371 2,288,727 1,936,761Gopalganj 20300 1,845 597,649 201,908 601,516 465,507 6,380 433,810 9,190 8,938 5,445 20,485 15,527 57,788 44,182 29,000 27,995 42,874 52,633 44,539Kishoreganj 20400 122,945 2,050,073 3,600 3,964 6,560 1,097,756 1,602,695 360,538 350,625 213,605 803,623 32,970 122,707 93,816 61,578 59,444 91,039 111,760 94,573Madaripur 20500 81,138 752,271 267,808 5,796,414 663,207 6,345 546,097 9,140 8,888 5,415 20,372 15,513 57,738 44,144 28,975 27,971 42,837 52,587 44,500Manikganj 20600 138,715 2,533,864 133,105 0 266,209 1,611,181 1,840,082 224,405 218,236 132,952 500,190 6,515 24,246 18,538 12,168 11,746 17,989 22,083 18,687Munshiganj 20700 0 3,851,057 14,403 1,819 3,010 154,392 2,795,344 110,456 107,419 65,441 246,201 2,715 10,104 7,725 5,070 4,895 7,496 9,202 7,787Narayanganj 20900 3,851,057 0 873,007 146,678 1,110,010 3,127,695 30,514 1,657,147 1,611,588 981,799 3,693,710 542,888 2,020,529 1,544,806 1,013,969 978,826 1,499,072 1,840,281 1,557,278Rajbari 21000 14,403 873,007 0 201,908 2,278,472 5,712 633,795 8,229 8,003 4,875 18,342 21,931 81,621 62,404 40,960 39,541 60,556 74,340 62,908Shariatpur 21100 1,819 146,678 201,908 0 399,608 6,290 106,319 9,060 8,811 5,368 20,195 15,493 57,660 44,085 28,936 27,933 42,779 52,517 44,440Faridpur 21200 3,010 1,110,010 2,278,472 399,608 0 10,410 805,757 14,995 14,583 8,884 33,424 16,849 62,708 47,944 31,469 30,379 46,525 57,114 48,331Tangail 21300 157,690 3,138,524 7,166 7,890 13,059 0 2,273,472 922,735 897,367 546,687 2,056,737 168,463 626,988 479,367 314,644 303,738 465,176 571,056 483,237Narsingdi 21400 2,795,344 30,514 633,795 106,319 805,757 2,266,766 0 1,412,729 1,373,889 836,990 3,148,912 399,198 1,485,740 1,135,931 745,594 719,753 1,102,301 1,353,200 1,145,102Jamalpur 21500 110,456 1,657,147 8,229 9,060 14,995 906,575 1,412,729 0 0 0 0 32,139 119,616 91,453 60,028 57,947 88,746 108,946 92,192Netrokona 21600 107,419 1,611,588 8,003 8,811 14,583 881,651 1,373,889 0 0 0 0 31,256 116,328 88,939 58,377 56,354 86,306 105,950 89,657Sherpur 21700 65,441 981,799 4,875 5,368 8,884 537,112 836,990 0 0 0 0 19,041 70,868 54,183 35,564 34,331 52,579 64,546 54,620Mymensingh 21800 246,201 3,693,710 18,342 20,195 33,424 2,020,716 3,148,912 0 0 0 0 71,637 266,620 203,846 133,799 129,161 197,811 242,835 205,491Joypurhat 30100 3,406 552,248 22,482 16,100 17,854 168,463 400,459 34,878 33,919 20,664 77,742 0 0 0 0 0 0 0 0Bogra 30200 12,675 2,055,365 83,673 59,920 66,448 626,988 1,490,433 129,810 126,241 76,908 289,341 0 0 0 0 0 0 0 0Naogaon 30300 9,691 1,571,441 63,973 45,812 50,803 479,367 1,139,519 99,247 96,519 58,800 221,218 0 0 0 0 0 0 0 0Natore 30400 6,361 1,031,451 41,990 30,070 33,346 314,644 747,950 65,143 63,352 38,595 145,201 0 0 0 0 0 0 0 0Nawabganj 30500 6,140 995,702 40,535 29,027 32,190 303,738 722,026 62,885 61,156 37,257 140,169 0 0 0 0 0 0 0 0Pabna 30600 9,404 1,524,918 62,079 44,456 49,299 465,176 1,105,783 96,309 93,661 57,059 214,668 0 0 0 0 0 0 0 0Sirajganj 30700 11,544 1,872,010 76,209 54,574 60,520 571,056 1,357,475 118,230 114,980 70,047 263,530 0 0 0 0 0 0 0 0Rajshahi 30800 9,769 1,584,128 64,489 46,182 51,213 483,237 1,148,719 100,048 97,298 59,275 223,004 0 0 0 0 0 0 0 0Dinajpur 40100 8,863 970,346 45,885 46,696 51,693 102,828 703,448 55,457 53,932 32,856 123,612 32,071 119,363 91,259 59,900 57,824 88,558 108,715 91,996Gaibandha 40200 7,052 772,108 36,511 37,156 41,133 81,820 559,736 44,127 42,914 26,144 98,358 25,519 94,977 72,615 47,663 46,011 70,466 86,505 73,202Kurigram 40300 6,133 671,513 31,754 32,315 35,774 71,160 486,811 38,378 37,323 22,738 85,544 22,194 82,603 63,155 41,453 40,016 61,285 75,234 63,665Lalmonirhat 40400 3,723 407,625 19,276 19,616 21,715 43,196 295,506 23,297 22,656 13,802 51,927 13,472 50,142 38,336 25,163 24,291 37,201 45,669 38,646Nilphamari 40500 5,491 601,191 28,429 28,931 32,027 63,708 435,831 34,359 33,415 20,357 76,585 19,870 73,953 56,541 37,112 35,826 54,867 67,356 56,997Panchagarh 40600 2,927 320,507 15,156 15,424 17,074 33,964 232,350 18,318 17,814 10,852 40,829 10,593 39,426 30,143 19,785 19,099 29,251 35,909 30,386Rangpur 40700 8,625 944,310 44,654 45,443 50,306 100,069 684,573 53,969 52,485 31,975 120,295 31,211 116,160 88,811 58,293 56,273 86,181 105,798 89,528Thakurgaon 40800 4,120 451,092 21,331 21,708 24,031 47,802 327,017 25,781 25,072 15,274 57,464 14,909 55,489 42,424 27,846 26,881 41,168 50,539 42,767Barguna 50100 0 165,296 42,439 182,724 41,555 0 120,038 0 0 0 0 0 0 0 0 0 0 0 0Barisal 50200 0 1,083,384 136,008 535,616 201,908 0 786,749 0 0 0 0 9,882 36,780 28,120 18,457 17,818 27,288 33,499 28,347Bhola 50300 0 328,969 84,462 363,653 82,701 0 238,896 0 0 0 0 0 0 0 0 0 0 0 0Jhalokati 50400 0 119,541 65,247 134,662 69,414 0 86,810 0 0 0 0 3,397 12,645 9,667 6,345 6,126 9,381 11,517 9,745Patuakhali 50500 0 284,360 73,008 314,340 71,486 0 206,501 0 0 0 0 0 0 0 0 0 0 0 0Pirojpur 50600 0 293,796 65,247 199,909 134,662 0 213,353 0 0 0 0 12,978 48,301 36,929 24,239 23,399 35,835 43,992 37,227Bagerhat 60100 4,445 592,616 135,040 204,914 208,192 81,950 429,734 40,091 38,989 23,753 89,362 43,000 160,037 122,357 80,312 77,528 118,735 145,760 123,345Chuadanga 60200 3,400 590,558 272,800 69,075 271,492 62,681 428,385 14,205 13,815 8,416 31,663 88,260 328,486 251,146 164,845 159,132 243,710 299,182 253,173Jessore 60300 74,961 829,890 474,106 79,576 151,677 155,017 601,487 36,519 35,515 21,636 81,399 115,053 428,205 327,387 214,888 207,440 317,694 390,006 330,030Jhenaida 60400 5,335 494,262 539,934 205,915 874,823 98,339 358,185 43,806 42,601 25,953 97,641 127,482 474,466 362,756 238,103 229,851 352,016 432,140 365,684Khulna 60500 7,052 1,492,933 209,120 473,447 412,749 130,007 1,083,175 29,463 28,653 17,456 65,672 80,293 298,837 228,478 149,967 144,769 221,714 272,179 230,322Kushtia 60600 5,863 1,464,874 1,605,267 271,757 1,206,212 108,085 1,062,966 24,495 23,821 14,512 54,598 540,974 2,013,406 1,539,361 1,010,395 975,375 1,493,788 1,833,794 1,551,788Magura 60700 2,766 413,946 602,555 137,776 1,135,194 185,360 300,219 11,555 11,238 6,846 25,756 54,623 203,298 155,433 102,022 98,486 150,831 185,162 156,687Meherpur 60800 1,974 636,000 136,680 67,470 138,340 237,942 461,585 8,246 8,019 4,885 18,380 43,091 160,376 122,616 80,482 77,692 118,986 146,069 123,606Narail 60900 68,067 332,161 136,884 202,356 203,959 40,066 240,910 9,080 8,830 5,380 20,239 31,053 115,574 88,362 57,999 55,989 85,746 105,263 89,076Satkhira 61000 5,981 396,650 475,348 541,213 93,060 110,257 287,209 24,987 24,300 14,804 55,695 148,427 552,419 422,355 277,223 267,614 409,851 503,139 425,765Habiganj 70100 105,424 1,064,107 2,774 3,054 5,055 379,250 816,005 681,379 662,646 403,692 1,518,765 7,197 26,787 20,480 13,443 12,977 19,874 24,398 20,646Moulvibazar 70200 96,848 977,543 2,549 2,806 4,644 348,398 749,623 625,949 608,740 370,852 1,395,214 6,612 24,608 18,814 12,349 11,921 18,257 22,413 18,966Sunamganj 70300 124,549 1,257,148 3,277 3,609 5,972 448,050 964,036 804,988 782,857 476,926 1,794,285 8,503 31,647 24,196 15,881 15,331 23,479 28,824 24,391Sylhet 70400 175,044 1,766,820 4,606 5,071 8,394 629,698 1,354,875 1,131,346 1,100,242 670,281 2,521,722 11,950 44,477 34,005 22,320 21,546 32,998 40,509 34,280Benapole Land Port 99001 65,893 305,291 0 0 195,742 0 221,701 0 0 0 0 0 0 0 0 0 0 0 0Bhomra Land Port 99002 0 21,609 0 0 0 0 15,693 0 0 0 0 0 0 0 0 0 0 0 0Mongla Sea Port 99003 0 32,414 0 0 0 0 23,539 0 0 0 0 0 0 0 0 0 0 0 0Hilli Land Port 99004 0 118,851 0 0 0 0 86,309 0 0 0 0 0 0 0 0 0 0 0 0Dhaka Airport 99005 0 0 0 0 0 0 0 0 0 0 0 0 0 0 0 0 0 0 0Chittagong Airport 99006 0 0 0 0 0 0 0 0 0 0 0 0 0 0 0 0 0 0 0Chittagong Sea Port 99007 0 0 0 0 0 0 0 0 0 0 0 0 0 0 0 0 0 0 0Payra Sea Port 99008 0 0 0 0 0 0 0 0 0 0 0 0 0 0 0 0 0 0 0Matarbari Sea Port 99009 0 0 0 0 0 0 0 0 0 0 0 0 0 0 0 0 0 0 0Akhaura Land Port 99010 0 0 0 0 0 0 0 0 0 0 0 0 0 0 0 0 0 0 0Bibir Bazar Land Port 99011 0 0 0 0 0 0 0 0 0 0 0 0 0 0 0 0 0 0 0Ramgarh border crossing 99012 0 0 0 0 0 0 0 0 0 0 0 0 0 0 0 0 0 0 0Teknaf border crossing 99013 0 0 0 0 0 0 0 0 0 0 0 0 0 0 0 0 0 0 0
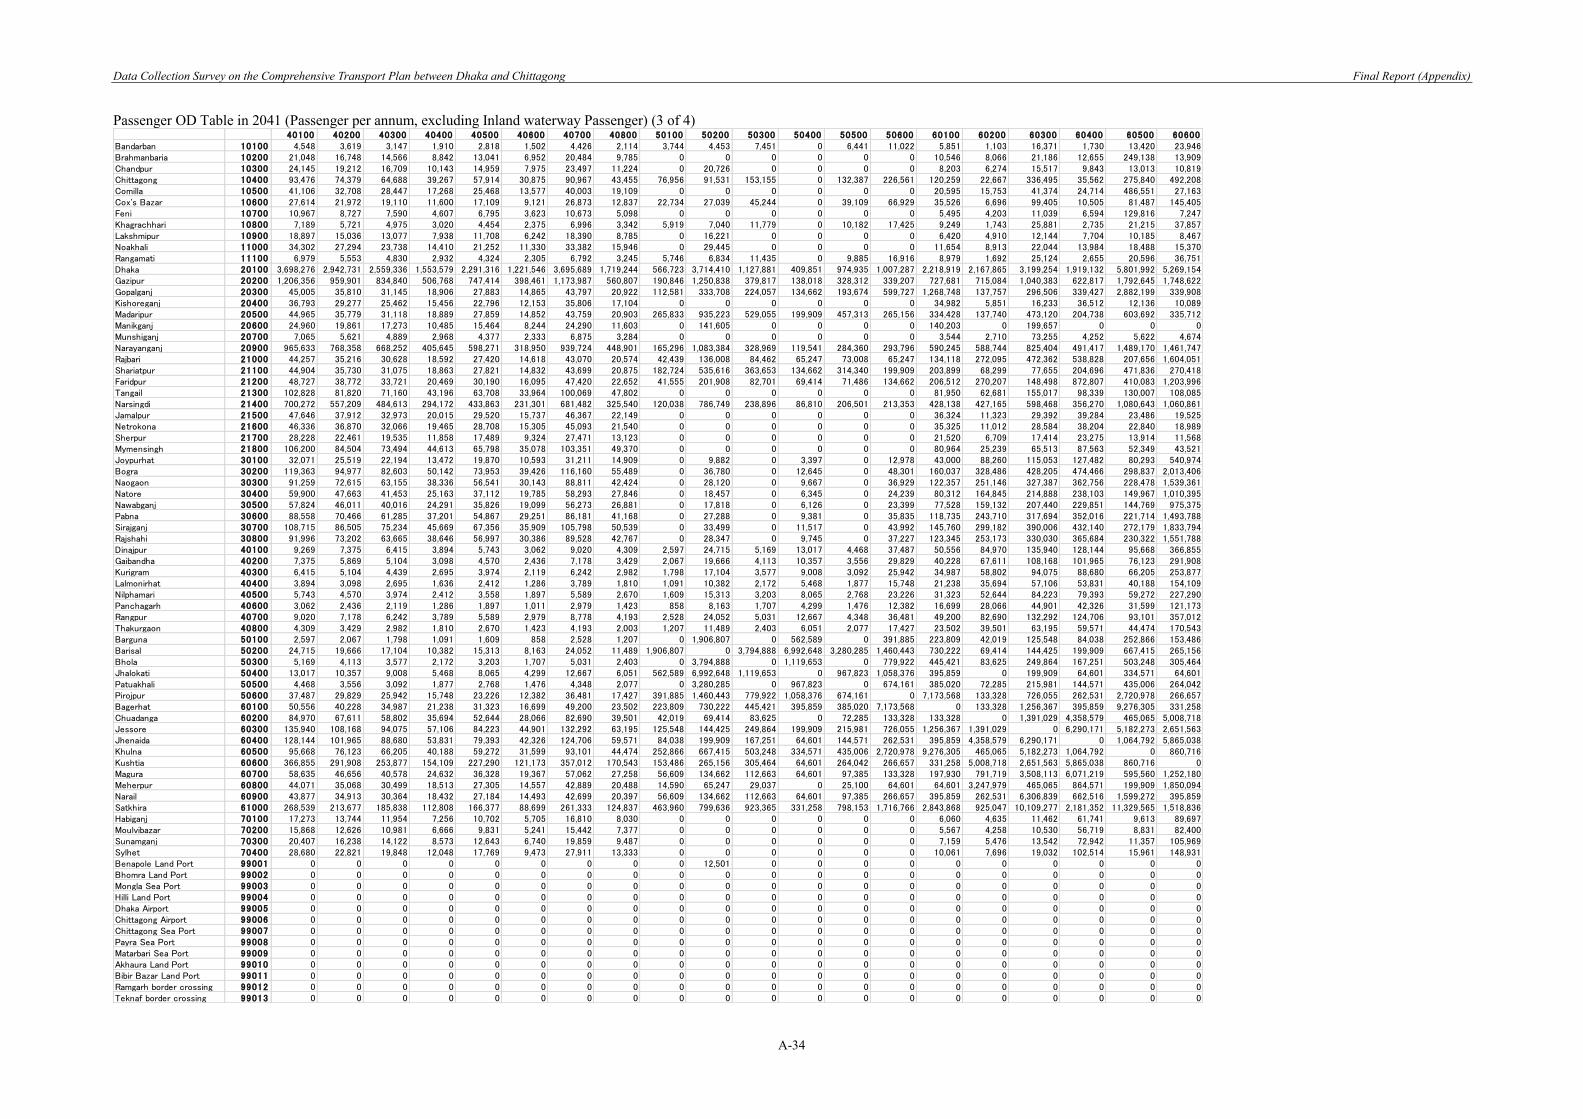
Data Collection Survey on the Comprehensive Transport Plan between Dhaka and Chittagong Final Report (Appendix)
A-34
Passenger OD Table in 2041 (Passenger per annum, excluding Inland waterway Passenger) (3 of 4)
40100 40200 40300 40400 40500 40600 40700 40800 50100 50200 50300 50400 50500 50600 60100 60200 60300 60400 60500 60600Bandarban 10100 4,548 3,619 3,147 1,910 2,818 1,502 4,426 2,114 3,744 4,453 7,451 0 6,441 11,022 5,851 1,103 16,371 1,730 13,420 23,946Brahmanbaria 10200 21,048 16,748 14,566 8,842 13,041 6,952 20,484 9,785 0 0 0 0 0 0 10,546 8,066 21,186 12,655 249,138 13,909Chandpur 10300 24,145 19,212 16,709 10,143 14,959 7,975 23,497 11,224 0 20,726 0 0 0 0 8,203 6,274 15,517 9,843 13,013 10,819Chittagong 10400 93,476 74,379 64,688 39,267 57,914 30,875 90,967 43,455 76,956 91,531 153,155 0 132,387 226,561 120,259 22,667 336,495 35,562 275,840 492,208Comilla 10500 41,106 32,708 28,447 17,268 25,468 13,577 40,003 19,109 0 0 0 0 0 0 20,595 15,753 41,374 24,714 486,551 27,163Cox's Bazar 10600 27,614 21,972 19,110 11,600 17,109 9,121 26,873 12,837 22,734 27,039 45,244 0 39,109 66,929 35,526 6,696 99,405 10,505 81,487 145,405Feni 10700 10,967 8,727 7,590 4,607 6,795 3,623 10,673 5,098 0 0 0 0 0 0 5,495 4,203 11,039 6,594 129,816 7,247Khagrachhari 10800 7,189 5,721 4,975 3,020 4,454 2,375 6,996 3,342 5,919 7,040 11,779 0 10,182 17,425 9,249 1,743 25,881 2,735 21,215 37,857Lakshmipur 10900 18,897 15,036 13,077 7,938 11,708 6,242 18,390 8,785 0 16,221 0 0 0 0 6,420 4,910 12,144 7,704 10,185 8,467Noakhali 11000 34,302 27,294 23,738 14,410 21,252 11,330 33,382 15,946 0 29,445 0 0 0 0 11,654 8,913 22,044 13,984 18,488 15,370Rangamati 11100 6,979 5,553 4,830 2,932 4,324 2,305 6,792 3,245 5,746 6,834 11,435 0 9,885 16,916 8,979 1,692 25,124 2,655 20,596 36,751Dhaka 20100 3,698,276 2,942,731 2,559,336 1,553,579 2,291,316 1,221,546 3,695,689 1,719,244 566,723 3,714,410 1,127,881 409,851 974,935 1,007,287 2,218,919 2,167,865 3,199,254 1,919,132 5,801,992 5,269,154Gazipur 20200 1,206,356 959,901 834,840 506,768 747,414 398,461 1,173,987 560,807 190,846 1,250,838 379,817 138,018 328,312 339,207 727,681 715,084 1,040,383 622,817 1,792,645 1,748,622Gopalganj 20300 45,005 35,810 31,145 18,906 27,883 14,865 43,797 20,922 112,581 333,708 224,057 134,662 193,674 599,727 1,268,748 137,757 296,506 339,427 2,882,199 339,908Kishoreganj 20400 36,793 29,277 25,462 15,456 22,796 12,153 35,806 17,104 0 0 0 0 0 0 34,982 5,851 16,233 36,512 12,136 10,089Madaripur 20500 44,965 35,779 31,118 18,889 27,859 14,852 43,759 20,903 265,833 935,223 529,055 199,909 457,313 265,156 334,428 137,740 473,120 204,738 603,692 335,712Manikganj 20600 24,960 19,861 17,273 10,485 15,464 8,244 24,290 11,603 0 141,605 0 0 0 0 140,203 0 199,657 0 0 0Munshiganj 20700 7,065 5,621 4,889 2,968 4,377 2,333 6,875 3,284 0 0 0 0 0 0 3,544 2,710 73,255 4,252 5,622 4,674Narayanganj 20900 965,633 768,358 668,252 405,645 598,271 318,950 939,724 448,901 165,296 1,083,384 328,969 119,541 284,360 293,796 590,245 588,744 825,404 491,417 1,489,170 1,461,747Rajbari 21000 44,257 35,216 30,628 18,592 27,420 14,618 43,070 20,574 42,439 136,008 84,462 65,247 73,008 65,247 134,118 272,095 472,362 538,828 207,656 1,604,051Shariatpur 21100 44,904 35,730 31,075 18,863 27,821 14,832 43,699 20,875 182,724 535,616 363,653 134,662 314,340 199,909 203,899 68,299 77,655 204,696 471,836 270,418Faridpur 21200 48,727 38,772 33,721 20,469 30,190 16,095 47,420 22,652 41,555 201,908 82,701 69,414 71,486 134,662 206,512 270,207 148,498 872,807 410,083 1,203,996Tangail 21300 102,828 81,820 71,160 43,196 63,708 33,964 100,069 47,802 0 0 0 0 0 0 81,950 62,681 155,017 98,339 130,007 108,085Narsingdi 21400 700,272 557,209 484,613 294,172 433,863 231,301 681,482 325,540 120,038 786,749 238,896 86,810 206,501 213,353 428,138 427,165 598,468 356,270 1,080,643 1,060,861Jamalpur 21500 47,646 37,912 32,973 20,015 29,520 15,737 46,367 22,149 0 0 0 0 0 0 36,324 11,323 29,392 39,284 23,486 19,525Netrokona 21600 46,336 36,870 32,066 19,465 28,708 15,305 45,093 21,540 0 0 0 0 0 0 35,325 11,012 28,584 38,204 22,840 18,989Sherpur 21700 28,228 22,461 19,535 11,858 17,489 9,324 27,471 13,123 0 0 0 0 0 0 21,520 6,709 17,414 23,275 13,914 11,568Mymensingh 21800 106,200 84,504 73,494 44,613 65,798 35,078 103,351 49,370 0 0 0 0 0 0 80,964 25,239 65,513 87,563 52,349 43,521Joypurhat 30100 32,071 25,519 22,194 13,472 19,870 10,593 31,211 14,909 0 9,882 0 3,397 0 12,978 43,000 88,260 115,053 127,482 80,293 540,974Bogra 30200 119,363 94,977 82,603 50,142 73,953 39,426 116,160 55,489 0 36,780 0 12,645 0 48,301 160,037 328,486 428,205 474,466 298,837 2,013,406Naogaon 30300 91,259 72,615 63,155 38,336 56,541 30,143 88,811 42,424 0 28,120 0 9,667 0 36,929 122,357 251,146 327,387 362,756 228,478 1,539,361Natore 30400 59,900 47,663 41,453 25,163 37,112 19,785 58,293 27,846 0 18,457 0 6,345 0 24,239 80,312 164,845 214,888 238,103 149,967 1,010,395Nawabganj 30500 57,824 46,011 40,016 24,291 35,826 19,099 56,273 26,881 0 17,818 0 6,126 0 23,399 77,528 159,132 207,440 229,851 144,769 975,375Pabna 30600 88,558 70,466 61,285 37,201 54,867 29,251 86,181 41,168 0 27,288 0 9,381 0 35,835 118,735 243,710 317,694 352,016 221,714 1,493,788Sirajganj 30700 108,715 86,505 75,234 45,669 67,356 35,909 105,798 50,539 0 33,499 0 11,517 0 43,992 145,760 299,182 390,006 432,140 272,179 1,833,794Rajshahi 30800 91,996 73,202 63,665 38,646 56,997 30,386 89,528 42,767 0 28,347 0 9,745 0 37,227 123,345 253,173 330,030 365,684 230,322 1,551,788Dinajpur 40100 9,269 7,375 6,415 3,894 5,743 3,062 9,020 4,309 2,597 24,715 5,169 13,017 4,468 37,487 50,556 84,970 135,940 128,144 95,668 366,855Gaibandha 40200 7,375 5,869 5,104 3,098 4,570 2,436 7,178 3,429 2,067 19,666 4,113 10,357 3,556 29,829 40,228 67,611 108,168 101,965 76,123 291,908Kurigram 40300 6,415 5,104 4,439 2,695 3,974 2,119 6,242 2,982 1,798 17,104 3,577 9,008 3,092 25,942 34,987 58,802 94,075 88,680 66,205 253,877Lalmonirhat 40400 3,894 3,098 2,695 1,636 2,412 1,286 3,789 1,810 1,091 10,382 2,172 5,468 1,877 15,748 21,238 35,694 57,106 53,831 40,188 154,109Nilphamari 40500 5,743 4,570 3,974 2,412 3,558 1,897 5,589 2,670 1,609 15,313 3,203 8,065 2,768 23,226 31,323 52,644 84,223 79,393 59,272 227,290Panchagarh 40600 3,062 2,436 2,119 1,286 1,897 1,011 2,979 1,423 858 8,163 1,707 4,299 1,476 12,382 16,699 28,066 44,901 42,326 31,599 121,173Rangpur 40700 9,020 7,178 6,242 3,789 5,589 2,979 8,778 4,193 2,528 24,052 5,031 12,667 4,348 36,481 49,200 82,690 132,292 124,706 93,101 357,012Thakurgaon 40800 4,309 3,429 2,982 1,810 2,670 1,423 4,193 2,003 1,207 11,489 2,403 6,051 2,077 17,427 23,502 39,501 63,195 59,571 44,474 170,543Barguna 50100 2,597 2,067 1,798 1,091 1,609 858 2,528 1,207 0 1,906,807 0 562,589 0 391,885 223,809 42,019 125,548 84,038 252,866 153,486Barisal 50200 24,715 19,666 17,104 10,382 15,313 8,163 24,052 11,489 1,906,807 0 3,794,888 6,992,648 3,280,285 1,460,443 730,222 69,414 144,425 199,909 667,415 265,156Bhola 50300 5,169 4,113 3,577 2,172 3,203 1,707 5,031 2,403 0 3,794,888 0 1,119,653 0 779,922 445,421 83,625 249,864 167,251 503,248 305,464Jhalokati 50400 13,017 10,357 9,008 5,468 8,065 4,299 12,667 6,051 562,589 6,992,648 1,119,653 0 967,823 1,058,376 395,859 0 199,909 64,601 334,571 64,601Patuakhali 50500 4,468 3,556 3,092 1,877 2,768 1,476 4,348 2,077 0 3,280,285 0 967,823 0 674,161 385,020 72,285 215,981 144,571 435,006 264,042Pirojpur 50600 37,487 29,829 25,942 15,748 23,226 12,382 36,481 17,427 391,885 1,460,443 779,922 1,058,376 674,161 0 7,173,568 133,328 726,055 262,531 2,720,978 266,657Bagerhat 60100 50,556 40,228 34,987 21,238 31,323 16,699 49,200 23,502 223,809 730,222 445,421 395,859 385,020 7,173,568 0 133,328 1,256,367 395,859 9,276,305 331,258Chuadanga 60200 84,970 67,611 58,802 35,694 52,644 28,066 82,690 39,501 42,019 69,414 83,625 0 72,285 133,328 133,328 0 1,391,029 4,358,579 465,065 5,008,718Jessore 60300 135,940 108,168 94,075 57,106 84,223 44,901 132,292 63,195 125,548 144,425 249,864 199,909 215,981 726,055 1,256,367 1,391,029 0 6,290,171 5,182,273 2,651,563Jhenaida 60400 128,144 101,965 88,680 53,831 79,393 42,326 124,706 59,571 84,038 199,909 167,251 64,601 144,571 262,531 395,859 4,358,579 6,290,171 0 1,064,792 5,865,038Khulna 60500 95,668 76,123 66,205 40,188 59,272 31,599 93,101 44,474 252,866 667,415 503,248 334,571 435,006 2,720,978 9,276,305 465,065 5,182,273 1,064,792 0 860,716Kushtia 60600 366,855 291,908 253,877 154,109 227,290 121,173 357,012 170,543 153,486 265,156 305,464 64,601 264,042 266,657 331,258 5,008,718 2,651,563 5,865,038 860,716 0Magura 60700 58,635 46,656 40,578 24,632 36,328 19,367 57,062 27,258 56,609 134,662 112,663 64,601 97,385 133,328 197,930 791,719 3,508,113 6,071,219 595,560 1,252,180Meherpur 60800 44,071 35,068 30,499 18,513 27,305 14,557 42,889 20,488 14,590 65,247 29,037 0 25,100 64,601 64,601 3,247,979 465,065 864,571 199,909 1,850,094Narail 60900 43,877 34,913 30,364 18,432 27,184 14,493 42,699 20,397 56,609 134,662 112,663 64,601 97,385 266,657 395,859 262,531 6,306,839 662,516 1,599,272 395,859Satkhira 61000 268,539 213,677 185,838 112,808 166,377 88,699 261,333 124,837 463,960 799,636 923,365 331,258 798,153 1,716,766 2,843,868 925,047 10,109,277 2,181,352 11,329,565 1,518,836Habiganj 70100 17,273 13,744 11,954 7,256 10,702 5,705 16,810 8,030 0 0 0 0 0 0 6,060 4,635 11,462 61,741 9,613 89,697Moulvibazar 70200 15,868 12,626 10,981 6,666 9,831 5,241 15,442 7,377 0 0 0 0 0 0 5,567 4,258 10,530 56,719 8,831 82,400Sunamganj 70300 20,407 16,238 14,122 8,573 12,643 6,740 19,859 9,487 0 0 0 0 0 0 7,159 5,476 13,542 72,942 11,357 105,969Sylhet 70400 28,680 22,821 19,848 12,048 17,769 9,473 27,911 13,333 0 0 0 0 0 0 10,061 7,696 19,032 102,514 15,961 148,931Benapole Land Port 99001 0 0 0 0 0 0 0 0 0 12,501 0 0 0 0 0 0 0 0 0 0Bhomra Land Port 99002 0 0 0 0 0 0 0 0 0 0 0 0 0 0 0 0 0 0 0 0Mongla Sea Port 99003 0 0 0 0 0 0 0 0 0 0 0 0 0 0 0 0 0 0 0 0Hilli Land Port 99004 0 0 0 0 0 0 0 0 0 0 0 0 0 0 0 0 0 0 0 0Dhaka Airport 99005 0 0 0 0 0 0 0 0 0 0 0 0 0 0 0 0 0 0 0 0Chittagong Airport 99006 0 0 0 0 0 0 0 0 0 0 0 0 0 0 0 0 0 0 0 0Chittagong Sea Port 99007 0 0 0 0 0 0 0 0 0 0 0 0 0 0 0 0 0 0 0 0Payra Sea Port 99008 0 0 0 0 0 0 0 0 0 0 0 0 0 0 0 0 0 0 0 0Matarbari Sea Port 99009 0 0 0 0 0 0 0 0 0 0 0 0 0 0 0 0 0 0 0 0Akhaura Land Port 99010 0 0 0 0 0 0 0 0 0 0 0 0 0 0 0 0 0 0 0 0Bibir Bazar Land Port 99011 0 0 0 0 0 0 0 0 0 0 0 0 0 0 0 0 0 0 0 0Ramgarh border crossing 99012 0 0 0 0 0 0 0 0 0 0 0 0 0 0 0 0 0 0 0 0Teknaf border crossing 99013 0 0 0 0 0 0 0 0 0 0 0 0 0 0 0 0 0 0 0 0
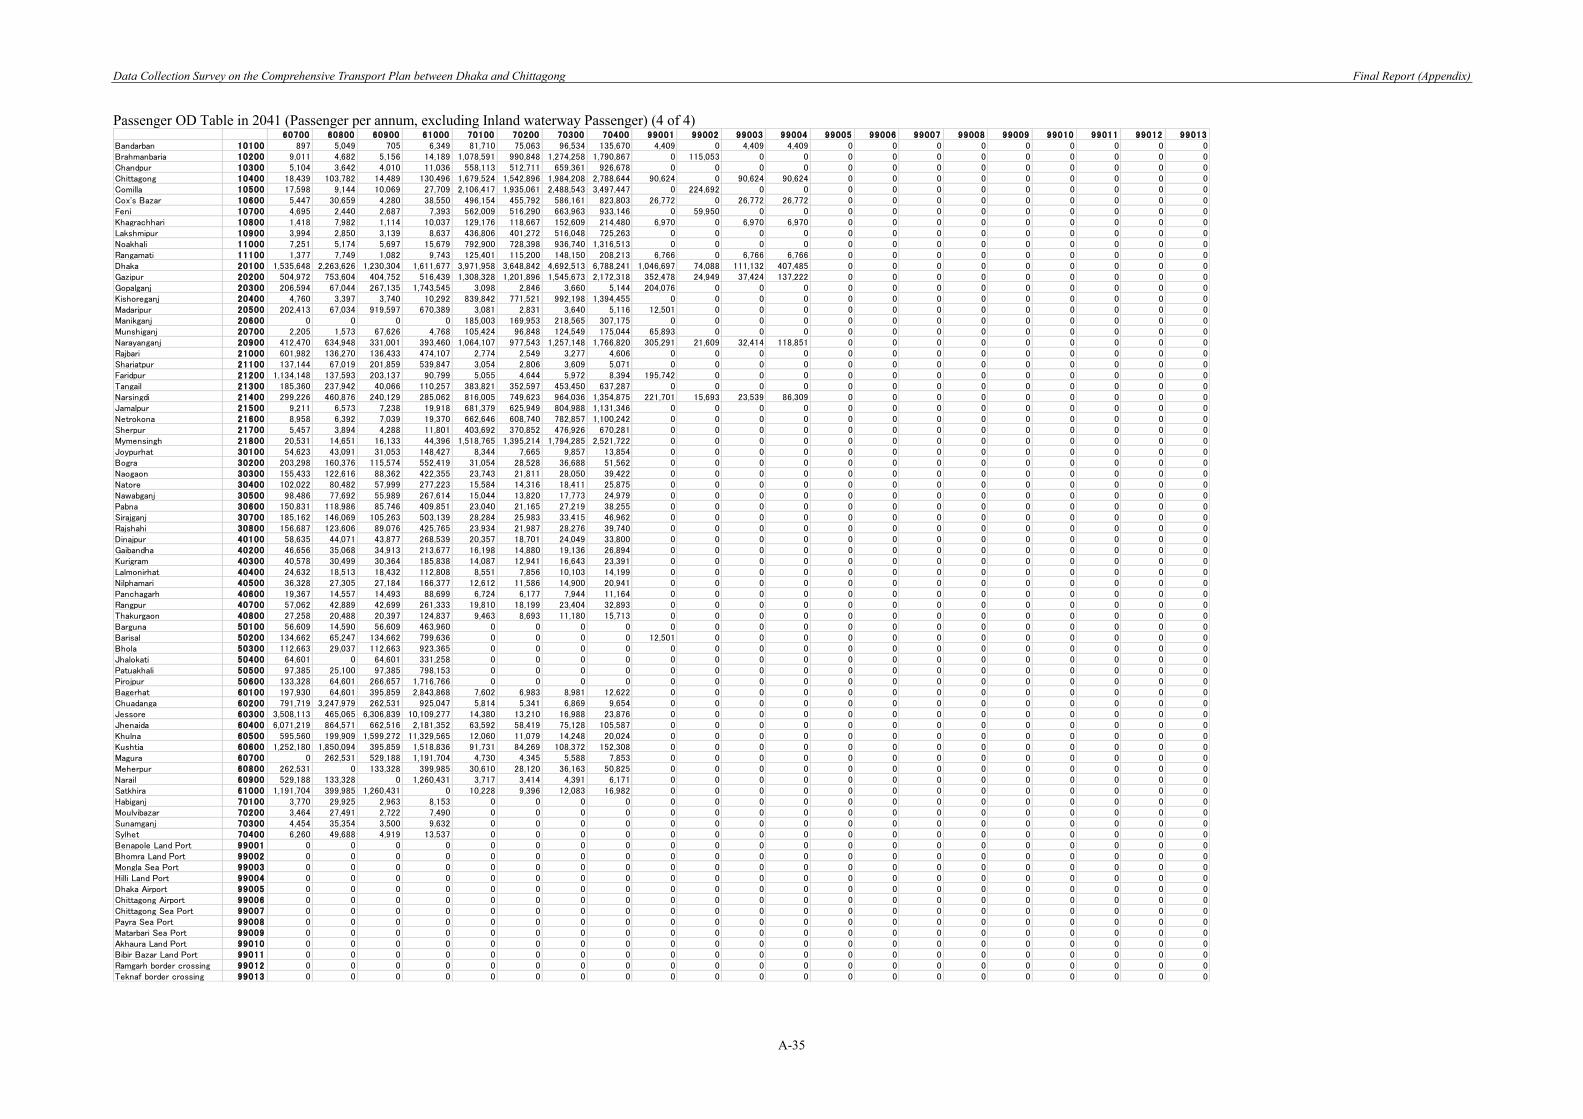
Data Collection Survey on the Comprehensive Transport Plan between Dhaka and Chittagong Final Report (Appendix)
A-35
Passenger OD Table in 2041 (Passenger per annum, excluding Inland waterway Passenger) (4 of 4)
60700 60800 60900 61000 70100 70200 70300 70400 99001 99002 99003 99004 99005 99006 99007 99008 99009 99010 99011 99012 99013Bandarban 10100 897 5,049 705 6,349 81,710 75,063 96,534 135,670 4,409 0 4,409 4,409 0 0 0 0 0 0 0 0 0Brahmanbaria 10200 9,011 4,682 5,156 14,189 1,078,591 990,848 1,274,258 1,790,867 0 115,053 0 0 0 0 0 0 0 0 0 0 0Chandpur 10300 5,104 3,642 4,010 11,036 558,113 512,711 659,361 926,678 0 0 0 0 0 0 0 0 0 0 0 0 0Chittagong 10400 18,439 103,782 14,489 130,496 1,679,524 1,542,896 1,984,208 2,788,644 90,624 0 90,624 90,624 0 0 0 0 0 0 0 0 0Comilla 10500 17,598 9,144 10,069 27,709 2,106,417 1,935,061 2,488,543 3,497,447 0 224,692 0 0 0 0 0 0 0 0 0 0 0Cox's Bazar 10600 5,447 30,659 4,280 38,550 496,154 455,792 586,161 823,803 26,772 0 26,772 26,772 0 0 0 0 0 0 0 0 0Feni 10700 4,695 2,440 2,687 7,393 562,009 516,290 663,963 933,146 0 59,950 0 0 0 0 0 0 0 0 0 0 0Khagrachhari 10800 1,418 7,982 1,114 10,037 129,176 118,667 152,609 214,480 6,970 0 6,970 6,970 0 0 0 0 0 0 0 0 0Lakshmipur 10900 3,994 2,850 3,139 8,637 436,806 401,272 516,048 725,263 0 0 0 0 0 0 0 0 0 0 0 0 0Noakhali 11000 7,251 5,174 5,697 15,679 792,900 728,398 936,740 1,316,513 0 0 0 0 0 0 0 0 0 0 0 0 0Rangamati 11100 1,377 7,749 1,082 9,743 125,401 115,200 148,150 208,213 6,766 0 6,766 6,766 0 0 0 0 0 0 0 0 0Dhaka 20100 1,535,648 2,263,626 1,230,304 1,611,677 3,971,958 3,648,842 4,692,513 6,788,241 1,046,697 74,088 111,132 407,485 0 0 0 0 0 0 0 0 0Gazipur 20200 504,972 753,604 404,752 516,439 1,308,328 1,201,896 1,545,673 2,172,318 352,478 24,949 37,424 137,222 0 0 0 0 0 0 0 0 0Gopalganj 20300 206,594 67,044 267,135 1,743,545 3,098 2,846 3,660 5,144 204,076 0 0 0 0 0 0 0 0 0 0 0 0Kishoreganj 20400 4,760 3,397 3,740 10,292 839,842 771,521 992,198 1,394,455 0 0 0 0 0 0 0 0 0 0 0 0 0Madaripur 20500 202,413 67,034 919,597 670,389 3,081 2,831 3,640 5,116 12,501 0 0 0 0 0 0 0 0 0 0 0 0Manikganj 20600 0 0 0 0 185,003 169,953 218,565 307,175 0 0 0 0 0 0 0 0 0 0 0 0 0Munshiganj 20700 2,205 1,573 67,626 4,768 105,424 96,848 124,549 175,044 65,893 0 0 0 0 0 0 0 0 0 0 0 0Narayanganj 20900 412,470 634,948 331,001 393,460 1,064,107 977,543 1,257,148 1,766,820 305,291 21,609 32,414 118,851 0 0 0 0 0 0 0 0 0Rajbari 21000 601,982 136,270 136,433 474,107 2,774 2,549 3,277 4,606 0 0 0 0 0 0 0 0 0 0 0 0 0Shariatpur 21100 137,144 67,019 201,859 539,847 3,054 2,806 3,609 5,071 0 0 0 0 0 0 0 0 0 0 0 0 0Faridpur 21200 1,134,148 137,593 203,137 90,799 5,055 4,644 5,972 8,394 195,742 0 0 0 0 0 0 0 0 0 0 0 0Tangail 21300 185,360 237,942 40,066 110,257 383,821 352,597 453,450 637,287 0 0 0 0 0 0 0 0 0 0 0 0 0Narsingdi 21400 299,226 460,876 240,129 285,062 816,005 749,623 964,036 1,354,875 221,701 15,693 23,539 86,309 0 0 0 0 0 0 0 0 0Jamalpur 21500 9,211 6,573 7,238 19,918 681,379 625,949 804,988 1,131,346 0 0 0 0 0 0 0 0 0 0 0 0 0Netrokona 21600 8,958 6,392 7,039 19,370 662,646 608,740 782,857 1,100,242 0 0 0 0 0 0 0 0 0 0 0 0 0Sherpur 21700 5,457 3,894 4,288 11,801 403,692 370,852 476,926 670,281 0 0 0 0 0 0 0 0 0 0 0 0 0Mymensingh 21800 20,531 14,651 16,133 44,396 1,518,765 1,395,214 1,794,285 2,521,722 0 0 0 0 0 0 0 0 0 0 0 0 0Joypurhat 30100 54,623 43,091 31,053 148,427 8,344 7,665 9,857 13,854 0 0 0 0 0 0 0 0 0 0 0 0 0Bogra 30200 203,298 160,376 115,574 552,419 31,054 28,528 36,688 51,562 0 0 0 0 0 0 0 0 0 0 0 0 0Naogaon 30300 155,433 122,616 88,362 422,355 23,743 21,811 28,050 39,422 0 0 0 0 0 0 0 0 0 0 0 0 0Natore 30400 102,022 80,482 57,999 277,223 15,584 14,316 18,411 25,875 0 0 0 0 0 0 0 0 0 0 0 0 0Nawabganj 30500 98,486 77,692 55,989 267,614 15,044 13,820 17,773 24,979 0 0 0 0 0 0 0 0 0 0 0 0 0Pabna 30600 150,831 118,986 85,746 409,851 23,040 21,165 27,219 38,255 0 0 0 0 0 0 0 0 0 0 0 0 0Sirajganj 30700 185,162 146,069 105,263 503,139 28,284 25,983 33,415 46,962 0 0 0 0 0 0 0 0 0 0 0 0 0Rajshahi 30800 156,687 123,606 89,076 425,765 23,934 21,987 28,276 39,740 0 0 0 0 0 0 0 0 0 0 0 0 0Dinajpur 40100 58,635 44,071 43,877 268,539 20,357 18,701 24,049 33,800 0 0 0 0 0 0 0 0 0 0 0 0 0Gaibandha 40200 46,656 35,068 34,913 213,677 16,198 14,880 19,136 26,894 0 0 0 0 0 0 0 0 0 0 0 0 0Kurigram 40300 40,578 30,499 30,364 185,838 14,087 12,941 16,643 23,391 0 0 0 0 0 0 0 0 0 0 0 0 0Lalmonirhat 40400 24,632 18,513 18,432 112,808 8,551 7,856 10,103 14,199 0 0 0 0 0 0 0 0 0 0 0 0 0Nilphamari 40500 36,328 27,305 27,184 166,377 12,612 11,586 14,900 20,941 0 0 0 0 0 0 0 0 0 0 0 0 0Panchagarh 40600 19,367 14,557 14,493 88,699 6,724 6,177 7,944 11,164 0 0 0 0 0 0 0 0 0 0 0 0 0Rangpur 40700 57,062 42,889 42,699 261,333 19,810 18,199 23,404 32,893 0 0 0 0 0 0 0 0 0 0 0 0 0Thakurgaon 40800 27,258 20,488 20,397 124,837 9,463 8,693 11,180 15,713 0 0 0 0 0 0 0 0 0 0 0 0 0Barguna 50100 56,609 14,590 56,609 463,960 0 0 0 0 0 0 0 0 0 0 0 0 0 0 0 0 0Barisal 50200 134,662 65,247 134,662 799,636 0 0 0 0 12,501 0 0 0 0 0 0 0 0 0 0 0 0Bhola 50300 112,663 29,037 112,663 923,365 0 0 0 0 0 0 0 0 0 0 0 0 0 0 0 0 0Jhalokati 50400 64,601 0 64,601 331,258 0 0 0 0 0 0 0 0 0 0 0 0 0 0 0 0 0Patuakhali 50500 97,385 25,100 97,385 798,153 0 0 0 0 0 0 0 0 0 0 0 0 0 0 0 0 0Pirojpur 50600 133,328 64,601 266,657 1,716,766 0 0 0 0 0 0 0 0 0 0 0 0 0 0 0 0 0Bagerhat 60100 197,930 64,601 395,859 2,843,868 7,602 6,983 8,981 12,622 0 0 0 0 0 0 0 0 0 0 0 0 0Chuadanga 60200 791,719 3,247,979 262,531 925,047 5,814 5,341 6,869 9,654 0 0 0 0 0 0 0 0 0 0 0 0 0Jessore 60300 3,508,113 465,065 6,306,839 10,109,277 14,380 13,210 16,988 23,876 0 0 0 0 0 0 0 0 0 0 0 0 0Jhenaida 60400 6,071,219 864,571 662,516 2,181,352 63,592 58,419 75,128 105,587 0 0 0 0 0 0 0 0 0 0 0 0 0Khulna 60500 595,560 199,909 1,599,272 11,329,565 12,060 11,079 14,248 20,024 0 0 0 0 0 0 0 0 0 0 0 0 0Kushtia 60600 1,252,180 1,850,094 395,859 1,518,836 91,731 84,269 108,372 152,308 0 0 0 0 0 0 0 0 0 0 0 0 0Magura 60700 0 262,531 529,188 1,191,704 4,730 4,345 5,588 7,853 0 0 0 0 0 0 0 0 0 0 0 0 0Meherpur 60800 262,531 0 133,328 399,985 30,610 28,120 36,163 50,825 0 0 0 0 0 0 0 0 0 0 0 0 0Narail 60900 529,188 133,328 0 1,260,431 3,717 3,414 4,391 6,171 0 0 0 0 0 0 0 0 0 0 0 0 0Satkhira 61000 1,191,704 399,985 1,260,431 0 10,228 9,396 12,083 16,982 0 0 0 0 0 0 0 0 0 0 0 0 0Habiganj 70100 3,770 29,925 2,963 8,153 0 0 0 0 0 0 0 0 0 0 0 0 0 0 0 0 0Moulvibazar 70200 3,464 27,491 2,722 7,490 0 0 0 0 0 0 0 0 0 0 0 0 0 0 0 0 0Sunamganj 70300 4,454 35,354 3,500 9,632 0 0 0 0 0 0 0 0 0 0 0 0 0 0 0 0 0Sylhet 70400 6,260 49,688 4,919 13,537 0 0 0 0 0 0 0 0 0 0 0 0 0 0 0 0 0Benapole Land Port 99001 0 0 0 0 0 0 0 0 0 0 0 0 0 0 0 0 0 0 0 0 0Bhomra Land Port 99002 0 0 0 0 0 0 0 0 0 0 0 0 0 0 0 0 0 0 0 0 0Mongla Sea Port 99003 0 0 0 0 0 0 0 0 0 0 0 0 0 0 0 0 0 0 0 0 0Hilli Land Port 99004 0 0 0 0 0 0 0 0 0 0 0 0 0 0 0 0 0 0 0 0 0Dhaka Airport 99005 0 0 0 0 0 0 0 0 0 0 0 0 0 0 0 0 0 0 0 0 0Chittagong Airport 99006 0 0 0 0 0 0 0 0 0 0 0 0 0 0 0 0 0 0 0 0 0Chittagong Sea Port 99007 0 0 0 0 0 0 0 0 0 0 0 0 0 0 0 0 0 0 0 0 0Payra Sea Port 99008 0 0 0 0 0 0 0 0 0 0 0 0 0 0 0 0 0 0 0 0 0Matarbari Sea Port 99009 0 0 0 0 0 0 0 0 0 0 0 0 0 0 0 0 0 0 0 0 0Akhaura Land Port 99010 0 0 0 0 0 0 0 0 0 0 0 0 0 0 0 0 0 0 0 0 0Bibir Bazar Land Port 99011 0 0 0 0 0 0 0 0 0 0 0 0 0 0 0 0 0 0 0 0 0Ramgarh border crossing 99012 0 0 0 0 0 0 0 0 0 0 0 0 0 0 0 0 0 0 0 0 0Teknaf border crossing 99013 0 0 0 0 0 0 0 0 0 0 0 0 0 0 0 0 0 0 0 0 0
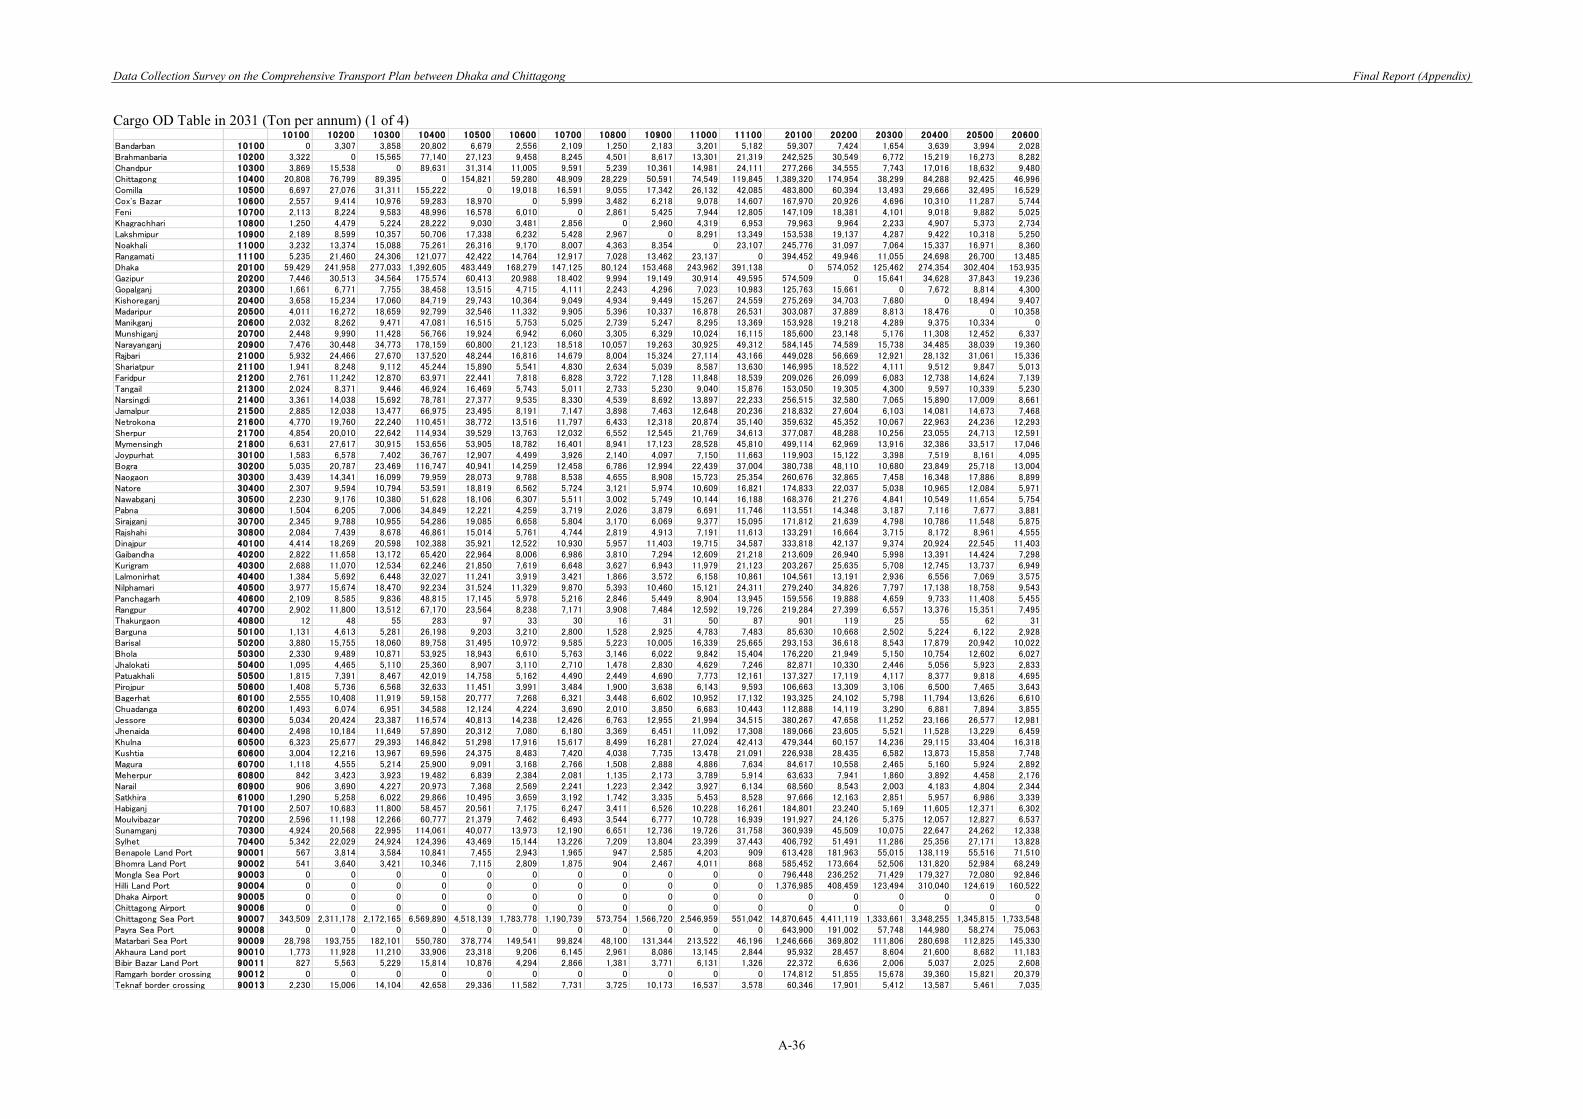
Data Collection Survey on the Comprehensive Transport Plan between Dhaka and Chittagong Final Report (Appendix)
A-36
Cargo OD Table in 2031 (Ton per annum) (1 of 4)
10100 10200 10300 10400 10500 10600 10700 10800 10900 11000 11100 20100 20200 20300 20400 20500 20600Bandarban 10100 0 3,307 3,858 20,802 6,679 2,556 2,109 1,250 2,183 3,201 5,182 59,307 7,424 1,654 3,639 3,994 2,028Brahmanbaria 10200 3,322 0 15,565 77,140 27,123 9,458 8,245 4,501 8,617 13,301 21,319 242,525 30,549 6,772 15,219 16,273 8,282Chandpur 10300 3,869 15,538 0 89,631 31,314 11,005 9,591 5,239 10,361 14,981 24,111 277,266 34,555 7,743 17,016 18,632 9,480Chittagong 10400 20,808 76,799 89,395 0 154,821 59,280 48,909 28,229 50,591 74,549 119,845 1,389,320 174,954 38,299 84,288 92,425 46,996Comilla 10500 6,697 27,076 31,311 155,222 0 19,018 16,591 9,055 17,342 26,132 42,085 483,800 60,394 13,493 29,666 32,495 16,529Cox's Bazar 10600 2,557 9,414 10,976 59,283 18,970 0 5,999 3,482 6,218 9,078 14,607 167,970 20,926 4,696 10,310 11,287 5,744Feni 10700 2,113 8,224 9,583 48,996 16,578 6,010 0 2,861 5,425 7,944 12,805 147,109 18,381 4,101 9,018 9,882 5,025Khagrachhari 10800 1,250 4,479 5,224 28,222 9,030 3,481 2,856 0 2,960 4,319 6,953 79,963 9,964 2,233 4,907 5,373 2,734Lakshmipur 10900 2,189 8,599 10,357 50,706 17,338 6,232 5,428 2,967 0 8,291 13,349 153,538 19,137 4,287 9,422 10,318 5,250Noakhali 11000 3,232 13,374 15,088 75,261 26,316 9,170 8,007 4,363 8,354 0 23,107 245,776 31,097 7,064 15,337 16,971 8,360Rangamati 11100 5,235 21,460 24,306 121,077 42,422 14,764 12,917 7,028 13,462 23,137 0 394,452 49,946 11,055 24,698 26,700 13,485Dhaka 20100 59,429 241,958 277,033 1,392,605 483,449 168,279 147,125 80,124 153,468 243,962 391,138 0 574,052 125,462 274,354 302,404 153,935Gazipur 20200 7,446 30,513 34,564 175,574 60,413 20,988 18,402 9,994 19,149 30,914 49,595 574,509 0 15,641 34,628 37,843 19,236Gopalganj 20300 1,661 6,771 7,755 38,458 13,515 4,715 4,111 2,243 4,296 7,023 10,983 125,763 15,661 0 7,672 8,814 4,300Kishoreganj 20400 3,658 15,234 17,060 84,719 29,743 10,364 9,049 4,934 9,449 15,267 24,559 275,269 34,703 7,680 0 18,494 9,407Madaripur 20500 4,011 16,272 18,659 92,799 32,546 11,332 9,905 5,396 10,337 16,878 26,531 303,087 37,889 8,813 18,476 0 10,358Manikganj 20600 2,032 8,262 9,471 47,081 16,515 5,753 5,025 2,739 5,247 8,295 13,369 153,928 19,218 4,289 9,375 10,334 0Munshiganj 20700 2,448 9,990 11,428 56,766 19,924 6,942 6,060 3,305 6,329 10,024 16,115 185,600 23,148 5,176 11,308 12,452 6,337Narayanganj 20900 7,476 30,448 34,773 178,159 60,800 21,123 18,518 10,057 19,263 30,925 49,312 584,145 74,589 15,738 34,485 38,039 19,360Rajbari 21000 5,932 24,466 27,670 137,520 48,244 16,816 14,679 8,004 15,324 27,114 43,166 449,028 56,669 12,921 28,132 31,061 15,336Shariatpur 21100 1,941 8,248 9,112 45,244 15,890 5,541 4,830 2,634 5,039 8,587 13,630 146,995 18,522 4,111 9,512 9,847 5,013Faridpur 21200 2,761 11,242 12,870 63,971 22,441 7,818 6,828 3,722 7,128 11,848 18,539 209,026 26,099 6,083 12,738 14,624 7,139Tangail 21300 2,024 8,371 9,446 46,924 16,469 5,743 5,011 2,733 5,230 9,040 15,876 153,050 19,305 4,300 9,597 10,339 5,230Narsingdi 21400 3,361 14,038 15,692 78,781 27,377 9,535 8,330 4,539 8,692 13,897 22,233 256,515 32,580 7,065 15,890 17,009 8,661Jamalpur 21500 2,885 12,038 13,477 66,975 23,495 8,191 7,147 3,898 7,463 12,648 20,236 218,832 27,604 6,103 14,081 14,673 7,468Netrokona 21600 4,770 19,760 22,240 110,451 38,772 13,516 11,797 6,433 12,318 20,874 35,140 359,632 45,352 10,067 22,963 24,236 12,293Sherpur 21700 4,854 20,010 22,642 114,934 39,529 13,763 12,032 6,552 12,545 21,769 34,613 377,087 48,288 10,256 23,055 24,713 12,591Mymensingh 21800 6,631 27,617 30,915 153,656 53,905 18,782 16,401 8,941 17,123 28,528 45,810 499,114 62,969 13,916 32,386 33,517 17,046Joypurhat 30100 1,583 6,578 7,402 36,767 12,907 4,499 3,926 2,140 4,097 7,150 11,663 119,903 15,122 3,398 7,519 8,161 4,095Bogra 30200 5,035 20,787 23,469 116,747 40,941 14,259 12,458 6,786 12,994 22,439 37,004 380,738 48,110 10,680 23,849 25,718 13,004Naogaon 30300 3,439 14,341 16,099 79,959 28,073 9,788 8,538 4,655 8,908 15,723 25,354 260,676 32,865 7,458 16,348 17,886 8,899Natore 30400 2,307 9,594 10,794 53,591 18,819 6,562 5,724 3,121 5,974 10,609 16,821 174,833 22,037 5,038 10,965 12,084 5,971Nawabganj 30500 2,230 9,176 10,380 51,628 18,106 6,307 5,511 3,002 5,749 10,144 16,188 168,376 21,276 4,841 10,549 11,654 5,754Pabna 30600 1,504 6,205 7,006 34,849 12,221 4,259 3,719 2,026 3,879 6,691 11,746 113,551 14,348 3,187 7,116 7,677 3,881Sirajganj 30700 2,345 9,788 10,955 54,286 19,085 6,658 5,804 3,170 6,069 9,377 15,095 171,812 21,639 4,798 10,786 11,548 5,875Rajshahi 30800 2,084 7,439 8,678 46,861 15,014 5,761 4,744 2,819 4,913 7,191 11,613 133,291 16,664 3,715 8,172 8,961 4,555Dinajpur 40100 4,414 18,269 20,598 102,388 35,921 12,522 10,930 5,957 11,403 19,715 34,587 333,818 42,137 9,374 20,924 22,545 11,403Gaibandha 40200 2,822 11,658 13,172 65,420 22,964 8,006 6,986 3,810 7,294 12,609 21,218 213,609 26,940 5,998 13,391 14,424 7,298Kurigram 40300 2,688 11,070 12,534 62,246 21,850 7,619 6,648 3,627 6,943 11,979 21,123 203,267 25,635 5,708 12,745 13,737 6,949Lalmonirhat 40400 1,384 5,692 6,448 32,027 11,241 3,919 3,421 1,866 3,572 6,158 10,861 104,561 13,191 2,936 6,556 7,069 3,575Nilphamari 40500 3,977 15,674 18,470 92,234 31,524 11,329 9,870 5,393 10,460 15,121 24,311 279,240 34,826 7,797 17,138 18,758 9,543Panchagarh 40600 2,109 8,585 9,836 48,815 17,145 5,978 5,216 2,846 5,449 8,904 13,945 159,556 19,888 4,659 9,733 11,408 5,455Rangpur 40700 2,902 11,800 13,512 67,170 23,564 8,238 7,171 3,908 7,484 12,592 19,726 219,284 27,399 6,557 13,376 15,351 7,495Thakurgaon 40800 12 48 55 283 97 33 30 16 31 50 87 901 119 25 55 62 31Barguna 50100 1,131 4,613 5,281 26,198 9,203 3,210 2,800 1,528 2,925 4,783 7,483 85,630 10,668 2,502 5,224 6,122 2,928Barisal 50200 3,880 15,755 18,060 89,758 31,495 10,972 9,585 5,223 10,005 16,339 25,665 293,153 36,618 8,543 17,879 20,942 10,022Bhola 50300 2,330 9,489 10,871 53,925 18,943 6,610 5,763 3,146 6,022 9,842 15,404 176,220 21,949 5,150 10,754 12,602 6,027Jhalokati 50400 1,095 4,465 5,110 25,360 8,907 3,110 2,710 1,478 2,830 4,629 7,246 82,871 10,330 2,446 5,056 5,923 2,833Patuakhali 50500 1,815 7,391 8,467 42,019 14,758 5,162 4,490 2,449 4,690 7,773 12,161 137,327 17,119 4,117 8,377 9,818 4,695Pirojpur 50600 1,408 5,736 6,568 32,633 11,451 3,991 3,484 1,900 3,638 6,143 9,593 106,663 13,309 3,106 6,500 7,465 3,643Bagerhat 60100 2,555 10,408 11,919 59,158 20,777 7,268 6,321 3,448 6,602 10,952 17,132 193,325 24,102 5,798 11,794 13,626 6,610Chuadanga 60200 1,493 6,074 6,951 34,588 12,124 4,224 3,690 2,010 3,850 6,683 10,443 112,888 14,119 3,290 6,881 7,894 3,855Jessore 60300 5,034 20,424 23,387 116,574 40,813 14,238 12,426 6,763 12,955 21,994 34,515 380,267 47,658 11,252 23,166 26,577 12,981Jhenaida 60400 2,498 10,184 11,649 57,890 20,312 7,080 6,180 3,369 6,451 11,092 17,308 189,066 23,605 5,521 11,528 13,229 6,459Khulna 60500 6,323 25,677 29,393 146,842 51,298 17,916 15,617 8,499 16,281 27,024 42,413 479,344 60,157 14,236 29,115 33,404 16,318Kushtia 60600 3,004 12,216 13,967 69,596 24,375 8,483 7,420 4,038 7,735 13,478 21,091 226,938 28,435 6,582 13,873 15,858 7,748Magura 60700 1,118 4,555 5,214 25,900 9,091 3,168 2,766 1,508 2,888 4,886 7,634 84,617 10,558 2,465 5,160 5,924 2,892Meherpur 60800 842 3,423 3,923 19,482 6,839 2,384 2,081 1,135 2,173 3,789 5,914 63,633 7,941 1,860 3,892 4,458 2,176Narail 60900 906 3,690 4,227 20,973 7,368 2,569 2,241 1,223 2,342 3,927 6,134 68,560 8,543 2,003 4,183 4,804 2,344Satkhira 61000 1,290 5,258 6,022 29,866 10,495 3,659 3,192 1,742 3,335 5,453 8,528 97,666 12,163 2,851 5,957 6,986 3,339Habiganj 70100 2,507 10,683 11,800 58,457 20,561 7,175 6,247 3,411 6,526 10,228 16,261 184,801 23,240 5,169 11,605 12,371 6,302Moulvibazar 70200 2,596 11,198 12,266 60,777 21,379 7,462 6,493 3,544 6,777 10,728 16,939 191,927 24,126 5,375 12,057 12,827 6,537Sunamganj 70300 4,924 20,568 22,995 114,061 40,077 13,973 12,190 6,651 12,736 19,726 31,758 360,939 45,509 10,075 22,647 24,262 12,338Sylhet 70400 5,342 22,029 24,924 124,396 43,469 15,144 13,226 7,209 13,804 23,399 37,443 406,792 51,491 11,286 25,356 27,171 13,828Benapole Land Port 90001 567 3,814 3,584 10,841 7,455 2,943 1,965 947 2,585 4,203 909 613,428 181,963 55,015 138,119 55,516 71,510Bhomra Land Port 90002 541 3,640 3,421 10,346 7,115 2,809 1,875 904 2,467 4,011 868 585,452 173,664 52,506 131,820 52,984 68,249Mongla Sea Port 90003 0 0 0 0 0 0 0 0 0 0 0 796,448 236,252 71,429 179,327 72,080 92,846Hilli Land Port 90004 0 0 0 0 0 0 0 0 0 0 0 1,376,985 408,459 123,494 310,040 124,619 160,522Dhaka Airport 90005 0 0 0 0 0 0 0 0 0 0 0 0 0 0 0 0 0Chittagong Airport 90006 0 0 0 0 0 0 0 0 0 0 0 0 0 0 0 0 0Chittagong Sea Port 90007 343,509 2,311,178 2,172,165 6,569,890 4,518,139 1,783,778 1,190,739 573,754 1,566,720 2,546,959 551,042 14,870,645 4,411,119 1,333,661 3,348,255 1,345,815 1,733,548Payra Sea Port 90008 0 0 0 0 0 0 0 0 0 0 0 643,900 191,002 57,748 144,980 58,274 75,063Matarbari Sea Port 90009 28,798 193,755 182,101 550,780 378,774 149,541 99,824 48,100 131,344 213,522 46,196 1,246,666 369,802 111,806 280,698 112,825 145,330Akhaura Land port 90010 1,773 11,928 11,210 33,906 23,318 9,206 6,145 2,961 8,086 13,145 2,844 95,932 28,457 8,604 21,600 8,682 11,183Bibir Bazar Land Port 90011 827 5,563 5,229 15,814 10,876 4,294 2,866 1,381 3,771 6,131 1,326 22,372 6,636 2,006 5,037 2,025 2,608Ramgarh border crossing 90012 0 0 0 0 0 0 0 0 0 0 0 174,812 51,855 15,678 39,360 15,821 20,379Teknaf border crossing 90013 2,230 15,006 14,104 42,658 29,336 11,582 7,731 3,725 10,173 16,537 3,578 60,346 17,901 5,412 13,587 5,461 7,035
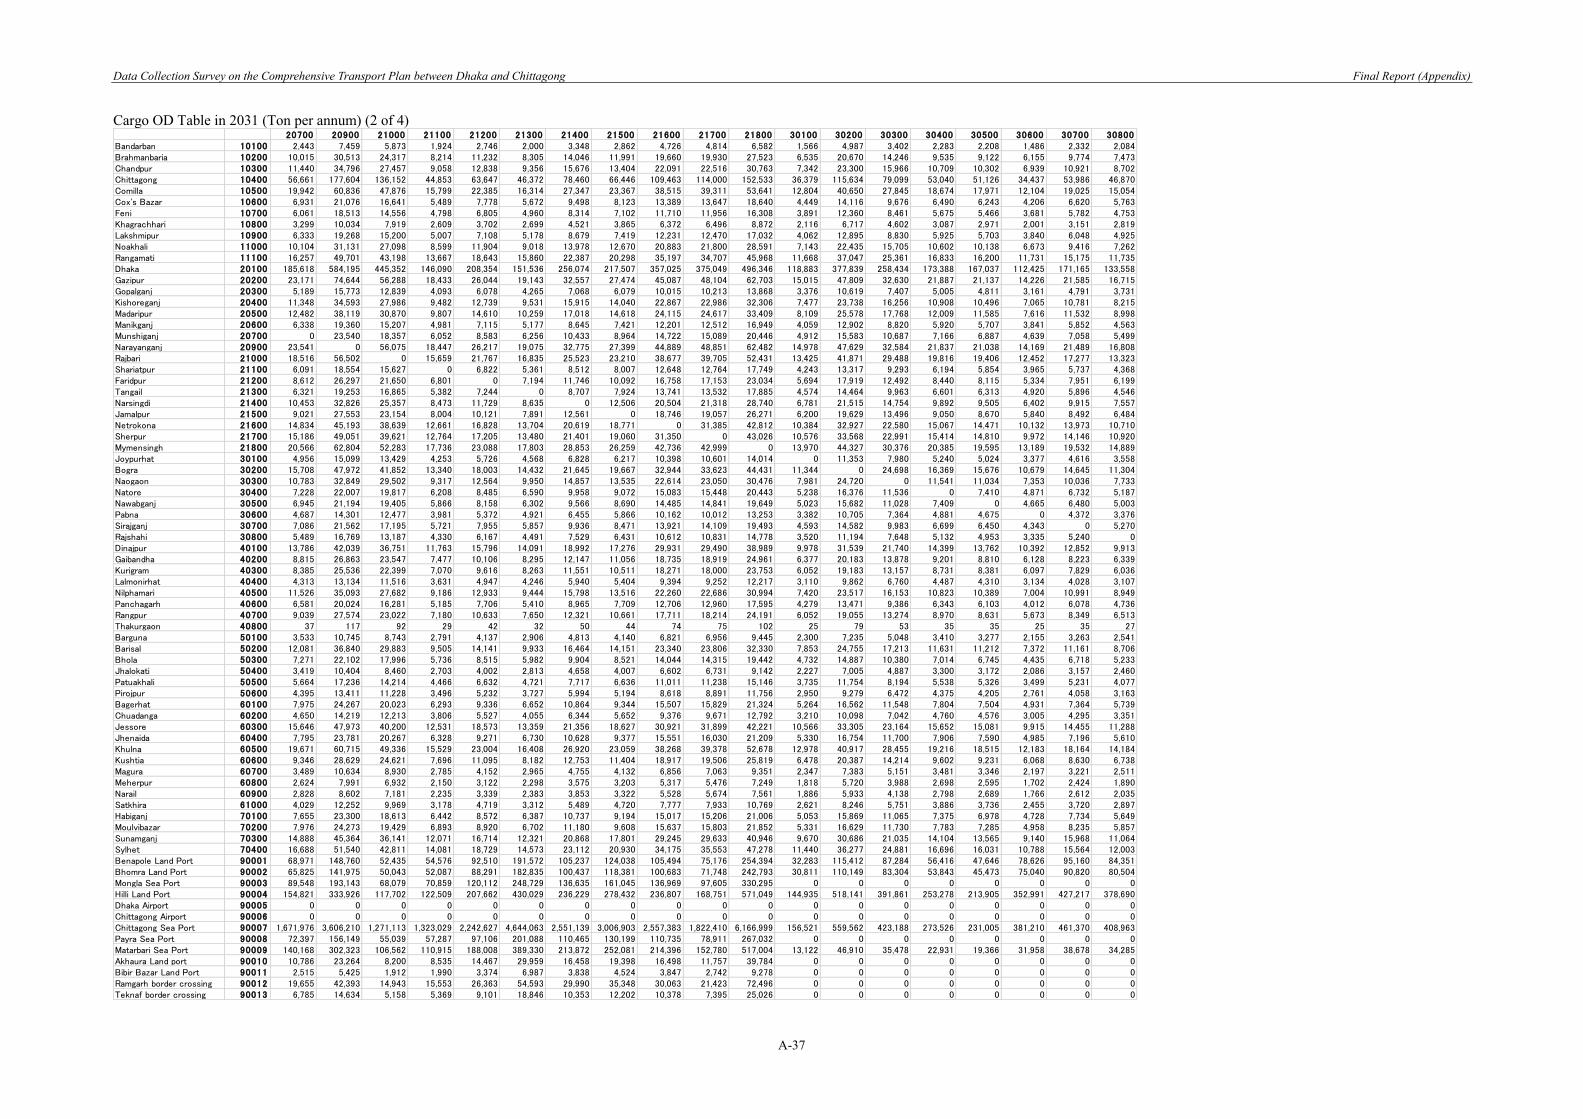
Data Collection Survey on the Comprehensive Transport Plan between Dhaka and Chittagong Final Report (Appendix)
A-37
Cargo OD Table in 2031 (Ton per annum) (2 of 4)
20700 20900 21000 21100 21200 21300 21400 21500 21600 21700 21800 30100 30200 30300 30400 30500 30600 30700 30800Bandarban 10100 2,443 7,459 5,873 1,924 2,746 2,000 3,348 2,862 4,726 4,814 6,582 1,566 4,987 3,402 2,283 2,208 1,486 2,332 2,084Brahmanbaria 10200 10,015 30,513 24,317 8,214 11,232 8,305 14,046 11,991 19,660 19,930 27,523 6,535 20,670 14,246 9,535 9,122 6,155 9,774 7,473Chandpur 10300 11,440 34,796 27,457 9,058 12,838 9,356 15,676 13,404 22,091 22,516 30,763 7,342 23,300 15,966 10,709 10,302 6,939 10,921 8,702Chittagong 10400 56,661 177,604 136,152 44,853 63,647 46,372 78,460 66,446 109,463 114,000 152,533 36,379 115,634 79,099 53,040 51,126 34,437 53,986 46,870Comilla 10500 19,942 60,836 47,876 15,799 22,385 16,314 27,347 23,367 38,515 39,311 53,641 12,804 40,650 27,845 18,674 17,971 12,104 19,025 15,054Cox's Bazar 10600 6,931 21,076 16,641 5,489 7,778 5,672 9,498 8,123 13,389 13,647 18,640 4,449 14,116 9,676 6,490 6,243 4,206 6,620 5,763Feni 10700 6,061 18,513 14,556 4,798 6,805 4,960 8,314 7,102 11,710 11,956 16,308 3,891 12,360 8,461 5,675 5,466 3,681 5,782 4,753Khagrachhari 10800 3,299 10,034 7,919 2,609 3,702 2,699 4,521 3,865 6,372 6,496 8,872 2,116 6,717 4,602 3,087 2,971 2,001 3,151 2,819Lakshmipur 10900 6,333 19,268 15,200 5,007 7,108 5,178 8,679 7,419 12,231 12,470 17,032 4,062 12,895 8,830 5,925 5,703 3,840 6,048 4,925Noakhali 11000 10,104 31,131 27,098 8,599 11,904 9,018 13,978 12,670 20,883 21,800 28,591 7,143 22,435 15,705 10,602 10,138 6,673 9,416 7,262Rangamati 11100 16,257 49,701 43,198 13,667 18,643 15,860 22,387 20,298 35,197 34,707 45,968 11,668 37,047 25,361 16,833 16,200 11,731 15,175 11,735Dhaka 20100 185,618 584,195 445,352 146,090 208,354 151,536 256,074 217,507 357,025 375,049 496,346 118,883 377,839 258,434 173,388 167,037 112,425 171,165 133,558Gazipur 20200 23,171 74,644 56,288 18,433 26,044 19,143 32,557 27,474 45,087 48,104 62,703 15,015 47,809 32,630 21,887 21,137 14,226 21,585 16,715Gopalganj 20300 5,189 15,773 12,839 4,093 6,078 4,265 7,068 6,079 10,015 10,213 13,868 3,376 10,619 7,407 5,005 4,811 3,161 4,791 3,731Kishoreganj 20400 11,348 34,593 27,986 9,482 12,739 9,531 15,915 14,040 22,867 22,986 32,306 7,477 23,738 16,256 10,908 10,496 7,065 10,781 8,215Madaripur 20500 12,482 38,119 30,870 9,807 14,610 10,259 17,018 14,618 24,115 24,617 33,409 8,109 25,578 17,768 12,009 11,585 7,616 11,532 8,998Manikganj 20600 6,338 19,360 15,207 4,981 7,115 5,177 8,645 7,421 12,201 12,512 16,949 4,059 12,902 8,820 5,920 5,707 3,841 5,852 4,563Munshiganj 20700 0 23,540 18,357 6,052 8,583 6,256 10,433 8,964 14,722 15,089 20,446 4,912 15,583 10,687 7,166 6,887 4,639 7,058 5,499Narayanganj 20900 23,541 0 56,075 18,447 26,217 19,075 32,775 27,399 44,889 48,851 62,482 14,978 47,629 32,584 21,837 21,038 14,169 21,489 16,808Rajbari 21000 18,516 56,502 0 15,659 21,767 16,835 25,523 23,210 38,677 39,705 52,431 13,425 41,871 29,488 19,816 19,406 12,452 17,277 13,323Shariatpur 21100 6,091 18,554 15,627 0 6,822 5,361 8,512 8,007 12,648 12,764 17,749 4,243 13,317 9,293 6,194 5,854 3,965 5,737 4,368Faridpur 21200 8,612 26,297 21,650 6,801 0 7,194 11,746 10,092 16,758 17,153 23,034 5,694 17,919 12,492 8,440 8,115 5,334 7,951 6,199Tangail 21300 6,321 19,253 16,865 5,382 7,244 0 8,707 7,924 13,741 13,532 17,885 4,574 14,464 9,963 6,601 6,313 4,920 5,896 4,546Narsingdi 21400 10,453 32,826 25,357 8,473 11,729 8,635 0 12,506 20,504 21,318 28,740 6,781 21,515 14,754 9,892 9,505 6,402 9,915 7,557Jamalpur 21500 9,021 27,553 23,154 8,004 10,121 7,891 12,561 0 18,746 19,057 26,271 6,200 19,629 13,496 9,050 8,670 5,840 8,492 6,484Netrokona 21600 14,834 45,193 38,639 12,661 16,828 13,704 20,619 18,771 0 31,385 42,812 10,384 32,927 22,580 15,067 14,471 10,132 13,973 10,710Sherpur 21700 15,186 49,051 39,621 12,764 17,205 13,480 21,401 19,060 31,350 0 43,026 10,576 33,568 22,991 15,414 14,810 9,972 14,146 10,920Mymensingh 21800 20,566 62,804 52,283 17,736 23,088 17,803 28,853 26,259 42,736 42,999 0 13,970 44,327 30,376 20,385 19,595 13,189 19,532 14,889Joypurhat 30100 4,956 15,099 13,429 4,253 5,726 4,568 6,828 6,217 10,398 10,601 14,014 0 11,353 7,980 5,240 5,024 3,377 4,616 3,558Bogra 30200 15,708 47,972 41,852 13,340 18,003 14,432 21,645 19,667 32,944 33,623 44,431 11,344 0 24,698 16,369 15,676 10,679 14,645 11,304Naogaon 30300 10,783 32,849 29,502 9,317 12,564 9,950 14,857 13,535 22,614 23,050 30,476 7,981 24,720 0 11,541 11,034 7,353 10,036 7,733Natore 30400 7,228 22,007 19,817 6,208 8,485 6,590 9,958 9,072 15,083 15,448 20,443 5,238 16,376 11,536 0 7,410 4,871 6,732 5,187Nawabganj 30500 6,945 21,194 19,405 5,866 8,158 6,302 9,566 8,690 14,485 14,841 19,649 5,023 15,682 11,028 7,409 0 4,665 6,480 5,003Pabna 30600 4,687 14,301 12,477 3,981 5,372 4,921 6,455 5,866 10,162 10,012 13,253 3,382 10,705 7,364 4,881 4,675 0 4,372 3,376Sirajganj 30700 7,086 21,562 17,195 5,721 7,955 5,857 9,936 8,471 13,921 14,109 19,493 4,593 14,582 9,983 6,699 6,450 4,343 0 5,270Rajshahi 30800 5,489 16,769 13,187 4,330 6,167 4,491 7,529 6,431 10,612 10,831 14,778 3,520 11,194 7,648 5,132 4,953 3,335 5,240 0Dinajpur 40100 13,786 42,039 36,751 11,763 15,796 14,091 18,992 17,276 29,931 29,490 38,989 9,978 31,539 21,740 14,399 13,762 10,392 12,852 9,913Gaibandha 40200 8,815 26,863 23,547 7,477 10,106 8,295 12,147 11,056 18,735 18,919 24,961 6,377 20,183 13,878 9,201 8,810 6,128 8,223 6,339Kurigram 40300 8,385 25,536 22,399 7,070 9,616 8,263 11,551 10,511 18,271 18,000 23,753 6,052 19,183 13,157 8,731 8,381 6,097 7,829 6,036Lalmonirhat 40400 4,313 13,134 11,516 3,631 4,947 4,246 5,940 5,404 9,394 9,252 12,217 3,110 9,862 6,760 4,487 4,310 3,134 4,028 3,107Nilphamari 40500 11,526 35,093 27,682 9,186 12,933 9,444 15,798 13,516 22,260 22,686 30,994 7,420 23,517 16,153 10,823 10,389 7,004 10,991 8,949Panchagarh 40600 6,581 20,024 16,281 5,185 7,706 5,410 8,965 7,709 12,706 12,960 17,595 4,279 13,471 9,386 6,343 6,103 4,012 6,078 4,736Rangpur 40700 9,039 27,574 23,022 7,180 10,633 7,650 12,321 10,661 17,711 18,214 24,191 6,052 19,055 13,274 8,970 8,631 5,673 8,349 6,513Thakurgaon 40800 37 117 92 29 42 32 50 44 74 75 102 25 79 53 35 35 25 35 27Barguna 50100 3,533 10,745 8,743 2,791 4,137 2,906 4,813 4,140 6,821 6,956 9,445 2,300 7,235 5,048 3,410 3,277 2,155 3,263 2,541Barisal 50200 12,081 36,840 29,883 9,505 14,141 9,933 16,464 14,151 23,340 23,806 32,330 7,853 24,755 17,213 11,631 11,212 7,372 11,161 8,706Bhola 50300 7,271 22,102 17,996 5,736 8,515 5,982 9,904 8,521 14,044 14,315 19,442 4,732 14,887 10,380 7,014 6,745 4,435 6,718 5,233Jhalokati 50400 3,419 10,404 8,460 2,703 4,002 2,813 4,658 4,007 6,602 6,731 9,142 2,227 7,005 4,887 3,300 3,172 2,086 3,157 2,460Patuakhali 50500 5,664 17,236 14,214 4,466 6,632 4,721 7,717 6,636 11,011 11,238 15,146 3,735 11,754 8,194 5,538 5,326 3,499 5,231 4,077Pirojpur 50600 4,395 13,411 11,228 3,496 5,232 3,727 5,994 5,194 8,618 8,891 11,756 2,950 9,279 6,472 4,375 4,205 2,761 4,058 3,163Bagerhat 60100 7,975 24,267 20,023 6,293 9,336 6,652 10,864 9,344 15,507 15,829 21,324 5,264 16,562 11,548 7,804 7,504 4,931 7,364 5,739Chuadanga 60200 4,650 14,219 12,213 3,806 5,527 4,055 6,344 5,652 9,376 9,671 12,792 3,210 10,098 7,042 4,760 4,576 3,005 4,295 3,351Jessore 60300 15,646 47,973 40,200 12,531 18,573 13,359 21,356 18,627 30,921 31,899 42,221 10,566 33,305 23,164 15,652 15,081 9,915 14,455 11,288Jhenaida 60400 7,795 23,781 20,267 6,328 9,271 6,730 10,628 9,377 15,551 16,030 21,209 5,330 16,754 11,700 7,906 7,590 4,985 7,196 5,610Khulna 60500 19,671 60,715 49,336 15,529 23,004 16,408 26,920 23,059 38,268 39,378 52,678 12,978 40,917 28,455 19,216 18,515 12,183 18,164 14,184Kushtia 60600 9,346 28,629 24,621 7,696 11,095 8,182 12,753 11,404 18,917 19,506 25,819 6,478 20,387 14,214 9,602 9,231 6,068 8,630 6,738Magura 60700 3,489 10,634 8,930 2,785 4,152 2,965 4,755 4,132 6,856 7,063 9,351 2,347 7,383 5,151 3,481 3,346 2,197 3,221 2,511Meherpur 60800 2,624 7,991 6,932 2,150 3,122 2,298 3,575 3,203 5,317 5,476 7,249 1,818 5,720 3,988 2,698 2,595 1,702 2,424 1,890Narail 60900 2,828 8,602 7,181 2,235 3,339 2,383 3,853 3,322 5,528 5,674 7,561 1,886 5,933 4,138 2,798 2,689 1,766 2,612 2,035Satkhira 61000 4,029 12,252 9,969 3,178 4,719 3,312 5,489 4,720 7,777 7,933 10,769 2,621 8,246 5,751 3,886 3,736 2,455 3,720 2,897Habiganj 70100 7,655 23,300 18,613 6,442 8,572 6,387 10,737 9,194 15,017 15,206 21,006 5,053 15,869 11,065 7,375 6,978 4,728 7,734 5,649Moulvibazar 70200 7,976 24,273 19,429 6,893 8,920 6,702 11,180 9,608 15,637 15,803 21,852 5,331 16,629 11,730 7,783 7,285 4,958 8,235 5,857Sunamganj 70300 14,888 45,364 36,141 12,071 16,714 12,321 20,868 17,801 29,245 29,633 40,946 9,670 30,686 21,035 14,104 13,565 9,140 15,968 11,064Sylhet 70400 16,688 51,540 42,811 14,081 18,729 14,573 23,112 20,930 34,175 35,553 47,278 11,440 36,277 24,881 16,696 16,031 10,788 15,564 12,003Benapole Land Port 90001 68,971 148,760 52,435 54,576 92,510 191,572 105,237 124,038 105,494 75,176 254,394 32,283 115,412 87,284 56,416 47,646 78,626 95,160 84,351Bhomra Land Port 90002 65,825 141,975 50,043 52,087 88,291 182,835 100,437 118,381 100,683 71,748 242,793 30,811 110,149 83,304 53,843 45,473 75,040 90,820 80,504Mongla Sea Port 90003 89,548 193,143 68,079 70,859 120,112 248,729 136,635 161,045 136,969 97,605 330,295 0 0 0 0 0 0 0 0Hilli Land Port 90004 154,821 333,926 117,702 122,509 207,662 430,029 236,229 278,432 236,807 168,751 571,049 144,935 518,141 391,861 253,278 213,905 352,991 427,217 378,690Dhaka Airport 90005 0 0 0 0 0 0 0 0 0 0 0 0 0 0 0 0 0 0 0Chittagong Airport 90006 0 0 0 0 0 0 0 0 0 0 0 0 0 0 0 0 0 0 0Chittagong Sea Port 90007 1,671,976 3,606,210 1,271,113 1,323,029 2,242,627 4,644,063 2,551,139 3,006,903 2,557,383 1,822,410 6,166,999 156,521 559,562 423,188 273,526 231,005 381,210 461,370 408,963Payra Sea Port 90008 72,397 156,149 55,039 57,287 97,106 201,088 110,465 130,199 110,735 78,911 267,032 0 0 0 0 0 0 0 0Matarbari Sea Port 90009 140,168 302,323 106,562 110,915 188,008 389,330 213,872 252,081 214,396 152,780 517,004 13,122 46,910 35,478 22,931 19,366 31,958 38,678 34,285Akhaura Land port 90010 10,786 23,264 8,200 8,535 14,467 29,959 16,458 19,398 16,498 11,757 39,784 0 0 0 0 0 0 0 0Bibir Bazar Land Port 90011 2,515 5,425 1,912 1,990 3,374 6,987 3,838 4,524 3,847 2,742 9,278 0 0 0 0 0 0 0 0Ramgarh border crossing 90012 19,655 42,393 14,943 15,553 26,363 54,593 29,990 35,348 30,063 21,423 72,496 0 0 0 0 0 0 0 0Teknaf border crossing 90013 6,785 14,634 5,158 5,369 9,101 18,846 10,353 12,202 10,378 7,395 25,026 0 0 0 0 0 0 0 0
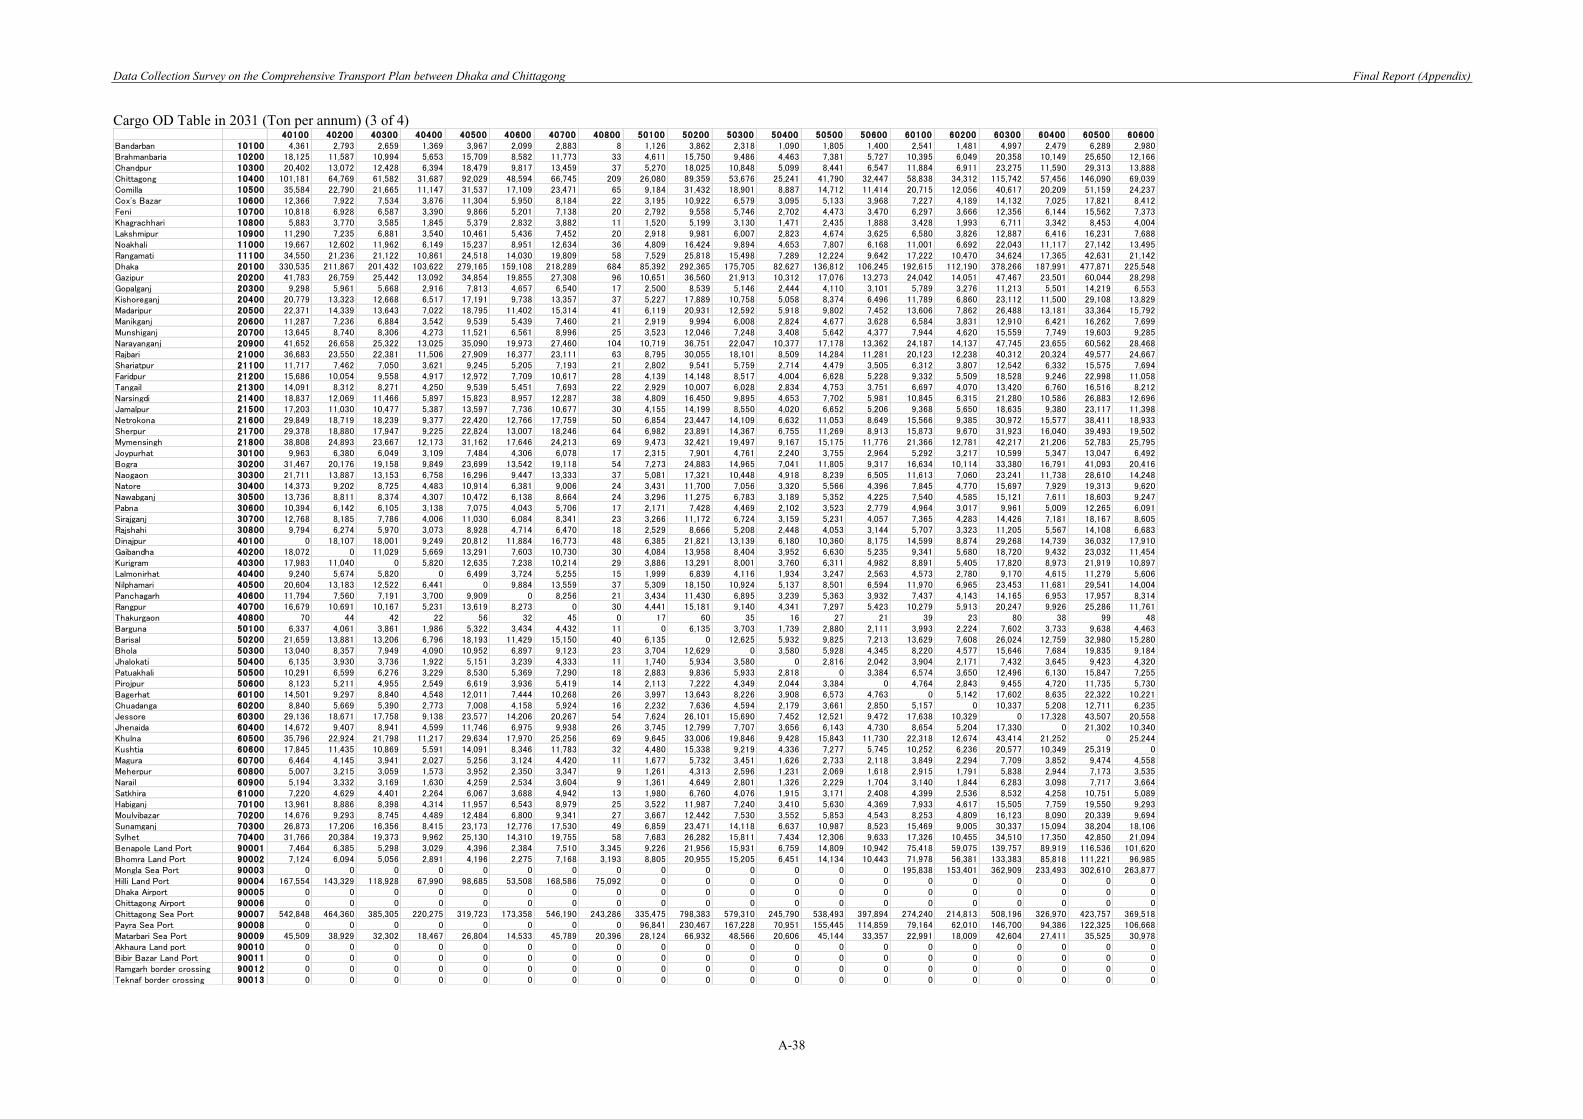
Data Collection Survey on the Comprehensive Transport Plan between Dhaka and Chittagong Final Report (Appendix)
A-38
Cargo OD Table in 2031 (Ton per annum) (3 of 4)
40100 40200 40300 40400 40500 40600 40700 40800 50100 50200 50300 50400 50500 50600 60100 60200 60300 60400 60500 60600Bandarban 10100 4,361 2,793 2,659 1,369 3,967 2,099 2,883 8 1,126 3,862 2,318 1,090 1,805 1,400 2,541 1,481 4,997 2,479 6,289 2,980Brahmanbaria 10200 18,125 11,587 10,994 5,653 15,709 8,582 11,773 33 4,611 15,750 9,486 4,463 7,381 5,727 10,395 6,049 20,358 10,149 25,650 12,166Chandpur 10300 20,402 13,072 12,428 6,394 18,479 9,817 13,459 37 5,270 18,025 10,848 5,099 8,441 6,547 11,884 6,911 23,275 11,590 29,313 13,888Chittagong 10400 101,181 64,769 61,582 31,687 92,029 48,594 66,745 209 26,080 89,359 53,676 25,241 41,790 32,447 58,838 34,312 115,742 57,456 146,090 69,039Comilla 10500 35,584 22,790 21,665 11,147 31,537 17,109 23,471 65 9,184 31,432 18,901 8,887 14,712 11,414 20,715 12,056 40,617 20,209 51,159 24,237Cox's Bazar 10600 12,366 7,922 7,534 3,876 11,304 5,950 8,184 22 3,195 10,922 6,579 3,095 5,133 3,968 7,227 4,189 14,132 7,025 17,821 8,412Feni 10700 10,818 6,928 6,587 3,390 9,866 5,201 7,138 20 2,792 9,558 5,746 2,702 4,473 3,470 6,297 3,666 12,356 6,144 15,562 7,373Khagrachhari 10800 5,883 3,770 3,585 1,845 5,379 2,832 3,882 11 1,520 5,199 3,130 1,471 2,435 1,888 3,428 1,993 6,711 3,342 8,453 4,004Lakshmipur 10900 11,290 7,235 6,881 3,540 10,461 5,436 7,452 20 2,918 9,981 6,007 2,823 4,674 3,625 6,580 3,826 12,887 6,416 16,231 7,688Noakhali 11000 19,667 12,602 11,962 6,149 15,237 8,951 12,634 36 4,809 16,424 9,894 4,653 7,807 6,168 11,001 6,692 22,043 11,117 27,142 13,495Rangamati 11100 34,550 21,236 21,122 10,861 24,518 14,030 19,809 58 7,529 25,818 15,498 7,289 12,224 9,642 17,222 10,470 34,624 17,365 42,631 21,142Dhaka 20100 330,535 211,867 201,432 103,622 279,165 159,108 218,289 684 85,392 292,365 175,705 82,627 136,812 106,245 192,615 112,190 378,266 187,991 477,871 225,548Gazipur 20200 41,783 26,759 25,442 13,092 34,854 19,855 27,308 96 10,651 36,560 21,913 10,312 17,076 13,273 24,042 14,051 47,467 23,501 60,044 28,298Gopalganj 20300 9,298 5,961 5,668 2,916 7,813 4,657 6,540 17 2,500 8,539 5,146 2,444 4,110 3,101 5,789 3,276 11,213 5,501 14,219 6,553Kishoreganj 20400 20,779 13,323 12,668 6,517 17,191 9,738 13,357 37 5,227 17,889 10,758 5,058 8,374 6,496 11,789 6,860 23,112 11,500 29,108 13,829Madaripur 20500 22,371 14,339 13,643 7,022 18,795 11,402 15,314 41 6,119 20,931 12,592 5,918 9,802 7,452 13,606 7,862 26,488 13,181 33,364 15,792Manikganj 20600 11,287 7,236 6,884 3,542 9,539 5,439 7,460 21 2,919 9,994 6,008 2,824 4,677 3,628 6,584 3,831 12,910 6,421 16,262 7,699Munshiganj 20700 13,645 8,740 8,306 4,273 11,521 6,561 8,996 25 3,523 12,046 7,248 3,408 5,642 4,377 7,944 4,620 15,559 7,749 19,603 9,285Narayanganj 20900 41,652 26,658 25,322 13,025 35,090 19,973 27,460 104 10,719 36,751 22,047 10,377 17,178 13,362 24,187 14,137 47,745 23,655 60,562 28,468Rajbari 21000 36,683 23,550 22,381 11,506 27,909 16,377 23,111 63 8,795 30,055 18,101 8,509 14,284 11,281 20,123 12,238 40,312 20,324 49,577 24,667Shariatpur 21100 11,717 7,462 7,050 3,621 9,245 5,205 7,193 21 2,802 9,541 5,759 2,714 4,479 3,505 6,312 3,807 12,542 6,332 15,575 7,694Faridpur 21200 15,686 10,054 9,558 4,917 12,972 7,709 10,617 28 4,139 14,148 8,517 4,004 6,628 5,228 9,332 5,509 18,528 9,246 22,998 11,058Tangail 21300 14,091 8,312 8,271 4,250 9,539 5,451 7,693 22 2,929 10,007 6,028 2,834 4,753 3,751 6,697 4,070 13,420 6,760 16,516 8,212Narsingdi 21400 18,837 12,069 11,466 5,897 15,823 8,957 12,287 38 4,809 16,450 9,895 4,653 7,702 5,981 10,845 6,315 21,280 10,586 26,883 12,696Jamalpur 21500 17,203 11,030 10,477 5,387 13,597 7,736 10,677 30 4,155 14,199 8,550 4,020 6,652 5,206 9,368 5,650 18,635 9,380 23,117 11,398Netrokona 21600 29,849 18,719 18,239 9,377 22,420 12,766 17,759 50 6,854 23,447 14,109 6,632 11,053 8,649 15,566 9,385 30,972 15,577 38,411 18,933Sherpur 21700 29,378 18,880 17,947 9,225 22,824 13,007 18,246 64 6,982 23,891 14,367 6,755 11,269 8,913 15,873 9,670 31,923 16,040 39,493 19,502Mymensingh 21800 38,808 24,893 23,667 12,173 31,162 17,646 24,213 69 9,473 32,421 19,497 9,167 15,175 11,776 21,366 12,781 42,217 21,206 52,783 25,795Joypurhat 30100 9,963 6,380 6,049 3,109 7,484 4,306 6,078 17 2,315 7,901 4,761 2,240 3,755 2,964 5,292 3,217 10,599 5,347 13,047 6,492Bogra 30200 31,467 20,176 19,158 9,849 23,699 13,542 19,118 54 7,273 24,883 14,965 7,041 11,805 9,317 16,634 10,114 33,380 16,791 41,093 20,416Naogaon 30300 21,711 13,887 13,153 6,758 16,296 9,447 13,333 37 5,081 17,321 10,448 4,918 8,239 6,505 11,613 7,060 23,241 11,738 28,610 14,248Natore 30400 14,373 9,202 8,725 4,483 10,914 6,381 9,006 24 3,431 11,700 7,056 3,320 5,566 4,396 7,845 4,770 15,697 7,929 19,313 9,620Nawabganj 30500 13,736 8,811 8,374 4,307 10,472 6,138 8,664 24 3,296 11,275 6,783 3,189 5,352 4,225 7,540 4,585 15,121 7,611 18,603 9,247Pabna 30600 10,394 6,142 6,105 3,138 7,075 4,043 5,706 17 2,171 7,428 4,469 2,102 3,523 2,779 4,964 3,017 9,961 5,009 12,265 6,091Sirajganj 30700 12,768 8,185 7,786 4,006 11,030 6,084 8,341 23 3,266 11,172 6,724 3,159 5,231 4,057 7,365 4,283 14,426 7,181 18,167 8,605Rajshahi 30800 9,794 6,274 5,970 3,073 8,928 4,714 6,470 18 2,529 8,666 5,208 2,448 4,053 3,144 5,707 3,323 11,205 5,567 14,108 6,683Dinajpur 40100 0 18,107 18,001 9,249 20,812 11,884 16,773 48 6,385 21,821 13,139 6,180 10,360 8,175 14,599 8,874 29,268 14,739 36,032 17,910Gaibandha 40200 18,072 0 11,029 5,669 13,291 7,603 10,730 30 4,084 13,958 8,404 3,952 6,630 5,235 9,341 5,680 18,720 9,432 23,032 11,454Kurigram 40300 17,983 11,040 0 5,820 12,635 7,238 10,214 29 3,886 13,291 8,001 3,760 6,311 4,982 8,891 5,405 17,820 8,973 21,919 10,897Lalmonirhat 40400 9,240 5,674 5,820 0 6,499 3,724 5,255 15 1,999 6,839 4,116 1,934 3,247 2,563 4,573 2,780 9,170 4,615 11,279 5,606Nilphamari 40500 20,604 13,183 12,522 6,441 0 9,884 13,559 37 5,309 18,150 10,924 5,137 8,501 6,594 11,970 6,965 23,453 11,681 29,541 14,004Panchagarh 40600 11,794 7,560 7,191 3,700 9,909 0 8,256 21 3,434 11,430 6,895 3,239 5,363 3,932 7,437 4,143 14,165 6,953 17,957 8,314Rangpur 40700 16,679 10,691 10,167 5,231 13,619 8,273 0 30 4,441 15,181 9,140 4,341 7,297 5,423 10,279 5,913 20,247 9,926 25,286 11,761Thakurgaon 40800 70 44 42 22 56 32 45 0 17 60 35 16 27 21 39 23 80 38 99 48Barguna 50100 6,337 4,061 3,861 1,986 5,322 3,434 4,432 11 0 6,135 3,703 1,739 2,880 2,111 3,993 2,224 7,602 3,733 9,638 4,463Barisal 50200 21,659 13,881 13,206 6,796 18,193 11,429 15,150 40 6,135 0 12,625 5,932 9,825 7,213 13,629 7,608 26,024 12,759 32,980 15,280Bhola 50300 13,040 8,357 7,949 4,090 10,952 6,897 9,123 23 3,704 12,629 0 3,580 5,928 4,345 8,220 4,577 15,646 7,684 19,835 9,184Jhalokati 50400 6,135 3,930 3,736 1,922 5,151 3,239 4,333 11 1,740 5,934 3,580 0 2,816 2,042 3,904 2,171 7,432 3,645 9,423 4,320Patuakhali 50500 10,291 6,599 6,276 3,229 8,530 5,369 7,290 18 2,883 9,836 5,933 2,818 0 3,384 6,574 3,650 12,496 6,130 15,847 7,255Pirojpur 50600 8,123 5,211 4,955 2,549 6,619 3,936 5,419 14 2,113 7,222 4,349 2,044 3,384 0 4,764 2,843 9,455 4,720 11,735 5,730Bagerhat 60100 14,501 9,297 8,840 4,548 12,011 7,444 10,268 26 3,997 13,643 8,226 3,908 6,573 4,763 0 5,142 17,602 8,635 22,322 10,221Chuadanga 60200 8,840 5,669 5,390 2,773 7,008 4,158 5,924 16 2,232 7,636 4,594 2,179 3,661 2,850 5,157 0 10,337 5,208 12,711 6,235Jessore 60300 29,136 18,671 17,758 9,138 23,577 14,206 20,267 54 7,624 26,101 15,690 7,452 12,521 9,472 17,638 10,329 0 17,328 43,507 20,558Jhenaida 60400 14,672 9,407 8,941 4,599 11,746 6,975 9,938 26 3,745 12,799 7,707 3,656 6,143 4,730 8,654 5,204 17,330 0 21,302 10,340Khulna 60500 35,796 22,924 21,798 11,217 29,634 17,970 25,256 69 9,645 33,006 19,846 9,428 15,843 11,730 22,318 12,674 43,414 21,252 0 25,244Kushtia 60600 17,845 11,435 10,869 5,591 14,091 8,346 11,783 32 4,480 15,338 9,219 4,336 7,277 5,745 10,252 6,236 20,577 10,349 25,319 0Magura 60700 6,464 4,145 3,941 2,027 5,256 3,124 4,420 11 1,677 5,732 3,451 1,626 2,733 2,118 3,849 2,294 7,709 3,852 9,474 4,558Meherpur 60800 5,007 3,215 3,059 1,573 3,952 2,350 3,347 9 1,261 4,313 2,596 1,231 2,069 1,618 2,915 1,791 5,838 2,944 7,173 3,535Narail 60900 5,194 3,332 3,169 1,630 4,259 2,534 3,604 9 1,361 4,649 2,801 1,326 2,229 1,704 3,140 1,844 6,283 3,098 7,717 3,664Satkhira 61000 7,220 4,629 4,401 2,264 6,067 3,688 4,942 13 1,980 6,760 4,076 1,915 3,171 2,408 4,399 2,536 8,532 4,258 10,751 5,089Habiganj 70100 13,961 8,886 8,398 4,314 11,957 6,543 8,979 25 3,522 11,987 7,240 3,410 5,630 4,369 7,933 4,617 15,505 7,759 19,550 9,293Moulvibazar 70200 14,676 9,293 8,745 4,489 12,484 6,800 9,341 27 3,667 12,442 7,530 3,552 5,853 4,543 8,253 4,809 16,123 8,090 20,339 9,694Sunamganj 70300 26,873 17,206 16,356 8,415 23,173 12,776 17,530 49 6,859 23,471 14,118 6,637 10,987 8,523 15,469 9,005 30,337 15,094 38,204 18,106Sylhet 70400 31,766 20,384 19,373 9,962 25,130 14,310 19,755 58 7,683 26,282 15,811 7,434 12,306 9,633 17,326 10,455 34,510 17,350 42,850 21,094Benapole Land Port 90001 7,464 6,385 5,298 3,029 4,396 2,384 7,510 3,345 9,226 21,956 15,931 6,759 14,809 10,942 75,418 59,075 139,757 89,919 116,536 101,620Bhomra Land Port 90002 7,124 6,094 5,056 2,891 4,196 2,275 7,168 3,193 8,805 20,955 15,205 6,451 14,134 10,443 71,978 56,381 133,383 85,818 111,221 96,985Mongla Sea Port 90003 0 0 0 0 0 0 0 0 0 0 0 0 0 0 195,838 153,401 362,909 233,493 302,610 263,877Hilli Land Port 90004 167,554 143,329 118,928 67,990 98,685 53,508 168,586 75,092 0 0 0 0 0 0 0 0 0 0 0 0Dhaka Airport 90005 0 0 0 0 0 0 0 0 0 0 0 0 0 0 0 0 0 0 0 0Chittagong Airport 90006 0 0 0 0 0 0 0 0 0 0 0 0 0 0 0 0 0 0 0 0Chittagong Sea Port 90007 542,848 464,360 385,305 220,275 319,723 173,358 546,190 243,286 335,475 798,383 579,310 245,790 538,493 397,894 274,240 214,813 508,196 326,970 423,757 369,518Payra Sea Port 90008 0 0 0 0 0 0 0 0 96,841 230,467 167,228 70,951 155,445 114,859 79,164 62,010 146,700 94,386 122,325 106,668Matarbari Sea Port 90009 45,509 38,929 32,302 18,467 26,804 14,533 45,789 20,396 28,124 66,932 48,566 20,606 45,144 33,357 22,991 18,009 42,604 27,411 35,525 30,978Akhaura Land port 90010 0 0 0 0 0 0 0 0 0 0 0 0 0 0 0 0 0 0 0 0Bibir Bazar Land Port 90011 0 0 0 0 0 0 0 0 0 0 0 0 0 0 0 0 0 0 0 0Ramgarh border crossing 90012 0 0 0 0 0 0 0 0 0 0 0 0 0 0 0 0 0 0 0 0Teknaf border crossing 90013 0 0 0 0 0 0 0 0 0 0 0 0 0 0 0 0 0 0 0 0
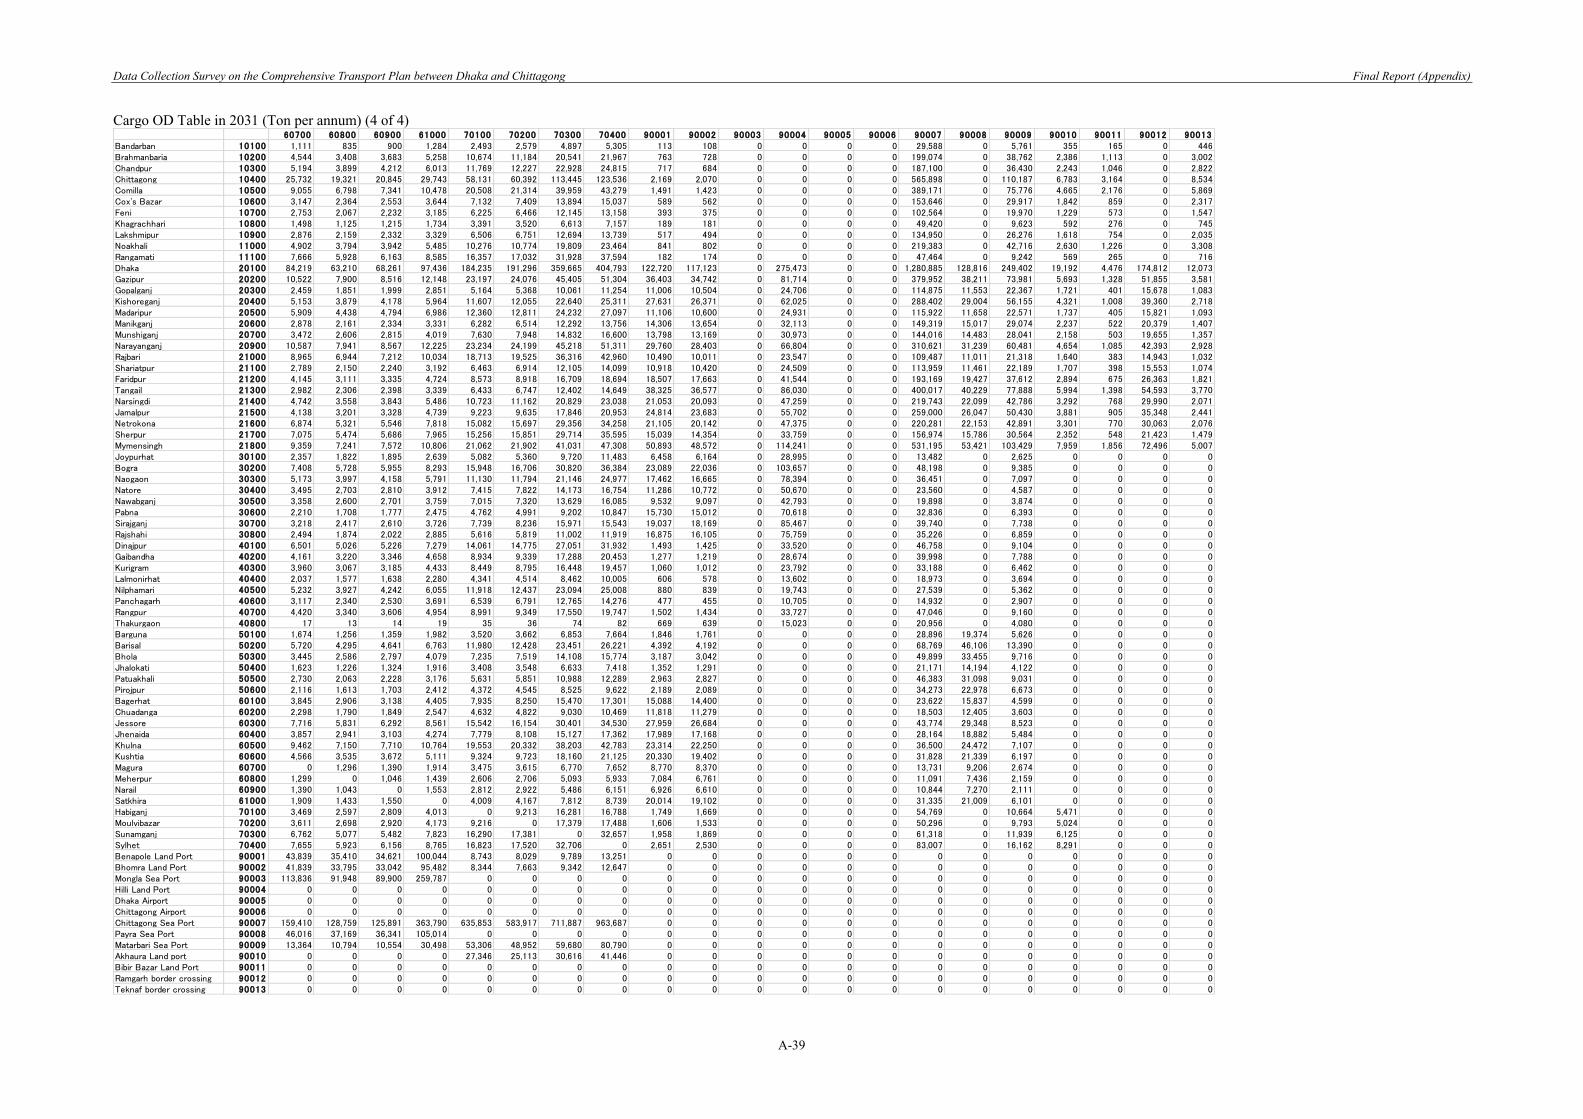
Data Collection Survey on the Comprehensive Transport Plan between Dhaka and Chittagong Final Report (Appendix)
A-39
Cargo OD Table in 2031 (Ton per annum) (4 of 4)
60700 60800 60900 61000 70100 70200 70300 70400 90001 90002 90003 90004 90005 90006 90007 90008 90009 90010 90011 90012 90013Bandarban 10100 1,111 835 900 1,284 2,493 2,579 4,897 5,305 113 108 0 0 0 0 29,588 0 5,761 355 165 0 446Brahmanbaria 10200 4,544 3,408 3,683 5,258 10,674 11,184 20,541 21,967 763 728 0 0 0 0 199,074 0 38,762 2,386 1,113 0 3,002Chandpur 10300 5,194 3,899 4,212 6,013 11,769 12,227 22,928 24,815 717 684 0 0 0 0 187,100 0 36,430 2,243 1,046 0 2,822Chittagong 10400 25,732 19,321 20,845 29,743 58,131 60,392 113,445 123,536 2,169 2,070 0 0 0 0 565,898 0 110,187 6,783 3,164 0 8,534Comilla 10500 9,055 6,798 7,341 10,478 20,508 21,314 39,959 43,279 1,491 1,423 0 0 0 0 389,171 0 75,776 4,665 2,176 0 5,869Cox's Bazar 10600 3,147 2,364 2,553 3,644 7,132 7,409 13,894 15,037 589 562 0 0 0 0 153,646 0 29,917 1,842 859 0 2,317Feni 10700 2,753 2,067 2,232 3,185 6,225 6,466 12,145 13,158 393 375 0 0 0 0 102,564 0 19,970 1,229 573 0 1,547Khagrachhari 10800 1,498 1,125 1,215 1,734 3,391 3,520 6,613 7,157 189 181 0 0 0 0 49,420 0 9,623 592 276 0 745Lakshmipur 10900 2,876 2,159 2,332 3,329 6,506 6,751 12,694 13,739 517 494 0 0 0 0 134,950 0 26,276 1,618 754 0 2,035Noakhali 11000 4,902 3,794 3,942 5,485 10,276 10,774 19,809 23,464 841 802 0 0 0 0 219,383 0 42,716 2,630 1,226 0 3,308Rangamati 11100 7,666 5,928 6,163 8,585 16,357 17,032 31,928 37,594 182 174 0 0 0 0 47,464 0 9,242 569 265 0 716Dhaka 20100 84,219 63,210 68,261 97,436 184,235 191,296 359,665 404,793 122,720 117,123 0 275,473 0 0 1,280,885 128,816 249,402 19,192 4,476 174,812 12,073Gazipur 20200 10,522 7,900 8,516 12,148 23,197 24,076 45,405 51,304 36,403 34,742 0 81,714 0 0 379,952 38,211 73,981 5,693 1,328 51,855 3,581Gopalganj 20300 2,459 1,851 1,999 2,851 5,164 5,368 10,061 11,254 11,006 10,504 0 24,706 0 0 114,875 11,553 22,367 1,721 401 15,678 1,083Kishoreganj 20400 5,153 3,879 4,178 5,964 11,607 12,055 22,640 25,311 27,631 26,371 0 62,025 0 0 288,402 29,004 56,155 4,321 1,008 39,360 2,718Madaripur 20500 5,909 4,438 4,794 6,986 12,360 12,811 24,232 27,097 11,106 10,600 0 24,931 0 0 115,922 11,658 22,571 1,737 405 15,821 1,093Manikganj 20600 2,878 2,161 2,334 3,331 6,282 6,514 12,292 13,756 14,306 13,654 0 32,113 0 0 149,319 15,017 29,074 2,237 522 20,379 1,407Munshiganj 20700 3,472 2,606 2,815 4,019 7,630 7,948 14,832 16,600 13,798 13,169 0 30,973 0 0 144,016 14,483 28,041 2,158 503 19,655 1,357Narayanganj 20900 10,587 7,941 8,567 12,225 23,234 24,199 45,218 51,311 29,760 28,403 0 66,804 0 0 310,621 31,239 60,481 4,654 1,085 42,393 2,928Rajbari 21000 8,965 6,944 7,212 10,034 18,713 19,525 36,316 42,960 10,490 10,011 0 23,547 0 0 109,487 11,011 21,318 1,640 383 14,943 1,032Shariatpur 21100 2,789 2,150 2,240 3,192 6,463 6,914 12,105 14,099 10,918 10,420 0 24,509 0 0 113,959 11,461 22,189 1,707 398 15,553 1,074Faridpur 21200 4,145 3,111 3,335 4,724 8,573 8,918 16,709 18,694 18,507 17,663 0 41,544 0 0 193,169 19,427 37,612 2,894 675 26,363 1,821Tangail 21300 2,982 2,306 2,398 3,339 6,433 6,747 12,402 14,649 38,325 36,577 0 86,030 0 0 400,017 40,229 77,888 5,994 1,398 54,593 3,770Narsingdi 21400 4,742 3,558 3,843 5,486 10,723 11,162 20,829 23,038 21,053 20,093 0 47,259 0 0 219,743 22,099 42,786 3,292 768 29,990 2,071Jamalpur 21500 4,138 3,201 3,328 4,739 9,223 9,635 17,846 20,953 24,814 23,683 0 55,702 0 0 259,000 26,047 50,430 3,881 905 35,348 2,441Netrokona 21600 6,874 5,321 5,546 7,818 15,082 15,697 29,356 34,258 21,105 20,142 0 47,375 0 0 220,281 22,153 42,891 3,301 770 30,063 2,076Sherpur 21700 7,075 5,474 5,686 7,965 15,256 15,851 29,714 35,595 15,039 14,354 0 33,759 0 0 156,974 15,786 30,564 2,352 548 21,423 1,479Mymensingh 21800 9,359 7,241 7,572 10,806 21,062 21,902 41,031 47,308 50,893 48,572 0 114,241 0 0 531,195 53,421 103,429 7,959 1,856 72,496 5,007Joypurhat 30100 2,357 1,822 1,895 2,639 5,082 5,360 9,720 11,483 6,458 6,164 0 28,995 0 0 13,482 0 2,625 0 0 0 0Bogra 30200 7,408 5,728 5,955 8,293 15,948 16,706 30,820 36,384 23,089 22,036 0 103,657 0 0 48,198 0 9,385 0 0 0 0Naogaon 30300 5,173 3,997 4,158 5,791 11,130 11,794 21,146 24,977 17,462 16,665 0 78,394 0 0 36,451 0 7,097 0 0 0 0Natore 30400 3,495 2,703 2,810 3,912 7,415 7,822 14,173 16,754 11,286 10,772 0 50,670 0 0 23,560 0 4,587 0 0 0 0Nawabganj 30500 3,358 2,600 2,701 3,759 7,015 7,320 13,629 16,085 9,532 9,097 0 42,793 0 0 19,898 0 3,874 0 0 0 0Pabna 30600 2,210 1,708 1,777 2,475 4,762 4,991 9,202 10,847 15,730 15,012 0 70,618 0 0 32,836 0 6,393 0 0 0 0Sirajganj 30700 3,218 2,417 2,610 3,726 7,739 8,236 15,971 15,543 19,037 18,169 0 85,467 0 0 39,740 0 7,738 0 0 0 0Rajshahi 30800 2,494 1,874 2,022 2,885 5,616 5,819 11,002 11,919 16,875 16,105 0 75,759 0 0 35,226 0 6,859 0 0 0 0Dinajpur 40100 6,501 5,026 5,226 7,279 14,061 14,775 27,051 31,932 1,493 1,425 0 33,520 0 0 46,758 0 9,104 0 0 0 0Gaibandha 40200 4,161 3,220 3,346 4,658 8,934 9,339 17,288 20,453 1,277 1,219 0 28,674 0 0 39,998 0 7,788 0 0 0 0Kurigram 40300 3,960 3,067 3,185 4,433 8,449 8,795 16,448 19,457 1,060 1,012 0 23,792 0 0 33,188 0 6,462 0 0 0 0Lalmonirhat 40400 2,037 1,577 1,638 2,280 4,341 4,514 8,462 10,005 606 578 0 13,602 0 0 18,973 0 3,694 0 0 0 0Nilphamari 40500 5,232 3,927 4,242 6,055 11,918 12,437 23,094 25,008 880 839 0 19,743 0 0 27,539 0 5,362 0 0 0 0Panchagarh 40600 3,117 2,340 2,530 3,691 6,539 6,791 12,765 14,276 477 455 0 10,705 0 0 14,932 0 2,907 0 0 0 0Rangpur 40700 4,420 3,340 3,606 4,954 8,991 9,349 17,550 19,747 1,502 1,434 0 33,727 0 0 47,046 0 9,160 0 0 0 0Thakurgaon 40800 17 13 14 19 35 36 74 82 669 639 0 15,023 0 0 20,956 0 4,080 0 0 0 0Barguna 50100 1,674 1,256 1,359 1,982 3,520 3,662 6,853 7,664 1,846 1,761 0 0 0 0 28,896 19,374 5,626 0 0 0 0Barisal 50200 5,720 4,295 4,641 6,763 11,980 12,428 23,451 26,221 4,392 4,192 0 0 0 0 68,769 46,106 13,390 0 0 0 0Bhola 50300 3,445 2,586 2,797 4,079 7,235 7,519 14,108 15,774 3,187 3,042 0 0 0 0 49,899 33,455 9,716 0 0 0 0Jhalokati 50400 1,623 1,226 1,324 1,916 3,408 3,548 6,633 7,418 1,352 1,291 0 0 0 0 21,171 14,194 4,122 0 0 0 0Patuakhali 50500 2,730 2,063 2,228 3,176 5,631 5,851 10,988 12,289 2,963 2,827 0 0 0 0 46,383 31,098 9,031 0 0 0 0Pirojpur 50600 2,116 1,613 1,703 2,412 4,372 4,545 8,525 9,622 2,189 2,089 0 0 0 0 34,273 22,978 6,673 0 0 0 0Bagerhat 60100 3,845 2,906 3,138 4,405 7,935 8,250 15,470 17,301 15,088 14,400 0 0 0 0 23,622 15,837 4,599 0 0 0 0Chuadanga 60200 2,298 1,790 1,849 2,547 4,632 4,822 9,030 10,469 11,818 11,279 0 0 0 0 18,503 12,405 3,603 0 0 0 0Jessore 60300 7,716 5,831 6,292 8,561 15,542 16,154 30,401 34,530 27,959 26,684 0 0 0 0 43,774 29,348 8,523 0 0 0 0Jhenaida 60400 3,857 2,941 3,103 4,274 7,779 8,108 15,127 17,362 17,989 17,168 0 0 0 0 28,164 18,882 5,484 0 0 0 0Khulna 60500 9,462 7,150 7,710 10,764 19,553 20,332 38,203 42,783 23,314 22,250 0 0 0 0 36,500 24,472 7,107 0 0 0 0Kushtia 60600 4,566 3,535 3,672 5,111 9,324 9,723 18,160 21,125 20,330 19,402 0 0 0 0 31,828 21,339 6,197 0 0 0 0Magura 60700 0 1,296 1,390 1,914 3,475 3,615 6,770 7,652 8,770 8,370 0 0 0 0 13,731 9,206 2,674 0 0 0 0Meherpur 60800 1,299 0 1,046 1,439 2,606 2,706 5,093 5,933 7,084 6,761 0 0 0 0 11,091 7,436 2,159 0 0 0 0Narail 60900 1,390 1,043 0 1,553 2,812 2,922 5,486 6,151 6,926 6,610 0 0 0 0 10,844 7,270 2,111 0 0 0 0Satkhira 61000 1,909 1,433 1,550 0 4,009 4,167 7,812 8,739 20,014 19,102 0 0 0 0 31,335 21,009 6,101 0 0 0 0Habiganj 70100 3,469 2,597 2,809 4,013 0 9,213 16,281 16,788 1,749 1,669 0 0 0 0 54,769 0 10,664 5,471 0 0 0Moulvibazar 70200 3,611 2,698 2,920 4,173 9,216 0 17,379 17,488 1,606 1,533 0 0 0 0 50,296 0 9,793 5,024 0 0 0Sunamganj 70300 6,762 5,077 5,482 7,823 16,290 17,381 0 32,657 1,958 1,869 0 0 0 0 61,318 0 11,939 6,125 0 0 0Sylhet 70400 7,655 5,923 6,156 8,765 16,823 17,520 32,706 0 2,651 2,530 0 0 0 0 83,007 0 16,162 8,291 0 0 0Benapole Land Port 90001 43,839 35,410 34,621 100,044 8,743 8,029 9,789 13,251 0 0 0 0 0 0 0 0 0 0 0 0 0Bhomra Land Port 90002 41,839 33,795 33,042 95,482 8,344 7,663 9,342 12,647 0 0 0 0 0 0 0 0 0 0 0 0 0Mongla Sea Port 90003 113,836 91,948 89,900 259,787 0 0 0 0 0 0 0 0 0 0 0 0 0 0 0 0 0Hilli Land Port 90004 0 0 0 0 0 0 0 0 0 0 0 0 0 0 0 0 0 0 0 0 0Dhaka Airport 90005 0 0 0 0 0 0 0 0 0 0 0 0 0 0 0 0 0 0 0 0 0Chittagong Airport 90006 0 0 0 0 0 0 0 0 0 0 0 0 0 0 0 0 0 0 0 0 0Chittagong Sea Port 90007 159,410 128,759 125,891 363,790 635,853 583,917 711,887 963,687 0 0 0 0 0 0 0 0 0 0 0 0 0Payra Sea Port 90008 46,016 37,169 36,341 105,014 0 0 0 0 0 0 0 0 0 0 0 0 0 0 0 0 0Matarbari Sea Port 90009 13,364 10,794 10,554 30,498 53,306 48,952 59,680 80,790 0 0 0 0 0 0 0 0 0 0 0 0 0Akhaura Land port 90010 0 0 0 0 27,346 25,113 30,616 41,446 0 0 0 0 0 0 0 0 0 0 0 0 0Bibir Bazar Land Port 90011 0 0 0 0 0 0 0 0 0 0 0 0 0 0 0 0 0 0 0 0 0Ramgarh border crossing 90012 0 0 0 0 0 0 0 0 0 0 0 0 0 0 0 0 0 0 0 0 0Teknaf border crossing 90013 0 0 0 0 0 0 0 0 0 0 0 0 0 0 0 0 0 0 0 0 0
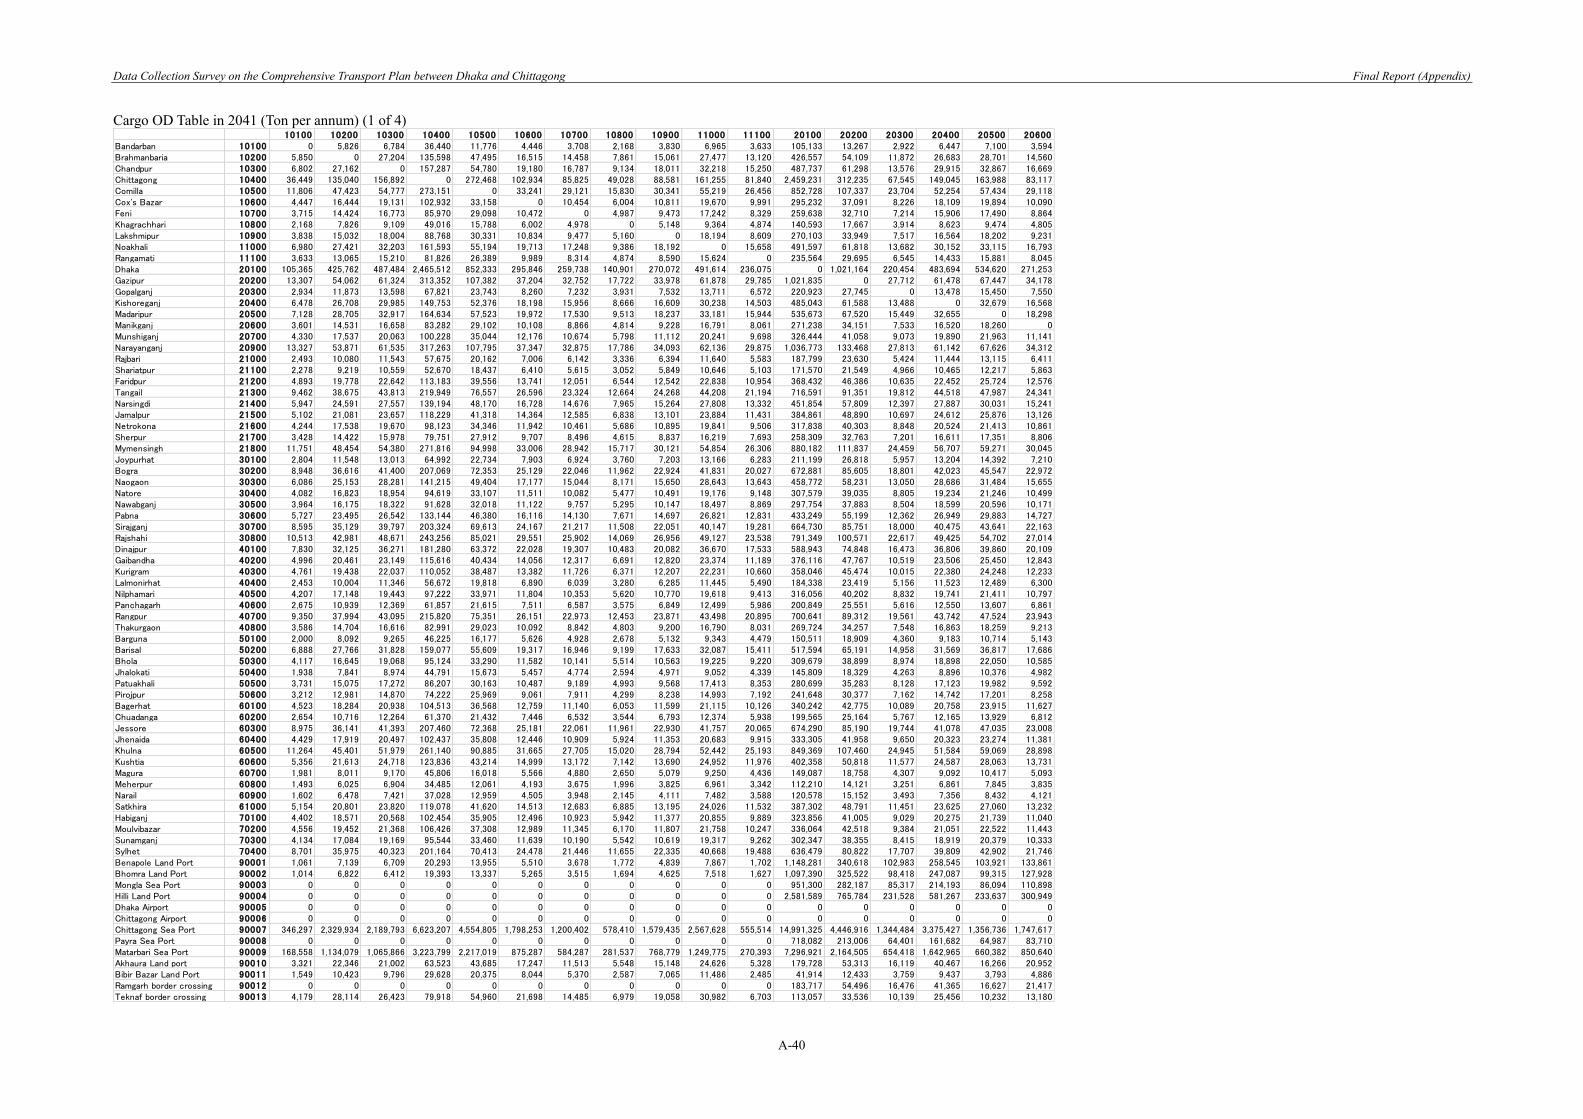
Data Collection Survey on the Comprehensive Transport Plan between Dhaka and Chittagong Final Report (Appendix)
A-40
Cargo OD Table in 2041 (Ton per annum) (1 of 4)
10100 10200 10300 10400 10500 10600 10700 10800 10900 11000 11100 20100 20200 20300 20400 20500 20600Bandarban 10100 0 5,826 6,784 36,440 11,776 4,446 3,708 2,168 3,830 6,965 3,633 105,133 13,267 2,922 6,447 7,100 3,594Brahmanbaria 10200 5,850 0 27,204 135,598 47,495 16,515 14,458 7,861 15,061 27,477 13,120 426,557 54,109 11,872 26,683 28,701 14,560Chandpur 10300 6,802 27,162 0 157,287 54,780 19,180 16,787 9,134 18,011 32,218 15,250 487,737 61,298 13,576 29,915 32,867 16,669Chittagong 10400 36,449 135,040 156,892 0 272,468 102,934 85,825 49,028 88,581 161,255 81,840 2,459,231 312,235 67,545 149,045 163,988 83,117Comilla 10500 11,806 47,423 54,777 273,151 0 33,241 29,121 15,830 30,341 55,219 26,456 852,728 107,337 23,704 52,254 57,434 29,118Cox's Bazar 10600 4,447 16,444 19,131 102,932 33,158 0 10,454 6,004 10,811 19,670 9,991 295,232 37,091 8,226 18,109 19,894 10,090Feni 10700 3,715 14,424 16,773 85,970 29,098 10,472 0 4,987 9,473 17,242 8,329 259,638 32,710 7,214 15,906 17,490 8,864Khagrachhari 10800 2,168 7,826 9,109 49,016 15,788 6,002 4,978 0 5,148 9,364 4,874 140,593 17,667 3,914 8,623 9,474 4,805Lakshmipur 10900 3,838 15,032 18,004 88,768 30,331 10,834 9,477 5,160 0 18,194 8,609 270,103 33,949 7,517 16,564 18,202 9,231Noakhali 11000 6,980 27,421 32,203 161,593 55,194 19,713 17,248 9,386 18,192 0 15,658 491,597 61,818 13,682 30,152 33,115 16,793Rangamati 11100 3,633 13,065 15,210 81,826 26,389 9,989 8,314 4,874 8,590 15,624 0 235,564 29,695 6,545 14,433 15,881 8,045Dhaka 20100 105,365 425,762 487,484 2,465,512 852,333 295,846 259,738 140,901 270,072 491,614 236,075 0 1,021,164 220,454 483,694 534,620 271,253Gazipur 20200 13,307 54,062 61,324 313,352 107,382 37,204 32,752 17,722 33,978 61,878 29,785 1,021,835 0 27,712 61,478 67,447 34,178Gopalganj 20300 2,934 11,873 13,598 67,821 23,743 8,260 7,232 3,931 7,532 13,711 6,572 220,923 27,745 0 13,478 15,450 7,550Kishoreganj 20400 6,478 26,708 29,985 149,753 52,376 18,198 15,956 8,666 16,609 30,238 14,503 485,043 61,588 13,488 0 32,679 16,568Madaripur 20500 7,128 28,705 32,917 164,634 57,523 19,972 17,530 9,513 18,237 33,181 15,944 535,673 67,520 15,449 32,655 0 18,298Manikganj 20600 3,601 14,531 16,658 83,282 29,102 10,108 8,866 4,814 9,228 16,791 8,061 271,238 34,151 7,533 16,520 18,260 0Munshiganj 20700 4,330 17,537 20,063 100,228 35,044 12,176 10,674 5,798 11,112 20,241 9,698 326,444 41,058 9,073 19,890 21,963 11,141Narayanganj 20900 13,327 53,871 61,535 317,263 107,795 37,347 32,875 17,786 34,093 62,136 29,875 1,036,773 133,468 27,813 61,142 67,626 34,312Rajbari 21000 2,493 10,080 11,543 57,675 20,162 7,006 6,142 3,336 6,394 11,640 5,583 187,799 23,630 5,424 11,444 13,115 6,411Shariatpur 21100 2,278 9,219 10,559 52,670 18,437 6,410 5,615 3,052 5,849 10,646 5,103 171,570 21,549 4,966 10,465 12,217 5,863Faridpur 21200 4,893 19,778 22,642 113,183 39,556 13,741 12,051 6,544 12,542 22,838 10,954 368,432 46,386 10,635 22,452 25,724 12,576Tangail 21300 9,462 38,675 43,813 219,949 76,557 26,596 23,324 12,664 24,268 44,208 21,194 716,591 91,351 19,812 44,518 47,987 24,341Narsingdi 21400 5,947 24,591 27,557 139,194 48,170 16,728 14,676 7,965 15,264 27,808 13,332 451,854 57,809 12,397 27,887 30,031 15,241Jamalpur 21500 5,102 21,081 23,657 118,229 41,318 14,364 12,585 6,838 13,101 23,884 11,431 384,861 48,890 10,697 24,612 25,876 13,126Netrokona 21600 4,244 17,538 19,670 98,123 34,346 11,942 10,461 5,686 10,895 19,841 9,506 317,838 40,303 8,848 20,524 21,413 10,861Sherpur 21700 3,428 14,422 15,978 79,751 27,912 9,707 8,496 4,615 8,837 16,219 7,693 258,309 32,763 7,201 16,611 17,351 8,806Mymensingh 21800 11,751 48,454 54,380 271,816 94,998 33,006 28,942 15,717 30,121 54,854 26,306 880,182 111,837 24,459 56,707 59,271 30,045Joypurhat 30100 2,804 11,548 13,013 64,992 22,734 7,903 6,924 3,760 7,203 13,166 6,283 211,199 26,818 5,957 13,204 14,392 7,210Bogra 30200 8,948 36,616 41,400 207,069 72,353 25,129 22,046 11,962 22,924 41,831 20,027 672,881 85,605 18,801 42,023 45,547 22,972Naogaon 30300 6,086 25,153 28,281 141,215 49,404 17,177 15,044 8,171 15,650 28,643 13,643 458,772 58,231 13,050 28,686 31,484 15,655Natore 30400 4,082 16,823 18,954 94,619 33,107 11,511 10,082 5,477 10,491 19,176 9,148 307,579 39,035 8,805 19,234 21,246 10,499Nawabganj 30500 3,964 16,175 18,322 91,628 32,018 11,122 9,757 5,295 10,147 18,497 8,869 297,754 37,883 8,504 18,599 20,596 10,171Pabna 30600 5,727 23,495 26,542 133,144 46,380 16,116 14,130 7,671 14,697 26,821 12,831 433,249 55,199 12,362 26,949 29,883 14,727Sirajganj 30700 8,595 35,129 39,797 203,324 69,613 24,167 21,217 11,508 22,051 40,147 19,281 664,730 85,751 18,000 40,475 43,641 22,163Rajshahi 30800 10,513 42,981 48,671 243,256 85,021 29,551 25,902 14,069 26,956 49,127 23,538 791,349 100,571 22,617 49,425 54,702 27,014Dinajpur 40100 7,830 32,125 36,271 181,280 63,372 22,028 19,307 10,483 20,082 36,670 17,533 588,943 74,848 16,473 36,806 39,860 20,109Gaibandha 40200 4,996 20,461 23,149 115,616 40,434 14,056 12,317 6,691 12,820 23,374 11,189 376,116 47,767 10,519 23,506 25,450 12,843Kurigram 40300 4,761 19,438 22,037 110,052 38,487 13,382 11,726 6,371 12,207 22,231 10,660 358,046 45,474 10,015 22,380 24,248 12,233Lalmonirhat 40400 2,453 10,004 11,346 56,672 19,818 6,890 6,039 3,280 6,285 11,445 5,490 184,338 23,419 5,156 11,523 12,489 6,300Nilphamari 40500 4,207 17,148 19,443 97,222 33,971 11,804 10,353 5,620 10,770 19,618 9,413 316,056 40,202 8,832 19,741 21,411 10,797Panchagarh 40600 2,675 10,939 12,369 61,857 21,615 7,511 6,587 3,575 6,849 12,499 5,986 200,849 25,551 5,616 12,550 13,607 6,861Rangpur 40700 9,350 37,994 43,095 215,820 75,351 26,151 22,973 12,453 23,871 43,498 20,895 700,641 89,312 19,561 43,742 47,524 23,943Thakurgaon 40800 3,586 14,704 16,616 82,991 29,023 10,092 8,842 4,803 9,200 16,790 8,031 269,724 34,257 7,548 16,863 18,259 9,213Barguna 50100 2,000 8,092 9,265 46,225 16,177 5,626 4,928 2,678 5,132 9,343 4,479 150,511 18,909 4,360 9,183 10,714 5,143Barisal 50200 6,888 27,766 31,828 159,077 55,609 19,317 16,946 9,199 17,633 32,087 15,411 517,594 65,191 14,958 31,569 36,817 17,686Bhola 50300 4,117 16,645 19,068 95,124 33,290 11,582 10,141 5,514 10,563 19,225 9,220 309,679 38,899 8,974 18,898 22,050 10,585Jhalokati 50400 1,938 7,841 8,974 44,791 15,673 5,457 4,774 2,594 4,971 9,052 4,339 145,809 18,329 4,263 8,896 10,376 4,982Patuakhali 50500 3,731 15,075 17,272 86,207 30,163 10,487 9,189 4,993 9,568 17,413 8,353 280,699 35,283 8,128 17,123 19,982 9,592Pirojpur 50600 3,212 12,981 14,870 74,222 25,969 9,061 7,911 4,299 8,238 14,993 7,192 241,648 30,377 7,162 14,742 17,201 8,258Bagerhat 60100 4,523 18,284 20,938 104,513 36,568 12,759 11,140 6,053 11,599 21,115 10,126 340,242 42,775 10,089 20,758 23,915 11,627Chuadanga 60200 2,654 10,716 12,264 61,370 21,432 7,446 6,532 3,544 6,793 12,374 5,938 199,565 25,164 5,767 12,165 13,929 6,812Jessore 60300 8,975 36,141 41,393 207,460 72,368 25,181 22,061 11,961 22,930 41,757 20,065 674,290 85,190 19,744 41,078 47,035 23,008Jhenaida 60400 4,429 17,919 20,497 102,437 35,808 12,446 10,909 5,924 11,353 20,683 9,915 333,305 41,958 9,650 20,323 23,274 11,381Khulna 60500 11,264 45,401 51,979 261,140 90,885 31,665 27,705 15,020 28,794 52,442 25,193 849,369 107,460 24,945 51,584 59,069 28,898Kushtia 60600 5,356 21,613 24,718 123,836 43,214 14,999 13,172 7,142 13,690 24,952 11,976 402,358 50,818 11,577 24,587 28,063 13,731Magura 60700 1,981 8,011 9,170 45,806 16,018 5,566 4,880 2,650 5,079 9,250 4,436 149,087 18,758 4,307 9,092 10,417 5,093Meherpur 60800 1,493 6,025 6,904 34,485 12,061 4,193 3,675 1,996 3,825 6,961 3,342 112,210 14,121 3,251 6,861 7,845 3,835Narail 60900 1,602 6,478 7,421 37,028 12,959 4,505 3,948 2,145 4,111 7,482 3,588 120,578 15,152 3,493 7,356 8,432 4,121Satkhira 61000 5,154 20,801 23,820 119,078 41,620 14,513 12,683 6,885 13,195 24,026 11,532 387,302 48,791 11,451 23,625 27,060 13,232Habiganj 70100 4,402 18,571 20,568 102,454 35,905 12,496 10,923 5,942 11,377 20,855 9,889 323,856 41,005 9,029 20,275 21,739 11,040Moulvibazar 70200 4,556 19,452 21,368 106,426 37,308 12,989 11,345 6,170 11,807 21,758 10,247 336,064 42,518 9,384 21,051 22,522 11,443Sunamganj 70300 4,134 17,084 19,169 95,544 33,460 11,639 10,190 5,542 10,619 19,317 9,262 302,347 38,355 8,415 18,919 20,379 10,333Sylhet 70400 8,701 35,975 40,323 201,164 70,413 24,478 21,446 11,655 22,335 40,668 19,488 636,479 80,822 17,707 39,809 42,902 21,746Benapole Land Port 90001 1,061 7,139 6,709 20,293 13,955 5,510 3,678 1,772 4,839 7,867 1,702 1,148,281 340,618 102,983 258,545 103,921 133,861Bhomra Land Port 90002 1,014 6,822 6,412 19,393 13,337 5,265 3,515 1,694 4,625 7,518 1,627 1,097,390 325,522 98,418 247,087 99,315 127,928Mongla Sea Port 90003 0 0 0 0 0 0 0 0 0 0 0 951,300 282,187 85,317 214,193 86,094 110,898Hilli Land Port 90004 0 0 0 0 0 0 0 0 0 0 0 2,581,589 765,784 231,528 581,267 233,637 300,949Dhaka Airport 90005 0 0 0 0 0 0 0 0 0 0 0 0 0 0 0 0 0Chittagong Airport 90006 0 0 0 0 0 0 0 0 0 0 0 0 0 0 0 0 0Chittagong Sea Port 90007 346,297 2,329,934 2,189,793 6,623,207 4,554,805 1,798,253 1,200,402 578,410 1,579,435 2,567,628 555,514 14,991,325 4,446,916 1,344,484 3,375,427 1,356,736 1,747,617Payra Sea Port 90008 0 0 0 0 0 0 0 0 0 0 0 718,082 213,006 64,401 161,682 64,987 83,710Matarbari Sea Port 90009 168,558 1,134,079 1,065,866 3,223,799 2,217,019 875,287 584,287 281,537 768,779 1,249,775 270,393 7,296,921 2,164,505 654,418 1,642,965 660,382 850,640Akhaura Land port 90010 3,321 22,346 21,002 63,523 43,685 17,247 11,513 5,548 15,148 24,626 5,328 179,728 53,313 16,119 40,467 16,266 20,952Bibir Bazar Land Port 90011 1,549 10,423 9,796 29,628 20,375 8,044 5,370 2,587 7,065 11,486 2,485 41,914 12,433 3,759 9,437 3,793 4,886Ramgarh border crossing 90012 0 0 0 0 0 0 0 0 0 0 0 183,717 54,496 16,476 41,365 16,627 21,417Teknaf border crossing 90013 4,179 28,114 26,423 79,918 54,960 21,698 14,485 6,979 19,058 30,982 6,703 113,057 33,536 10,139 25,456 10,232 13,180
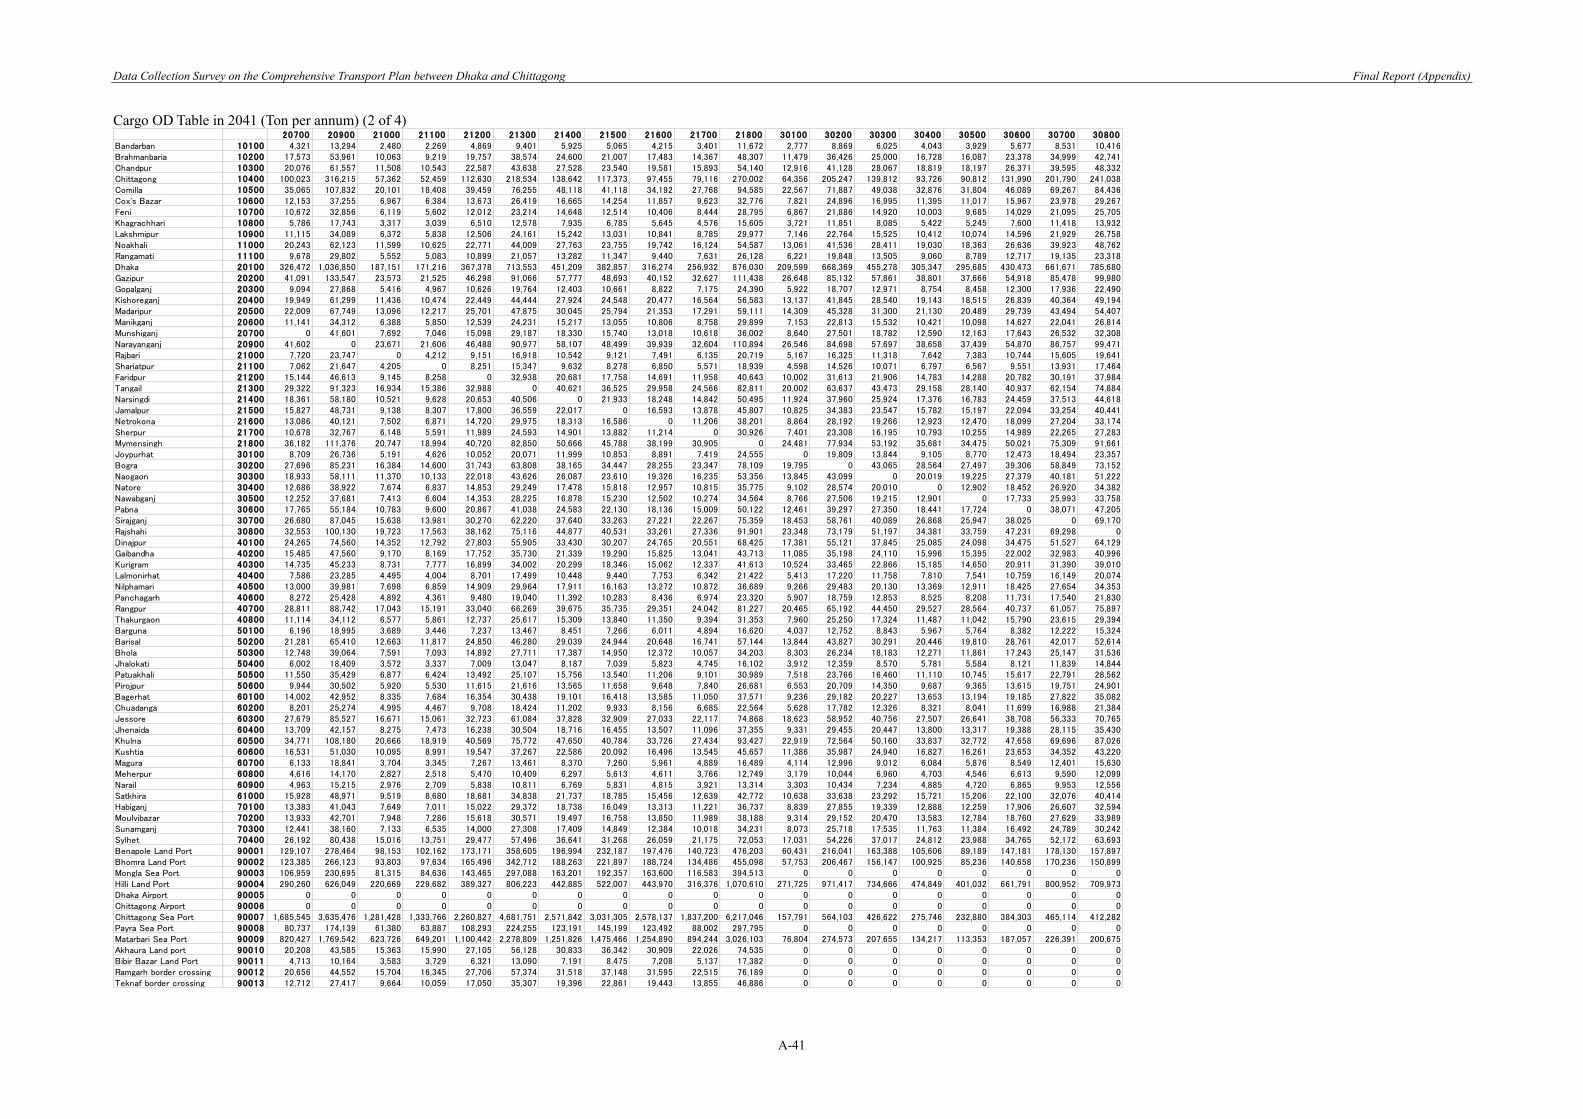
Data Collection Survey on the Comprehensive Transport Plan between Dhaka and Chittagong Final Report (Appendix)
A-41
Cargo OD Table in 2041 (Ton per annum) (2 of 4)
20700 20900 21000 21100 21200 21300 21400 21500 21600 21700 21800 30100 30200 30300 30400 30500 30600 30700 30800Bandarban 10100 4,321 13,294 2,480 2,269 4,869 9,401 5,925 5,065 4,215 3,401 11,672 2,777 8,869 6,025 4,043 3,929 5,677 8,531 10,416Brahmanbaria 10200 17,573 53,961 10,063 9,219 19,757 38,574 24,600 21,007 17,483 14,367 48,307 11,479 36,426 25,000 16,728 16,087 23,378 34,999 42,741Chandpur 10300 20,076 61,557 11,508 10,543 22,587 43,638 27,528 23,540 19,581 15,893 54,140 12,916 41,128 28,067 18,819 18,197 26,371 39,595 48,332Chittagong 10400 100,023 316,215 57,362 52,459 112,630 218,534 138,642 117,373 97,455 79,116 270,002 64,356 205,247 139,812 93,726 90,812 131,990 201,790 241,038Comilla 10500 35,065 107,832 20,101 18,408 39,459 76,255 48,118 41,118 34,192 27,768 94,585 22,567 71,887 49,038 32,876 31,804 46,089 69,267 84,436Cox's Bazar 10600 12,153 37,255 6,967 6,384 13,673 26,419 16,665 14,254 11,857 9,623 32,776 7,821 24,896 16,995 11,395 11,017 15,967 23,978 29,267Feni 10700 10,672 32,856 6,119 5,602 12,012 23,214 14,648 12,514 10,406 8,444 28,795 6,867 21,886 14,920 10,003 9,685 14,029 21,095 25,705Khagrachhari 10800 5,786 17,743 3,317 3,039 6,510 12,578 7,935 6,785 5,645 4,576 15,605 3,721 11,851 8,085 5,422 5,245 7,600 11,418 13,932Lakshmipur 10900 11,115 34,089 6,372 5,838 12,506 24,161 15,242 13,031 10,841 8,785 29,977 7,146 22,764 15,525 10,412 10,074 14,596 21,929 26,758Noakhali 11000 20,243 62,123 11,599 10,625 22,771 44,009 27,763 23,755 19,742 16,124 54,587 13,061 41,536 28,411 19,030 18,363 26,636 39,923 48,762Rangamati 11100 9,678 29,802 5,552 5,083 10,899 21,057 13,282 11,347 9,440 7,631 26,128 6,221 19,848 13,505 9,060 8,789 12,717 19,135 23,318Dhaka 20100 326,472 1,036,850 187,151 171,216 367,378 713,553 451,209 382,857 316,274 256,932 876,030 209,599 668,369 455,278 305,347 295,685 430,473 661,671 785,680Gazipur 20200 41,091 133,547 23,573 21,525 46,298 91,066 57,777 48,693 40,152 32,627 111,438 26,648 85,132 57,861 38,801 37,666 54,918 85,478 99,980Gopalganj 20300 9,094 27,868 5,416 4,967 10,626 19,764 12,403 10,661 8,822 7,175 24,390 5,922 18,707 12,971 8,754 8,458 12,300 17,936 22,490Kishoreganj 20400 19,949 61,299 11,436 10,474 22,449 44,444 27,924 24,548 20,477 16,564 56,583 13,137 41,845 28,540 19,143 18,515 26,839 40,364 49,194Madaripur 20500 22,009 67,749 13,096 12,217 25,701 47,875 30,045 25,794 21,353 17,291 59,111 14,309 45,328 31,300 21,130 20,489 29,739 43,494 54,407Manikganj 20600 11,141 34,312 6,388 5,850 12,539 24,231 15,217 13,055 10,806 8,758 29,899 7,153 22,813 15,532 10,421 10,098 14,627 22,041 26,814Munshiganj 20700 0 41,601 7,692 7,046 15,098 29,187 18,330 15,740 13,018 10,618 36,002 8,640 27,501 18,782 12,590 12,163 17,643 26,532 32,308Narayanganj 20900 41,602 0 23,671 21,606 46,488 90,977 58,107 48,499 39,939 32,604 110,894 26,546 84,698 57,697 38,658 37,439 54,870 86,757 99,471Rajbari 21000 7,720 23,747 0 4,212 9,151 16,918 10,542 9,121 7,491 6,135 20,719 5,167 16,325 11,318 7,642 7,383 10,744 15,605 19,641Shariatpur 21100 7,062 21,647 4,205 0 8,251 15,347 9,632 8,278 6,850 5,571 18,939 4,598 14,526 10,071 6,797 6,567 9,551 13,931 17,464Faridpur 21200 15,144 46,613 9,145 8,258 0 32,938 20,681 17,758 14,691 11,958 40,643 10,002 31,613 21,906 14,783 14,288 20,782 30,191 37,984Tangail 21300 29,322 91,323 16,934 15,386 32,988 0 40,621 36,525 29,958 24,566 82,811 20,002 63,637 43,473 29,158 28,140 40,937 62,154 74,884Narsingdi 21400 18,361 58,180 10,521 9,628 20,653 40,506 0 21,933 18,248 14,842 50,495 11,924 37,960 25,924 17,376 16,783 24,459 37,513 44,618Jamalpur 21500 15,827 48,731 9,138 8,307 17,800 36,559 22,017 0 16,593 13,878 45,807 10,825 34,383 23,547 15,782 15,197 22,094 33,254 40,441Netrokona 21600 13,086 40,121 7,502 6,871 14,720 29,975 18,313 16,586 0 11,206 38,201 8,864 28,192 19,266 12,923 12,470 18,099 27,204 33,174Sherpur 21700 10,678 32,767 6,148 5,591 11,989 24,593 14,901 13,882 11,214 0 30,926 7,401 23,308 16,195 10,793 10,255 14,989 22,265 27,283Mymensingh 21800 36,182 111,376 20,747 18,994 40,720 82,850 50,666 45,788 38,199 30,905 0 24,481 77,934 53,192 35,681 34,475 50,021 75,309 91,661Joypurhat 30100 8,709 26,736 5,191 4,626 10,052 20,071 11,999 10,853 8,891 7,419 24,555 0 19,809 13,844 9,105 8,770 12,473 18,494 23,357Bogra 30200 27,696 85,231 16,384 14,600 31,743 63,808 38,165 34,447 28,255 23,347 78,109 19,795 0 43,065 28,564 27,497 39,306 58,849 73,152Naogaon 30300 18,933 58,111 11,370 10,133 22,018 43,626 26,087 23,610 19,326 16,235 53,356 13,845 43,099 0 20,019 19,225 27,379 40,181 51,222Natore 30400 12,686 38,922 7,674 6,837 14,853 29,249 17,478 15,818 12,957 10,815 35,775 9,102 28,574 20,010 0 12,902 18,452 26,920 34,382Nawabganj 30500 12,252 37,681 7,413 6,604 14,353 28,225 16,878 15,230 12,502 10,274 34,564 8,766 27,506 19,215 12,901 0 17,733 25,993 33,758Pabna 30600 17,765 55,184 10,783 9,600 20,867 41,038 24,583 22,130 18,136 15,009 50,122 12,461 39,297 27,350 18,441 17,724 0 38,071 47,205Sirajganj 30700 26,680 87,045 15,638 13,981 30,270 62,220 37,640 33,263 27,221 22,267 75,359 18,453 58,761 40,089 26,868 25,947 38,025 0 69,170Rajshahi 30800 32,553 100,130 19,723 17,563 38,162 75,116 44,877 40,531 33,261 27,336 91,901 23,348 73,179 51,197 34,381 33,759 47,231 69,298 0Dinajpur 40100 24,265 74,560 14,352 12,792 27,803 55,905 33,430 30,207 24,765 20,551 68,425 17,381 55,121 37,845 25,085 24,098 34,475 51,527 64,129Gaibandha 40200 15,485 47,560 9,170 8,169 17,752 35,730 21,339 19,290 15,825 13,041 43,713 11,085 35,198 24,110 15,996 15,395 22,002 32,983 40,996Kurigram 40300 14,735 45,233 8,731 7,777 16,899 34,002 20,299 18,346 15,062 12,337 41,613 10,524 33,465 22,866 15,185 14,650 20,911 31,390 39,010Lalmonirhat 40400 7,586 23,285 4,495 4,004 8,701 17,499 10,448 9,440 7,753 6,342 21,422 5,413 17,220 11,758 7,810 7,541 10,759 16,149 20,074Nilphamari 40500 13,000 39,981 7,698 6,859 14,909 29,964 17,911 16,163 13,272 10,872 36,689 9,266 29,483 20,130 13,369 12,911 18,425 27,654 34,353Panchagarh 40600 8,272 25,428 4,892 4,361 9,480 19,040 11,392 10,283 8,436 6,974 23,320 5,907 18,759 12,853 8,525 8,208 11,731 17,540 21,830Rangpur 40700 28,811 88,742 17,043 15,191 33,040 66,269 39,675 35,735 29,351 24,042 81,227 20,465 65,192 44,450 29,527 28,564 40,737 61,057 75,897Thakurgaon 40800 11,114 34,112 6,577 5,861 12,737 25,617 15,309 13,840 11,350 9,394 31,353 7,960 25,250 17,324 11,487 11,042 15,790 23,615 29,394Barguna 50100 6,196 18,995 3,689 3,446 7,237 13,467 8,451 7,266 6,011 4,894 16,620 4,037 12,752 8,843 5,967 5,764 8,382 12,222 15,324Barisal 50200 21,281 65,410 12,663 11,817 24,850 46,280 29,039 24,944 20,648 16,741 57,144 13,844 43,827 30,291 20,446 19,810 28,761 42,017 52,614Bhola 50300 12,748 39,064 7,591 7,093 14,892 27,711 17,387 14,950 12,372 10,057 34,203 8,303 26,234 18,183 12,271 11,861 17,243 25,147 31,536Jhalokati 50400 6,002 18,409 3,572 3,337 7,009 13,047 8,187 7,039 5,823 4,745 16,102 3,912 12,359 8,570 5,781 5,584 8,121 11,839 14,844Patuakhali 50500 11,550 35,429 6,877 6,424 13,492 25,107 15,756 13,540 11,206 9,101 30,989 7,518 23,766 16,460 11,110 10,745 15,617 22,791 28,562Pirojpur 50600 9,944 30,502 5,920 5,530 11,615 21,616 13,565 11,658 9,648 7,840 26,681 6,553 20,709 14,350 9,687 9,365 13,615 19,751 24,901Bagerhat 60100 14,002 42,952 8,335 7,684 16,354 30,438 19,101 16,418 13,585 11,050 37,571 9,236 29,182 20,227 13,653 13,194 19,185 27,822 35,082Chuadanga 60200 8,201 25,274 4,995 4,467 9,708 18,424 11,202 9,933 8,156 6,685 22,564 5,628 17,782 12,326 8,321 8,041 11,699 16,988 21,384Jessore 60300 27,679 85,527 16,671 15,061 32,723 61,084 37,828 32,909 27,033 22,117 74,868 18,623 58,952 40,756 27,507 26,641 38,708 56,333 70,765Jhenaida 60400 13,709 42,157 8,275 7,473 16,238 30,504 18,716 16,455 13,507 11,096 37,355 9,331 29,455 20,447 13,800 13,317 19,388 28,115 35,430Khulna 60500 34,771 108,180 20,666 18,919 40,569 75,772 47,650 40,784 33,726 27,434 93,427 22,919 72,564 50,160 33,837 32,772 47,658 69,696 87,026Kushtia 60600 16,531 51,030 10,095 8,991 19,547 37,267 22,586 20,092 16,496 13,545 45,657 11,386 35,987 24,940 16,827 16,261 23,653 34,352 43,220Magura 60700 6,133 18,841 3,704 3,345 7,267 13,461 8,370 7,260 5,961 4,889 16,489 4,114 12,996 9,012 6,084 5,876 8,549 12,401 15,630Meherpur 60800 4,616 14,170 2,827 2,518 5,470 10,409 6,297 5,613 4,611 3,766 12,749 3,179 10,044 6,960 4,703 4,546 6,613 9,590 12,099Narail 60900 4,963 15,215 2,976 2,709 5,838 10,811 6,769 5,831 4,815 3,921 13,314 3,303 10,434 7,234 4,885 4,720 6,865 9,953 12,556Satkhira 61000 15,928 48,971 9,519 8,680 18,681 34,838 21,737 18,785 15,456 12,639 42,772 10,638 33,638 23,292 15,721 15,206 22,100 32,076 40,414Habiganj 70100 13,383 41,043 7,649 7,011 15,022 29,372 18,738 16,049 13,313 11,221 36,737 8,839 27,855 19,339 12,888 12,259 17,906 26,607 32,594Moulvibazar 70200 13,933 42,701 7,948 7,286 15,618 30,571 19,497 16,758 13,850 11,989 38,188 9,314 29,152 20,470 13,583 12,784 18,760 27,629 33,989Sunamganj 70300 12,441 38,160 7,133 6,535 14,000 27,308 17,409 14,849 12,384 10,018 34,231 8,073 25,718 17,535 11,763 11,384 16,492 24,789 30,242Sylhet 70400 26,192 80,438 15,016 13,751 29,477 57,496 36,641 31,268 26,059 21,175 72,053 17,031 54,226 37,017 24,812 23,988 34,765 52,172 63,693Benapole Land Port 90001 129,107 278,464 98,153 102,162 173,171 358,605 196,994 232,187 197,476 140,723 476,203 60,431 216,041 163,388 105,606 89,189 147,181 178,130 157,897Bhomra Land Port 90002 123,385 266,123 93,803 97,634 165,496 342,712 188,263 221,897 188,724 134,486 455,098 57,753 206,467 156,147 100,925 85,236 140,658 170,236 150,899Mongla Sea Port 90003 106,959 230,695 81,315 84,636 143,465 297,088 163,201 192,357 163,600 116,583 394,513 0 0 0 0 0 0 0 0Hilli Land Port 90004 290,260 626,049 220,669 229,682 389,327 806,223 442,885 522,007 443,970 316,376 1,070,610 271,725 971,417 734,666 474,849 401,032 661,791 800,952 709,973Dhaka Airport 90005 0 0 0 0 0 0 0 0 0 0 0 0 0 0 0 0 0 0 0Chittagong Airport 90006 0 0 0 0 0 0 0 0 0 0 0 0 0 0 0 0 0 0 0Chittagong Sea Port 90007 1,685,545 3,635,476 1,281,428 1,333,766 2,260,827 4,681,751 2,571,842 3,031,305 2,578,137 1,837,200 6,217,046 157,791 564,103 426,622 275,746 232,880 384,303 465,114 412,282Payra Sea Port 90008 80,737 174,139 61,380 63,887 108,293 224,255 123,191 145,199 123,492 88,002 297,795 0 0 0 0 0 0 0 0Matarbari Sea Port 90009 820,427 1,769,542 623,726 649,201 1,100,442 2,278,809 1,251,826 1,475,466 1,254,890 894,244 3,026,103 76,804 274,573 207,655 134,217 113,353 187,057 226,391 200,675Akhaura Land port 90010 20,208 43,585 15,363 15,990 27,105 56,128 30,833 36,342 30,909 22,026 74,535 0 0 0 0 0 0 0 0Bibir Bazar Land Port 90011 4,713 10,164 3,583 3,729 6,321 13,090 7,191 8,475 7,208 5,137 17,382 0 0 0 0 0 0 0 0Ramgarh border crossing 90012 20,656 44,552 15,704 16,345 27,706 57,374 31,518 37,148 31,595 22,515 76,189 0 0 0 0 0 0 0 0Teknaf border crossing 90013 12,712 27,417 9,664 10,059 17,050 35,307 19,396 22,861 19,443 13,855 46,886 0 0 0 0 0 0 0 0
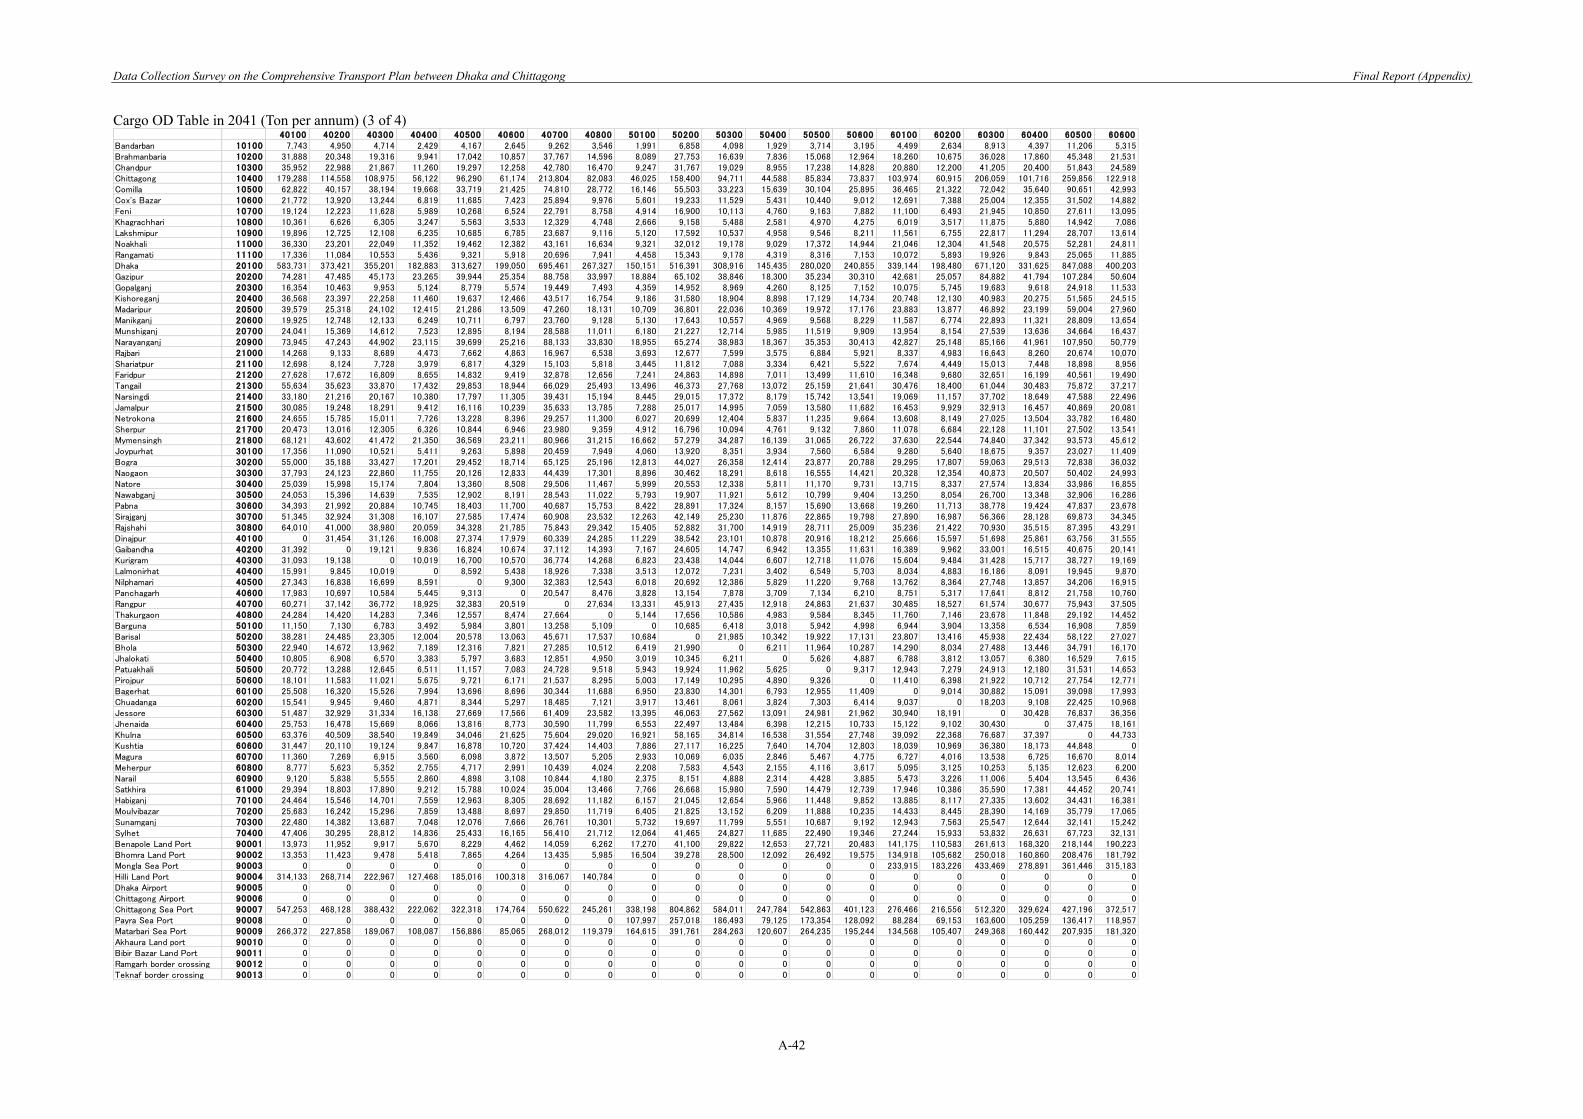
Data Collection Survey on the Comprehensive Transport Plan between Dhaka and Chittagong Final Report (Appendix)
A-42
Cargo OD Table in 2041 (Ton per annum) (3 of 4)
40100 40200 40300 40400 40500 40600 40700 40800 50100 50200 50300 50400 50500 50600 60100 60200 60300 60400 60500 60600Bandarban 10100 7,743 4,950 4,714 2,429 4,167 2,645 9,262 3,546 1,991 6,858 4,098 1,929 3,714 3,195 4,499 2,634 8,913 4,397 11,206 5,315Brahmanbaria 10200 31,888 20,348 19,316 9,941 17,042 10,857 37,767 14,596 8,089 27,753 16,639 7,836 15,068 12,964 18,260 10,675 36,028 17,860 45,348 21,531Chandpur 10300 35,952 22,988 21,867 11,260 19,297 12,258 42,780 16,470 9,247 31,767 19,029 8,955 17,238 14,828 20,880 12,200 41,205 20,400 51,843 24,589Chittagong 10400 179,288 114,558 108,975 56,122 96,290 61,174 213,804 82,083 46,025 158,400 94,711 44,588 85,834 73,837 103,974 60,915 206,059 101,716 259,856 122,918Comilla 10500 62,822 40,157 38,194 19,668 33,719 21,425 74,810 28,772 16,146 55,503 33,223 15,639 30,104 25,895 36,465 21,322 72,042 35,640 90,651 42,993Cox's Bazar 10600 21,772 13,920 13,244 6,819 11,685 7,423 25,894 9,976 5,601 19,233 11,529 5,431 10,440 9,012 12,691 7,388 25,004 12,355 31,502 14,882Feni 10700 19,124 12,223 11,628 5,989 10,268 6,524 22,791 8,758 4,914 16,900 10,113 4,760 9,163 7,882 11,100 6,493 21,945 10,850 27,611 13,095Khagrachhari 10800 10,361 6,626 6,305 3,247 5,563 3,533 12,329 4,748 2,666 9,158 5,488 2,581 4,970 4,275 6,019 3,517 11,875 5,880 14,942 7,086Lakshmipur 10900 19,896 12,725 12,108 6,235 10,685 6,785 23,687 9,116 5,120 17,592 10,537 4,958 9,546 8,211 11,561 6,755 22,817 11,294 28,707 13,614Noakhali 11000 36,330 23,201 22,049 11,352 19,462 12,382 43,161 16,634 9,321 32,012 19,178 9,029 17,372 14,944 21,046 12,304 41,548 20,575 52,281 24,811Rangamati 11100 17,336 11,084 10,553 5,436 9,321 5,918 20,696 7,941 4,458 15,343 9,178 4,319 8,316 7,153 10,072 5,893 19,926 9,843 25,065 11,885Dhaka 20100 583,731 373,421 355,201 182,883 313,627 199,050 695,461 267,327 150,151 516,391 308,916 145,435 280,020 240,855 339,144 198,480 671,120 331,625 847,088 400,203Gazipur 20200 74,281 47,485 45,173 23,265 39,944 25,354 88,758 33,997 18,884 65,102 38,846 18,300 35,234 30,310 42,681 25,057 84,882 41,794 107,284 50,604Gopalganj 20300 16,354 10,463 9,953 5,124 8,779 5,574 19,449 7,493 4,359 14,952 8,969 4,260 8,125 7,152 10,075 5,745 19,683 9,618 24,918 11,533Kishoreganj 20400 36,568 23,397 22,258 11,460 19,637 12,466 43,517 16,754 9,186 31,580 18,904 8,898 17,129 14,734 20,748 12,130 40,983 20,275 51,565 24,515Madaripur 20500 39,579 25,318 24,102 12,415 21,286 13,509 47,260 18,131 10,709 36,801 22,036 10,369 19,972 17,176 23,883 13,877 46,892 23,199 59,004 27,960Manikganj 20600 19,925 12,748 12,133 6,249 10,711 6,797 23,760 9,128 5,130 17,643 10,557 4,969 9,568 8,229 11,587 6,774 22,893 11,321 28,809 13,654Munshiganj 20700 24,041 15,369 14,612 7,523 12,895 8,194 28,588 11,011 6,180 21,227 12,714 5,985 11,519 9,909 13,954 8,154 27,539 13,636 34,664 16,437Narayanganj 20900 73,945 47,243 44,902 23,115 39,699 25,216 88,133 33,830 18,955 65,274 38,983 18,367 35,353 30,413 42,827 25,148 85,166 41,961 107,950 50,779Rajbari 21000 14,268 9,133 8,689 4,473 7,662 4,863 16,967 6,538 3,693 12,677 7,599 3,575 6,884 5,921 8,337 4,983 16,643 8,260 20,674 10,070Shariatpur 21100 12,698 8,124 7,728 3,979 6,817 4,329 15,103 5,818 3,445 11,812 7,088 3,334 6,421 5,522 7,674 4,449 15,013 7,448 18,898 8,956Faridpur 21200 27,628 17,672 16,809 8,655 14,832 9,419 32,878 12,656 7,241 24,863 14,898 7,011 13,499 11,610 16,348 9,680 32,651 16,199 40,561 19,490Tangail 21300 55,634 35,623 33,870 17,432 29,853 18,944 66,029 25,493 13,496 46,373 27,768 13,072 25,159 21,641 30,476 18,400 61,044 30,483 75,872 37,217Narsingdi 21400 33,180 21,216 20,167 10,380 17,797 11,305 39,431 15,194 8,445 29,015 17,372 8,179 15,742 13,541 19,069 11,157 37,702 18,649 47,588 22,496Jamalpur 21500 30,085 19,248 18,291 9,412 16,116 10,239 35,633 13,785 7,288 25,017 14,995 7,059 13,580 11,682 16,453 9,929 32,913 16,457 40,869 20,081Netrokona 21600 24,655 15,785 15,011 7,726 13,228 8,396 29,257 11,300 6,027 20,699 12,404 5,837 11,235 9,664 13,608 8,149 27,025 13,504 33,782 16,480Sherpur 21700 20,473 13,016 12,305 6,326 10,844 6,946 23,980 9,359 4,912 16,796 10,094 4,761 9,132 7,860 11,078 6,684 22,128 11,101 27,502 13,541Mymensingh 21800 68,121 43,602 41,472 21,350 36,569 23,211 80,966 31,215 16,662 57,279 34,287 16,139 31,065 26,722 37,630 22,544 74,840 37,342 93,573 45,612Joypurhat 30100 17,356 11,090 10,521 5,411 9,263 5,898 20,459 7,949 4,060 13,920 8,351 3,934 7,560 6,584 9,280 5,640 18,675 9,357 23,027 11,409Bogra 30200 55,000 35,188 33,427 17,201 29,452 18,714 65,125 25,196 12,813 44,027 26,358 12,414 23,877 20,788 29,295 17,807 59,063 29,513 72,838 36,032Naogaon 30300 37,793 24,123 22,860 11,755 20,126 12,833 44,439 17,301 8,896 30,462 18,291 8,618 16,555 14,421 20,328 12,354 40,873 20,507 50,402 24,993Natore 30400 25,039 15,998 15,174 7,804 13,360 8,508 29,506 11,467 5,999 20,553 12,338 5,811 11,170 9,731 13,715 8,337 27,574 13,834 33,986 16,855Nawabganj 30500 24,053 15,396 14,639 7,535 12,902 8,191 28,543 11,022 5,793 19,907 11,921 5,612 10,799 9,404 13,250 8,054 26,700 13,348 32,906 16,286Pabna 30600 34,393 21,992 20,884 10,745 18,403 11,700 40,687 15,753 8,422 28,891 17,324 8,157 15,690 13,668 19,260 11,713 38,778 19,424 47,837 23,678Sirajganj 30700 51,345 32,924 31,308 16,107 27,585 17,474 60,908 23,532 12,263 42,149 25,230 11,876 22,865 19,798 27,890 16,987 56,366 28,128 69,873 34,345Rajshahi 30800 64,010 41,000 38,980 20,059 34,328 21,785 75,843 29,342 15,405 52,882 31,700 14,919 28,711 25,009 35,236 21,422 70,930 35,515 87,395 43,291Dinajpur 40100 0 31,454 31,126 16,008 27,374 17,979 60,339 24,285 11,229 38,542 23,101 10,878 20,916 18,212 25,666 15,597 51,698 25,861 63,756 31,555Gaibandha 40200 31,392 0 19,121 9,836 16,824 10,674 37,112 14,393 7,167 24,605 14,747 6,942 13,355 11,631 16,389 9,962 33,001 16,515 40,675 20,141Kurigram 40300 31,093 19,138 0 10,019 16,700 10,570 36,774 14,268 6,823 23,438 14,044 6,607 12,718 11,076 15,604 9,484 31,428 15,717 38,727 19,169Lalmonirhat 40400 15,991 9,845 10,019 0 8,592 5,438 18,926 7,338 3,513 12,072 7,231 3,402 6,549 5,703 8,034 4,883 16,186 8,091 19,945 9,870Nilphamari 40500 27,343 16,838 16,699 8,591 0 9,300 32,383 12,543 6,018 20,692 12,386 5,829 11,220 9,768 13,762 8,364 27,748 13,857 34,206 16,915Panchagarh 40600 17,983 10,697 10,584 5,445 9,313 0 20,547 8,476 3,828 13,154 7,878 3,709 7,134 6,210 8,751 5,317 17,641 8,812 21,758 10,760Rangpur 40700 60,271 37,142 36,772 18,925 32,383 20,519 0 27,634 13,331 45,913 27,435 12,918 24,863 21,637 30,485 18,527 61,574 30,677 75,943 37,505Thakurgaon 40800 24,284 14,420 14,283 7,346 12,557 8,474 27,664 0 5,144 17,656 10,586 4,983 9,584 8,345 11,760 7,146 23,678 11,848 29,192 14,452Barguna 50100 11,150 7,130 6,783 3,492 5,984 3,801 13,258 5,109 0 10,685 6,418 3,018 5,942 4,998 6,944 3,904 13,358 6,534 16,908 7,859Barisal 50200 38,281 24,485 23,305 12,004 20,578 13,063 45,671 17,537 10,684 0 21,985 10,342 19,922 17,131 23,807 13,416 45,938 22,434 58,122 27,027Bhola 50300 22,940 14,672 13,962 7,189 12,316 7,821 27,285 10,512 6,419 21,990 0 6,211 11,964 10,287 14,290 8,034 27,488 13,446 34,791 16,170Jhalokati 50400 10,805 6,908 6,570 3,383 5,797 3,683 12,851 4,950 3,019 10,345 6,211 0 5,626 4,887 6,788 3,812 13,057 6,380 16,529 7,615Patuakhali 50500 20,772 13,288 12,645 6,511 11,157 7,083 24,728 9,518 5,943 19,924 11,962 5,625 0 9,317 12,943 7,279 24,913 12,180 31,531 14,653Pirojpur 50600 18,101 11,583 11,021 5,675 9,721 6,171 21,537 8,295 5,003 17,149 10,295 4,890 9,326 0 11,410 6,398 21,922 10,712 27,754 12,771Bagerhat 60100 25,508 16,320 15,526 7,994 13,696 8,696 30,344 11,688 6,950 23,830 14,301 6,793 12,955 11,409 0 9,014 30,882 15,091 39,098 17,993Chuadanga 60200 15,541 9,945 9,460 4,871 8,344 5,297 18,485 7,121 3,917 13,461 8,061 3,824 7,303 6,414 9,037 0 18,203 9,108 22,425 10,968Jessore 60300 51,487 32,929 31,334 16,138 27,669 17,566 61,409 23,582 13,395 46,063 27,562 13,091 24,981 21,962 30,940 18,191 0 30,428 76,837 36,356Jhenaida 60400 25,753 16,478 15,669 8,066 13,816 8,773 30,590 11,799 6,553 22,497 13,484 6,398 12,215 10,733 15,122 9,102 30,430 0 37,475 18,161Khulna 60500 63,376 40,509 38,540 19,849 34,046 21,625 75,604 29,020 16,921 58,165 34,814 16,538 31,554 27,748 39,092 22,368 76,687 37,397 0 44,733Kushtia 60600 31,447 20,110 19,124 9,847 16,878 10,720 37,424 14,403 7,886 27,117 16,225 7,640 14,704 12,803 18,039 10,969 36,380 18,173 44,848 0Magura 60700 11,360 7,269 6,915 3,560 6,098 3,872 13,507 5,205 2,933 10,069 6,035 2,846 5,467 4,775 6,727 4,016 13,538 6,725 16,670 8,014Meherpur 60800 8,777 5,623 5,352 2,755 4,717 2,991 10,439 4,024 2,208 7,583 4,543 2,155 4,116 3,617 5,095 3,125 10,253 5,135 12,623 6,200Narail 60900 9,120 5,838 5,555 2,860 4,898 3,108 10,844 4,180 2,375 8,151 4,888 2,314 4,428 3,885 5,473 3,226 11,006 5,404 13,545 6,436Satkhira 61000 29,394 18,803 17,890 9,212 15,788 10,024 35,004 13,466 7,766 26,668 15,980 7,590 14,479 12,739 17,946 10,386 35,590 17,381 44,452 20,741Habiganj 70100 24,464 15,546 14,701 7,559 12,963 8,305 28,692 11,182 6,157 21,045 12,654 5,966 11,448 9,852 13,885 8,117 27,335 13,602 34,431 16,381Moulvibazar 70200 25,683 16,242 15,296 7,859 13,488 8,697 29,850 11,719 6,405 21,825 13,152 6,209 11,888 10,235 14,433 8,445 28,390 14,169 35,779 17,065Sunamganj 70300 22,480 14,382 13,687 7,048 12,076 7,666 26,761 10,301 5,732 19,697 11,799 5,551 10,687 9,192 12,943 7,563 25,547 12,644 32,141 15,242Sylhet 70400 47,406 30,295 28,812 14,836 25,433 16,165 56,410 21,712 12,064 41,465 24,827 11,685 22,490 19,346 27,244 15,933 53,832 26,631 67,723 32,131Benapole Land Port 90001 13,973 11,952 9,917 5,670 8,229 4,462 14,059 6,262 17,270 41,100 29,822 12,653 27,721 20,483 141,175 110,583 261,613 168,320 218,144 190,223Bhomra Land Port 90002 13,353 11,423 9,478 5,418 7,865 4,264 13,435 5,985 16,504 39,278 28,500 12,092 26,492 19,575 134,918 105,682 250,018 160,860 208,476 181,792Mongla Sea Port 90003 0 0 0 0 0 0 0 0 0 0 0 0 0 0 233,915 183,226 433,469 278,891 361,446 315,183Hilli Land Port 90004 314,133 268,714 222,967 127,468 185,016 100,318 316,067 140,784 0 0 0 0 0 0 0 0 0 0 0 0Dhaka Airport 90005 0 0 0 0 0 0 0 0 0 0 0 0 0 0 0 0 0 0 0 0Chittagong Airport 90006 0 0 0 0 0 0 0 0 0 0 0 0 0 0 0 0 0 0 0 0Chittagong Sea Port 90007 547,253 468,128 388,432 222,062 322,318 174,764 550,622 245,261 338,198 804,862 584,011 247,784 542,863 401,123 276,466 216,556 512,320 329,624 427,196 372,517Payra Sea Port 90008 0 0 0 0 0 0 0 0 107,997 257,018 186,493 79,125 173,354 128,092 88,284 69,153 163,600 105,259 136,417 118,957Matarbari Sea Port 90009 266,372 227,858 189,067 108,087 156,886 85,065 268,012 119,379 164,615 391,761 284,263 120,607 264,235 195,244 134,568 105,407 249,368 160,442 207,935 181,320Akhaura Land port 90010 0 0 0 0 0 0 0 0 0 0 0 0 0 0 0 0 0 0 0 0Bibir Bazar Land Port 90011 0 0 0 0 0 0 0 0 0 0 0 0 0 0 0 0 0 0 0 0Ramgarh border crossing 90012 0 0 0 0 0 0 0 0 0 0 0 0 0 0 0 0 0 0 0 0Teknaf border crossing 90013 0 0 0 0 0 0 0 0 0 0 0 0 0 0 0 0 0 0 0 0
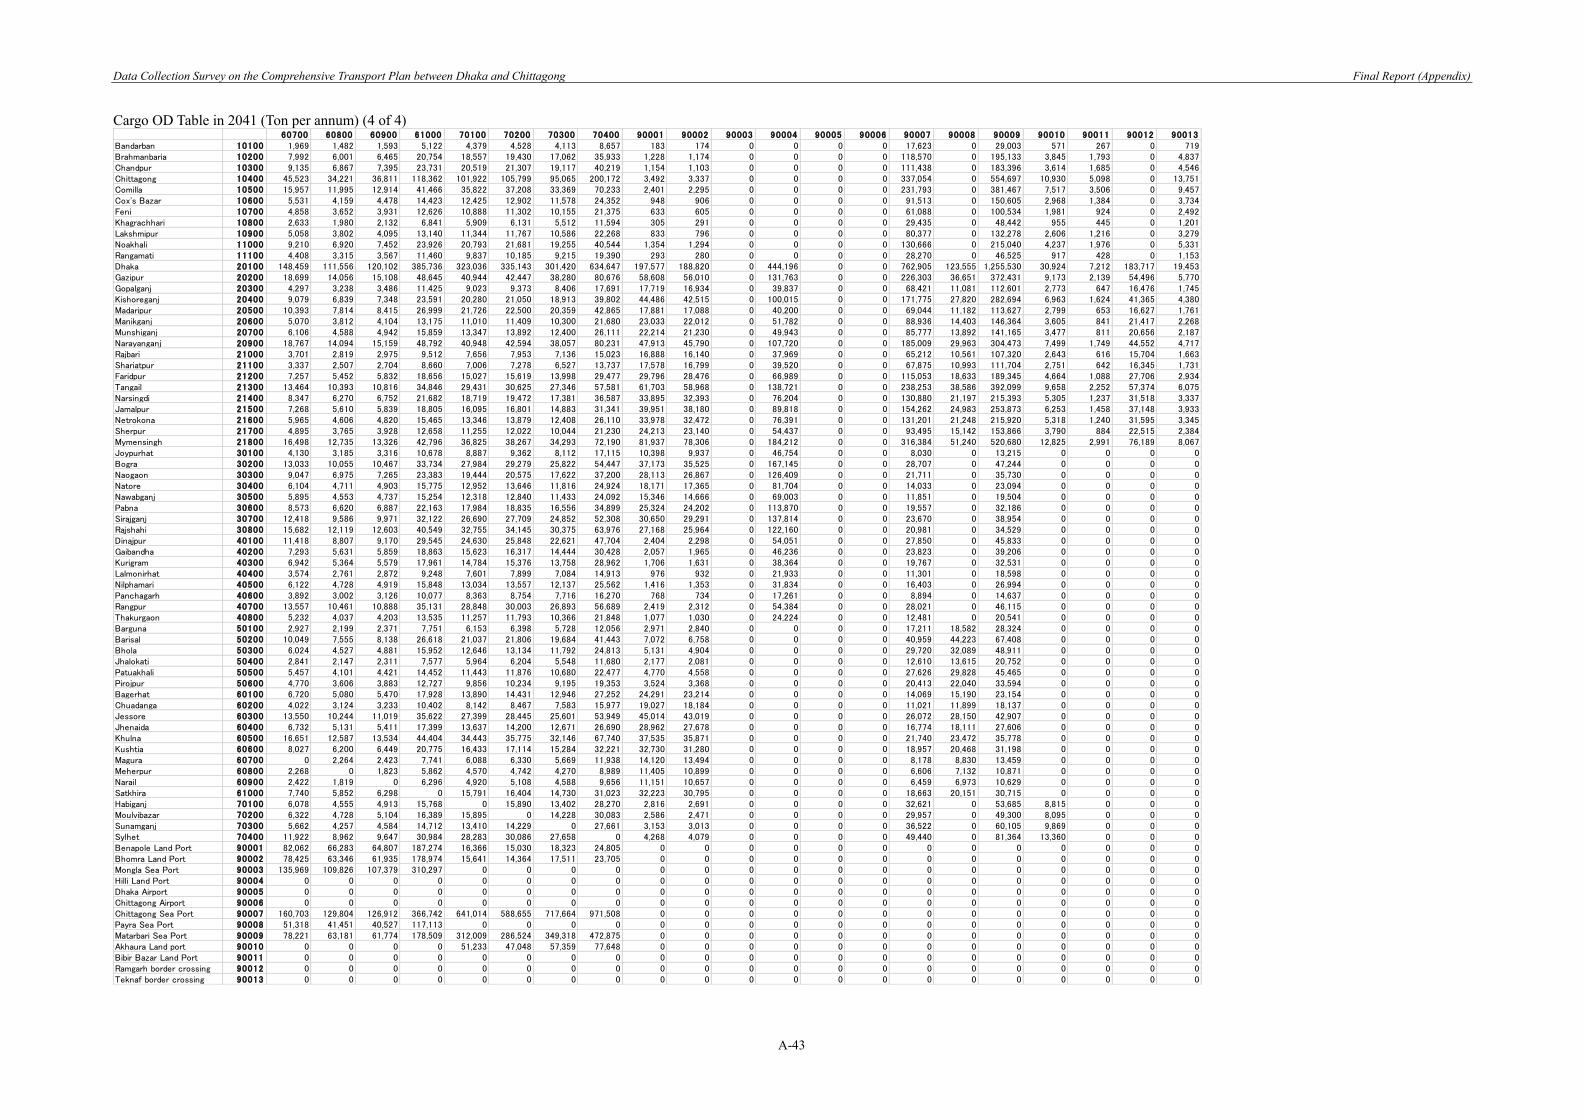
Data Collection Survey on the Comprehensive Transport Plan between Dhaka and Chittagong Final Report (Appendix)
A-43
Cargo OD Table in 2041 (Ton per annum) (4 of 4)
60700 60800 60900 61000 70100 70200 70300 70400 90001 90002 90003 90004 90005 90006 90007 90008 90009 90010 90011 90012 90013Bandarban 10100 1,969 1,482 1,593 5,122 4,379 4,528 4,113 8,657 183 174 0 0 0 0 17,623 0 29,003 571 267 0 719Brahmanbaria 10200 7,992 6,001 6,465 20,754 18,557 19,430 17,062 35,933 1,228 1,174 0 0 0 0 118,570 0 195,133 3,845 1,793 0 4,837Chandpur 10300 9,135 6,867 7,395 23,731 20,519 21,307 19,117 40,219 1,154 1,103 0 0 0 0 111,438 0 183,396 3,614 1,685 0 4,546Chittagong 10400 45,523 34,221 36,811 118,362 101,922 105,799 95,065 200,172 3,492 3,337 0 0 0 0 337,054 0 554,697 10,930 5,098 0 13,751Comilla 10500 15,957 11,995 12,914 41,466 35,822 37,208 33,369 70,233 2,401 2,295 0 0 0 0 231,793 0 381,467 7,517 3,506 0 9,457Cox's Bazar 10600 5,531 4,159 4,478 14,423 12,425 12,902 11,578 24,352 948 906 0 0 0 0 91,513 0 150,605 2,968 1,384 0 3,734Feni 10700 4,858 3,652 3,931 12,626 10,888 11,302 10,155 21,375 633 605 0 0 0 0 61,088 0 100,534 1,981 924 0 2,492Khagrachhari 10800 2,633 1,980 2,132 6,841 5,909 6,131 5,512 11,594 305 291 0 0 0 0 29,435 0 48,442 955 445 0 1,201Lakshmipur 10900 5,058 3,802 4,095 13,140 11,344 11,767 10,586 22,268 833 796 0 0 0 0 80,377 0 132,278 2,606 1,216 0 3,279Noakhali 11000 9,210 6,920 7,452 23,926 20,793 21,681 19,255 40,544 1,354 1,294 0 0 0 0 130,666 0 215,040 4,237 1,976 0 5,331Rangamati 11100 4,408 3,315 3,567 11,460 9,837 10,185 9,215 19,390 293 280 0 0 0 0 28,270 0 46,525 917 428 0 1,153Dhaka 20100 148,459 111,556 120,102 385,736 323,036 335,143 301,420 634,647 197,577 188,820 0 444,196 0 0 762,905 123,555 1,255,530 30,924 7,212 183,717 19,453Gazipur 20200 18,699 14,056 15,108 48,645 40,944 42,447 38,280 80,676 58,608 56,010 0 131,763 0 0 226,303 36,651 372,431 9,173 2,139 54,496 5,770Gopalganj 20300 4,297 3,238 3,486 11,425 9,023 9,373 8,406 17,691 17,719 16,934 0 39,837 0 0 68,421 11,081 112,601 2,773 647 16,476 1,745Kishoreganj 20400 9,079 6,839 7,348 23,591 20,280 21,050 18,913 39,802 44,486 42,515 0 100,015 0 0 171,775 27,820 282,694 6,963 1,624 41,365 4,380Madaripur 20500 10,393 7,814 8,415 26,999 21,726 22,500 20,359 42,865 17,881 17,088 0 40,200 0 0 69,044 11,182 113,627 2,799 653 16,627 1,761Manikganj 20600 5,070 3,812 4,104 13,175 11,010 11,409 10,300 21,680 23,033 22,012 0 51,782 0 0 88,936 14,403 146,364 3,605 841 21,417 2,268Munshiganj 20700 6,106 4,588 4,942 15,859 13,347 13,892 12,400 26,111 22,214 21,230 0 49,943 0 0 85,777 13,892 141,165 3,477 811 20,656 2,187Narayanganj 20900 18,767 14,094 15,159 48,792 40,948 42,594 38,057 80,231 47,913 45,790 0 107,720 0 0 185,009 29,963 304,473 7,499 1,749 44,552 4,717Rajbari 21000 3,701 2,819 2,975 9,512 7,656 7,953 7,136 15,023 16,888 16,140 0 37,969 0 0 65,212 10,561 107,320 2,643 616 15,704 1,663Shariatpur 21100 3,337 2,507 2,704 8,660 7,006 7,278 6,527 13,737 17,578 16,799 0 39,520 0 0 67,875 10,993 111,704 2,751 642 16,345 1,731Faridpur 21200 7,257 5,452 5,832 18,656 15,027 15,619 13,998 29,477 29,796 28,476 0 66,989 0 0 115,053 18,633 189,345 4,664 1,088 27,706 2,934Tangail 21300 13,464 10,393 10,816 34,846 29,431 30,625 27,346 57,581 61,703 58,968 0 138,721 0 0 238,253 38,586 392,099 9,658 2,252 57,374 6,075Narsingdi 21400 8,347 6,270 6,752 21,682 18,719 19,472 17,381 36,587 33,895 32,393 0 76,204 0 0 130,880 21,197 215,393 5,305 1,237 31,518 3,337Jamalpur 21500 7,268 5,610 5,839 18,805 16,095 16,801 14,883 31,341 39,951 38,180 0 89,818 0 0 154,262 24,983 253,873 6,253 1,458 37,148 3,933Netrokona 21600 5,965 4,606 4,820 15,465 13,346 13,879 12,408 26,110 33,978 32,472 0 76,391 0 0 131,201 21,248 215,920 5,318 1,240 31,595 3,345Sherpur 21700 4,895 3,765 3,928 12,658 11,255 12,022 10,044 21,230 24,213 23,140 0 54,437 0 0 93,495 15,142 153,866 3,790 884 22,515 2,384Mymensingh 21800 16,498 12,735 13,326 42,796 36,825 38,267 34,293 72,190 81,937 78,306 0 184,212 0 0 316,384 51,240 520,680 12,825 2,991 76,189 8,067Joypurhat 30100 4,130 3,185 3,316 10,678 8,887 9,362 8,112 17,115 10,398 9,937 0 46,754 0 0 8,030 0 13,215 0 0 0 0Bogra 30200 13,033 10,055 10,467 33,734 27,984 29,279 25,822 54,447 37,173 35,525 0 167,145 0 0 28,707 0 47,244 0 0 0 0Naogaon 30300 9,047 6,975 7,265 23,383 19,444 20,575 17,622 37,200 28,113 26,867 0 126,409 0 0 21,711 0 35,730 0 0 0 0Natore 30400 6,104 4,711 4,903 15,775 12,952 13,646 11,816 24,924 18,171 17,365 0 81,704 0 0 14,033 0 23,094 0 0 0 0Nawabganj 30500 5,895 4,553 4,737 15,254 12,318 12,840 11,433 24,092 15,346 14,666 0 69,003 0 0 11,851 0 19,504 0 0 0 0Pabna 30600 8,573 6,620 6,887 22,163 17,984 18,835 16,556 34,899 25,324 24,202 0 113,870 0 0 19,557 0 32,186 0 0 0 0Sirajganj 30700 12,418 9,586 9,971 32,122 26,690 27,709 24,852 52,308 30,650 29,291 0 137,814 0 0 23,670 0 38,954 0 0 0 0Rajshahi 30800 15,682 12,119 12,603 40,549 32,755 34,145 30,375 63,976 27,168 25,964 0 122,160 0 0 20,981 0 34,529 0 0 0 0Dinajpur 40100 11,418 8,807 9,170 29,545 24,630 25,848 22,621 47,704 2,404 2,298 0 54,051 0 0 27,850 0 45,833 0 0 0 0Gaibandha 40200 7,293 5,631 5,859 18,863 15,623 16,317 14,444 30,428 2,057 1,965 0 46,236 0 0 23,823 0 39,206 0 0 0 0Kurigram 40300 6,942 5,364 5,579 17,961 14,784 15,376 13,758 28,962 1,706 1,631 0 38,364 0 0 19,767 0 32,531 0 0 0 0Lalmonirhat 40400 3,574 2,761 2,872 9,248 7,601 7,899 7,084 14,913 976 932 0 21,933 0 0 11,301 0 18,598 0 0 0 0Nilphamari 40500 6,122 4,728 4,919 15,848 13,034 13,557 12,137 25,562 1,416 1,353 0 31,834 0 0 16,403 0 26,994 0 0 0 0Panchagarh 40600 3,892 3,002 3,126 10,077 8,363 8,754 7,716 16,270 768 734 0 17,261 0 0 8,894 0 14,637 0 0 0 0Rangpur 40700 13,557 10,461 10,888 35,131 28,848 30,003 26,893 56,689 2,419 2,312 0 54,384 0 0 28,021 0 46,115 0 0 0 0Thakurgaon 40800 5,232 4,037 4,203 13,535 11,257 11,793 10,366 21,848 1,077 1,030 0 24,224 0 0 12,481 0 20,541 0 0 0 0Barguna 50100 2,927 2,199 2,371 7,751 6,153 6,398 5,728 12,056 2,971 2,840 0 0 0 0 17,211 18,582 28,324 0 0 0 0Barisal 50200 10,049 7,555 8,138 26,618 21,037 21,806 19,684 41,443 7,072 6,758 0 0 0 0 40,959 44,223 67,408 0 0 0 0Bhola 50300 6,024 4,527 4,881 15,952 12,646 13,134 11,792 24,813 5,131 4,904 0 0 0 0 29,720 32,089 48,911 0 0 0 0Jhalokati 50400 2,841 2,147 2,311 7,577 5,964 6,204 5,548 11,680 2,177 2,081 0 0 0 0 12,610 13,615 20,752 0 0 0 0Patuakhali 50500 5,457 4,101 4,421 14,452 11,443 11,876 10,680 22,477 4,770 4,558 0 0 0 0 27,626 29,828 45,465 0 0 0 0Pirojpur 50600 4,770 3,606 3,883 12,727 9,856 10,234 9,195 19,353 3,524 3,368 0 0 0 0 20,413 22,040 33,594 0 0 0 0Bagerhat 60100 6,720 5,080 5,470 17,928 13,890 14,431 12,946 27,252 24,291 23,214 0 0 0 0 14,069 15,190 23,154 0 0 0 0Chuadanga 60200 4,022 3,124 3,233 10,402 8,142 8,467 7,583 15,977 19,027 18,184 0 0 0 0 11,021 11,899 18,137 0 0 0 0Jessore 60300 13,550 10,244 11,019 35,622 27,399 28,445 25,601 53,949 45,014 43,019 0 0 0 0 26,072 28,150 42,907 0 0 0 0Jhenaida 60400 6,732 5,131 5,411 17,399 13,637 14,200 12,671 26,690 28,962 27,678 0 0 0 0 16,774 18,111 27,606 0 0 0 0Khulna 60500 16,651 12,587 13,534 44,404 34,443 35,775 32,146 67,740 37,535 35,871 0 0 0 0 21,740 23,472 35,778 0 0 0 0Kushtia 60600 8,027 6,200 6,449 20,775 16,433 17,114 15,284 32,221 32,730 31,280 0 0 0 0 18,957 20,468 31,198 0 0 0 0Magura 60700 0 2,264 2,423 7,741 6,088 6,330 5,669 11,938 14,120 13,494 0 0 0 0 8,178 8,830 13,459 0 0 0 0Meherpur 60800 2,268 0 1,823 5,862 4,570 4,742 4,270 8,989 11,405 10,899 0 0 0 0 6,606 7,132 10,871 0 0 0 0Narail 60900 2,422 1,819 0 6,296 4,920 5,108 4,588 9,656 11,151 10,657 0 0 0 0 6,459 6,973 10,629 0 0 0 0Satkhira 61000 7,740 5,852 6,298 0 15,791 16,404 14,730 31,023 32,223 30,795 0 0 0 0 18,663 20,151 30,715 0 0 0 0Habiganj 70100 6,078 4,555 4,913 15,768 0 15,890 13,402 28,270 2,816 2,691 0 0 0 0 32,621 0 53,685 8,815 0 0 0Moulvibazar 70200 6,322 4,728 5,104 16,389 15,895 0 14,228 30,083 2,586 2,471 0 0 0 0 29,957 0 49,300 8,095 0 0 0Sunamganj 70300 5,662 4,257 4,584 14,712 13,410 14,229 0 27,661 3,153 3,013 0 0 0 0 36,522 0 60,105 9,869 0 0 0Sylhet 70400 11,922 8,962 9,647 30,984 28,283 30,086 27,658 0 4,268 4,079 0 0 0 0 49,440 0 81,364 13,360 0 0 0Benapole Land Port 90001 82,062 66,283 64,807 187,274 16,366 15,030 18,323 24,805 0 0 0 0 0 0 0 0 0 0 0 0 0Bhomra Land Port 90002 78,425 63,346 61,935 178,974 15,641 14,364 17,511 23,705 0 0 0 0 0 0 0 0 0 0 0 0 0Mongla Sea Port 90003 135,969 109,826 107,379 310,297 0 0 0 0 0 0 0 0 0 0 0 0 0 0 0 0 0Hilli Land Port 90004 0 0 0 0 0 0 0 0 0 0 0 0 0 0 0 0 0 0 0 0 0Dhaka Airport 90005 0 0 0 0 0 0 0 0 0 0 0 0 0 0 0 0 0 0 0 0 0Chittagong Airport 90006 0 0 0 0 0 0 0 0 0 0 0 0 0 0 0 0 0 0 0 0 0Chittagong Sea Port 90007 160,703 129,804 126,912 366,742 641,014 588,655 717,664 971,508 0 0 0 0 0 0 0 0 0 0 0 0 0Payra Sea Port 90008 51,318 41,451 40,527 117,113 0 0 0 0 0 0 0 0 0 0 0 0 0 0 0 0 0Matarbari Sea Port 90009 78,221 63,181 61,774 178,509 312,009 286,524 349,318 472,875 0 0 0 0 0 0 0 0 0 0 0 0 0Akhaura Land port 90010 0 0 0 0 51,233 47,048 57,359 77,648 0 0 0 0 0 0 0 0 0 0 0 0 0Bibir Bazar Land Port 90011 0 0 0 0 0 0 0 0 0 0 0 0 0 0 0 0 0 0 0 0 0Ramgarh border crossing 90012 0 0 0 0 0 0 0 0 0 0 0 0 0 0 0 0 0 0 0 0 0Teknaf border crossing 90013 0 0 0 0 0 0 0 0 0 0 0 0 0 0 0 0 0 0 0 0 0