Embed Size (px)
Citation preview
Data-Based Decision Making: Universal
Screening and Progress
Monitoring
Advanced Organizer
• Rationale for universal screening
• Tools and Procedures for universal screening
• Rationale for progress monitoring
• Key characteristics of progress monitoring systems
• Tools and Procedures for progress monitoring
• Question and Answer
Why Universal Screening?Program Evaluation
• Allows for analysis of overall literacy health of the school• Are 80% of all students reaching benchmarks and
“on track” for next goal?
• Are all subgroups performing adequately?
Why Universal Screening? Program Evaluation
• Does the core curriculum need to be addressed?• Intensity• Fidelity• Targeted• Group size• Instructional skills
Why Universal Screening?Identify Students in Need of Support
• Periodic and universal screening ensures that no students “fall through the cracks”
• Strategic support: Students are placed in a program that provides moderate intervention and progress monitored every 2 weeks
• Intensive support: Students are placed in an intervention that is intense and progress monitored weekly or bi-weekly
Why use a Screener to Identify Students and Track Progress?
• Reading trajectories are established early. • Readers on a low trajectory tend to stay on
that trajectory and fall further and further behind.
• Early identification leads to early intervention. The later children are identified as needing support, the more difficult it is to catch up!
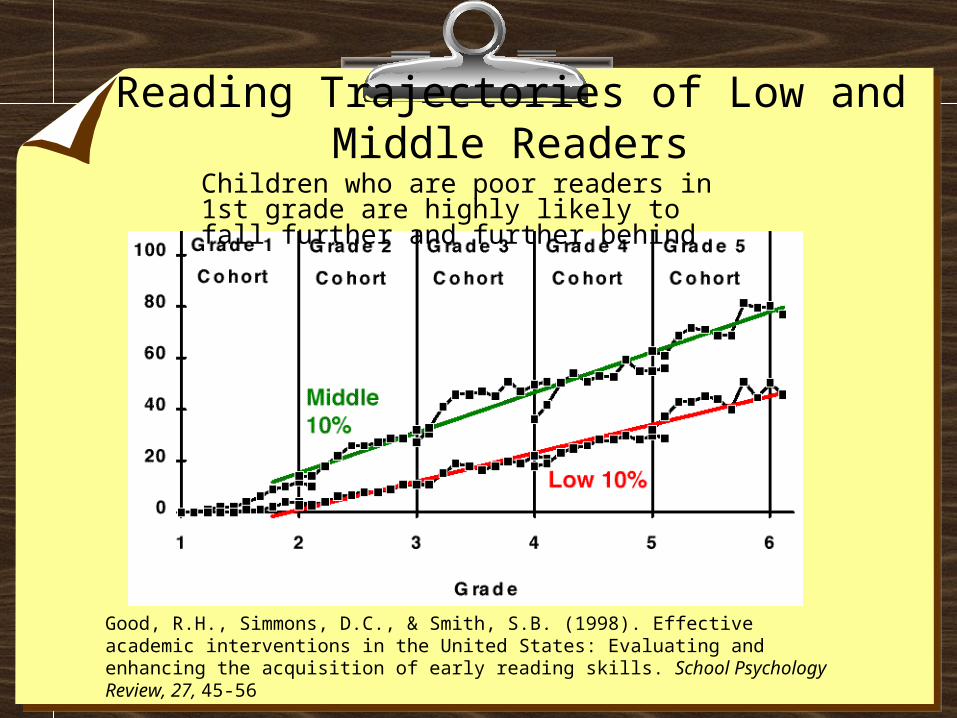
Reading Trajectories of Low and Middle Readers
Good, R.H., Simmons, D.C., & Smith, S.B. (1998). Effective academic interventions in the United States: Evaluating and enhancing the acquisition of early reading skills. School Psychology Review, 27, 45-56
Children who are poor readers in 1st grade are highly likely to fall further and further behind
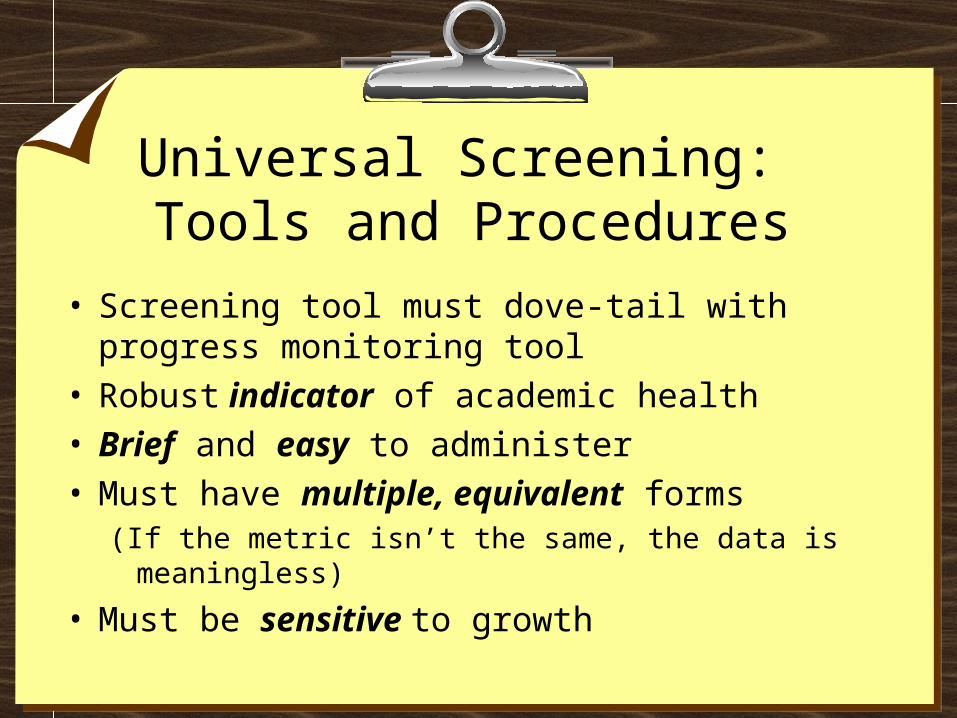
Universal Screening: Tools and Procedures
• Screening tool must dove-tail with progress monitoring tool
• Robust indicator of academic health • Brief and easy to administer• Must have multiple, equivalent forms
(If the metric isn’t the same, the data is meaningless)
• Must be sensitive to growth
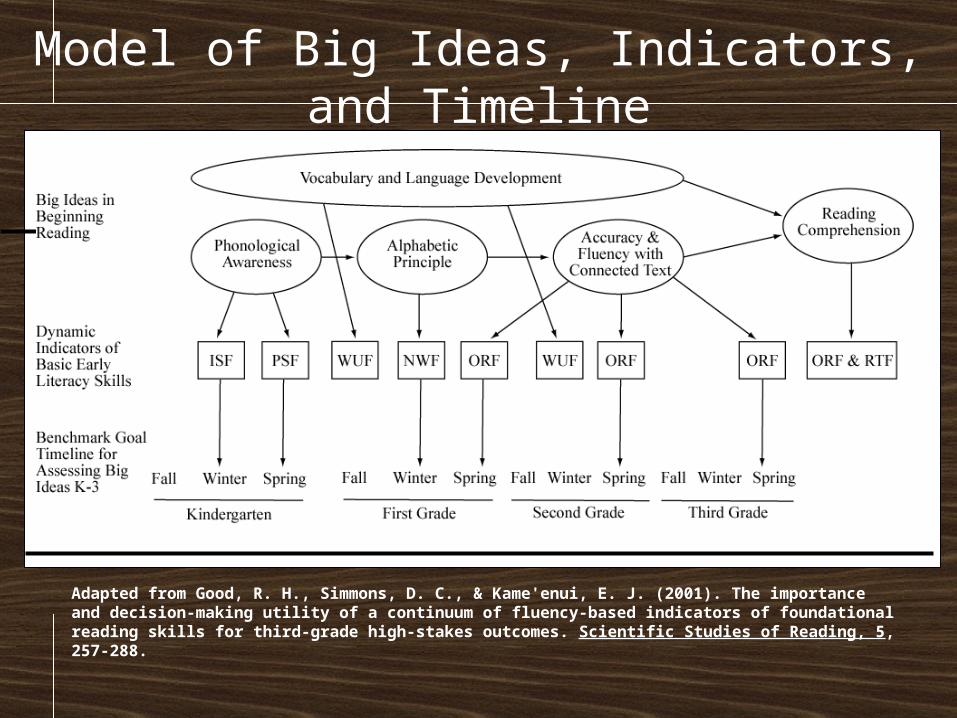
Model of Big Ideas, Indicators, and Timeline
Adapted from Good, R. H., Simmons, D. C., & Kame'enui, E. J. (2001). The importance and decision-making utility of a continuum of fluency-based indicators of foundational reading skills for third-grade high-stakes outcomes. Scientific Studies of Reading, 5, 257-288.
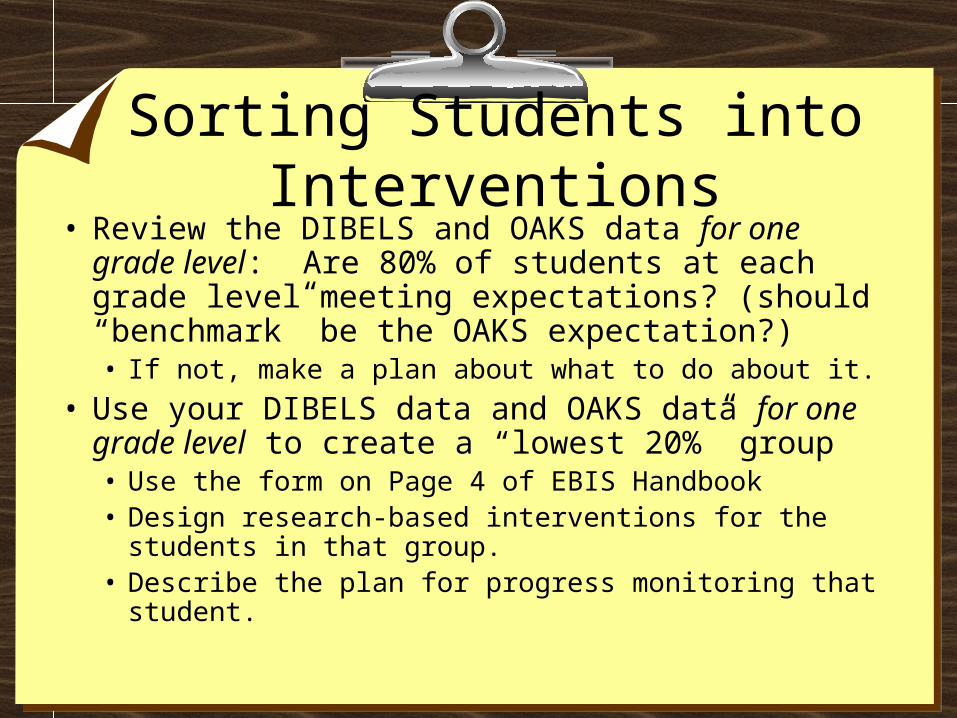
Sorting Students into Interventions• Review the DIBELS and OAKS data for one grade
level: Are 80% of students at each grade level meeting expectations? (should “benchmark” be the OAKS expectation?)• If not, make a plan about what to do about it.
• Use your DIBELS data and OAKS data for one grade level to create a “lowest 20%” group• Use the form on Page 4 of EBIS Handbook• Design research-based interventions for the students in
that group.• Describe the plan for progress monitoring that student.
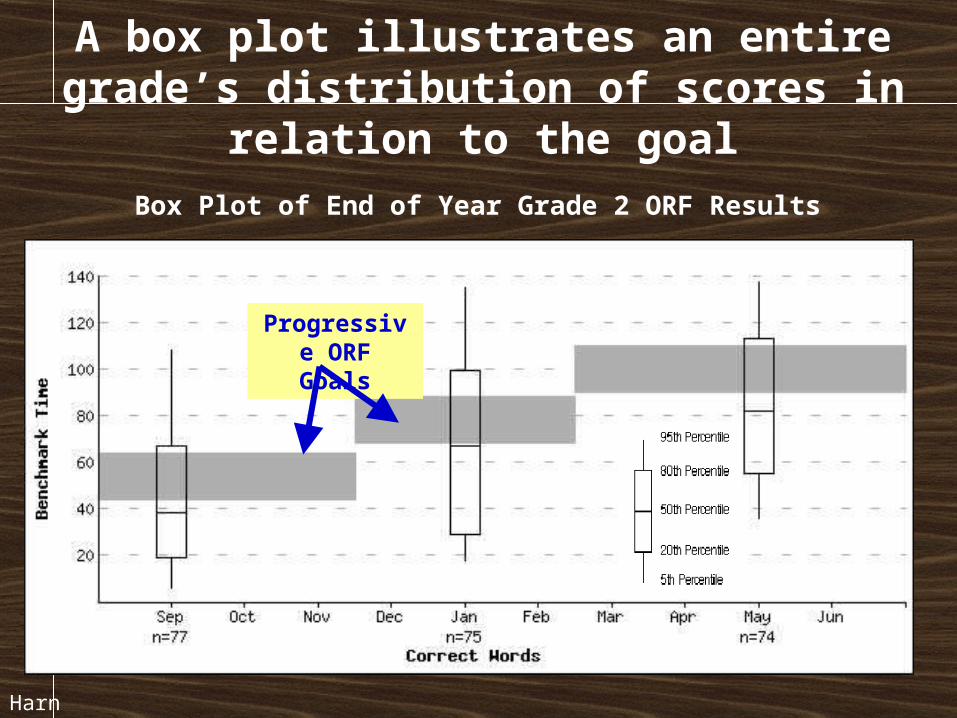
Box Plot of End of Year Grade 2 ORF Results
Progressive ORF Goals
A box plot illustrates an entire grade’s distribution of scores in relation to the goal
Harn (2005)
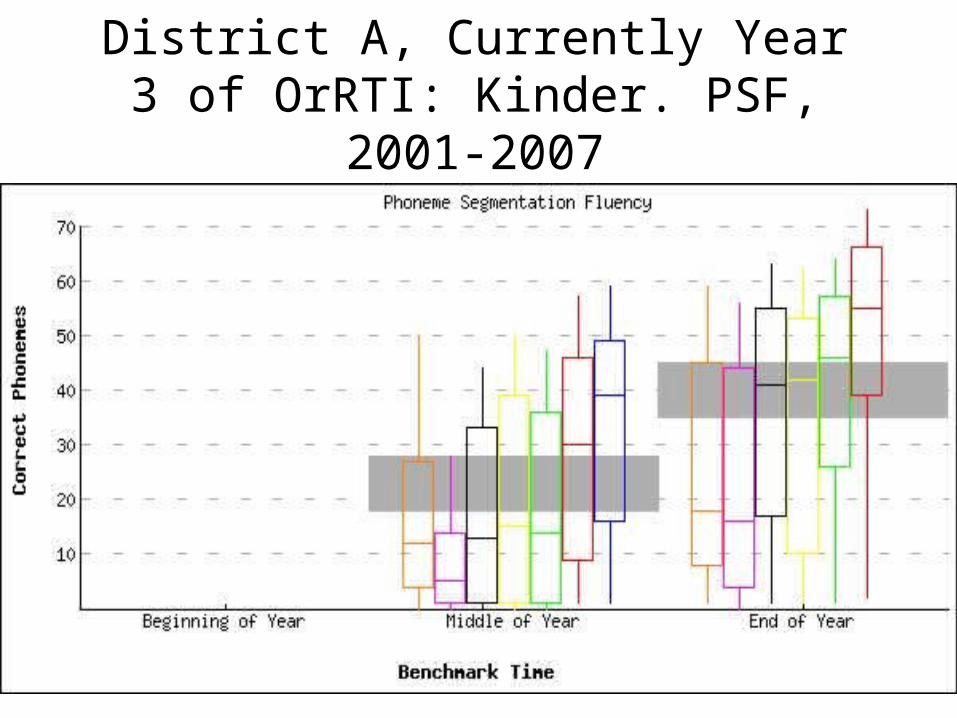
District A, Currently Year 3 of OrRTI: Kinder. PSF, 2001-2007
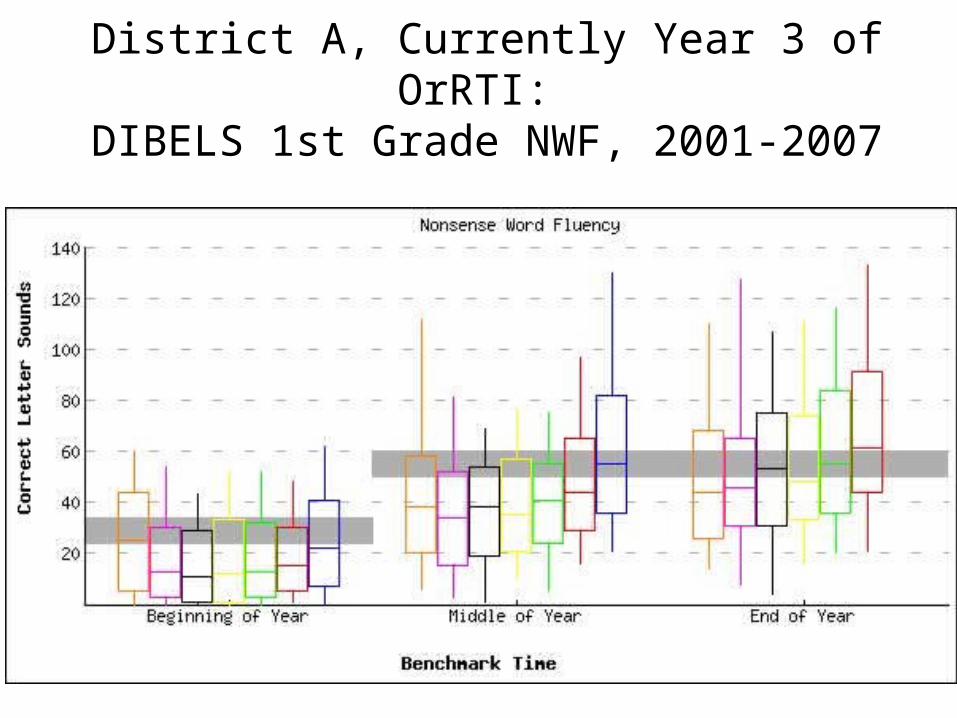
District A, Currently Year 3 of OrRTI: DIBELS 1st Grade NWF, 2001-2007
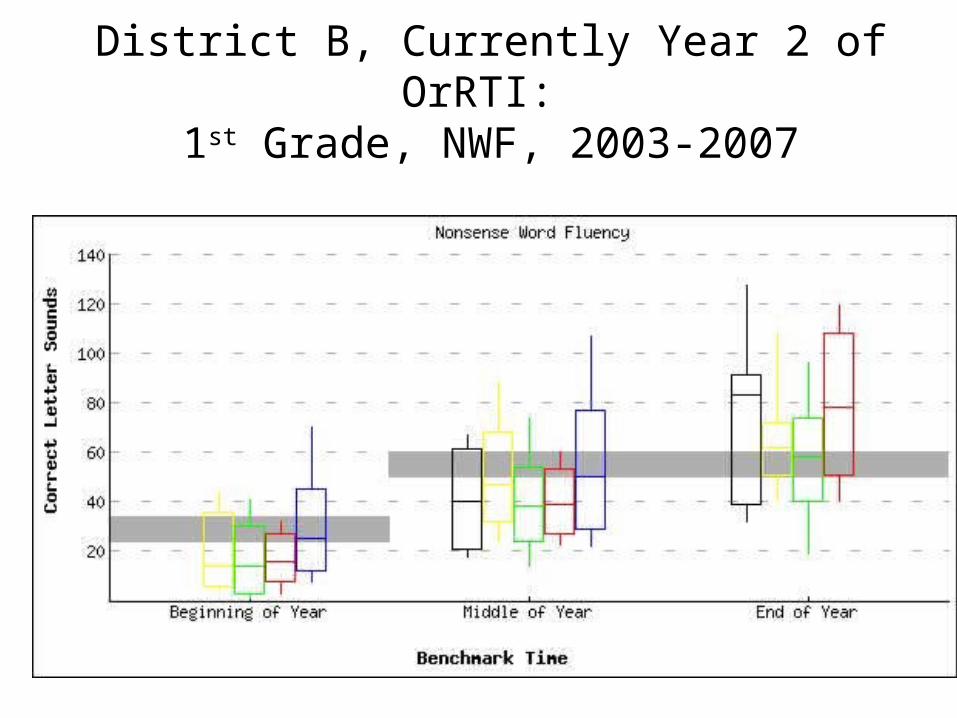
District B, Currently Year 2 of OrRTI: 1st Grade, NWF, 2003-2007
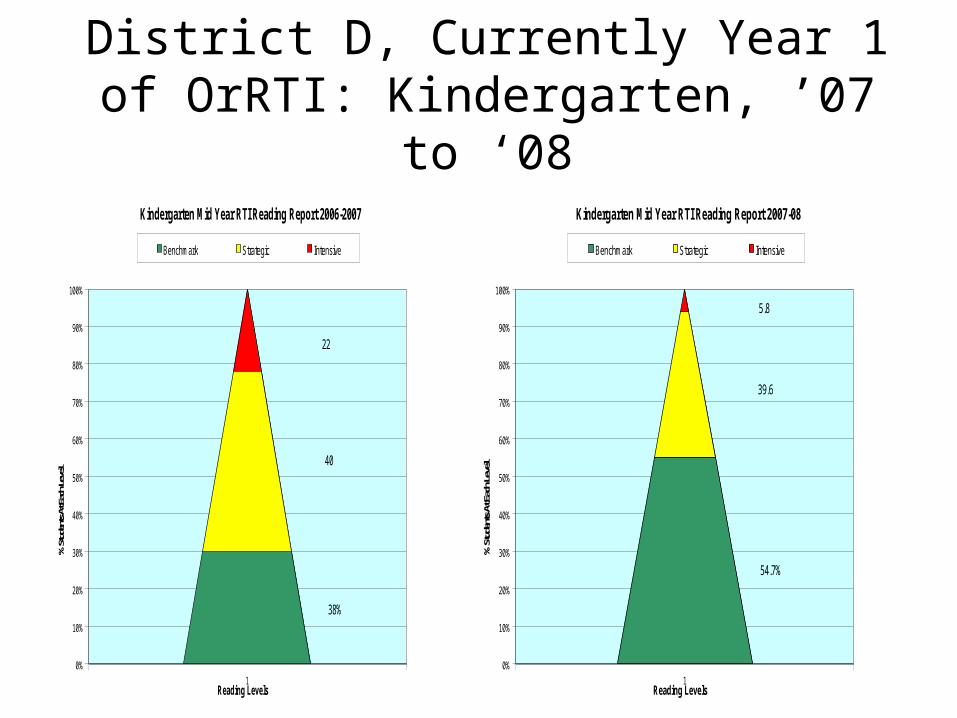
District D, Currently Year 1 of OrRTI: Kindergarten, ’07 to ‘08
38%
40
22
0%
10%
20%
30%
40%
50%
60%
70%
80%
90%
100%
% Stu
dents
At Ea
ch Le
vel
1Reading Levels
Kindergarten Mid Year RTI Reading Report 2006-2007
Benchmark Strategic Intensive
54.7%
39.6
5.8
0%
10%
20%
30%
40%
50%
60%
70%
80%
90%
100%
% St
uden
ts At
Each
Leve
l
1Reading Levels
Kindergarten Mid Year RTI Reading Report 2007-08
Benchmark Strategic Intensive
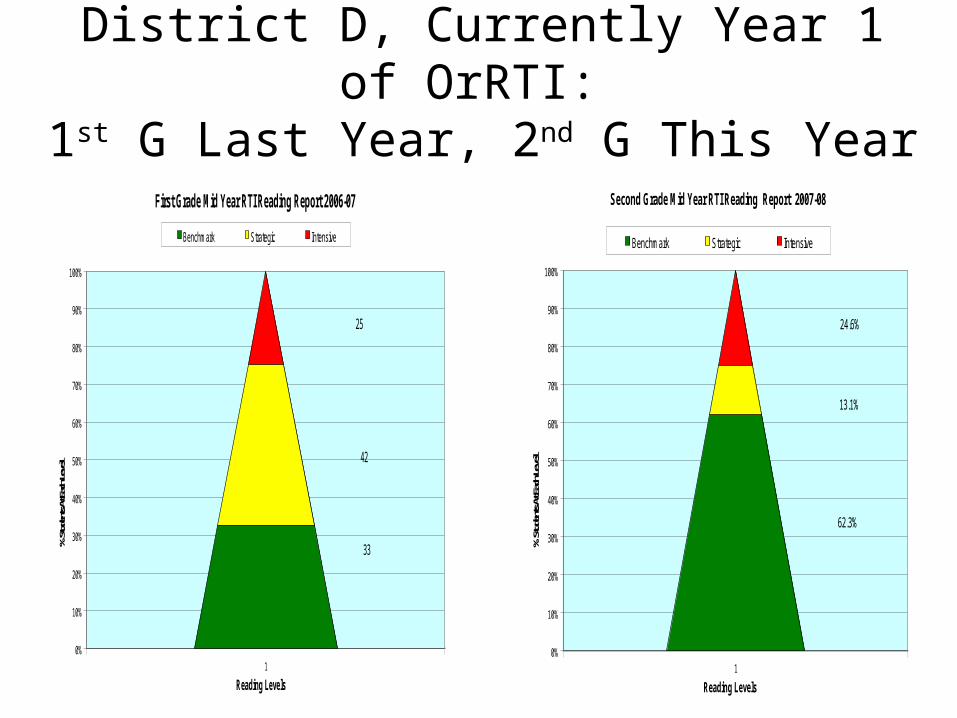
District D, Currently Year 1 of OrRTI: 1st G Last Year, 2nd G This Year
33
42
25
0%
10%
20%
30%
40%
50%
60%
70%
80%
90%
100%
% Stud
ents A
t Each
Level
1
Reading Levels
First Grade Mid Year RTI Reading Report 2006-07
Benchmark Strategic Intensive
62.3%
13.1%
24.6%
0%
10%
20%
30%
40%
50%
60%
70%
80%
90%
100%
% Stu
dents
At Ea
ch Le
vel
1
Reading Levels
Second Grade Mid Year RTI Reading Report 2007-08
Benchmark Strategic Intensive
**Make a Plan• Who will conduct Universal Screening? • Who will train the screeners?• Who will prepare materials?• Who will organize at the school?• Where will the data go?• Who will organize the data and present it to teaching
teams?• Who will keep track of which students are in
interventions?
Progress Monitoring: Are We There Yet?
Why Monitor Progress?
• It’s the GPS for educators
• It improves achievement
• It’s the law
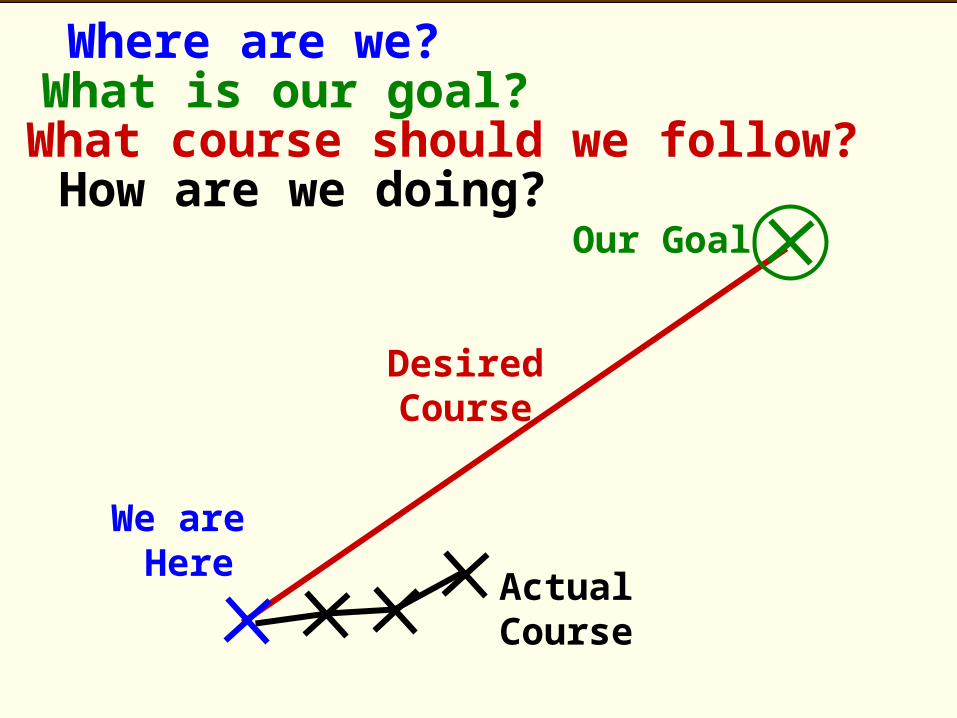
Where are we?What is our goal?What course should we follow?How are we doing?
ActualCourse
DesiredCourse
Our Goal
We are Here
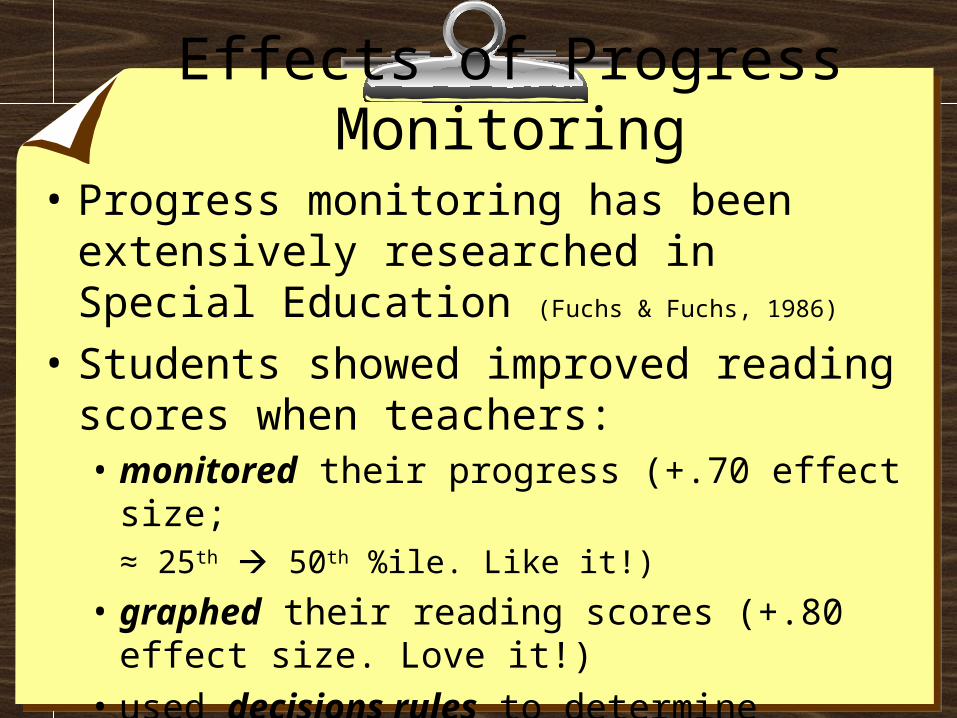
Effects of Progress Monitoring• Progress monitoring has been extensively
researched in Special Education (Fuchs & Fuchs, 1986)
• Students showed improved reading scores when teachers:• monitored their progress (+.70 effect size;
≈ 25th 50th %ile. Like it!)
• graphed their reading scores (+.80 effect size. Love it!)
• used decisions rules to determine whether to make a change in instruction (+.90 effect size. Gotta have it!)
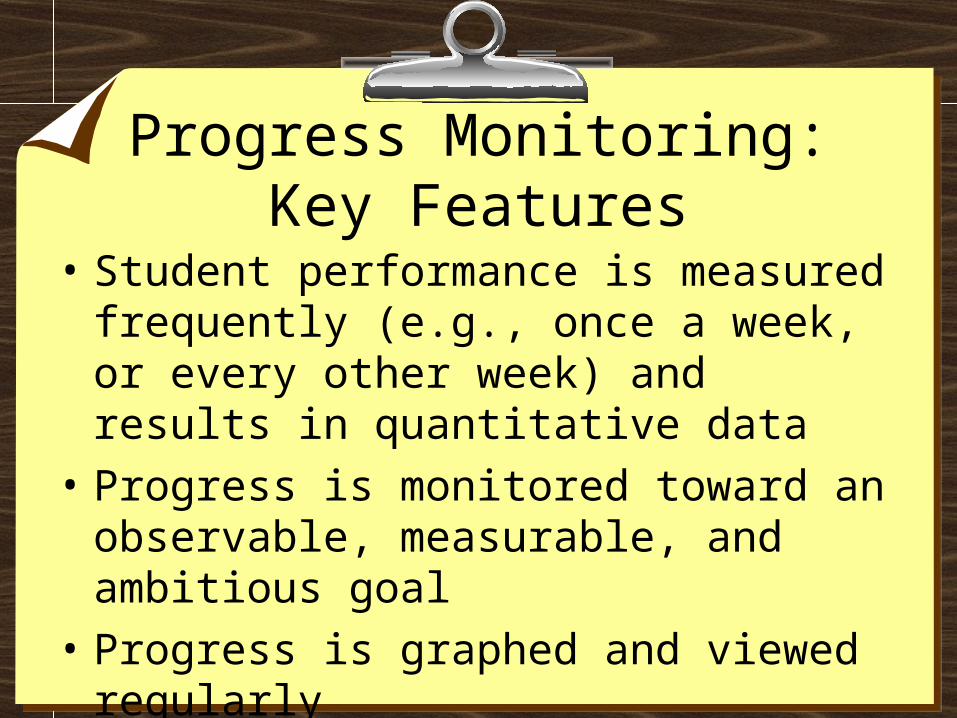
Progress Monitoring: Key Features
• Student performance is measured frequently (e.g., once a week, or every other week) and results in quantitative data
• Progress is monitored toward an observable, measurable, and ambitious goal
• Progress is graphed and viewed regularly
• Data decision rules are used consistently
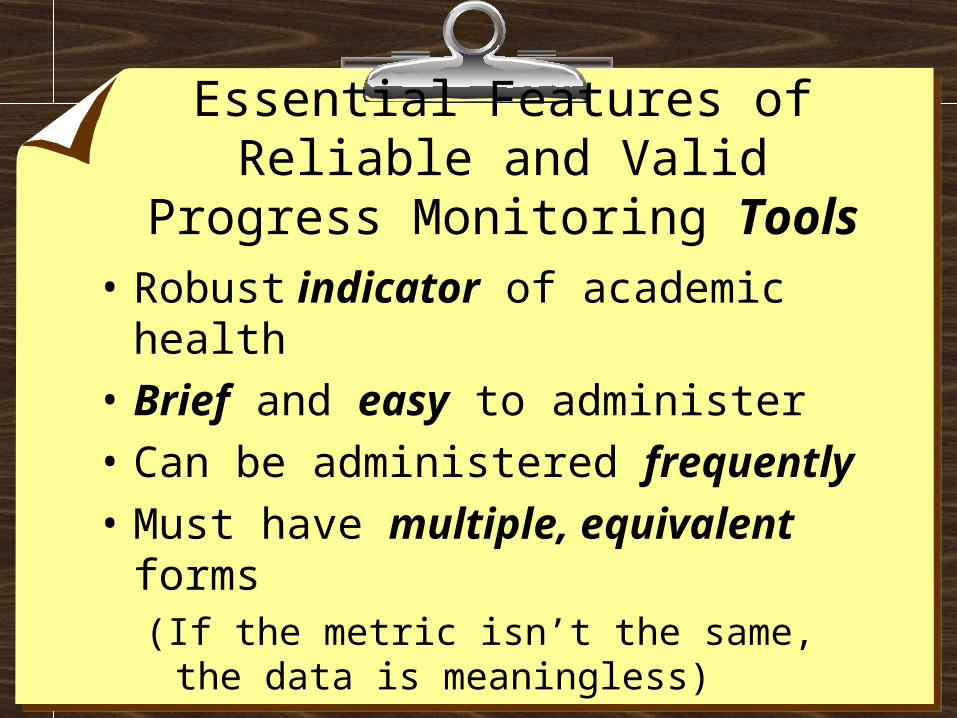
Essential Features of Reliable and Valid Progress Monitoring Tools
• Robust indicator of academic health
• Brief and easy to administer
• Can be administered frequently
• Must have multiple, equivalent forms(If the metric isn’t the same, the data is
meaningless)
• Must be sensitive to growth
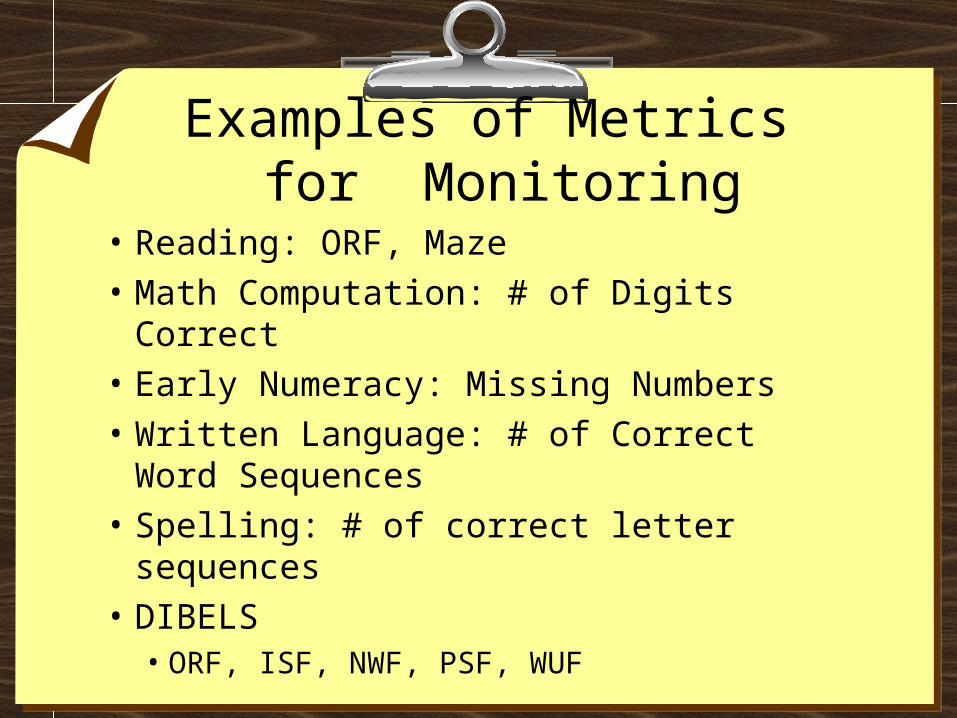
Examples of Metrics for Monitoring
• Reading: ORF, Maze
• Math Computation: # of Digits Correct
• Early Numeracy: Missing Numbers
• Written Language: # of Correct Word Sequences
• Spelling: # of correct letter sequences
• DIBELS• ORF, ISF, NWF, PSF, WUF
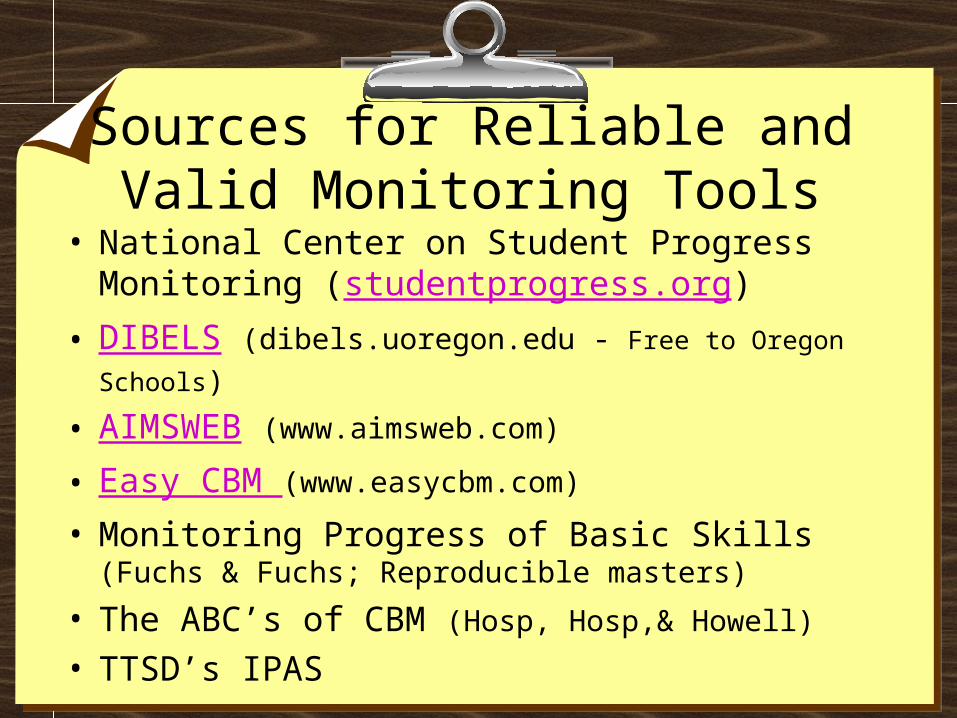
Sources for Reliable and Valid Monitoring Tools
• National Center on Student Progress Monitoring (studentprogress.org)
• DIBELS (dibels.uoregon.edu - Free to Oregon Schools)
• AIMSWEB (www.aimsweb.com)
• Easy CBM (www.easycbm.com)
• Monitoring Progress of Basic Skills (Fuchs & Fuchs; Reproducible masters)
• The ABC’s of CBM (Hosp, Hosp,& Howell) • TTSD’s IPAS
Outcomes Driven Model in a Picture N
on
sen
se W
ord
Flu
ency
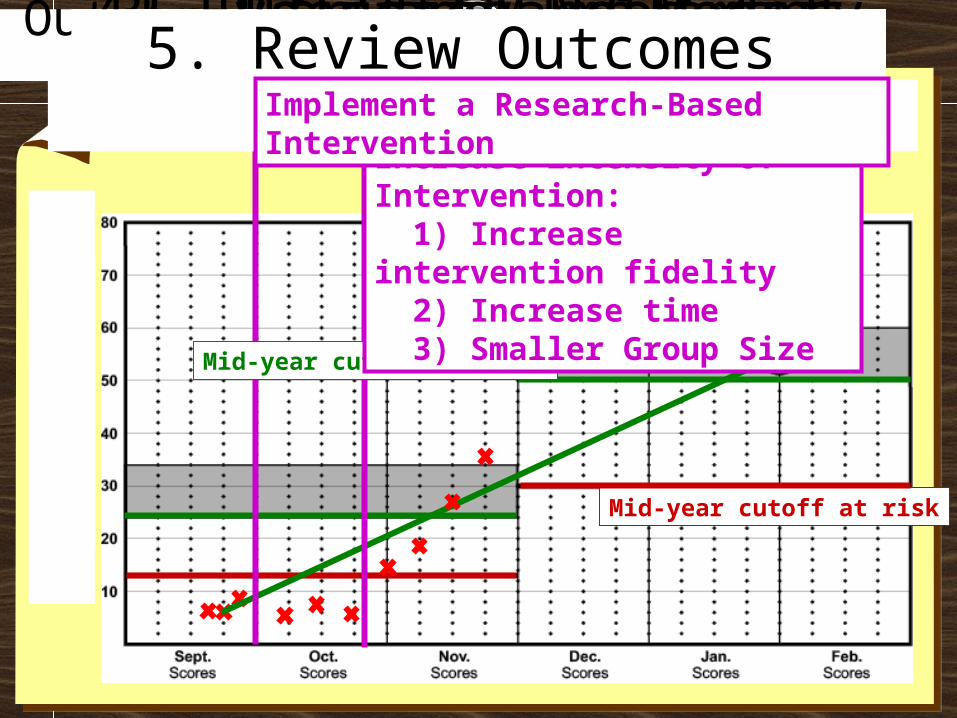
Mid-year cutoff at risk
Mid-year cutoff low risk
Increase intensity of Intervention: 1) Increase intervention fidelity 2) Increase time 3) Smaller Group Size
1. Identify Need for Support 2. Validate Need for Support 3. Plan and Implement Support 4. Evaluate and Modify Support 5. Review Outcomes Implement a Research-Based Intervention
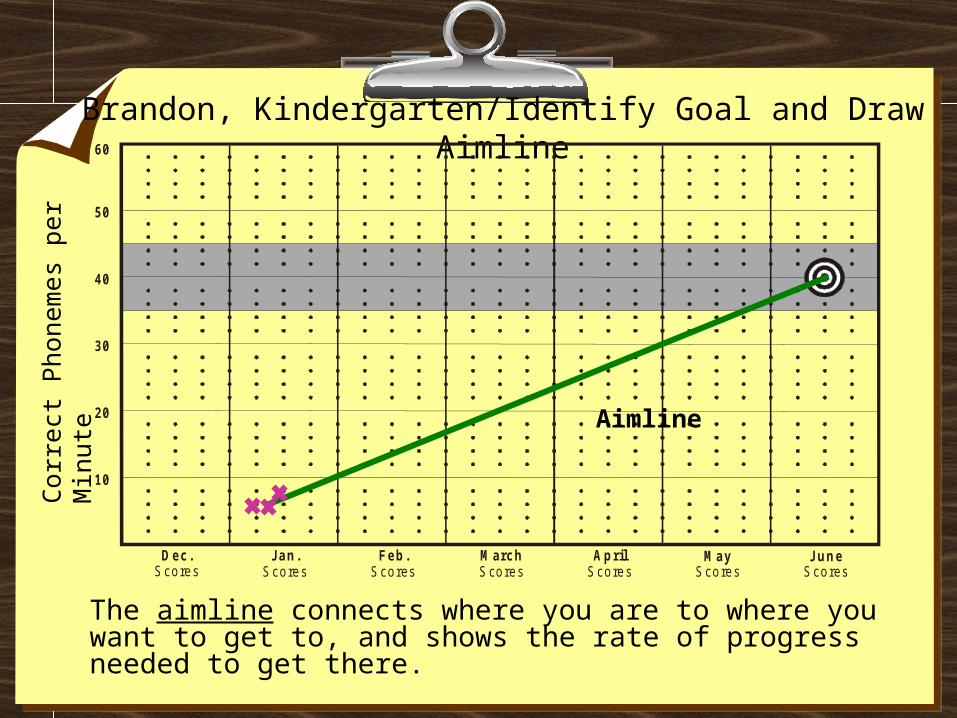
Brandon, Kindergarten/Identify Goal and Draw Aimline
The aimline connects where you are to where you want to get to, and shows the rate of progress needed to get there.
10
20
30
40
Dec.Scores
Feb.Scores
Jan.Scores
M archScores
AprilScores
M ayScores
JuneScores
60
50
Aimline
Cor
rect
Pho
nem
es p
er M
inut
e
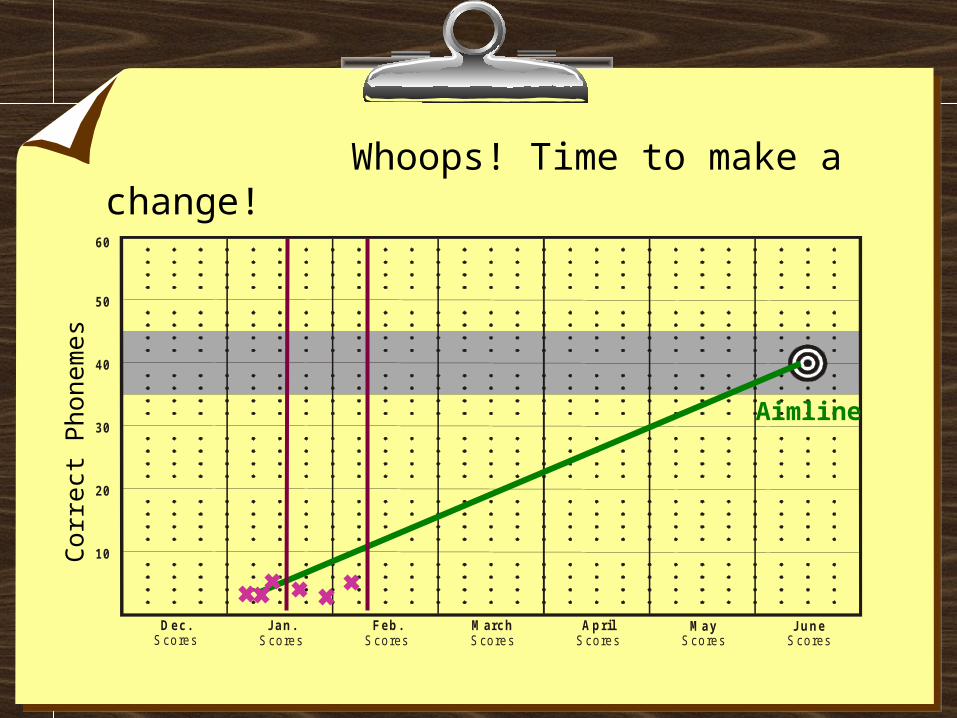
Whoops! Time to make a change!
10
20
30
40
Dec.Scores
Feb.Scores
Jan.Scores
M archScores
AprilScores
MayScores
JuneScores
60
50
Cor
rect
Pho
nem
es
Aimline
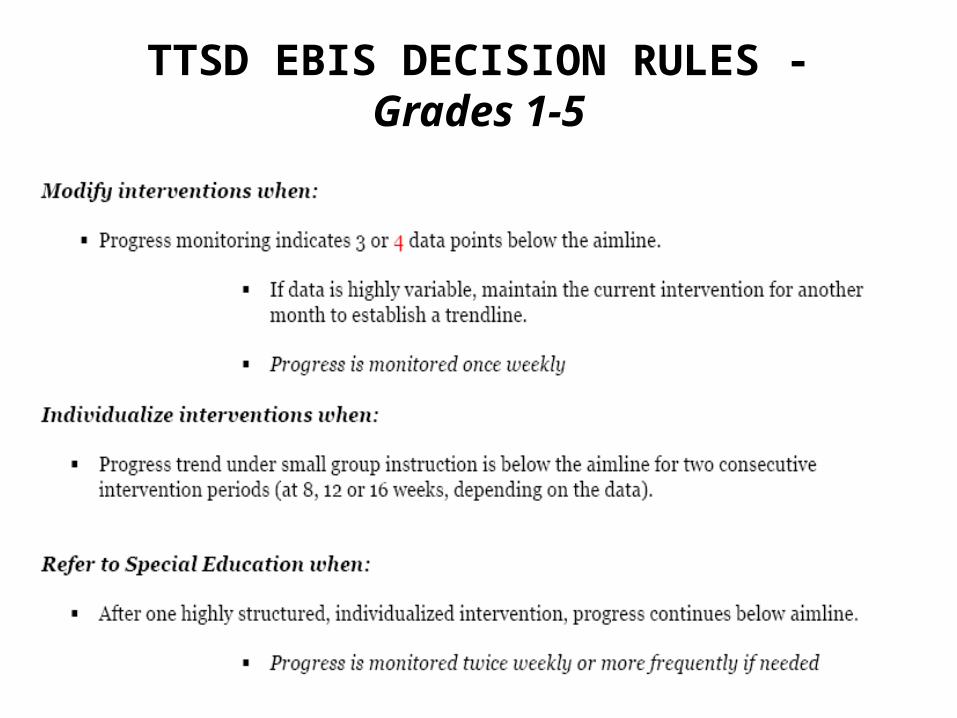
TTSD EBIS DECISION RULES - Grades 1-5
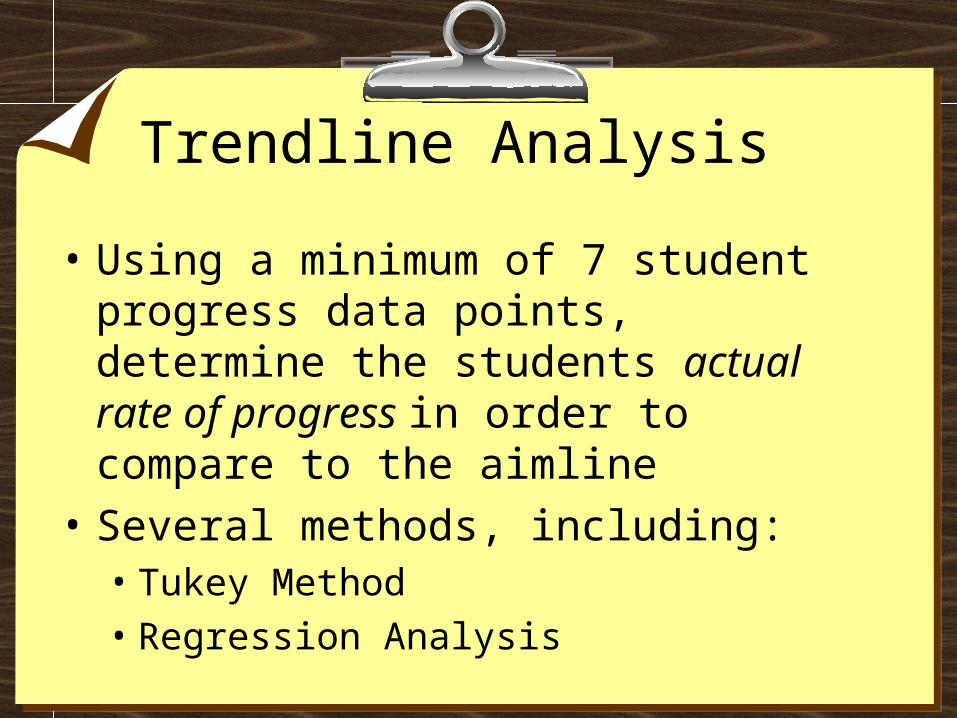
Trendline Analysis
• Using a minimum of 7 student progress data points, determine the students actual rate of progress in order to compare to the aimline
• Several methods, including:• Tukey Method• Regression Analysis
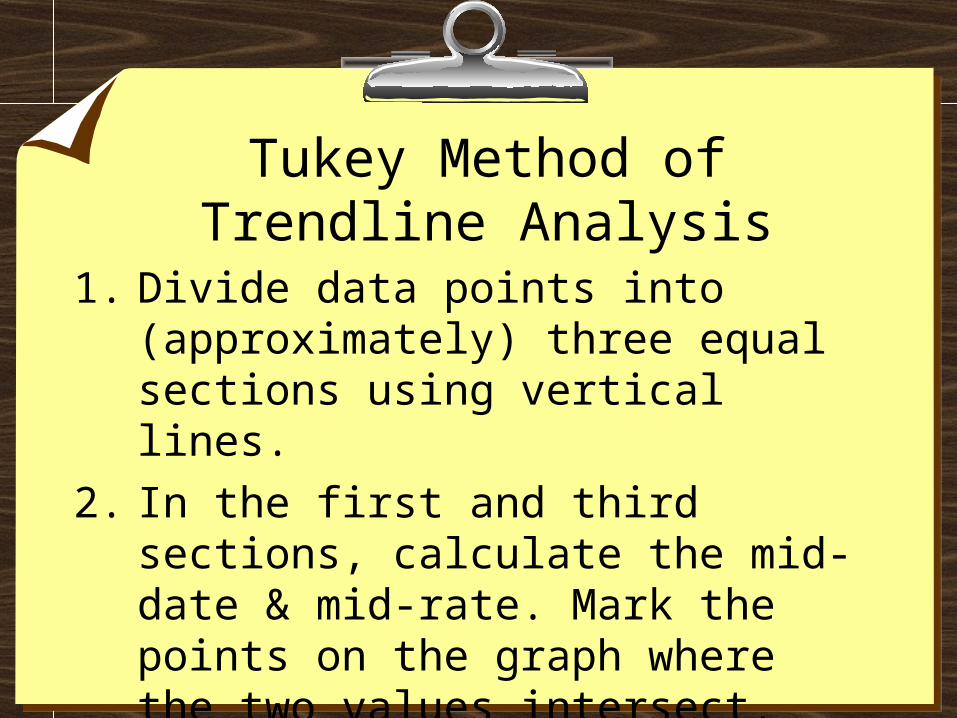
Tukey Method of Trendline Analysis
1. Divide data points into (approximately) three equal sections using vertical lines.
2. In the first and third sections, calculate the mid-date & mid-rate. Mark the points on the graph where the two values intersect.
3. Connect the points to draw the trendline.
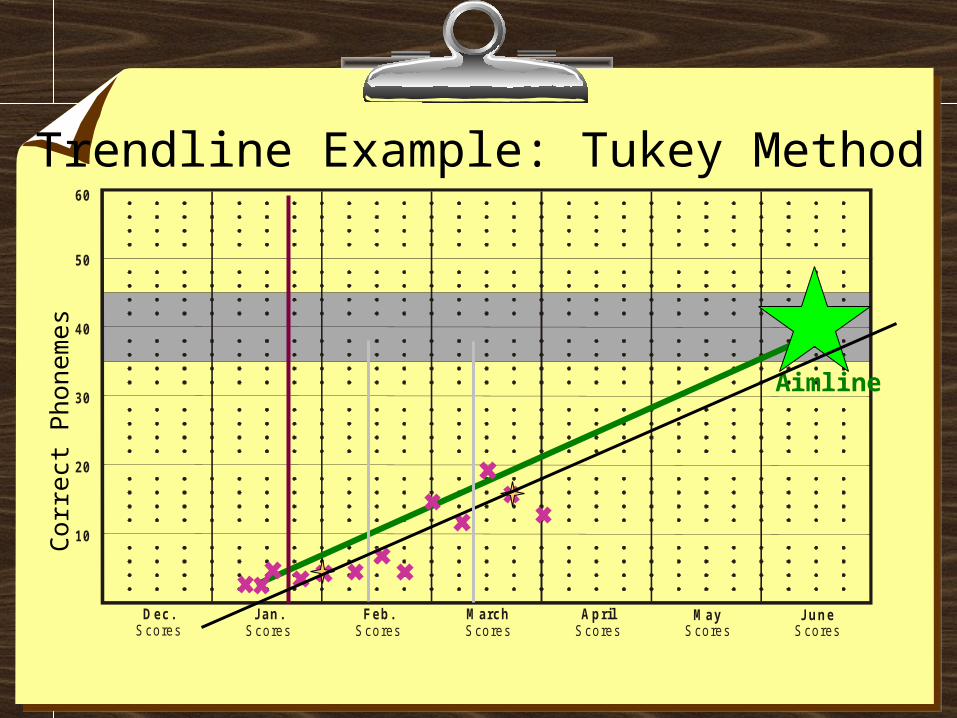
Trendline Example: Tukey Method
10
20
30
40
Dec.Scores
Feb.Scores
Jan.Scores
M archScores
AprilScores
MayScores
JuneScores
60
50
Cor
rect
Pho
nem
es
Aimline
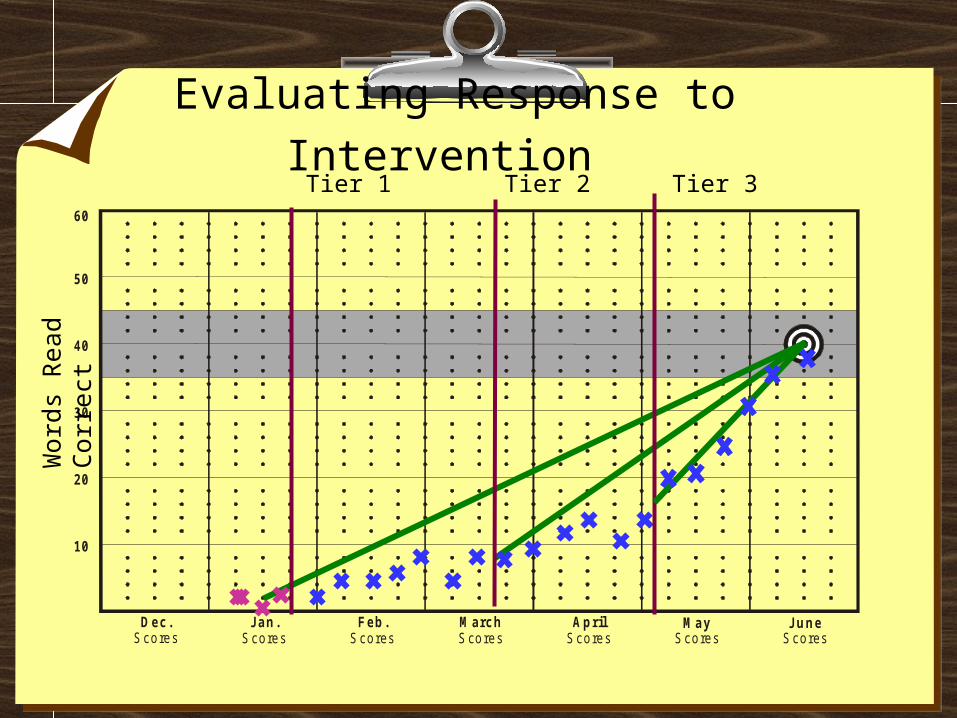
Evaluating Response to Intervention
10
20
30
40
Dec.Scores
Feb.Scores
Jan.Scores
M archScores
AprilScores
M ayScores
JuneScores
60
50
Wor
ds R
ead
Cor
rect
Tier 2 Tier 3Tier 1
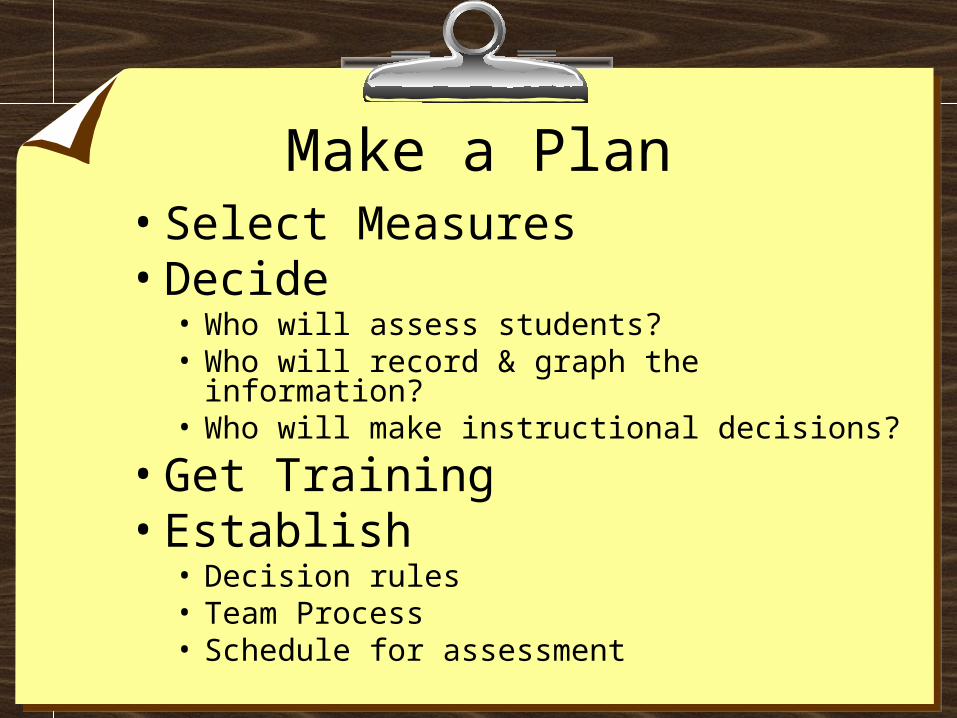
Make a Plan• Select Measures• Decide
• Who will assess students?• Who will record & graph the information?• Who will make instructional decisions?
• Get Training• Establish
• Decision rules• Team Process• Schedule for assessment
“Stop asking me if we’re almost there; we’re Nomads, for crying out loud.”