Embed Size (px)
DESCRIPTION
Universal Screening Measures (Chapter 2). Gary L. Cates, Ph.D. Illinois State University. Today’s Objectives. Provide a purpose, rationale, and description of what constitutes a universal screening measure for academic performance and social behavior - PowerPoint PPT Presentation
Citation preview

Universal Screening Measures(Chapter 2)
Gary L. Cates, Ph.D.Illinois State University

Today’s Objectives
• Provide a purpose, rationale, and description of what constitutes a universal screening measure for academic performance and social behavior
• Discuss how to obtain cut scores/benchmarks and what to consider
• Describe how to make data-based decisions with universal screening instruments to identify students at risk for academic performance and social behavior concerns


3 Purposes of Universal Screening
Predict which students are at risk for not meeting AYP (or long-term educational goals)
Monitor progress of all students over time
Reduce the need to do more in-depth diagnostic assessment with all students
Needed for reading, writing, math, and behavior
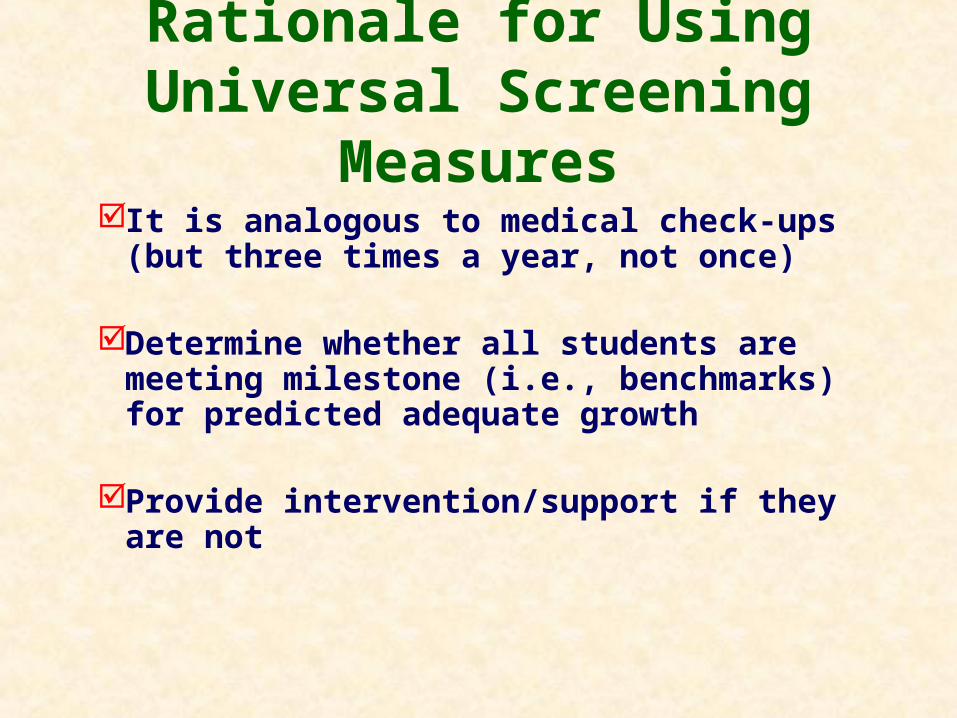
Rationale for Using Universal Screening Measures
It is analogous to medical check-ups (but three times a year, not once)
Determine whether all students are meeting milestone (i.e., benchmarks) for predicted adequate growth
Provide intervention/support if they are not

Characteristics of Universal Screening Measures
Brief to administer
Allow for multiple administration
Simple to score and interpret
Predict fairly well students at risk for not meeting AYP

Examples of Universal Screening Measures for Academic Performance (USM-A)
Curriculum-Based Measurement
Data-Based Decision Making with USM-A

Student Identification: Percentile Rank Approach
• Dual discrepancy to determine a change in intensity (i.e., tier) of service
• Cut Scores– Do not use percentiles!– District-derived cut scores are based on screening
instruments’ ability to predict state scores• Rate of Improvement
– Average gain made per day/per week?

sam
plin
g of
stu
den
tsal
l stu
den
ts in
clu
ded
Student TeacherFall
WRCWinter WRC
Winter Percentile
Rank Classification
S, A Smith 209 208 1.00 Well Above AverageK, D J ones 159 170 0.93 Well Above AverageF, M Smith 134 156 0.90 Above AverageH, A Smith 130 148 0.81 Above AverageE, S Smith 115 145 0.75 AverageP, A J ones 96 133 0.68 AverageK, C J ones 109 114 0.51 AverageS, D Armstrong 66 112 0.46 AverageB, C Armstrong 92 94 0.36 AverageE, A Armstrong 61 80 0.25 AverageA, B Smith 39 65 0.24 Below AverageR, P Armstrong 42 63 0.22 Below AverageM, W J ones 50 60 0.20 Below AverageG, S J ones 28 58 0.19 Below AverageJ , J Smith 20 54 0.17 Below AverageM, A Smith 38 51 0.15 Below AverageB, J J ones 47 48 0.14 Below AverageP, M Smith 47 45 0.10 Below AverageA, D Armstrong 38 45 0.10 Below AverageM, T J ones 42 41 0.08 Well Below AverageD, Z Armstrong 31 39 0.07 Well Below AverageM, M Smith 30 38 0.03 Well Below AverageD, A J ones 18 38 0.03 Well Below AverageK, A Armstrong 8 21 0.02 Well Below AverageA, J J ones 7 18 0.00 Well Below Average

Student Identification: Dual-Discrepancy Approach
• Rate of Improvement• Average gain made per day/per week?
• Compared to peers (or cut score) over time

sam
plin
g of
stu
den
tsal
l stu
den
ts in
clu
ded
Student TeacherFall WRC
Winter WRC
Winter Percentile
Rank ClassificationRate of Progress
Average Rate of Progress
S, A Smith 209 208 1.00 Well Above Average -0.1 1.3K, D Jones 159 170 0.93 Well Above Average 0.6 1.3F, M Smith 134 156 0.90 Above Average 1.2 1.3H, A Smith 130 148 0.81 Above Average 1.0 1.3E, S Smith 115 145 0.75 Average 1.7 1.3P, A Jones 96 133 0.68 Average 2.1 1.3K, C Jones 109 114 0.51 Average 0.3 1.3S, D Armstrong 66 112 0.46 Average 2.6 1.3B, C Armstrong 92 94 0.36 Average 0.1 1.3E, A Armstrong 61 80 0.25 Average 1.1 1.3A, B Smith 39 65 0.24 Below Average 1.4 1.3R, P Armstrong 42 63 0.22 Below Average 1.2 1.3M, W Jones 50 60 0.20 Below Average 0.6 1.3G, S Jones 28 58 0.19 Below Average 1.7 1.3J, J Smith 20 54 0.17 Below Average 1.9 1.3M, A Smith 38 51 0.15 Below Average 0.7 1.3B, J Jones 47 48 0.14 Below Average 0.1 1.3P, M Smith 47 45 0.10 Below Average -0.1 1.3A, D Armstrong 38 45 0.10 Below Average 0.4 1.3M, T Jones 42 41 0.08 Well Below Average -0.1 1.3D, Z Armstrong 31 39 0.07 Well Below Average 0.4 1.3M, M Smith 30 38 0.03 Well Below Average 0.4 1.3D, A Jones 18 38 0.03 Well Below Average 1.1 1.3K, A Armstrong 8 21 0.02 Well Below Average 0.7 1.3A, J Jones 7 18 0.00 Well Below Average 0.6 1.3
Dual Discrepancy
• Discrepant from peers (or empirically supported cut score) at data collection point 1 (e.g., fall benchmark)
• Discrepancy continues or becomes larger at point 2 (e.g., winter benchmark)– This is referred to a student’s rate of improvement
(ROI)


Resources as a Consideration
• Example of comparing percentile rank or some national cut score without considering resources
• You want to minimize:– False positives– False negatives
• This can be facilitated with an educational diagnostic tool

Correlations
• Direction (positive or negative)• Magnitude/strength (0 to 1)• If you want to understand how much overlap
(i.e., variance) between the two is explained, then square your correlationr = .70 then about 49% overlap (i.e., variance)

120
125
130
135
140
145
150
155
160
165
170
175
180
185
190
195
200
0 10 20 30 40 50 60 70 80 90 100 110 120 130 140 150 160 170 180 190 200
STU
DEN
T PE
RFO
RMAN
CE O
N H
IGH
-STA
KES
TEST
Words Read Correctly Per Minute - 2nd Grade
FALSE POSITIVESFurther Diagnostic Assessment
False NegativesAdditional Data Currently Available
Negatives for At-Risk
POSITIVES for At-Risk
Relationship Between ORF In Fall of 2nd Grade and High-Stakes Testing in 3rd Grade

A Word About Correlations
• They do not tell you how much one variable causes the other!
• Use multiple data sources whenever possible• Another option is to triangulate the data (i.e.,
use three data sources) by simply weighting them based on strength of correlation
• Strong correlations do not always equate to accurate prediction of specific populations

Presentation Activity 3
• How are you currently making data-based decisions using the universal screening measures you have?
• Do you need to make some adjustments to your decision-making process?
• If you answered yes to the question above, What might those adjustments be?
Data-Based Decision Making with USM-B

Some Preliminary Points
• Social behavior screening is just as important as academic screening
• We will focus on procedures (common sense is needed: If a child displays severe behavior, then bypass the system we will discuss today)
• We will focus on PBIS and SSBD– The programs are examples of basic principles– You do not need to purchase these exact
programs
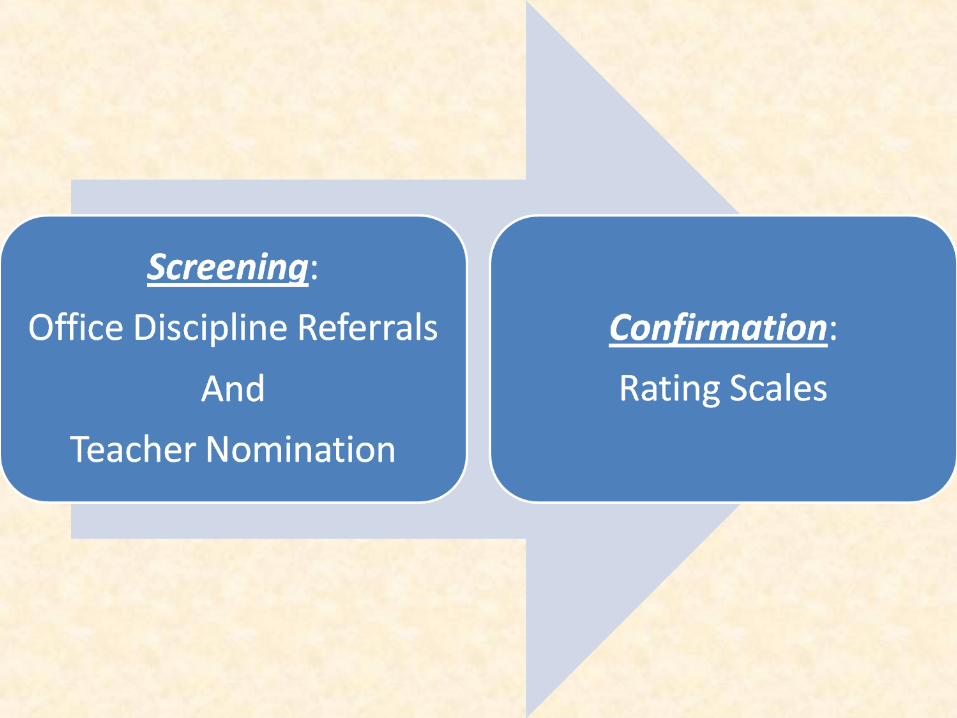

Office Discipline Referrals
• Good as a stand-alone screening tool for externalizing behavior problems
• Also good for analyzing schoolwide data– Discussed later
• See example teacher nomination form – Chapter 2 of book and on CD

Teacher Nomination
• Teachers are generally good judges• Nominate three students as externalizers• Nominate three students as internalizers• Trust your instincts and make decision
– There will be more sophisticated process to confirm your choices
• See example teacher nomination form – Chapter 2 of book and on CD

Confirming Teacher Nominations with Other Data
• Teacher, Parent, and Student Rating Scales– BASC– CBCL (Achenbach)

Example: Systematic Screening for Behavior Disorders (SSBD)
• Critical Events Inventory:– 33 severe behaviors (e.g., physical assault, stealing) in
checklist format– Room for other behaviors not listed
• Adaptive Scale: Assesses socially appropriate functional skills (e.g., following teacher directions)
• Maladaptive Scale: Assesses risk for developing antisocial behavior (e.g., testing teacher limits)

Data-Based Decision Making Using Universal Screening Measures for Behavior
• Computer software available• Web-based programs also available• See handout (Microsoft Excel Template)

Average Referrals Per Day Per Month

ODR Data by Behavior

ODR Data by Location

ODR Data by Time of Day

ODR Data by Student

Review of Important Points: Academic Peformance
• USMs used for screening and progress monitoring
• It is important to adhere to the characteristics when choosing a USM
• USM-A’s typically are similar to curriculum-based measurement procedures
• There are many ways to choose appropriate cut scores, but it is critical that available resources be considered

Review of Important Points: Behavior
• Social behavior is an important area for screening• Number of office discipline referrals is a strong
measure for schoolwide data analysis and external behavior
• Both internalizing and externalizing behaviors should be screened using teacher nominations
• Follow-up with rating scales• Use computer technology to facilitate the data-
based decision-making process

Questions