Embed Size (px)
Citation preview

1
Data Analytics as Inputs for Innovations in Engineering Design
Ma-Lorena Escandón-Quintanilla
Abstract. Developing a new solution in engineering is always a challenge. Engineering teams
tasked with finding a novel solution will usually attempt to search for information from external
sources to complement knowledge within the team. How can teams keep up with everything that
is going on in a specific domain? This process is time and resource consuming, and overwhelmed
teams tend to go back to improving existing designs with known solutions. By integrating the use
of data mining tools and the resulting reports and visualizations, teams can explore information,
and combine it with existing knowledge to increasing the novelty and diversity of proposed
solutions.
This PhD project aimed at helping creative teams include data analytics in early creative stages of
engineering design, especially for idea generation, by finding data which can result in a highly
innovative solution when combined with existing knowledge. Three cases were studied, totaling
45 teams and more than 275 participants, where knowledge discovery from databases (KDD) is
made available to teams in early creative stages of the engineering design process (EDP), in the
context of innovation competitions in higher education.
The use of data from patents through a KDD effort was found to be useful in all three cases, as it
appeared to help teams find new and more diverse ideas, and further develop their concepts.
Findings suggest that early access to external information allowed teams in innovation contests to
generate novel combinations.
Keywords: engineering design process, knowledge discovery, patent mining, innovation contests
1 Introduction
Innovation today requires perspectives from different domains of knowledge, it is multidisciplinary.
Innovation contests are one of the available options companies have to generate ideas by bringing
together participants from different domains or areas of expertise, and facilitate the exchange and
creation of knowledge for a specific purpose. The objective is to have a wide diversity of potential
solutions, in order to identify original or novel approaches to solve a problem.
Unfortunately, popular ideas are constantly recombined; to produce an original result, the ideator or
ideators must make highly varying (wild) recombinations (Fleming & Szigety, 2006). It is necessary
to support participants to enable them to make unexpected combinations (Dove & Jones, 2004).
It is possible to map the connections between concepts in a domain by using data mining tools and
techniques to analyze the knowledge in patents, scientific articles and other information sources. The
resulting visualizations of information can be used as input to help bolster the creativity of
participants, given that “creative thinking involves a process of iterative activation of ‘cues’”
(Hamman, 2000). The purpose of this research project aims to expand the use of data mining tools in
early creative stages of engineering design to find terms that are distant or unrelated, to stimulate the
spark of bisociation.

2
2 Background
2.1 The Engineering design process
Engineering Design was defined by the Accreditation Board for Engineering and Technology (ABET)
as “the process of devising a system, component, or process to meet desired needs (Ertas & Jones,
1996). Usually non-linear and iterative, it is a decision-making process in which math and engineering
are applied to efficiently transform resources to achieve an identified objective (in Ertas & Jones,
1996, page 2). Designers move between stages when facing an issue, or discover new information
about the design problem.
Atman et al. (2007) charted the Engineering Design Process (EDP) as a series of activities in three
stages as, shown in Table 1.
Table 1. Engineering design process (Atman et al. (2007)
Design stages Design activities
Problem scoping
Need identification
Problem definition
Information gathering
Development of
alternative solutions
Idea generation
Modeling
Feasibility analysis
Evaluation
Project realization
Selection
Communication
Implementation
2.1.1 Bisociation
In the nineteen-sixties, Arthur Koestler posited that creative ideas are spawned when two previously
considered incompatible fields of knowledge are connected in a bisociation; the combination leads to
something completely different from existing solutions (Koestler, 1964). Koestler suggests that truly
creative combinations “result from a blending of elements drawn from of two previously unrelated
frames or matrices of thought into a new matrix of meaning by way of a process involving
comparison, abstraction and categorization, analogies and metaphors” (1964). This belief has been
also proposed under different terms, such as conceptual blending or forced relationships.
In contrast to bisociation, there is “association”, thinking in one matrix. This is useful to perform tasks
already encountered in past experience, it is not capable of original, creative achievement. Table 2
shows the contrast between the two forms of thought:

3
Table 2. Comparison between associative and bisociative thought (Koestler, 1964)
Associative thought (habit) Bisociative thought (originality)
Association within the confines of a given matrix Bisociation of independent matrices
Guidance by pre-conscious or extra-conscious processes Guidance by sub-conscious processes
Dynamic equilibrium Activation of regenerative potentials
Rigid to flexible variations on a theme Super-flexibility
Repetitiveness Novelty
Conservative Destructive-Constructive
2.1.2 Innovation contests
Cases 2 and 3 in this research were performed during innovation contests. An innovation contest is
usually an open innovation effort where companies or organizations propose challenges to
participants, and teams usually try to solve a technological problem in a defined amount of time. As
found by Adamczyk, Bullinger and Möslein (2012), innovation contests can have different
characteristics, given their purpose and context:
Table 3. Innovation contests categorization (Adamczyk, Bullinger & Möslein, 2012)
Attraction
(marketing / activation)
Online, offline, mixed
Community functionality Given, not given
Contest period Very short term, short term, long term, very long term
Contest phases One, two, more
Degree of elaboration Idea, sketch, concept, prototype, solution, evolving
Evaluation Jury evaluation, peer review, self-assessment, mixed
Facilitation Professional facilitation, peer facilitation, mixed
Media Online, offline, mixed
Organizer Company, public organization, non-profit, individual
Participation as Individual, team, both
Replication Biannual, annual, less frequent, more frequent
Reward / motivation Monetary, non-monetary, mixed
Sponsorship / partnership Family, friends and colleagues, universities, national associations,
specific industries, state and local agencies, mixed
Target group Specified, unspecified
Task / topic specificity Open task/low, specific task/high
4
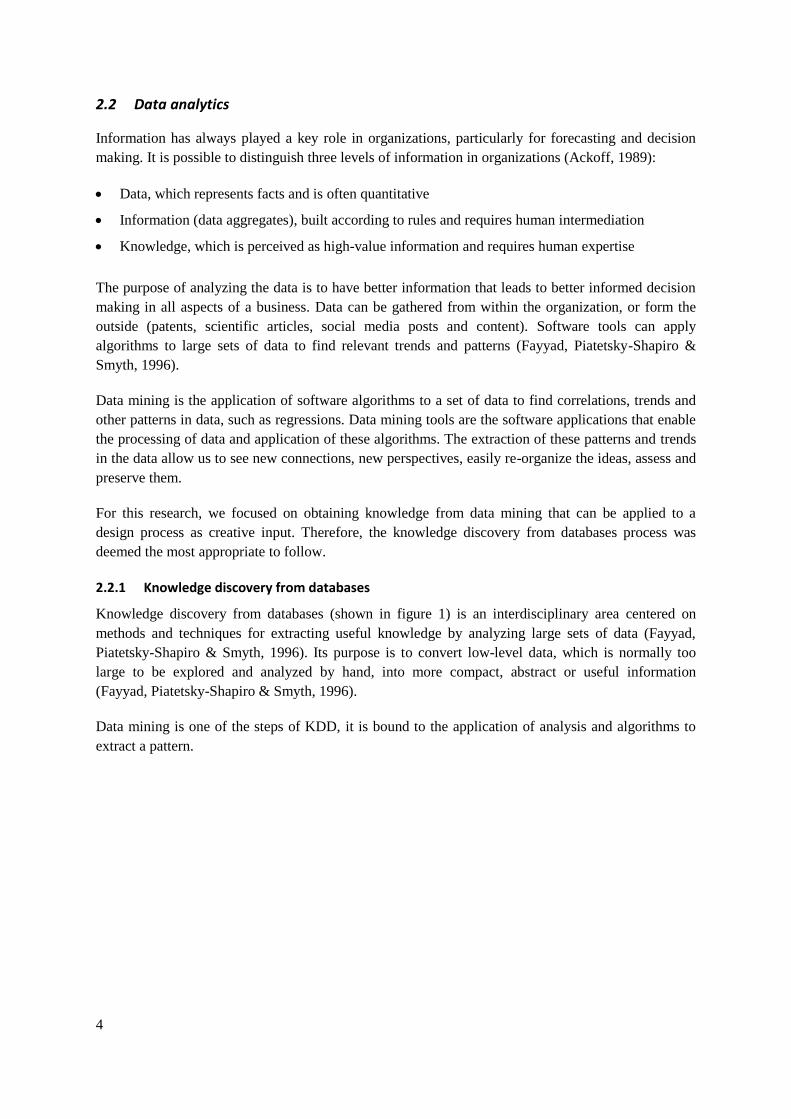
2.2 Data analytics
Information has always played a key role in organizations, particularly for forecasting and decision
making. It is possible to distinguish three levels of information in organizations (Ackoff, 1989):
Data, which represents facts and is often quantitative
Information (data aggregates), built according to rules and requires human intermediation
Knowledge, which is perceived as high-value information and requires human expertise
The purpose of analyzing the data is to have better information that leads to better informed decision
making in all aspects of a business. Data can be gathered from within the organization, or form the
outside (patents, scientific articles, social media posts and content). Software tools can apply
algorithms to large sets of data to find relevant trends and patterns (Fayyad, Piatetsky-Shapiro &
Smyth, 1996).
Data mining is the application of software algorithms to a set of data to find correlations, trends and
other patterns in data, such as regressions. Data mining tools are the software applications that enable
the processing of data and application of these algorithms. The extraction of these patterns and trends
in the data allow us to see new connections, new perspectives, easily re-organize the ideas, assess and
preserve them.
For this research, we focused on obtaining knowledge from data mining that can be applied to a
design process as creative input. Therefore, the knowledge discovery from databases process was
deemed the most appropriate to follow.
2.2.1 Knowledge discovery from databases
Knowledge discovery from databases (shown in figure 1) is an interdisciplinary area centered on
methods and techniques for extracting useful knowledge by analyzing large sets of data (Fayyad,
Piatetsky-Shapiro & Smyth, 1996). Its purpose is to convert low-level data, which is normally too
large to be explored and analyzed by hand, into more compact, abstract or useful information
(Fayyad, Piatetsky-Shapiro & Smyth, 1996).
Data mining is one of the steps of KDD, it is bound to the application of analysis and algorithms to
extract a pattern.

5
Figure 1. Knowledge discovery from databases (Fayyad, Piatetsky-Shapiro & Smyth, 1996; Baesens, 2014)
2.2.2 Use of data mining for idea generation
Data mining technologies are about finding similarities, trends and correlations, and it is up to people
to evaluate the results and gain insights. However, if we follow Koestler’s theory that there is value in
connecting what is separated or incompatible, we must then search for the disconnections.
Shan, Zhu and Zhao (2013) believe that using data in the idea generation process can help participants
get “unstuck”, and that there is enormous potential for insight discovery. Dove and Jones (2014)
suggest that data can be useful to support in the idea generation process, especially when there is no
predefined outcome, which is the case for most design problems.
From the process by Atman et al. (2007), we believe data analytics can be used in four moments of
the process for engineering design:
Need identification / problem definition. By bringing together different sources of information
and finding trends that are only visible with large amounts of data, data analytics can make it
easier to visualize gaps in a domain (Müller et al., 2012).
Information gathering. Data from different sources can be mined and used as input for
information gathering, increasing the external stimuli for teams (Dove & Jones, 2014).
Idea generation. Data mining tools and techniques can be used to identify which ideas are not
being connected (Koestler, 1964; Nielsen, 2012).
Evaluation. In the process of developing a concept or solution, only a few of the ideas are
developed, and the rest are discarded. “Unused” data can be kept and analyzed for future
developments (Chen, Li & Hung, 2013).

6
2.2.3 TKM’s IPMetrix (data mining tool)
The software IPMetrix by company TKM was selected to perform the different knowledge discovery
steps for the cases presented in this research. TKM is a consulting and information services company
based in Voiron, France. They specialize in the exploitation of scientific data sources, for example
patents, scientific publications and project reports, to generate different visualizations and reports like
semantic analysis, mapping collaborations, and patent evolutions. Their software’s automated analysis
of scientific documents and visualizations from scientific sources were used to extract information for
the cases presented here. However, the company was not involved in the preparation of the data, or
the cases themselves.
The IPMetrix tool uses TF-IDF as to determine the most important terms in documents uploaded to
the database (meeting with Florian Carichon-TKM, March 2017) for the semantic analysis
visualization (Figure 2). The abbreviation stands for “term frequency-inverse document frequency” is
the total weight for each term in every document, where “term frequency” is the number of
occurrences of a term in a document, and “inverse document frequency” is a measure used to
minimize the effects of the terms that occur frequently in a collection of documents, but do not add
value in determining relevance (Manning et al., 2009).
Figure 2. Semantic analysis from the Voronoi diagram visualization in IPMetrix

7
To generate a Voronoi diagram (Figure 3), which is a form of visualization where clusters of terms
are arranged in partitions in a plane, the terms in the documents are mapped into vectors. The vectors
are then grouped according to similarity. The IPMetrix performs these steps to produce a semantic
clustering visualization:
1. Extraction of words and expressions from all the documents uploaded to the database.
2. Lemmatization and stemming of the different keywords and expressions to group words into lexical
families.
3. Assembly of a "stop words" list to filter common keywords and expressions.
4. Creation of vectors to represent the different documents.
5. Application of K-means method to create clusters.
6. Valuation of TF-IDF of clusters to determine the representative keywords/expressions.
7. Display the 20 keywords or expressions with the largest TF-IDF ratio.
Figure 3. Example of the Voronoi diagram in IPMetrix

8
3 Research plan
This research project describes original work where the purpose was to provide teams with access to
data from a KDD process, and observe the effect of its use at the early creative stages of the
engineering design. After a theoretical research on the documented use of information technologies to
support idea generation, and the use of data as creative input, a procedure was designed following the
Knowledge Discovery from Databases process, and tried over several iterations of improvement
working with creative engineering teams in different contexts.
Three cases were performed where the researcher attempted to better support the different stages of
the EDP through the application of data from patent mining. To observe the differences, three levels
of access to explore data in a data mining tool were provided: low, intermediate and high.
The work described in this research project aims to propose the use of data mining tools, and the
resulting information, to support the early creative stages of engineering design. However, it does not
include the materialization of a concept. It also considers the results at a team level, meaning it does
not measure the creative production of individual team members, but the result of the effort of the
team.
3.1 Research question
The ultimate goal of this research is to optimize the idea generation process by integrating the use of
data. The following research question will guide the work during this research project:
How can the use of data mining tools and data support early creative stages of engineering design?
3.1.1 Specific objectives
Identify issues of using data for idea generation
o documented in the literature (in previous studies, we will review other information or
data support)
o interview/surveys with participants
Propose new guidelines for ideation sessions to use data
Perform idea generation sessions following the proposed guideline
Propose improvements and adjustments to the guidelines based on the feedbacks and results
of the studies
3.1.2 Stages
To be able to achieve the necessary knowledge to design the process and evaluation procedure to
include the use of data in the context of an idea generation session, the following stages are necessary:
1. Literature review (initial and systematic)
2. Develop protocol
3. Design evaluation tool for idea generation sessions
4. Gather data for incumbent domains
5. Implement protocol in ideation sessions with students
6. Analyze results in terms of number of ideas and variety of concepts

9
7. Get input from experts regarding complexity of concepts
3.1.3 Source data
Given that the data will depend on the availability of study opportunities and the data size can vary,
some of the studies will be performed using smaller databases, but using the analytics applied to
larger data sets.
For each idea generation session, it was necessary to prepare the data that would be exploited using
data mining tools. Two of the main sources of data to be included in this research are patents and
scientific articles because of their availability and the plethora of theories that can be found within a
single domain.
For the three experiences, the software IPMetrix was used to perform the data mining. The process of
data selection, loading, cleaning and transformation is described in each chapter, according to the
work performed on the data for the specific case.
4 Evaluation
In engineering, Shah et al. (2003) suggest that the success of ideation must consider the extent to
which the idea or design fulfills the requirements, as opposed to cognitive psychology where ideation
effectiveness is usually measured by fluency (number of ideas) and novelty (how different the idea is
to other solutions). They propose to evaluate idea generation by the process or by the outcome, using
the criteria of quality, quantity, variety and novelty.
Given that, to the knowledge of the author, there is currently no method to objectively measure the
quality of an idea, and therefore will not be included in the evaluation criteria. It is also assumed that
the concepts will be applicable to the problem at hand. Consequently, the focus will be on the
complexity and variety of ideas.
Complexity refers to the level of subsystems considered in the study of the problem (Ardaiz-
Villanueva et al., 2011), while the variety measures the number of categories in which the solutions
could be divided (Glier et al. 2011, Wodehouse & Ion 2012). An increase in both this metrics would
suggest that the participants were able to look for different types of solutions and did not gravitate
towards known solutions.
5 Expected results
By including data analytics in the early creative stages of engineering design, we could see an
improvement in the complexity and variety of the resulting concepts. It is expected that the number of
ideas will not increase significantly, or will even decrease, given that the creativity exercise is not to
diverge in a brainstorm but to try to find a new way to connect the disconnected elements. However,
we expect that idea generation sessions where participants are given concepts to blend will result in a
greater variety of technical solutions and with increased novelty compared to sessions where
participants do not have this support.

10
6 Cases
The objective of this research was to find ways to assist teams in engineering design efforts to
improve the early stages, by enhancing their process with data as a creative input. Therefore, it was
decided to perform several iterations in order to detect the needs of participants, correct the method
and apply again. One entrepreneurship challenge calling for engineering teams to develop innovative
solutions related to water conservation provided the framework for three different events, where
teams were supported with data, in hopes of increasing the novelty and diversity of proposed
solutions. The three cases were performed in a university setting. Each case presents the scope,
evaluation, results and conclusions.
6.1 Case 1 - Need identification / Problem definition
In the first experience, participants in a creativity session were asked to identify needs or problems
(first stage of the engineering design process) related to water conservation. The participants were
self-selected, as an open call was published in the school’s weekly announcements, and all members
of the community were eligible to participate. No previous knowledge was required.
To begin, teams were asked to identify the elements of the problem world, to help them identify their
current knowledge on the issue. Examples of the work made by the teams is shown in Figure 4.
Figure 1. Teams list the elements of the issue
Then, to identify needs and define problems, teams were asked to make a list of the key issues that
can stem from the elements in the problem world. Examples of the work performed by the teams is
shown in figure 5.

11
Figure 2. Teams identify key issues
Because of the limited time, teams were not trained in the data exploration tool from IPMetrix. The
researcher performed some of the KDD steps in advance, to have data visualizations ready for the
session. The teams were given intermediate access to explore data in a data mining tool, meaning they
could explore, but not make new searches or add data.
Figure 6. KDD steps performed by the researcher and the teams in Case 1
Teams were able to identify problems within their knowledge. The analysis of the results indicates
that participants gravitated towards terms and keywords related to previously generated ideas, thus the
increase in novelty was low. It was found that, left to select relevant information by themselves, teams
select data which confirm or support their ideas. A summary of the results is shown in Table 4.
Table 4. Results of issues identified per group
Group Number of
participants
Issues identified
originally
Issues identified
with support
Total
1 5 5 3 8
2 6 3 1 4
3 4 5 2 7
Case Actor
Data
selection
Data
pre-processing
Data
transformation
Data
mining
Interpretation
and evaluation Application
Researcher
Participants1

12
In order to correct the issue of intermediate exploration, it was decided to train participants in the use
of the data mining tool for subsequent cases; if teams have more freedom to explore data, they can
potentially generate more novel combinations.
6.2 Case 2 - Development of alternative solutions
For this experience, teams in an intensive summer course were tasked with proposing innovative
engineering solutions for water conservation. The students in the teams were trained in the use of the
data exploration tool. The teams were then invited to continue using the tool to generate new ideas,
meaning they had high access to the data exploration tool; they were able to add data, and make
searches.
Figure 7 shows the steps in which the researcher and the participants in the teams were involved. The
researcher pre-loaded data and applied different analyses to demonstrate the use of the tool and
facilitate the adoption of the data searches by participants.
Figure 7. KDD steps performed by the researcher and the teams in Case 2
Half of the teams elected to use the tool to identify clues for innovative solutions. The researcher was
not informed of this until after the course was completed. A summary of the findings is shown in
Table 5.
Table 5. Analysis of changes to team solutions
Team Use of data
mining tool
Observable changes Sophistication
increase
1 No Added automation of the garbage pick-up, using a static pole
in the shore
Intermediate
2 No Changed “net” (flexible) to “cone” (rigid) Low
3 Yes Designed complete system based on buoys High
4 Yes Improved sample taking device, designed complete system
(management platform, transportation device, test kit)
High
5 Yes Designed flexible and energy-capturing (subsystems) wave-
breaking pillars (system)
High
6 No Developed a business model based on local advertisement Low
7 Yes Identified user segments, designed physical solution to go
along digital
Intermediate
8 No Aesthetic improvements to design Low
Teams participating in the summer school presented their solutions to an external panel of experts,
Case Actor
Data
selection
Data
pre-processing
Data
transformation
Data
mining
Interpretation
and evaluation Application
Researcher
Participants2
13
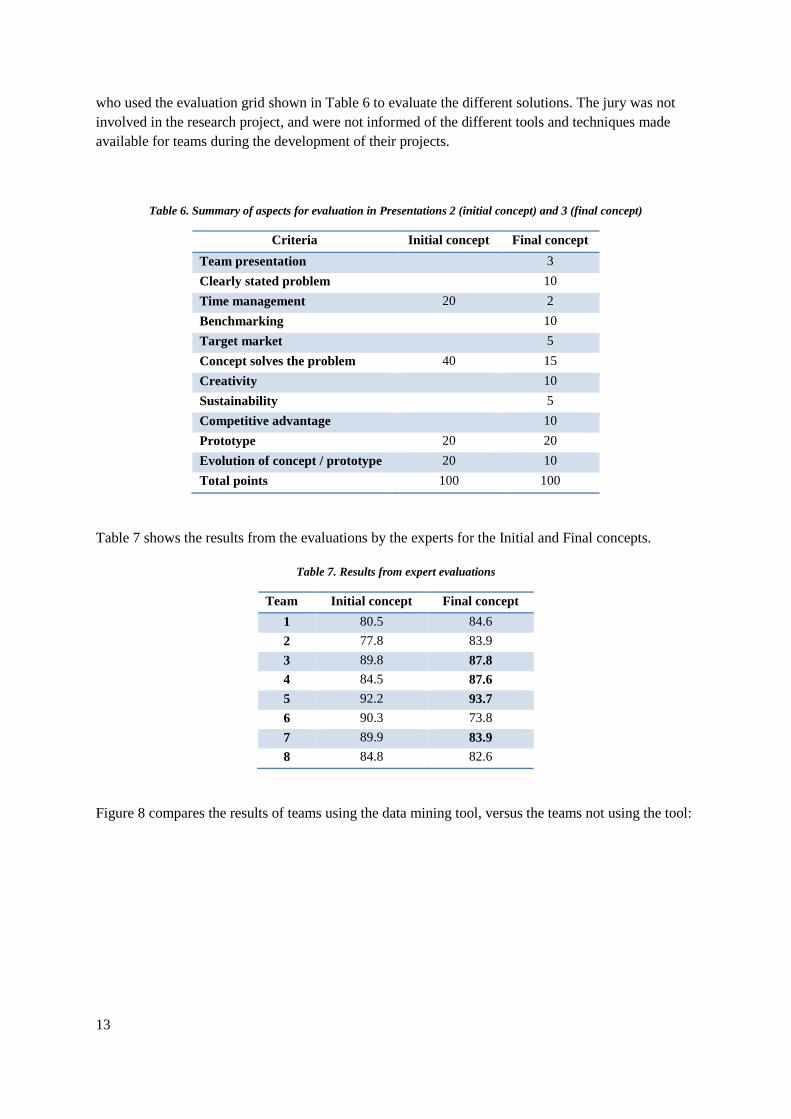
who used the evaluation grid shown in Table 6 to evaluate the different solutions. The jury was not
involved in the research project, and were not informed of the different tools and techniques made
available for teams during the development of their projects.
Table 6. Summary of aspects for evaluation in Presentations 2 (initial concept) and 3 (final concept)
Criteria Initial concept Final concept
Team presentation 3
Clearly stated problem 10
Time management 20 2
Benchmarking 10
Target market 5
Concept solves the problem 40 15
Creativity 10
Sustainability 5
Competitive advantage 10
Prototype 20 20
Evolution of concept / prototype 20 10
Total points 100 100
Table 7 shows the results from the evaluations by the experts for the Initial and Final concepts.
Table 7. Results from expert evaluations
Team Initial concept Final concept
1 80.5 84.6
2 77.8 83.9
3 89.8 87.8
4 84.5 87.6
5 92.2 93.7
6 90.3 73.8
7 89.9 83.9
8 84.8 82.6
Figure 8 compares the results of teams using the data mining tool, versus the teams not using the tool:

14
Figure 8. Results from teams using the data mining tool vs. teams not using the data mining tool
Teams who chose to explore data for creative support found improvements or components from
existing solutions to advance their own design, and received more positive evaluations by a jury of
experts. However, the objective of obtaining more diverse or novel solutions was not achieved. A
possible explanation is that the use of the tool can overwhelm participants with too many options to
explore, bringing teams back to known solutions. A possible solution to the issue of too many options
is to have an external actor (such as a moderator) extract keywords from the data, and provide
participants with these terms to combine into novel ideas.
6.3 Case 3 - Idea generation
To correct the issue of too many options to explore the data, teams participating in an intensive
limited-time innovation contest were given keywords selected by the researcher. Teams were given
the keywords early in the process, and were thus able to integrate them in their idea generation
process. In other words, participants had low access to explore data in a data mining tool. The
researcher performed the data analysis for two challenges in the competition, and selected keywords
relevant to the knowledge base of the problem. Figure 9 illustrates the steps performed by the
researcher and the participants in this case.
Figure 9. KDD steps performed by the researcher and the teams in Case 1
Case Actor
Data
selection
Data
pre-processing
Data
transformation
Data
mining
Interpretation
and evaluation Application
Researcher
Participants3

15
To be able to compare the results from teams with keyword support, “twin challenges” were selected.
These challenges had similar scopes and constraints, meaning their solutions could be mapped into
comparable elements. Table 8 summarizes the teams participating with each challenge.
Table 8. Summary of teams, participants for each challenge
Challenge Keyword
cues
Number
of teams
Number of
participants
Type A - Challenge 1. Taking water samples from
the river Yes 15
+93
1 team did not specify
Type A - Challenge 3. Examine, clean and repair
damaged sewer pipes No 10
+55
2 teams did not specify
Type B - Challenge 2. Notifying the population
about the river’s water quality Yes 5 36
Type B - Challenge 4. Recognize and list the
river’s rare or invasive species No 4 28
After the event was completed, the researcher studied all the solutions proposed for each challenge,
transcribing the description verbatim. Then, the variety of the solutions for each challenge was
measured as a score counting the different types proposed that fulfill the objective. We identified two
levels where the variety can be measured, first, for the type of solution, and second for the elements
that resolve the constraint proposed in the challenge. Figures 10-13 show the screenshots depicting the
types of proposed solutions to each challenge.
Figure 10. Screenshots for Challenge 1 (Type A) - Seven solution types

16
Figure 11. Screenshots for Challenge 3 (Type A) - Four solution types
Figure 12. Screenshots for Challenge 2 (Type B) - Five solution types

17
Figure 13. Screenshots for Challenge 4 (Type B) - Two solution types
Table 9 summarizes the types of solution found for each challenge, based on the description:
Table 9. Summary of types of solution for each challenge
Challenge Keyword
cues Solution types
Total solution
types
Type A
Challenge 1 Yes
floating, flying, hybrid floating-flying, submersible,
hybrid submersible-vehicle, fixed stations, service 7
Type A
Challenge 3 No propeller, wheels, turbine, probe 4
Type B
Challenge 2 Yes
buoys, water filter, water dispenser, interactive mirror,
information panels 5
Type B
Challenge 4 No game, simulation 2
The results show that teams who selected the keyword supported challenges generated more diverse
and novel ideas, compared to teams without the support. By providing relevant keywords, it was
possible to obtain the benefits of the KDD without the issues of training participants on the use of the
tool, and the resources teams would have to dedicate to explore the data. Figures 14-16 compare the
results for Type A and Type B challenges.

18
Figure 14. Type of solutions for Type A and Type B challenges
Figure 15. Elements per comparable constraint in Type A challenges
Figure 16. Elements per comparable constraint in Type B challenges

19
7 Conclusions
Using data as creative input can help teams look for more diverse solutions, as it can expose team
members to key pieces of data that can trigger new solution paths. However, it is recommended to
determine whether the objective of including data in an EDP effort is to generate a novel idea or to
solve a problem.
To generate novel ideas, it seems preferable to provide data in the form of keywords selected by an
external actor, to prompt original combinations. If the team is searching for incremental
improvements or elements of existing solutions, then it appears to be beneficial to have access to a
knowledge base to explore. It is important to delimit the exploration to avoid becoming stunned
because of the amount of available information.
The three cases in this research showed that data analytics can be utilized in different moments of the
early creative stages of the engineering design process, and that the access to the data can help teams
expand their ideation outside their previously known solutions. Further work is of course needed to
test different levels of access in the stages of the engineering process; for example, it would be
interesting to study the use of pre-selected keywords in the need identification stage, to see if the
problem identification can also be diversified.
While the inclusion of a data exploration tool can be challenging for most organizations, their
application can have a positive impact in the context of innovation.
8 References
Ackoff, R.L. (1989). From data to wisdom. Journal of applied systems analysis, 16 (1), 3-9.
Adamczyk, S., Bullinger, A. C., & Möslein, K. M. (2012). Innovation contests: A review,
classification and outlook. Creativity and Innovation Management, 21(4), 335-360.
Ardaiz-Villanueva, O., X. Nicuesa-Chacón, O. Brene-Artazcoz, M. L. Sanz De Acedo Lizarraga and
M. T. Sanz De Acedo Baquedano (2011). "Evaluation of computer tools for idea generation
and team formation in project-based learning." Computers and Education 56(3): 700-711.
Atman, C. J., Adams, R. S., Cardella, M. E., Turns, J., Mosborg, S., & Saleem, J. (2007). Engineering
design processes: A comparison of students and expert practitioners. Journal of engineering
education, 96(4), 359-379.
Baesens, B. (2014). Analytics in a big data world. Hoboken: John Wiley & Sons.
Chen, P. L., Li, S. C., & Hung, M. T. (2013, July). Co-occurrence analysis in innovation management:
Data processing of an online brainstorming platform. In Technology Management in the IT-
Driven Services (PICMET), 2013 Proceedings of PICMET'13: (pp. 688-694). IEEE.
Dove, G. and S. Jones (2014). "Using Information Visualization to Support Creativity in Service
Design Workshops." Proceedings Service Design.

20
Dubitzky, W., Kötter, T., Schmidt, O., & Berthold, M. R. (2012). Towards creative information
exploration based on Koestler’s concept of bisociation (pp. 11-32). Springer Berlin
Heidelberg.
Ertas, A., & Jones, J. C. (1996). The engineering design process (2nd ed. ed.). New York, N.Y.: J.
Wiley and Sons.
Fayyad, U., Piatetsky-Shapiro, G., & Smyth, P. (1996). From data mining to knowledge discovery in
databases. AI magazine, 17(3), 37
Fleming, L., & Szigety, M. (2006). Exploring the tail of creativity: An evolutionary model of
breakthrough invention. Advances in Strategic Management, 23, 335-359.
Glier, M. W., S. R. Schmidt, J. S. Linsey and D. A. McAdams (2011). "Distributed ideation: Idea
generation in distributed capstone engineering design teams." International Journal of
Engineering Education 27(6): 1281-1294.
Hamman, M. (2000). "Priming computer-assisted music composition through design of
human/computer interaction." Mathematics and Computers in Modern Science - Acoustics
and Music, Biology and Chemistry, Business and Economics: 75-82.
Koestler, A. (1964). The act of creation.
Manning, C., Raghavan, P., & Schutze, H. (2009). Introduction to information retrieval (1st ed.).
Cambridge: Cambridge University Press.
Müller, L., Wetzel, T., Hobohm, H. C., & Schrader, T. (2012, November). Creativity Support Tools
for Data Triggered Hypothesis Generation. In Knowledge, Information and Creativity Support
Systems (pp. 24-27).
Nielsen, M. (2012). Reinventing discovery. Princeton, N.J.: Princeton University Press.
Shan, Z., Zhu, Y. & Zhao, T. (2013). Kaleidoscope: Computer-Assisted Ideation through Idea
Network Exploration. CS 224W 2013 Project Final Report. Department of Computer Science,
Stanford University.
Shah, J. J., N. Vargas-Hernandez and S. M. Smith (2003). "Metrics for measuring ideation
effectiveness." Design Studies 24(2): 111-134.
Wodehouse, A. and W. Ion (2012). "Augmenting the 6-3-5 method with design information."
Research in Engineering Design 23(1): 5-15.