Embed Size (px)
Citation preview

Data Analysis Tool for theEU H2020 City.Risks Operation Center
Erik Zocher (4797383)[email protected]
A thesis presented for the degree ofBachelor of Science
Advisors:Prof. Dr. Agnes VoisardProf. Dr. Katinka Wolter
Supervisor:Paras Mehta
Freie Universitat BerlinDepartment of Computer Science & Mathematics
Institute for Computer ScienceResearch Group: Databases and Information Systems
2nd August 2017Berlin, Germany

Abstract
The bachelor thesis is about the implementation of a Data Analysis Toolfor the City.Risks Project funded by the Horizon 2020 (H2020) EuropeanResearch and Innovation program. The aim is to develop an interface thatis easy to interact with but in the same time provides all the necessary toolsto conveniently gain knowledge out of a large dataset. This is achieved byusing a search engine for the implementation and various user-centered de-sign methods to design a user-friendly graphical user-interface that providesvisualizations of the dataset as well as the possibility to search through thedataset by keywords. The underlying functionality is achieved by implement-ing a search engine with Lucene and Elasticsearch. The design of the userinterface is realized by iteratively applying user-centered design methods likeheuristic evaluation, action analysis and think-aloud.
Keywords user-centered design, search engine, observer design pattern,angular2+, elasticsearch, lucene
Die vorliegende Bachelorarbeit behandelt die Entwicklung eines Datenanaly-setools fur das von der europaischen Union im Rahmen des Forschungs- undInnovationsprogramms Horizon 2020 geforderten Projekts City.Risks. Zielist, eine Benutzeroberflache zu entwickeln mit der sich leicht interagierenlasst, welche gleichzeitig alle notigen Werkzeuge zur Verfugung stellt, um aufeinfache Art und Weise neue Einsichten aus einem großen Datensatz zu erhal-ten sowie die Moglichkeit in dem Datensatz nach Schlagwortern zu suchen.Die zugrunde liegende Funktionalitat wird durch die Implementierung einerSuchmaschine mit Lucene und Elasticsearch erreicht. Der Entwurf der Be-nutzerschnittstelle wird durch die wiederholte Anwendung von nutzerzen-trierten Designmethoden wie heuristische Auswertung, Aktionsanalyse undThink-Aloud realisiert.
Schlagworter Nutzerorientierte Gestaltung, Suchmaschine, Beobachter(Entwurfsmuster), Angular2+, Elasticsearch, Lucene

Contents
List of Figures II
List of Tables III
Listings IV
List of Abbreviations VI
1 Introduction 11.1 Motivation . . . . . . . . . . . . . . . . . . . . . . . . . . . . . 11.2 Outline of Contribution . . . . . . . . . . . . . . . . . . . . . . 21.3 Structure of the Thesis . . . . . . . . . . . . . . . . . . . . . . 3
2 Background 42.1 Context of Work . . . . . . . . . . . . . . . . . . . . . . . . . 4
2.1.1 EU H2020 City.Risks . . . . . . . . . . . . . . . . . . . 42.1.2 City.Risks Operation Center . . . . . . . . . . . . . . . 5
2.2 Definitions . . . . . . . . . . . . . . . . . . . . . . . . . . . . . 52.3 Related Work . . . . . . . . . . . . . . . . . . . . . . . . . . . 6
2.3.1 Data Visualization . . . . . . . . . . . . . . . . . . . . 62.3.2 Search . . . . . . . . . . . . . . . . . . . . . . . . . . . 72.3.3 Geospatial and Temporal Visualization . . . . . . . . . 72.3.4 Research Results . . . . . . . . . . . . . . . . . . . . . 8
3 Design and Evaluation of the Data Analysis Tool 93.1 Requirement Analysis . . . . . . . . . . . . . . . . . . . . . . . 9
3.1.1 Functional Requirements . . . . . . . . . . . . . . . . . 93.1.2 Non-functional Requirements . . . . . . . . . . . . . . 10
3.2 Design of the Frontend . . . . . . . . . . . . . . . . . . . . . . 10
I
3.2.1 Method: User-Centered Design . . . . . . . . . . . . . 103.2.2 Target Group . . . . . . . . . . . . . . . . . . . . . . . 113.2.3 Personas . . . . . . . . . . . . . . . . . . . . . . . . . . 113.2.4 User Stories . . . . . . . . . . . . . . . . . . . . . . . . 133.2.5 First Iteration . . . . . . . . . . . . . . . . . . . . . . . 143.2.6 Second Iteration . . . . . . . . . . . . . . . . . . . . . 19
3.3 Design of the Backend . . . . . . . . . . . . . . . . . . . . . . 223.3.1 Incident Data . . . . . . . . . . . . . . . . . . . . . . . 223.3.2 Technology Analysis . . . . . . . . . . . . . . . . . . . 24
4 Implementation of the Data Analysis Tool 264.1 Architectural Pattern . . . . . . . . . . . . . . . . . . . . . . . 274.2 Design Pattern . . . . . . . . . . . . . . . . . . . . . . . . . . 274.3 Implementation of the Frontend . . . . . . . . . . . . . . . . . 28
4.3.1 Frontend Framework . . . . . . . . . . . . . . . . . . . 324.3.2 Plugins, Libraries, Frameworks . . . . . . . . . . . . . 33
4.4 Implementation of the Backend . . . . . . . . . . . . . . . . . 34
5 Results 395.1 Summary . . . . . . . . . . . . . . . . . . . . . . . . . . . . . 39
6 Discussion 416.1 Conclusions . . . . . . . . . . . . . . . . . . . . . . . . . . . . 416.2 Limitations . . . . . . . . . . . . . . . . . . . . . . . . . . . . 426.3 Outlook . . . . . . . . . . . . . . . . . . . . . . . . . . . . . . 42
References 43
Appendices 47
A Images of Mockups and final Implementation 48A.1 First Iteration Visualize View . . . . . . . . . . . . . . . . . . 49A.2 First Iteration Search View . . . . . . . . . . . . . . . . . . . . 50A.3 Second Iteration Mockup . . . . . . . . . . . . . . . . . . . . . 51A.4 Implementation of Data Analysis Tool . . . . . . . . . . . . . 52
B Mapping of Elasticsearch Index 53
C Transcription of Interviews 56
II

List of Figures
3.1 Persona Sofia Rossi . . . . . . . . . . . . . . . . . . . . . . . . 123.2 Persona Robert Lewis . . . . . . . . . . . . . . . . . . . . . . 123.3 Mockup for first Iteration of Visualize Tab . . . . . . . . . . . 153.4 Mockup for first Iteration of Search Tab . . . . . . . . . . . . 153.5 Second Iteration Mockup . . . . . . . . . . . . . . . . . . . . . 20
4.1 Implemented Data Analysis Tool . . . . . . . . . . . . . . . . 264.2 Implemented Data Analysis Tool with Components . . . . . . 284.3 Observable Data Service . . . . . . . . . . . . . . . . . . . . . 294.4 Communication between two Components . . . . . . . . . . . 314.5 Backend Architecture . . . . . . . . . . . . . . . . . . . . . . . 34
III
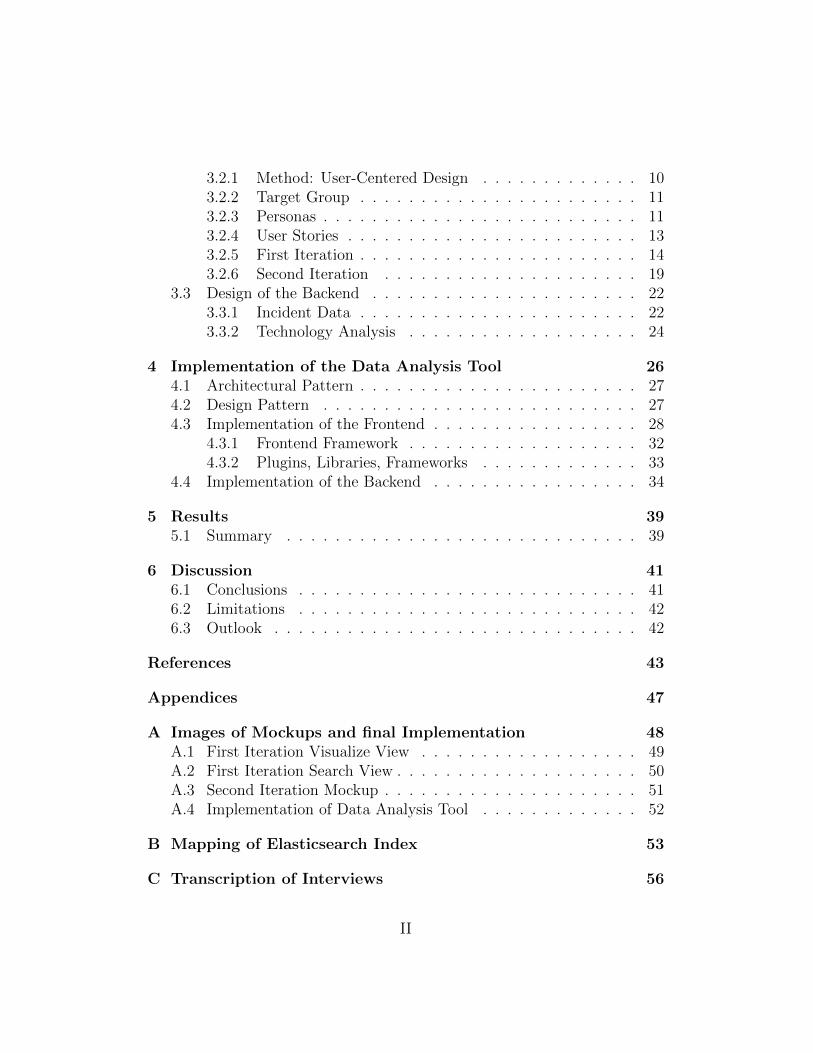
List of Tables
3.1 Action Analysis for first Iteration . . . . . . . . . . . . . . . . 193.2 Action Analysis of second Iteration . . . . . . . . . . . . . . . 213.3 Comparison of different Search Engines . . . . . . . . . . . . . 25
5.1 Action Analysis Comparison . . . . . . . . . . . . . . . . . . . 40
IV

Listings
3.1 Sample Incident (JSON) . . . . . . . . . . . . . . . . . . . . . 234.1 Result-table Component Initialization . . . . . . . . . . . . . . 304.2 Observable Data Service . . . . . . . . . . . . . . . . . . . . . 304.3 Communication between two Components . . . . . . . . . . . 314.4 Logstash Configuration . . . . . . . . . . . . . . . . . . . . . . 354.5 Flatten Objects in Nested Array in Elasticsearch . . . . . . . . 364.6 Elasticsearch DSL Query Example . . . . . . . . . . . . . . . . 37B.1 Mappings for Elasticsearch Docment Index . . . . . . . . . . . 53
V
List of Abbreviations
API Application Programming Interface
DAT Data Analysis Tool
DSL Domain-Specific Language
H2020 Horizon 2020, the European Research and Innovation Action
IDF Inverse Document Frequency
ID Identifier
IoT Internet of Things
JSON JavaScript Object Notation
NoSQL Not only SQL
NPM Node Package Manager
REST Representational State Transfer
RxJS Reactive Extensions for JavaScript
TF Term Frequency
URL Uniform Resource Locator
VI

Statutory declaration
I declare that I have developed and written the enclosed Bachelor Thesiscompletely by myself, and have not used sources or means without declara-tion in the text. Any thoughts from others or literal quotations are clearlymarked. The Bachelor Thesis was not used in the same or in a similar versionto achieve an academic grading or is being published elsewhere.
Berlin (Germany), 02nd August 2017
Erik Zocher
VII

Chapter 1
Introduction
The first chapter provides the motivation for developing the software thatis used to generate insights into spatial and temporal data, the goals of thisthesis as well as the structure of the work.
1.1 Motivation
”Data by itself is of no value unless it is processed to obtaininformation [..]”[1]
More and more data is produced every day. IBM stated in 2013 that ”90% ofthe data in the world today has been created in the last two years alone.”[2]Yet according to the MIT Technology Review Author Antonio Regalado”only about 0.5 percent of that data is ever analyzed.”[3] Gaining valuableinsights out of data has become an huge market in the last few years andincreases a lot in the future. According to the International Data Corpora-tion the Data and Business Analytics market is predicted to grow its revenuenearly 50% in five years from $122 Billion in 2015 to more than $187 billionin 2019. Nearly $55 billion of this revenue in 2019 is made from Software,like End-User Query, Reporting, Analysis and Data Warehouse ManagementTools.[4] The crucial parts for those software solutions, according to RitaSallam, research vice president at Gartner, Inc. are ”design, implementationand support.”[5]As part of the City.Risks project funded by the European Union, an opera-tion center is being developed in which information from citizens, authoritiesand devices is collected and further processed. This operation center lacks an
1
effective way to efficiently analyze and visualize the collected data over a longperiod of time. Such a tool is essential to all decision-makers and can formthe basis for meaningful future decisions. Questions that can be clarifiedare, for example: What time and in which neighborhood occur most thefts?Which objects are stolen most frequently? Furthermore, by analyzing theuser feedback, it is possible to find the most important topics for inhabitantsof a district and to adapt the political and strategic decisions accordingly.
1.2 Outline of Contribution
The goal of the bachelor thesis is the creation of an effective tool for theanalysis and visualization of the data collected within the framework of theCity.Risks project. The application is supposed to be able to enrich and in-dex data with metadata, to examine the data with common analysis methodsand to find suitable ways to visualize them and help users gain new insights.The application is designed to integrate seamlessly into the existing struc-tures of the City.Risks project, be easy to use, and have an attractive userinterface.Most applications for indexing and navigating large data sets already haveall the necessary tools to store, index, and search the edited records in auser-friendly way. The two largest open source search engines are Luceneand Sphinx. Lucene lays the foundation for two open source software pack-ages that add additional functionality to the aforementioned search engineand are named Elasticsearch and Apache Solr.[6] Elasticsearch, Apache Solrand Sphinx are presented in more detail during the course of the work andthe appropriate search engine is selected for implementing the backend ofour Data Analysis Tool. The main part of this thesis deals with the develop-ment of a user-friendly interface. A user-centered design approach is chosen.It starts with the think-aloud method of a prototype and is then furtherimproved with a heuristic evaluation combined with the action analysis forevery iteration stage.
2

1.3 Structure of the Thesis
The first chapter gives the motivation for the bachelor thesis, the outlineof contribution and the structure of the thesis. Chapter 2 deals with theBackground and the context of the thesis. It gives a brief overview overthe EU H2020 City.Risks project in which the thesis is integrated, givesdefinitions for some of the underlying elements and explains the related workthat has been done in similar fields. Chapter 3 deals with the design andevaluation of the Data Analysis Tool (DAT). It looks at the requirementsfor the DAT and examines the provided data. This chapter also introducesthe available software to realize the backend and selects the right one for theapplication. Furthermore Chapter 3 deals with the design and evaluationprocess of a user interface for the DAT. Therefore target groups, Personasderived from that target groups and user stories are created. Furthermoretwo interface iterations are created and subsequently evaluated with heuristicevaluation, action analysis and think-aloud evaluation. The final iterationis implemented. The important steps of that implementation as well asinteresting code snippets are described in Chapter 4. Chapter 5 provides thesummary. Chapter 6 provides the conclusions, the limitations as well as theoutlook of the bachelor thesis.
3

Chapter 2
Background
This chapter provides an overview over the framework for the bachelor thesisas well as important definitions and related work.
2.1 Context of Work
This section gives a brief overview over the City.Risks project and introducesthe operation center that contains the Data Analysis Tool.
2.1.1 EU H2020 City.Risks
The framework for this bachelor thesis is the City.Risks research and innova-tion action project funded by the European Union within the Horizon 2020program. One of the goals of City.Risks is to investigate whether there isa relationship between perceived and actual anxiety as well as the percep-tion of security in large cities. It is intended to use the applications of theCity.Risks project to provide a secure space for residents and authorities toorganize in groups and to communicate directly. Examples could be that anauthority informs all residents in a particular area about an unforeseen eventin the neighborhood or individual citizens communicate to the authoritieswhere problems occur in their surrounding area. Furthermore, a sensor isdeveloped, that can be attached to objects and then localized with the helpof smartphones and other receivers.[7]
4

2.1.2 City.Risks Operation Center
As part of the City.Risks project an operation center is developed where theuser generated and the sensor data is managed in a central application. Userssend information about incidents in their surrounding area via a smartphoneapplication to the operation center. The data from the sensors also arrivesat the operation center and gets further processed. The operator of the oper-ation center can issue alerts that are sent to citizens who use the City.Riskssmartphone application and warn them about incidents in their area. Themodule which is developed within the bachelor thesis is intended to be usedin this operation center.
2.2 Definitions
Design Pattern
According to the book Design Patterns – Elements of Reusable Object- Ori-ented Software[8] ”[a] design pattern names, abstracts, and identifies thekey aspects of a common design structure that make it useful for creating areusable object-oriented design.” or in general ”[a design pattern] describesthe core of the solution to that problem.”
Elasticsearch
”Elasticsearch is a distributed, scalable, real-time search and analytics en-gine.”[9] In contrast to a regular database, the process of inserting new rowsinto a table is called indexing in Elasticsearch and what would be a new tablerow in a relational database is called a document.
Inverted Index
An inverted index saves the locations of occurrence for a term in a textcollection similar to an index in a book. It is used in most of informationretrieval systems like search machines.[10]
5

Open Source
In software development open source means that the source code of the soft-ware is freely available for everyone to look at and in most cases the softwarecan be improved or new features can be added by other developers.[11]
REST
Representational State Transfer (REST) is “an architectural style consistingof [a] set of constraints applied to elements within the architecture”.[12] Theseconstraints are client-server architecture, stateless communication, ability tocache the response of a request for later use, uniform or standardized interfacethat simplifies the architecture, a layered system for security as well as acode-on-demand style that allows downloading and executing of code.[12]
User-Centered Design
The ISO 9241 part 210: Ergonomics of human-system interaction - Human-centered design for interactive systems defines user-centered as
”approach to systems design and development that aims tomake interactive systems more usable by focusing on the use ofthe system and applying human factors/ergonomics and usabilityknowledge and techniques.”
2.3 Related Work
The main focus of this work is how to efficiently visualize and search throughlarge datasets to get new insights about the available data. Therefor thissection gives an overview over the state of the art of search and visualizationof data and an overview over a special form of visualizing data, geospatialand temporal visualizations.
2.3.1 Data Visualization
The biggest paradigm shifts in data analysis software according to Gart-ner, Inc. are from IT-centric complete solutions to smaller modular data-centric software solutions and the shift from simple system of record reportsto visual-based exploration to gain insights.[5] The large integrated software
6

solutions from old market leading manufacturers such as SAP and IBM hadto adapt themselves and their range of functions to this paradigm shift inrecent years in order not to lose the connection to new emerging companiessuch as the current market leader in this segment Tableau or QLik. Thebiggest advantage of these data-driven software solutions is that they can beimplemented much quicker, therefore achieve results significantly faster andcan be adapted to requirement changes quickly. The next major paradigmshift into the world of data analysis software is the arrival of machine learningand the automation of knowledge extraction.[5]
2.3.2 Search
A perfect example of why it is necessary to search through large datasetsis the Internet. Without search engines like Google Search, Microsoft Bingor DuckDuckGo the Internet would not be as accessible as it is today. Oneof the biggest trends in search at the moment is contextual search.[13] Thatmeans the user provides additional information, like a location, his favoritefood, etc. and the search engine delivers results depending on the externalcriteria. Companies like Google that provide a variety of services for usersthen use the provided data (e.g.: via Google Mail) to suggest results based oninformation from e-mails like appointment dates or gives information abouttraffic jams on a regular way home based on tracked smartphone GPS sig-nal. The second trend deals with the integration of search into IoT devices.Amazon’s Alexa, Apple’s Siri or Microsoft’s Cortana allow users to searchfor answers without typing them into an input element, simply by talking tothe device.[14] The third general trend is to go away from universal search,like Google Search, that delivers results to every topic to more specializedsearch engines, like amazon.com for buying goods or skyscanner.de for cheapflights.[15]
2.3.3 Geospatial and Temporal Visualization
The form of visualizing complex geospatial and temporal data is in almost allcases tailored to highly individual projects. Requirements, like the necessityto be free and open source or the integration into existing projects, are usuallytoo complex to be solved by standard software like the data visualization toolKibana that is part of the Elasticsearch technology stack. The mentioned
7

application provides the basic functionality to visualize aggregated datasetsalso on maps using its built-in functionalities, but in practice fails to incorpo-rate it into existing projects in a satisfying way. It provides two ways to usevisualizations, first to create a Kibana branded dashboard with all wantedvisualizations or to use single visualizations and incorporate them into anapplication via an iFrame. None of both ways meet the requirements. Otherdata visualization software like tableau provides the same basic, very wellmade functionality but fails to adapt to highly individual and special usecases. A very interesting project in the field of geospatial and temporal datavisualization is the GeoVISTA CrimeViz project. It is a ”web-based map-ping application supporting visual analytics of criminal activity in space andtime”. It was developed between 2013 and 2015 for the Harrisburg Bureauof Police.[16] The application operates on a special dataset for the Americancity of Columbia. Adapting the software to the City.Risks use case wouldn’tbe an easy task to solve. But the core functionalities of CrimeViz, like themap panel for visualizing crime scenes, a data layer panel to adjust the out-come and the temporal panel to visualize crime over time lays out a goodstarting point for developing the application for the City.Risks project.
2.3.4 Research Results
The biggest advantages of the software developed in this bachelor thesis arethe seamless integration into the City.Risks operation center, because of itsmodular data-centric approach as well as the development of the user in-terface according to user requirements using user-centered design methods.Furthermore, no software license fees are charged and the code is going tobe completely available for inspection so it can be adapted to future changerequests.
8

Chapter 3
Design and Evaluation of theData Analysis Tool
This chapter starts with the requirements for our software. The main partsof this chapter are the design and evaluation of the frontend user interfaceusing the user-centered design method and the design of the backend. Aspart of the backend design process this chapter examines the available dataused in the City.Risks project and what available software is on the marketthat supports the development of our application backend in a convenientway.
3.1 Requirement Analysis
This section deals with the question of what functional and non-functionalrequirements the software should have.
3.1.1 Functional Requirements
Multiuser Many users must be able to use the software at the same time.
Data storage The data must be collected and stored for a long period oftime.
Searchable The software has to enable users to search through the datasetof incidents via keywords.
9

Visualization The software visualizes the available data in a way that auser can gain knowledge from it.
3.1.2 Non-functional Requirements
Performance The search and visualization tools should deliver the userdesired goals in a quick way.
Usability The user needs to reach his goal in an effective way. It mustbe easily understandable for the user what is possible with the software, thefunctionality should be self explanatory and easy to learn.
3.2 Design of the Frontend
This section describes the user-centered design method and the different pro-cesses that are executed in order to evaluate design of the frontend.
3.2.1 Method: User-Centered Design
The design for the frontend is done by using an iterative user-centered designapproach. The first part of this section deals with the research about thetarget group, the creation of user personas and user tasks that subsequentlybecome the basis for the design and evaluation process. For the design andevaluation process the methods think-aloud, heuristic evaluation and actionanalysis were used. These methods are used two times to generate findings inevery iteration and lead into the creation of a new and improved prototypefor every iteration.
Think-Aloud
The think-aloud method is one qualitative user-centered design method thathelps finding inaccuracies and errors of a user interface by solving user storiesand communicating every step and decision the user made.[17]
Heuristic Evaluation
Heuristic evaluation can be ”quantitative, which uses statistical functionsand countable techniques, and qualitative, using techniques such as those
10

that involves the experience and knowledge of experts or those belongingto knowledge discovery data (KDD) discipline (by example).”[18] For theevaluation of the user interface we focus on the qualitative approach to eval-uate the user interface. For this approach the user feedback is not consideredand the improvements are based on different design heuristics and principles.We used the list of heuristics from Jakob Nielsen[19] as the main source forderiving improvements for the next iteration.
Action Analysis
The action analysis is a quantitative approach ”[b]ased on categorized user-program interactions”[20] like time until a task is completed, the number ofclicks necessary to solve certain tasks or the number of errors that happenwhile fulfilling a task.
3.2.2 Target Group
In order to efficiently work with the user-centered design method it is nec-essary to define a target group for the application. This helps to betterunderstand the user needs and to have a clear idea of who is the audiencethat uses the software. The City.Risks operation center is used initially bythe city administration of three major European cities: London, Rome andSofia. The operation center is operated by ”Agents” that are supervised bya ”Supervisor”. In the European Union it is more likely that the Agent orassistant in civil service is female (65%) and the supervisor or in generalan administrator is male (62%).[21] From this we derive two personas, SofiaRossi (Figure 3.1) a female ”Agent” and Robert Lewis (Figure 3.2), a male”Supervisor”.
3.2.3 Personas
The personas are based on two of the 12 archetypes from Carol S. Pearson’sbook Awakening the Heroes Within: Twelve Archetypes to Help Us FindOurselves and Transform Our World. [22] While Sofia Rossi represents theOrphan, Robert Lewis represents the Ruler.
11

Figure 3.1: Persona Sofia Rossi1
Figure 3.2: Persona Robert Lewis2
12

”Agent” Sofia Rossi Sofia Rossi is 31 years old, married, with one childand lives together with her child and husband in an apartment in Ostiensea district of Rome, Italy. Everyday she commutes 30 minutes to work. Sheis working in city administration for the last 7 years as office worker dealingmainly with town planning duties. She has gathered a profound knowledge inher field of expertise and is pretty happy with her safe job. She is a graduatewith a bachelor degree and her annual income is 36.000 Euro. She likes touse social networks to stay up to date and to communicate with friends andfamily. Besides the software she uses for work on a daily basis, she is not veryexperienced in handling different technological devices. She likes travelingand goes jogging on a regular basis.
”Supervisor” Robert Lewis Robert Lewis is 47 years old, married, withtwo children. He lives together with his family in a small house in Greenford,a district of London, Great Britain. Everyday he has to commute 45 minutesto work. He is a civil servant in city administration mainly focused on execu-tive duties. He earns 52.000 Euro per year and is very loyal to his employer.After work he is happy that he does not need to use many electronic devicesbesides his television and his aged mobile phone. He likes to meet with hisfriends, watch football and in general enjoys the quieter atmosphere in hisresidential area. He is quite conservative, voted pro Brexit and is a memberof the Anglican church.
3.2.4 User Stories
User stories wrap the requirements for a product in an easy to understandand clear way that can be communicated with other stakeholders.[23]
”As an an official in charge for town planning, Sofia Rossi wants to findnew insights fast and easy, like in which town district security needs to beimproved, so that she don’t has to waste a lot of time on researching.”
”As a civil servant in city administration, to gain new insights, Robert Lewis
1Image Credit: https://pixabay.com/en/woman-serious-bored-satisfied-2385789/,accessed 31.07.2017
2Image Credit: https://pixabay.com/en/business-man-suit-office-1032839/, accessed31.07.2017
13

doesn’t want to use complicated software or work through enormous amountof un- or semistructured data, like excel sheets.”
3.2.5 First Iteration
We used the mockup tool Balsamiq3 for both iterations. Figures 3.3 and 3.4show two separate views for visualization and search as well as errors thatwere found during the evaluation of both views. Higher quality images of thetwo views can be found in appendix A.1 and A.2.
Think-Aloud Method
For the first iteration four test subjects were asked to solve following tasksusing the provided user interface:
1) Look at the page and describe what you see
2) Show all thefts in April without datepicker
3) Find the day with most riots
4) Search for all incidents, then find the theft entry with the description“my blue car got stolen” in the table and click it (describe what yousee)
5) Find all days with thefts
6) Find all thefts that happened after 15.05.2017
7) Find all incidents with keyword “stolen”
8) Find all incidents between 15.05.2017 and 20.05.2017
8b) Reset search
The transcribed interviews can be found in appendix C. The key findings forthe first round of evaluation via think-aloud method were: Users 1, 2 and4 stated that both views should be combined (Figures 3.3 and 3.4, No. 1).The users made clear that the input area is too similar in both views and itis of high interest to search for a keyword and visualize the results.
3https://balsamiq.com/, accessed 19.07.2017
14

Figure 3.3: Mockup for first Iteration of Visualize Tab
Figure 3.4: Mockup for first Iteration of Search Tab
15

User 1 and 4 stated that it would be less confusing if the interface allowed toprepare a statement and click a button that then fires the query to receive aresult and not fire a query every time the user changes an element.Users 1 and 2 pressed a button to see all incidents for a month (”showmonthly”) but it changed nothing in the view.For user 1 it was not plausible that the charts were interactive and could beused to narrow down results (Figure 3.3, No. 3).Users 1 and 3 had problems finding the buttons to switch between monthlyand day-by-day visualization of the incidents (Figure 3.3, No. 4).The need to activate or deactivate the date picker was a problem for users 2,3 and 4 (Figure 3.4, No. 5).
Heuristic Evaluation
The heuristics used for evaluating the user interface according to Nielsen [19]are:
• Visibility of system status: The system should always keep usersinformed about what is going on, through appropriate feedback withinreasonable time.
• Match between system and the real world: The system shouldspeak the users’ language, with words, phrases and concepts familiarto the user, rather than system-oriented terms. Follow real-world con-ventions, making information appear in a natural and logical order.
• User control and freedom: Users often choose system functions bymistake and will need a clearly marked ”emergency exit” to leave theunwanted state without having to go through an extended dialogue.Support undo and redo.
• Consistency and standards: Users should not have to wonder whe-ther different words, situations, or actions mean the same thing. Followplatform conventions.
• Error prevention: Even better than good error messages is a care-ful design which prevents a problem from occurring in the first place.Either eliminate error-prone conditions or check for them and presentusers with a confirmation option before they commit to the action.
16

• Recognition rather than recall: Minimize the user’s memory loadby making objects, actions, and options visible. The user should nothave to remember information from one part of the dialogue to another.Instructions for use of the system should be visible or easily retrievablewhenever appropriate.
• Flexibility and efficiency of use: Accelerators — unseen by thenovice user — may often speed up the interaction for the expert usersuch that the system can cater to both inexperienced and experiencedusers. Allow users to tailor frequent actions.
• Aesthetic and minimalist design: Dialogues should not containinformation which is irrelevant or rarely needed. Every extra unit ofinformation in a dialogue competes with the relevant units of informa-tion and diminishes their relative visibility.
• Help users recognize, diagnose, and recover from errors: Errormessages should be expressed in plain language (no codes), preciselyindicate the problem, and constructively suggest a solution.
• Help and documentation: Even though it is better if the system canbe used without documentation, it may be necessary to provide helpand documentation. Any such information should be easy to search,focused on the user’s task, list concrete steps to be carried out, and notbe too large.
After working through the usability heuristics for evaluating user interfacedesign the following errors of the first iteration have been found:
Search Tab The input field ”Type of incident” in both views is missingan ”All incidents” feature (Figure 3.3, No. 2).After the user has chosen a type of incident it is not clear anymore that theinput field is about selecting the type of incident. At this point the userinterface is not providing enough feedback to the user.The distance of the ”show monthly” and ”show day-by-day” buttons and thechart they belong to is too wide (Figure 3.3, No. 4). Therefore the elementsdon’t relate to each other. There is no visual feedback which one of the twobuttons is active.It is not obvious that the center left and bottom left charts are interactive
17
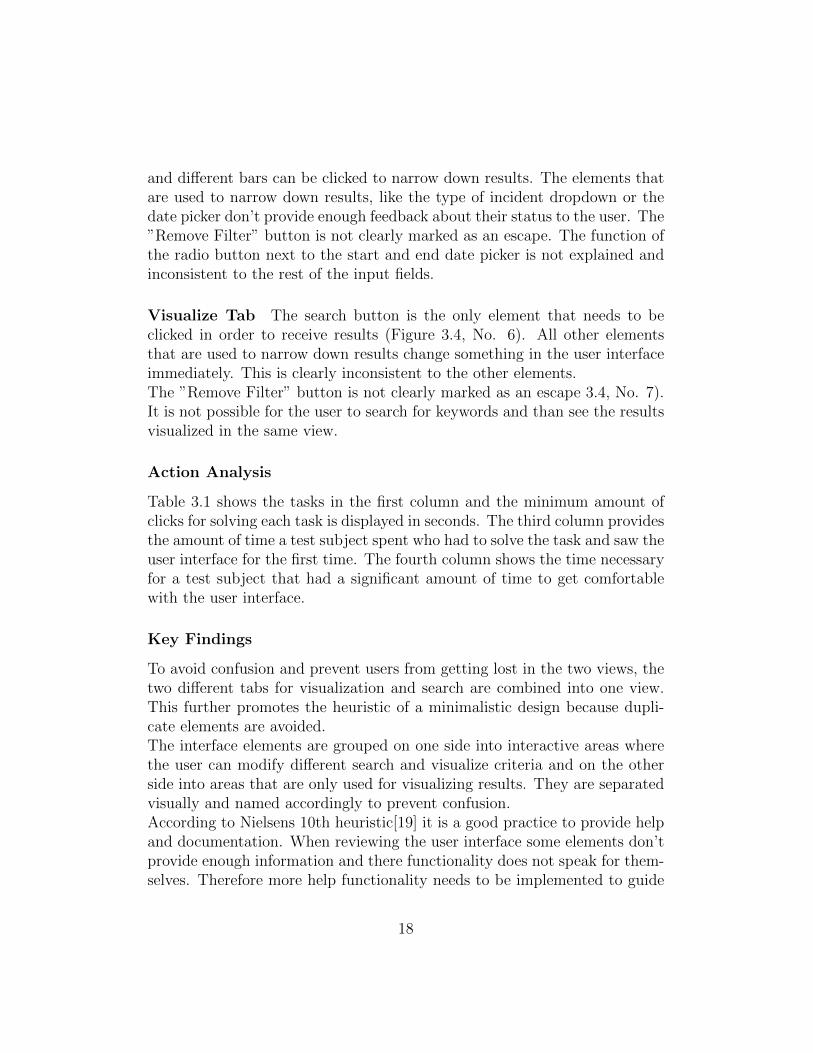
and different bars can be clicked to narrow down results. The elements thatare used to narrow down results, like the type of incident dropdown or thedate picker don’t provide enough feedback about their status to the user. The”Remove Filter” button is not clearly marked as an escape. The function ofthe radio button next to the start and end date picker is not explained andinconsistent to the rest of the input fields.
Visualize Tab The search button is the only element that needs to beclicked in order to receive results (Figure 3.4, No. 6). All other elementsthat are used to narrow down results change something in the user interfaceimmediately. This is clearly inconsistent to the other elements.The ”Remove Filter” button is not clearly marked as an escape 3.4, No. 7).It is not possible for the user to search for keywords and than see the resultsvisualized in the same view.
Action Analysis
Table 3.1 shows the tasks in the first column and the minimum amount ofclicks for solving each task is displayed in seconds. The third column providesthe amount of time a test subject spent who had to solve the task and saw theuser interface for the first time. The fourth column shows the time necessaryfor a test subject that had a significant amount of time to get comfortablewith the user interface.
Key Findings
To avoid confusion and prevent users from getting lost in the two views, thetwo different tabs for visualization and search are combined into one view.This further promotes the heuristic of a minimalistic design because dupli-cate elements are avoided.The interface elements are grouped on one side into interactive areas wherethe user can modify different search and visualize criteria and on the otherside into areas that are only used for visualizing results. They are separatedvisually and named accordingly to prevent confusion.According to Nielsens 10th heuristic[19] it is a good practice to provide helpand documentation. When reviewing the user interface some elements don’tprovide enough information and there functionality does not speak for them-selves. Therefore more help functionality needs to be implemented to guide
18

Tasks #Clicks Time [sec] Time [sec](minimum) (untrained) (trained)
Show all thefts in aprilwithout datepicker 3 24,94 9,67Find the day with most riots 3 24,36 10,08Find all incidents between15.05.2017 and 20.05.2017 5 29,79 12,26Search for all incidents,then find the theft entry with thedescription “my blue car got stolen” 2 22,52 8,69in the table and click itFind all days with thefts 3 27,71 9,29Find all thefts that happened after15.05.2017 5 26,31 14,33Find all incidents withkeyword “stolen” 3 +keyword 30,08 12,85
Table 3.1: Action Analysis for first Iteration
and help users when they are in doubt. The visual feedback of what is abutton was insufficient. And it needs to be consistent whether certain taskshave to be triggered by a button or are automatically performed.
3.2.6 Second Iteration
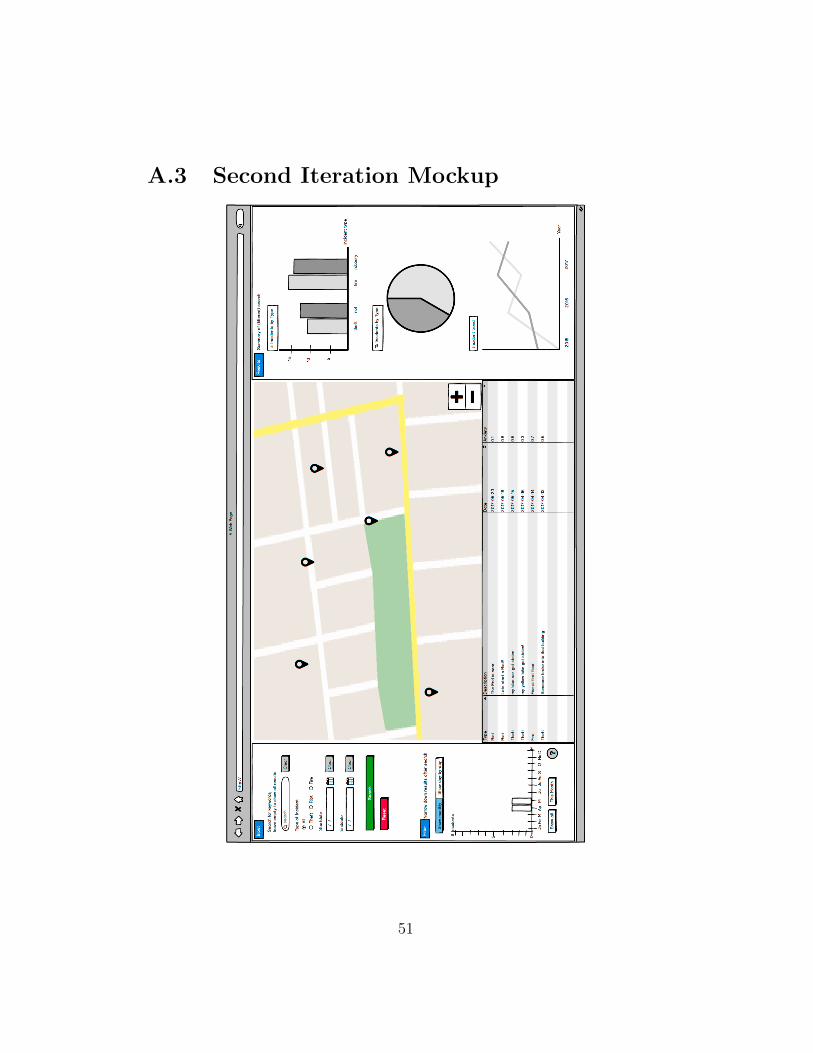
The starting point for the second iteration is the mockup shown in figure3.5. A high resolution version can be found in appendix A.3. It showsthe combined visualize and search tab and and now also includes some helpfunctionality, like sub lines for components or buttons with question marksthat provide additional information to support the user. It also shows themarked errors that were found in the second iteration.
Think-Aloud Method
For the second iteration five test subjects (users 5 - 9) were asked to performthe same tasks as in the first iteration. User 5 stated that she feels distractedby the empty bottom left chart that shows nothing on initial startup (3.5,
19

Figure 3.5: Second Iteration Mockup
No. 1). She was so much distracted by empty components that she did notsee the search button. User 5 also stated that the order of the input fieldsis misleading (3.5, No. 2). If you can specify the type of incident beforea search and also get results without using the keyword search, it may begood to put the types of incident input field at the first position of the inputcomponent. This way you get an overview of all results for a certain typeof incidents and can narrow down the results with the search for keywordsand date range later. User 6 agreed to user 5’s observation and stated thatit is uncommon to apply a type of incident “filter” without searching forkeywords. User 7 stated that he expects to see only information regardinghis search query, especially when he used the filter by ”type of incident”.Information that is not relevant to the search should be omitted (3.5, No.3). A general user trend was that they were missing extra information onwhat exactly they are seeing and what happened.
Heuristic Evaluation
Due to the fact that the types of incidents are a free form field in the ap-plication that produces the incident data, it is cumbersome to use radiobuttons to chose the type of incident (3.5, No. 4). The amount of types of
20

incidents could exceed 30, which would make it look cluttered. Therefore adrop-down menu is chosen to provide the incident types. The user interfaceprovides empty charts before the user issues a search. This clearly violatesthe principle of aesthetic and minimalistic design.
Action Analysis
Tasks #Clicks Time [sec] Time [sec](minimum) (untrained) (trained)
Show all thefts in aprilwithout datepicker 3 15,62 4,88Find the day with most riots 3 14,38 5,87Find all incidents between15.05.2017 and 20.05.2017 5 18,68 9,75Search for all incidents,then find the theft entry with thedescription “my blue car got stolen” 2 12,69 4,82in the table and click itFind all days with thefts 3 11,43 5,02Find all thefts that happened after15.05.2107 5 19,02 5,60Find all incidents withkeyword “stolen” 3 +keyword 14,82 7,53
Table 3.2: Action Analysis of second Iteration
The table 3.2 shows a significant improvement of the amount of time that wasnecessary to fulfill the tasks for trained and untrained test subjects comparedto the action analysis of the first iteration.
Key Findings
To skip the two different views and combine them into one was a major im-provement for the test subjects that had also tested the first iteration of theinterface.The most significant speedup from the first iteration to the second was that
21

users did not had to switch between the two separate views. Also the struc-ture of the search input fields on the left from top to bottom provided aclearer structure to achieve the user intended goals. The major key findingof the second iteration was that users expected to have hidden componentsif those were not relevant for the moment or didn’t provide any additionalcontent. User guidance and design principles remain a high priority for theuser interface.
3.3 Design of the Backend
The backend consists of a search engine that deals with indexing and storingthe data from the operation center. It is accessible through an API and de-livers user specified search results in a fast and convenient way. The followingsection deals with picking the appropriate search engine for this task.
3.3.1 Incident Data
The data that is indexed and visualized is derived from the operation centerof the City.Risks project and consists in the form of incidents. The signifi-cant characteristics of an incident are a unique ID, a single location, differenttypes, reports, alerts and sightings. It is not necessary for an incident to havea location but it can also have an area provided via a polygon instead of asingle location. reports are issued by citizens who want to report anythingregarding a specific incident and alerts are issued by the operators of theCity.Risks operation center to warn users in a certain area. Sightings areautomatically recorded with the help of the bluetooth broadcast device thatis developed during the City.Risks project and receivers like smartphones ortelephone provider antennas. Every incident can have many reports, alertsand sightings. Most important parts of every report and sighting are a times-tamp and a location. This can help to identify routes or the current positionof a lost or stolen object. An example incident can be seen in listing 3.1.
22

Listing 3.1: Sample Incident (JSON)
1 { "@class": "Incident",
2 "id": "0ecee0c5 -1df4 -440a-bfd6 -53645 f17f557",
3 "state": "open",
4 "location": {5 "type": "Point",
6 "coordinates": [13.41, 52.52, 0]
7 },8 "types": [{9 "type": "theft",
10 "confidence": 1
11 }],12 "reports": [{13 "@class": "Report",
14 "id": "0955e576 -54df -4304 -833f -199629 b9e6bd",
15 "src": {16 "@class": "TheftReport",
17 "id": "0955e576 -54df -4304 -833f -199629 b9e6bd",
18 "description": "black/green Centurion Cyclo Cross 4000",
19 "time": 0,
20 "incident": "0ecee0c5 -1df4 -440a-bfd6 -53645 f17f557",
21 "location": {22 "type": "Point",
23 "coordinates": [13.41, 52.52, 0]
24 },25 "address": "7E:23:B1 :56:2F:B9",
26 "lastTimeSeen": 1483618580,
27 "state": "active",
28 "created": 1483618580
29 },30 "incident": "0ecee0c5 -1df4 -440a-bfd6 -53645 f17f557",
31 "state": "restricted"
32 }],33 "sightings": [{34 "@class": "NormalizedSighting",
35 "id": "7E:23:B1:56:2F:B9",
36 "time": 1464103770,
37 "signal": 64,
38 "location": {39 "type": "Feature",
40 "properties": {41 "precision": 64,
42 "timestamp": 1464103770
43 },44 "geometry": {45 "type": "Point",
46 "coordinates": [13.42, 52.52]
47 }48 }49 }],50 "token": "7E:23:B1 :56:2F:B9",
51 "flags": 2,
52 "theft": true }
23

3.3.2 Technology Analysis
Available Technology
Lucene Lucene is an open source search engine library developed in Java.[24]It indexes documents, allowing it to search them effectively for keywords.Extensions like Elastichsearch or Solr provide additional functionality suchas a server, a database or a REST interface for easy integration into otherprojects.
Elasticsearch and Kibana Elasticsearch, provides a server with RESTinterface, works distributed, stores the incoming data in a NoSQL database,and uses Apache Lucene to index the data [25]. Elasticsearch also has a wholehost of other products that simplify the creation of clear dashboards withvisualizations or help storing the data in the database. The so-called ElasticStack consists at least of Elasticsearch, Logstash and Kibana. Logstash is atool which is used to receive different data formats from different sources, toconvert them into an Elasticsearch-readable format (JSON) and send themto Elasticsearch. Kibana provides a browser-based graphical user interfacefor Elasticsearch that can be used to easily create and publish dashboardswith different visualizations.
Apache Solr Apache Solr is quite similar to Elasticsearch. It is an opensource search server on top of the Apache Lucene search library and providesstorage for the data as well as a REST-like API for easy searching throughthe documents.[26]
Sphinx Sphinx is also an open source search engine with REST-ful API,data storage and server like Elasticearch or Solr but relies on its own indexinglibrary and not on Lucene.
24
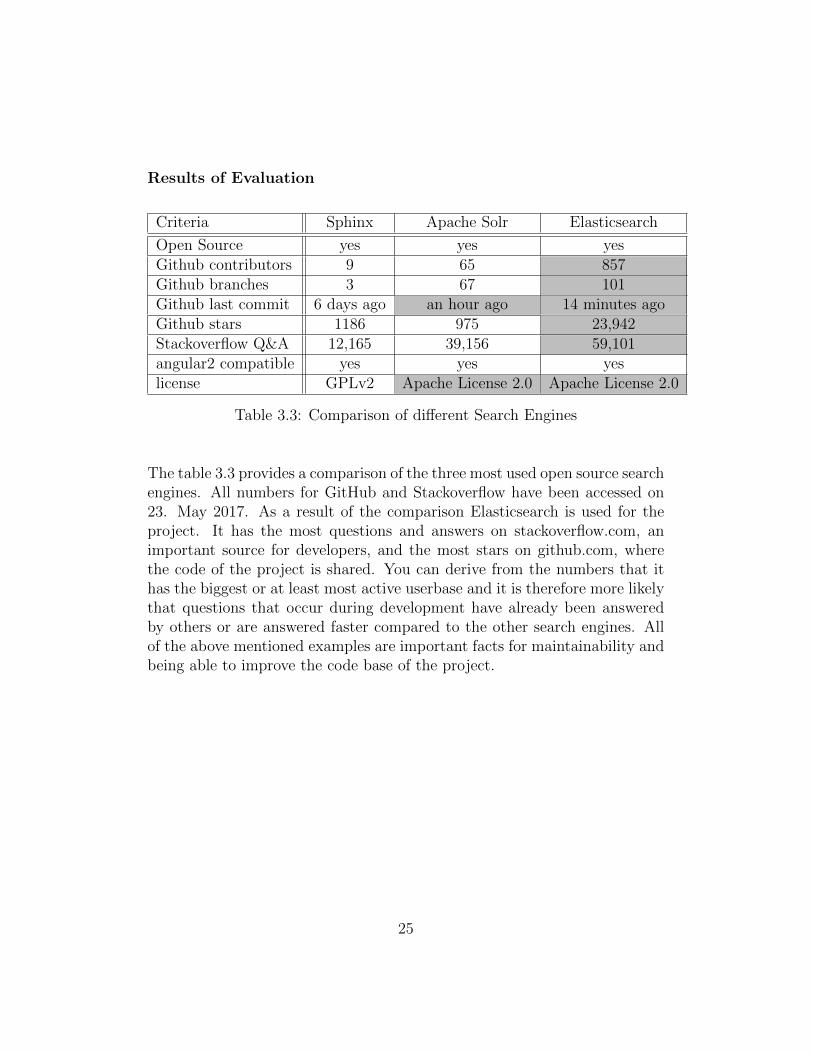
Results of Evaluation
Criteria Sphinx Apache Solr Elasticsearch
Open Source yes yes yesGithub contributors 9 65 857Github branches 3 67 101Github last commit 6 days ago an hour ago 14 minutes agoGithub stars 1186 975 23,942Stackoverflow Q&A 12,165 39,156 59,101angular2 compatible yes yes yeslicense GPLv2 Apache License 2.0 Apache License 2.0
Table 3.3: Comparison of different Search Engines
The table 3.3 provides a comparison of the three most used open source searchengines. All numbers for GitHub and Stackoverflow have been accessed on23. May 2017. As a result of the comparison Elasticsearch is used for theproject. It has the most questions and answers on stackoverflow.com, animportant source for developers, and the most stars on github.com, wherethe code of the project is shared. You can derive from the numbers that ithas the biggest or at least most active userbase and it is therefore more likelythat questions that occur during development have already been answeredby others or are answered faster compared to the other search engines. Allof the above mentioned examples are important facts for maintainability andbeing able to improve the code base of the project.
25

Chapter 4
Implementation of the DataAnalysis Tool
Figure 4.1: Implemented Data Analysis Tool
This chapter starts with describing the underlying design pattern that waschosen for implementing the Data Analysis Tool. The rest of this chapteris separated into two main parts, the implementation of the frontend in thefirst half and the implementation of the backend in the second half.
26

The code for this implementation can be found on the attached DVD orunder https://github.com/frometor/oc-dat.Throughout this chapter examples are provided to better understand the ap-plication. In contrast to the user-centered design process of the user interfacein chapter 3, this section describes the general software architecture and theapplied design pattern used for implementing the Data Analysis Tool.
4.1 Architectural Pattern
To deal with the asynchronous nature of a user input, the need of individualcomponents to communicate with each other as well as reacting to datachanges, the publish-subscribe architectural paradigm is used. In a publish/subscribe architecture ”[s]ubscribers have the ability to express their interestin an event, or a pattern of events, and are subsequently notified of any event,generated by a publisher, which matches their registered interest”.[27]
4.2 Design Pattern
The design pattern used for implementing the frontend is the observer pat-tern. It is a behavioral model ”that defines and maintains a dependencybetween objects”[8]. It is widely used in frontend development for appli-cations with different components exchanging data. The basic idea behindthe observer pattern is that components, called observers, depending on thesame data, subscribe to the same source called subject or observable andget notified whenever the data changes. None of the components knows howmany components have subscribed to the same source. Only the observable,that handles the data, knows that it has to communicate changes to an arrayof observers.
27

4.3 Implementation of the Frontend
Figure 4.2: Implemented Data Analysis Tool with Components
The following example is given to show the different steps from inserting thedata until receiving a result.
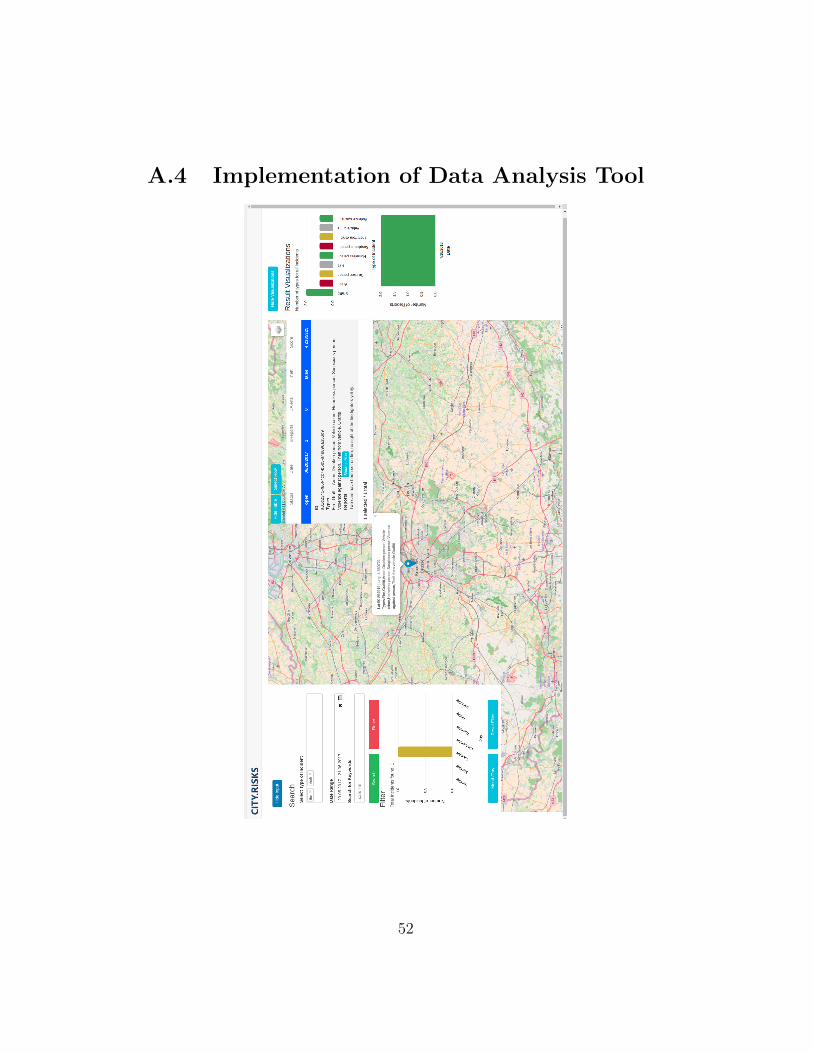
Example 4.1 ”A user wants to know about incidents of type ”fire” and”theft” with the keywords ”cars” and ”fire” that happened between 29.05.2017and 21.06.2017.”
Figure 4.2 shows the implemented version of the Data Analysis Tool withthe input values from example 4.1 inserted into the input component. Ahigh resolution version can be found in appendix A.4. The search queryleads to a single result incident that is visualized as a marker on the mapcomponent, can be found on the filter component as well as in the result-table component. If the filter component has more than one incident, it ispossible to filter the incidents by a single day or by a single month simply byclicking the corresponding chart. The frontend consists of many componentsthat are responsible for different tasks. The biggest components are the in-put component, the map component, the data-table component and differentchart components and are marked with red rectangles in figure 4.2. Each of
28

these components consist of smaller components that provide a functional-ity inside their respective main component. Figure 4.3 provides a top-leveloverview over the communication of the different components and consistsof five steps:
Figure 4.3: Observable Data Service
First, all components, that need data to work with, subscribe to the observ-able data service.Second, the input-component publishes the search criteria from the user tothe observable data service. The input component is where the user can typekeywords, specify a date range or choose incidents by type. For our examplethe user specifies the keywords ”cars” and ”fire” in the keyword input field,uses the date range picker to specify the date range and also chooses thetypes of incident ”fire” and ”theft” from the type of incident field.Third, all the provided data is used to form an Elasticsearch query and sentto the Elasticsearch backend. The backend part is discussed in detail in Sec-tion 4.4.Fourth, the result of this post request is sent back to the observable dataservice via a response JSON object that contains all matching incidents.Fifths, the data is published to all the components that subscribed to theobservable.
29

Listing 4.1: Result-table Component Initialization
1 this.incidentService.incidents$.subscribe(
2 newIncidents => {3 this.allIncidents = newIncidents;
4 this.fillColums(incidents,{"name":"all"});5 }6 );
Listing 4.1 shows a code snippet for one component, the result-table com-ponent. On initialization the component subscribes to the data service ob-servable and whenever the observable emits a new value, the result-tablecomponent sets the local variable allIncidents (line 3) and calls the functionfillColumns (line 4) to redraw the table with the new values.
Listing 4.2: Observable Data Service
1 // private subject = new BehaviorSubject(this.EMPTY_SEARCH);
2 // incidents$: Observable <any > = this.subject.asObservable ();
3
4 getIncidents(payload: any): Observable <any > {5 [..]
6 return this.http.post(this.url, postDataType, headers)
7 .map(res => res.json())
8 .do(newIncidents => this.subject.next(newIncidents));
9 }
In listing 4.2 is shown what happens inside the observable data service.Whenever the function getIncidents() gets called it receives a payload that isused to form the postDataType variable. In our example the postDataTypevariable contains information about the keywords, the date range and thetypes of incident the user specified. This data gets sent to an URL, in thiscase the Elasticsearch endpoint (line 6). If the post request was successful,the returning values get mapped to JSON (line 7) and the observable emitsa new value to all subscribers including the result-table component (line 8).
Example 4.2 ”The user clicks on one of the markers on the map compo-nent and expects the associated row in the table to be highlighted.”
The observable data service provides yet another feature which is the com-munication between two elements. This helps to communicate user inputin one component to other components that need to react to this input and
30
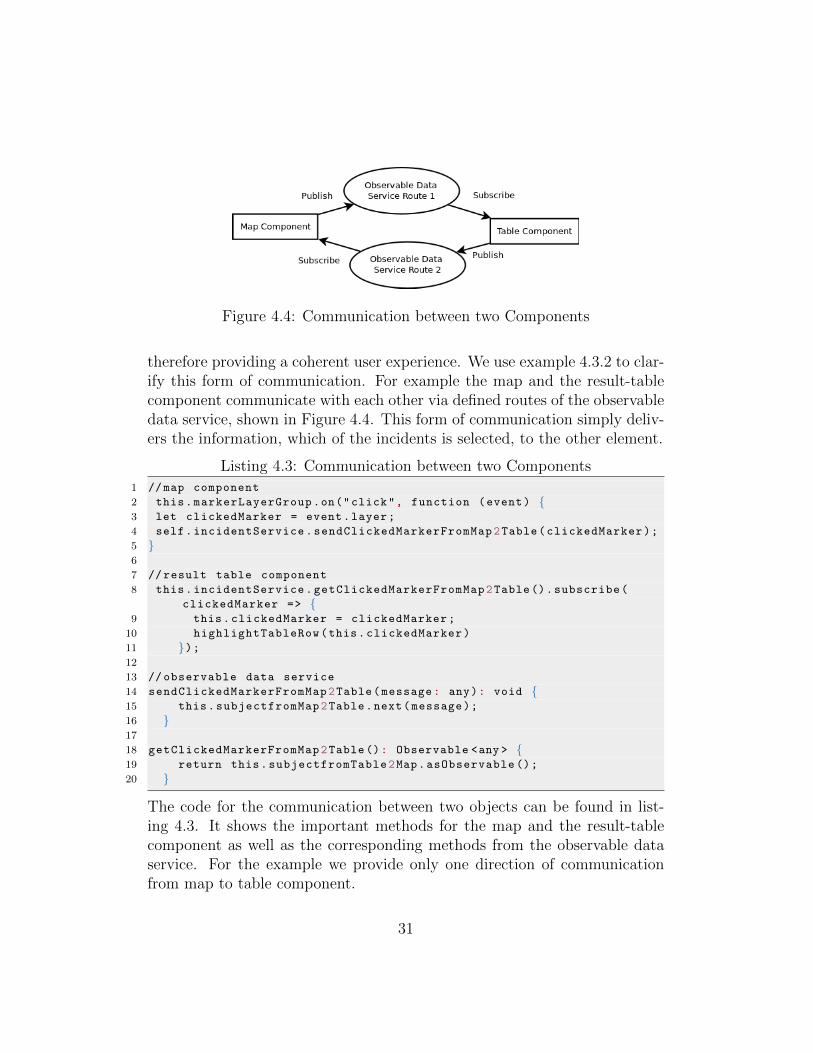
Figure 4.4: Communication between two Components
therefore providing a coherent user experience. We use example 4.3.2 to clar-ify this form of communication. For example the map and the result-tablecomponent communicate with each other via defined routes of the observabledata service, shown in Figure 4.4. This form of communication simply deliv-ers the information, which of the incidents is selected, to the other element.
Listing 4.3: Communication between two Components
1 //map component
2 this.markerLayerGroup.on("click", function (event) {3 let clickedMarker = event.layer;
4 self.incidentService.sendClickedMarkerFromMap2Table(clickedMarker);
5 }6
7 // result table component
8 this.incidentService.getClickedMarkerFromMap2Table ().subscribe(
clickedMarker => {9 this.clickedMarker = clickedMarker;
10 highlightTableRow(this.clickedMarker)
11 });12
13 // observable data service
14 sendClickedMarkerFromMap2Table(message: any): void {15 this.subjectfromMap2Table.next(message);
16 }17
18 getClickedMarkerFromMap2Table(): Observable <any > {19 return this.subjectfromTable2Map.asObservable ();
20 }
The code for the communication between two objects can be found in list-ing 4.3. It shows the important methods for the map and the result-tablecomponent as well as the corresponding methods from the observable dataservice. For the example we provide only one direction of communicationfrom map to table component.
31

For this component-to-component communication we decided to implementroutes for every direction. In theory, a component could use the observableto emit a new value and at the same time subscribe to this observable toreceive changes from other components. This requires additional handlingof every received message in every component and is more prone to errors.This whole process could be avoided by using separate routes.In the provided code snippet shown in listing 4.3 the map component registersan event handler on the markerLayerGroup array which consists of all mark-ers representing the different incidents (line 2). The map component calls thedata service observable function sendClickedMarkerFromMap2Table() whichtakes the necessary information from the marker, if it has been clicked bythe user (line 4). Inside the data service observable the called function emitsa new value namely the clickedMarker that came from the map component(line 15). If the result-table component subscribed to the observable (line8), it receives a new message from the observable, sets the local variablethis.clickedMarker (line 9) and calls the function this.highlightTableRow()to highlight the corresponding row in the table (line 10).
4.3.1 Frontend Framework
For the implementation of the frontend the newest version of angular (4+)was used. To create new angular components and services we used thecommand line interface (angular-cli) tool.1 The main benefits of using theangular-cli are the speed up of creating template structures for new compo-nents and services, providing a development server for testing the applicationand automatically compiling the component based code structure into onecoherent code base whenever code changes happen. The main reason forusing angular was that it uses the observable pattern extensively and the useof observables is supported out of the box with the RxJS library, that is partof the core libraries of angular. RxJS is a support library used to achievethe reactive programming paradigm, a way of implementing methods thatmakes it easier to deal with asynchronous data streams.
1https://github.com/angular/angular-cli, accessed 27.07.2017
32
As already mentioned angular has a component based architecture and ev-ery component consists of a pseudo Model-View-Controller Architecture. Asingle component has a view representation, a component class that can beconsidered a controller and services and directives that are used for commu-nicating with a model.[28]
4.3.2 Plugins, Libraries, Frameworks
For speeding up the implementation several plugins, libraries and smallerframeworks for common use cases were used. These support applicationswere chosen by the quality of their documentation, the availability of workingexamples and an active community represented by the amount of githubstars and questions on stack overflow. To install all components we usedthe node package manager (NPM).2 NPM allows it to install new pluginssimply by adding them to the list of dependencies in the package.json fileand running npm install to install them. For the input component, we usedthe mydaterangepicker3 and the ng-select24 plugins. For the map componentthe leaflet5 library and the angular 2+ packages from asymmetrik6 were used.For the datatable component we used the ngx-datatable7 framework and forthe different charts the ngx-charts8 framework was used. To make the wholeapplication responsive, we used the bootstrap9 framework.
2https://www.npmjs.com/, accessed 28.07.20173https://github.com/kekeh/mydaterangepicker, accessed: 15.07.20174https://github.com/valor-software/ng2-select, accessed: 15.07.20175http://leafletjs.com, accessed: 15.07.20176https://github.com/Asymmetrik/angular2-leaflet, accessed: 15.07.20177https://github.com/swimlane/ngx-datatable, accessed: 15.07.20178https://github.com/swimlane/ngx-charts, accessed: 15.07.20179http://getbootstrap.com, accessed: 15.07.2017
33
4.4 Implementation of the Backend
Figure 4.5: Backend Architecture
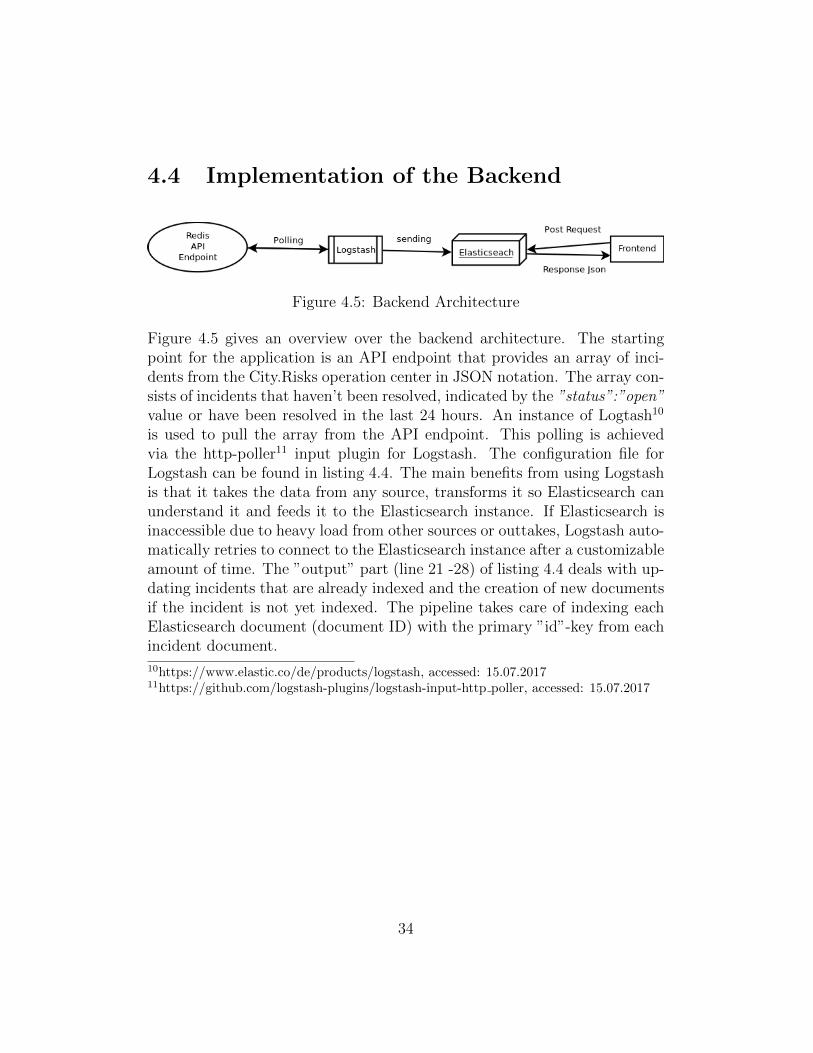
Figure 4.5 gives an overview over the backend architecture. The startingpoint for the application is an API endpoint that provides an array of inci-dents from the City.Risks operation center in JSON notation. The array con-sists of incidents that haven’t been resolved, indicated by the ”status”:”open”value or have been resolved in the last 24 hours. An instance of Logtash10
is used to pull the array from the API endpoint. This polling is achievedvia the http-poller11 input plugin for Logstash. The configuration file forLogstash can be found in listing 4.4. The main benefits from using Logstashis that it takes the data from any source, transforms it so Elasticsearch canunderstand it and feeds it to the Elasticsearch instance. If Elasticsearch isinaccessible due to heavy load from other sources or outtakes, Logstash auto-matically retries to connect to the Elasticsearch instance after a customizableamount of time. The ”output” part (line 21 -28) of listing 4.4 deals with up-dating incidents that are already indexed and the creation of new documentsif the incident is not yet indexed. The pipeline takes care of indexing eachElasticsearch document (document ID) with the primary ”id”-key from eachincident document.
10https://www.elastic.co/de/products/logstash, accessed: 15.07.201711https://github.com/logstash-plugins/logstash-input-http poller, accessed: 15.07.2017
34

Listing 4.4: Logstash Configuration
1 input {2 http_poller {3 urls => {4 ocendpoint => {5 method => get
6 url => "http :// url.to/api/enpoint"
7 headers => {8 Accept => "application/json"
9 auth=> "<password >"
10 }11 }12 }13 request_timeout => 60
14 schedule => { cron => "* * * * *"}15 codec => "json"
16 }17 }18
19 [..]
20
21 output {22 elasticsearch {23 index => "incidents"
24 document_type => "incident"
25 pipeline => "rename_id"
26 document_id => "%{id}"
27 doc_as_upsert => true
28 action => "update"
29 }30 }
The Elasticsearch document structure needs to be manually mapped beforeindexing new documents. The domain-specific language (DSL) query for thispurpose can be found in appendix B. It is considered best practice to mapthe structure before new documents get indexed to avoid inconsistencies orunwanted behavior when using the build in mapping functionality. The mainreason for not using the automatic mapping for indexing the incident docu-ments in our case is that a single incident can contain arrays of reports oralerts. These arrays are automatically flattened by Elasticsearch to simplekey value pairs to speed up the search process later on.
35
Listing 4.5: Flatten Objects in Nested Array in Elasticsearch
1 //This:
2 {3 "followers": [
4 { "age": 35, "name": "Mary White"},5 { "age": 26, "name": "Alex Jones"},6 { "age": 19, "name": "Lisa Smith"}7 ]
8 }9
10 //Will be flattened to:
11 {12 "followers.age": [19, 26, 35],
13 "followers.name": [alex, jones, lisa, smith, mary, white]
14 }
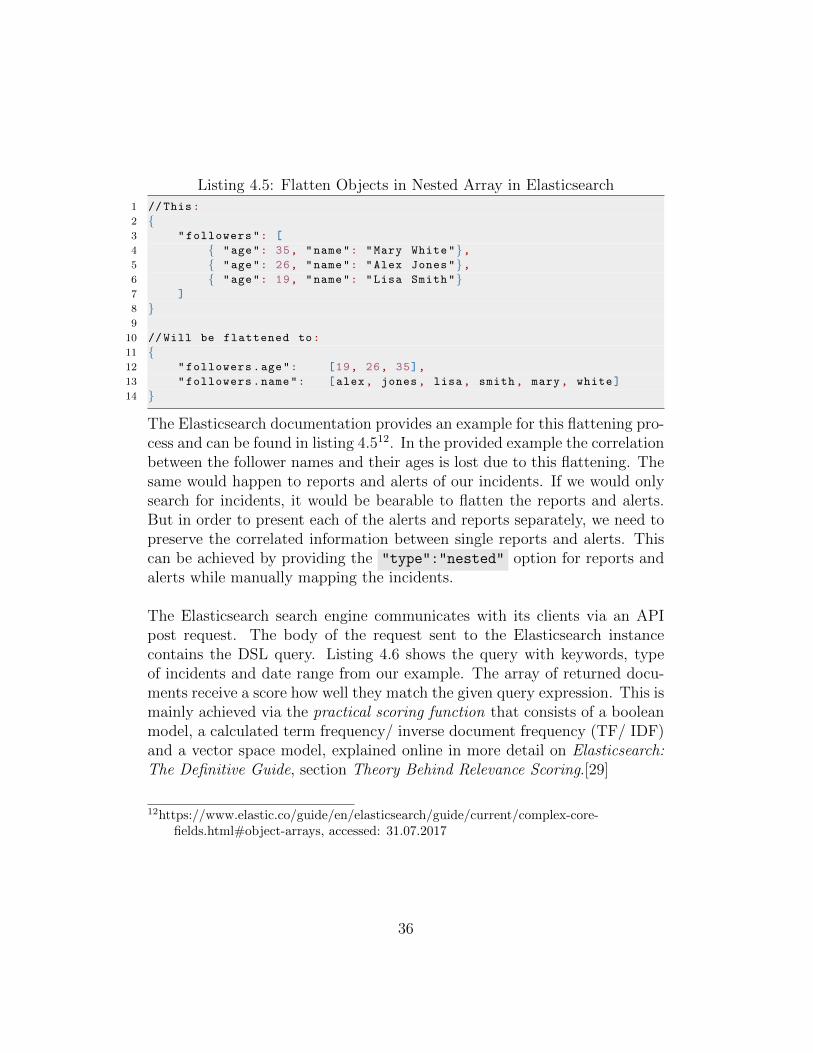
The Elasticsearch documentation provides an example for this flattening pro-cess and can be found in listing 4.512. In the provided example the correlationbetween the follower names and their ages is lost due to this flattening. Thesame would happen to reports and alerts of our incidents. If we would onlysearch for incidents, it would be bearable to flatten the reports and alerts.But in order to present each of the alerts and reports separately, we need topreserve the correlated information between single reports and alerts. Thiscan be achieved by providing the "type":"nested" option for reports andalerts while manually mapping the incidents.
The Elasticsearch search engine communicates with its clients via an APIpost request. The body of the request sent to the Elasticsearch instancecontains the DSL query. Listing 4.6 shows the query with keywords, typeof incidents and date range from our example. The array of returned docu-ments receive a score how well they match the given query expression. This ismainly achieved via the practical scoring function that consists of a booleanmodel, a calculated term frequency/ inverse document frequency (TF/ IDF)and a vector space model, explained online in more detail on Elasticsearch:The Definitive Guide, section Theory Behind Relevance Scoring.[29]
12https://www.elastic.co/guide/en/elasticsearch/guide/current/complex-core-fields.html#object-arrays, accessed: 31.07.2017
36

Listing 4.6: Elasticsearch DSL Query Example
1 {2 "query": {3 "bool": {4 "filter": {5 "bool": {6 "must": [
7 {8 "nested": {9 "path": "reports",
10 "query": {11 "bool": {12 "must": [
13 {14 "range": {15 "reports.src.created": {16 "gt": 1496008800,
17 "lte": 1497996000
18 }}}]}}}},19 {20 "nested": {21 "path": "types",
22 "query": {23 "bool": {24 "must": [
25 {26 "match": {27 "types.type": "fire"
28 }}]}}}},29 {30 "nested": {31 "path": "types",
32 "query": {33 "bool": {34 "must": [
35 {36 "match": {37 "types.type": "theft"
38 }}]}}}}]}},39 "must": {40 "query_string": {41 "query": "cars~ fire~"
42 }}}}43 }
37

The query operator ”bool” (line 3) in listing 4.6 indicates that the query isevaluated as a boolean expression. It further recalls this boolean model withthe use of keywords ”must” and ”should” that act as boolean ∨ (OR) and∧ (AND) operators in the query. The ”query string” operator evaluates thetwo keywords ”cars˜” and ”fire˜” as a boolean OR clause. The ”˜”(tilde)at the end of each keyword adds fuzziness to the keyword search via theLevenshtein edit distance. This way the DSL query in listing 4.6 who getssent to Elasticsearch evaluates to this boolean expression:
searchresults = (keyword1 ∨ .. ∨ keywordX) ∧ types ∧ daterange
The term frequency/inverse document frequency consists of three factors thatare taken into account for scoring a keyword:
• term frequency: how many times the keyword appears in the speci-fied field of the document
• inverse document frequency: how many times the keyword appearsin all documents that have been found
• field-length norm: If the keyword has been found deep inside thedocument, the document receives a lower score than a document wherethe keyword was found in a first level key value pair.
The vector space model transforms documents and queries into vectors. Thekeywords receive a weight according to their score in the TF/IDF. Next thedocuments and the search query are plotted as vectors in an n-dimensionalgraph, where n equals the amount of keywords. It is easy to calculate thedistance from each document to the given query and rank them according todistance. The array of documents sorted by relevance gets sent back to theuser and can be used to visualize the results in the frontend.[29]
38
Chapter 5
Results
This section first gives a summary about the results that have been foundduring the bachelor thesis and provide the limitations as well as an outlookto future work.
5.1 Summary
We started this bachelor thesis explaining the motivation for this work, subse-quently explaining the outline of contribution and the structure of the thesis.In the second chapter the background information in which the thesis is em-bedded was given, as well as some definitions and the related work touched byour thesis. The third chapter explained the design process of the frontend viathe user-centered design approach including target groups, personas and userstories. These fundamentals provided the basis for the think-aloud, heuristicevaluation and action analysis methods, used for improving the frontend inan iterative process. The same chapter provided detailed information for thedesign of the backend as well as the requirement analysis for the whole appli-cation. Chapter 4 described the whole implementation part for the front- andthe backend. Used design patterns, chosen frameworks as well as importantcode snippets are treated in this chapter.The major improvement between the first and the second iteration was thecombination of the two separate views for visualizing and searching the in-cident data. The key finding for the second iteration was that componentsthat are empty or don’t provide any additional information, should be hid-den to not confuse users. The second think-aloud method for the second
39

iteration received a much better feedback from the test candidates. User 6and 8 stated that the interface was clearly understandable and the tasks wereeasily solvable.An important factor for realizing the frontend for the Data Analysis Toolwas to implement familiar structures that are similar to other applications inorder to reduce the learning curve and make the application more accessible.User 6 confirmed this assumption by saying ”I expected this button there, Iknow this from other applications, it looks familiar”. User 9 stated ”I thinkit has come out well, i think it looks good.”The results from the Action Analysis provided in table 5.1 show a signifi-
Tasks 1. Iteration 2. Iterationuntrained [sec] trained [sec] untrained [sec] trained [sec]
Task 1 24,94 9,67 15,62 4,88Task 2 24,36 10,08 14,38 5,87Task 3 29,79 12,26 18,68 9,75Task 4 22,52 8,69 12,69 4,82Task 5 27,71 9,29 11,43 5,02Task 6 26,31 14,33 19,02 5,60Task 7 30,08 12,85 14,82 7,53
Table 5.1: Action Analysis Comparison
cant reduction in time users had to spent on solving the tasks. Users weresometimes able to decrease the time necessary to solve the task by half usingthe second iteration interface compared to the first iteration.During the first iteration half of the test subjects stated that they are con-fused by the application performing actions automatically whenever theychange the input fields. We improved this by making it clear that a user hasto click a search button in order to receive results. This is an interesting fact,because it means some user prefer to need more clicks to achieve a result.
40

Chapter 6
Discussion
This Chapter provides the conclusions, the limitations as well as the outlookof this thesis.
6.1 Conclusions
The goals of this thesis were to build an application that is able to visualizeand search through large datasets and designing a user-friendly interface inan iterative user-centered design process.As seen in the summary section the user-centered design approach for de-signing user interfaces helped increasing the productivity and speeding upthe users workload with every iteration. The observable data service patternused for implementing the frontend is a well tested, well documented designpattern for frontend user interfaces. Angular, the main framework chosen forthe frontend implementation, follows best practices and coding standards, ismaintained by a large company, has a large userbase, is well documented andpopular for frontend applications. All additional plugins, frameworks and li-braries have been selected according to their userbase size, their quality ofdocumentation and their provided examples. This provides a good maintain-ability for our application and the chance to add new features in the futureas well as providing a template as starting point for other applications thatwant to visualize data.The implementation of the backend with the help of the Elasticsearch tech-nology stack provides a useful setup that can be used in future works to buildeffective applications that handle all different kinds of searchable datasets.
41

6.2 Limitations
Although the user interface has been successful implemented and the userinterface has received positive feedback, there are still limitations. The back-end handling and frontend visualization of a huge dataset with more than10.000 documents has not been tested. The initial testing phase for the wholecollection of City.Risks applications starts after the end date of this bachelorthesis. So all testing was done using test data that was emitted from the par-ticipating members of the City.Risks project via the provided API endpoint.The application still provides space for further new visualizations. Thesecould be easily integrated as separate components after new user feedback,when used in production or when the amount of data increases.
6.3 Outlook
The successfully implemented Data Analysis Tool can further be used toincorporate new features, thanks to its component based structure. Ideas forfuture improvements could be additional layers for the map like heatmaps,visualizing different districts of a city or provide additional information onnearby police or fire departments. Also it might be of interest to chooseseparate characteristics of the incident and provide a visualization for thechosen characteristics.
42

References
Cited references are ordered by appearance.
[1] V. Rajaraman, “Big data analytics,” Resonance, vol. 21, no. 8,pp. 695–716, 2016. [Online]. Available: http://dx.doi.org/10.1007/s12045-016-0376-7
[2] I. Corporation, “What is big data?” 2013, [accessed April 12, 2017].[Online]. Available: https://www-01.ibm.com/software/data/bigdata/what-is-big-data.html
[3] A. Regalado, “The data made me do it,” 2013, [accessed April12, 2017]. [Online]. Available: https://www.technologyreview.com/s/514346/the-data-made-me-do-it/
[4] I. IDC Research, “Worldwide big data and business analyticsrevenues forecast to reach $187 billion in 2019, according toidc,” 2016, [accessed April 12, 2017]. [Online]. Available: https://www.idc.com/getdoc.jsp?containerId=prUS41306516
[5] I. Gartner, “Gartner says worldwide business intelligence and analyticsmarket to reach $18.3 billion in 2017,” 2017, [accessed April 12, 2017].[Online]. Available: http://www.gartner.com/newsroom/id/3612617
[6] solidIt, “Db-engines ranking von suchmaschinen,” 2017, [accessedFebruary 14, 2017]. [Online]. Available: http://db-engines.com/de/ranking/suchmaschine
[7] C. Research and I. Action, “Project overview,” 2017, [ac-cessed 29.07.2017]. [Online]. Available: http://project.cityrisks.eu/project-overview/
43
[8] Design patterns : elements of reusable object-oriented software / ErichGamma, 37th ed., ser. Addison-Wesley professional computing series.Boston, Mass. ; Munich [u.a.]: Addison-Wesley, 2009.
[9] Elasticsearch, “Preface,” 2014, [accessed 19.07.2017]. [Online]. Avail-able: https://www.elastic.co/guide/en/elasticsearch/guide/current/preface.html
[10] S. Buttcher, C. L. A. Clarke, and G. V. Cormack, Information Retrieval:Implementing and Evaluating Search Engines. Cambridge: MIT, 2010.
[11] D. M. Berry, Copy, Rip, Burn : The Politics of Copyleft and OpenSource. London: Pluto, 2008.
[12] R. T. Fielding, “Architectural styles and the design of network-based software architectures,” dissertation, University of California,Irvine, 2000. [Online]. Available: http://www.ics.uci.edu/∼fielding/pubs/dissertation/top.htm
[13] A. Friedman, “The future of search engines is context,” 2015, [accessedApril 16, 2017]. [Online]. Available: http://searchengineland.com/future-search-engines-context-217550
[14] S. Sirich, “Smarter digital assistants and the future of search,” 2016, [ac-cessed April 16, 2017]. [Online]. Available: https://searchenginewatch.com/2016/04/25/understanding-intent-through-voice-search/
[15] J. Gans, “Google, yelp, and the future of search,” 2015, [accessed April 16, 2017]. [Online]. Available: https://hbr.org/2015/07/google-yelp-and-the-future-of-search
[16] R. E. Roth, K. S. Ross, and A. M. Maceachren, “User-centered design for interactive maps: A case study in crimeanalysis,” ISPRS International Journal of Geo-Information, vol. 4,no. 1, pp. 262–301, February 2015. [Online]. Available: https://doaj.org/article/81d999342d11462ba5a94e0733dee471
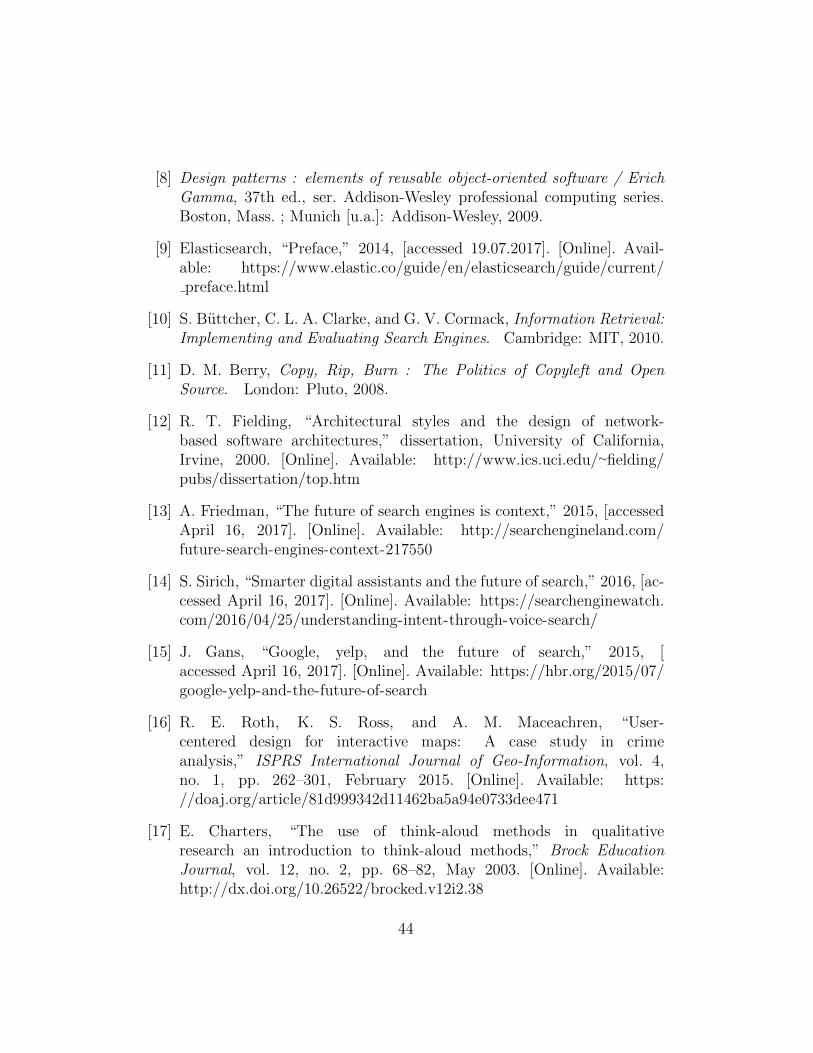
[17] E. Charters, “The use of think-aloud methods in qualitativeresearch an introduction to think-aloud methods,” Brock EducationJournal, vol. 12, no. 2, pp. 68–82, May 2003. [Online]. Available:http://dx.doi.org/10.26522/brocked.v12i2.38
44
[18] M. Gonzalez, L. Masip, A. Granollers, and M. Oliva, “Quantitativeanalysis in a heuristic evaluation experiment,” Advances in EngineeringSoftware, vol. 40, no. 12, pp. 1271 – 1278, 2009, designing,modelling and implementing interactive systems. [Online]. Available:http://www.sciencedirect.com/science/article/pii/S0965997809000477
[19] J. Nielsen, “10 usability heuristics for user interface design,” 1995,[accessed April 18, 2017]. [Online]. Available: https://www.nngroup.com/articles/ten-usability-heuristics/
[20] C. Spannagel, M. Glaser-Zikuda, and U. Schroeder, “Applicationof qualitative content analysis in user-program interaction research,”Forum Qualitative Sozialforschung / Forum: Qualitative SocialResearch, vol. 6, no. 2, 2005. [Online]. Available: http://www.qualitative-research.net/index.php/fqs/article/view/469
[21] E. Commission, “More women in senior positions key to economic sta-bility and growth,” Publications Office of the European Union, Luxem-bourg, Ms.
[22] C. Pearson, Awakening the Heroes Within: Twelve Archetypes to HelpUs Find Ourselves and Transform Our World. Cambridge: Pluto, 1991.
[23] K. Breitman and J. Leite, “Managing user stories,” in InternationalWorkshop on Time-Constrained Requirements Engineering, 2002, p. 168.
[24] T. A. S. Foundation, “Apache lucene core,” 2016, [accessed February06, 2017]. [Online]. Available: http://lucene.apache.org/core/
[25] E. BV, “Elasticsearch basic concepts,” 2015, [accessed July 22, 2017].[Online]. Available: https://www.elastic.co/guide/en/elasticsearch/guide/current/intro.html
[26] T. A. S. Foundation, “Solr features,” 2017, [accessed February 16,2017]. [Online]. Available: http://lucene.apache.org/solr/features.html
[27] P. T. Eugster, P. A. Felber, R. Guerraoui, and A.-M. Kermarrec,“The many faces of publish/subscribe,” ACM Comput. Surv.,vol. 35, no. 2, pp. 114–131, Jun. 2003. [Online]. Available:http://doi.acm.org/10.1145/857076.857078
45
[28] R. Shrestha, “Angular 2: A component-based mvc framework,” 2016,[accessed 30.07.2017]. [Online]. Available: https://dzone.com/articles/angular-2-a-component-based-mvc-framework
[29] Elasticsearch, “Theory behind relevance scoring,” 2014, [accessed18.07.2017]. [Online]. Available: https://www.elastic.co/guide/en/elasticsearch/guide/current/scoring-theory.html
46

Appendices
47
Appendix A
Images of Mockups and finalImplementation
48

A.1 First Iteration Visualize View
49

A.2 First Iteration Search View
50
A.3 Second Iteration Mockup
51
A.4 Implementation of Data Analysis Tool
52

Appendix B
Mapping of Elasticsearch Index
Listing B.1: Mappings for Elasticsearch Docment Index
1 {"mappings":{"incident":{"properties":{"@class":{"type":"text","fields":{"keyword":{"type":"keyword","ignore_above":256}}},
2 "alerts":{"type":"nested","properties":{"@class":{"type":"text","fields":{"keyword":{"type":"keyword","ignore_above":256}}},
3 "default_language":{"type":"text","fields":{"keyword":{"type":"keyword","ignore_above":256}}},
4 "event_type":{"type":"text","fields":{"keyword":{"type":"keyword","ignore_above":256}}},
5 "geometry":{"properties":{"coordinates":{"type":"float"},6 "type":{"type":"text","fields":{"keyword":{"type":"keyword","
ignore_above":256}}}}},7 "id":{"type":"text","fields":{"keyword":{"type":"keyword","
ignore_above":256}}},8 "incident":{"type":"text","fields":{"keyword":{"type":"keyword",
"ignore_above":256}}},9 "languages":{"properties":{"en":{"properties":{"description":{"
type":"text","analyzer":"standard","fields":{"keyword":{"type":"keyword","ignore_above":256}}},
10 "headline":{"type":"text","fields":{"keyword":{"type":"keyword","ignore_above":256}}},
11 "instruction":{"type":"text","fields":{"keyword":{"type":"keyword","ignore_above":256}}}}}}},
12 "msg_type":{"type":"text","fields":{"keyword":{"type":"keyword","ignore_above":256}}},
13 "note":{"type":"text","fields":{"keyword":{"type":"keyword","ignore_above":256}}},
14 "provider_id":{"type":"text","fields":{"keyword":{"type":"keyword","ignore_above":256}}},
15 "scope":{"type":"text","fields":{"keyword":{"type":"keyword","ignore_above":256}}},"sent":{"type":"long"},
53

16 "severity":{"type":"text","fields":{"keyword":{"type":"keyword","ignore_above":256}}},
17 "status":{"type":"text","fields":{"keyword":{"type":"keyword","ignore_above":256}}}}},
18 "flags":{"type":"long"},"id":{"type":"text","fields":{"keyword":{"type":"keyword","ignore_above":256}}},
19 "location":{"properties":{"coordinates":{"type":"float"},"geometries":{"properties":{"coordinates":{"type":"float"},
20 "type":{"type":"text","fields":{"keyword":{"type":"keyword","ignore_above":256}}}}},
21 "type":{"type":"text","fields":{"keyword":{"type":"keyword","ignore_above":256}}}}},
22 "reports":{"type":"nested","properties":{"@class":{"type":"text","fields":{"keyword":{"type":"keyword","ignore_above":256}}},
23 "id":{"type":"text","fields":{"keyword":{"type":"keyword","ignore_above":256}}},
24 "incident":{"type":"text","fields":{"keyword":{"type":"keyword","ignore_above":256}}},
25 "relevance":{"properties":{"@class":{"type":"text","fields":{"keyword":{"type":"keyword","ignore_above":256}}},
26 "code":{"type":"long"},"confidence":{"type":"float"},"report_id":{"type":"text","fields":{"keyword":{"type":"keyword","ignore_above":256}}},
27 "status":{"type":"text","fields":{"keyword":{"type":"keyword","ignore_above":256}}},"value":{"type":"float"}}},
28 "src":{"properties":{"@class":{"type":"text","fields":{"keyword":{"type":"keyword","ignore_above":256}}},
29 "address":{"type":"text","fields":{"keyword":{"type":"keyword","ignore_above":256}}},"anxiety":{"type":"float"},
30 "created":{"type":"long"},"description":{"type":"text","analyzer":"standard",
31 "fields":{"keyword":{"type":"keyword","ignore_above":256}}},"flagging":{"type":"boolean"},
32 "id":{"type":"text","fields":{"keyword":{"type":"keyword","ignore_above":256}}},
33 "incident":{"type":"text","fields":{"keyword":{"type":"keyword","ignore_above":256}}},"lastTimeSeen":{"type":"long"},
34 "location":{"properties":{"coordinates":{"type":"float"},"type":{"type":"text","fields":{"keyword":{"type":"keyword","ignore_above":256}}}}},
35 "media":{"properties":{"heading":{"type":"float"},"type":{"type":"text","fields":{"keyword":{"type":"keyword","ignore_above":256}}},
36 "url":{"type":"text","fields":{"keyword":{"type":"keyword","ignore_above":256}}}}},
37 "state":{"type":"text","fields":{"keyword":{"type":"keyword","ignore_above":256}}},
38 "time":{"type":"long"},"type":{"type":"text","fields":{"keyword":{"type":"keyword","ignore_above":256}}}}},
54

39 "state":{"type":"text","fields":{"keyword":{"type":"keyword","ignore_above":256}}},
40 "translation":{"properties":{"@class":{"type":"text","fields":{"keyword":{"type":"keyword","ignore_above":256}}},
41 "code":{"type":"long"},"description":{"properties":{"value":{"type":"text","analyzer":"standard",
42 "fields":{"keyword":{"type":"keyword","ignore_above":256}}}}},"media":{"properties":{"probabilities":{"type":"float"},
43 "terms":{"type":"text","fields":{"keyword":{"type":"keyword","ignore_above":256}}}}},
44 "report_id":{"type":"text","fields":{"keyword":{"type":"keyword","ignore_above":256}}},
45 "status":{"type":"text","fields":{"keyword":{"type":"keyword","ignore_above":256}}}}}}},
46 "sightings":{"type":"nested","properties":{"@class":{"type":"text","fields":{"keyword":{"type":"keyword","ignore_above":256}}},
47 "id":{"type":"text","fields":{"keyword":{"type":"keyword","ignore_above":256}}},
48 "location":{"properties":{"geometry":{"properties":{"coordinates":{"type":"float"},
49 "type":{"type":"text","fields":{"keyword":{"type":"keyword","ignore_above":256}}}}},
50 "properties":{"properties":{"precision":{"type":"long"},"timestamp":{"type":"long"}}},
51 "type":{"type":"text","fields":{"keyword":{"type":"keyword","ignore_above":256}}}}},
52 "signal":{"type":"long"},"time":{"type":"long"}}},"state":{"type":"text","fields":{"keyword":{"type":"keyword","ignore_above":256}}},
53 "theft":{"type":"boolean"},"token":{"type":"text","fields":{"keyword":{"type":"keyword","ignore_above":256}}},
54 "types":{"type":"nested","properties":{"confidence":{"type":"float"},
55 "type":{"type":"text","fields":{"keyword":{"type":"keyword","ignore_above":256}}}}}}}},
56 "settings":{"number_of_shards":2,"number_of_replicas":1}}
55

Appendix C
Transcription of Interviews
The transcribed interviews along with the audio and video files can be foundon the attached DVD.
56