Embed Size (px)
Citation preview
93
CHAPTER-IV
DATA ANALYSIS AND INTERPRETATION
4.1 Introduction
Data analysis is a process of assigning meaning to collected data, analysing significance
and determination of findings and conclusions. Data analysis helps in finding conclusions
and results with the help of scientific methods. Significance of data analysis is to provide
suitable findings for proper results and conclusions. Data is firstly collected and coding of
data is done with suitable software like SPSS. Data is collected by several respondents of
selected companies with the help of questionnaires.
After collection of data, graphs, tables and charts are prepared with the help of software.
Graphs and charts help to analyze the collected data in a proper and desired way. Findings
and data interpretation becomes easy with software as manual calculations are time
consuming.
Variables are defined properly in context with hypothesis. Hypothesis has both dependent
and independent variables. Suitable test are applied on each hypotheses relating dependent
and independent variable. These tests provide results with certain conclusion and
recommendations.
In current chapter various factors are taken into consideration related with training of
employees in cement industry with special reference to industries in Rajasthan through the
framed set of hypothesis with the vision to analyze training programs in cement industry.
It elaborates the significance of various statistical tests which are applied in study. The
chapter describes the primary points of employee training program in cement industry,
94
strengthen the logics evolved in research and to justify the hypothesis related with current
study.
The survey was conducted among employees (sample size 300) of Cement Industry of
Rajasthan (JK cement, Ultratech cement, Shree Cement and Wonder cement) and views of
these employees in preview of training of employee of these industries. Employees of all
departments of cement industry such as Managers, Engineers, Higher authorities, & others
are evaluated as respondents in current study.
Researcher gave a brief introduction about herself and assured respondents that their
participation of providing information will be used for research study only. All the
respondents were asked some interview scheduled questions and their views on the topics
were noted.
4.1.1 Tools for Data Analysis
Description of Tools-
Questionnaire
Intensive Interviews
The main techniques of this study are to gather information through questionnaires which
is known as primary data, containing close ended questions. One set of questionnaire was
formed for all employees of cement industry respondents (J.K cement, Ultratech cement,
Shree Cement and Wonder cement). The questionnaire was divided into two parts
(Questionnaire is attached as Annexure-I at last of the thesis)
a) First part Section A consisted of Demographic Information i.e. primary information
regarding Respondent’s Name, Age, Designation, Income, and Gender etc.

95
b) The second part of the questionnaire i.e. Section B constitutes the crux of the research
and is related to training of employee in cement industry and directly correlates with
hypothesis testing.
4.1.2 Variables
Both dependent and independent variables are taken into consideration for study.
Dependent variable
Variable which is dependent on other associated factor and values got changed with
change in associated factor. Dependent variable in study is Employee Training Program.
Independent variable
Variable which is independent and not affected by other associated factor and value is
same with change in associated factor. Independent variable are communication skills,
technical awareness, performance, confidence, commitment, motivation, learning, loyalty,
team work etc.
4.2 Descriptive analysis
This provides the descriptive analysis of collected data with tables, charts and graphs. It
overall describes the data with each variable and percent wise comparison of each section.

96
(i) Demographic details of respondents.
Demographic study means study of different aspects of selected human population. It
includes age, gender, designation, organization details, income and educational
qualification of respondents.
In current research study Rajasthan is chosen as the universe of study. Training program
among cement industry employees has been tried to be identified. Tables and graphs show
the demographic details of respondents from employees of cement industry.
97
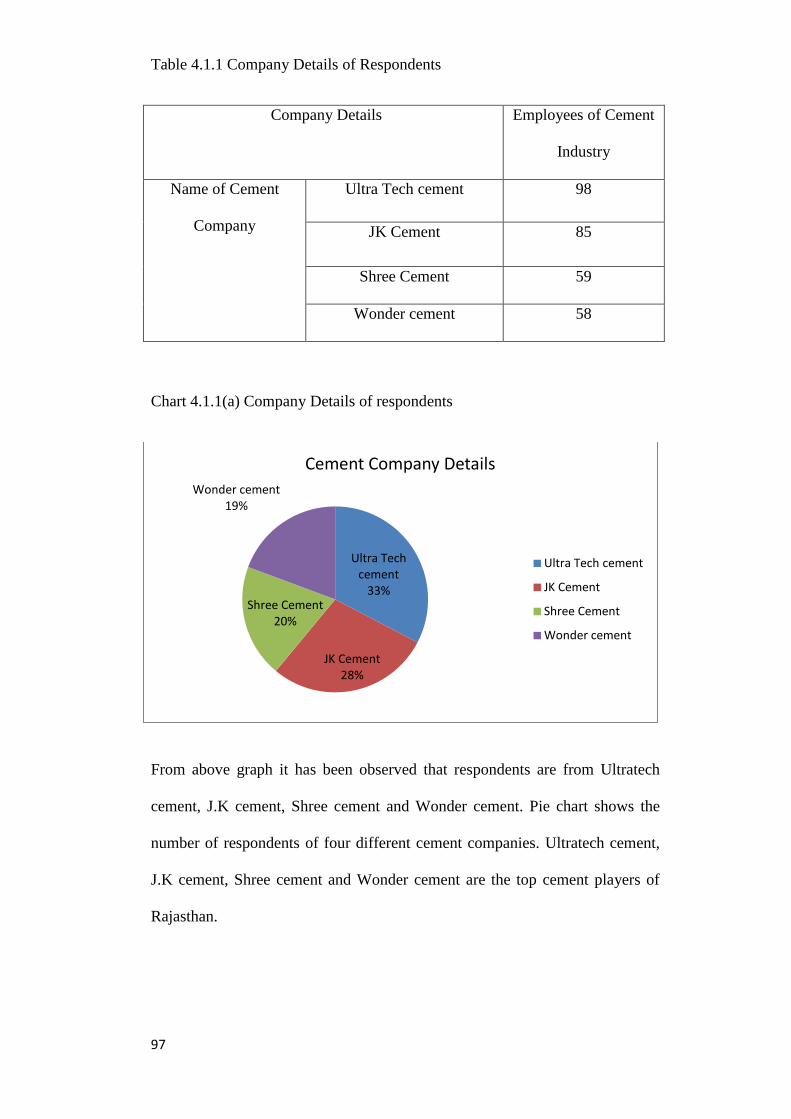
Table 4.1.1 Company Details of Respondents
Company Details Employees of Cement
Industry
Name of Cement
Company
Ultra Tech cement 98
JK Cement 85
Shree Cement 59
Wonder cement 58
Chart 4.1.1(a) Company Details of respondents
From above graph it has been observed that respondents are from Ultratech
cement, J.K cement, Shree cement and Wonder cement. Pie chart shows the
number of respondents of four different cement companies. Ultratech cement,
J.K cement, Shree cement and Wonder cement are the top cement players of
Rajasthan.
Ultra Tech cement
33%
JK Cement 28%
Shree Cement 20%
Wonder cement 19%
Cement Company Details
Ultra Tech cement
JK Cement
Shree Cement
Wonder cement

98
Table 4.1.2 Gender of Respondents
Gender Male respondents 276
Female respondents 24
Chart 4.1.2(a) Gender of Respondents
Cement industry is well known to all and it has been found that female
employees are very less as compared to male respondents. Female respondents
contribute only 8% of total respondents while male respondents are in majority
in above mentioned cement companies. Only 24 female respondents are there
as compared to 276 male respondents.
Male 92%
Female 8%
Gender of Respondents

99
Table 4.1.3 Age of Respondents
Age
(In Years)
Below 25 Years 31
26-35 (In Years) 86
36-45 (In Years) 95
45 Years and above 88
Chart 4.1.3(a) Age Group of Respondents
As per the chart most of the respondents belong to 36-45 years, above 45 years and
26-35 years in cement companies. It means that cement companies has higher age
workforce than young age employees. Below 25 years contribute only 10 % of the
total respondents. Majority of respondents are above 25 years of age.
Below 25 10%
26-35 29%
36-45 32%
45 and above 29%
Age Group of Respondents

100
Table 4.1.4 Educational Qualification of Respondents
Educational Qualification Below Graduation 32
Graduation 184
Post Graduation 30
Higher Studies 54
Chart 4.1.4(a) Educational Qualification of Respondents
Above chart depicts educational qualification of cement employees which shows that
two third of total respondents are graduated. Post graduated are only 10 % of total
respondents. This data shows the education level of cement companies which states
that most of the respondents have done graduation in cement companies.
Higher Studies 18%
Graduation 61%
Post Graduation 10%
Below Graduation
11%
Educational Qualification of Respondents

101
Table 4.1.5 Designation of Respondents
Designation Engineer 112
Manager 105
Higher Authority 42
Others 41
Chart 4.1.5(a) Designation of Respondents
Chart shows that most of the respondents of cement industry are engineers and
managers. More than 70% of respondents are engineers and managers. Engineers
are the base of technology and innovation and cement industry is equipped with
high machinery and mechanised plants.
Engineer 37%
Manager 35%
Higher Authority
14%
Others 14%
Designation of Respondents

102
Table 4.1.6 Work Experience of Respondents
Work Experience
0-3 Years 71
4-8Years 124
9-14 Years 68
15 Years & Above 37
Chart 4.1.6(a) Work Experience of Respondents
Another parameter deals with work experience of respondents of cement industry.
Working experience of 71 respondents is nearly in category of up to 3 years
experience and 4-8 years respondents are 124 in number. Very few employees have
15 years of work experiences.
0-3 Years 24%
4-8Years 41%
9-14 Years 23%
15 Years & Above 12%

103
Table 4.1.7 Monthly Income of Respondents
Monthly Income Less than Rs 20,000/- 46
Rs 20,001- Rs49,999/- 138
Rs 50,000- Rs99,999/- 69
Rs 1,00,000/- & Above 47
Chart 4.1.7(a) Monthly Salary of Respondents
Similarly the parameter under study is salary range of employees and it is identified
that maximum respondents have salary from Rs 20,000 to Rs 49,000/-(138
respondents) and another category of respondents are less than Rs 20,000/- per month
and they are only 46.
Less than Rs 20,000/-
15%
Rs 20,001- Rs49,999/-
46%
Rs 50,000- Rs99,999/-
23%
Rs 1,00,000/- & Above
16%
104
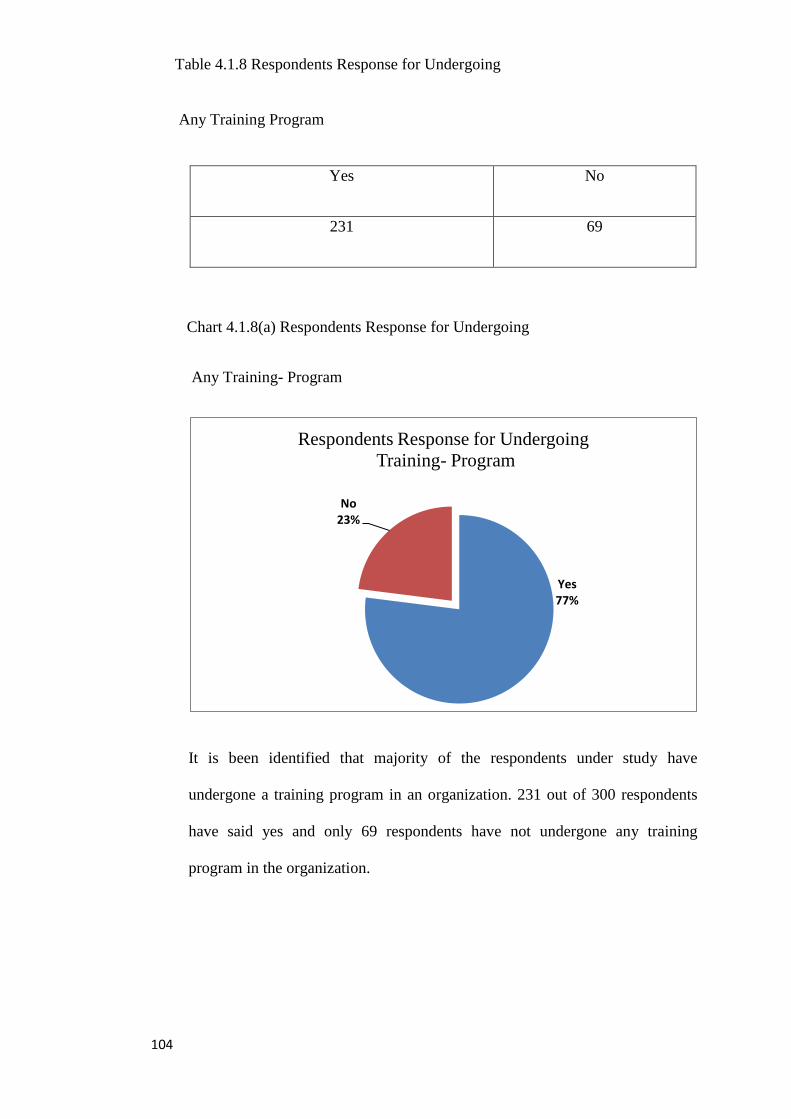
Table 4.1.8 Respondents Response for Undergoing
Any Training Program
Yes No
231 69
Chart 4.1.8(a) Respondents Response for Undergoing
Any Training- Program
It is been identified that majority of the respondents under study have
undergone a training program in an organization. 231 out of 300 respondents
have said yes and only 69 respondents have not undergone any training
program in the organization.
Yes 77%
No 23%
Respondents Response for Undergoing
Training- Program
105
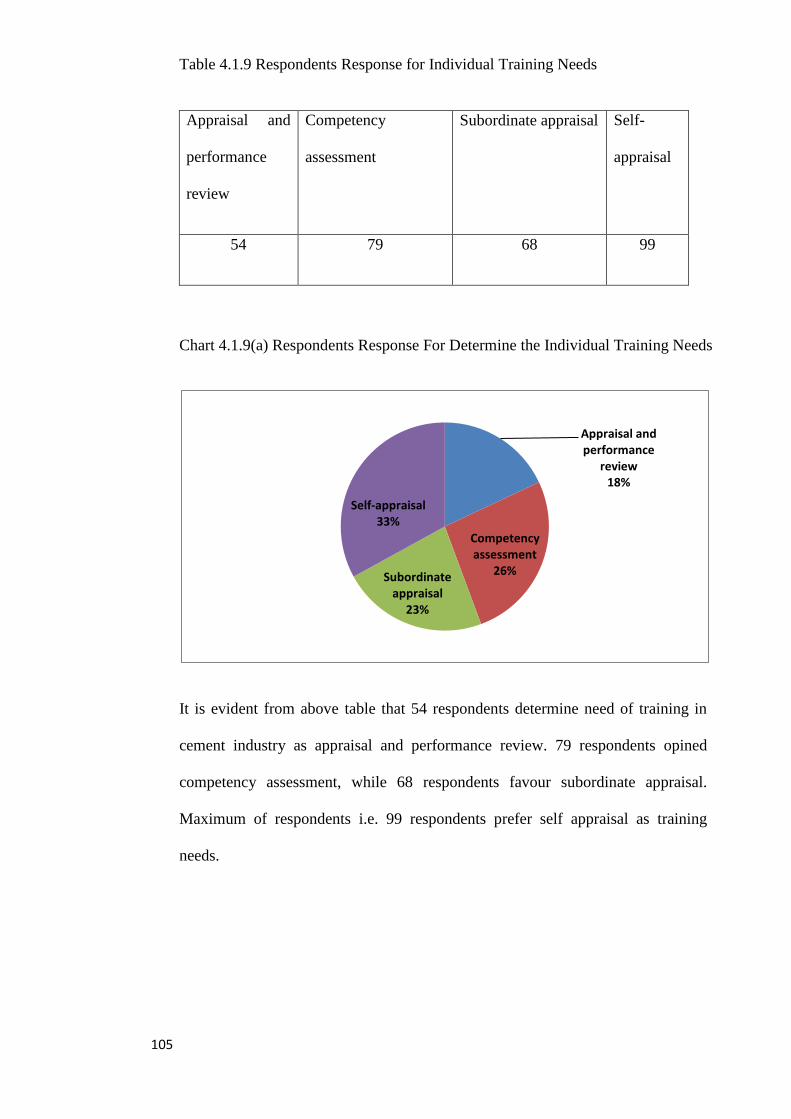
Table 4.1.9 Respondents Response for Individual Training Needs
Appraisal and
performance
review
Competency
assessment
Subordinate appraisal Self-
appraisal
54 79 68 99
Chart 4.1.9(a) Respondents Response For Determine the Individual Training Needs
It is evident from above table that 54 respondents determine need of training in
cement industry as appraisal and performance review. 79 respondents opined
competency assessment, while 68 respondents favour subordinate appraisal.
Maximum of respondents i.e. 99 respondents prefer self appraisal as training
needs.
Appraisal and performance
review 18%
Competency assessment
26% Subordinate appraisal
23%
Self-appraisal 33%
106
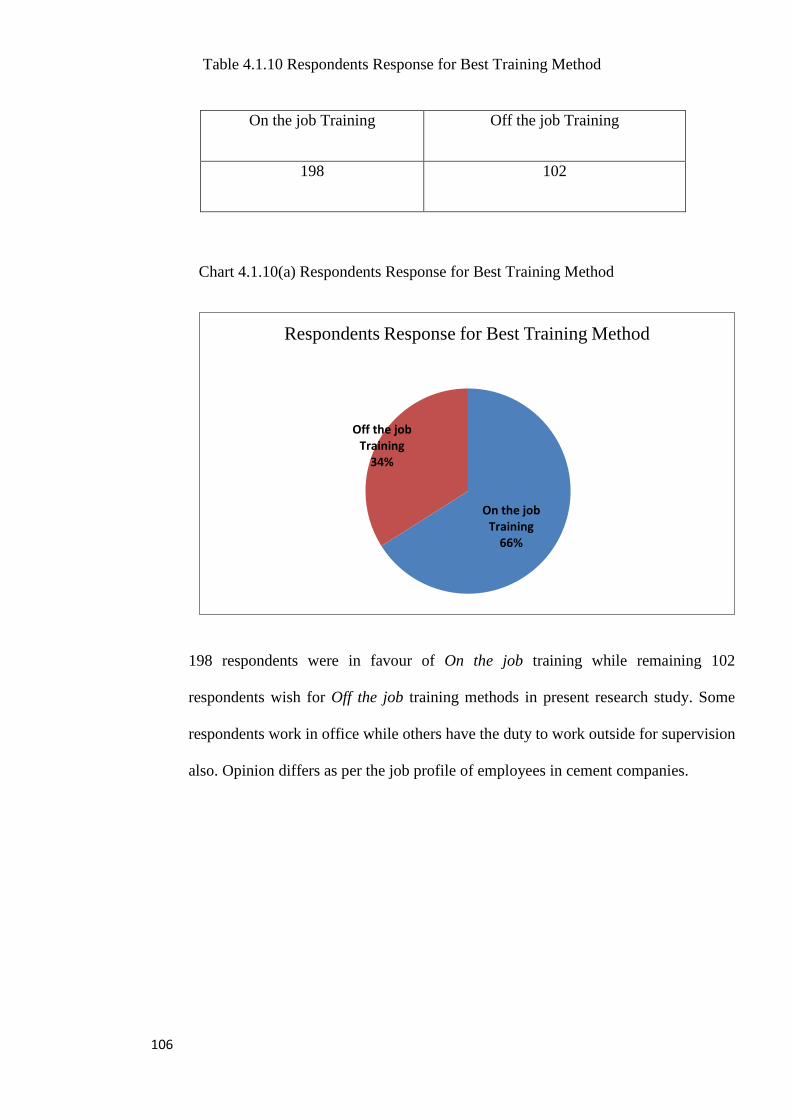
Table 4.1.10 Respondents Response for Best Training Method
On the job Training Off the job Training
198 102
Chart 4.1.10(a) Respondents Response for Best Training Method
198 respondents were in favour of On the job training while remaining 102
respondents wish for Off the job training methods in present research study. Some
respondents work in office while others have the duty to work outside for supervision
also. Opinion differs as per the job profile of employees in cement companies.
On the job Training
66%
Off the job Training
34%
Respondents Response for Best Training Method
107
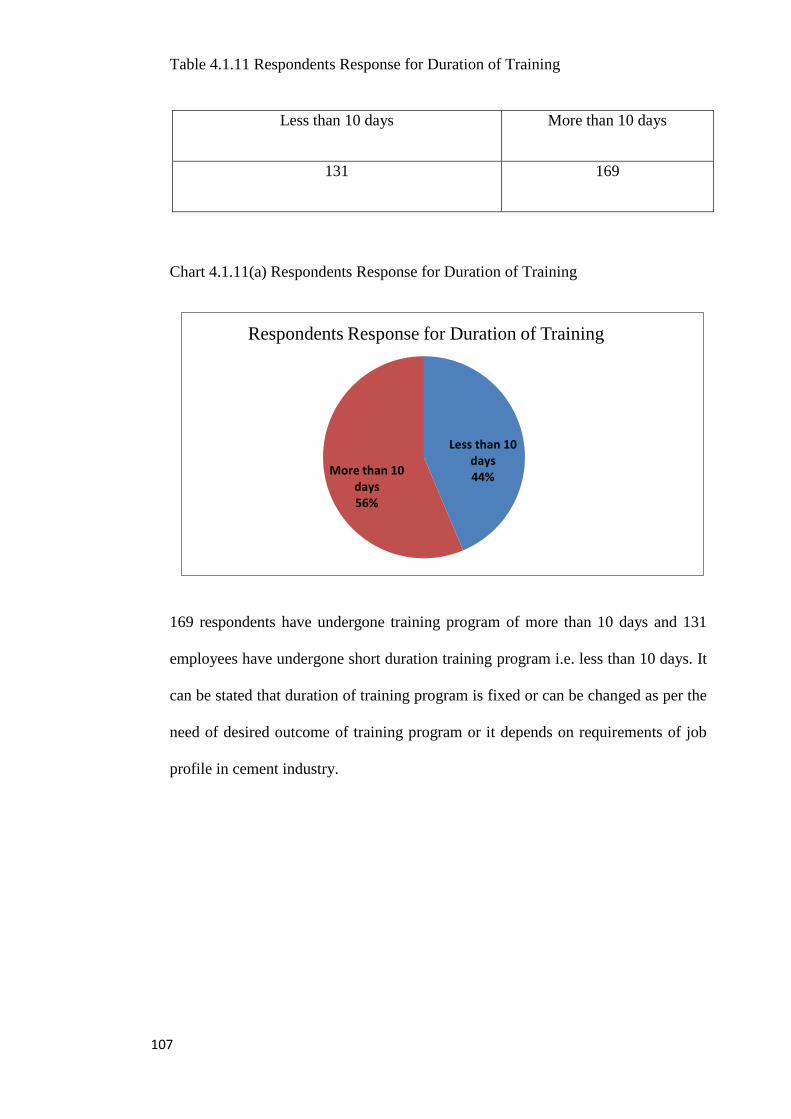
Table 4.1.11 Respondents Response for Duration of Training
Less than 10 days More than 10 days
131 169
Chart 4.1.11(a) Respondents Response for Duration of Training
169 respondents have undergone training program of more than 10 days and 131
employees have undergone short duration training program i.e. less than 10 days. It
can be stated that duration of training program is fixed or can be changed as per the
need of desired outcome of training program or it depends on requirements of job
profile in cement industry.
Less than 10 days 44%
More than 10 days 56%
Respondents Response for Duration of Training

108
Table 4.1.12 - Comparison of Duration of Training with Final Outcome of Training
Statement Strongly agree Agree Neutral Disagree Strongly
Disagree
Duration of
training
program effect
the final
outcome.
51 62 157 21 9
Chart 4.1.12(a) Respondents Response Comparison of Duration of Training with Final
Outcome of Training
Above study analyses the comparison of duration of training with final outcome of training
and it has been observed that most of the respondents are neutral on the effect of time
duration of training program on final outcome. Very few of respondents are agreed or
disagreed over effect of time duration of training on final outcome.
0
20
40
60
80
100
120
140
160
Strongly agree
Agree Neutral Disagree Strongly Disagree
No
of
Re
spo
nd
en
ts
Respondents Response
Respondents response

109
Table 4.1.13 Respondents Response for Various Methods of Training
S. no Method of Training No of Respondents
1. Lectures 18
2. Demonstrations 54
3. Discussions 39
4. Computer Based Training ((CBT) 62
5. Games & Simulation 13
6. Coaching 17
7. Mentoring 2
8. Job rotation 45
9. Sensitivity training 16
10. Transactional analysis 10
11. Simulation exercises 24
Methods of Training:-
Eleven various types of training methods are being applied in cement industry for their
employees.

110
Chart 4.1.13(A) Respondents Response for Various Methods of Training
Above study analyses the most appropriate method of training program in view of
respondents. The respondent views show that demonstration and computer based training
are the preferred training methods in cement industry. Job rotation is highly desired for
training program in cement companies.
Lectures
Demonstratio
ns
Discussions
Computer
Based Training ((CBT)
Games &
Simulation
Coaching
Mentoring
Job rotatio
n
Sensitivity
training
Transactional
analysis
Simulation
exercises
Series1 18 54 39 62 13 17 2 45 16 10 24
0
10
20
30
40
50
60
70
No
of
Re
spo
nd
en
ts
Respondents response for various methods of Training
111
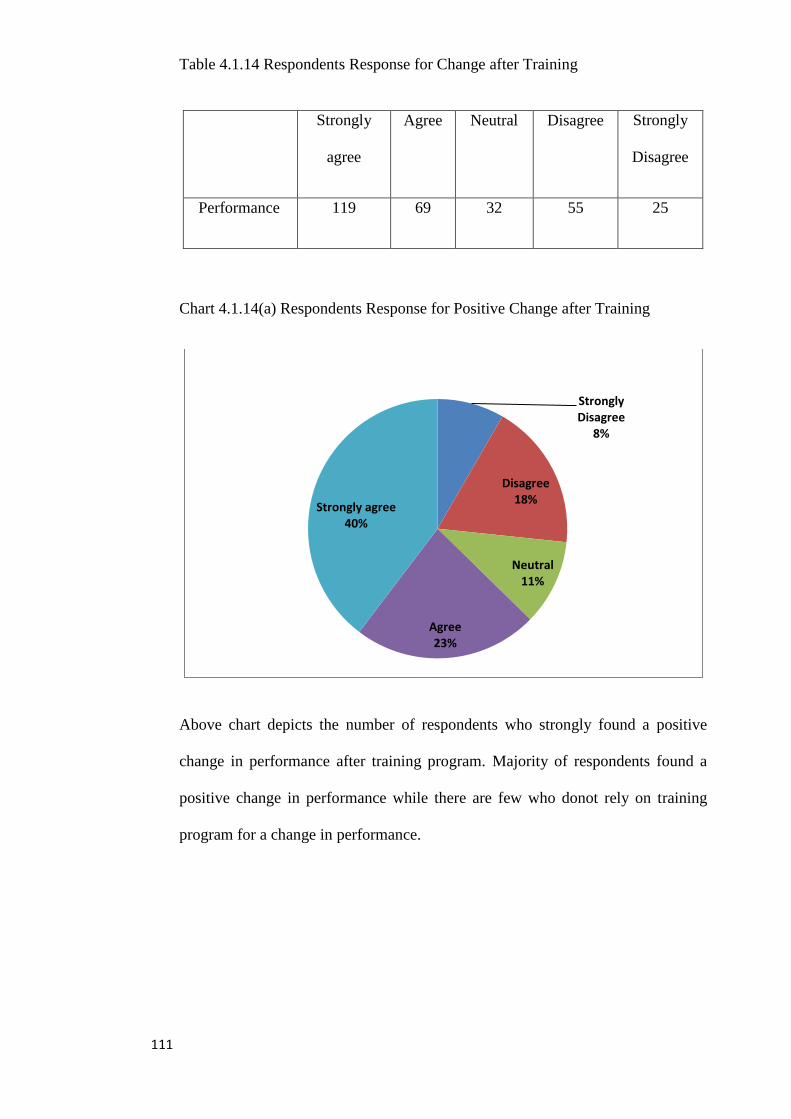
Table 4.1.14 Respondents Response for Change after Training
Strongly
agree
Agree Neutral Disagree Strongly
Disagree
Performance 119 69 32 55 25
Chart 4.1.14(a) Respondents Response for Positive Change after Training
Above chart depicts the number of respondents who strongly found a positive
change in performance after training program. Majority of respondents found a
positive change in performance while there are few who donot rely on training
program for a change in performance.
Strongly Disagree
8%
Disagree 18%
Neutral 11%
Agree 23%
Strongly agree 40%
112
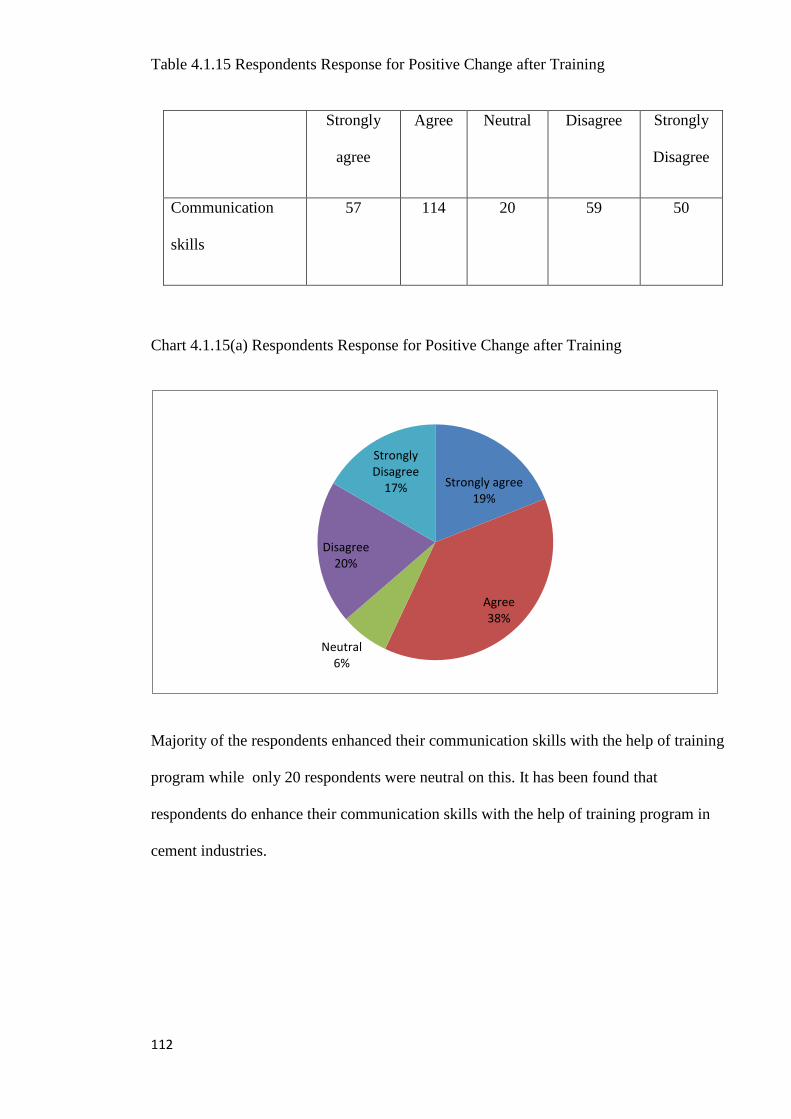
Table 4.1.15 Respondents Response for Positive Change after Training
Strongly
agree
Agree Neutral Disagree Strongly
Disagree
Communication
skills
57 114 20 59 50
Chart 4.1.15(a) Respondents Response for Positive Change after Training
Majority of the respondents enhanced their communication skills with the help of training
program while only 20 respondents were neutral on this. It has been found that
respondents do enhance their communication skills with the help of training program in
cement industries.
Strongly agree 19%
Agree 38%
Neutral 6%
Disagree 20%
Strongly Disagree
17%
113
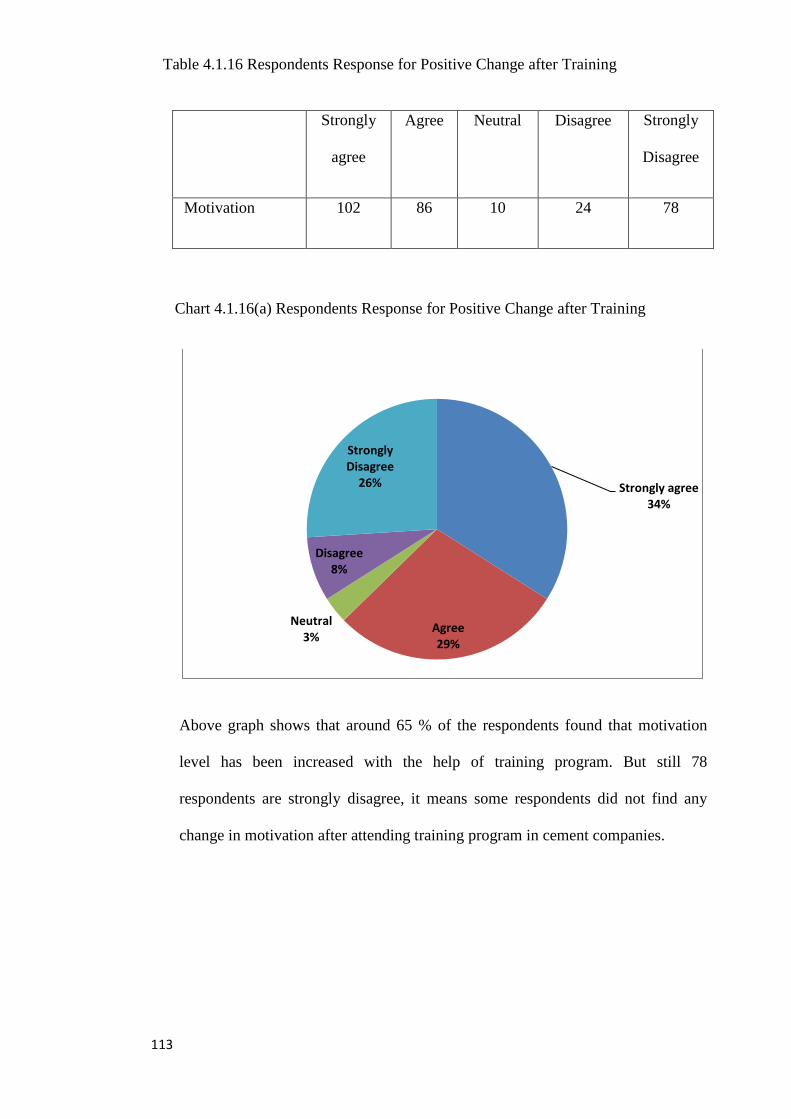
Table 4.1.16 Respondents Response for Positive Change after Training
Strongly
agree
Agree Neutral Disagree Strongly
Disagree
Motivation 102 86 10 24 78
Chart 4.1.16(a) Respondents Response for Positive Change after Training
Above graph shows that around 65 % of the respondents found that motivation
level has been increased with the help of training program. But still 78
respondents are strongly disagree, it means some respondents did not find any
change in motivation after attending training program in cement companies.
Strongly agree 34%
Agree 29%
Neutral 3%
Disagree 8%
Strongly Disagree
26%

114
Table 4.1.17 Respondents Response for Positive Change after Training
Strongly
agree
Agree Neutral Disagree Strongly
Disagree
Personality 102 105 26 45 20
Chart 4.1.17(a) Respondents Response for Positive Change after Training
It has been analysed that positive change in personality through training program
can be achieved in cement industry as maximum respondents are agree on this.
Neutral respondents are only 9% of total employees.
Strongly agree 34%
Agree 35%
Neutral 9%
Disagree 15%
Strongly Disagree 7%

115
Table 4.1.18 Respondents Response for Positive Change after Training
Strongly
agree
Agree Neutral Disagree Strongly
Disagree
Learning 56 113 22 58 51
Chart 4.1.18(a) Respondents Response for Positive Change after Training
It has been found that positive change in learning is possible by attending training
program, around 113 employees found change in their learning. But 17 % of
employees did not find any change in learning after training program. It states that
cement industry training programs enhances learning of employees.
Strongly agree 19%
Agree 38%
Neutral 7%
disagree 19%
Strongly disagree
17% Strongly agree
Agree
Neutral
disagree
Strongly disagree

116
Table 4.1.19 Respondents Response for Positive Change after Training
Strongly
agree
Agree Neutral Disagree Strongly
Disagree
Technical
awareness
136 105 27 18 14
Chart 4.1.19(a) Respondents Response for Positive Change after Training
Technical awareness can be improved with the help of training in cement industry.
Only 11% respondents did not get technological awareness through training program
but most of the respondents enhanced their technical expertise in cement industry.
Strongly agree 45%
Agree 35%
Neutral 9%
Disagree 6%
Strongly Disagree 5%

117
Table 4.1.20 Respondents Response for Positive Change after Training
Strongly
agree
Agree Neutral Disagree Strongly
Disagree
Role clarity 95 96 21 51 37
Chart 4.1.20(a) Respondents Response for Positive Change after Training
Above graph states that role clarity or clarity of role, duties and liabilities of
employees can be enhanced through training program in cement industry. 191
respondents become clear about their role at workplace but still 37 respondents
are not satisfied. 21 employees are neutral and it contribute 7% of total
respondents.
Strongly agree 32%
Agree 32%
Neutral 7%
Disagree 17%
Strongly Disagree 12%
118
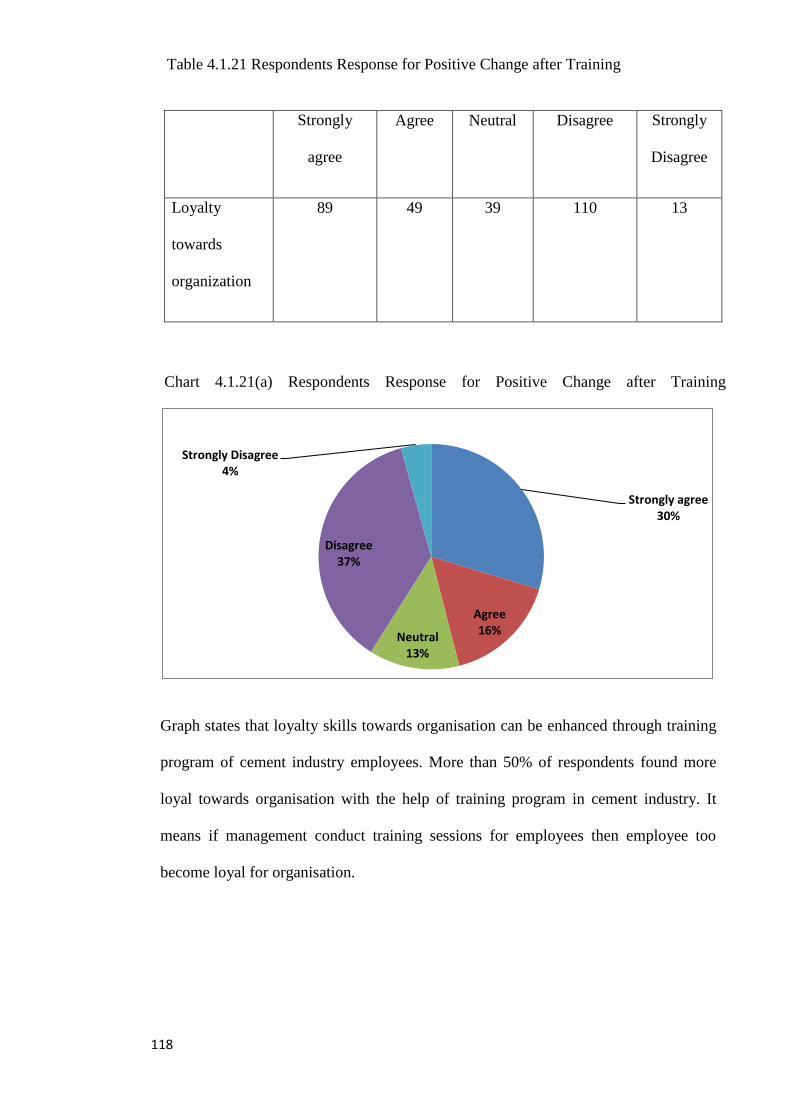
Table 4.1.21 Respondents Response for Positive Change after Training
Strongly
agree
Agree Neutral Disagree Strongly
Disagree
Loyalty
towards
organization
89 49 39 110 13
Chart 4.1.21(a) Respondents Response for Positive Change after Training
Graph states that loyalty skills towards organisation can be enhanced through training
program of cement industry employees. More than 50% of respondents found more
loyal towards organisation with the help of training program in cement industry. It
means if management conduct training sessions for employees then employee too
become loyal for organisation.
Strongly agree 30%
Agree 16%
Neutral 13%
Disagree 37%
Strongly Disagree 4%

119
Table 4.1.22 Respondents Response for Positive Change after Training
Strongly
agree
Agree Neutral Disagree Strongly
Disagree
Mutual trust 80 95 18 52 56
Chart 4.1.22(a) Respondents Response for Positive Change after Training
Study shows mutual trust or mutual bonding can become stronger through training
program in cement industry. Nearly half of the respondents found stronger mutual
bonding and only 18 employees do not find any change in mutual relationship
through training program. Only 19% respondents have no affect on mutual
relationship by training programs.
Strongly agree 27%
Agree 31%
Neutral 6%
Disagree 17%
Strongly Disagree
19%

120
Table 4.1.23 Respondents Response for Positive Change after Training
Strongly
agree
Agree Neutral Disagree Strongly
Disagree
Change
adaptation
112 109 22 41 16
Chart 4.1.23(a) Respondents Response for Positive Change after Training
Respondents found that training helps in adopting change where change can be
related to knowledge, learning or working environment. 75% of respondents favour
to enhance change adaptation ability with training sessions. Training improves
expertise, builds confidence and loyalty, enhance communication skills and team
bonding, all these helps an employee to adopt change in an organisation.
Strongly agree 38%
Agree 36%
Neutral 7%
Disagree 14%
Strongly Disagree 5%

121
Table 4.1.24 Respondents Response for Positive Change after Training
Strongly agree Agree Neutral Disagree Strongly
Disagree
Confidence 84 99 14 49 54
Chart 4.1.24(a) Respondents Response for Positive Change after Training
Training helps employees in doing their job well and most of the respondents opined
for increase in confidence level through training program. This states that training
program of cement industry is significant for building confidence level.
Strongly agree 28%
Agree 33% Neutral
5%
Disagree 16%
Strongly Disagree 18%
122
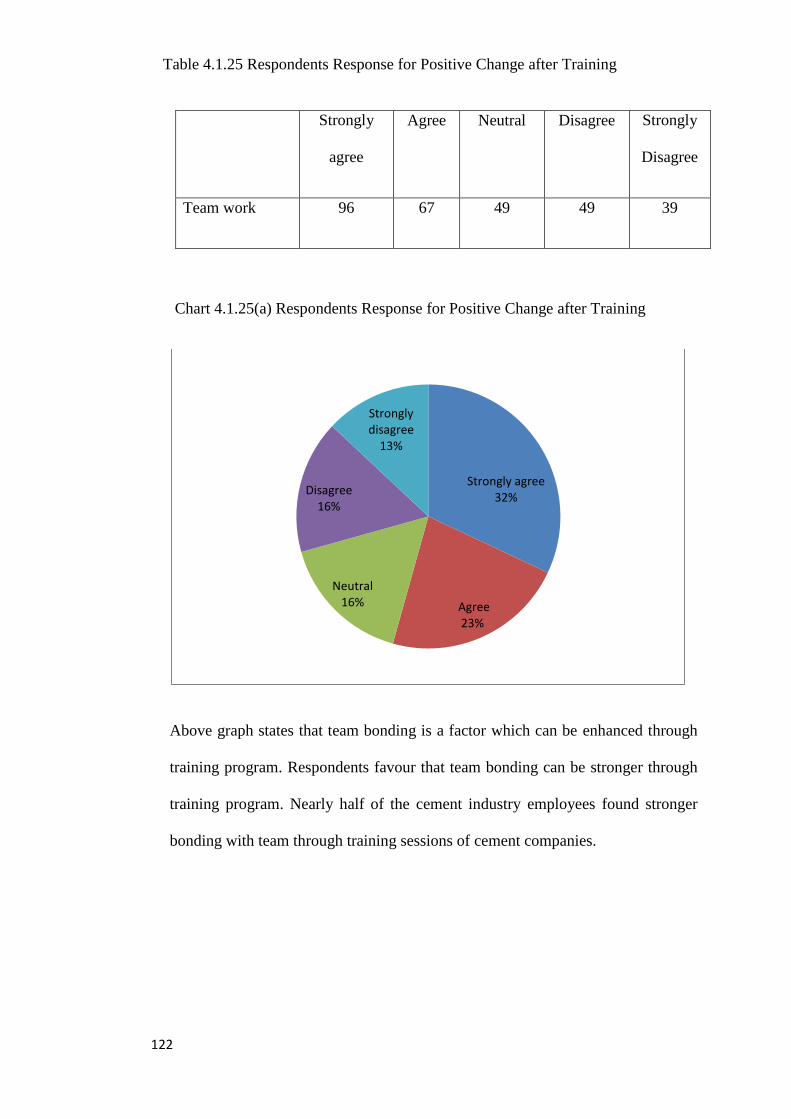
Table 4.1.25 Respondents Response for Positive Change after Training
Strongly
agree
Agree Neutral Disagree Strongly
Disagree
Team work 96 67 49 49 39
Chart 4.1.25(a) Respondents Response for Positive Change after Training
Above graph states that team bonding is a factor which can be enhanced through
training program. Respondents favour that team bonding can be stronger through
training program. Nearly half of the cement industry employees found stronger
bonding with team through training sessions of cement companies.
Strongly agree 32%
Agree 23%
Neutral 16%
Disagree 16%
Strongly disagree
13%

123
Table 4.1.26 Respondents Response for Positive Change after Training
Strongly
agree
Agree Neutral Disagree Strongly
Disagree
Commitment
towards
organization
95 96 21 51 37
Chart 4.26(a) Respondents Response for Positive Change after Training
Above graph states that nearly 200 respondents found more committed towards
organisation after attending training program in cement industry. This means training
in cement industries build commitment of employees towards organisation.
Strongly agree 32%
agree 32%
Neutral 7%
disagree 17%
Strongly disagree
12%

124
Table 4.1.27 Respondents Response for Positive Change after Training
Strongly
agree
Agree Neutral Disagree Strongly
Disagree
Leadership skills 80 67 59 54 40
Chart 4.1.27(a) Respondents Response for Positive Change after Training
As per the graph it has been observed that respondents found positive change in
leadership traits through training program. Nearly half of the employees find change in
leadership traits through training programs. 59 respondents have no views but 94
respondents found no change in leadership traits.
Strongly agree 27%
agree 22% Neutral
20%
Disagree 18%
Strongly disagree
13%

125
Table 4.1.28 Respondents Response for Negative Impact of Training
Statement Yes No
Performance 45 255
Chart 4.1.28(A) Respondents Response for Negative Impact of Training
Respondent’s response for negative impact of training on employee performance
shows that there is no negative impact of training on employee performance. 255
respondents found no negative impact which states that training program in cement
industry has no negative impact on performance.
Yes 15%
No 85%
Respondents Response for Negative Impact of
Training on performance

126
Table 4.1.29 Respondents Response for Negative Impact of Training
Statement Yes No
Learning 69 231
Chart 4.1.29(A) Respondents Response for Negative Impact of Training
Respondent’s response for negative impact of training on employee learning
shows that there is no negative impact of training on learning of employees. 231
respondents found no negative impact which reveals that training program in
cement industry has no negative impact on learning of employees.
Yes 23%
No 77%
Respondents Response for Negative Impact of
Training on learning

127
Table 4.1.30 Respondents Response for Satisfied Training Program
Statement Yes No
Are you satisfied with the Training
programs organized by company?
241 59
Chart 4.1.30(a) Respondents Response for Satisfied Training Program
Study shows that most of the respondents are satisfied with the training program
conducted by the company in cement industries but there are 59 respondents who
are not satisfied with training sessions. This means companies have to work over
training program to make training a successful event in organisation.
Yes 80%
No 20%
Respondents Response for satisfied training program

128
Table 4.1.31 Respondents Response for Improvement of Training Program
Expert guidance Competency
assessment
Proper follow -up Time duration
82 89 91 38
Chart 4.1.31(a) Respondents Response for Improvement of Training Program
Employees preferred guidance of experts and competency assessment as most
preferred ways to improve training program in cement companies. Proper follow up
is needed at priority for improving training program as per the respondent’s views.
Time duration is not a way to improve training program as it is favoured by only
13% of total respondents.
Expert guidance 27%
Competency assessment
30%
Proper follow -up 30%
Time duration 13%
Training programme can be improved by
Expert guidance
Competency assessment
Proper follow -up
Time duration

129
4.3 Testing of hypothesis
Tools for Hypothesis Testing
Descriptive analysis is done after data collection which will be followed by appropriate
statistical analysis. Statistical analysis includes representation and tabulation using graphs
and charts for diagrammatic representation of data.
Hypothesis testing is a process to test given hypothesis with scientific methods. Hypothesis
testing process has four steps:
1. Formulate the null hypothesis Ho.
2. Find out a statistical test to evaluate the acceptance of null hypothesis.
3. Work out the actual value of P. Smaller the actual P-value, more robust evidence will be
against null theory.
4. Comparison of actual p-value with an appropriate significance level (known as a great
leader value). If p<=alpha, which shows result is usually statistically considerable, the
actual null theory is usually eliminated, alternate theory is usually logical.
The data collected from the questionnaire has been used to check the hypothesis. For
hypothesis testing the following statistical techniques are being applied on the tabulated
data.
130
Following tests have been applied on the study.
1. Cronbach’s Alpha
2. Normality Test (Shapiro Wilk Test)
3. Chi-Square (Goodness of Fit)
4. Chi-Square for Independence
Cronbach Alpha
Cronbach alpha is the most commonly used method to measure reliability or internal
consistency. It was given by Kuder & Richardson in year 1937 and later on generalized by
Cronbach for test measures.
Cronbach alpha is a tool to investigate reliability of data or given sample. Test provides an
estimate of internal consistency but does not imply the stability of sample test with respect
to time. It estimates proportion of variance in test score and that can be attributed to true
variance.
More the normality or normal distribution it would provide, high value estimate of
Cronbach alpha will be achieved. It shows how much the data is reliable with internal
consistency of a set of items. Less reliability means less estimation to work further or less
reliability of results.
If Cronbach alpha is greater than .075 or equal to that, it estimates the reliability of data but
if it is less than standard value, reliability test failed in that case.
Alpha value > = 0.75 (reliability passed)
Alpha value < 0.75 (reliability failed)

131
Shapiro Wilk Test for Normality
Normality tests means that the assumed distribution of population from which samples are
drawn are normally distributed or not. Although true normality is considered to be a myth,
one can check normality by graphs, plots, tests etc.
Chi-Square Test (A Goodness of Fit)
Chi-square is a test to find that observed value is a true representative of given distribution
or not. By this it is studied that expected frequencies or a distribution fits an appropriate
model or not. For chi square goodness of fit number of degrees of freedom is the
independent values which can be done for expected values or by this much degree change
is acceptable by the method.
In likelihood hypothesis and facts, the chi-squared appropriation (likewise chi-square or χ²-
circulation) with k degrees of flexibility is the dispersion of a total of the squares of k free
standard ordinary irregular variables.
Chi-Square Test for Independence
This test is applied to find association between two independent variables for a study to be
performed in research. In the current research design Chi Square is been applied and
interpreted with the help of table as well as SPSS software. Interpretation is essential as the
useful users and utility of researchers findings lie in proper interpretation. It is through
interpretation that the researcher can well understand the abstract principle that work
beneath the findings.

132
4.4 Reliability test- Cronbach’s Alpha through SPSS software.
Table 4.4 (a)
Reliability Statistics
Cronbach's Alpha No. of Items
.894 15
Interpretation: The above reliability study indicates that various cement industries in
Rajasthan respondent’s responses are reliable up to significant level and free from biases.
Cronbach's Alpha is a reliability tests which shows reliability of data and this has been
done with the help of SPSS software.
It can be seen that Cronbach's alpha is 0.894, which shows high level of internal
consistency of sample data. If Cronbach's Alpha value is equal or more than 0.75 than data
is considered to be reliable but if it is less than 0.75 than data is not reliable.

133
4.5 Normality test through Shapiro Wilk test
Table 4.5(a)
Tests of Normality
Variables
Shapiro-Wilk Test
Statistic df Sig.
Performance .827 299 .000
Communication
Skills
.852 299 .000
Motivation .783 299 .000
Personality .831 299 .000
Learning .854 299 .000
Technical
Awareness
.840 299 .000
Role clarity .833 299 .000
Loyalty .835 299 .000
Mutual trust .764 299 .000
Change Adaptation .809 299 .000
Confidence .827 299 .000
Team work .860 299 .000
Commitment .833 299 .000
Leadership .882 299 .000

134
Interpretation: From the above table it can be seen that the significant value of Shapiro-
Wilk test is less than 0.05, so the data significantly deviate from a normal distribution. The
significant value for each statement is less than 0.05, normality test failed and it is assumed
that data is not normal. If the significance level is more than 0.05 than data is considered to
be normal. So for hypothesis testing non-parametric tests will be applied as normality of
data got failed as per Shapiro-Wilk test.
Hypothesis Testing
Hypothesis 1
H10: There is no significant difference amongst the opinion of employees regarding
effectiveness of training program with respect to selected variables in cement industry.
H1: There is a significant difference amongst the opinion of employees regarding
effectiveness of training program with respect to selected variables in cement industry.
4.6 Chi-Square Test (Goodness of Fit)
Independent variables are: Performance, Communication Skills, Motivation, Personality,
Learning, Technical Awareness, Role clarity, Loyalty, Mutual trust, Change Adaptation,
Confidence, Team work, Commitment, Leadership.

135
Table 4.6 (a) Chi-Square Test (Goodness of Fit)
Test Statistics
Variables Asymp. Sig. df
Chi-Square
Performance .000 4 93.267a
Communication
Skills
.000
4
77.100a
Motivation .000 4 109.333a
Personality .000 4 72.700a
learning .000 4 72.567a
Technical
Awareness
.000
4
57.967a
Role clarity .000 4 100.548b
Loyalty .000 4 77.533a
Mutual trust .000 4 212.833a
Change Adaptation .000 4 147.433a
Confidence .000 4 110.233a
Team work .000 4 33.800a
Commitment .000 4 77.533a
Leadership .000
4
14.767a
136
Interpretation: Above table shows the significant value of each independent variable and
chi-square value at four degree of freedom for selected variables. It has been observed
from above table that the significant difference of all selected variables are less than 0.05
which means null hypothesis will be rejected and alternate hypothesis will be accepted. It
indicates that there is a significant difference amongst the opinion of employees regarding
effectiveness of employee training program with respect to selected variables in cement
industry.
Hypothesis 2
H20: There is no significant association amongst opinion of employees regarding impact of
training program on employee skills on the basis of training methods.
H21: There is a significant association amongst opinion of employees regarding impact of
training program on employee skills on the basis of training methods.
4.7 Chi-Square for Independence
Employee skills as- Technical Awareness and Role clarity
Independent variables are: Technical Awareness and Training methods
Training methods: On the job training and Off the job training

137
Table 4.7 (a) Crosstab: Training methods and Technical Awareness
Crosstab: Training methods and Technical
Awareness
Total
strongly
disagree disagree neutral agree
strongly
agree
On the
job
training
% within
training
method
5.6% 3.5% 7.1% 35.9% 48.0% 100.0%
% within
technical
aware
78.6% 38.9% 51.9% 67.6% 69.9% 66.0%
% of
Total
3.7% 2.3% 4.7% 23.7% 31.7% 66.0%
Off the
job
training
% within
training
method
2.9% 10.8% 12.7% 33.3% 40.2% 100.0%
% within
technical
aware
21.4% 61.1% 48.1% 32.4% 30.1% 34.0%
% of
Total
1.0% 3.7% 4.3% 11.3% 13.7% 34.0%
Total % within
training
method
4.7% 6.0% 9.0% 35.0% 45.3% 100.0%
% within
technical
aware
100.0% 100.0% 100.0% 100.0% 100.0% 100.0%
% of
Total
4.7% 6.0% 9.0% 35.0% 45.3% 100.0%

138
Table 4.7 (b) - Chi-Square Tests
Chi-Square Tests
Value df
Asymp. Sig. (2-
sided)
Pearson Chi-Square 10.313a 4 .035
Likelihood Ratio 9.892 4 .042
Linear-by-Linear
Association
2.276 1 .131
N of Valid Cases 300
Interpretation: From the above table it can be seen that Pearson Chi-Square is
10.313; significant value is .035 at 4 degree of freedom. The significant value is less
than 0.05 which results in rejection of null hypothesis. It indicates that there is a
significant association amongst opinion of employees regarding impact of training
program on employee technical awareness on the basis of different training methods.

139
Table 4.7 (c) Crosstab: Training methods and Role Clarity.
Training methods: On the job training and Off the job training
Crosstab: Training methods and Role Clarity
Total
strongly
disagree disagree neutral agree
strongly
agree
On the
job
training
% within
training
method
14.1% 12.6% 5.6% 32.8% 34.8% 100.0%
% within
technical
aware
75.7% 49.0% 52.4% 67.7% 72.6% 66.0%
% of
Total
9.3% 8.3% 3.7% 21.7% 23.0% 66.0%
Off the
job
training
% within
training
method
8.8% 25.5% 9.8% 30.4% 25.5% 100.0%
% within
technical
aware
24.3% 51.0% 47.6% 32.3% 27.4% 34.0%
% of
Total
3.0% 8.7% 3.3% 10.3% 8.7% 34.0%
Total % within
training
method
12.3% 17.0% 7.0% 32.0% 31.7% 100.0%
% within
technical
aware
100.0% 100.0% 100.0% 100.0% 100.0% 100.0%
% of
Total
12.3% 17.0% 7.0% 32.0% 31.7% 100.0%

140
Table 4.7(d) Chi-Square Tests
Chi-Square Tests
Value df
Asymp. Sig. (2-
sided)
Pearson Chi-Square 11.819a 4 .019
Likelihood Ratio 11.535 4 .021
Linear-by-Linear
Association
1.869 1 .172
N of Valid Cases 300
Interpretation: From the above table it can be seen that Pearson Chi-Square is 11.8;
significant value is .019 at 4 degree of freedom. The significant value is less than .05
which results in rejection of null hypothesis. It indicates that there is a significant
association amongst opinion of employees regarding impact of training program on
employee role clarity on the basis of different training methods.

141
Hypothesis 3
H20: There is no significant association amongst opinion of employees regarding impact of
training program on employee skills on the basis of different age groups.
H21: There is a significant association amongst opinion of employees regarding impact of
training program on employee skills on the basis of different age groups.
4.8 Chi-Square for Independence
Employee skills as- Communication Skills and Confidence
Independent variables are: Communication Skills and Age Groups

142
Table 4.8(a) Crosstab: Communication Skills and Age Groups.
Crosstab: Communication Skills and Age
Groups Total strongly
disagree
disagr
ee
neutral agree strongl
y agree
BELO
W 25
yrs
% within
Age
6.5% 22.6% 48.4% 22.6% 100.0
%
% within
Communic
ation
4.0% 11.9% 13.2% 12.3% 10.3%
% of Total .7% 2.3% 5.0% 2.3% 10.3%
26-35 % within
Age
4.7% 12.8% 59.3% 23.3% 100.0
%
% within
Communic
ation
8.0% 18.6% 44.7% 35.1% 28.7%
% of Total 1.3% 3.7% 17.0% 6.7% 28.7%
36-45 % within
Age
7.4% 14.7% 13.7% 40.0% 24.2% 100.0
%
% within
Communic
ation
14.0% 23.7% 65.0% 33.3% 40.4% 31.7%
% of Total 2.3% 4.7% 4.3% 12.7% 7.7% 31.7%
above
45 yrs
% within
Age
42.0% 30.7% 8.0% 11.4% 8.0% 100.0
%
% within
Communic
ation
74.0% 45.8% 35.0% 8.8% 12.3% 29.3%
% of Total 12.3% 9.0% 2.3% 3.3% 2.3% 29.3%
Total % within
Age
16.7% 19.7% 6.7% 38.0% 19.0% 100.0
%
% within
Communic
ation
100.0% 100.0
%
100.0
%
100.0
%
100.0
%
100.0
%
% of Total 16.7% 19.7% 6.7% 38.0% 19.0% 100.0
%

143
Table 4.8(b) Chi-Square Tests
Value df
Asymp. Sig. (2-
sided)
Pearson Chi-Square 107.885a 12 .000
Likelihood Ratio 114.478 12 .000
Linear-by-Linear
Association
52.367 1 .000
N of Valid Cases 300
Interpretation: From the above table it can be seen that Pearson Chi-Square is
107.8; significant value is .000 at 12 degree of freedom. The significant value is less
than .05 which results in rejection of null hypothesis. It indicates that there is a
significant association amongst opinion of employees regarding impact of training
program on employee communication skills on the basis of different age groups.
144
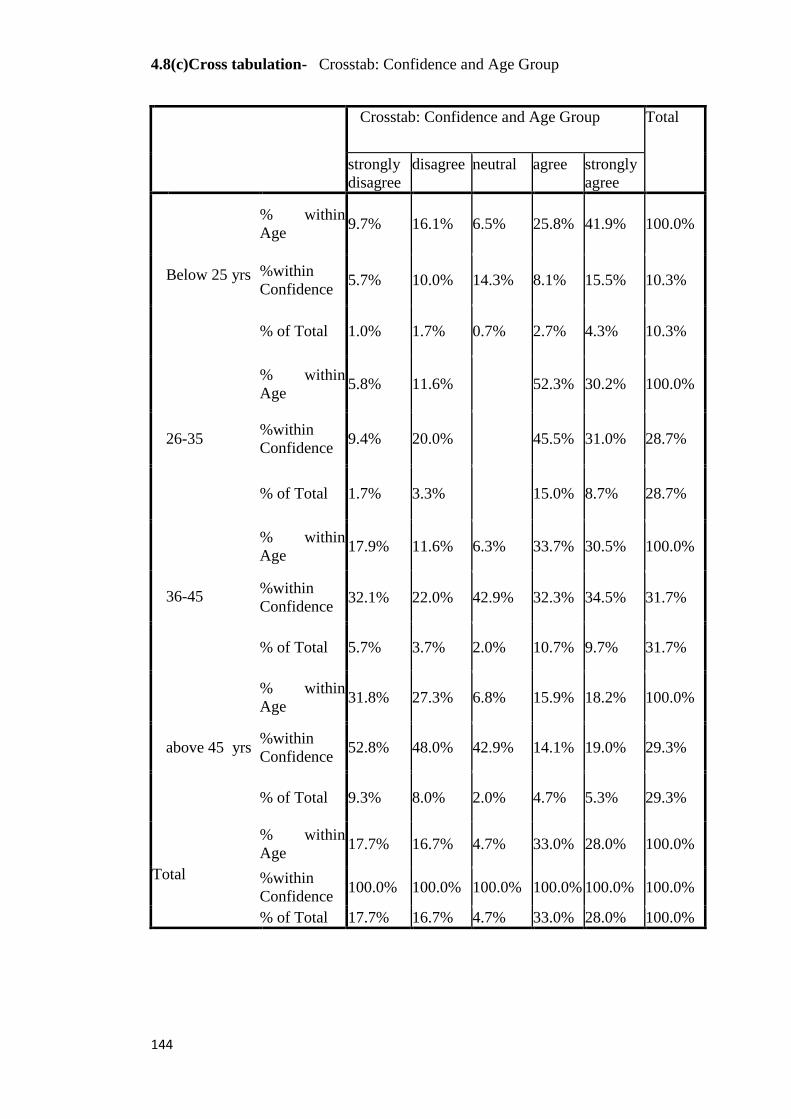
4.8(c)Cross tabulation- Crosstab: Confidence and Age Group
Crosstab: Confidence and Age Group Total
strongly
disagree
disagree neutral agree strongly
agree
Below 25 yrs
% within
Age 9.7% 16.1% 6.5% 25.8% 41.9% 100.0%
%within
Confidence 5.7% 10.0% 14.3% 8.1% 15.5% 10.3%
% of Total 1.0% 1.7% 0.7% 2.7% 4.3% 10.3%
26-35
% within
Age 5.8% 11.6%
52.3% 30.2% 100.0%
%within
Confidence 9.4% 20.0%
45.5% 31.0% 28.7%
% of Total 1.7% 3.3%
15.0% 8.7% 28.7%
36-45
% within
Age 17.9% 11.6% 6.3% 33.7% 30.5% 100.0%
%within
Confidence 32.1% 22.0% 42.9% 32.3% 34.5% 31.7%
% of Total 5.7% 3.7% 2.0% 10.7% 9.7% 31.7%
above 45 yrs
% within
Age 31.8% 27.3% 6.8% 15.9% 18.2% 100.0%
%within
Confidence 52.8% 48.0% 42.9% 14.1% 19.0% 29.3%
% of Total 9.3% 8.0% 2.0% 4.7% 5.3% 29.3%
Total
% within
Age 17.7% 16.7% 4.7% 33.0% 28.0% 100.0%
%within
Confidence 100.0% 100.0% 100.0% 100.0% 100.0% 100.0%
% of Total 17.7% 16.7% 4.7% 33.0% 28.0% 100.0%
145
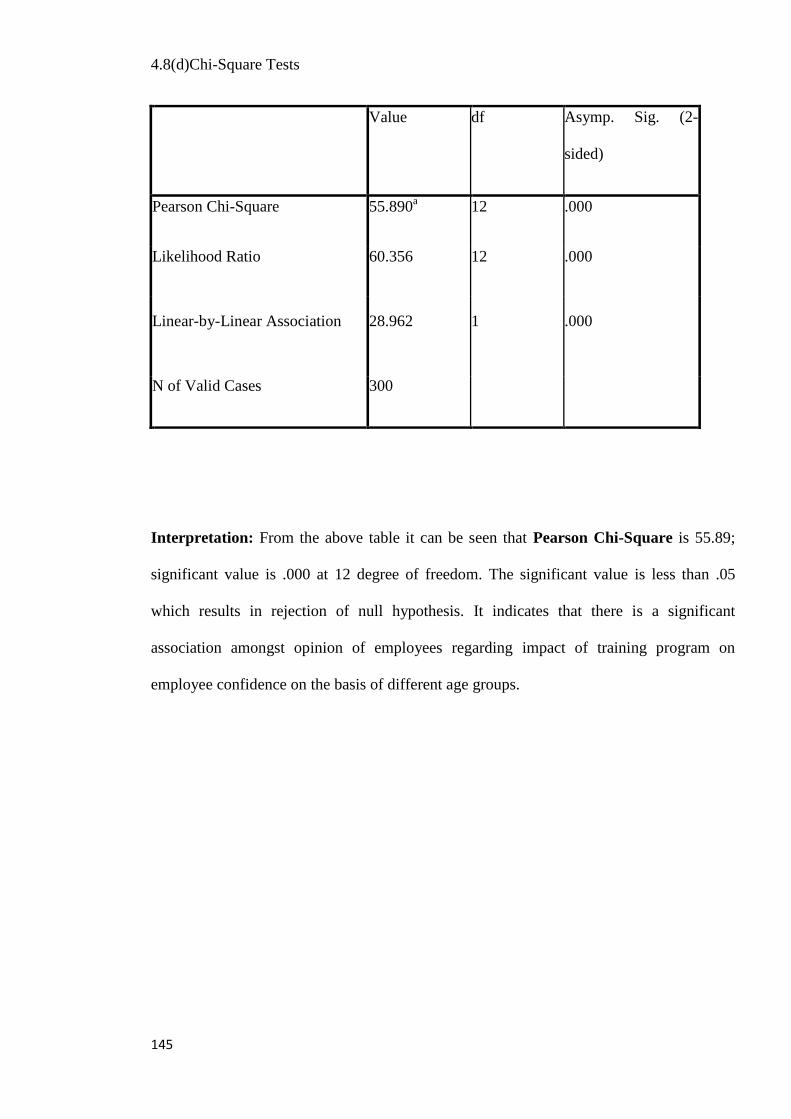
4.8(d)Chi-Square Tests
Value df Asymp. Sig. (2-
sided)
Pearson Chi-Square 55.890a 12 .000
Likelihood Ratio 60.356 12 .000
Linear-by-Linear Association 28.962 1 .000
N of Valid Cases 300
Interpretation: From the above table it can be seen that Pearson Chi-Square is 55.89;
significant value is .000 at 12 degree of freedom. The significant value is less than .05
which results in rejection of null hypothesis. It indicates that there is a significant
association amongst opinion of employees regarding impact of training program on
employee confidence on the basis of different age groups.