Embed Size (px)
Citation preview
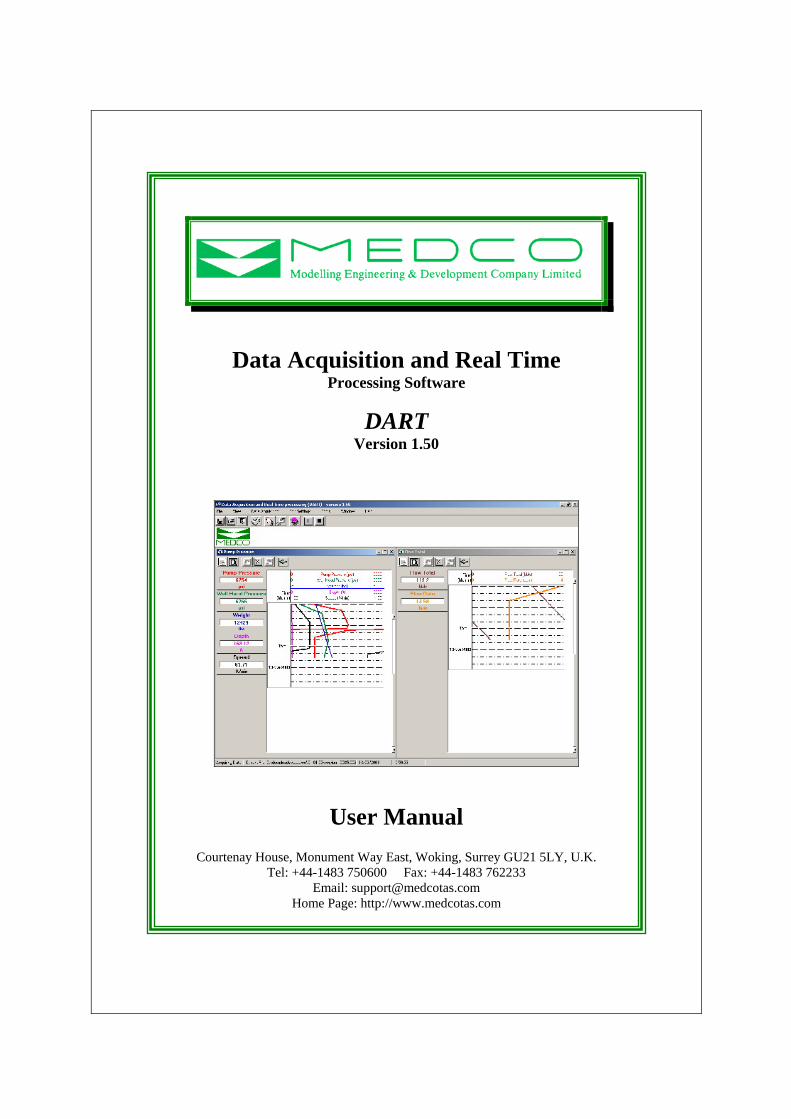
Data Acquisition and Real Time Processing Software
DART Version 1.50
User Manual
Courtenay House, Monument Way East, Woking, Surrey GU21 5LY, U.K. Tel: +44-1483 750600 Fax: +44-1483 762233
Email: [email protected] Home Page: http://www.medcotas.com
2
Data Acquisition and Real Time processing - D A R T_____________________________________3 Overview_______________________________________________________________________4 Quick Start_____________________________________________________________________5
Hardware Settings ______________________________________________________________5 Installation and Upgrades_________________________________________________________7 The DART Menu ________________________________________________________________8 The DART Menu ________________________________________________________________8
FILE_________________________________________________________________________9 VIEW_______________________________________________________________________10 DATA ACQUISITION/PLAYBACK______________________________________________11 EDIT SETTINGS _____________________________________________________________12 TOOLS _____________________________________________________________________15 WINDOW ___________________________________________________________________18 HELP_______________________________________________________________________19
Graph Tool Bar ________________________________________________________________20 Parameter’s Properties__________________________________________________________21
Prepare to Print Graph__________________________________________________________23 THE TOOL BAR _____________________________________________________________23
Version 1.54 New Features _________________________________________________________25
3
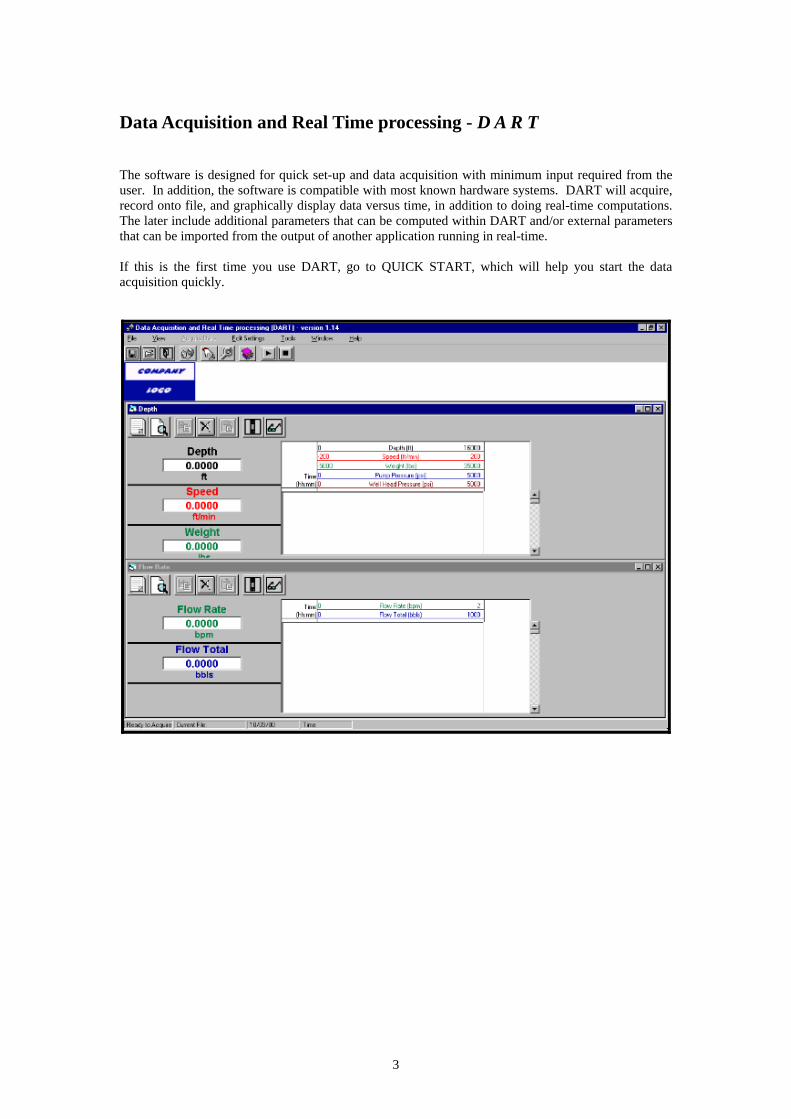
Data Acquisition and Real Time processing - D A R T The software is designed for quick set-up and data acquisition with minimum input required from the user. In addition, the software is compatible with most known hardware systems. DART will acquire, record onto file, and graphically display data versus time, in addition to doing real-time computations. The later include additional parameters that can be computed within DART and/or external parameters that can be imported from the output of another application running in real-time. If this is the first time you use DART, go to QUICK START, which will help you start the data acquisition quickly.
4
Overview DART is intended to be a generic data acquisition software with the added capability of real time processing. The features of the program are: • Acquisition of ASCII formatted data via serial port
This can include data being transmitted at regular intervals by the hardware or data transmitted upon request.
• Acquisition of data through use of specific hardware. • DART is capable of auto-detecting all the above hardware configurations. • Perform real time computations. To use this feature, DART has a facility to define some
computed parameters using the acquired raw data. • Up to 32 parameters can be graphically and numerically displayed. The figure 32 can be
increased in future depending on the computer hardware. • Scroll back and forth to view acquired and computed parameters. • Do playbacks of acquired and computed data. • Print graphs of any time interval of the acquired and computed data. • Communication with other applications is made easy. In real-time, DART outputs data to a
data base file which may be accessed by any other applications. The external application can perform real-time analysis of the data and again produce data base output files. DART can import the live data from the external application’s data base files.
• MEDCO has developed the first external application, which performs Fatigue Analysis for Coiled Tubing (FACT).
5
Quick Start
DART will record all changes made to the displays and settings. Thus on the first occasion you use DART you may need some time to setup the displays and define the hardware protocol. The next time you run DART you will not be required to repeat what you already defined in the previous run. There is a facility to clear all previous settings, though, it is not recommended that you use this unless you are certain that this will be the fastest way to re-write the settings.
The first time you run the program, you need to define some hardware settings that will enable you acquire data from your hardware. Alternatively, if you are using a hardware known to the DART program, then you can use the AUTO DETECT feature and DART will do most of the work for you. You will still have the flexibility of re-defining any of the settings.
Hardware Settings • Select EDIT SETTINGS from the main menu then select SERIAL PORT • You will find most of the settings already set to some default value, which may or may not be
applicable to your hardware. If you do not know what should be the setting then leave it as the default value. If data acquisition fails you will get an error message "Time Out", then you can come back and change the value.
• Enter the number of parameters • Enter the required sampling rate • Specify a "Sensitivity Criterion" that suits your application. The Sensitivity Criterion is used
to define peaks or troughs in the data, i.e. if the value of a parameter changes by more than x%, where x is the Sensitivity Criterion, then the data will be captured regardless of the sampling rate. Note, though, this is limited to the maximum speed at which data can be received.
• Specify a Time Out value as a multiple of the sampling rate. If, for some reason, your hardware is not responding or some problem has occurred that is preventing DART from acquiring the data, the duration of no data without giving a warning will be limited to this value.
• Specify the Serial Port Protocol. (see also DART MENU – EDIT SETTINGS). Depending on your hardware, select either of the following • If your hardware transmits data at regular intervals then select "formatted and at regular
intervals" for the "Data through serial port is ". - Close this window - On the next window specify the delimiter character and the terminator character.
• If your hardware requires a command to transmit data then select "sent when requested" for
the "Data through serial port is". Close the window and another window will appear with the number of parameters you entered. You will be required to supply the command strings to retrieve and reset (where applicable) data for each parameter.
Thus, after defining your hardware settings, you can start acquiring data immediately. Initially, each parameter will have the following • Name: will be "Parameter n" where n is the parameter number. • Units: will be assigned the text "Units". • Minimum and maximum scales will be 0 and 100 respectively. • Curve color will be black. • Number format will be "0.000". • No upper and lower alarms. • Up to 6 curves per graph (by default). Note that you can change this number to anything
between 1 and 8.
6
All the parameters’ properties can be changed in a table called "Parameters Table" which is accessible from EDIT SETTINGS. Simply overtype the contents of the table. When you click on the columns of color or format a pop-up window will automatically appear with the available choices. If you have one or more parameters that you do not wish to include but they will be transmitted by the hardware regardless, then you can clear the name of the parameter from the Parameters Table and DART will read this as BLANK. Any BLANKs are ignored in DART. You can also change any of the above on the graphs directly. Simply move the mouse to the setting you wish to change and click. For example, if you wish to change the maximum scale, then point the mouse at the maximum scale and click the mouse left button. You can also access all the parameter properties by right clicking on the name of parameter in the numeric display area outside the graph, i.e. on the left-hand-side of the graph window. From each graph that holds one curve, you will be able to "copy" then "paste" the curve to another graph. Once copied, the graph from which the curve was copied will automatically disappear. On each graph that holds more than one curve you can "remove" or "paste" one curve at a time. These facilities can be accessed from a toolbar on the graphs. (see also Graph Tool Bar). You can also add a definition of a computed parameter. To add a computed parameter, select TOOLS from the main menu then Define Computed Parameter. A list of your existing parameters will appear and by double clicking a parameter name it will be included in the formula in curly brackets "{ }". Your computed parameters will appear in the Parameters Table and can be edited in the same way as the acquired parameters. Remember that next time you run DART all the above settings will be remembered and you will not have to go through them again. Playback Settings No settings required for the playback of files recorded by DART. The data base files produced by DART will include a “Graph Settings” table which tells DART the settings used for the recording of the data. Thus, upon opening an existing data file, DART will show the list of the parameters that were recorded. You de-select any of these parameters if you do not wish to include it in the playback. After you close the window of the parameters to be played back, you can make changes to the graph settings, such as changing the color of the curves or the minimum/maximum curve scales in the same way as with the real-time graphs.
7
Installation and Upgrades The DART software can be downloaded from MEDCO’s web site at http://www.medcotas.com. Normally, there will be two options, one for a completely new installation and the second for an upgrade only. The upgrade option may only be used if you already have the latest version, prior to the upgrade, installed and operational. Installation Instructions
• All the files are self-extracting. When a file is opened, the user will be prompted to confirm the path to which the files will be extracted. By default, the files will be extracted to “C:\Medco Applications Setup Files\DART”. You can change the default path to any Path Name if so desired.
• Once the main file has been unzipped (i.e. files extracted), use Windows Explorer to open the folder to which the files were extracted (Path Name). (Go to START > RUN then type “Explorer” and click the OK button).
• Within the folder, there will be more self-extracting files that should be unzipped within the same folder and they will automatically unzip to “Path Name\disk1\” and “Path Name\disk2\” and so forth, depending on the number of disks associated with the setup program.
• After having unzipped all the sub-files, locate the program “setup.exe” within “Path Name\disk1\” and double-click to run.
• Follow the setup instructions. • IMPORTANT If you do not remove a previously installed version of DART, then you will get
a message warning you that SETUP is about to replace a pre-existing file, namely the HELP file, then you will get the option to Cancel Setup – you should reply NO – you will then get another message asking “Are you sure you want to continue?” to which you should reply YES. If you remove a previous installation then you will lose the settings. It is suggested that you do not remove a previous installation.
8
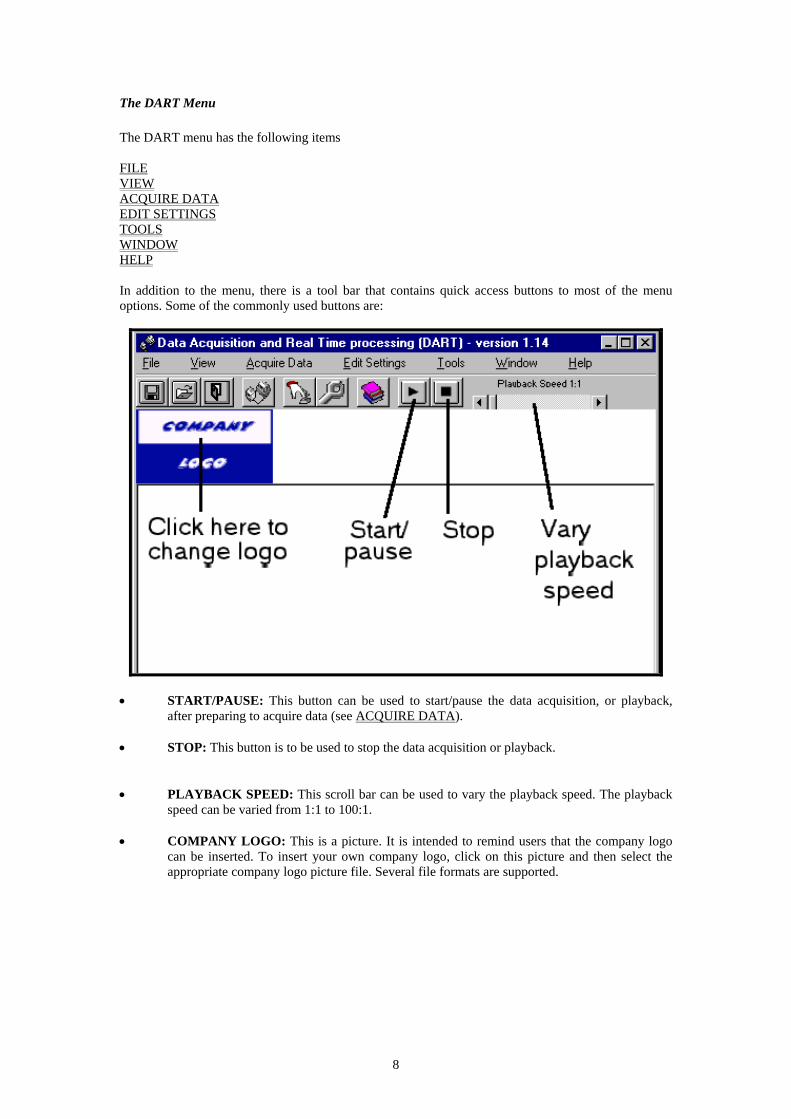
The DART Menu The DART menu has the following items FILE VIEW ACQUIRE DATA EDIT SETTINGS TOOLS WINDOW HELP In addition to the menu, there is a tool bar that contains quick access buttons to most of the menu options. Some of the commonly used buttons are:
• START/PAUSE: This button can be used to start/pause the data acquisition, or playback,
after preparing to acquire data (see ACQUIRE DATA). • STOP: This button is to be used to stop the data acquisition or playback. • PLAYBACK SPEED: This scroll bar can be used to vary the playback speed. The playback
speed can be varied from 1:1 to 100:1. • COMPANY LOGO: This is a picture. It is intended to remind users that the company logo
can be inserted. To insert your own company logo, click on this picture and then select the appropriate company logo picture file. Several file formats are supported.

9
FILE The FILE menu option has the following sub-items: • RECORD DATA TO: Use this command to name the data acquisition file. The file will be
automatically assigned an extension ".mdb" (Microsoft DataBase). If you specify a file name that already exists, the program will automatically detect the settings in the file. If the settings are exactly the same as the current run, then you will have the option of “Create New” or “Append to Existing”. “Create New” will create a new file with same name as the existing file adding “#n” where “n” is a number from 1 upwards. “Append to Existing” will simply continue storing data in the existing file. If the file settings are different to the current run, then “Create New” will be the only option available.
• PLAYBACK FILE: Use this command to open or playback existing data acquisition file. The
playback facility is not necessarily limited to files recorded or saved by DART. However, the files to open must still conform to some rules that DART will assume about the format. Any playback file must be compatible with “mdb” database format with at least two tables, “logData” and “GraphSettings”. “logData” must have a unique ID column, DATE column, and TIME column followed by the actual parameters’ columns. “GraphSettings” table should conform to the table format shown below. The Number of rows in the “GraphSettings” table must match the number of parameters columns in the “logData” table. Note also that the “CurveColor” column is a LONG integer.
• EXIT: Use this command to end the program execution. The program will prompt you to
confirm your intention of ending execution.
10
VIEW This menu option allows the user to view or hide the tool bar, the status bar, and the company logo. In addition, there is one sub-item in this menu option for viewing the actual data and editing the summary report. If the tool bar is visible then clicking on the VIEW - TOOL BAR will hide the tool bar and vice versa. Similarly for the other sub-items on this menu option. If the tool bar is not visible, then the START, PAUSE, and STOP buttons will not be accessible. Thus, when one of these buttons needs to be accessed, the user should make the tool bar visible then use the button. If the Company Logo is hidden, then the "Alarms Triggered" button will not be visible when an alarm is triggered. Thus, during the data acquisition, it is recommended to keep the company logo visible particularly if any of the alarms are set.
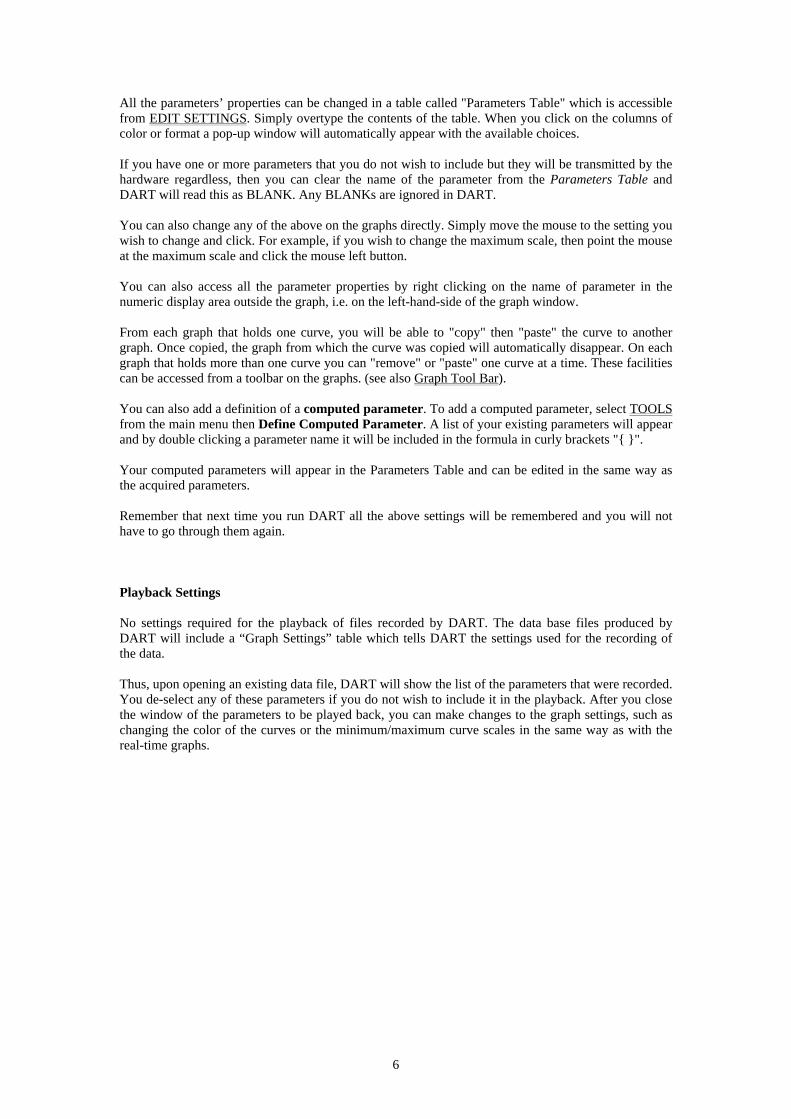
VIEW – Summary Report This menu option is only available after the data acquisition session has ended or in playback mode. You can use this option to view and print the “logData” table, or parts of, and to view, edit, and print the “Summary Report” table. If you wish to add a comment in the summary report at any particular time of the job, then simply go to the row in the “logData” that corresponds to the moment of time. You have two options for moving to the required time, either using the scroll bar, or by entering the DATE & TIME as shown below. Upon clicking the “Add Row to Summary Report” button a dialog box for entering the user comment will be displayed. Note that comments will be automatically sorted by DATE & TIME. To edit an existing comment, simply scroll to the “comments” column in the “Summary Report” and over-type the comment.
11
DATA ACQUISITION/PLAYBACK This menu option normally has the caption “Data Acquisition”. However, when a previously recorded file has been opened for playback, the caption will automatically change to “Playback”. Data Acquisition will prepare DART to acquire data. Before the actual acquisition is started, the user may edit the graphs, add parameters through the formula editor or through importing live data. The program will save any changes made at this stage. However, the user may save different settings for different acquisitions in separate templates that can be loaded before clicking Acquire Data. The menu options available here are:
CONNECT TO HARDWARE (not available during playback) START/PAUSE/RESUME STOP
The last two, and their corresponding toolbar buttons, will be disabled until the CONNECT TO HARDWARE is used. When you are ready to acquire data, click DATA ACQUISITION menu command followed by the option CONNECT TO HARDWARE and the graphs will immediately appear. The total number of curves will be the number of non-BLANK parameters, including any additional parameters included in graphs. The number of graphs will depend on how you set up the graphs the last time you used DART, or using the settings saved in a settings template. It is highly recommended that you have a minimum number of graphs. This way you will limit the system resources used by DART for display, and you will be able to display most of the curves/graphs simultaneously, if not all. When you are ready to start acquiring data, click the START option. If no file name has been specified for saving the data, then the program will prompt the user for specifying a file name when the START button is clicked. In playback mode, the START button will start the playback. Furthermore, a scroll bar titled “Playback Speed” will become available on the toolbar. The playback speed automatically assumes the speed that was last used during a previous playback, ranging from 1:1 to 100:1, where a speed of 100:1 is fastest. Once the START option has been clicked, the caption will automatically change and will become “PAUSE” while data is being acquired, and “RESUME” while pausing the acquisition. This menu option, will therefore, perform the functions stipulated by the caption. When you wish to close the database files and/or end the acquisition, use the menu option STOP.
12
EDIT SETTINGS This menu option has the following sub-items: • AUTO DETECT HARDWARE: This option can be used when the status of DART is Ready.
The auto detect option will basically try a few hardware configurations, those known to MEDCO. If unsuccessful, then the program will respond by "Unknown hardware" message. If successful then the program will respond by reporting the type of hardware detected. The user still has to write the parameter properties, thus the parameters table will automatically appear after the hardware has been detected. Note that if this option is used and reported successful hardware detection then there will be no need to define the serial port protocol in EDIT SETTINGS - SERIAL PORT. However, the user may still wish to access this to edit sampling rate, sensitivity criterion, and time out.
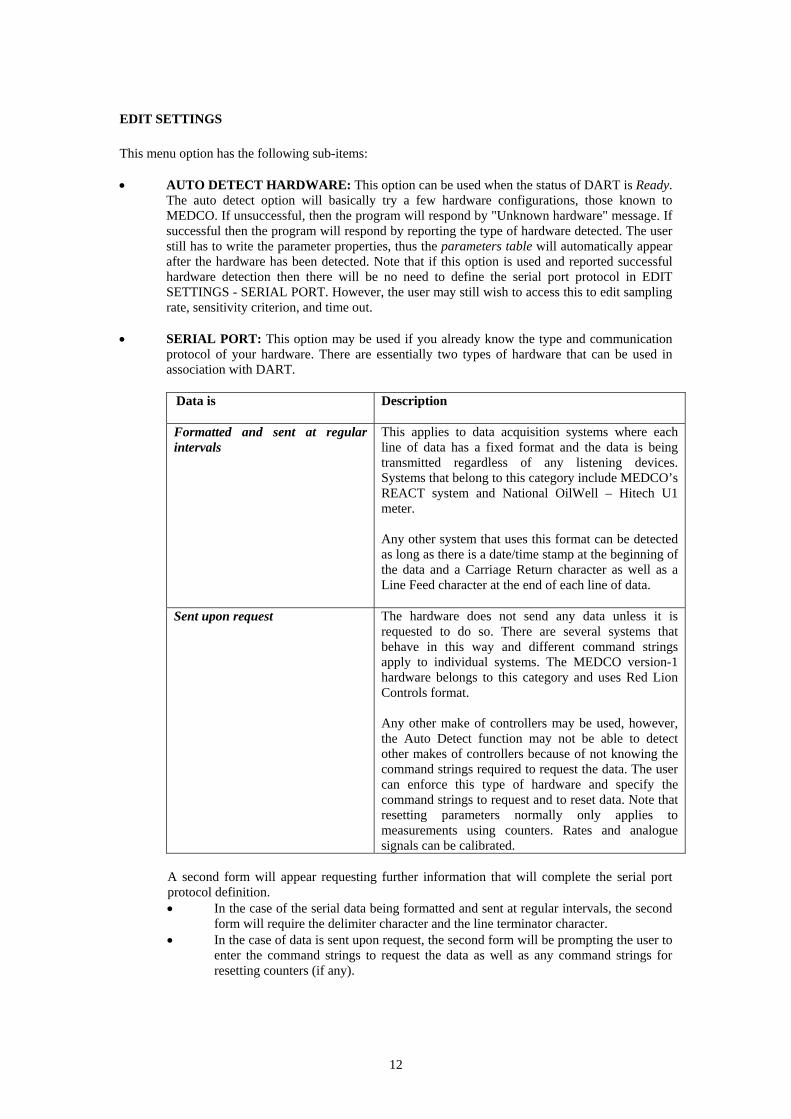
• SERIAL PORT: This option may be used if you already know the type and communication
protocol of your hardware. There are essentially two types of hardware that can be used in association with DART.
Data is Description
Formatted and sent at regular intervals
This applies to data acquisition systems where each line of data has a fixed format and the data is being transmitted regardless of any listening devices. Systems that belong to this category include MEDCO’s REACT system and National OilWell – Hitech U1 meter. Any other system that uses this format can be detected as long as there is a date/time stamp at the beginning of the data and a Carriage Return character as well as a Line Feed character at the end of each line of data.
Sent upon request The hardware does not send any data unless it is requested to do so. There are several systems that behave in this way and different command strings apply to individual systems. The MEDCO version-1 hardware belongs to this category and uses Red Lion Controls format. Any other make of controllers may be used, however, the Auto Detect function may not be able to detect other makes of controllers because of not knowing the command strings required to request the data. The user can enforce this type of hardware and specify the command strings to request and to reset data. Note that resetting parameters normally only applies to measurements using counters. Rates and analogue signals can be calibrated.
A second form will appear requesting further information that will complete the serial port protocol definition. • In the case of the serial data being formatted and sent at regular intervals, the second
form will require the delimiter character and the line terminator character. • In the case of data is sent upon request, the second form will be prompting the user to
enter the command strings to request the data as well as any command strings for resetting counters (if any).
13
• PARAMETERS TABLE: This option can be used for both data acquisition and playback. A list of all the parameters will appear and the user can change any of the properties by direct entry into the grid.
• SAVE/LOAD/DELETE SETTINGS TEMPLATE: The settings can be saved in a template with any name of the user’s choice. This template can be re-loaded and will over-write the existing settings. The templates are useful when several settings are used for different hardware or data acquisition setup. The user need only create the settings once and save them in templates, thus negating the need for repetition.
• CLEAR SETTINGS: Use this option to clear the program settings. The settings are stored in the WINDOWS registry and this option can be used to clear them and start new settings.
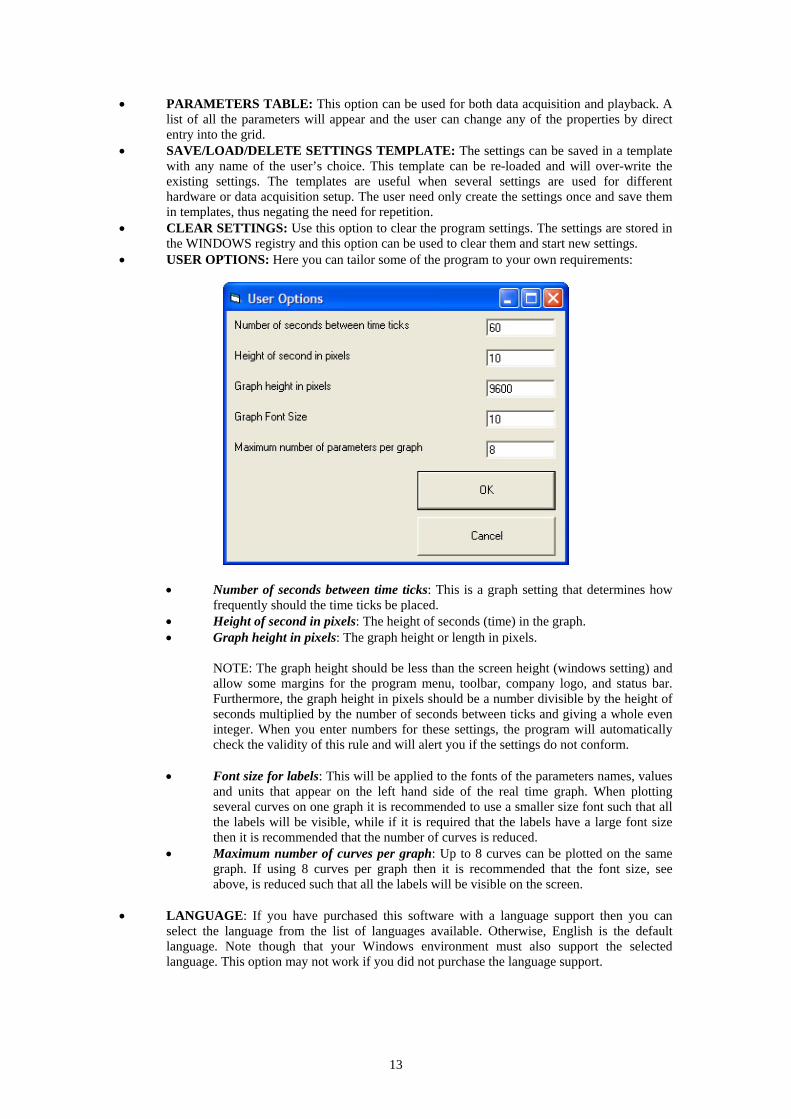
• USER OPTIONS: Here you can tailor some of the program to your own requirements:
• Number of seconds between time ticks: This is a graph setting that determines how frequently should the time ticks be placed.
• Height of second in pixels: The height of seconds (time) in the graph. • Graph height in pixels: The graph height or length in pixels.
NOTE: The graph height should be less than the screen height (windows setting) and allow some margins for the program menu, toolbar, company logo, and status bar. Furthermore, the graph height in pixels should be a number divisible by the height of seconds multiplied by the number of seconds between ticks and giving a whole even integer. When you enter numbers for these settings, the program will automatically check the validity of this rule and will alert you if the settings do not conform.
• Font size for labels: This will be applied to the fonts of the parameters names, values and units that appear on the left hand side of the real time graph. When plotting several curves on one graph it is recommended to use a smaller size font such that all the labels will be visible, while if it is required that the labels have a large font size then it is recommended that the number of curves is reduced.
• Maximum number of curves per graph: Up to 8 curves can be plotted on the same graph. If using 8 curves per graph then it is recommended that the font size, see above, is reduced such that all the labels will be visible on the screen.
• LANGUAGE: If you have purchased this software with a language support then you can
select the language from the list of languages available. Otherwise, English is the default language. Note though that your Windows environment must also support the selected language. This option may not work if you did not purchase the language support.

14
15
TOOLS This menu option gives the user additional tools to enhance the program performance. These include defining additional parameters, other than those acquired through hardware. The additional parameters can be computed within DART and the formula definition can be written in DART too. Alternatively, additional parameters can be computed outside DART by an external application. The later technique uses Data Base files to write to and read from. Other features here include parameter calibration and resetting.
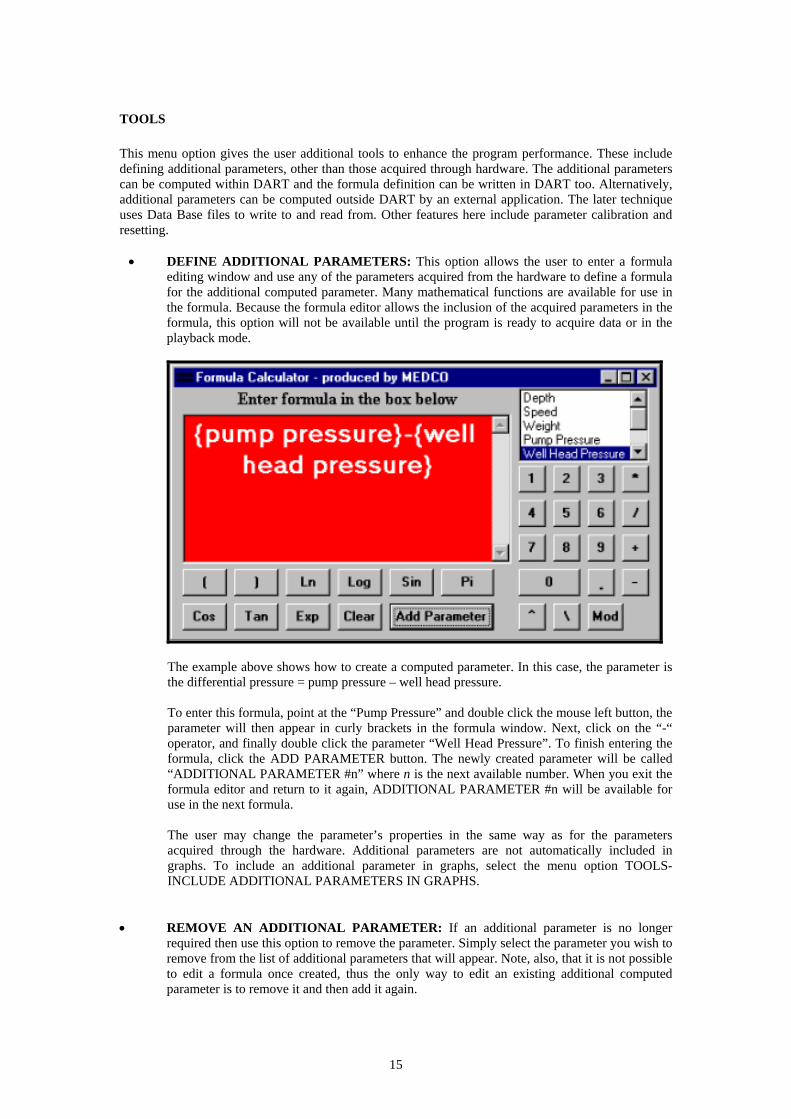
• DEFINE ADDITIONAL PARAMETERS: This option allows the user to enter a formula editing window and use any of the parameters acquired from the hardware to define a formula for the additional computed parameter. Many mathematical functions are available for use in the formula. Because the formula editor allows the inclusion of the acquired parameters in the formula, this option will not be available until the program is ready to acquire data or in the playback mode.
The example above shows how to create a computed parameter. In this case, the parameter is the differential pressure = pump pressure – well head pressure. To enter this formula, point at the “Pump Pressure” and double click the mouse left button, the parameter will then appear in curly brackets in the formula window. Next, click on the “-“ operator, and finally double click the parameter “Well Head Pressure”. To finish entering the formula, click the ADD PARAMETER button. The newly created parameter will be called “ADDITIONAL PARAMETER #n” where n is the next available number. When you exit the formula editor and return to it again, ADDITIONAL PARAMETER #n will be available for use in the next formula. The user may change the parameter’s properties in the same way as for the parameters acquired through the hardware. Additional parameters are not automatically included in graphs. To include an additional parameter in graphs, select the menu option TOOLS-INCLUDE ADDITIONAL PARAMETERS IN GRAPHS.
• REMOVE AN ADDITIONAL PARAMETER: If an additional parameter is no longer
required then use this option to remove the parameter. Simply select the parameter you wish to remove from the list of additional parameters that will appear. Note, also, that it is not possible to edit a formula once created, thus the only way to edit an existing additional computed parameter is to remove it and then add it again.
16
• INCLUDE ADDITIONAL PARAMETERS IN GRAPHS: As mentioned earlier, additional parameters are not automatically included in graphs, thus to add an additional parameter in the graphs use this option. Once an additional parameter is added to graphs, it will appear in a graph of it’s own. Use the copy and paste commands of the graphs to move the additional parameter to another existing graph.
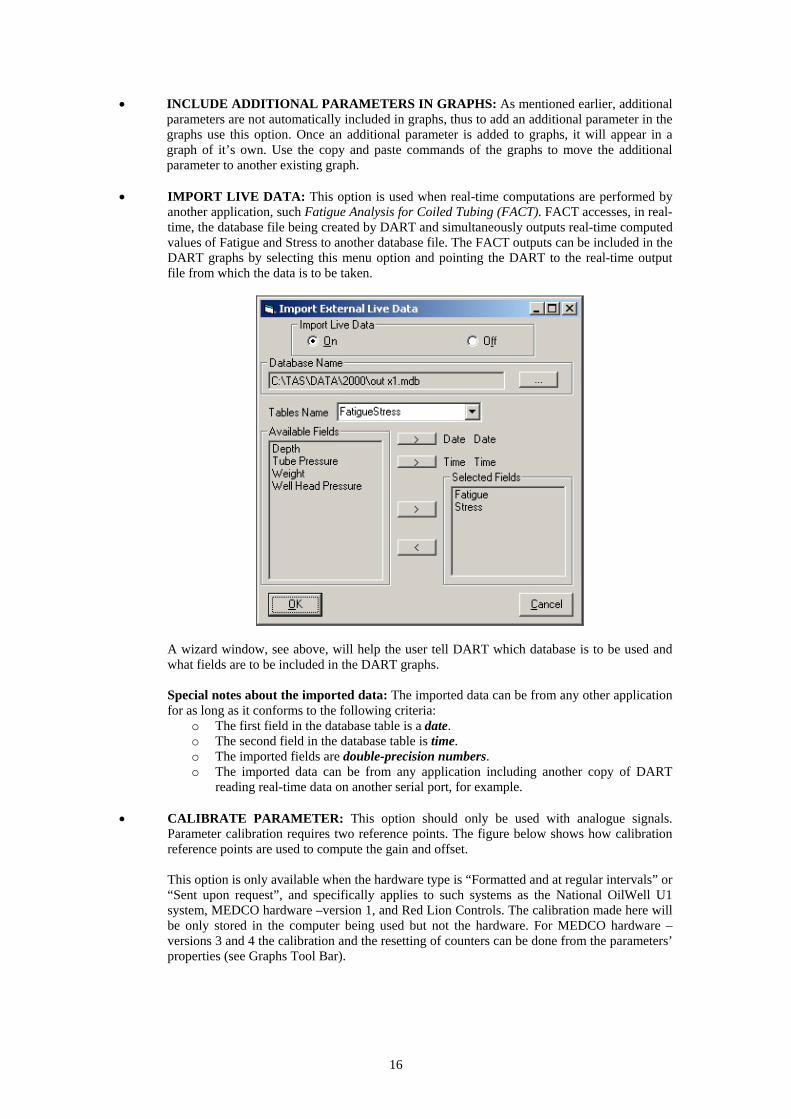
• IMPORT LIVE DATA: This option is used when real-time computations are performed by
another application, such Fatigue Analysis for Coiled Tubing (FACT). FACT accesses, in real-time, the database file being created by DART and simultaneously outputs real-time computed values of Fatigue and Stress to another database file. The FACT outputs can be included in the DART graphs by selecting this menu option and pointing the DART to the real-time output file from which the data is to be taken.
A wizard window, see above, will help the user tell DART which database is to be used and what fields are to be included in the DART graphs. Special notes about the imported data: The imported data can be from any other application for as long as it conforms to the following criteria:
o The first field in the database table is a date. o The second field in the database table is time. o The imported fields are double-precision numbers. o The imported data can be from any application including another copy of DART
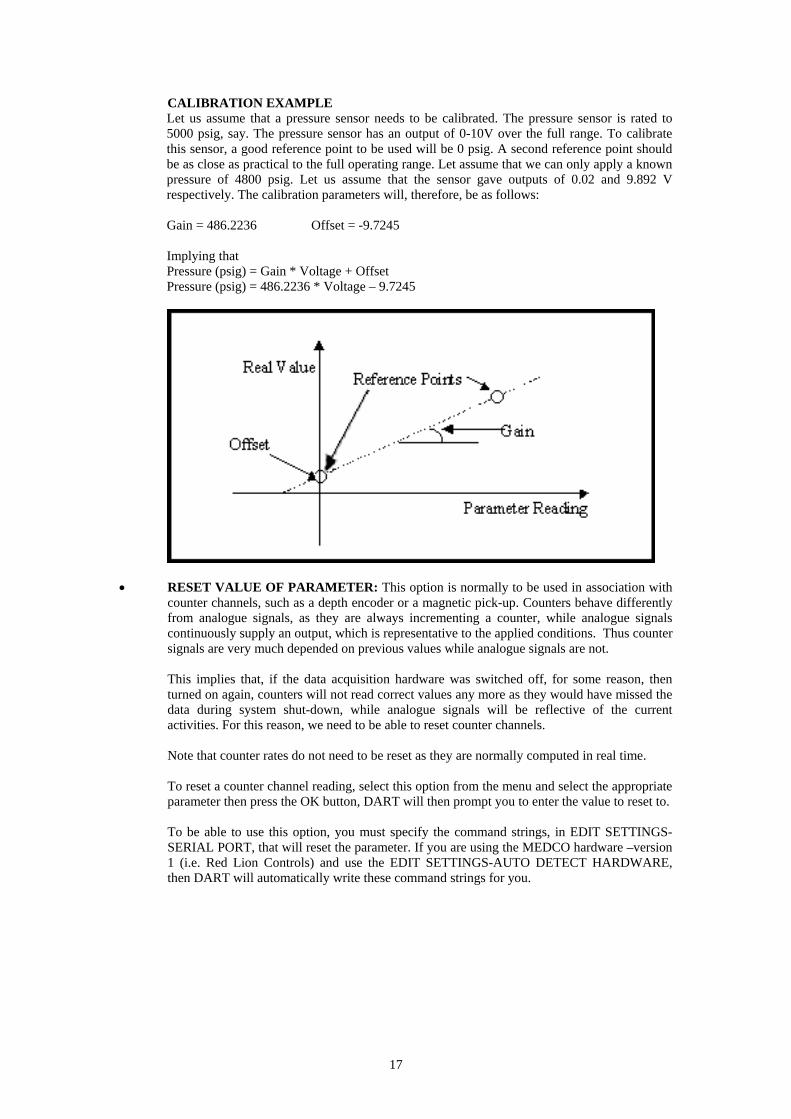
reading real-time data on another serial port, for example. • CALIBRATE PARAMETER: This option should only be used with analogue signals.
Parameter calibration requires two reference points. The figure below shows how calibration reference points are used to compute the gain and offset. This option is only available when the hardware type is “Formatted and at regular intervals” or “Sent upon request”, and specifically applies to such systems as the National OilWell U1 system, MEDCO hardware –version 1, and Red Lion Controls. The calibration made here will be only stored in the computer being used but not the hardware. For MEDCO hardware – versions 3 and 4 the calibration and the resetting of counters can be done from the parameters’ properties (see Graphs Tool Bar).
17
CALIBRATION EXAMPLE Let us assume that a pressure sensor needs to be calibrated. The pressure sensor is rated to 5000 psig, say. The pressure sensor has an output of 0-10V over the full range. To calibrate this sensor, a good reference point to be used will be 0 psig. A second reference point should be as close as practical to the full operating range. Let assume that we can only apply a known pressure of 4800 psig. Let us assume that the sensor gave outputs of 0.02 and 9.892 V respectively. The calibration parameters will, therefore, be as follows: Gain = 486.2236 Offset = -9.7245 Implying that Pressure (psig) = Gain * Voltage + Offset Pressure (psig) = 486.2236 * Voltage – 9.7245
• RESET VALUE OF PARAMETER: This option is normally to be used in association with
counter channels, such as a depth encoder or a magnetic pick-up. Counters behave differently from analogue signals, as they are always incrementing a counter, while analogue signals continuously supply an output, which is representative to the applied conditions. Thus counter signals are very much depended on previous values while analogue signals are not.
This implies that, if the data acquisition hardware was switched off, for some reason, then turned on again, counters will not read correct values any more as they would have missed the data during system shut-down, while analogue signals will be reflective of the current activities. For this reason, we need to be able to reset counter channels. Note that counter rates do not need to be reset as they are normally computed in real time. To reset a counter channel reading, select this option from the menu and select the appropriate parameter then press the OK button, DART will then prompt you to enter the value to reset to. To be able to use this option, you must specify the command strings, in EDIT SETTINGS-SERIAL PORT, that will reset the parameter. If you are using the MEDCO hardware –version 1 (i.e. Red Lion Controls) and use the EDIT SETTINGS-AUTO DETECT HARDWARE, then DART will automatically write these command strings for you.

18
WINDOW The WINDOW menu option gives the user access to such features as CASCADE, TILE HORIZONTALLY, TILE VERTICALLY, ARRANGE ICONS, and a WINDOW LIST. • CASCADE: Rearranges graph windows in your project so they overlap in a cascade. • TILE HORIZONTALLY: Tiles the graph windows horizontally when several graphs are
visible. • TILE VERTICALLY: Tiles the graph windows vertically when several graphs are visible. • ARRANGE ICONS: Arranges the icons of the windows you have minimized, neatly at the
bottom left of the window. • WINDOW LIST: Lists all open graphs using the name of the first curve in each graph as a
window title.

19
HELP • DART HELP CONTENTS: Gives the user access to this help file. • ABOUT DART: States the current version number and the copyright.
20
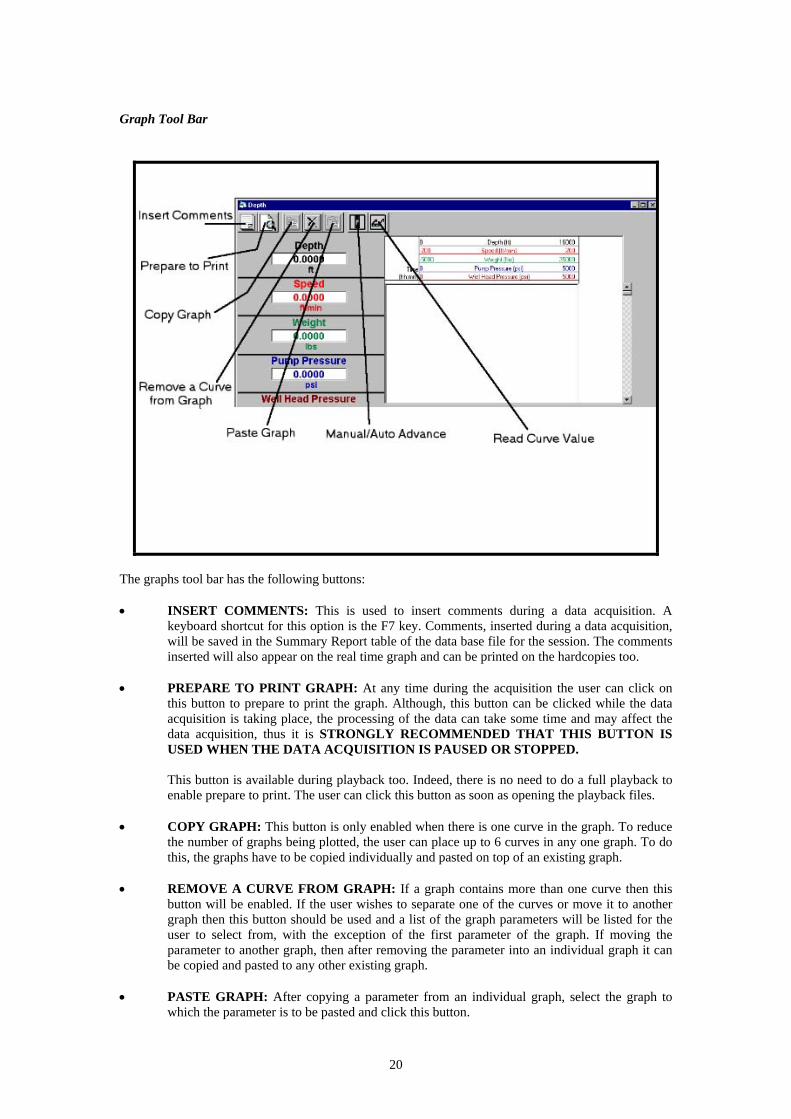
Graph Tool Bar
The graphs tool bar has the following buttons: • INSERT COMMENTS: This is used to insert comments during a data acquisition. A
keyboard shortcut for this option is the F7 key. Comments, inserted during a data acquisition, will be saved in the Summary Report table of the data base file for the session. The comments inserted will also appear on the real time graph and can be printed on the hardcopies too.
• PREPARE TO PRINT GRAPH: At any time during the acquisition the user can click on
this button to prepare to print the graph. Although, this button can be clicked while the data acquisition is taking place, the processing of the data can take some time and may affect the data acquisition, thus it is STRONGLY RECOMMENDED THAT THIS BUTTON IS USED WHEN THE DATA ACQUISITION IS PAUSED OR STOPPED.
This button is available during playback too. Indeed, there is no need to do a full playback to enable prepare to print. The user can click this button as soon as opening the playback files.
• COPY GRAPH: This button is only enabled when there is one curve in the graph. To reduce the number of graphs being plotted, the user can place up to 6 curves in any one graph. To do this, the graphs have to be copied individually and pasted on top of an existing graph.
• REMOVE A CURVE FROM GRAPH: If a graph contains more than one curve then this
button will be enabled. If the user wishes to separate one of the curves or move it to another graph then this button should be used and a list of the graph parameters will be listed for the user to select from, with the exception of the first parameter of the graph. If moving the parameter to another graph, then after removing the parameter into an individual graph it can be copied and pasted to any other existing graph.
• PASTE GRAPH: After copying a parameter from an individual graph, select the graph to
which the parameter is to be pasted and click this button.
21
• READ CURVE VALUE: This button enables the user to read the value of any of the
parameters on the graph at any time. When this button is clicked, a list of the graph parameters will appear and the user should select the wanted parameter. By moving the mouse over the graph area the values of the parameter will appear. To change to another parameter value, simply click this button again and select the appropriate parameter.
Parameter’s Properties
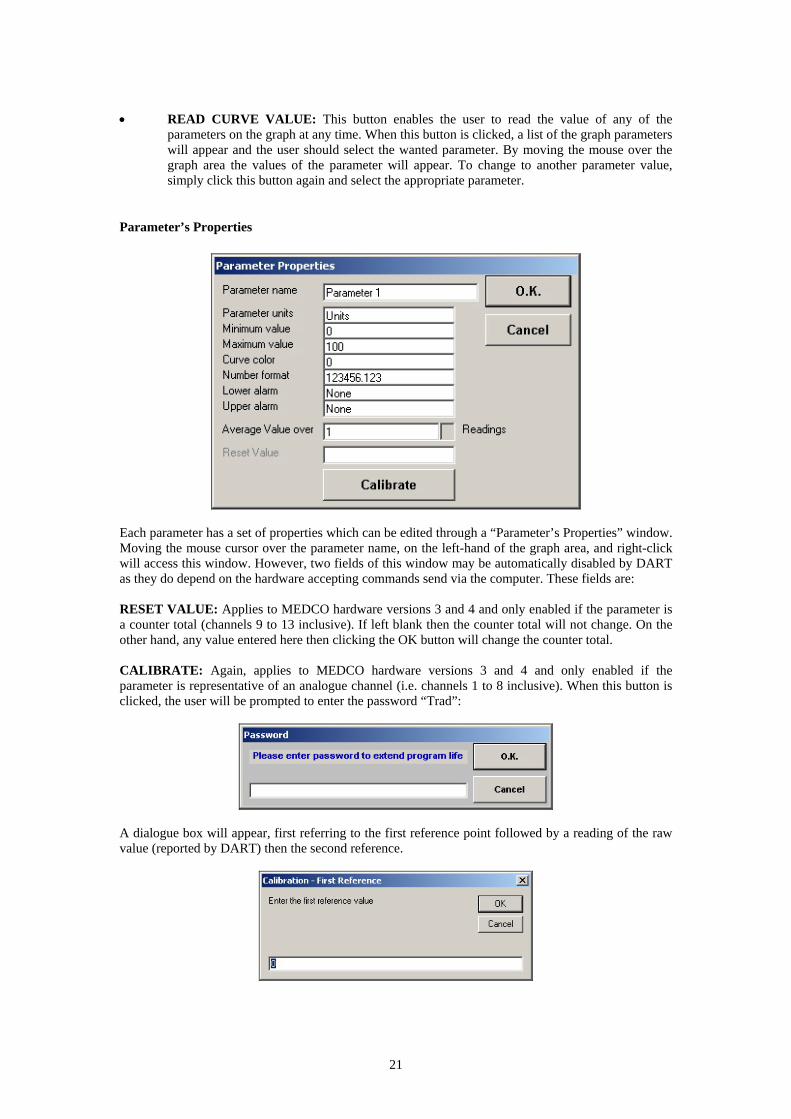
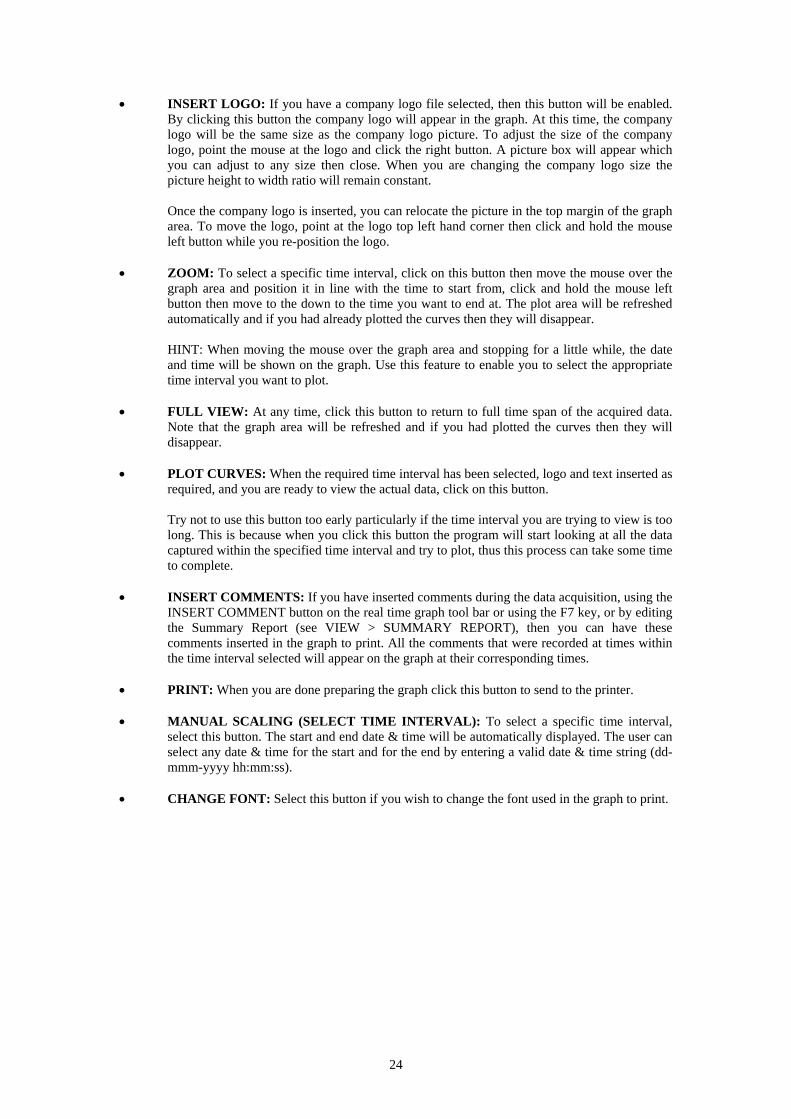
Each parameter has a set of properties which can be edited through a “Parameter’s Properties” window. Moving the mouse cursor over the parameter name, on the left-hand of the graph area, and right-click will access this window. However, two fields of this window may be automatically disabled by DART as they do depend on the hardware accepting commands send via the computer. These fields are: RESET VALUE: Applies to MEDCO hardware versions 3 and 4 and only enabled if the parameter is a counter total (channels 9 to 13 inclusive). If left blank then the counter total will not change. On the other hand, any value entered here then clicking the OK button will change the counter total. CALIBRATE: Again, applies to MEDCO hardware versions 3 and 4 and only enabled if the parameter is representative of an analogue channel (i.e. channels 1 to 8 inclusive). When this button is clicked, the user will be prompted to enter the password “Trad”:
A dialogue box will appear, first referring to the first reference point followed by a reading of the raw value (reported by DART) then the second reference.
22
Finally, DART will compute the GAIN and OFFSET values for the parameter. But before committing these values to the hardware, they will be reported to the user who can accept or decline. In addition, various parameters’ properties can be accessed and changed within the graph window. The following properties can be changed in the area to the left hand side of the graph. • Parameter Name: Move the mouse over the parameter name and click the mouse left button. • Parameter Number Format: Move the mouse over the box showing the parameter value and
click the mouse left button. A list of the valid formats will appear. Select the required format. • Parameter Units: Move the mouse over the parameter units and click the mouse left button. The following properties can be changed in the area at the top of the graph showing the curve scales. • Minimum Value: Move the mouse over the to the left side of the line showing the curve
scales and click the left button. • Maximum Value: Move the mouse over the to the right side of the line showing the curve
scales and click the left button. • Curve Color: Move the mouse over the to the centre of the line showing the curve scales and
click the left button. All the above properties as well as setting upper and lower alarms can be accessed in one window per parameter by moving the mouse anywhere in the area containing the parameter name, value, and units and clicking the right button. If during the acquisition or playback the value of the parameter is less than the minimum value or greater than the maximum value then the curve will be wrapped. A wrapped curve will appear from the other end of the scales and the line will be thicker.
23
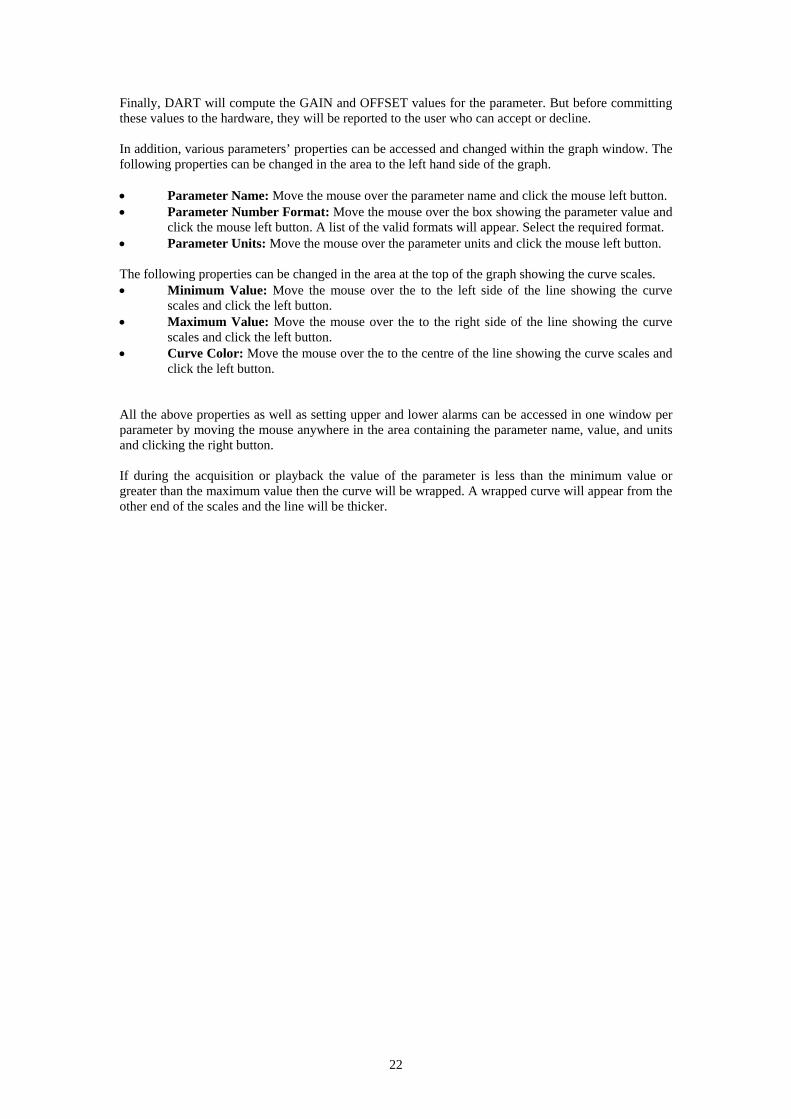
Prepare to Print Graph Data acquisition is normally associated with activities taking place over a long time. This fact makes printing the data a tedious and time consuming task. Do you print all the data or just print part of it? If you do print all the data then you can expect the printing job to take a long time too, even with the most powerful computers. For this reason, DART allows the user to make the necessary decisions before initiating a print job, thus reducing the waiting time for the user. This facility is provided through the “Prepare to Print Graph”. Here, the user has the choice of first selecting the time interval, inserting company logo, inserting some text (to describe the acquisition job), inserting the comments that were recorded during the job, and change the fonts used for printing. After satisfactory preparation of the graph, the print button can be used to send the graph to an on-line printer.
THE TOOL BAR • INSERT TEXT: If you wish to add some additional text or comments, then click this button.
A text box will appear at the top left hand corner of the graph. The size of the text cannot be adjusted, but it’s position can be adjusted in exactly the same way as the logo (see INSERT LOGO below). To enter text, click on the text box and start typing. The text box will be enlarged to allow you to see what text is being typed.
24
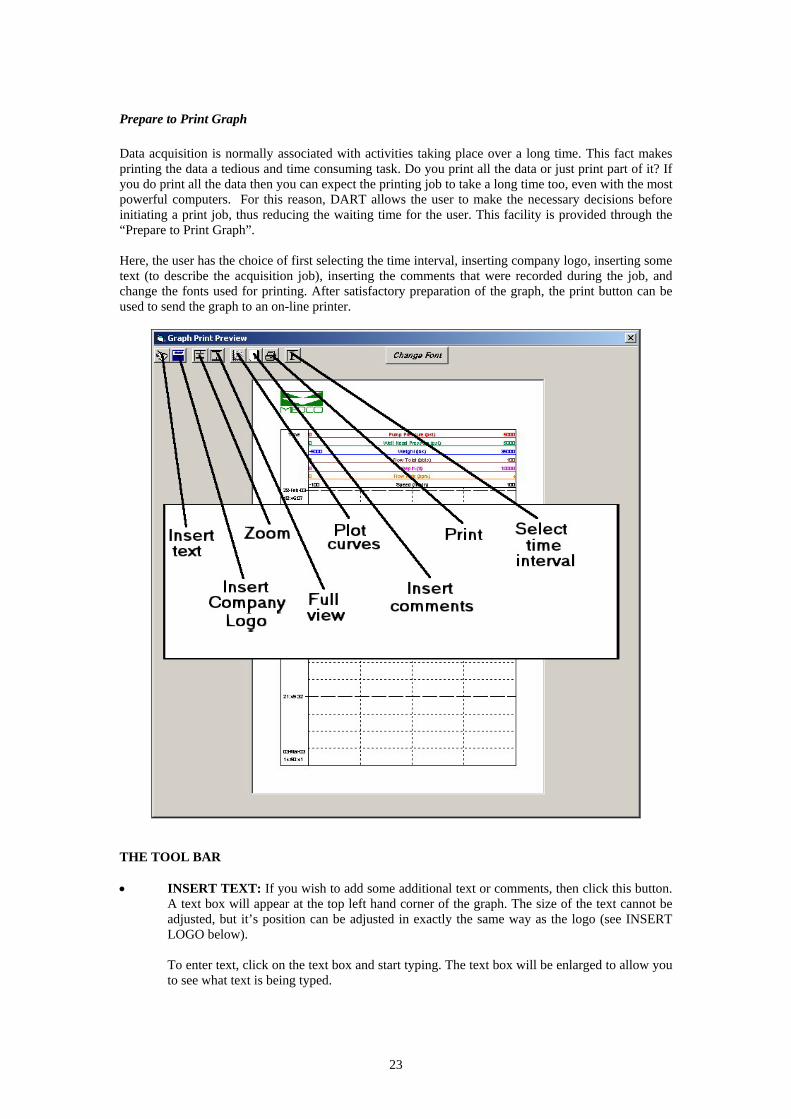
• INSERT LOGO: If you have a company logo file selected, then this button will be enabled. By clicking this button the company logo will appear in the graph. At this time, the company logo will be the same size as the company logo picture. To adjust the size of the company logo, point the mouse at the logo and click the right button. A picture box will appear which you can adjust to any size then close. When you are changing the company logo size the picture height to width ratio will remain constant. Once the company logo is inserted, you can relocate the picture in the top margin of the graph area. To move the logo, point at the logo top left hand corner then click and hold the mouse left button while you re-position the logo.
• ZOOM: To select a specific time interval, click on this button then move the mouse over the graph area and position it in line with the time to start from, click and hold the mouse left button then move to the down to the time you want to end at. The plot area will be refreshed automatically and if you had already plotted the curves then they will disappear.
HINT: When moving the mouse over the graph area and stopping for a little while, the date and time will be shown on the graph. Use this feature to enable you to select the appropriate time interval you want to plot.
• FULL VIEW: At any time, click this button to return to full time span of the acquired data. Note that the graph area will be refreshed and if you had plotted the curves then they will disappear.
• PLOT CURVES: When the required time interval has been selected, logo and text inserted as
required, and you are ready to view the actual data, click on this button.
Try not to use this button too early particularly if the time interval you are trying to view is too long. This is because when you click this button the program will start looking at all the data captured within the specified time interval and try to plot, thus this process can take some time to complete.
• INSERT COMMENTS: If you have inserted comments during the data acquisition, using the INSERT COMMENT button on the real time graph tool bar or using the F7 key, or by editing the Summary Report (see VIEW > SUMMARY REPORT), then you can have these comments inserted in the graph to print. All the comments that were recorded at times within the time interval selected will appear on the graph at their corresponding times.
• PRINT: When you are done preparing the graph click this button to send to the printer. • MANUAL SCALING (SELECT TIME INTERVAL): To select a specific time interval,
select this button. The start and end date & time will be automatically displayed. The user can select any date & time for the start and for the end by entering a valid date & time string (dd-mmm-yyyy hh:mm:ss).
• CHANGE FONT: Select this button if you wish to change the font used in the graph to print.
25
Version 1.54 New Features Some new features have been added to the software since this manual was created. These are detailed below:
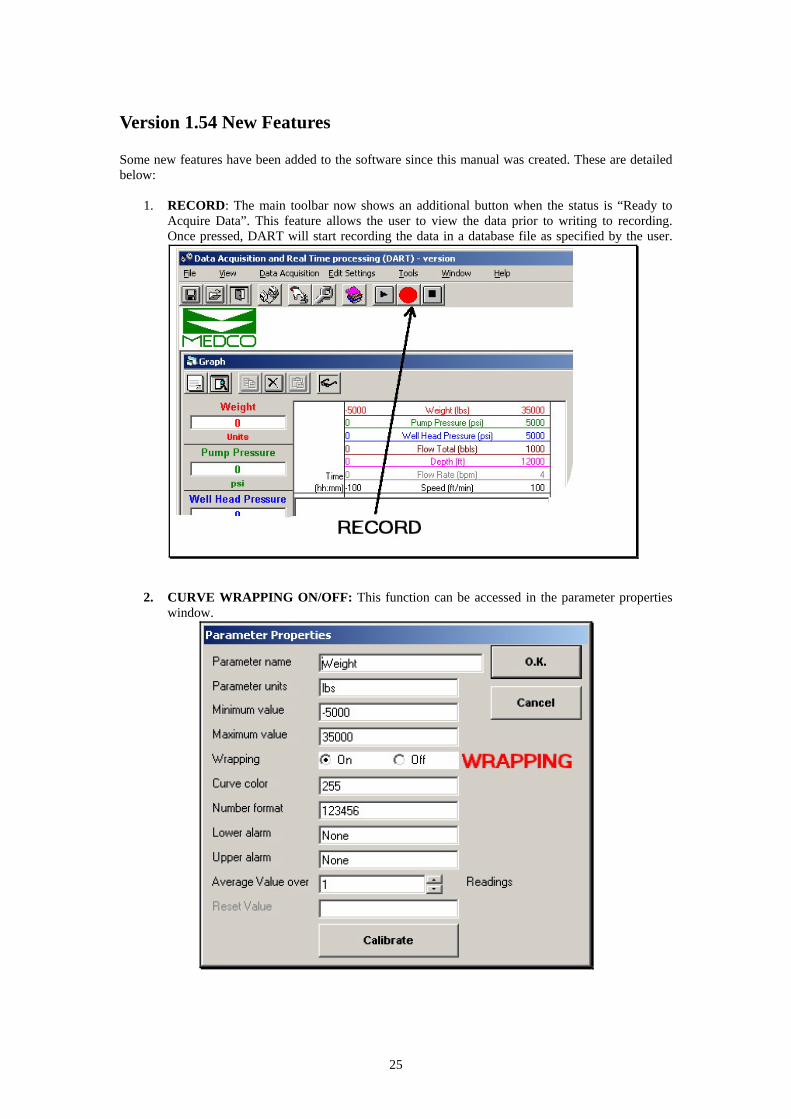
1. RECORD: The main toolbar now shows an additional button when the status is “Ready to Acquire Data”. This feature allows the user to view the data prior to writing to recording. Once pressed, DART will start recording the data in a database file as specified by the user.
2. CURVE WRAPPING ON/OFF: This function can be accessed in the parameter properties window.


![A software framework for real-time multi-modal detection ... · requirement for real-time processing. BiosignalsStudio [12] is a software framework for real-time acquisition and processing](https://img.pdfslide.us/doc/110x75/5f648da6b75a69707a1a25b2/a-software-framework-for-real-time-multi-modal-detection-requirement-for-real-time.jpg)