Embed Size (px)
Citation preview

4CeeD: Real-Time Data Acquisition and Analysis Framework for Material-relatedCyber-Physical Environments
Phuong Nguyen, Steven Konstanty, Todd Nicholson, Thomas O’brien, Aaron Schwartz-Duval, Timothy Spila,Klara Nahrstedt, Roy H. Campbell, Indranil Gupta, Michael Chan, Kenton McHenry, Normand Paquin
University of Illinois at Urbana-Champaign{pvnguye2,stevek,tcnichol,tobrien3,asschwa2,tspila,klara,rhc,indy,mgc,mchenry,paquin}@illinois.edu
Abstract—In this paper, we propose a data acquisition andanalysis framework for materials-to-devices processes, named4CeeD, that focuses on the immense potential of capturing,accurately curating, correlating, and coordinating materials-to-devices digital data in a real-time and trusted mannerbefore fully archiving and publishing them for wide access andsharing. In particular, 4CeeD consists of: (i) a curation servicefor collecting data from experimental instruments, curating,and wrapping of data with extensive metadata in real-timeand in a trusted manner, (ii) a cloudlet for caching collecteddata from curation service and coordinating data transferwith the back-end, and (iii) a cloud-based coordination servicefor storing data, extracting meta-data, analyzing and findingcorrelations among the data. Our evaluation results show thatour proposed approach is able to help researchers significantlysave time and cost spent on experiments, and is efficientin dealing with high-volume and fast-changing workload ofheterogeneous types of experimental data.
I. INTRODUCTION
Studies suggest that it typically takes 20 years to gofrom the discovery of new materials to fabrication of newand next-generation devices based on the new materials [1].This cycle must be shortened, and it will require a majortransformation in how we collect digital data about materialsand how we make the digital data available to computationaltools for developing new materials and fabricating newdevices and to the research community as a whole.
However, the development of computational tools formaterials engineering has lagged behind the developmentof such tools in other engineering fields because of thecomplexity and sheer variety of materials and physicalphenomena that must be captured [2][3]. In particular, thecurrent state of data capture and storage in materials andsemiconductor domains often involves a lot of manualprocesses that leads to poor documentation of results. Forexample, data transfer between research lab and office isoften done via “sneaker-net” techniques using flash-drivesor email. During such process, no data file conversion isavailable, which hinders researchers from previewing theresults early and making timely decision during lab sessions.In addition, it is common that only “best” results andimages are kept for publishing, although what is “best”is determined by a narrow, specific scientific objective.
“Imperfect” data and/or data of secondary importance tothe researchers recording the data, perhaps containing vitalinformation that could accelerate the use of a new materialfor a device application, may simply never be captured (oronly be logged manually in an unsearchable way) for fellowresearchers to leverage or for a device engineer to search for.As a result, other researchers may end up repeating the verysample experiments over and over to retrieve these results.
While other related efforts, such as NanoHub [6], SEAD[8], or DataUp [12], have been focusing on making exist-ing datasets more accessible and shareable, our focus andapproach in this paper shifts to the immense potential ofcapturing, accurately curating, correlating, and coordinatingmaterials-to-devices digital data in a real-time and trustedmanner before fully archiving and publishing them forwide access and sharing. In particular, we develop a dataacquisition and analysis framework for materials-to-devicesprocesses, named 4CeeD. To the best of our knowledge,we are the first to build such a framework in the space ofmaterials science and device fabrication to cut the time andcost of the materials-to-devices processes.
In this paper, we present the overview of our proposedmulti-tier 4CeeD framework, and the design and imple-mentation of its main components. Specifically, at the usertier, the 4CeeD’s curation service will perform nimble andadaptive data collection from experimental instruments, datacuration, and wrapping of data with extensive metadatain real-time and in a trusted manner. At the intermediatetier, cloudlet can cache the data from curation service,and coordinate data transfer with the cloud-based back-endsystem. At the cloud tier, the 4CeeD’s coordination servicewill filter data, perform extraction of meta-data, analyzeand find correlations among the data to identify dependencyrelations between materials and device fabrication processes.
We have implemented and deployed the 4CeeD system atthe University of Illinois at Urbana-Champaign (UIUC) withtest users from two of UIUC’s major research labs that shareresearch facilities: Micro and Nano Technology Laboratory(MNTL) and Materials Research Laboratory (MRL). Theprimary feedback from the test users indicate that thesystem has helped them significantly reduce time and costspent on experiments. In addition, our evaluation on the

1. Create physical
experimental sample
2. Prepare analytical sample from the
physical experimental sample
3. Analyze the analytical
sample
4. Convert digital analytical
data
5.Transport the converted
analytical data
6. Interpret the converted
analytical data
7. Modify the procedure for creation
of the physical experimental sample
Figure 1: Experiment flow for material research.
system scalability show that the 4CeeD system is efficientin dealing with high-volume and fast-changing workload ofheterogeneous types of experimental data.
The paper is organized as follows. In Section II, weprovide some background information about the target envi-ronment of the proposed system and some insights from ouruser study as the motivations for the proposed solution. Wepresent the architectural overview of the 4CeeD system inSection III. In Section IV and V, we respectively describethe design and implementation of curation and coordinationservices – the two main components of the 4CeeD system.We show some evaluation results in Section VI and relatedwork in Section VII. We conclude the paper and presentsome future directions in Section VIII.
II. BACKGROUND & USER STUDY
To better understand the target environment of our pro-posed solution, we provide in this section some backgroundinformation on the materials, semiconductor experiments,and analytical instruments used in Materials Science re-search. In addition, we present some insights from ouruser study to shed light on the user requirements andexpectations.
A. Background
Figure 1 shows a typical experiment flow in materialresearch. In the first step, researchers create physical exper-imental samples, either in their labs or in shared fabricationfacilities. These physical samples can range from micro-electronic devices, to biological samples, to nanoparticles.Once physical samples are created, they must be preparedfor analysis (Step 2). For example, with analysis usingScanning Electron Microscopes (SEM), the preparation usu-ally involves cutting the sample into a size which can beplaced under the microscope and attaching it to a SEMsample holder. The result of such preparation is calledanalytical sample. The actual analysis of analytical samplehappens using analytic tools (Step 3), including SEM andother electron, scanning probe, or optical microscopies couldbe performed, as well as x-ray, ion, electron, and opticalscattering experiments.
The results of the analysis in Step 3 are the digital foot-prints of the physical experimental samples. These digitaldata can vary in format, depending on the type of analyticinstrument used. For example, the output of SEM micro-scopes (Figure 2) consist of: (i) digital images of analytical
Figure 2: An example of digitally collected data.
sample that are stored in standard image format (e.g., .TIF,.GIF., or .JPEG), (ii) instrument specific information andmeta-data (e.g., temperature, pressure, accelerating voltage,detector used, etc.) that are stored in a text file, and (iii)unstructured notes by researchers about the experimental oranalytical results. On the other hand, output data from theTEM microscopes is in proprietary data format (i.e., DM3)that contains both image data and instrument specific meta-data. In such the case of proprietary data format, it mightrequire another step to convert the results of analytic tools(Step 4). The researchers must then transport the convertedfiles to their personal workstation (Step 5 - which oftenuses a “sneakernet” of USB thumb drives) for follow-upinterpretation (Step 6). If the interpretation result is negative,further modifications might be needed for the procedureto create physical experimental sample (Step 7), whichcauses repetitions of the process until the desired criteriaare satisfied.
While new analytic techniques have allowed for a surgeof nanomaterials research publications and related innovativeproducts, the time between discovery of new materials andapplication in semiconductor fabrication processes is at arelative stagnation, taking several years between an inceptedmaterial design and its commercial usage. This slow pro-cess can be attributed largely in part to communication ofresearch, or rather the lack-there-of, specifically pertainingto nanomaterial analysis tools. Most often negative resultsfrom these nanomaterial analysis tools are not published, thetransportation of the collected data is often insecure, and theresulting data files are often propriety causing inherent lossof data through file conversion in order to work up the datafor publication quality figures.
In order to accelerate the experimental process, it isnecessary to have an expedient mean to capture and processthe digital data (i.e., output of Step 3) in real-time andin trusted manner before archiving, further analysis andvisualization for more efficient interpretation of the results.Such a distributed real-time and trusted framework wouldgreatly reduce the time, security and data loss risks ofthe manual efforts involved in the Step 4, 5, and 6 ofthe experimental process. In addition, a networked platformthat provides authorized access to archived experimentaldata would help close the communication gap betweenresearchers and prevent unnecessary repetitions of the ex-perimental process caused by the lack of information in the

literature.
B. User Study
To further verify the necessity and practicality of suchframework, we undertake a user study by surveying 52 usersof MNTL and MRL labs in the University of Illinois.
The results from the survey show that the majority ofusers utilizes a “sneakernet” method to transport data fromthe lab. Specifically, 96% of the users use USB thumb driveto transport data from the experimental session to their officefor further analysis, and 66% of them feel they have enoughtime during the session to upload the data if such a dataacquisition tool exists.
While survey results encouragingly show that nearly 80%of users are interested in using such a framework for dataacquisition, analysis, and a distributed platform for archivingand sharing data, they also point out some challenges inbuilding such a framework. First, the scale of data generatedduring lab session tends to be different from user to user, asshown in Figure 3a. In addition to the large number of usersfrom multiple research labs who might work concurrentlyduring peak hours, the system infrastructure should bescalable and capable of dealing with varying workloads.Second, researchers use a wide variety of instruments fortheir experiments. While Figure 3b shows the most popularinstruments (i.e., SEM and TEM), the long tail (i.e., ”Other”)consists of a very diverse set of instruments. As a result,the framework should be designed to support analyzingheterogeneous types of data generated from different typesof instruments. On the other hand, by knowing the mostpopular types of instruments being used, we can put morefocus on those types in designing evaluation and targetingpotential users. Third, as digital data is collected for wideaccess and sharing, users might want to perform search overshared repository of experimental data. The objectives can beto update/correct any missing meta-data/setting, erroneousinformation from user’s uploaded experimental data, to learnfrom others’ successful or failed experiments, or simply tolook for related experiments for reference purposes. Oursurvey shows that users want to search over the data using avariety of structured information, such as instrument types,experimental types and settings, beside traditional keyword-based search (Figure 3c).
III. 4CEED ARCHITECTURE OVERVIEW
In this section, we present the architectural overview ofour proposed 4CeeD system for real-time capture, curation,coordination, collaboration, and distribution of scientificmaterial-related data.
From the user study and survey results, we learned thatone of the major challenges for 4CeeD is to be able tocapture the data as it is generated in real-time during theexperimental session, transfer it to the cloud-based systemfor curation, archiving, analysis, and after-session viewing,
editing, or sharing. In addition, the cloud-based system needsto be scalable, to deal with large amount of input data, andbe flexible, to support processing heterogeneous types ofexperimental data. To address these challenges, we proposea 3-tier architecture of the 4CeeD system (Figure 4) thatconsists of three services: curation, cloudlet, and coordina-tion.Curation service (instrument and user tier): The datacuration service consists of two user-facing components:uploader and curator. With uploader, users can uploadraw data generated from materials-making/characterizationinstruments (e.g., a microscopies) and device fabricationinstruments via a user interface during experimental session.We will assume user-in-the-loop concept during the datainput step, because all of the materials and device fabricationinstruments are supervised and controlled by experimentingusers. Often, we want users to enter process-related data,notes regarding experimentation with new materials, rea-soning on why a certain physical component was added orremoved, and so forth. After the experimental session, usingcurator tool, users will also have the capability to annotate,add tags, remove erroneous data captured because of wronginstrument settings and/or configurations. We will describethe design and implementation of curation components indetails in Section IV.Cloudlet (intermediate tier): Since concurrently streamingdata from uploaders directly to the cloud might cause trafficcongestion and overload for cloud tier during peak hours,we propose to have an intermediate caching edge server,called cloudlet, deployed at each research lab. Cloudletwill coordinate with the coordination tier (to be described)to schedule data transfer and perform certain processingtasks on the data, in order to avoid traffic congestion,reduce unnecessary data to be sent to the coordinator, andoffload computation from the cloud. In addition, cloudlet isparticularly important if scientific instruments are connectedto PCs running old and unsupported OS (e.g., Windows XP)whose software cannot be patched with important securityprotections. In case the scientific instruments are connectedto secure and updated PCs, and there is only a small numberof instruments from a lab get connected to the back-endcloud, the cloudlet layer is optional.Coordination service (cloud tier): This is the centralizedcloud infrastructure for storing and processing collecteddata. To support heterogeneous types of workflow-based dataprocessing tasks, we design 4CeeDs coordination servicebased on topic-based publish/subscribe model. In addition, tosupport scalability, we design a dynamic resource manage-ment mechanism based on explicitly modeling performanceof the cloud-based pub/sub system. We will describe thedesign and implementation of the coordination tier in detailsin Section V.
For the first-phase development of our proposed architec-ture, we have designed and implemented the curation and

(a) Amount of data generated per session. (b) Working instruments. (c) Search preferences.Figure 3: Survey responses on the data size and experimental instruments.
Uploader
Uploader
Uploader
Cloudlet
Coordinator
Uploader
Uploader
Uploader
Cloudlet
MNTLMRL
upload images,Spectra, maps, metadata, text
upload images, metadata, text
view, edit, share data(via Webapp)
bulk data transfer(via API)
Process, analyze, correlate data from
multiple sources
...
Curator Curator
Figure 4: Overview of 4CeeD system.
coordination tiers that communicate directly with each other.We leave the design of cloudlet and its interaction with othertiers as a future work.
IV. 4CEED’S CURATION SERVICE
A. Requirements and Design Methodology
Since the primary purpose of data curation service (up-loader in particular) is to help users save time at themicroscopes by easily uploading raw experimental data tothe cloud repository, such a tool should require minimalinteractions with users. In addition, since the targeted usersare non-IT people, the interface should be intuitive andsimple to use.
Another requirement for curation service is to supportvarious types of input from different types of experimentsand by different users. Our discussions with users show thatusers tend to have different ways to organize their experi-mental data. For example, one might organize his/her databy experiment dates, while the other might use instrumentsor types of experiments. As a result, the curation serviceshould provide an extendable data model for inputting datato support diverse use cases.
As user study suggested, the curation service should alsosupport users the ability to search through shared datarepository by efficient filtering of structured and meta data.
In terms of the compatibility, since the PCs attached toinstruments can run different versions of operating systems
(including older, unsupported OSes like Windows XP), thecuration tools should be platform independent.
B. Implementation
To realize the above requirements, we first propose an ex-tendable data model by expanding the one used by Clowder1
to support nested structures necessary to mimic hierarchicalfolders which represent step by step scientific experimentsand device fabrication processes. Specifically, the data modelhierarchy includes three main concepts: nested collection,datasets, and files. At the lowest level, files represent exper-imental result data, such as images, text, or proprietary files.A dataset is a grouping of files that have metadata capturingthe preparation information of the experimental sample. Acollection is a way for users to organize their datasets (e.g.,each collection represents experiment data for a day, ordone by a particular instrument). The nested structure ofcollections provides users the flexibility to describe theirown data organization.
The uploader is implemented as web-based app (henceto be platform-independent) with its interface divided into3 simple dependent steps following the nested data model(Figure 5). The uploader requires users to log-in using theirown credentials every time using the application. In the firststep, user creates or selects a collection or sub-collectionfrom his/her own set of nested collections visualized by atree-based structure. After selecting (or creating) a collec-tion, in step two, user can create or select a dataset. Besidehaving users manually enter meta-data, we support metadatatemplates (i.e., each template correspond to a collection ofmeta-data fields) to allow users to quickly and accuratelyrecord any metadata associated with the dataset. In the thirdstep, users can drag and drop multiple raw experimental filesto the dataset selected/created in Step 2 to submit. Additionalfile-level metadata can also be added in the third step.
Similarly, the web-based curator also provides users ac-cess to their data via nested data model in Figure 6a.In particular, users can browse, view, edit their uploadedexperimental data by collections, datasets, or files. Users cansee all data processing tasks done on the raw experimental
1Clowder - https://clowder.ncsa.illinois.edu

Figure 5: 4CeeD uploader’s simple 3-step interface.
(a) View/edit uploaded experimental data.
(b) Faceted search across shared data repository.Figure 6: 4CeeD’s curator interfaces.
data. Examples of the tasks include extracting instrument-specific meta-data and image from DM3 file, generatingthumbnail previews for microscopy images, and classifyingexperimental data into appropriate types (e.g., diffusion,oxidation, etc.) or outcomes (i.e., success or failure). Eachtype of experimental data requires different set of dataprocessing tasks to be applied, which can be configured onthe coordination service (to describe in Section V). Eachset of tasks are often in form of workflow or DirectedAcyclic Graph (DAG) of tasks, and corresponds to a typeof a data processing job. In addition, we provide an “e-commerce style” search (i.e., similar to that of e-commercesites like Amazon, Newegg) over shared data repository ofexperiments (Figure 6b). Users can easily and efficientlysearch through a large amount of experimental data bycombining traditional keyword-based search and structureddata filtering (or faceted search). The structured data usedin filtering can be instrument-specific meta-data, experiment-related settings, or analytical results of data processing tasks(e.g., success/failure classification).
V. 4CEED’S COORDINATION SERVICE
A. Requirements and Design Methodology
Since the experimental data uploaded to coordinationservice can be of various types and formats, one of the mainrequirements for 4CeeD’s coordination service is to able tosupport processing heterogeneous types of data processingjobs, each corresponds to a type of uploaded data. To dealwith job heterogeneity, we design the coordination’s archi-tecture based on topic-based publish/subscribe model thatsupports execution of heterogeneous workflows. We leveragethe message passing mechanism in pub/sub system, in whichdifferent components in the system can post events (in formof messages) and react to those posted by other components,to give applications the flexibility to decide the logic ofhow to react to events and what chain of the steps neededto process an event. Our proposed design separates controlplane, which manages resources, user permissions, and allthe execution logic of workflows (i.e., task dependencies),and compute plane, which focuses on actual processing ofworkflow’s tasks, and thus, allows scalable and flexible im-plementation of heterogeneous workflows/jobs. We describeour proposed architecture in details in Section V-B.
Since a large number of users might work concurrentlyduring the peak hours, the coordination service needs tobe scalable. In addition, since real-world applications of-ten have variable and sometimes bursty loads, static andrule-based resource provisioning strategies are not suitable.To address these challenges, we leverage the elasticityof coordination service’s cloud infrastructure to design adynamic resource management approach for the pub/sub-based coordination. Our proposed solution also supportsdifferent resource provisioning strategies to satisfy differentobjectives set by users, such as quality of service (e.g.,response time, utilization), or cost of resources. We describein details our proposed resource management approach inSection V-C.
B. Publish Subscribe-based Coordination System
Our proposed system architecture for the pub/sub-basedcoordination service is presented in Figure 7. The systemconsists of three main components: front-end, control plane,and compute plane.

Coordination’s front-end
A’s Consumers
Job invoker
A B C
Database / File system
B’s Consumers C’s Consumers
B C
Broker(s)
Sub Pub Sub Pub Sub Pub
A B
Job type From To
1 A B
1 B C
1 Start A
1 C End
... ... ...
Con
trol p
lane
Com
pute
pla
ne
1 A B CJob
EndStart
Resource manager
Uploader Curator
LAN/WAN
Curationservices
Figure 7: Cloud-based pub/sub system architecture.
Front-end is the cloud entry point for all incoming re-quests (e.g., requests for processing raw experimental datauploaded by users, or curation requests). Any input data thatcome with the requests are stored into a database or filesystem (which will then be accessible when requests areprocessed). Front-end translates the incoming request into ajob profile that includes time-stamp, job ID, job type, userinformation, and any references to its input data stored indatabase/file system.
Control plane manages resources and handles all theexecution logic of jobs. When the Job invoker receivesthe job profile from front-end, it first checks to see if theuser who submitted the request has appropriate permissionon the data that the job accesses to. Since each job typecorresponds to a workflow of tasks, job invoker will askthe brokers which task of the job should be processed first.The brokers maintain a mapping table that includes all thetask dependencies of all the job types that system supports.Particularly, given a job type and a current task (i.e., ”From”field), the brokers will return what is the next task (i.e., ”To”field) to be processed for a job. The Job invoker forward thejob profile to the appropriate component in compute planewhere the first task of the job will be processed.
Another main component of the control plane is resourcemanger that monitors the performance of processing compo-nents in the compute plane to make resource provisioningdecisions. We describe the design and implementation ofresource manager in details in Section V-C.
Compute plane is in charge of actual processing of tasksof a job. It consists of a “peer-to-peer”-like network ofprocessing components, which are commonly abstracted astopics in pub/sub system, each is responsible for processing a
particular type of task (e.g., extracting meta-data from DM3,generating previews of experimental images, classifyingexperimental data). Each topic operates both as a subscriberand a publisher. As a subscriber, a topic maintains a messagequeue for requests of the task type it is in charge for and aset of consumers that subscribes to the queue to processthe requests (the number of consumers per topic can beadjusted dynamically and is the topic of study for resourcemanagement). Each consumer of a topic also acts as apublisher. After a task is processed, the consumer will askcontrol plane’s brokers for the subsequent task(s) of the joband then, forward the job request to the appropriate topic(s).
In the Figure 7 shows an example of a flow of a jobthrough the system. The request of a type-1 job consists ofthree tasks A → B → C that are executed consecutively.After verifying the permissions of user who submitted therequest, job invoker asks the brokers and send the requestto the appropriate topic in charge of the first task of thejob (i.e., task A). The job request is processed by one ofthe consumers of topic A, and then, after the A’s consumerconsults the brokers, the request is forwarded to the nexttopic (i.e., topic B). Similar procedure applies for thetransition from task B to C. The processing of the jobrequest ends when task C’s consumer is notified that taskC is the last task of a type-1 job.
C. Coordination Service’s Resource Manager
In the following, we will describe our proposed design andimplementation of an efficient resource manager for 4CeeD’scoordination service.
Resource manager, which is part of the control plane,collects various statistics of the system in real-time, suchas job request arrival rates, actual job response time, anddecides whether to perform rescheduling of resources basedon monitoring information (e.g., when system’s averageresponse time is greater than a certain predefined threshold).If a rescheduling is needed, resource manager executesappropriate resource allocation algorithm and produces anew allocation of resources over topics (i.e., how manyconsumers are needed for each topic).
We use a 3-step approach to design the resource allocationalgorithm for 4CeeD’s coordination service:
• Step 1 (Optimization): Formulate resource manage-ment as optimization problems.
• Step 2 (Modeling): Formally model the performancemetrics of the system (e.g., response time, utilization).
• Step 3 (Solution): Efficiently solve the optimizationproblems to find optimal resource allocation strategies.
In the following, for the paper’s completeness, we willbriefly describe each step. More details can be found in ourprevious work [9].
Before describing each step, we define some notationsused in this section. Let us consider a cloud-based pub/subsystem that consists of J topics (i.e., supports processing
J tasks) and accepts requests for N types of jobs, eachjob corresponds to a workflow of tasks supported by thepub/sub system. In terms of computational parameters, foreach topic j (1 ≤ j ≤ J), there are mj (uniform)consumers subscribe to its message queue. The numbers ofconsumers over topics m = (m1,m2, ...,mJ) (which canbe dynamically provisioned by exploiting the elasticity ofthe cloud infrastructure) are the main variables to measureperformance of the elastic pub/sub system.
The system performance metrics, we use work-in-progress, denoted as WIP , as the performance metric fortime (since response time is linearly related to the numberof job requests being in the system, by Little’s law). Partic-ularly, WIP (m) =
∑Jj=1 νjLj(mj), with νj and Lj(mj)
are respectively the value of a job request (assumed to begiven) and the number of job requests in progress at topic j.In terms of the resource cost, the total resource cost dependson the number of provisioned consumers per topic and isdefine as F (m) =
∑Jj=1 Fj(mj), where Fj(mj) is the cost
of allocating mj consumers at topic j.Optimization. The resource management problem for cloud-based pub/sub system can be formulated as optimizationproblems using different objective functions to allow flexibleselection of resource provisioning strategies. In particular,for the first optimization problem, the objective is to min-imize system’s overall response time, or appropriately theWIP metric:
Problem Definition 1: (Minimal Time Resource Alloca-tion) Given a cloud-based pub/sub system that supports Ntypes of job and J different tasks, and a cost budgetM, findan optimal allocation m of consumers to topics to minimizesystem’s work-in-progress WIP :
argminm
WIP (m) =
J∑j=1
νjLj(mj)
subject toJ∑
j=1
Fj(mj) =M
For the second optimization problem, the objective is tominimize the total resource cost of allocating consumersacross topics:
Problem Definition 2: (Minimal Cost Resource Alloca-tion) Given a cloud-based pub/sub system that supports Ntypes of job and J different tasks, and a WIP (or time)constraint T , find an optimal allocation m of consumers totopics to minimize system’s total resource cost F (m):
argminm
F (m) =
J∑j=1
Fj(mj)
subject toJ∑
j=1
νjLj(mj) ≤ T
Modeling. In order to solve the above problems, it isimportant to obtain the formulation for the performance
metric WIP . In particular, from the system architecturedescription in Section V-B, it is intuitive to model eachtopic as a network of queues, each queue corresponds toa topic’s message queue. Besides, as job requests can be ofdifferent job types and they arrive then leave the systemas they are finished, the queuing network model of thesystem is categorized as multi-class and open. To makethe system model more realistic, we consider job requestarrival rates and processing time at each topic both followgeneral distributions. As a result, we can model each topicas a GI/G/m queue and the elastic pub/sub system as aGeneralized Multiple-class Jackson OQN.
With this modeling, we are able to obtain the approxima-tion of performance measure of individual topic Lj(mj), andof the whole system WIP as WIP (m) =
∑Jj=1 νjLj(mj).
Solution. Dynamic resource allocation for the system requiremore efficient solutions for Problem 1 and 2. By realizingthe convex property of the objective functions (i.e., WIPin particular), we propose greedy strategies that not onlyefficiently solve the optimization problems, but also providethe optimal solutions. In particular, the Algorithm 1 startswith initializing each topic with one consumer, and then, thealgorithm greedily finds the topic with the largest benefitif being allocated an additional consumer. For Problem 1,the allocation benefit is defined to be proportional to thedecrease of the number of work-in-progress job requests(i.e., νj [Lj(m
i−1j ) − Lj(m
i−1j + 1)]). For Problem 2, the
benefit is defined to be inversely proportional to the increasein resource cost (i.e., Fj(m
i−1j +1)−Fj(m
i−1j )) and directly
proportional to the decrease of the number of work-in-progress job requests (i.e., νj [Lj(m
i−1j )− Lj(m
i−1j + 1)]).
The greedy algorithm ends when it reaches the optimizationconstraint (cost budget M in Problem 1, and response timeconstraint T in Problem 2).
Algorithm 1 Greedy Resource Allocation1: procedure GREEDYRESALLOC2: Initial allocation m0: m0
j = 1, ∀1 ≤ j ≤ J3: Initialize iteration count i = 14: while The optimization constraint is satisfied do5: Find the topic j∗ that maximizes the allocation benefit6: Add one consumer to most benefit topic mi
j∗ = mi−1j∗ + 1
7: Update iteration count i = i+ 1
8: Return allocation solution mi
VI. EVALUATION
A. 4CeeD Implementation Details
We implemented 4CeeD’s uploader as a lightweight Webapplication using PHP programming language. Curatorscommunicate directly with 4CeeD’s cloud-based coordina-tion service via front-end APIs, which are based on Clow-der’s API implementation. 4CeeD’s curator is implementedbased on Clowder with added features including nestedcollections data model, structured data-based search (or

faceted search). We use Elasticsearch2 as the search indexingserver for faceted search.
We implemented 4CeeD coordination service’s proposedcloud-based elastic pub/sub system using RabbitMQ3 as themessage queue engine and Docker4 container technologyas the implementation platform for consumers (for bet-ter isolation and server consolidation). Particularly, eachconsumer is implemented and encapsulated into a Dockerimage and subscribes to a RabbitMQ’s message queue ofappropriate topic. We deployed coordinator on a cluster ofthree servers, each server is equipped with an Intel Xeonquad core processor (1.2Ghz for each core) and 16GBof RAM. We use Kubernetes5 as the Docker containerostrastration engine for the cluster and each topic’s consumerset is abstracted as a Kubernetes’ ReplicationController. Theresource manager (resource allocator in particular) interactsdirectly with Kubernetes to dynamically scale the size ofReplicationController (i.e., number of consumers) of eachtopic. All system components are implemented using Pythonprogramming language.
B. Curator
To evaluate curator, we ask our beta testers for their opin-ion about the tool after a few months of use. In particular,we ask users about how easy it is to use the tool and howmuch time would they be able to save using the curatorduring experimental sessions.
In terms of the ease of use, the user statements show that“the curator application is simple”, “the steps in usage arepretty clear”, and tools “allows them to utilize their preferredorganizational strategy” without any instructions.
In terms of the time saving, an average SEM user statesthat every time using the SEM, he spend about 15% of thetime exporting and transferring the images to a server. Inaddition to this time, he also need to spend another 15% ofthe time analyzing the images since he does not have a wayto view the proprietary image format and I does not want tolose all the SEM metadata after exporting resulted file to a.TIF or .JPEG image format for after-session viewing. So,in total, for an hour long reservation, he loses about 15 to20 minutes depending on the type of experiment. This timesavings can also be translated into cost savings. Particularly,each hour in the clean room normally costs $15 and theSEM costs another $10 per hour. In addition to the laborcost, it can go up to $75 per hour. Therefore, the time spenton exporting and moving files would costs $25 to $30 eachhour.
Being able to use the curator during experiment sessionsallows users effectively save the time spent copying files andtransport them to office for after-session interpretation. In
2Elasticsearch - https://www.elastic.co3RabbitMQ - https://www.rabbitmq.com4Docker - https://www.docker.com5Kubernetes - http://kubernetes.io
Task Description 𝜇j cs2j
A Unpacking digital microscope output files (e.g., DM3, HDF5) 4.2 0.33
B Extracting and analyzing metadata from input file 3.7 0.5
C Extracting and analyzing image from input file 6.7 0.4
D Classify the input file into appropriate experiment type and predict if the experiment is successful or not 5.1 0.5
(a) Supported types of task.
A B D
C D
AB
DC
Job type Format ca2i
1 0.33
2 0.5
3 0.25
(b) Supported types of job.Figure 8: Tasks and jobs supported by the system.
addition, the previews of experimental files help users savetime converting between different preview image formats.More importanly, since all metadata are also captured, userswould know all configurations of the instruments (e.g., SEMcamera settings at which the image was taken), and thus caneasily try the same measurement again in the future.
C. Coordinator
In this section, we evaluate the effectiveness of our pro-posed coordinator compared to baseline in the two resourcemanagement tasks defined in Section V.
1) Evaluation Settings:Case study: We take the application of executing scientificcomputing workflows as the case study. Particularly, thesystem supports analyzing experimental data generated bydigital microscopes (which are usually in forms of DM3, orHDF5 files). Four types of task are supported, which corre-spond to the steps needed to process input data (Figure 8a).Depending on the input data, the system can support threedifferent types of job, each job consists of all or a subset ofsupported tasks (Figure 8b).Parameter settings: The processing rates of tasks are givenin Figure 8a. The squared coefficient variance (scv) of jobarrival rates are given in Figure 8b, while the expectedarrival rates of each job type (i.e., λi) are varied duringthe evaluation to represent changing workload. Please notethat the time unit we use for rates (i.e., processing time rateµj and job arrival rate λi) is per minute. To simplify thecomputation, we use a uniform resource cost function, i.e.,Fj(mj) = mj ,∀j, and consider the job requests as equallyimportant, i.e., νj = 1,∀j6.
We compare our resource management algorithms, namedMinTime (greedy algorithm for Problem 1) and MinCost
(greedy algorithm for Problem 2), with random resourceallocation approach, named Random. In Random, for eachiteration, a topic is randomly chosen to be allocated anadditional consumer. To evaluate the performance of dif-ferent algorithms, we initially allocate one consumer to
6Please note that Fj(mj) and νj can be chosen in any form so thatWIP (m) and F (m) maintain their non-increasing and non-decreasingconvex properties.
0
50
100
150
200
250
300
350
400
450
[0.5, 1.0, 0.5]
[1.0, 1.5, 1.0]
[1.5, 2.0, 1.5]
[2.0, 2.5, 2.0]
[2.5, 3.0, 2.5]
[3.0, 3.5, 3.0]
Ave
rage
resp
onse
tim
e (s
econ
ds)
Job arrival rates
Type 1 Type 2Type 3 All
Figure 9: Average response time when incoming workload increase.
020406080
100120140160180200
0 1 2 3 4 5
Ave
rage
resp
onse
tim
e (s
econ
ds)
Iteration
MinTime Random
(a) Minimize time resourceallocation comparison.
0
50
100
150
200
250
300
0 1 2 3 4 5 6 7 8 9 10
Ave
rage
resp
onse
tim
e (s
econ
ds)
Iteration
MinCost Random
(b) Minimize cost resourceallocation comparison.
Figure 10: Optimization tasks comparison.
each topic: m = (1, 1, 1, 1). Then, after each iteration (i.e.,after a consumer is allocated to a topic), we measure theaverage response time of each type of job, as well as theaverage of all jobs. An algorithm is considered better if itachieves lower average response time after a given numberof iterations (in case of minimal time allocation), or requiresless iterations to reach a predefined response time threshold(in case of minimal cost allocation).
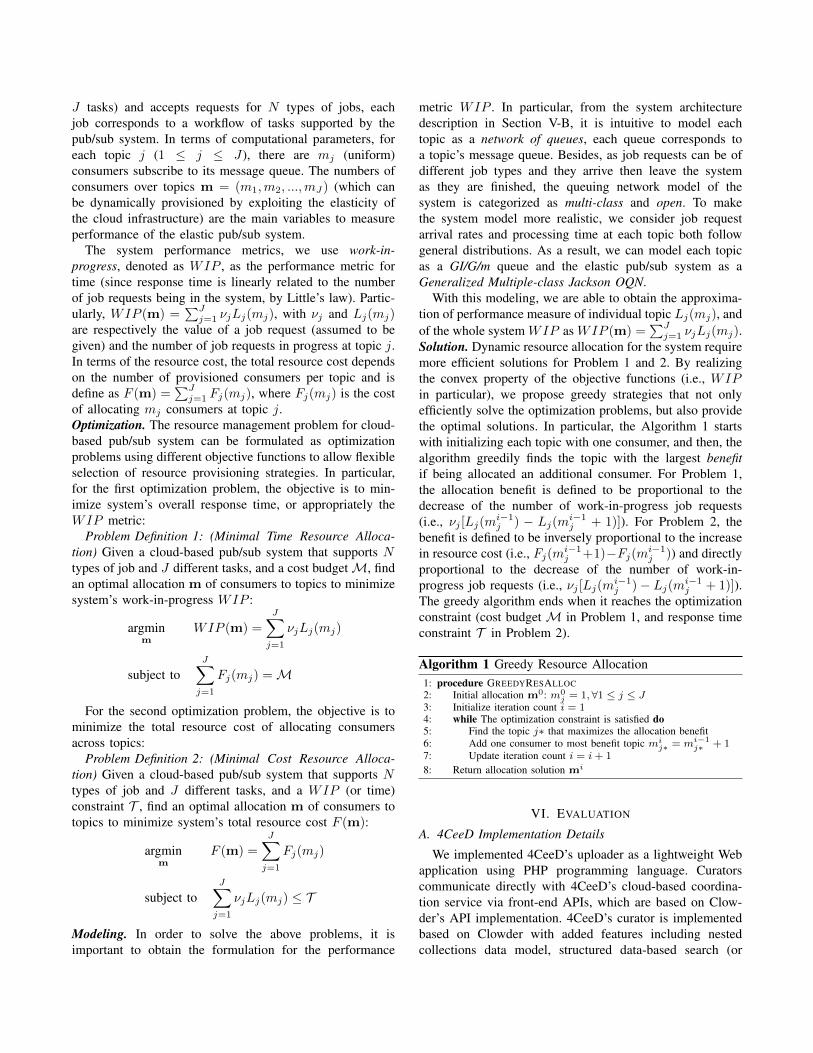
2) Varying workload: We first evaluate the performanceof the pub/sub system by varying the input workload. Inthis experiment, we fix the number of consumer at eachtopic to be 1 (i.e., m = (1, 1, 1, 1)) and increase the arrivalrates of different job types. The results in Figure 9 showthat, as expected, when the arrival rates increase, the averageresponse time of the system (averaging over each individualjob type as well as over all job types) increases. Moreimportantly, in Figure 9, we also observe that the increasesin the average response time of different job types aredifferent. For example, job type 3 seems to be less affectedby the increase of the arrival rates, compared with job type1 and type 2. This suggests that, when provisioning thenumber of consumers at each topic, one should considerthe differences in the sensitivity of different job types tothe changing workload. This insight is also consistent withour motivation in designing the greedy resource allocationstrategies (Section V), in which, we give higher provisioningpriority to topic whose provisioning gives largest benefit.
3) Optimization Tasks: For the Minimal Time ResourceAllocation task, given a workload {λi} = (2.0, 2.5, 2.0) anda cost constraintM = 5, we perform resource allocation us-ing MinTime and Random. Figure 10a shows that, when twoalgorithms reach the cost constraint (i.e., after 5 iterations),MinTime outperforms Random by achieving a lower averageresponse time of all types of job. On the other hand, Random
0
20
40
60
80
100
120
140
160
180
200
Res
pons
e tim
e (s
econ
ds)
Job requests ordered by arrival time
Type 1 Type 2 Type 3
{𝜆j} = (0.5, 1.0, 0.5) {𝜆j} = (3.0, 3.5, 3.0)
Figure 11: Dynamic provisioning to deal with bursty workload.
could not achieve optimal result due to its randomization inselecting topics for provisioning.
For the Minimal Cost Resource Allocation task, givena workload {λi} = (3.0, 3.5, 3.0) and a response timeconstraint of 50 seconds: T = 50, we perform resourceallocation using MinCost and Random until the systemaverage response time of all types of job smaller than orequal T . The result in Figure 10b shows that MinCost onlyneeds 5 additional consumers to satisfy the response timeconstraint, while Random struggles in bringing down theresponse time to below T , even after 10 iterations.
The results in both optimization tasks help confirm theeffectiveness of using greedy strategy in selecting the topicsfor resource provisioning that maximize the overall benefit.
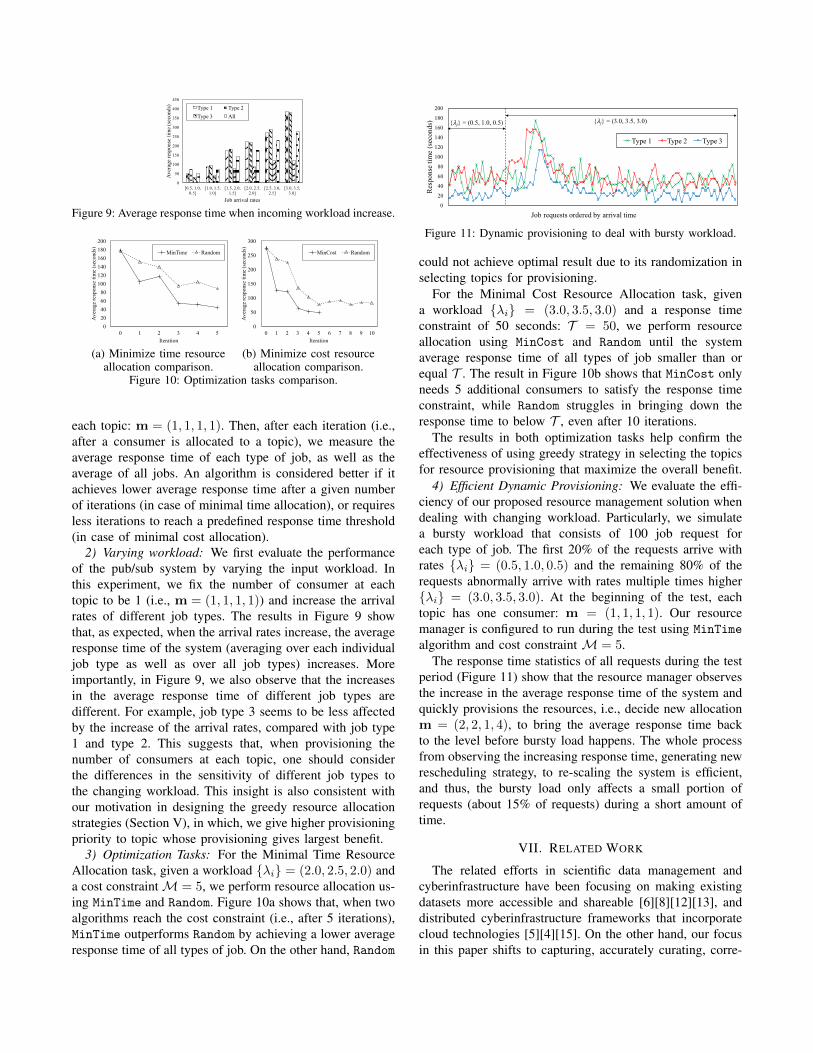
4) Efficient Dynamic Provisioning: We evaluate the effi-ciency of our proposed resource management solution whendealing with changing workload. Particularly, we simulatea bursty workload that consists of 100 job request foreach type of job. The first 20% of the requests arrive withrates {λi} = (0.5, 1.0, 0.5) and the remaining 80% of therequests abnormally arrive with rates multiple times higher{λi} = (3.0, 3.5, 3.0). At the beginning of the test, eachtopic has one consumer: m = (1, 1, 1, 1). Our resourcemanager is configured to run during the test using MinTime
algorithm and cost constraint M = 5.The response time statistics of all requests during the test
period (Figure 11) show that the resource manager observesthe increase in the average response time of the system andquickly provisions the resources, i.e., decide new allocationm = (2, 2, 1, 4), to bring the average response time backto the level before bursty load happens. The whole processfrom observing the increasing response time, generating newrescheduling strategy, to re-scaling the system is efficient,and thus, the bursty load only affects a small portion ofrequests (about 15% of requests) during a short amount oftime.
VII. RELATED WORK
The related efforts in scientific data management andcyberinfrastructure have been focusing on making existingdatasets more accessible and shareable [6][8][12][13], anddistributed cyberinfrastructure frameworks that incorporatecloud technologies [5][4][15]. On the other hand, our focusin this paper shifts to capturing, accurately curating, corre-

lating, and coordinating materials-to-devices digital data ina real-time and trusted manner before fully archiving andpublishing them for wide access and sharing. As a result,our effort is complement to those other efforts, and we couldeffectively leverage existing solutions to solve our problems.
Publish-subscribe system [18][17], with its wide range ofapplications, has been a large topic of study. There havebeen a lot of efforts recently [7][10][16] to deploy pub/subsystem in the cloud environment to take advantage of theelasticity of the cloud. For example, Gascon et al [10]propose a cloud resource provisioning strategy for pub/subsystem based on monitoring the incoming workload, Settyet al. [11] study the resource cost-effective deploymentproblem of pub/sub system with known workload. Ourproposed cloud-based 4CeeD’s coordination service in thispaper leverages pub/sub model to support scalable executionof heterogeneous workflows.
Most of the efforts on resource management for cloud-based systems have been on batch processing [19], in-teractive big data analytics systems [20], or synchronousdata stream processing [14]. In our previous work [9], wefocus on resource management for real-time asynchronouspub/sub system that can support multiple types of jobs. Ourproposed resource allocation strategies can be used withother more generic cloud resource management solutions,such as YARN [22] and Mesos [21] that help allocateavailable computational resources to applications.
VIII. CONCLUSIONS AND FUTURE WORK
In conclusions, in this paper, we have presented designand implementation of 4CeeD, a data acquisition and anal-ysis framework for materials-to-devices processes. 4CeeDsupports capturing, curating, correlating, and coordinatingmaterials-to-devices digital data in a real-time and trustedmanner before fully archiving and publishing data. Theevaluation results show that our curation service helps usersspeed up about a third of the time spent at digital micro-scopes, and avoid using widely popular “sneakernet” methodto transport data that limits data capacity and poses secu-rity concerns. At cloud level, 4CeeD’s coordination servicesupports scalable execution of heterogeneous workflows,where tasks can be written by users and plugged-in to thecoordination system via containerization.
In terms of future work, we would like to incorporatecloudlet into the current implementation to help orchestratedata transfer between multiple sides and the cloud to avoidtraffic congestion. We will also investigate how to performoff-load computational tasks from the cloud to cloudletto support applications that require low-latency and fastresponses, as well as to prevent unnecessary data transferredto the cloud. In addition, we would also like to increase thenumber of instruments supported by 4Ceed framework andexpand 4CeeD’s user base.
ACKNOWLEDGMENT
This research was funded by the National Science Founda-tion NSF ACI 1443013. The opinions, findings and conclu-sions or recommendations expressed in this paper are thoseof the authors and do not necessarily reflect the view of theNational Science Foundation.
REFERENCES
[1] Holdren, J.P. Materials genome initiative for global competitiveness.National Science and Technology Council OSTP 2011, Washington,USA.
[2] Apelian, D. et al. Accelerating technology transition: bridging thevalley of death for materials and processes in defense systems.National Materials Advisory Board, NAE, 2004.
[3] Oden, J.T. et al. Simulation-Based Engineering Science: Revolu-tionizing Engineering Science through Simulation. Report of theNational Science Foundation Blue Ribbon Panel on Simulation-BasedEngineering Science, 2006.
[4] Padhy, S. et al. Brown Dog: Leveraging everything towardsautocuration. In Big Data 2015.
[5] McLennan, M., Kennell, R. HUBzero: a platform for disseminationand collaboration in computational science and engineering. Com-puting in Science & Engineering 2010, 12(2), pp.48-53.
[6] Klimeck, G. et al. nanohub.org: Advancing education and research innanotechnology. Computing in Science & Engineering 2008, 10(5),pp.17-23.
[7] Li, M., Fan, Y., Kim, M. K., Chen, H., and Lei, H.. A scalable andelastic publish/subscribe service. In Proceedings of IPDPS 2011, pp.1254-1265.
[8] Plale, B. et al. SEAD virtual archive: Building a federation of insti-tutional repositories for long-term data preservation in sustainabilityscience. International Journal of Digital Curation 2013, 8(2), pp.172-180.
[9] Nguyen, P. and Nahrstedt, K. Resource Management for Elastic Pub-lish Subscribe Systems: A Performance Modeling-based Approach. InCLOUD 2016.
[10] Gascon-Samson, J. et al. Dynamoth: A Scalable Pub/Sub Middlewarefor Latency-Constrained Applications in the Cloud. In Proceedingsof ICDCS 2015, pp. 486-496.
[11] Setty, V. et al. Cost-effective resource allocation for deployingpub/sub on cloud. In Proceedings of ICDCS 2014, pp. 555-566.IEEE, 2014.
[12] Strasser, C. et al. DataUp: A tool to help researchers describe andshare tabular data. In F1000Research, 3.
[13] Szalay, A.S. et al. The SDSS skyserver: public access to the sloandigital sky server data. In SIGMOD 2002.
[14] Fu, T. Z. J. et al. DRS: Dynamic Resource Scheduling for Real-TimeAnalytics over Fast Streams. In Proceedings of ICDCS 2015.
[15] Mayernik, M. et al. The data conservancy instance: Infrastructureand organizational services for research data curation. D-LibMagazine 2012, 18(9), p.2.
[16] Tran, N.-L., Skhiri, S., and Zimnyi, E. Eqs: An elastic and scalablemessage queue for the cloud. In Proc. of CloudCom 201, pp. 391-398.
[17] Jacobsen, H.A. et al. The PADRES Publish/Subscribe System. Prin-ciples and Applications of Distributed Event-Based Systems 2010,164, p.205.
[18] Eugster, P.T., Felber, P.A., Guerraoui, R. and Kermarrec, A.M., 2003.The many faces of publish/subscribe. ACM Computing Surveys(CSUR), 35(2), pp.114-131.
[19] Zaharia, M. et al. Delay scheduling: a simple technique for achievinglocality and fairness in cluster scheduling. In Proceedings of the 5thEuropean conference on Computer systems 2010, pp. 265-278.
[20] Melnik, S. et al. Dremel: interactive analysis of web-scale datasets.Proceedings of the VLDB Endowment 2010, 3(1-2), 330-339.
[21] Hindman, B. et al. Mesos: A Platform for Fine-Grained ResourceSharing in the Data Center. In Proceedings of NSDI 2011, Vol. 11,pp. 22-22.
[22] Vavilapalli, V.K. et al. Apache hadoop yarn: Yet another resourcenegotiator. In Proceedings of the 4th annual Symposium on CloudComputing 2013 (p. 5).


![A software framework for real-time multi-modal detection ... · requirement for real-time processing. BiosignalsStudio [12] is a software framework for real-time acquisition and processing](https://img.pdfslide.us/doc/110x75/5f648da6b75a69707a1a25b2/a-software-framework-for-real-time-multi-modal-detection-requirement-for-real-time.jpg)