Embed Size (px)
Citation preview
Dassault Systèmes
November 2016
T. de Tersant, Senior EVP, CFO
P. Daloz, EVP, Brands & Corporate Development

2
Forward Looking Information Statements herein that are not historical facts but express expectations or objectives for the future, including but not limited to statements
regarding the Company’s non-IFRS financial performance objectives, are forward-looking statements.
Such forward-looking statements are based on Dassault Systèmes management's current views and assumptions and involve known
and unknown risks and uncertainties. Actual results or performances may differ materially from those in such statements due to a range
of factors. The Company’s current outlook for 2016 takes into consideration, among other things, an uncertain global economic
environment. In light of the continuing uncertainties regarding economic, business, social and geopolitical conditions at the global level,
the Company’s revenue, net earnings and cash flows may grow more slowly, whether on an annual or quarterly basis. While the
Company makes every effort to take into consideration this uncertain macroeconomic outlook, the Company’s business results, however,
may not develop as anticipated. Furthermore, due to factors affecting sales of the Company’s products and services as described above
and in the Risk Factors section of the Company’s most recent Document de Référence, there may be a substantial time lag between an
improvement in global economic and business conditions and an upswing in the Company’s business results.
In preparing such forward-looking statements, the Company has in particular assumed an average US dollar to euro exchange rate of
US$1.15 per €1.00 for the 2016 fourth quarter and US$1.12 per €1.00 for the full year as well as an average Japanese yen to euro
exchange rate of JPY120.0 to €1.00 for the fourth quarter and JPY120.8 to €1.00 for the full year before hedging; however, currency
values fluctuate, and the Company’s results of operations may be significantly affected by changes in exchange rates.
The Company’s actual results or performance may also be materially negatively affected by numerous risks and uncertainties, as
described in the “Risk Factors” section of the 2015 Document de Référence, filed with the AMF on March 23, 2016, and also available on
the Company’s website www.3ds.com.
3
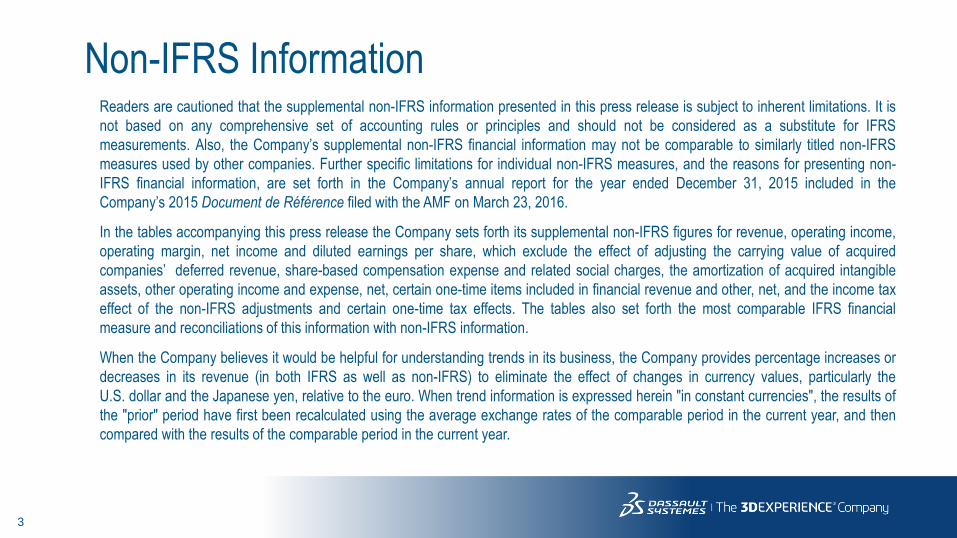
Non-IFRS Information Readers are cautioned that the supplemental non-IFRS information presented in this press release is subject to inherent limitations. It is
not based on any comprehensive set of accounting rules or principles and should not be considered as a substitute for IFRS
measurements. Also, the Company’s supplemental non-IFRS financial information may not be comparable to similarly titled non-IFRS
measures used by other companies. Further specific limitations for individual non-IFRS measures, and the reasons for presenting non-
IFRS financial information, are set forth in the Company’s annual report for the year ended December 31, 2015 included in the
Company’s 2015 Document de Référence filed with the AMF on March 23, 2016.
In the tables accompanying this press release the Company sets forth its supplemental non-IFRS figures for revenue, operating income,
operating margin, net income and diluted earnings per share, which exclude the effect of adjusting the carrying value of acquired
companies’ deferred revenue, share-based compensation expense and related social charges, the amortization of acquired intangible
assets, other operating income and expense, net, certain one-time items included in financial revenue and other, net, and the income tax
effect of the non-IFRS adjustments and certain one-time tax effects. The tables also set forth the most comparable IFRS financial
measure and reconciliations of this information with non-IFRS information.
When the Company believes it would be helpful for understanding trends in its business, the Company provides percentage increases or
decreases in its revenue (in both IFRS as well as non-IFRS) to eliminate the effect of changes in currency values, particularly the
U.S. dollar and the Japanese yen, relative to the euro. When trend information is expressed herein "in constant currencies", the results of
the "prior" period have first been recalculated using the average exchange rates of the comparable period in the current year, and then
compared with the results of the comparable period in the current year.

4
Q3 2016 Highlights
Delivering good Q3 total revenue, operating margin and EPS
3DEXPERIENCE delivering strong growth
ENOVIA showing good momentum
SOLIDWORKS performing well
Broadening reach in T&M, High-tech, CG-Retail, CPG-Retail and AEC
Closing CST acquisition and expanding in Electromagnetic Simulation
Updating FY16 guidance for Q3 positive currency impact and CST acquisition,
narrowing revenue range
5
1
Q3 16 Financial Highlights
2
Q3 16 Business Review
3 Q4 & FY16 Financial Objectives
4 Financial Information Appendix
Agenda
6
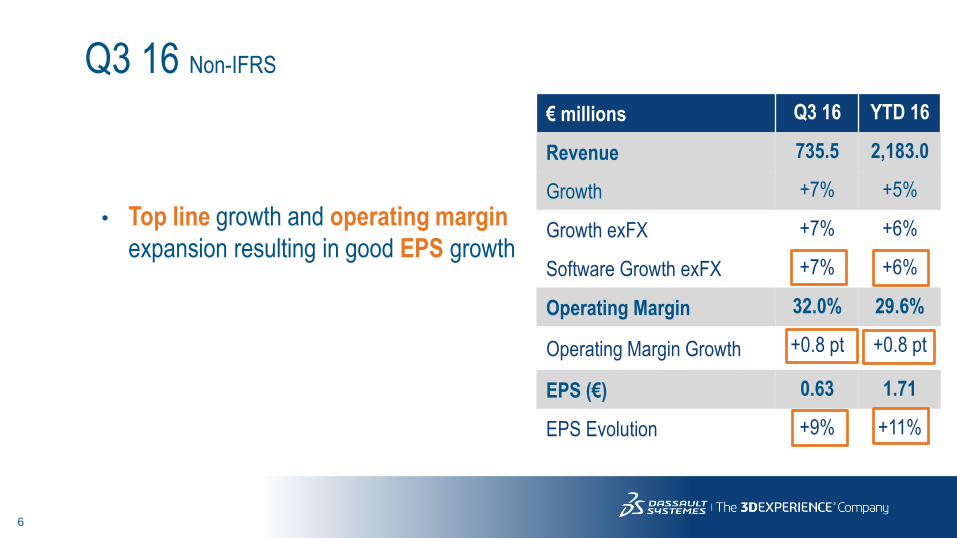
€ millions Q3 16 YTD 16
Revenue 735.5 2,183.0
Growth +7% +5%
Growth exFX +7% +6%
Software Growth exFX +7% +6%
Operating Margin 32.0% 29.6%
Operating Margin Growth +0.8 pt +0.8 pt
EPS (€) 0.63 1.71
EPS Evolution +9% +11%
Q3 16 Non-IFRS
• Top line growth and operating margin
expansion resulting in good EPS growth

7
Software Revenue by Region Non-IFRS
Q3 16:
Growth in North America offset in part by
weaker results in Latin America
Good performance in France and
Southern Europe
Strong performance in Asia led by China
and Korea
Q3 16 YTD 16
Americas +3% +6%
Europe +4% +6%
Asia +17% +8%
Software Revenue +7% +6%
Software Revenue Growth exFX by Region
8
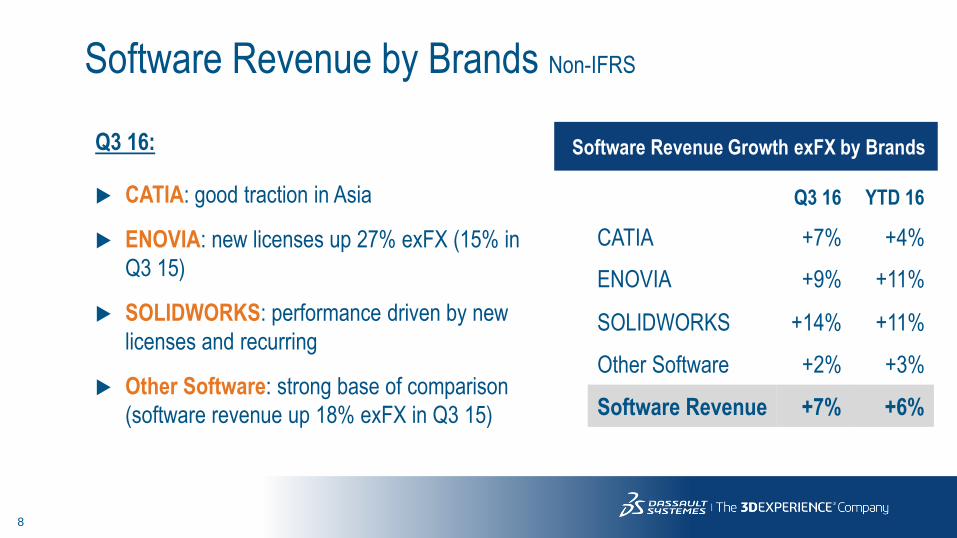
Software Revenue by Brands Non-IFRS
Q3 16:
CATIA: good traction in Asia
ENOVIA: new licenses up 27% exFX (15% in
Q3 15)
SOLIDWORKS: performance driven by new
licenses and recurring
Other Software: strong base of comparison
(software revenue up 18% exFX in Q3 15)
Software Revenue Growth exFX by Brands
Q3 16 YTD 16
CATIA +7% +4%
ENOVIA +9% +11%
SOLIDWORKS +14% +11%
Other Software +2% +3%
Software Revenue +7% +6%

9
Q3 16 Business Review
SOLIDWORKS
3DEXPERIENCE
3DEXPERIENCity
Industries

10
Q3 SOLIDWORKS Performance
SOLIDWORKS new licenses up ~+13% exFX in Q3 (double-digit growth across geos)
Continuously investing in R&D with a new release every year
Sustaining strong community involvement
725k+ commercial users
10M+ students have learned SOLIDWORKS in the past 22 years
350+ resellers
650+ software partners
11
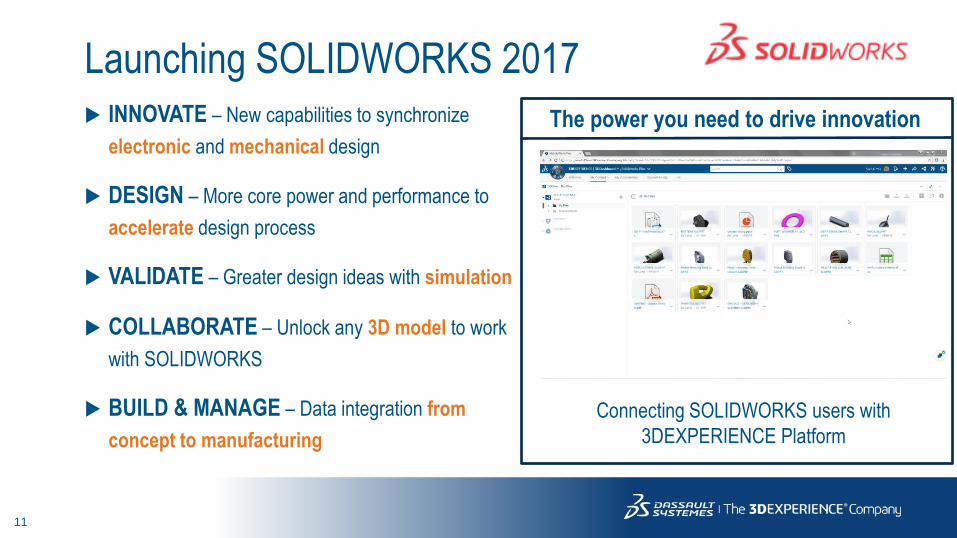
Launching SOLIDWORKS 2017 INNOVATE – New capabilities to synchronize
electronic and mechanical design
DESIGN – More core power and performance to
accelerate design process
VALIDATE – Greater design ideas with simulation
COLLABORATE – Unlock any 3D model to work
with SOLIDWORKS
BUILD & MANAGE – Data integration from
concept to manufacturing
Connecting SOLIDWORKS users with
3DEXPERIENCE Platform
The power you need to drive innovation

12
Q3 16 Business Review
SOLIDWORKS
3DEXPERIENCE
3DEXPERIENCity
Industries

13
3DEXPERIENCE | YTD Performance
* Excluding SOLIDWORKS and acquisitions
20%
33%
YTD 2015 YTD 2016
+13 points in YTD 16
% V6 / New Licenses Revenue* Non-IFRS
3DEXPERIENCE new licenses
revenue up +76% exFX

14
Global manufacturer of three million vehicles annually
3DEXPERIENCE Platform: 10,000 Users at Renault
RENAULT
Business Values: Solution:
“Our ’NewPDM’ program is key for engineering digital
acceleration of Groupe Renault. This huge business
transformation, driven with Dassault Systèmes’
support, represents a clear performance breakthrough
for the development of the future range of our three
brands, Renault, Dacia and Renault Samsung Motors.”
Gaspar Gascon Abellan, Executive Vice President Engineering,
Groupe Renault
3DEXPERIENCE Platform
with Target Zero Defect
Industry Solution Experience
(including ENOVIA, CATIA,
SIMULIA, DELMIA) to lower
risks and costs associated
with new products
introduction
15
Q3 16 Business Review
SOLIDWORKS
3DEXPERIENCE
3DEXPERIENCity
Industries

16
Attending World Cities Summit | July 2016, Singapore
92 mayors and city leaders from 64 countries attending 2016 World Cities
Summit taking place in Singapore
Showcasing the 3DEXPERIENCE platform and revealing the value
of IOT for Smart Cities

17
Leading group in China pioneering in smart city-related projects and in supporting
SMBs from emerging industry in China
Cybernaut Adopts 3DEXPERIENCE Platform
Cybernaut
Business Values:
Solution: Creating Industry Parks in several cities and
deploying the 3DEXPERIENCE platform in order to:
- Support the faster development of Small and
Mid-size Business
- Develop education and cultivate 3D talents
- Contribute to building a number of smart
cities
3DEXPERIENCE Platform
including 3DEXPERIENCity
Zhu Min, President of Cybernaut
“We wish to enhance
the public’s
awareness of the
value and advantages
of 3D technology and
big data to push the
technology and
service innovation of
China for Made in
China 2025.”
18
Q3 16 Business Review
SOLIDWORKS
3DEXPERIENCE
3DEXPERIENCity
Industries
19
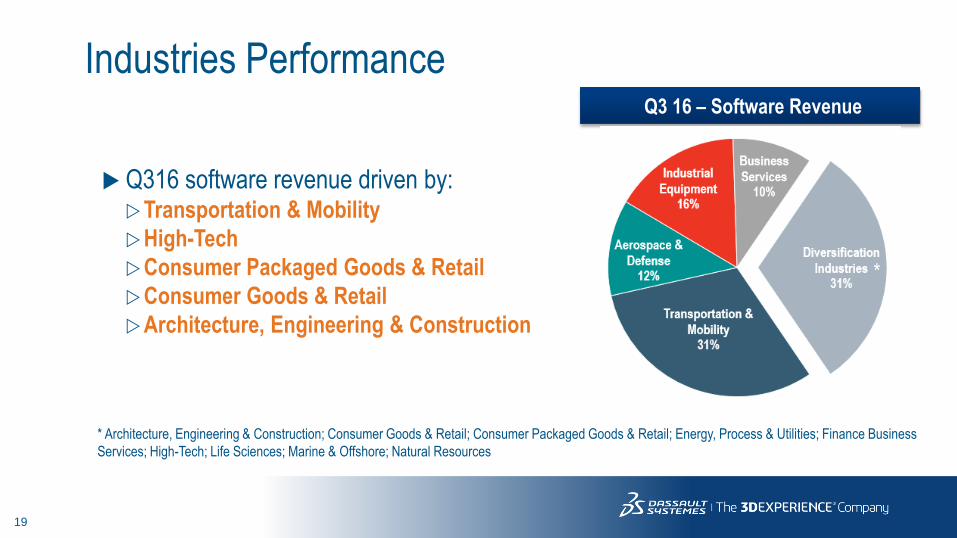
Industries Performance
Q316 software revenue driven by: Transportation & Mobility
High-Tech
Consumer Packaged Goods & Retail
Consumer Goods & Retail
Architecture, Engineering & Construction
Q3 16 – Software Revenue
* Architecture, Engineering & Construction; Consumer Goods & Retail; Consumer Packaged Goods & Retail; Energy, Process & Utilities; Finance Business
Services; High-Tech; Life Sciences; Marine & Offshore; Natural Resources
*
20
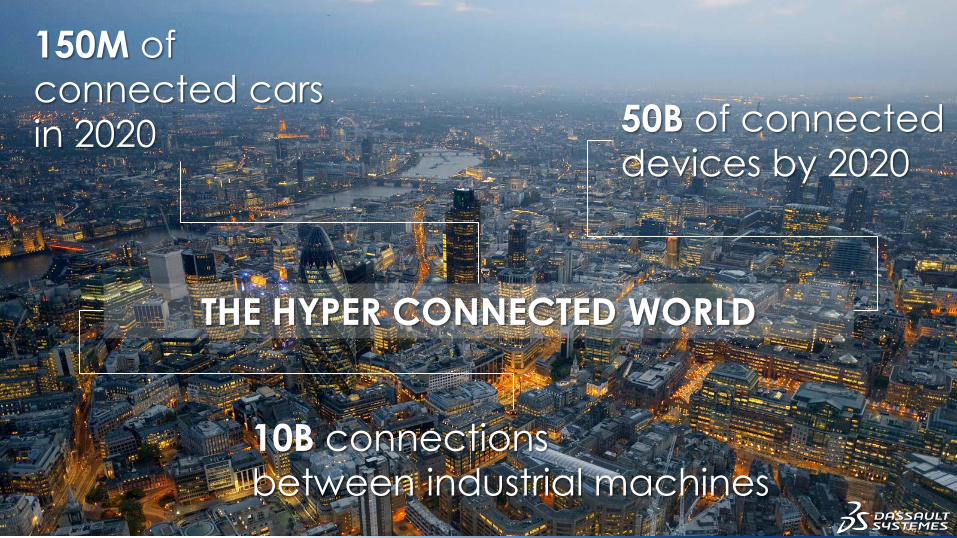
THE HYPER CONNECTED WORLD
150M of
connected cars
in 2020 50B of connected
devices by 2020
10B connections
between industrial machines
21
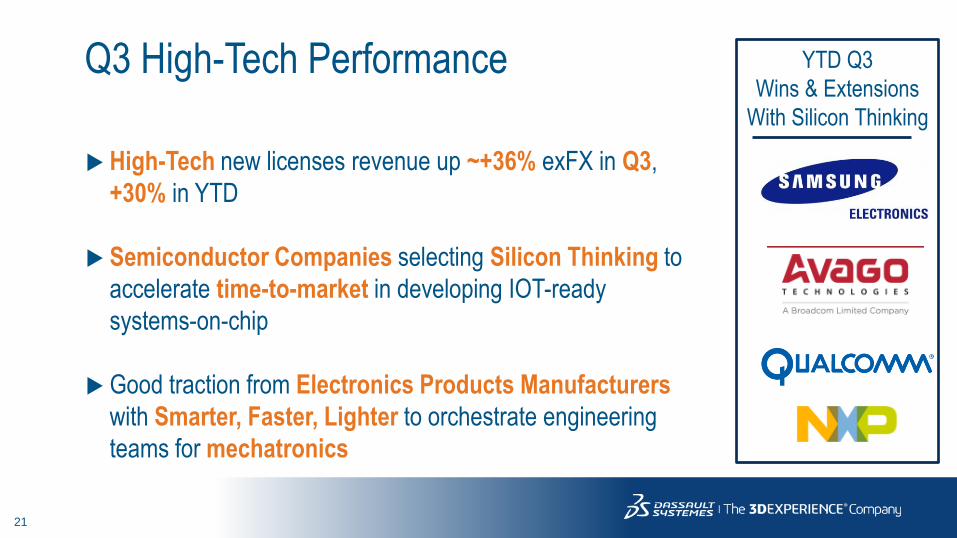
Q3 High-Tech Performance
High-Tech new licenses revenue up ~+36% exFX in Q3,
+30% in YTD
Semiconductor Companies selecting Silicon Thinking to
accelerate time-to-market in developing IOT-ready
systems-on-chip
Good traction from Electronics Products Manufacturers
with Smarter, Faster, Lighter to orchestrate engineering
teams for mechatronics
YTD Q3
Wins & Extensions
With Silicon Thinking

22
Closing CST Acquisition
Acquisition completed on September 30, 2016
Paid ~€220m in cash
CST enabling electromagnetic simulation to
be integrated in Industry Solution Experiences for
multi-physics and multi-scale simulation
Eliminating electromagnetic interference
Ensuring connectivity under all operating conditions
Electromagnetism is fundamental to
harmonize Product, Nature and Life

23
24
1
Q3 16 Financial Highlights
2
Q3 16 Business Review
3 Q4 & FY16 Financial Objectives
4 Financial Information Appendix
Agenda

25
Software Revenue Growth Non-IFRS
Software revenue up 7% exFX in Q3 16 driven by good recurring revenue benefiting from recoveries
New Licenses Revenue
+3.1%
+3% ex FX
+8.1%
+6% ex FX
Recurring and Other Software Revenue
+6.4%
+8% ex FX
+7.1%
+8% ex FX

26
Service Revenue & Margin Evolution Non-IFRS
Service Revenue
Serv. Gross Margin 11.6% 9.2% 13.5% 15.8%
+2.9%
+3% ex FX
+6.2%
+6% ex FX
27
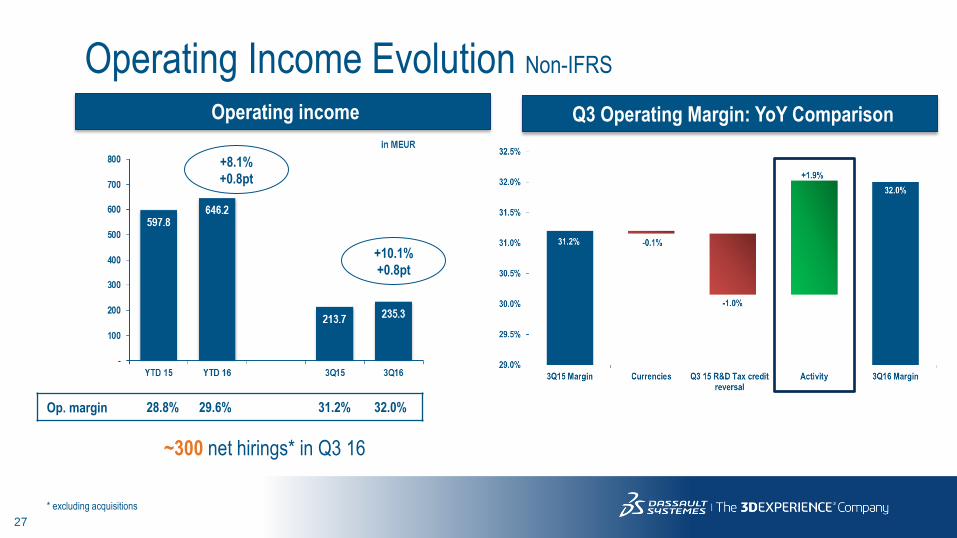
Operating Income Evolution Non-IFRS
Operating income
+8.1%
+0.8pt
+10.1%
+0.8pt
Op. margin 28.8% 29.6% 31.2% 32.0%
Q3 Operating Margin: YoY Comparison
~300 net hirings* in Q3 16
* excluding acquisitions

28
1.54
1.71
0.58 0.63
-
0.20
0.40
0.60
0.80
1.00
1.20
1.40
1.60
1.80
YTD 15 YTD 16 3Q15 3Q16
in EUR
Diluted EPS
EPS Non-IFRS
Excluding one-off impacts, Q3 16 EPS up 17%
+11%
+9%
Q3 EPS: YoY Comparison
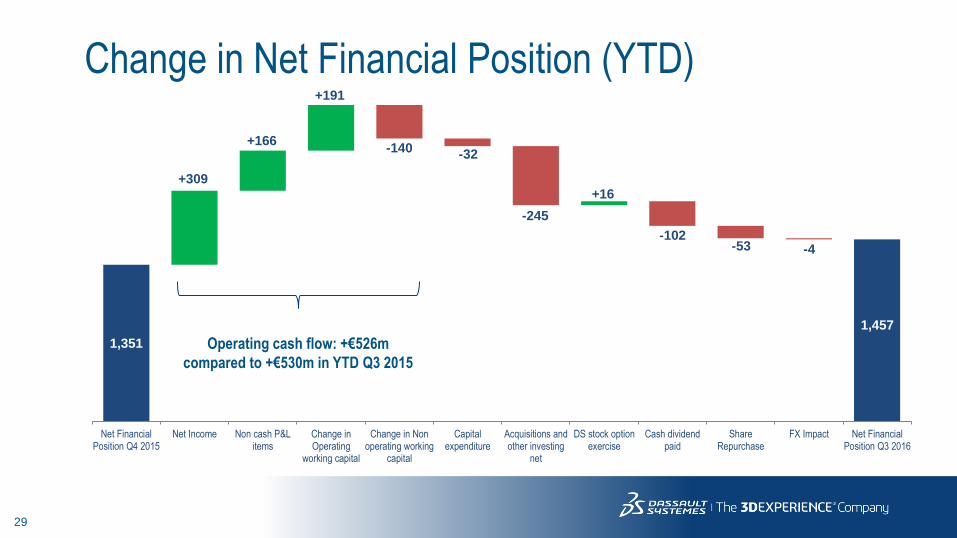
29
1,351
+309
+166
+191
-140 -32
-245
+16
-102 -53 -4
1,457
Net FinancialPosition Q4 2015
Net Income Non cash P&Litems
Change inOperating
working capital
Change in Nonoperating working
capital
Capitalexpenditure
Acquisitions andother investing
net
DS stock optionexercise
Cash dividendpaid
ShareRepurchase
FX Impact Net FinancialPosition Q3 2016
Change in Net Financial Position (YTD)
Operating cash flow: +€526m
compared to +€530m in YTD Q3 2015

30
Operating Cash Flow Evolution IFRS
€ million Q3 16 Q3 15 Changes
Operating Cash Flow +77 +113 -36
Net income adjusted for non cash items +187 +159 +28
Decrease in trade accounts receivable +91 +38 +53 Trade accounts receivable up 5% exFX* compared to Q3 15
(Decrease) in unearned revenue -137 -101 -36 Unearned revenue up 7% exFX** compared to Q3 15
Increase in accrued compensation +1 +21 -20 Timing impact on payments of salaries
Increase (Decrease) in accounts payable +5 -18 +23
(Decrease) Increase in income taxes payable -43 +37 -80 Higher downpayments in Q3 16 and timing impact of tax refunds
Other -27 -23 -4
* excluding impact of changes in scope
** excluding impact of purchase accounting on acquisitions

31
1
Q3 16 Financial Highlights
2
Q3 16 Business Review
3 Q4 & FY16 Financial Objectives
4 Financial Information Appendix
Agenda

32
Objectives Changes: July to October Non-IFRS
Adding CST acquisition
Taking into account Q3 positive currency impact
Updating GBP for Q4 (from 0.90 per €1.00 in July 0.95 in October)
Keeping US$ and JPY unchanged for Q4 (US$ 1.15 per €1.00, JPY 120.0 per €1.00)
Narrowing FY revenue range from €25 to €15 million
New revenue range at €3.015 to €3.030 billion
Low end unchanged from activity stand-point
Mid point lowered by €5 million from activity stand-point
EPS upgraded from €2.40 to €2.40-2.45

33
Objectives Changes: July to October Non-IFRS
Revenue variation
exFX Growth: +6-7% +6-7%

34
Proposed objectives Non-IFRS
Q4 2016:
• Software revenue up ~7-9% exFX
• New licenses revenue up ~8-12% exFX
• Recurring revenue up ~7-8% exFX
• Operating margin down ~0.5 point exFX at
mid-point, reflecting recruitments in Sales
and R&D and by marketing programs
• EPS reflecting heavy currency headwinds
(~6 points) FY 2016:
• Software revenue up ~7% exFX
• Tax rate below last year by ~2.5 points
• EPS up +9-11% exFX
Q4 2016 FY 2016
Revenue (M€) 832-847 3,015-3,030
Growth +4-6% +5%
Growth exFX +7-9% +6-7%
Software Growth exFX +7-9% +7%
Operating Margin 33-35% ~31.0%
Operating Margin Growth -3 to -1pt Stable
EPS (€) 0.69-0.74 2.40-2.45
EPS Growth -3 to +4% +7-9%
€/$ rates 1.15 1.12
€/¥ rates 120.0 120.8

35
1
Q3 16 Financial Highlights
2
Q3 16 Business Review
3 Q4 & FY16 Financial Objectives
4 Financial Information Appendix
Agenda
36
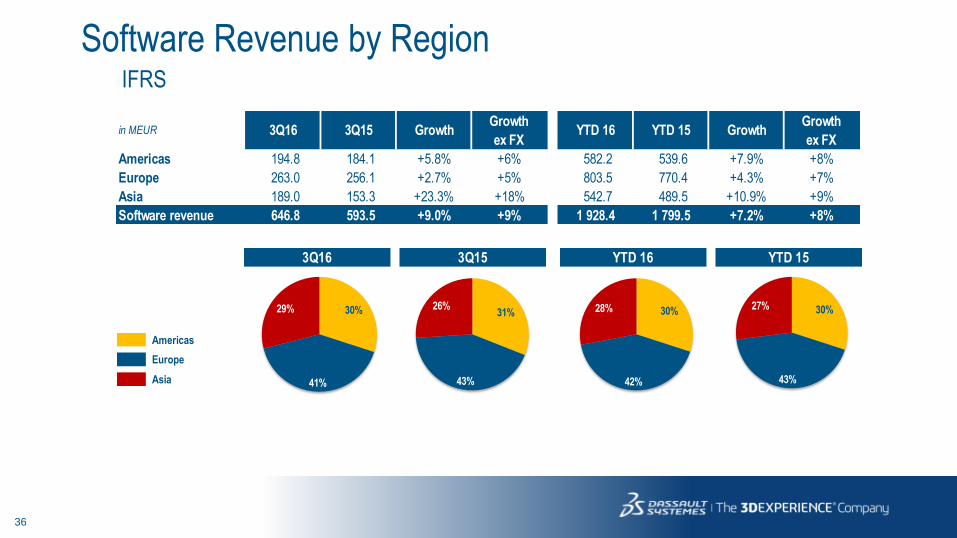
Software Revenue by Region IFRS
Americas
Europe
Asia
in MEUR 3Q16 3Q15 GrowthGrowth
ex FXYTD 16 YTD 15 Growth
Growth
ex FX
Americas 194.8 184.1 +5.8% +6% 582.2 539.6 +7.9% +8%
Europe 263.0 256.1 +2.7% +5% 803.5 770.4 +4.3% +7%
Asia 189.0 153.3 +23.3% +18% 542.7 489.5 +10.9% +9%
Software revenue 646.8 593.5 +9.0% +9% 1 928.4 1 799.5 +7.2% +8%
3Q16 3Q15
30%
41%
29% 31%
43%
26%
YTD 16 YTD 15
30%
42%
28% 30%
43%
27%

37
Software Revenue by Region Non-IFRS
Americas
Europe
Asia
in MEUR 3Q16 3Q15 GrowthGrowth
ex FXYTD 16 YTD 15 Growth
Growth
ex FX
Americas 194.8 189.3 +2.9% +3% 583.2 555.3 +5.0% +6%
Europe 263.3 258.9 +1.7% +4% 804.2 780.1 +3.1% +6%
Asia 189.0 154.6 +22.3% +17% 543.0 493.8 +10.0% +8%
Software revenue 647.1 602.8 +7.3% +7% 1 930.4 1 829.2 +5.5% +6%
3Q16 3Q15
30%
41%
29% 31%
43%
26%
YTD 16 YTD 15
30%
42%
28% 30%
43%
27%
38
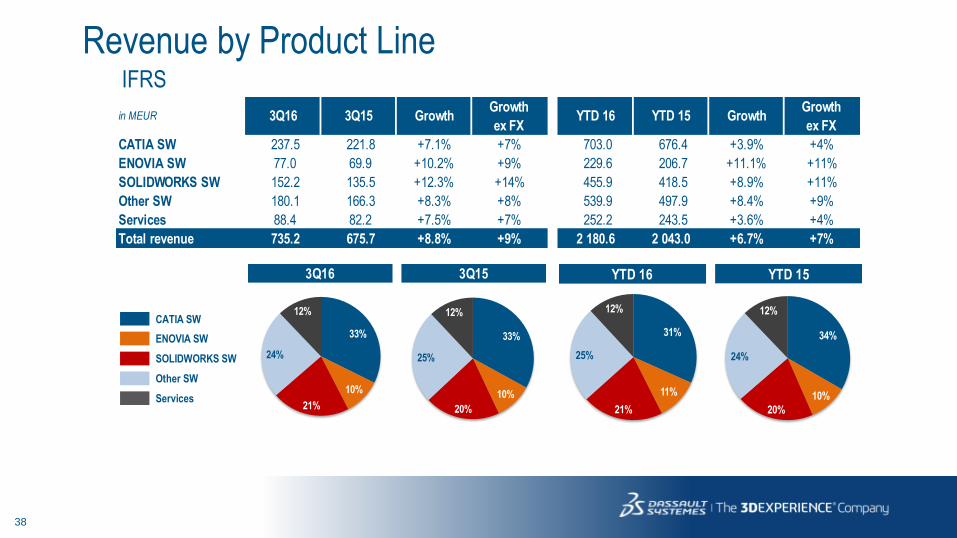
Revenue by Product Line IFRS
CATIA SW
ENOVIA SW
SOLIDWORKS SW
Other SW
Services
in MEUR 3Q16 3Q15 GrowthGrowth
ex FXYTD 16 YTD 15 Growth
Growth
ex FX
CATIA SW 237.5 221.8 +7.1% +7% 703.0 676.4 +3.9% +4%
ENOVIA SW 77.0 69.9 +10.2% +9% 229.6 206.7 +11.1% +11%
SOLIDWORKS SW 152.2 135.5 +12.3% +14% 455.9 418.5 +8.9% +11%
Other SW 180.1 166.3 +8.3% +8% 539.9 497.9 +8.4% +9%
Services 88.4 82.2 +7.5% +7% 252.2 243.5 +3.6% +4%
Total revenue 735.2 675.7 +8.8% +9% 2 180.6 2 043.0 +6.7% +7%
3Q16 3Q15
33%
10%
21%
24%
12%
33%
10%
20%
25%
12%
YTD 16 YTD 15
31%
11%
21%
25%
12%
34%
10%
20%
24%
12%

39
Non-IFRS
Revenue by Product Line
CATIA SW
ENOVIA SW
SOLIDWORKS SW
Other SW
Services
in MEUR 3Q16 3Q15 GrowthGrowth
ex FXYTD 16 YTD 15 Growth
Growth
ex FX
CATIA SW 237.5 221.8 +7.1% +7% 703.0 676.4 +3.9% +4%
ENOVIA SW 77.0 69.9 +10.2% +9% 229.6 206.7 +11.1% +11%
SOLIDWORKS SW 152.2 135.5 +12.3% +14% 455.9 418.5 +8.9% +11%
Other SW 180.4 175.6 +2.7% +2% 541.9 527.6 +2.7% +3%
Services 88.4 83.2 +6.2% +6% 252.6 245.4 +2.9% +3%
Total revenue 735.5 686.0 +7.2% +7% 2 183.0 2 074.6 +5.2% +6%
3Q16 3Q15
32%
10%
21%
25%
12%
32%
10%
20%
26%
12%
YTD 16 YTD 15
31%
11%
21%
25%
12%
33%
10%
20%
25%
12%

40
Software Revenue Evolution
Recurring
Non-recurring
Non-IFRS
72% 73%
75% 75%
28%27%
25% 25%
-
500
1 000
1 500
2 000
2 500
YTD 15 YTD 16 3Q15 3Q16
41
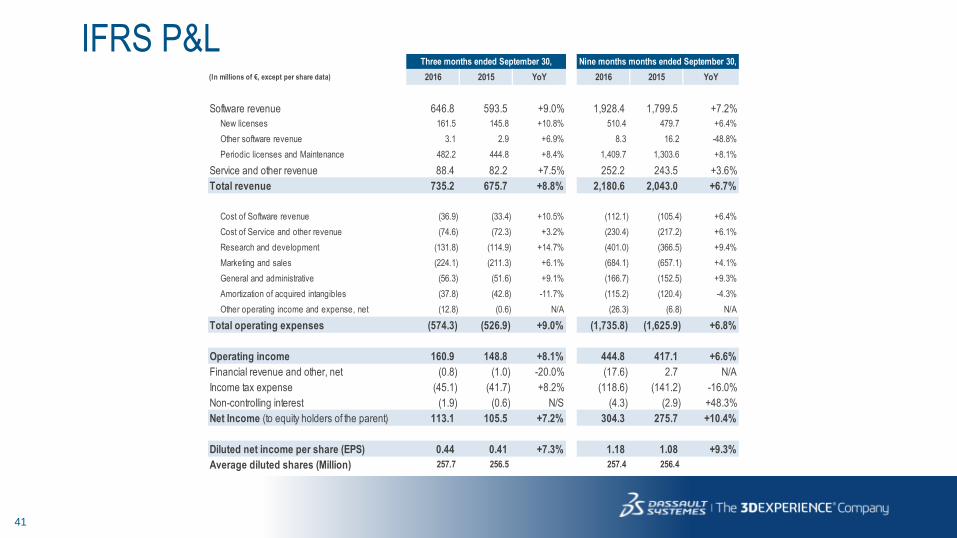
IFRS P&L Three months ended September 30, Nine months months ended September 30,
(In millions of €, except per share data) 2016 2015 YoY 2016 2015 YoY
Software revenue 646.8 593.5 +9.0% 1,928.4 1,799.5 +7.2%
New licenses 161.5 145.8 +10.8% 510.4 479.7 +6.4%
Other software revenue 3.1 2.9 +6.9% 8.3 16.2 -48.8%
Periodic licenses and Maintenance 482.2 444.8 +8.4% 1,409.7 1,303.6 +8.1%
Service and other revenue 88.4 82.2 +7.5% 252.2 243.5 +3.6%
Total revenue 735.2 675.7 +8.8% 2,180.6 2,043.0 +6.7%
Cost of Software revenue (36.9) (33.4) +10.5% (112.1) (105.4) +6.4%
Cost of Service and other revenue (74.6) (72.3) +3.2% (230.4) (217.2) +6.1%
Research and development (131.8) (114.9) +14.7% (401.0) (366.5) +9.4%
Marketing and sales (224.1) (211.3) +6.1% (684.1) (657.1) +4.1%
General and administrative (56.3) (51.6) +9.1% (166.7) (152.5) +9.3%
Amortization of acquired intangibles (37.8) (42.8) -11.7% (115.2) (120.4) -4.3%
Other operating income and expense, net (12.8) (0.6) N/A (26.3) (6.8) N/A
Total operating expenses (574.3) (526.9) +9.0% (1,735.8) (1,625.9) +6.8%
Operating income 160.9 148.8 +8.1% 444.8 417.1 +6.6%
Financial revenue and other, net (0.8) (1.0) -20.0% (17.6) 2.7 N/A
Income tax expense (45.1) (41.7) +8.2% (118.6) (141.2) -16.0%
Non-controlling interest (1.9) (0.6) N/S (4.3) (2.9) +48.3%
Net Income (to equity holders of the parent) 113.1 105.5 +7.2% 304.3 275.7 +10.4%
Diluted net income per share (EPS) 0.44 0.41 +7.3% 1.18 1.08 +9.3%
Average diluted shares (Million) 257.7 256.5 257.4 256.4

42
IFRS P&L (%) Three months ended September 30, Nine months months ended September 30,
2016 2015 2016 2015
% of revenue % of revenue
Software revenue 88.0% 87.8% 88.4% 88.1%
New licenses 22.0% 21.6% 23.4% 23.5%
Other software revenue 0.4% 0.4% 0.4% 0.8%
Periodic licenses and Maintenance 65.6% 65.8% 64.6% 63.8%
Service and other revenue 12.0% 12.2% 11.6% 11.9%
Total revenue 100.0% 100.0% 100.0% 100.0%
Cost of Software revenue 5.0% 4.9% 5.1% 5.2%
Cost of Service and other revenue 10.1% 10.7% 10.6% 10.6%
Research and development 17.9% 17.0% 18.4% 17.9%
Marketing and sales 30.5% 31.3% 31.4% 32.2%
General and administrative 7.7% 7.6% 7.6% 7.5%
Amortization of acquired intangibles 5.1% 6.3% 5.3% 5.9%
Other operating income and expense, net 1.7% 0.1% 1.2% 0.3%
Total operating expenses 78.1% 78.0% 79.6% 79.6%
Operating income 21.9% 22.0% 20.4% 20.4%
Financial revenue and other, net -0.1% -0.1% -0.8% 0.1%
Income tax rate (% of IBIT) 28.2% 28.3% 27.8% 33.6%
Non-controlling interest -0.3% -0.1% -0.2% -0.1%
Net Income (to equity holders of the parent) 15.4% 15.6% 14.0% 13.5%

43
Non-IFRS P&L Three months ended September 30, Nine months months ended September 30,
(In millions of €, except per share data) 2016 2015 YoY 2016 2015 YoY
Software revenue 647.1 602.8 +7.3% 1,930.4 1,829.2 +5.5%New licenses 161.5 149.4 +8.1% 511.0 495.8 +3.1%
Other software revenue 3.1 2.9 +6.9% 8.3 16.2 -48.8%
Periodic licenses and Maintenance 482.5 450.5 +7.1% 1,411.1 1,317.2 +7.1%
Service and other revenue 88.4 83.2 +6.2% 252.6 245.4 +2.9%
Total revenue 735.5 686.0 +7.2% 2,183.0 2,074.6 +5.2%
Cost of Software revenue (36.5) (33.2) +9.9% (111.1) (105.1) +5.7%
Cost of Service and other revenue (74.4) (72.0) +3.3% (229.4) (216.9) +5.8%
Research and development (121.8) (110.3) +10.4% (377.1) (357.5) +5.5%
Marketing and sales (216.8) (207.5) +4.5% (665.0) (649.0) +2.5%
General and administrative (50.7) (49.3) +2.8% (154.2) (148.3) +4.0%
Total operating expenses (500.2) (472.3) +5.9% (1,536.8) (1,476.8) +4.1%
Operating income 235.3 213.7 +10.1% 646.2 597.8 +8.1%
Financial revenue and other, net (1.2) (1.0) +20.0% (6.2) 2.7 N/A
Income tax expense (70.6) (63.6) +11.0% (196.7) (202.1) -2.7%
Non-controlling interest (1.9) (0.6) N/S (4.3) (2.9) +48.3%
Net Income (to equity holders of the parent) 161.6 148.5 +8.8% 439.0 395.5 +11.0%
Diluted net income per share (EPS) 0.63 0.58 +8.6% 1.71 1.54 +11.0%
Average diluted shares (Million) 257.7 256.5 257.4 256.4
44
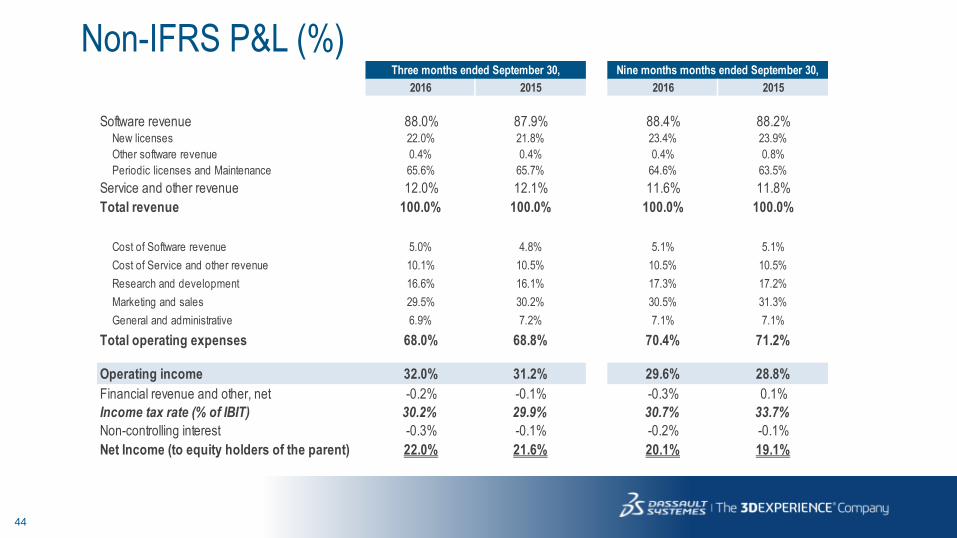
Non-IFRS P&L (%) Three months ended September 30, Nine months months ended September 30,
2016 2015 2016 2015
Software revenue 88.0% 87.9% 88.4% 88.2%New licenses 22.0% 21.8% 23.4% 23.9%
Other software revenue 0.4% 0.4% 0.4% 0.8%
Periodic licenses and Maintenance 65.6% 65.7% 64.6% 63.5%
Service and other revenue 12.0% 12.1% 11.6% 11.8%
Total revenue 100.0% 100.0% 100.0% 100.0%
Cost of Software revenue 5.0% 4.8% 5.1% 5.1%
Cost of Service and other revenue 10.1% 10.5% 10.5% 10.5%
Research and development 16.6% 16.1% 17.3% 17.2%
Marketing and sales 29.5% 30.2% 30.5% 31.3%
General and administrative 6.9% 7.2% 7.1% 7.1%
Total operating expenses 68.0% 68.8% 70.4% 71.2%
Operating income 32.0% 31.2% 29.6% 28.8%
Financial revenue and other, net -0.2% -0.1% -0.3% 0.1%
Income tax rate (% of IBIT) 30.2% 29.9% 30.7% 33.7%
Non-controlling interest -0.3% -0.1% -0.2% -0.1%
Net Income (to equity holders of the parent) 22.0% 21.6% 20.1% 19.1%

45
Revenue and Gross Margin
IFRS – Non-IFRS Reconciliation QTD
(€ million, except % and per share data) 2016 IFRSAdjustment
(1)
2016
Non-IFRS2015 IFRS
Adjustment
(1)
2015
Non-IFRSIFRS Non-IFRS
Total Revenue 735.2 0.3 735.5 675.7 10.3 686.0 8.8% 7.2%
Total Revenue breakdown by activity
Software revenue 646.8 0.3 647.1 593.5 9.3 602.8 9.0% 7.3%
New Licenses revenue 161.5 161.5 145.8 3.6 149.4 10.8% 8.1%
Other software revenue 3.1 3.1 2.9 2.9 6.9% 6.9%
Periodic and Maintenance revenue 482.2 0.3 482.5 444.8 5.7 450.5 8.4% 7.1%
Recurring portion of Software revenue 75% 75% 75% 75%
Service and other revenue 88.4 88.4 82.2 1.0 83.2 7.5% 6.2%
Total Revenue breakdown by product line
CATIA SW revenue 237.5 237.5 221.8 221.8 7.1% 7.1%
ENOVIA SW revenue 77.0 77.0 69.9 69.9 10.2% 10.2%
SOLIDWORKS SW revenue 152.2 152.2 135.5 135.5 12.3% 12.3%
Other SW revenue 180.1 0.3 180.4 166.3 9.3 175.6 8.3% 2.7%
Service and other revenue 88.4 88.4 82.2 1.0 83.2 7.5% 6.2%
Total Revenue breakdown by geography
Americas revenue 225.4 225.4 218.7 5.7 224.4 3.1% 0.4%
Europe revenue 302.1 0.3 302.4 291.5 3.1 294.6 3.6% 2.6%
Asia revenue 207.7 207.7 165.5 1.5 167.0 25.5% 24.4%
Gross Margin
Cost of Software revenue ( 36.9) 0.4 ( 36.5) ( 33.4) 0.2 ( 33.2) 10.5% 9.9%
Software Gross margin* 94.3% 94.4% 94.4% 94.5%
Cost of Service and other revenue ( 74.6) 0.2 ( 74.4) ( 72.3) 0.3 ( 72.0) 3.2% 3.3%
Service Gross margin 15.6% 15.8% 12.0% 13.5%
Three months ended September 30, Increase (Decrease)

46
Expenses & Earnings
IFRS – Non-IFRS Reconciliation QTD
(€ million)
2016 IFRS Adjust.2016
Non-IFRS2015 IFRS Adjust.
2015
Non-IFRS
Cost of revenue ( 111.5) 0.6 ( 110.9) ( 105.7) 0.5 ( 105.2)
Research and development ( 131.8) 10.0 ( 121.8) ( 114.9) 4.6 ( 110.3)
Marketing and sales ( 224.1) 7.3 ( 216.8) ( 211.3) 3.8 ( 207.5)
General and administrative ( 56.3) 5.6 ( 50.7) ( 51.6) 2.3 ( 49.3)
Total Share-based compensation expense 23.5 11.2
Three months ended September 30,
(€ million, except % and per share data) 2016 IFRSAdjustment
(1)
2016
Non-IFRS2015 IFRS
Adjustment
(1)
2015
Non-IFRSIFRS Non-IFRS
Total Operating Expenses ( 574.3) 74.1 ( 500.2) ( 526.9) 54.6 ( 472.3) 9.0% 5.9%
Share-based compensation expense ( 23.5) 23.5 - ( 11.2) 11.2 -
Amortization of acquired intangibles ( 37.8) 37.8 - ( 42.8) 42.8 -
Other operating income and expense, net ( 12.8) 12.8 - ( 0.6) 0.6 -
Operating Income 160.9 74.4 235.3 148.8 64.9 213.7 8.1% 10.1%
Operating Margin 21.9% 32.0% 22.0% 31.2%
Financial revenue & other, net ( 0.8) ( 0.4) ( 1.2) ( 1.0) ( 1.0) -20.0% 20.0%
Income tax expense ( 45.1) ( 25.5) ( 70.6) ( 41.7) ( 21.9) ( 63.6) 8.2% 11.0%
Non-controlling interest ( 1.9) ( 1.9) ( 0.6) ( 0.6) 216.7% 216.7%
Net Income attributable to shareholders 113.1 48.5 161.6 105.5 43.0 148.5 7.2% 8.8%
Diluted net income per share, in EUR 0.44 0.19 0.63 0.41 0.17 0.58 7.3% 8.6%
Three months ended September 30, Increase (Decrease)
47
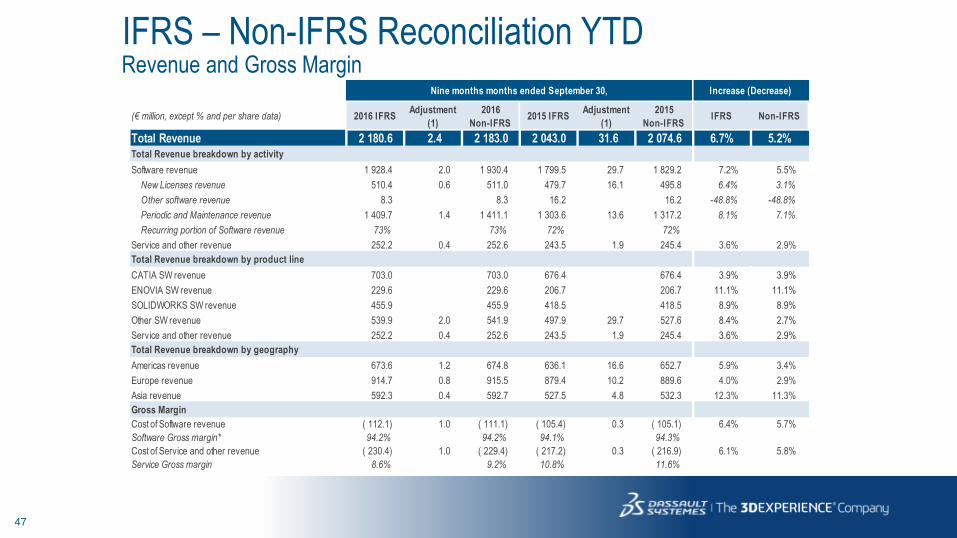
Revenue and Gross Margin
IFRS – Non-IFRS Reconciliation YTD
(€ million, except % and per share data) 2016 IFRSAdjustment
(1)
2016
Non-IFRS2015 IFRS
Adjustment
(1)
2015
Non-IFRSIFRS Non-IFRS
Total Revenue 2 180.6 2.4 2 183.0 2 043.0 31.6 2 074.6 6.7% 5.2%
Total Revenue breakdown by activity
Software revenue 1 928.4 2.0 1 930.4 1 799.5 29.7 1 829.2 7.2% 5.5%
New Licenses revenue 510.4 0.6 511.0 479.7 16.1 495.8 6.4% 3.1%
Other software revenue 8.3 8.3 16.2 16.2 -48.8% -48.8%
Periodic and Maintenance revenue 1 409.7 1.4 1 411.1 1 303.6 13.6 1 317.2 8.1% 7.1%
Recurring portion of Software revenue 73% 73% 72% 72%
Service and other revenue 252.2 0.4 252.6 243.5 1.9 245.4 3.6% 2.9%
Total Revenue breakdown by product line
CATIA SW revenue 703.0 703.0 676.4 676.4 3.9% 3.9%
ENOVIA SW revenue 229.6 229.6 206.7 206.7 11.1% 11.1%
SOLIDWORKS SW revenue 455.9 455.9 418.5 418.5 8.9% 8.9%
Other SW revenue 539.9 2.0 541.9 497.9 29.7 527.6 8.4% 2.7%
Service and other revenue 252.2 0.4 252.6 243.5 1.9 245.4 3.6% 2.9%
Total Revenue breakdown by geography
Americas revenue 673.6 1.2 674.8 636.1 16.6 652.7 5.9% 3.4%
Europe revenue 914.7 0.8 915.5 879.4 10.2 889.6 4.0% 2.9%
Asia revenue 592.3 0.4 592.7 527.5 4.8 532.3 12.3% 11.3%
Gross Margin
Cost of Software revenue ( 112.1) 1.0 ( 111.1) ( 105.4) 0.3 ( 105.1) 6.4% 5.7%
Software Gross margin* 94.2% 94.2% 94.1% 94.3%
Cost of Service and other revenue ( 230.4) 1.0 ( 229.4) ( 217.2) 0.3 ( 216.9) 6.1% 5.8%
Service Gross margin 8.6% 9.2% 10.8% 11.6%
Nine months months ended September 30, Increase (Decrease)

48
Expenses & Earnings
IFRS – Non-IFRS Reconciliation YTD
(€ million, except % and per share data) 2016 IFRSAdjustment
(1)
2016
Non-IFRS2015 IFRS
Adjustment
(1)
2015
Non-IFRSIFRS Non-IFRS
Total Operating Expenses (1 735.8) 199.0 (1 536.8) (1 625.9) 149.1 (1 476.8) 6.8% 4.1%
Share-based compensation expense ( 57.5) 57.5 - ( 21.9) 21.9 -
Amortization of acquired intangibles ( 115.2) 115.2 - ( 120.4) 120.4 -
Other operating income and expense, net ( 26.3) 26.3 - ( 6.8) 6.8 -
Operating Income 444.8 201.4 646.2 417.1 180.7 597.8 6.6% 8.1%
Operating Margin 20.4% 29.6% 20.4% 28.8%
Financial revenue & other, net ( 17.6) 11.4 ( 6.2) 2.7 2.7 - -
Income tax expense ( 118.6) ( 78.1) ( 196.7) ( 141.2) ( 60.9) ( 202.1) -16.0% -2.7%
Non-controlling interest ( 4.3) ( 4.3) ( 2.9) ( 2.9) 48.3% 48.3%
Net Income attributable to shareholders 304.3 134.7 439.0 275.7 119.8 395.5 10.4% 11.0%
Diluted net income per share, in EUR 1.18 0.53 1.71 1.08 0.46 1.54 9.3% 11.0%
Nine months months ended September 30, Increase (Decrease)
(€ million)
2016 IFRS Adjust.2016
Non-IFRS2015 IFRS Adjust.
2015
Non-IFRS
Cost of revenue ( 342.5) 2.0 ( 340.5) ( 322.6) 0.6 ( 322.0)
Research and development ( 401.0) 23.9 ( 377.1) ( 366.5) 9.0 ( 357.5)
Marketing and sales ( 684.1) 19.1 ( 665.0) ( 657.1) 8.1 ( 649.0)
General and administrative ( 166.7) 12.5 ( 154.2) ( 152.5) 4.2 ( 148.3)
Total Share-based compensation expense 57.5 21.9
Nine months months ended September 30,
49
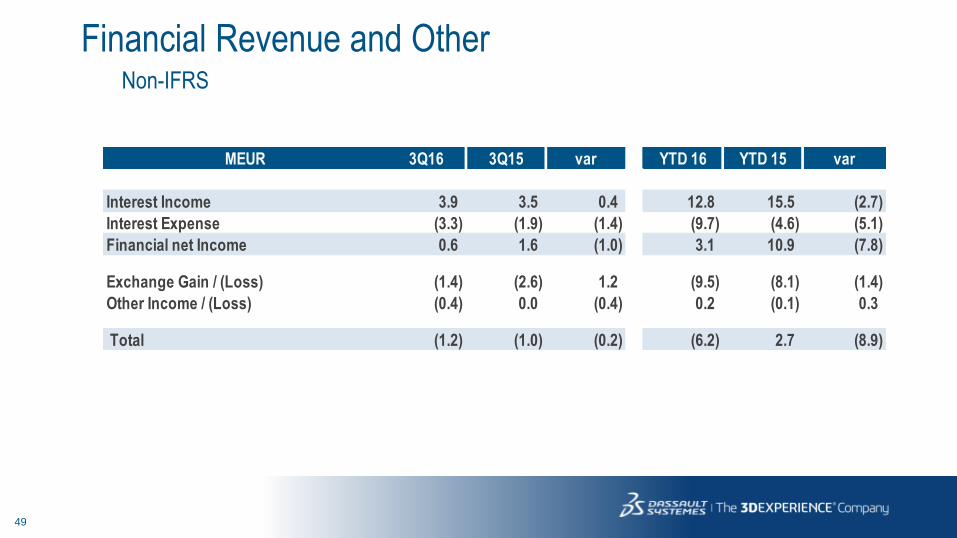
Non-IFRS
Financial Revenue and Other
MEUR 3Q16 3Q15 var YTD 16 YTD 15 var
Interest Income 3.9 3.5 0.4 12.8 15.5 (2.7)
Interest Expense (3.3) (1.9) (1.4) (9.7) (4.6) (5.1)
Financial net Income 0.6 1.6 (1.0) 3.1 10.9 (7.8)
Exchange Gain / (Loss) (1.4) (2.6) 1.2 (9.5) (8.1) (1.4)
Other Income / (Loss) (0.4) 0.0 (0.4) 0.2 (0.1) 0.3
Total (1.2) (1.0) (0.2) (6.2) 2.7 (8.9)

50
Revenue * 2016 2015 % change
EUR/USD 1.12 1.11 +1%
EUR/JPY 114.3 135.9 -16%
EUR/USD 1.12 1.11 +1%
EUR/JPY 121.0 134.8 -10%
3Q16 3Q15
3Q15 1.12 135.9 3Q16
1.11 in average in average 114.3
in average in average
Average $/EUR rate
1.11 -> 1.12 135.9 -> 114.3
Average $/EUR rate
Operating Expenses*
35.9%
5.2%
$/EUR – 3Q16/3Q15 Variance ¥/EUR – 3Q16/3Q15 Variance
YTD
37.2%USD
JPY 13.5%
Breakdown of P&L by currency for YTD 16 Average Exchange rates
QTD
Exchange Rate evolution From assumptions to actual data

51
Non-IFRS
Comparing 3Q16 with mid-range Objectives
Revenue Operating
Expenses
Operating
Profit
Operating
Margin
3Q16 Guidances mid-range 720.0 (501.8) 218.2 30.3%
Growth YoY +5.0% +6.2% +2.1% -0.9pt
USD impact 8.0 (5.1) 2.9 +0.1pt
JPY impact including hedging 3.3 (1.3) 2.0 +0.1pt
Other currencies and other hedging
impact 5.4 (3.3) 2.1 +0.1pt
Total FX 16.7 (9.7) 7.0 +0.3pt
Activity / Cost Control / Other (1.2) 11.3 10.1 +1.4pt
Delta: Reported vs guidances 15.5 1.6 17.1 +1.7pt
3Q16 Reported 735.5 (500.2) 235.3 32.0%
Growth YoY +7.2% +5.9% +10.1% +0.8pt
3Q15 Reported 686.0 (472.3) 213.7 31.2%
52
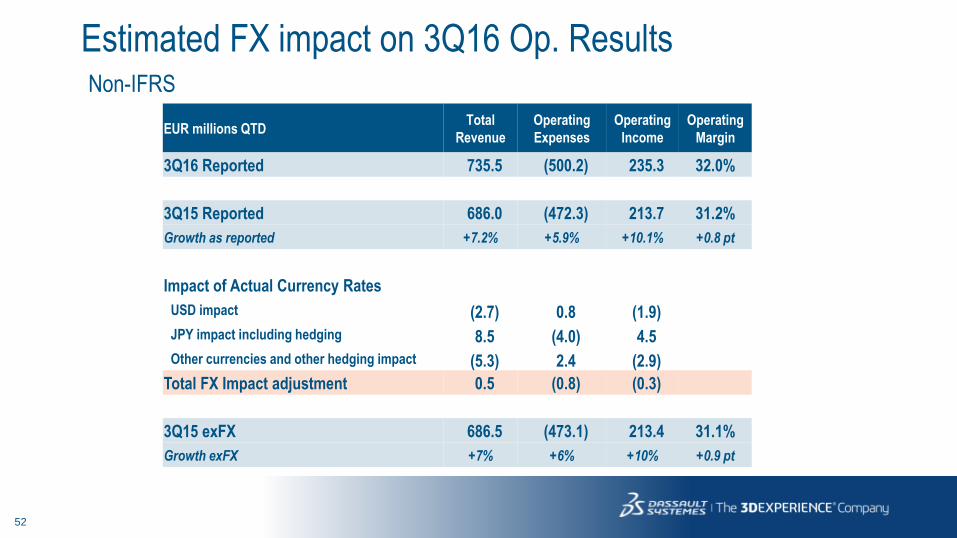
Non-IFRS
Estimated FX impact on 3Q16 Op. Results
EUR millions QTD Total
Revenue
Operating
Expenses
Operating
Income
Operating
Margin
3Q16 Reported 735.5 (500.2) 235.3 32.0%
3Q15 Reported 686.0 (472.3) 213.7 31.2%
Growth as reported +7.2% +5.9% +10.1% +0.8 pt
Impact of Actual Currency Rates
USD impact (2.7) 0.8 (1.9)
JPY impact including hedging 8.5 (4.0) 4.5
Other currencies and other hedging impact (5.3) 2.4 (2.9)
Total FX Impact adjustment 0.5 (0.8) (0.3)
3Q15 exFX 686.5 (473.1) 213.4 31.1%
Growth exFX +7% +6% +10% +0.9 pt

53
Non-IFRS
Estimated FX impact on YTD16 Op. Results
EUR millions FY Total
Revenue
Operating
Expenses
Operating
Income
Operating
Margin
YTD2016 Reported 2,183.0 (1,536.8) 646.2 29.6%
YTD2015 Reported 2,074.6 (1,476.8) 597.8 28.8%
Growth as reported +5.2% +4.1% +8.1% +0.8 pt
Impact of Actual Currency Rates
USD impact (11.0) 0.9 (10.1)
JPY impact including hedging 18.5 (7.5) 11.0
Other currencies and other hedging impact (21.8) 13.7 (8.1)
Total FX Impact adjustment (14.3) 7.1 (7.2)
YTD2015 exFX 2,060.3 (1,469.7) 590.6 28.7%
Growth exFX +6% +5% +9% +0.9 pt

54
Consolidated Statement of Cash Flows IFRS (in millions of €)
3Q16 3Q15 Variation YTD16 YTD15 Variation
Net income attributable to equity holders of the parent 113.1 105.5 7.6 304.3 275.7 28.6
Non-controlling interest 1.9 0.6 1.3 4.3 2.9 1.4
Net income 115.0 106.1 8.9 308.6 278.6 30.0
Depreciation of property & equipment 10.1 10.5 (0.4) 31.5 31.5 -
Amortization of intangible assets 39.9 45.0 (5.1) 121.6 126.7 (5.1)
Other non-cash P&L items 22.2 (2.5) 24.7 13.4 (22.8) 36.2
Changes in working capital (110.6) (45.7) (64.9) 50.6 116.2 (65.6)
Net Cash Provided by (Used in) Operating Activities (I) 76.6 113.4 (36.8) 525.7 530.2 (4.5)
Additions to property, equipment and intangibles (13.6) (12.8) (0.8) (32.0) (30.8) (1.2)
Payment for acquisition of businesses, net of cash acquired (234.7) - (234.7) (245.9) (18.1) (227.8)
Sale (Purchase) of short-term investments, net 0.7 1.4 (0.7) 20.5 17.7 2.8
Investments, loans and others - 0.3 (0.3) 0.6 (3.3) 3.9
Net Cash Provided by (Used in) Investing Activities (II) (247.6) (11.1) (236.5) (256.8) (34.5) (222.3)
Proceeds (Repayment) of short term and long term debt - - - - (10.8) 10.8
(Purchase) Sale of treasury stock (9.2) (22.9) 13.7 (52.5) (28.0) (24.5)
Proceeds from exercise of stock-options 5.4 5.5 (0.1) 15.9 25.0 (9.1)
Cash dividend paid - (2.9) 2.9 (101.9) (98.5) (3.4)
Net Cash Provided by (Used in) Financing Activities (III) (3.8) (20.3) 16.5 (138.5) (112.3) (26.2)
Effect of exchange rate changes on cash and cash equivalents (IV) (3.4) (6.1) 2.7 (3.3) 32.4 (35.7)
Increase (Decrease) in Cash (V) = (I)+(II)+(III)+(IV) (178.2) 75.9 (254.1) 127.1 415.8 (288.7)
Cash and cash equivalents at Beginning of Period 2,585.8 1,444.1 2,280.5 1,104.2
Cash and cash equivalents at End of Period 2,407.6 1,520.0 2,407.6 1,520.0
Cash and cash equivalents variation (178.2) 75.9 127.1 415.8

55
Balance Sheet
IFRS End of End of Variation End of Variation
(in millions of €) Sep-16 Jun-16 Sep-16 / Jun-16 Dec-15 Sep-16 / Dec-15
Cash and cash equivalents 2,452.9 2,585.8 -132.9 2,280.5 +172.4
Short-term investments 49.5 50.4 -0.9 70.8 -21.3
Accounts receivable, net 539.5 622.6 -83.1 739.1 -199.6
Other current assets 230.3 171.3 +59.0 150.8 +79.5
Total current assets 3,272.2 3,430.1 -157.9 3,241.2 +31.0
Property and equipment, net 130.6 128.5 +2.1 135.3 -4.7
Goodwill and Intangible assets, net 2,872.2 2,608.8 +263.4 2,687.1 +185.1
Other non current assets 320.0 323.7 -3.7 247.8 +72.2
Total Assets 6,595.0 6,491.1 +103.9 6,311.4 +283.6
Accounts payable 122.8 114.9 +7.9 119.8 +3.0
Unearned revenue 801.1 932.7 -131.6 778.0 +23.1
Other current liabilities 438.2 400.3 +37.9 414.0 +24.2
Total current liabilities 1,362.1 1,447.9 -85.8 1,311.8 +50.3
Long-term debt 1,000.0 1,000.0 0.0 1,000.0 0.0
Other non current obligations 577.3 522.6 +54.7 511.9 +65.4
Total long-term liabilities 1,577.3 1,522.6 +54.7 1,511.9 +65.4
Non-controlling interest 20.8 18.3 +2.5 19.2 +1.6
Parent Shareholders' equity 3,634.8 3,502.3 +132.5 3,468.5 +166.3
Total Liabilities and Shareholders' Equity 6,595.0 6,491.1 +103.9 6,311.4 +283.6
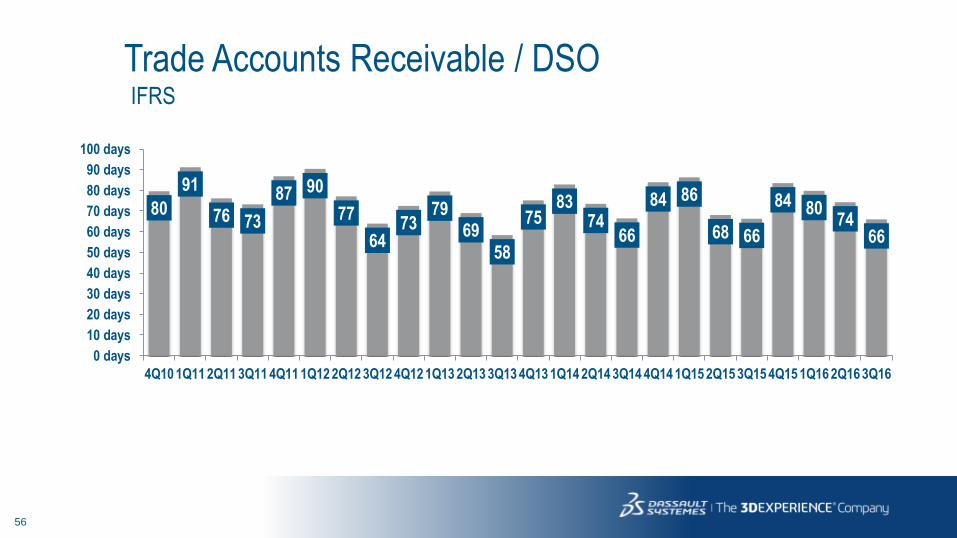
56
Trade Accounts Receivable / DSO IFRS
80
91
76 73
87 90
77
64 73
79 69
58
75 83
74 66
84 86
68 66
84 80 74
66
0 days
10 days
20 days
30 days
40 days
50 days
60 days
70 days
80 days
90 days
100 days
4Q10 1Q11 2Q11 3Q11 4Q11 1Q12 2Q12 3Q12 4Q12 1Q13 2Q13 3Q13 4Q13 1Q14 2Q14 3Q14 4Q14 1Q15 2Q15 3Q15 4Q15 1Q16 2Q16 3Q16

57
Headcount by destination
At Closing - TOTAL
3Q16 3Q15 % growth 2Q16 % growth
M&S + COR Ser 7,375 6,864 +7% 7,114 +4%
R&D + COR SW 6,235 5,755 +8% 5,976 +4%
G&A 1,311 1,194 +10% 1,220 +7%
Total 14,921 13,813 +8% 14,310 +4%

58
Accounting elements not included in the non-IFRS 2016 Objectives
IFRS 2016 Objectives
FY 2016 estimated deferred revenue write-down of ~€8m
FY 2016 estimated share-based compensation expenses, including related social charges: ~€79m
FY 2016 estimated amortization of acquired intangibles: ~€154m
The non-IFRS 2016 objectives do not include any impact from other operating income and expense, net
principally comprised of acquisition, integration and restructuring expenses, and from one-time items
included in financial revenue and one-time tax restructuring gains and losses
These estimates do not include any new stock option or share grants, or any new acquisitions or
restructurings completed after October 25, 2016

59