Embed Size (px)
Citation preview
The Power to Understand.800-211-8378 • PsychCorp.com
Sample Report
70478_DAS-II_SR_Cover_FIN 8/15/07 4:35 PM Page 1
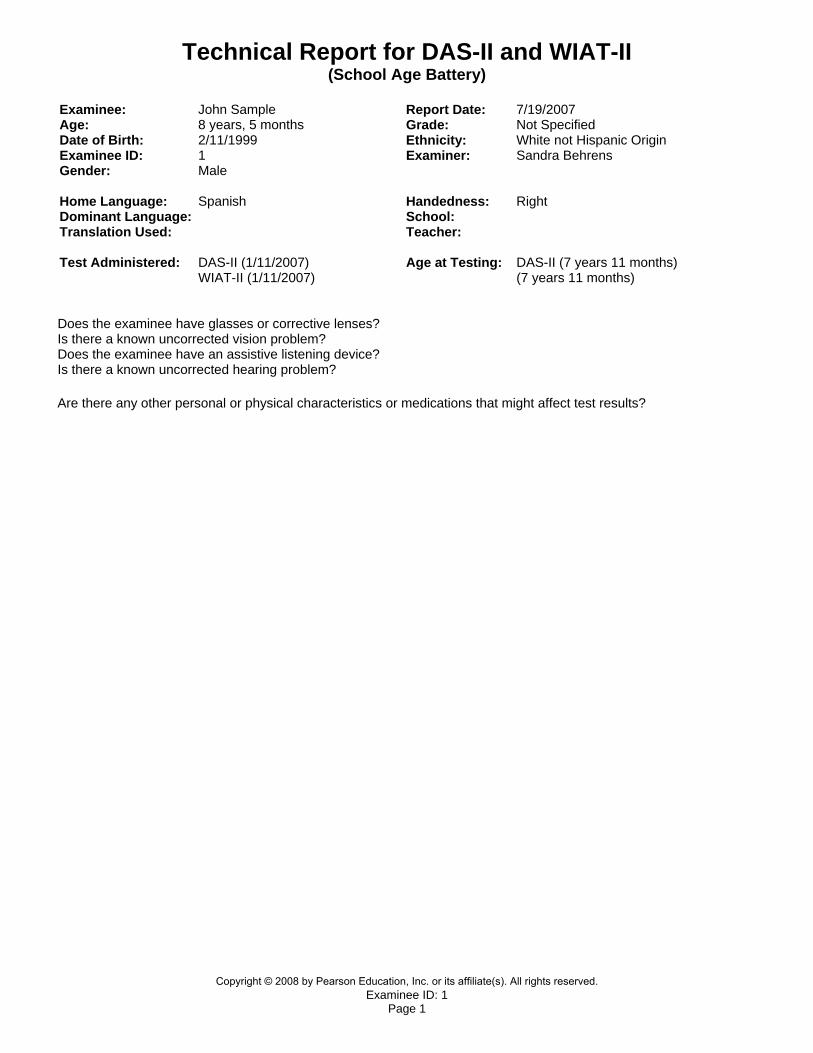
Technical Report for DAS-II and WIAT-II (School Age Battery)
Examinee ID: 1 Page 1
Examinee: John Sample Report Date: 7/19/2007 Age: 8 years, 5 months Grade: Not Specified Date of Birth: 2/11/1999 Ethnicity: White not Hispanic Origin Examinee ID: 1 Examiner: Sandra Behrens Gender: Male Home Language: Spanish Handedness: Right Dominant Language: School: Translation Used: Teacher: Test Administered: DAS-II (1/11/2007)
WIAT-II (1/11/2007) Age at Testing: DAS-II (7 years 11 months)
(7 years 11 months) Does the examinee have glasses or corrective lenses? Is there a known uncorrected vision problem? Does the examinee have an assistive listening device? Is there a known uncorrected hearing problem? Are there any other personal or physical characteristics or medications that might affect test results?
Copyright © 2008 by Pearson Education, Inc. or its affiliate(s). All rights reserved.
Technical Report for DAS-II and WIAT-II (School Age Battery)
Examinee ID: 1 Page 2
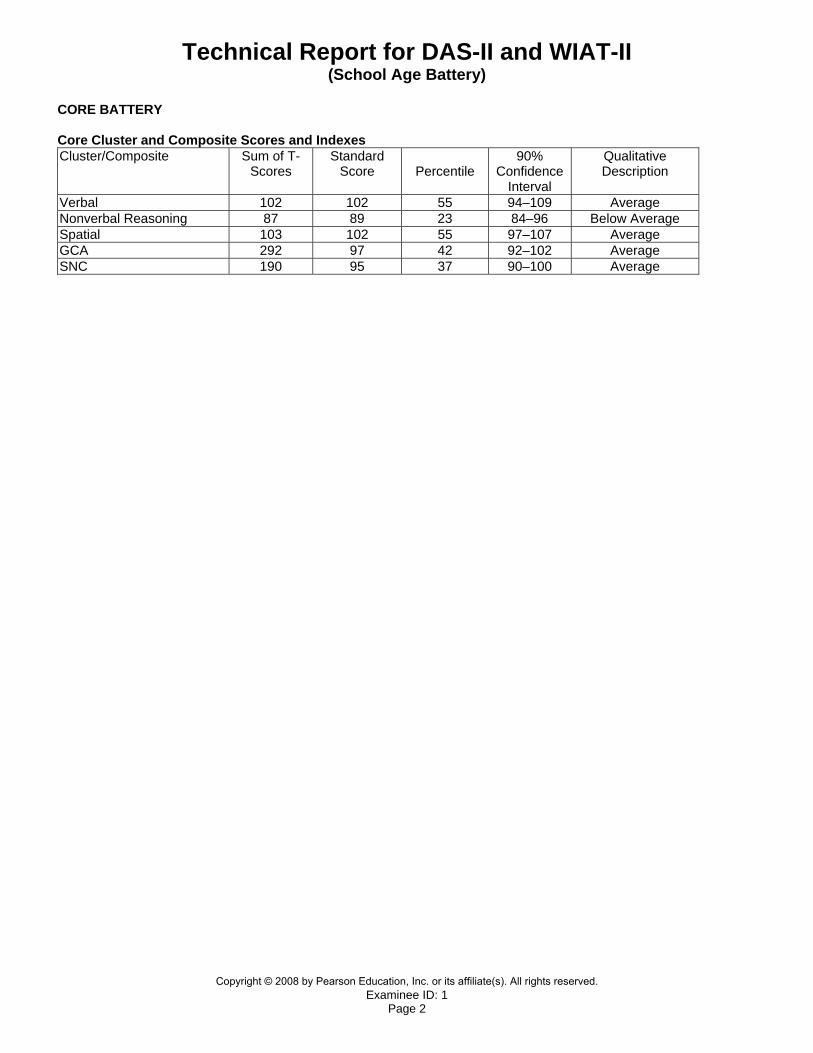
CORE BATTERY Core Cluster and Composite Scores and Indexes Cluster/Composite Sum of T-
Scores Standard
Score
Percentile 90%
Confidence Interval
Qualitative Description
Verbal 102 102 55 94–109 Average Nonverbal Reasoning 87 89 23 84–96 Below Average Spatial 103 102 55 97–107 Average GCA 292 97 42 92–102 Average SNC 190 95 37 90–100 Average
Copyright © 2008 by Pearson Education, Inc. or its affiliate(s). All rights reserved.
Technical Report for DAS-II and WIAT-II (School Age Battery)
Examinee ID: 1 Page 3
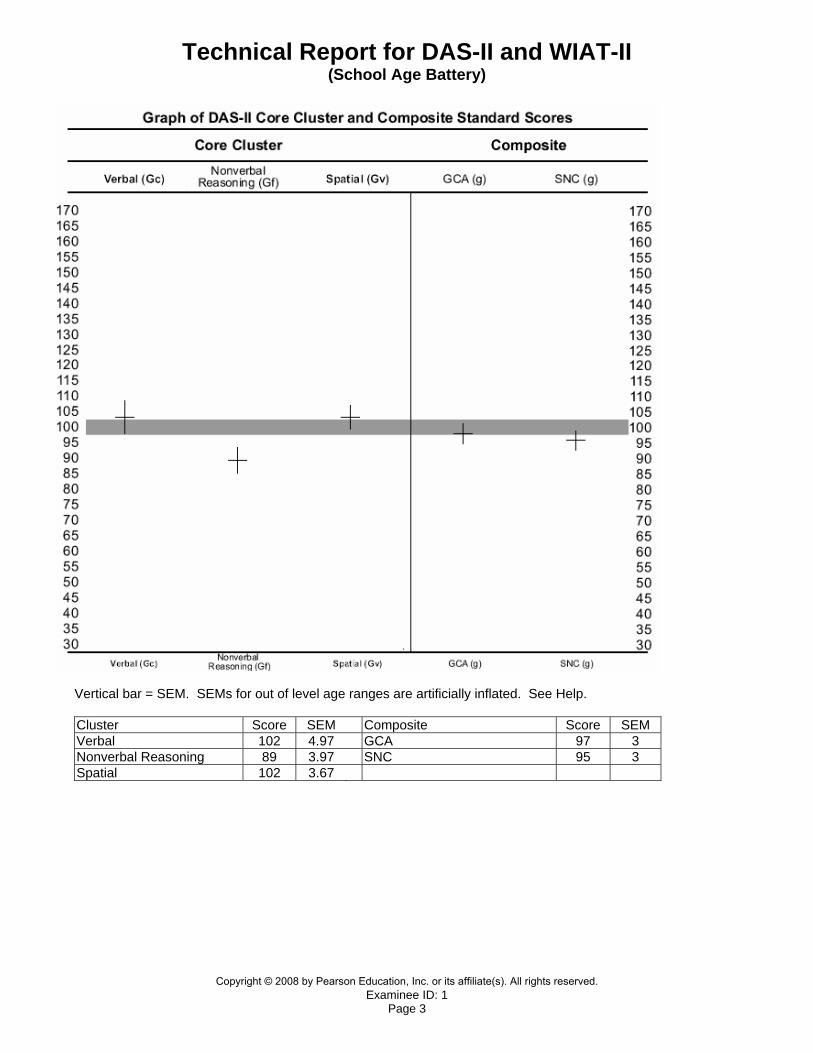
Vertical bar = SEM. SEMs for out of level age ranges are artificially inflated. See Help. Cluster Score SEM Composite Score SEM Verbal 102 4.97 GCA 97 3 Nonverbal Reasoning 89 3.97 SNC 95 3 Spatial 102 3.67
Copyright © 2008 by Pearson Education, Inc. or its affiliate(s). All rights reserved.
Technical Report for DAS-II and WIAT-II (School Age Battery)
Examinee ID: 1 Page 4
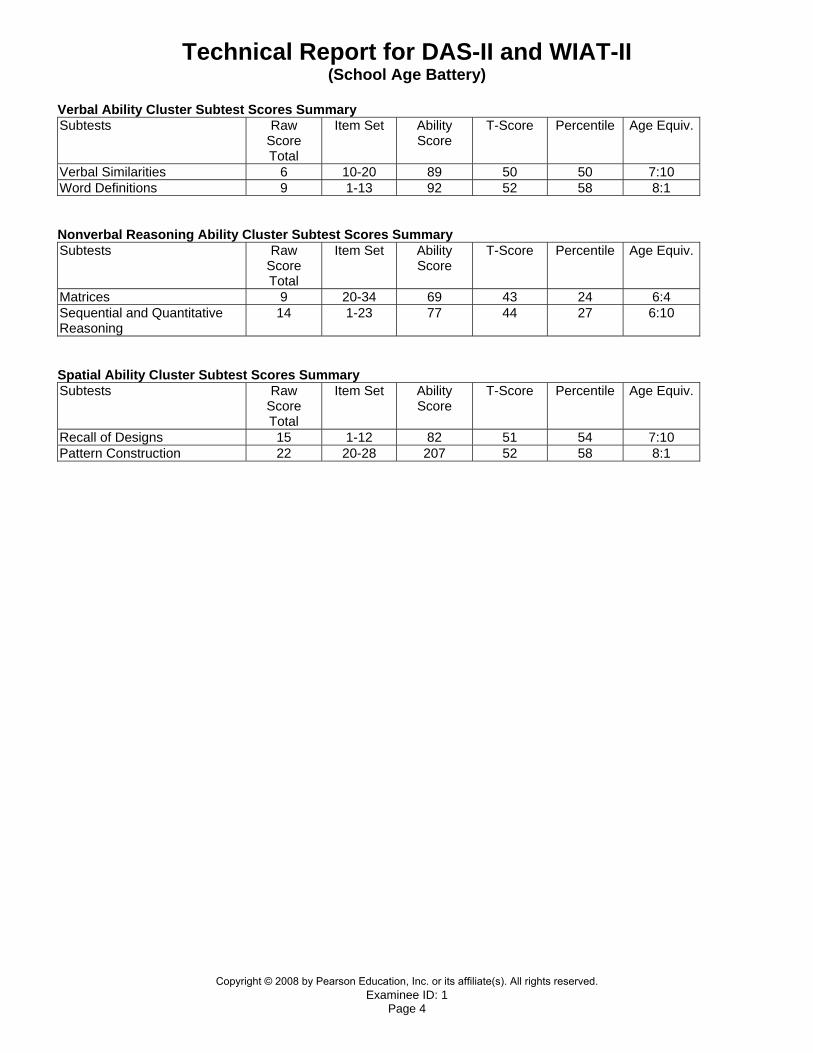
Verbal Ability Cluster Subtest Scores Summary Subtests Raw
Score Total
Item Set Ability Score
T-Score Percentile Age Equiv.
Verbal Similarities 6 10-20 89 50 50 7:10 Word Definitions 9 1-13 92 52 58 8:1 Nonverbal Reasoning Ability Cluster Subtest Scores Summary Subtests Raw
Score Total
Item Set Ability Score
T-Score Percentile Age Equiv.
Matrices 9 20-34 69 43 24 6:4 Sequential and Quantitative Reasoning
14 1-23 77 44 27 6:10
Spatial Ability Cluster Subtest Scores Summary Subtests Raw
Score Total
Item Set Ability Score
T-Score Percentile Age Equiv.
Recall of Designs 15 1-12 82 51 54 7:10 Pattern Construction 22 20-28 207 52 58 8:1
Copyright © 2008 by Pearson Education, Inc. or its affiliate(s). All rights reserved.
Technical Report for DAS-II and WIAT-II (School Age Battery)
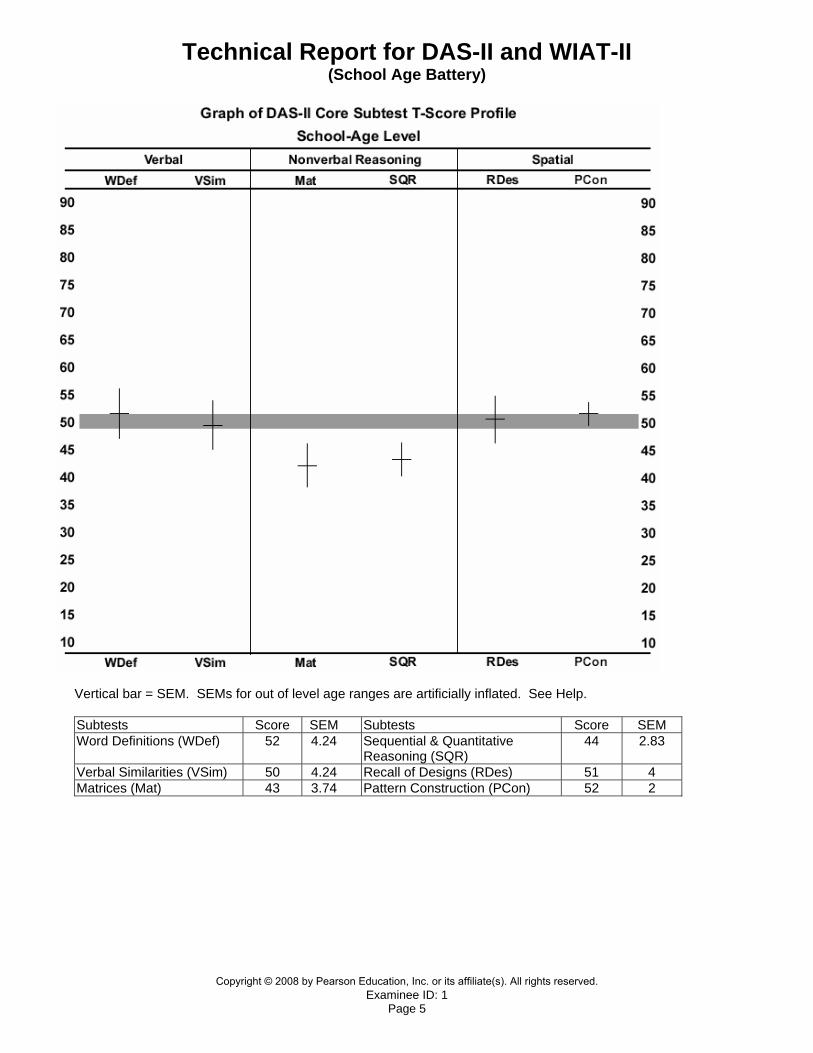
Examinee ID: 1 Page 5
Vertical bar = SEM. SEMs for out of level age ranges are artificially inflated. See Help. Subtests Score SEM Subtests Score SEM Word Definitions (WDef) 52 4.24 Sequential & Quantitative
Reasoning (SQR) 44 2.83
Verbal Similarities (VSim) 50 4.24 Recall of Designs (RDes) 51 4 Matrices (Mat) 43 3.74 Pattern Construction (PCon) 52 2
Copyright © 2008 by Pearson Education, Inc. or its affiliate(s). All rights reserved.
Technical Report for DAS-II and WIAT-II (School Age Battery)
Examinee ID: 1 Page 6
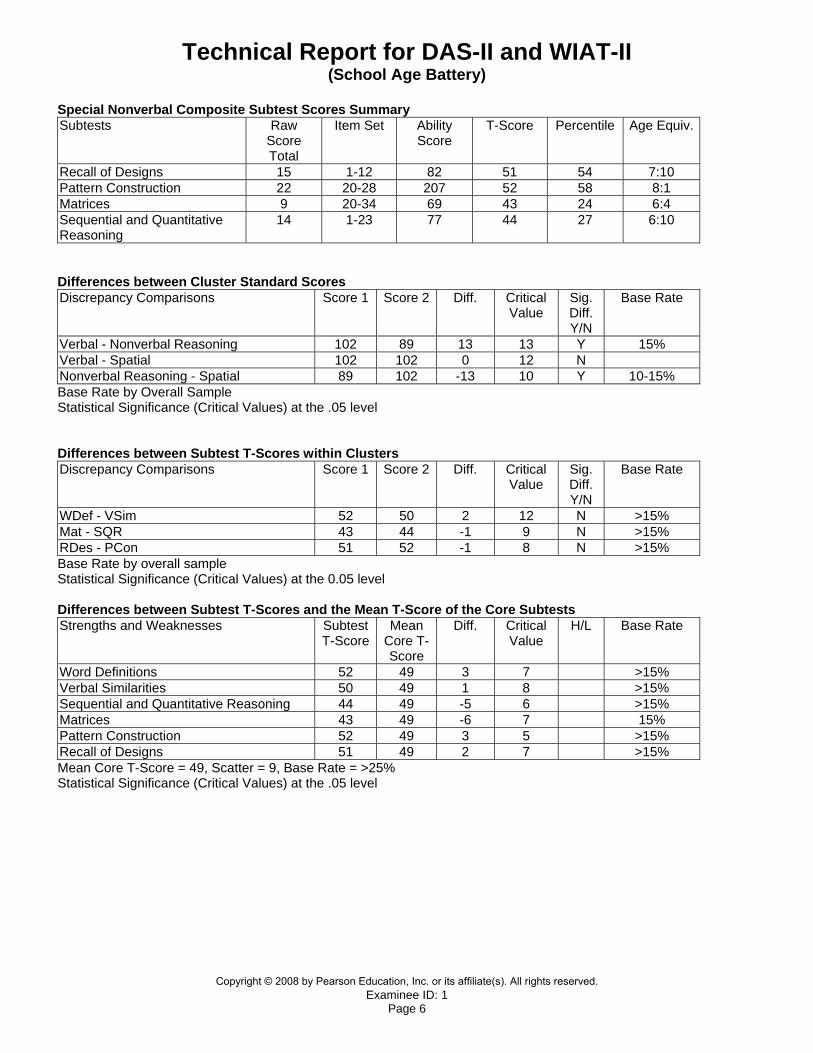
Special Nonverbal Composite Subtest Scores Summary Subtests Raw
Score Total
Item Set Ability Score
T-Score Percentile Age Equiv.
Recall of Designs 15 1-12 82 51 54 7:10 Pattern Construction 22 20-28 207 52 58 8:1 Matrices 9 20-34 69 43 24 6:4 Sequential and Quantitative Reasoning
14 1-23 77 44 27 6:10
Differences between Cluster Standard Scores Discrepancy Comparisons Score 1 Score 2 Diff. Critical
Value Sig. Diff. Y/N
Base Rate
Verbal - Nonverbal Reasoning 102 89 13 13 Y 15% Verbal - Spatial 102 102 0 12 N Nonverbal Reasoning - Spatial 89 102 -13 10 Y 10-15% Base Rate by Overall Sample Statistical Significance (Critical Values) at the .05 level Differences between Subtest T-Scores within Clusters Discrepancy Comparisons Score 1 Score 2 Diff. Critical
Value Sig. Diff. Y/N
Base Rate
WDef - VSim 52 50 2 12 N >15% Mat - SQR 43 44 -1 9 N >15% RDes - PCon 51 52 -1 8 N >15% Base Rate by overall sample Statistical Significance (Critical Values) at the 0.05 level Differences between Subtest T-Scores and the Mean T-Score of the Core Subtests Strengths and Weaknesses Subtest
T-ScoreMean
Core T-Score
Diff. Critical Value
H/L Base Rate
Word Definitions 52 49 3 7 >15% Verbal Similarities 50 49 1 8 >15% Sequential and Quantitative Reasoning 44 49 -5 6 >15% Matrices 43 49 -6 7 15% Pattern Construction 52 49 3 5 >15% Recall of Designs 51 49 2 7 >15% Mean Core T-Score = 49, Scatter = 9, Base Rate = >25% Statistical Significance (Critical Values) at the .05 level
Copyright © 2008 by Pearson Education, Inc. or its affiliate(s). All rights reserved.
Technical Report for DAS-II and WIAT-II (School Age Battery)
Examinee ID: 1 Page 7
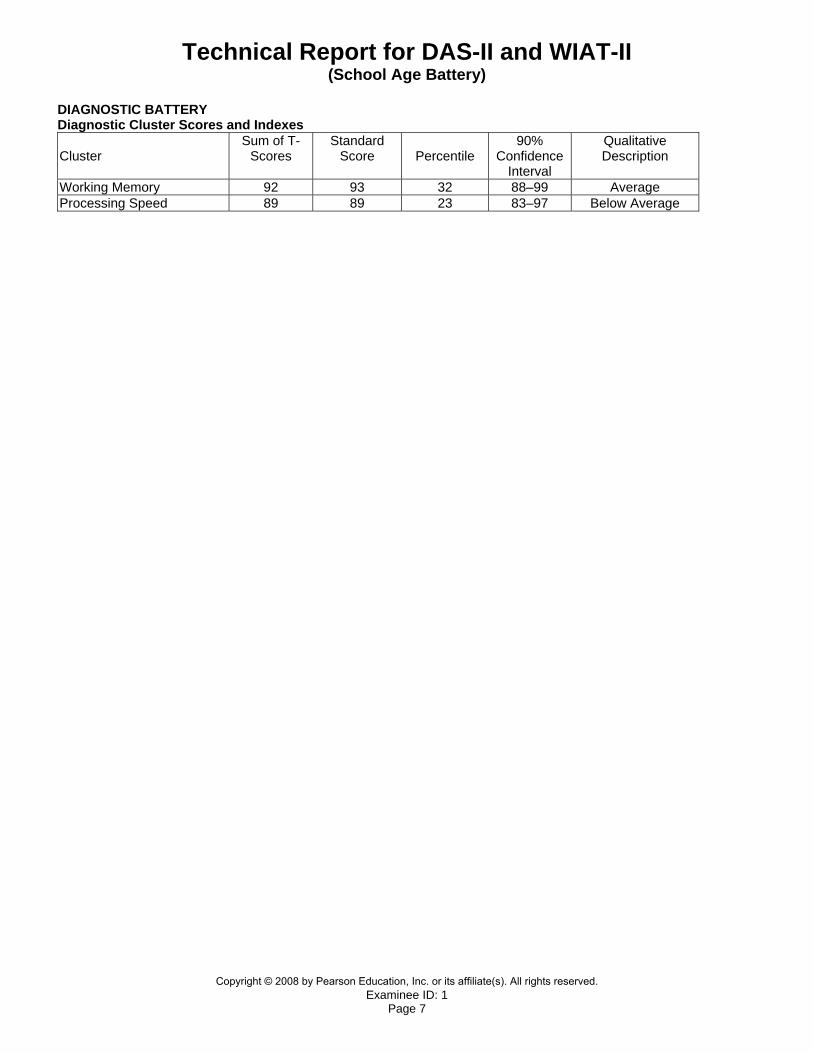
DIAGNOSTIC BATTERY Diagnostic Cluster Scores and Indexes Cluster
Sum of T-Scores
Standard Score
Percentile
90% Confidence
Interval
Qualitative Description
Working Memory 92 93 32 88–99 Average Processing Speed 89 89 23 83–97 Below Average
Copyright © 2008 by Pearson Education, Inc. or its affiliate(s). All rights reserved.
Technical Report for DAS-II and WIAT-II (School Age Battery)
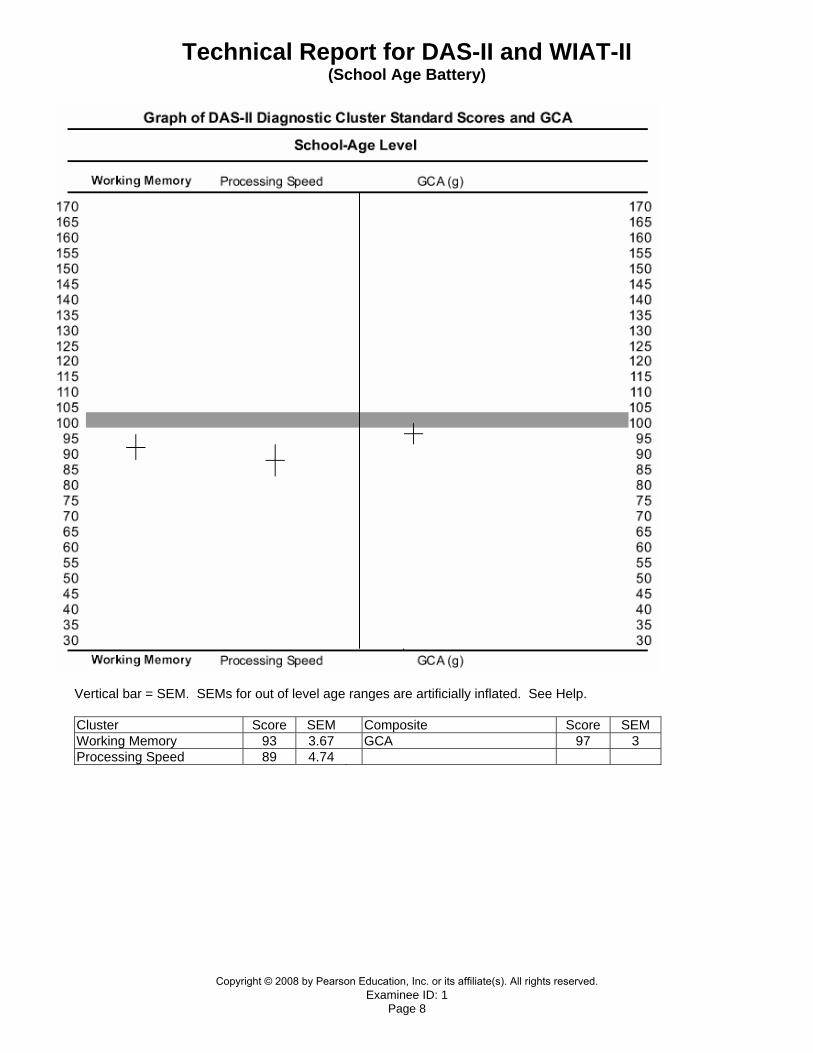
Examinee ID: 1 Page 8
Vertical bar = SEM. SEMs for out of level age ranges are artificially inflated. See Help. Cluster Score SEM Composite Score SEM Working Memory 93 3.67 GCA 97 3 Processing Speed 89 4.74
Copyright © 2008 by Pearson Education, Inc. or its affiliate(s). All rights reserved.
Technical Report for DAS-II and WIAT-II (School Age Battery)
Examinee ID: 1 Page 9
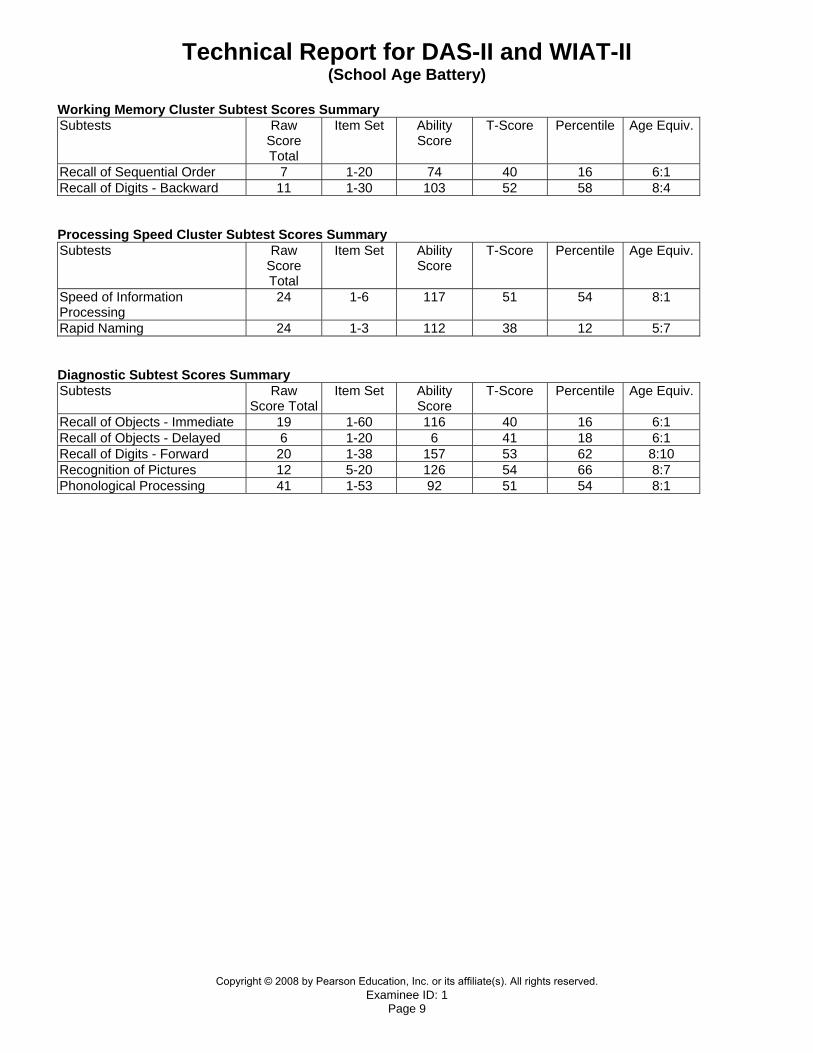
Working Memory Cluster Subtest Scores Summary Subtests Raw
Score Total
Item Set Ability Score
T-Score Percentile Age Equiv.
Recall of Sequential Order 7 1-20 74 40 16 6:1 Recall of Digits - Backward 11 1-30 103 52 58 8:4 Processing Speed Cluster Subtest Scores Summary Subtests Raw
Score Total
Item Set Ability Score
T-Score Percentile Age Equiv.
Speed of Information Processing
24 1-6 117 51 54 8:1
Rapid Naming 24 1-3 112 38 12 5:7 Diagnostic Subtest Scores Summary Subtests Raw
Score Total Item Set Ability
Score T-Score Percentile Age Equiv.
Recall of Objects - Immediate 19 1-60 116 40 16 6:1 Recall of Objects - Delayed 6 1-20 6 41 18 6:1 Recall of Digits - Forward 20 1-38 157 53 62 8:10 Recognition of Pictures 12 5-20 126 54 66 8:7 Phonological Processing 41 1-53 92 51 54 8:1
Copyright © 2008 by Pearson Education, Inc. or its affiliate(s). All rights reserved.
Technical Report for DAS-II and WIAT-II (School Age Battery)
Examinee ID: 1 Page 10
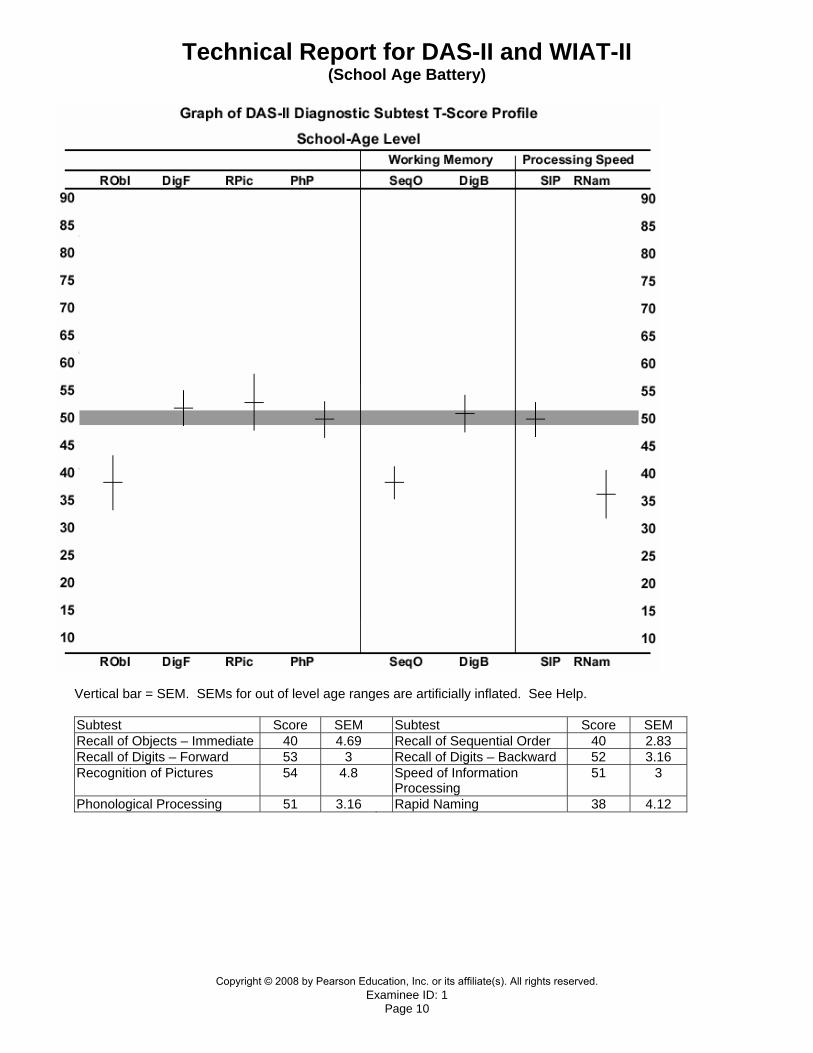
Vertical bar = SEM. SEMs for out of level age ranges are artificially inflated. See Help. Subtest Score SEM Subtest Score SEM Recall of Objects – Immediate 40 4.69 Recall of Sequential Order 40 2.83 Recall of Digits – Forward 53 3 Recall of Digits – Backward 52 3.16 Recognition of Pictures 54 4.8 Speed of Information
Processing 51 3
Phonological Processing 51 3.16 Rapid Naming 38 4.12
Copyright © 2008 by Pearson Education, Inc. or its affiliate(s). All rights reserved.
Technical Report for DAS-II and WIAT-II (School Age Battery)
Examinee ID: 1 Page 11
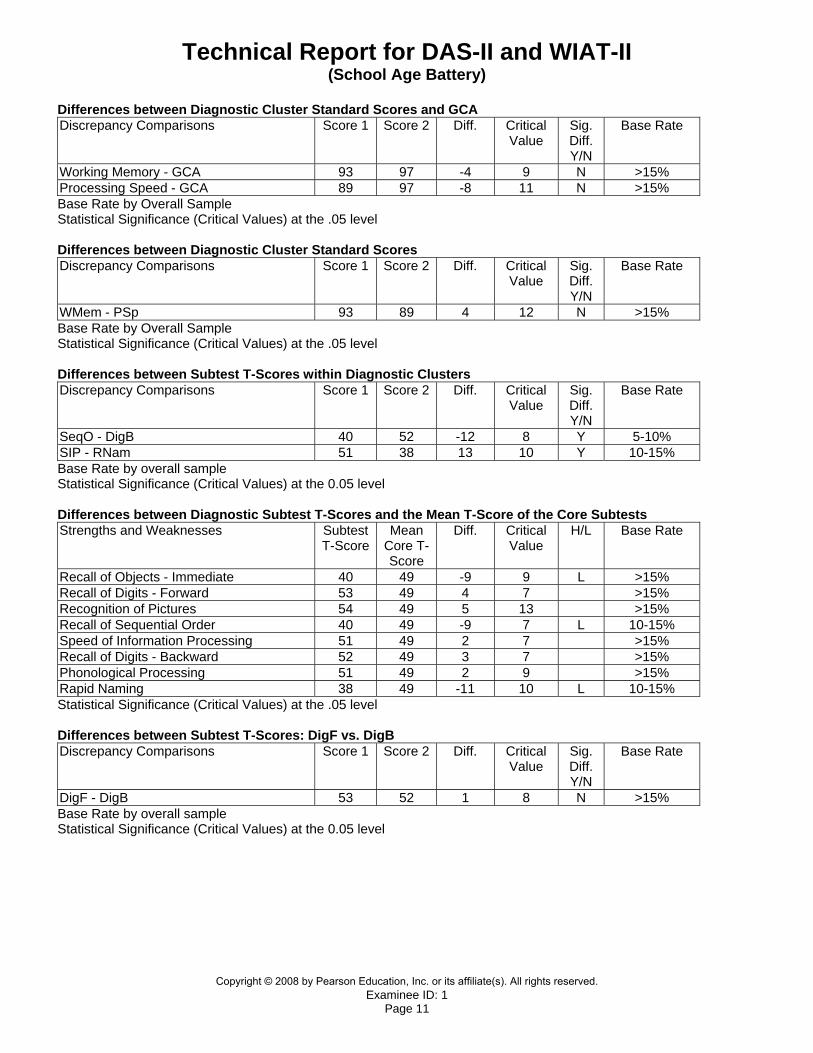
Differences between Diagnostic Cluster Standard Scores and GCA Discrepancy Comparisons Score 1 Score 2 Diff. Critical
Value Sig. Diff. Y/N
Base Rate
Working Memory - GCA 93 97 -4 9 N >15% Processing Speed - GCA 89 97 -8 11 N >15% Base Rate by Overall Sample Statistical Significance (Critical Values) at the .05 level Differences between Diagnostic Cluster Standard Scores Discrepancy Comparisons Score 1 Score 2 Diff. Critical
Value Sig. Diff. Y/N
Base Rate
WMem - PSp 93 89 4 12 N >15% Base Rate by Overall Sample Statistical Significance (Critical Values) at the .05 level Differences between Subtest T-Scores within Diagnostic Clusters Discrepancy Comparisons Score 1 Score 2 Diff. Critical
Value Sig. Diff. Y/N
Base Rate
SeqO - DigB 40 52 -12 8 Y 5-10% SIP - RNam 51 38 13 10 Y 10-15% Base Rate by overall sample Statistical Significance (Critical Values) at the 0.05 level Differences between Diagnostic Subtest T-Scores and the Mean T-Score of the Core Subtests Strengths and Weaknesses Subtest
T-ScoreMean
Core T-Score
Diff. Critical Value
H/L Base Rate
Recall of Objects - Immediate 40 49 -9 9 L >15% Recall of Digits - Forward 53 49 4 7 >15% Recognition of Pictures 54 49 5 13 >15% Recall of Sequential Order 40 49 -9 7 L 10-15% Speed of Information Processing 51 49 2 7 >15% Recall of Digits - Backward 52 49 3 7 >15% Phonological Processing 51 49 2 9 >15% Rapid Naming 38 49 -11 10 L 10-15% Statistical Significance (Critical Values) at the .05 level Differences between Subtest T-Scores: DigF vs. DigB Discrepancy Comparisons Score 1 Score 2 Diff. Critical
Value Sig. Diff. Y/N
Base Rate
DigF - DigB 53 52 1 8 N >15% Base Rate by overall sample Statistical Significance (Critical Values) at the 0.05 level
Copyright © 2008 by Pearson Education, Inc. or its affiliate(s). All rights reserved.

Technical Report for DAS-II and WIAT-II (School Age Battery)
Examinee ID: 1 Page 12
Differences between Subtest T-Scores: RObI vs. RPic Discrepancy Comparisons Score 1 Score 2 Diff. Critical
Value Sig. Diff. Y/N
Base Rate
RObI - RPic 40 54 -14 14 Y 10-15% Base Rate by overall sample Statistical Significance (Critical Values) at the 0.05 level Differences between Subtest T-Scores: RObI vs. RObD Discrepancy Comparisons Score 1 Score 2 Diff. Critical
Value Sig. Diff. Y/N
RObI - RObD 40 41 -1 11 N Statistical Significance (Critical Values) at the .10 level Differences between Phonological Processing Tasks Discrepancy Comparisons Ability
Score 1 Ability
Score 2Diff. Critical
Value Sig. Diff. Y/N
Task 1 - Task 2 100 110 -10 33 N Task 1 - Task 3 100 89 11 26 N Task 1 - Task 4 100 76 24 27 N Task 2 - Task 3 110 89 21 26 N Task 2 - Task 4 110 76 34 27 Y Task 3 - Task 4 89 76 13 19 N Statistical Significance (Critical Values) at the .10 level Differences between Simple and Complex Naming Conditions in Rapid Naming Discrepancy Comparisons Ability
Score 1 Ability
Score 2Diff. Critical
Value Sig. Diff. Y/N
Simple Naming - Complex Naming 117 95 22 21 Y Statistical Significance (Critical Values) at the .10 level Summary of WIAT-II Subtest Scores SUBTESTS*
RAW
STD
90% INTERVAL
PR
NCE
S9
AGE EQU
GRADE EQU
Word Reading 26 58 54- 62 0.3 <1 1 5:4 K:0 Reading Comprehension 53** 72 67- 77 3 11 1 <6:0 <1:0 Pseudoword Decoding 6 86 82- 90 18 30 3 5:8 K:9 Numerical Operations 15 106 95- 117 66 58 6 8:0 2:8 Math Reasoning 26 96 89- 103 39 44 4 7:4 2:1 Spelling 11 79 73- 85 8 21 2 6:0 1:1 Written Expression 5 90 81- 99 25 36 4 <7:0 1:2 * WIAT-II age-based normative information was used in the calculation of subtest and composite scores. ** Represents Reading Comprehension weighted raw score. Summary of WIAT-II Composite and Total Scores COMPOSITES*
RAW
STD
90% INTERVAL
PR
NCE
S9
Reading 216 69 67- 71 2 6 1
Copyright © 2008 by Pearson Education, Inc. or its affiliate(s). All rights reserved.
Technical Report for DAS-II and WIAT-II (School Age Battery)
Examinee ID: 1 Page 13
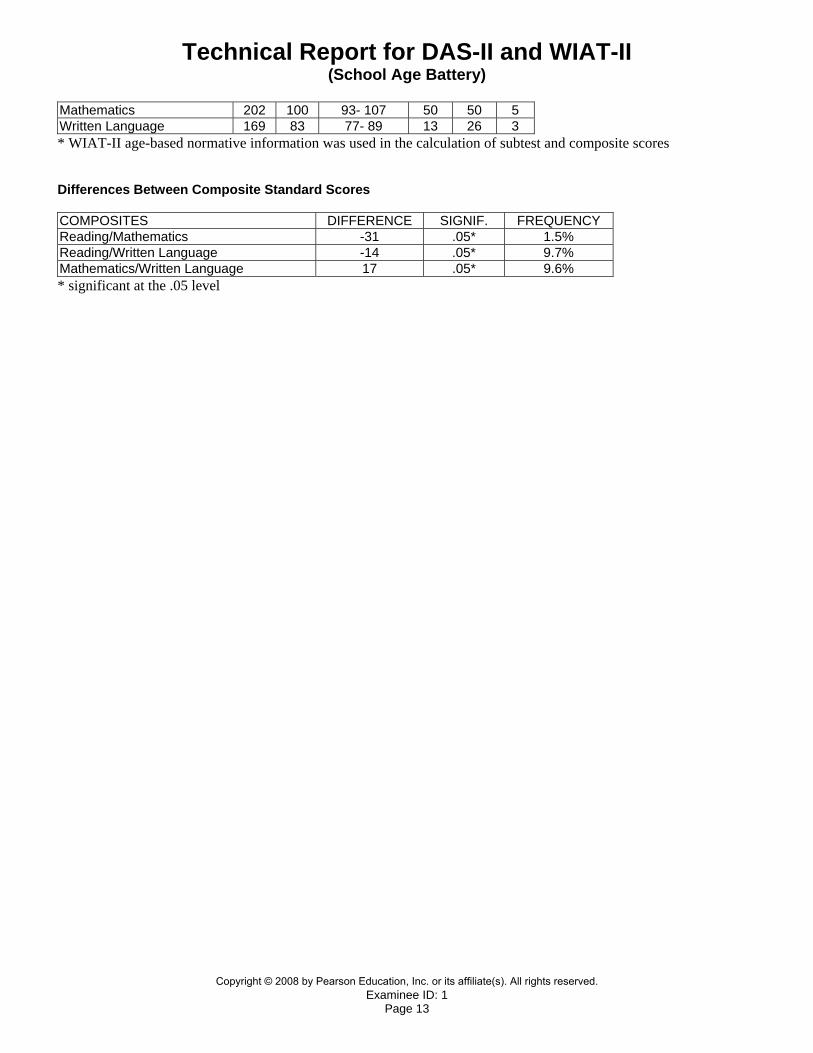
Mathematics 202 100 93- 107 50 50 5 Written Language 169 83 77- 89 13 26 3 * WIAT-II age-based normative information was used in the calculation of subtest and composite scores Differences Between Composite Standard Scores COMPOSITES DIFFERENCE SIGNIF. FREQUENCY Reading/Mathematics -31 .05* 1.5% Reading/Written Language -14 .05* 9.7% Mathematics/Written Language 17 .05* 9.6% * significant at the .05 level
Copyright © 2008 by Pearson Education, Inc. or its affiliate(s). All rights reserved.

Technical Report for DAS-II and WIAT-II (School Age Battery)
Examinee ID: 1 Page 14
Subtest SS SEM Subtest SS SEM Word Reading (WR) 58 2 Spelling (SP) 79 3 Reading Comprehension (RC) 72 3 Written Expression (WE) 90 5 Pseudoword Decoding (PD) 86 2 Listening Comprehension (LC) Numerical Operations (NO) 106 6 Oral Expression (OE) Math Reasoning (MR) 96 4
Copyright © 2008 by Pearson Education, Inc. or its affiliate(s). All rights reserved.
Technical Report for DAS-II and WIAT-II (School Age Battery)
Examinee ID: 1 Page 15
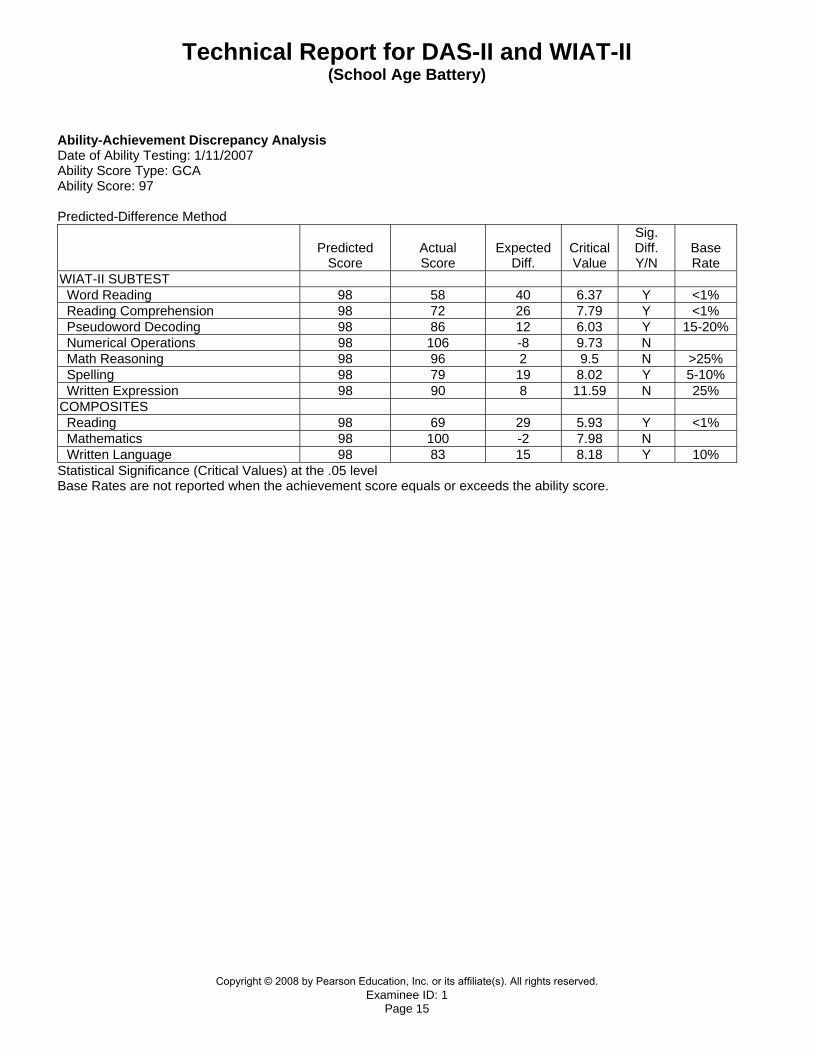
Ability-Achievement Discrepancy Analysis Date of Ability Testing: 1/11/2007 Ability Score Type: GCA Ability Score: 97 Predicted-Difference Method
Predicted Score
Actual Score
Expected
Diff.
Critical Value
Sig. Diff. Y/N
Base Rate
WIAT-II SUBTEST Word Reading 98 58 40 6.37 Y <1% Reading Comprehension 98 72 26 7.79 Y <1% Pseudoword Decoding 98 86 12 6.03 Y 15-20% Numerical Operations 98 106 -8 9.73 N Math Reasoning 98 96 2 9.5 N >25% Spelling 98 79 19 8.02 Y 5-10% Written Expression 98 90 8 11.59 N 25% COMPOSITES Reading 98 69 29 5.93 Y <1% Mathematics 98 100 -2 7.98 N Written Language 98 83 15 8.18 Y 10% Statistical Significance (Critical Values) at the .05 level Base Rates are not reported when the achievement score equals or exceeds the ability score.
Copyright © 2008 by Pearson Education, Inc. or its affiliate(s). All rights reserved.
70478
The Power to Understand.800-211-8378 • PsychCorp.com
ISBN 999-8697-80-8
9 7 8 9 9 9 8 6 9 7 8 0 5
Visit DAS–II.com for more product informationor call 800-211-8378.
70478_DAS-II_SR_Cover_FIN 8/15/07 4:35 PM Page 2
Copyright © 2008 by Pearson Education, Inc. or its affiliate(s). All rights reserved.