Embed Size (px)
Citation preview
1
4.1 Sampling and Surveys Read 209–211
What’s the difference between a population and a sample? What is a census?
What is that icon in the top-right corner of the example on page 210?
Read 211–213 (How to Sample Badly)
What’s the problem with convenience samples?
What is bias?
What’s a voluntary response sample? Is this a good method for obtaining a sample?
What is the purpose of the Check Your Understanding feature on page 213?
Alternate Example: To estimate the proportion of families that oppose budget cuts to the athletic
department, the principal surveys families as they enter the football stadium on Friday night. Explain
how this plan will result in bias and how the bias will affect the estimated proportion.
HW #1: page 229 (1, 3, 6, 7, 9, 10)
2
4.1 Random Sampling Methods Read 213–217
What’s a simple random sample (SRS)? How can you choose a SRS?
What’s the difference between sampling with replacement and sampling without replacement? How
should you account for this difference when using a table of random digits or other random number
generator?
Alternate Example: Mall Hours
The management company of a local mall plans to survey a random sample of 3 stores to determine the
hours they would like to stay open during the holiday season. Use Table D at line 101 to select an SRS
of size 3 stores.
Aeropostale Forever 21 Old Navy
All American Burger GameStop Pac Sun
Arby’s Gymboree Panda Express
Barnes & Noble Haggar Payless Shoes
Carter’s for Kids Just Sports Star Jewelers
Destination Tan Mrs. Fields Vitamin World
Famous Footwear Nike Factory Store Zales Diamond Store
Make sure labels are all the same length (2 digits in this case)
3
Read 219–220
What is a stratified random sample? How is it different than a simple random sample?
When is it beneficial to use a stratified random sample? What is the benefit? How do you choose a
variable to stratify by?
HW #2 page 230 (11, 13, 15, 17, 18, 19)
4.1 More about Sampling
Read 221–222
What is a cluster sample? Why do we use a cluster sample? How is it different than a stratified sample?
Alternate Example: A Good Read
A school librarian wants to know the average number of pages in all the books in the library. The
library has 20,000 books, arranged by type (fiction, biography, history, and so on) in shelves that hold
about 50 books each.
(a) Explain how to select a simple random sample of 500 books
(b) Explain how to select a stratified random sample of 500 books. Explain your choice of strata and
one reason why this method might be chosen.
4
(c) Explain how to select a cluster sample of 500 books. Explain your choice of cluster and one reason
why this method might be chosen.
(d) Discuss a potential drawback with each of the methods described above.
Read 223–225
What is inference?
What is a margin of error? What is the benefit of increasing the sample size?
Read 225–227
What is a sampling frame?
What is undercoverage and what problems might undercoverage cause?
What is nonresponse and what problems might nonresponse cause? How is it different than voluntary
response?
5
What is response bias and what problems might response bias cause? HW #3: page 231 (21, 23, 25, 27, 30, 31, 33, 35)
4.2 Observational Studies and Experiments
ADHD Linked to Lead and Mom’s Smoking, by Karen Barrow (February 1, 2007)
A mother’s smoking during pregnancy and exposure to lead significantly increases her child’s risk for
developing attention deficit hyperactivity disorder (ADHD), say researchers. In fact, as many as one third
of cases of ADHD in children are linked to exposure to tobacco smoke and lead before birth, giving moms
yet another reason to quit smoking during pregnancy.
For the study, researchers from Cincinnati Children’s Hospital Medical Center surveyed over 4,700
children between the ages of 4 and 15 and their parents. Over 4 percent of the children included had
ADHD. The researchers found that those children whose mother smoked during pregnancy were over
twice as likely to develop ADHD than a child whose mother had not smoked.
Based on this study, should we conclude that smoking during pregnancy causes an increase in the
likelihood that a child develops ADHD? Explain.
Explain the concept of confounding in the context of this study. Is there any way to prove that smoking causes ADHD?
Read 234–236 Read word-for-word
What are some differences between an observational study and an experiment?
6
What’s the difference between an explanatory variable and a response variable?
Page 237: Check Your Understanding
Designing Experiments
Suppose we wanted to design an experiment to see if caffeine affects pulse rate.
Here is an initial plan:
• measure initial pulse rate
• give each student some caffeine
• wait for a specified time
• measure final pulse rate
• compare final and initial rates
What are some problems with this plan? What other variables are most likely to be sources of
variability in pulse rates?
There are several steps we should take to solve these problems.
1. The first step is to include a that does not receive caffeine so we
have something to compare to. Otherwise, any pulse-raising (or lowering) event that occurs during the
experiment would be confounded with the caffeine. For example, an amazing stats lecture during the
waiting period would certainly raise pulse rates, making it hard to know how much of the pulse increase
was due to the caffeine.
7
Read 237–239
Briefly define the following terms:
• Treatment
• Experimental units
• Subjects
• Factor
• Level HW #4: page 233 (37–42) page 253 (45–55 odd) *Directions for 51–56 are the same
4.2 Experiments
The caffeine experiment, continued…
2. The second step is to make sure that the two groups (caffeine and non-caffeine) are as similar as
possible and are treated in exactly the same way, with the exception of the treatments. To make this
happen, we use randomization, replication, and control.
2a. We subjects to treatments to create groups that are roughly equivalent at
the beginning of the experiment. Random assignment ensures that the effects of uncontrolled variables
are balanced among the treatments groups. We must ALWAYS randomize since there will always be
other variables we cannot control or that we do not consider. Randomizing guards against what we
don’t know and prevents people from asking “But what about this variable?”
How do we randomize? What is a completely randomized design? (Read 239–243)
8
2b. means ensuring that there are an adequate number of observations in each
treatment group so that the two groups are as equivalent as possible. Then, differences in the effects of
the treatments can be distinguished from chance differences between the groups.
Note: Replication can also refer to repeating the experiment with different subjects. This can
help us feel more confident applying the results of our experiment to a .
2c. means holding other variables constant for each member of both treatment
groups. This prevents these other variables from becoming confounded with caffeine and from adding
additional variability to the distribution of the response variable.
• Prevents confounding: For example, sugar is an important variable to consider because it
may affect pulse rates. If one treatment group was given regular Coke (which has sugar) and
the other treatment group was given caffeine free Diet Coke (which has no sugar), then sugar
and caffeine would be confounded. If there was a difference in the average change in pulse
rates of the two groups after receiving the treatments, we wouldn’t know which variable
caused the change, and to what extent. To prevent sugar from becoming confounded with
caffeine, we need to make sure that members of both treatment groups get the same amount
of sugar.
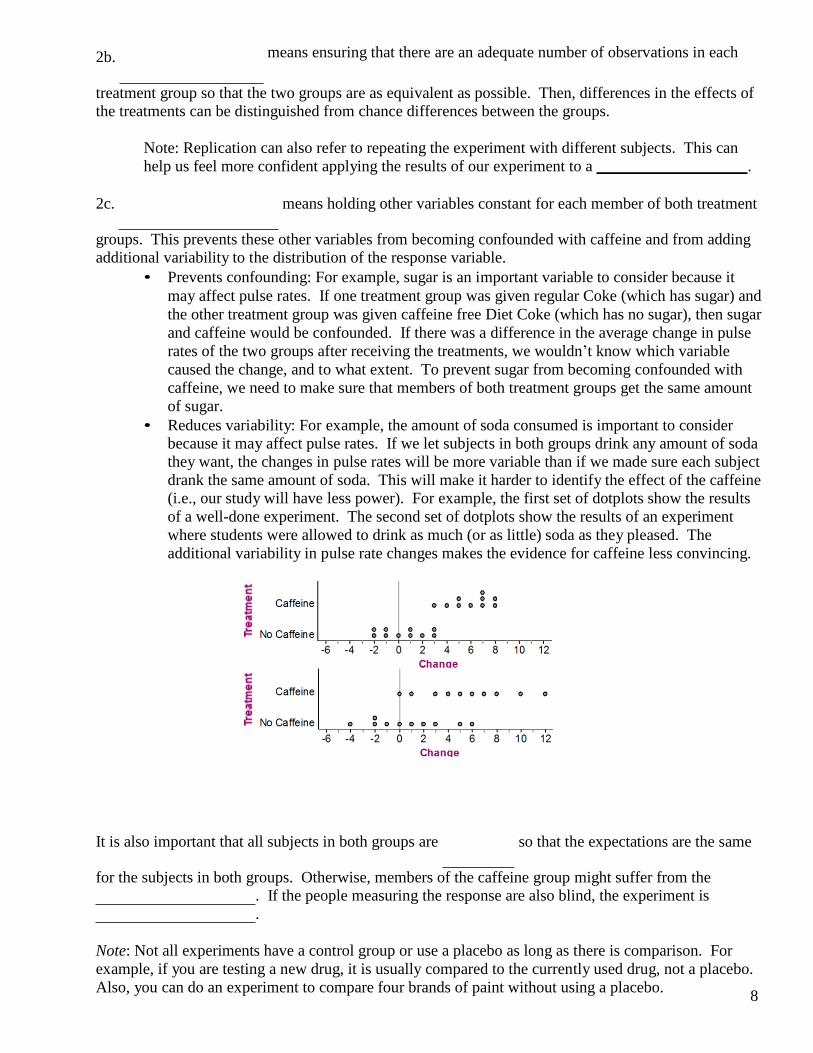
• Reduces variability: For example, the amount of soda consumed is important to consider
because it may affect pulse rates. If we let subjects in both groups drink any amount of soda
they want, the changes in pulse rates will be more variable than if we made sure each subject
drank the same amount of soda. This will make it harder to identify the effect of the caffeine
(i.e., our study will have less power). For example, the first set of dotplots show the results
of a well-done experiment. The second set of dotplots show the results of an experiment
where students were allowed to drink as much (or as little) soda as they pleased. The
additional variability in pulse rate changes makes the evidence for caffeine less convincing.
It is also important that all subjects in both groups are so that the expectations are the same
for the subjects in both groups. Otherwise, members of the caffeine group might suffer from the
. If the people measuring the response are also blind, the experiment is
.
Note: Not all experiments have a control group or use a placebo as long as there is comparison. For
example, if you are testing a new drug, it is usually compared to the currently used drug, not a placebo.
Also, you can do an experiment to compare four brands of paint without using a placebo.
9
SUMMARY: With randomization, replication, and control, each treatment group should be nearly
identical, and the effects of other variables should be about the same in each group. Now, if changes in
the explanatory variable are associated with changes in the response variable, we can attribute the
changes to the explanatory variable or the chance variation in the random assignment.
Read 243–249
Alternate Example: Multitasking Researchers in Canada performed an experiment with university
students to examine the effects of in-class laptop use on student learning. All participants in the study
were asked to attend a university style lecture and take notes with their laptops. Half of the participants
were assigned to complete other non-lecture related online tasks during the lecture. These tasks were
meant to imitate typical student Web browsing during classes. The remaining students simply took notes
with their laptops. To assign the treatments, the researchers printed 40 papers with instructions (20 with
multitasking and 20 without), shuffled them, and handed them out at random to students in the
classroom. At the end of the lecture, all participants took a comprehension test to measure how much
they learned from it. The results: students who were assigned to multitask did significantly worse (11%)
than students who were not assigned to multitask.
a. Explain how each of the four principles of experimental design was used in the multitasking
study. HW #5: page 254 (57, 59, 61, 63, 67, 69, 71)
10
The Caffeine Experiment Read 249
The results of an experiment are called if they are unlikely to
occur by random chance. That is, if it is unlikely that the results are due to the possible imbalances
created the random assignment.
For example, if caffeine really has no effect on pulse rates, then the average change in pulse rate of the
two groups should be exactly the same. However, because the results will vary depending on which
subjects are assigned to which group, the average change in the two groups will probably differ slightly.
Thus, whenever we do an experiment and find a difference between two groups, we need to determine if
this difference could be attributed to the chance variation in random assignment or because there really
is a difference in effect of the treatments.
How can we determine if the results of our experiment are statistically significant?
HW #6: page 259 (48, 58, 64, 68, 73)
4.2 Blocking
Read 251–255
Alternate Example: SAT schools
Many students enroll in prep courses to improve their SAT scores. Twenty students who have taken the
SAT once volunteered to participate in an experiment comparing online and classroom prep courses.
1. Describe how we can use a completely randomized design to compare online and classroom SAT
prep courses.
2. Among the 20 volunteers, 10 of are in Precalculus, 6 are in Algebra 2, and 4 are in Geometry. What
problem does this cause? How can we address this problem?
11
Class Treatment Improvement
P Online 100
P Online 100
P Online 90
P Online 90
P Online 100
P Classroom 70
P Classroom 70
P Classroom 80
P Classroom 80
P Classroom 80
A Online 50
A Online 60
A Online 40
A Classroom 30
A Classroom 40
A Classroom 20
G Online 30
G Online 30
G Classroom 0
G Classroom 20
Class Treatment Improvement P Online 100 P Online 100 P Online 90 P Online 90 P Online 100 P Classroom 70 P Classroom 70 P Classroom 80 P Classroom 80 P Classroom 80 A Online 50 A Online 60 A Online 40 A Classroom 30 A Classroom 40 A Classroom 20 G Online 30 G Online 30 G Classroom 0 G Classroom 20
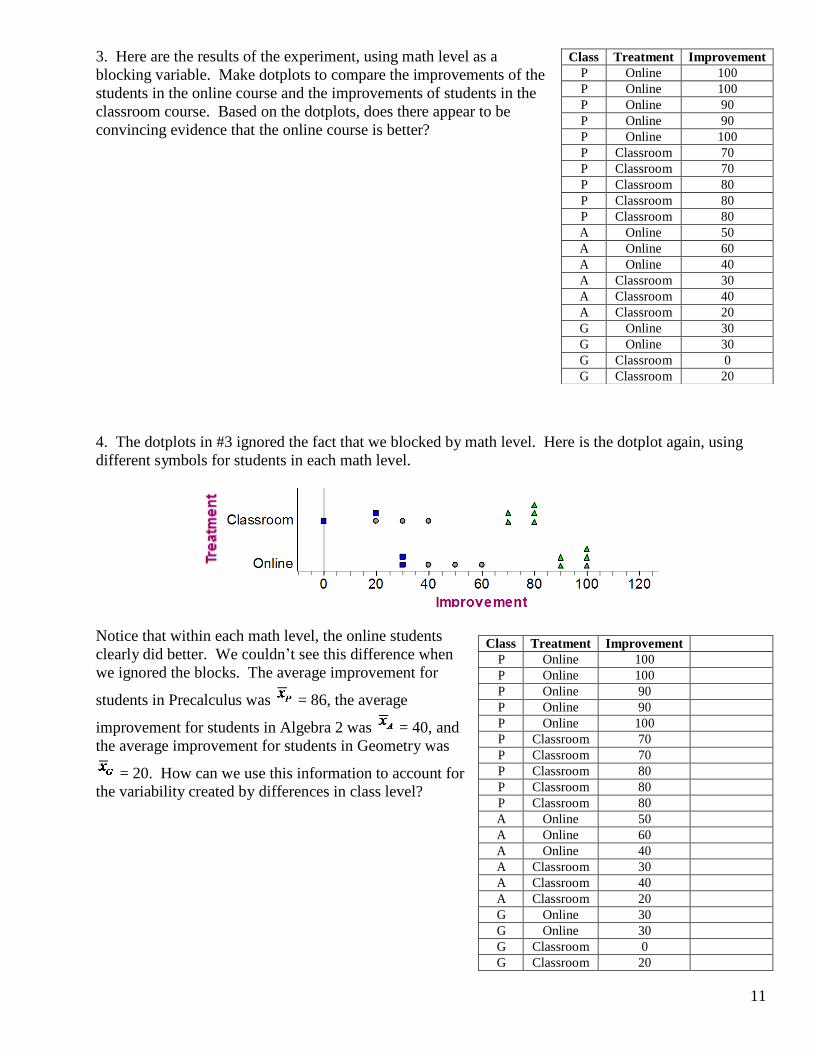
3. Here are the results of the experiment, using math level as a
blocking variable. Make dotplots to compare the improvements of the
students in the online course and the improvements of students in the
classroom course. Based on the dotplots, does there appear to be
convincing evidence that the online course is better?
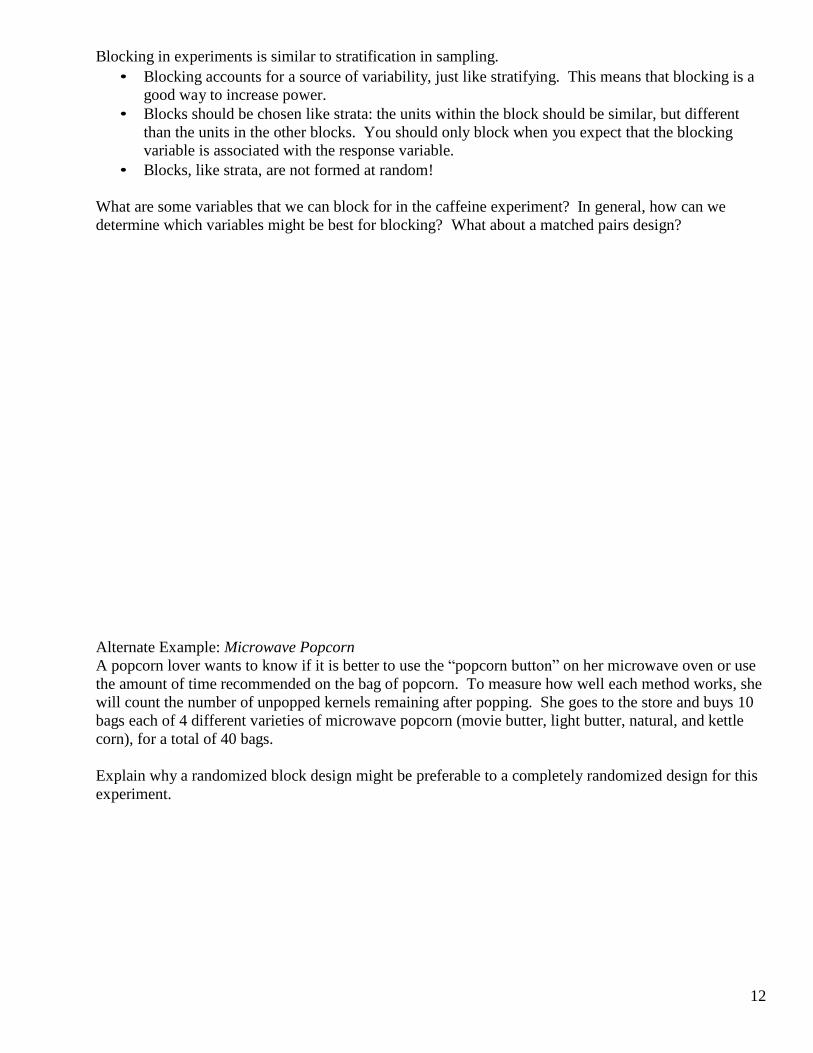
4. The dotplots in #3 ignored the fact that we blocked by math level. Here is the dotplot again, using
different symbols for students in each math level.
Notice that within each math level, the online students
clearly did better. We couldn’t see this difference when
we ignored the blocks. The average improvement for
students in Precalculus was = 86, the average
improvement for students in Algebra 2 was = 40, and
the average improvement for students in Geometry was
= 20. How can we use this information to account for
the variability created by differences in class level?
12
Blocking in experiments is similar to stratification in sampling.
• Blocking accounts for a source of variability, just like stratifying. This means that blocking is a
good way to increase power.
• Blocks should be chosen like strata: the units within the block should be similar, but different
than the units in the other blocks. You should only block when you expect that the blocking
variable is associated with the response variable.
• Blocks, like strata, are not formed at random!
What are some variables that we can block for in the caffeine experiment? In general, how can we
determine which variables might be best for blocking? What about a matched pairs design?
Alternate Example: Microwave Popcorn
A popcorn lover wants to know if it is better to use the “popcorn button” on her microwave oven or use
the amount of time recommended on the bag of popcorn. To measure how well each method works, she
will count the number of unpopped kernels remaining after popping. She goes to the store and buys 10
bags each of 4 different varieties of microwave popcorn (movie butter, light butter, natural, and kettle
corn), for a total of 40 bags.
Explain why a randomized block design might be preferable to a completely randomized design for this
experiment.
13
Outline a randomized block design for this experiment. What is a matched pairs design? Could we use a matched pairs design for the caffeine experiment?
HW #7: page 257 (75–85 odd)
14
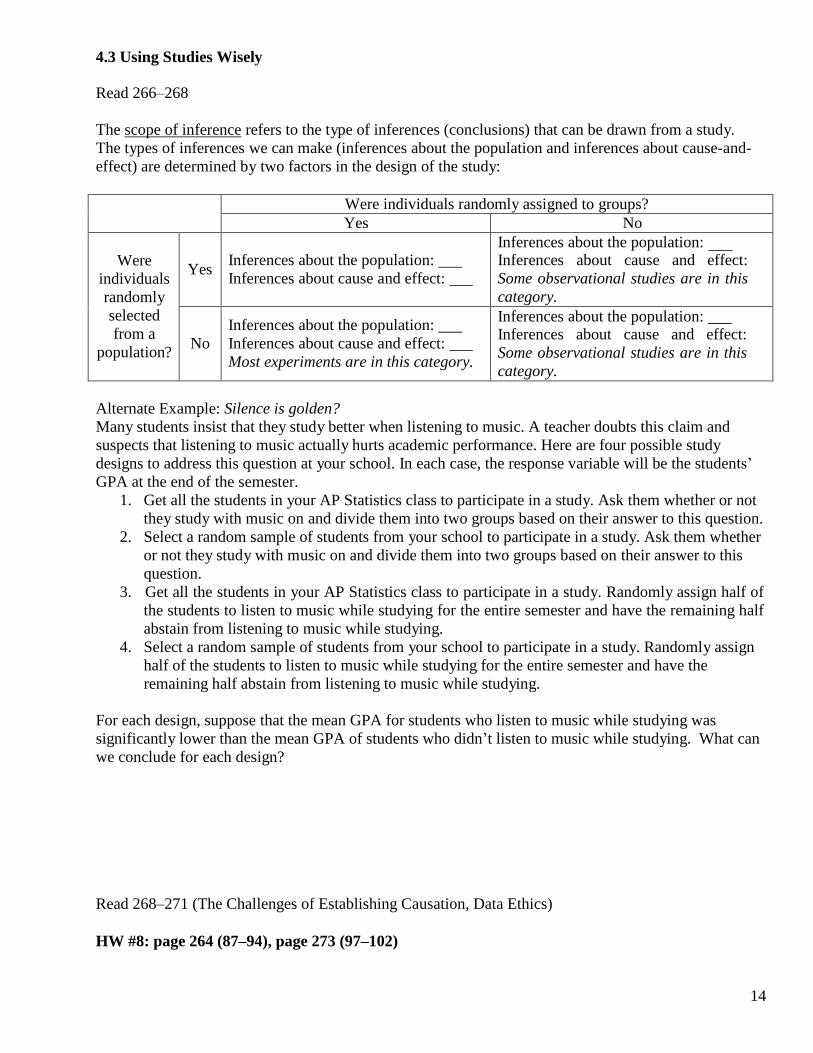
4.3 Using Studies Wisely
Read 266–268
The scope of inference refers to the type of inferences (conclusions) that can be drawn from a study.
The types of inferences we can make (inferences about the population and inferences about cause-and-
effect) are determined by two factors in the design of the study:
Were individuals randomly assigned to groups?
Yes No
Were
individuals
randomly
selected
from a
population?
Yes
Inferences about the population:
Inferences about cause and effect:
Inferences about the population: Inferences about cause and effect:
Some observational studies are in this
category.
No
Inferences about the population:
Inferences about cause and effect:
Most experiments are in this category.
Inferences about the population: Inferences about cause and effect:
Some observational studies are in this
category.
Alternate Example: Silence is golden?
Many students insist that they study better when listening to music. A teacher doubts this claim and
suspects that listening to music actually hurts academic performance. Here are four possible study
designs to address this question at your school. In each case, the response variable will be the students’
GPA at the end of the semester.
1. Get all the students in your AP Statistics class to participate in a study. Ask them whether or not
they study with music on and divide them into two groups based on their answer to this question.
2. Select a random sample of students from your school to participate in a study. Ask them whether
or not they study with music on and divide them into two groups based on their answer to this
question.
3. Get all the students in your AP Statistics class to participate in a study. Randomly assign half of
the students to listen to music while studying for the entire semester and have the remaining half
abstain from listening to music while studying.
4. Select a random sample of students from your school to participate in a study. Randomly assign
half of the students to listen to music while studying for the entire semester and have the
remaining half abstain from listening to music while studying.
For each design, suppose that the mean GPA for students who listen to music while studying was
significantly lower than the mean GPA of students who didn’t listen to music while studying. What can
we conclude for each design?
Read 268–271 (The Challenges of Establishing Causation, Data Ethics)
HW #8: page 264 (87–94), page 273 (97–102)


![[XLS] · Web view28 209 70227595 29 209 70775496 30 209 70554395 31 209 70775195 32 209 70559596 33 209 70774296 34 209 70778999 35 209 70773995 36 209 70226095 37 209 70776596 38](https://img.pdfslide.us/doc/110x75/5b0cded17f8b9ab7658b981b/xls-view28-209-70227595-29-209-70775496-30-209-70554395-31-209-70775195-32-209.jpg)