Embed Size (px)
Citation preview
Run with the bulls. Hunt with the bears. © 1 Copyright www.Guppytraders.com Pty Ltd ABN 41 371 501 098
Daryl Guppy In Association With www.nicolasdarvastrading.com
Darvas Trading -
Defining the Trend
with Volatility
22 Hibernia Cres, Brinkin, Box 40043, Casuarina, Northern Territory, Australia, 0811 Phone +61 8 89270061 Fax +61 8 89270125 [email protected] Daryl Guppy is the author of Share Trading; Trading Asian Shares; Trading Tactics; Bear Trading; Chart Trading; Market Trading Tactics; Better Trading; Snapshot Trading; Better Stock Trading; Trend Trading Offices and staff in Darwin, Kuala Lumpur +60 321697733, Singapore +65 68663339 and Beijing +86 13120148738
Run with the bulls. Hunt with the bears. © 2 Copyright www.Guppytraders.com Pty Ltd ABN 41 371 501 098
Table of Contents
Table of Contents .......................................................................................................2
Darvas Trading - Defining the Trend with Volatility ...............................................3
Darvas Construction Rules .......................................................................................5
Building A Box Top....................................................................................................6
Redefining the Box.....................................................................................................8
Box Limits and Triggers ............................................................................................9
Modern Darvas Stops ..............................................................................................11
Breakout Darvas.......................................................................................................13
Darvas in Metastock.................................................................................................15
Biography..................................................................................................................18
Run with the bulls. Hunt with the bears. © 3 Copyright www.Guppytraders.com Pty Ltd ABN 41 371 501 098
Darvas Trading - Defining the Trend with Volatility
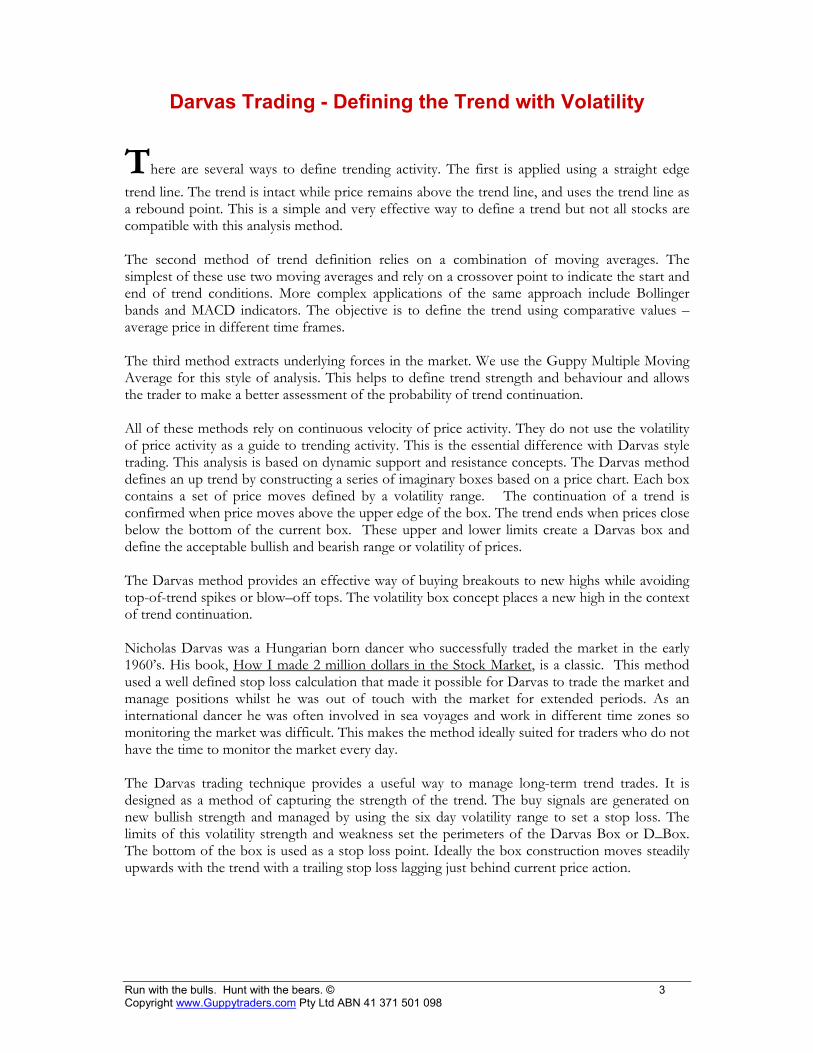
There are several ways to define trending activity. The first is applied using a straight edge trend line. The trend is intact while price remains above the trend line, and uses the trend line as a rebound point. This is a simple and very effective way to define a trend but not all stocks are compatible with this analysis method. The second method of trend definition relies on a combination of moving averages. The simplest of these use two moving averages and rely on a crossover point to indicate the start and end of trend conditions. More complex applications of the same approach include Bollinger bands and MACD indicators. The objective is to define the trend using comparative values – average price in different time frames. The third method extracts underlying forces in the market. We use the Guppy Multiple Moving Average for this style of analysis. This helps to define trend strength and behaviour and allows the trader to make a better assessment of the probability of trend continuation. All of these methods rely on continuous velocity of price activity. They do not use the volatility of price activity as a guide to trending activity. This is the essential difference with Darvas style trading. This analysis is based on dynamic support and resistance concepts. The Darvas method defines an up trend by constructing a series of imaginary boxes based on a price chart. Each box contains a set of price moves defined by a volatility range. The continuation of a trend is confirmed when price moves above the upper edge of the box. The trend ends when prices close below the bottom of the current box. These upper and lower limits create a Darvas box and define the acceptable bullish and bearish range or volatility of prices. The Darvas method provides an effective way of buying breakouts to new highs while avoiding top-of-trend spikes or blow–off tops. The volatility box concept places a new high in the context of trend continuation. Nicholas Darvas was a Hungarian born dancer who successfully traded the market in the early 1960’s. His book, How I made 2 million dollars in the Stock Market, is a classic. This method used a well defined stop loss calculation that made it possible for Darvas to trade the market and manage positions whilst he was out of touch with the market for extended periods. As an international dancer he was often involved in sea voyages and work in different time zones so monitoring the market was difficult. This makes the method ideally suited for traders who do not have the time to monitor the market every day. The Darvas trading technique provides a useful way to manage long-term trend trades. It is designed as a method of capturing the strength of the trend. The buy signals are generated on new bullish strength and managed by using the six day volatility range to set a stop loss. The limits of this volatility strength and weakness set the perimeters of the Darvas Box or D_Box. The bottom of the box is used as a stop loss point. Ideally the box construction moves steadily upwards with the trend with a trailing stop loss lagging just behind current price action.
Run with the bulls. Hunt with the bears. © 4 Copyright www.Guppytraders.com Pty Ltd ABN 41 371 501 098
Figure 1
The Darvas Box, uses a volatility range -based measure of bullish and bearish sentiment to set triggers for significant price action. The importance of a price breakout to a new high is confirmed when price overcomes the prevailing volatility resistance level. This is the top of the Darvas box.. This provides greater certainty about the trend continuation. A close below the bottom of the Darvas box suggests not just an exit from the trade, but a significant decline in trend strength and the potential for a trend collapse. The Darvas approach uses its own internal logic to understand trend behaviour and this leads to some counter intuitive situations where classic indicators signal a trend exit but the D_Box remains intact. When applying this method traders ignore all other indicator-based signals. The approach developed by Darvas uses a new twelve month high as a starting point, and then waits for several confirming conditions to develop before acting on a buy trigger. These confirming conditions create the rules for constructing the Darvas box. There are two variations to this strategy. We start with the classic Darvas approach. Then we consider modern adaptations. Both of these methods are automated in our Guppy Traders Essentials Charting software. The market Darvas traded was different from modern markets. We call this original approach the Classic method. Trading volumes were very low when compared with today’s trading activity. The classic Darvas application looked for an increase in volume with a price breakout. Our research indicates this is no longer an important identification or verification feature. Modern markets are deep and liquid enough for massive and sustainable volume to follow price movements for extended periods.
Run with the bulls. Hunt with the bears. © 5 Copyright www.Guppytraders.com Pty Ltd ABN 41 371 501 098
Darvas Construction Rules
The rules are:
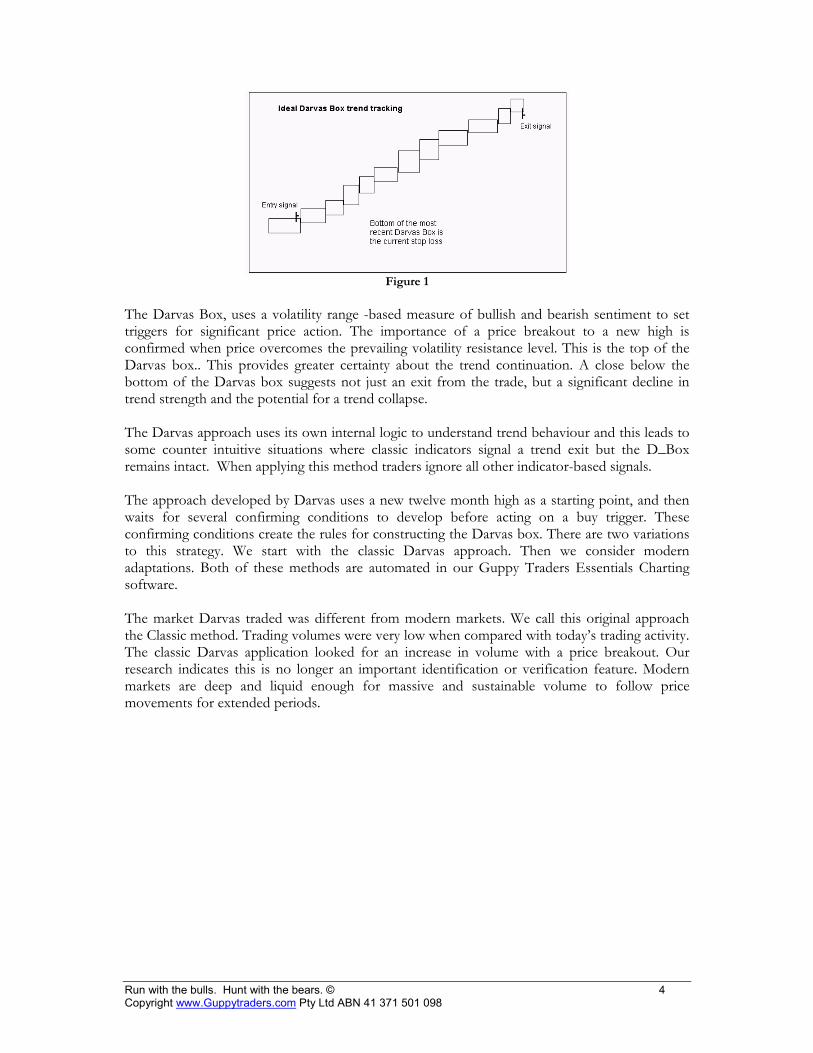
• The top of the Darvas box is established when the price does not touch or penetrate a previously set new high for three consecutive days. This is essentially a four day price pattern.
• The top of the Darvas box always starts with a new high. This high must be followed by three days that have lower highs.
• The Darvas box is based on a minimum of four days of price action.
The bottom of the Darvas box is only calculated after the top of the Darvas box has been confirmed. It is constructed in the opposite way to the top of the box.
• The Darvas box uses as its starting point, the lowest low that occurs AFTER the top of the
Darvas box is established. • The low is followed by three days of higher lows where the price does not touch or penetrate
a previously set calculation low for three consecutive days. It is again a three day pattern, but the calculation starts with the day the top of the box pattern is confirmed.
• This means it takes a minimum of four days for a Darvas box to be identified for both top and bottom.
• The top of the Darvas box is established in four days. The bottom of the box may take much longer to establish.
In addition to the filter idea, Darvas also uses stop loss orders and they fill two functions.
• The first is to protect capital once the trade is opened. Darvas initially places the stop loss
level at the exact bottom of the most recent box. This is a volatility based stop loss because the Darvas box is built around the expected volatility of price and price ranges. The Darvas box captures the ‘normal’ range of price activity. A buy signal is generated when prices move outside this upper volatility box. A sell signal is generated when prices drop below the volatility band. When the trade is first entered, we do not know where the bottom of the new volatility band is going to be. As a result we use the bottom of the most recent box as the initial stop loss point.
Darvas does not move his stop loss point upwards until the bottom of the new box is established.
• The second function is to protect a profit once a trade starts to make money. As soon as the bottom of the new box is confirmed it becomes the calculation point for the next stop loss point. The stop loss is set one tick below the bottom of the new box. The exit is taken as soon as the price falls below the bottom of the box.
Run with the bulls. Hunt with the bears. © 6 Copyright www.Guppytraders.com Pty Ltd ABN 41 371 501 098
Building a Box Top
Figure 2
Setting the top of the box takes exactly four days of price action. The high must be followed by three days of lower highs. The three highs must all be lower than the initial high – bar 1 in FIGURE 2 – that triggered the start of the pattern. In the example shown the first two days show a pattern of descending bars, but the last day in the extract has a high that is higher than the previous day’s bar. The new, most recent equal high, is always used as a new starting point. The objective is to capture the high for the period and then plot the bullish strength over the next three days. The bottom of the Darvas box is not calculated until the top of the box is confirmed.
Run with the bulls. Hunt with the bears. © 7 Copyright www.Guppytraders.com Pty Ltd ABN 41 371 501 098
Setting the Box Bottom
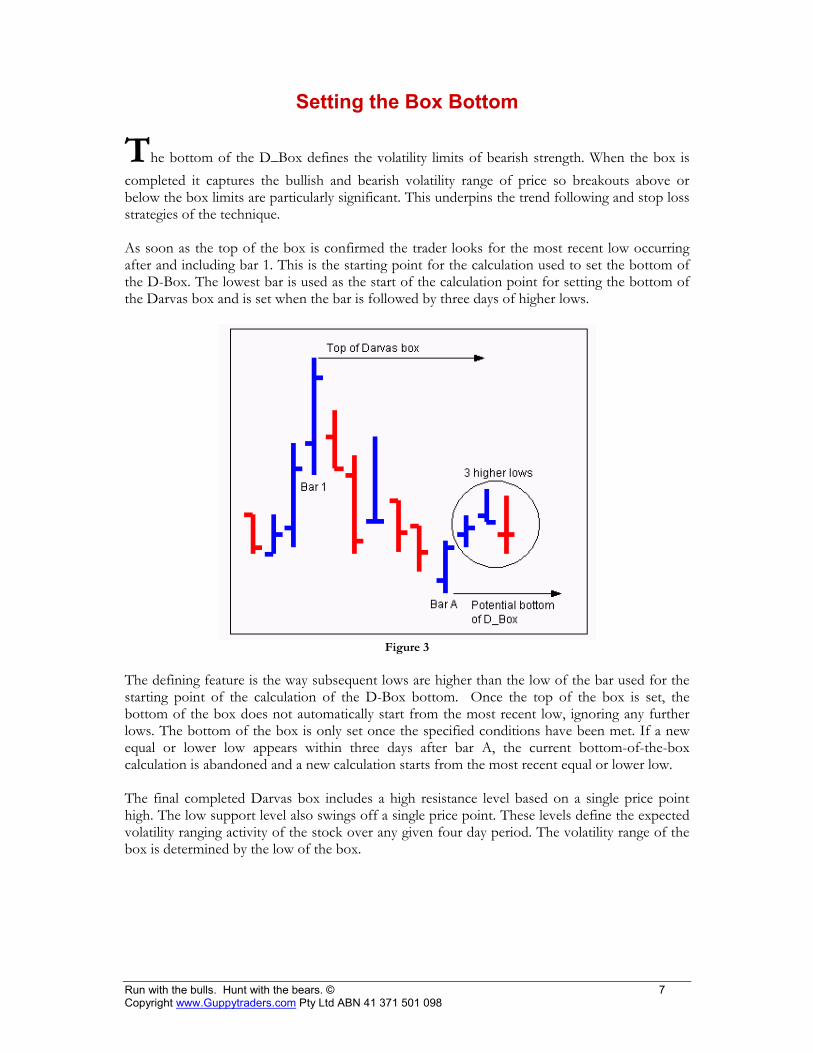
The bottom of the D_Box defines the volatility limits of bearish strength. When the box is completed it captures the bullish and bearish volatility range of price so breakouts above or below the box limits are particularly significant. This underpins the trend following and stop loss strategies of the technique. As soon as the top of the box is confirmed the trader looks for the most recent low occurring after and including bar 1. This is the starting point for the calculation used to set the bottom of the D-Box. The lowest bar is used as the start of the calculation point for setting the bottom of the Darvas box and is set when the bar is followed by three days of higher lows.
Figure 3
The defining feature is the way subsequent lows are higher than the low of the bar used for the starting point of the calculation of the D-Box bottom. Once the top of the box is set, the bottom of the box does not automatically start from the most recent low, ignoring any further lows. The bottom of the box is only set once the specified conditions have been met. If a new equal or lower low appears within three days after bar A, the current bottom-of-the-box calculation is abandoned and a new calculation starts from the most recent equal or lower low. The final completed Darvas box includes a high resistance level based on a single price point high. The low support level also swings off a single price point. These levels define the expected volatility ranging activity of the stock over any given four day period. The volatility range of the box is determined by the low of the box.
Run with the bulls. Hunt with the bears. © 8 Copyright www.Guppytraders.com Pty Ltd ABN 41 371 501 098
Redefining the Box
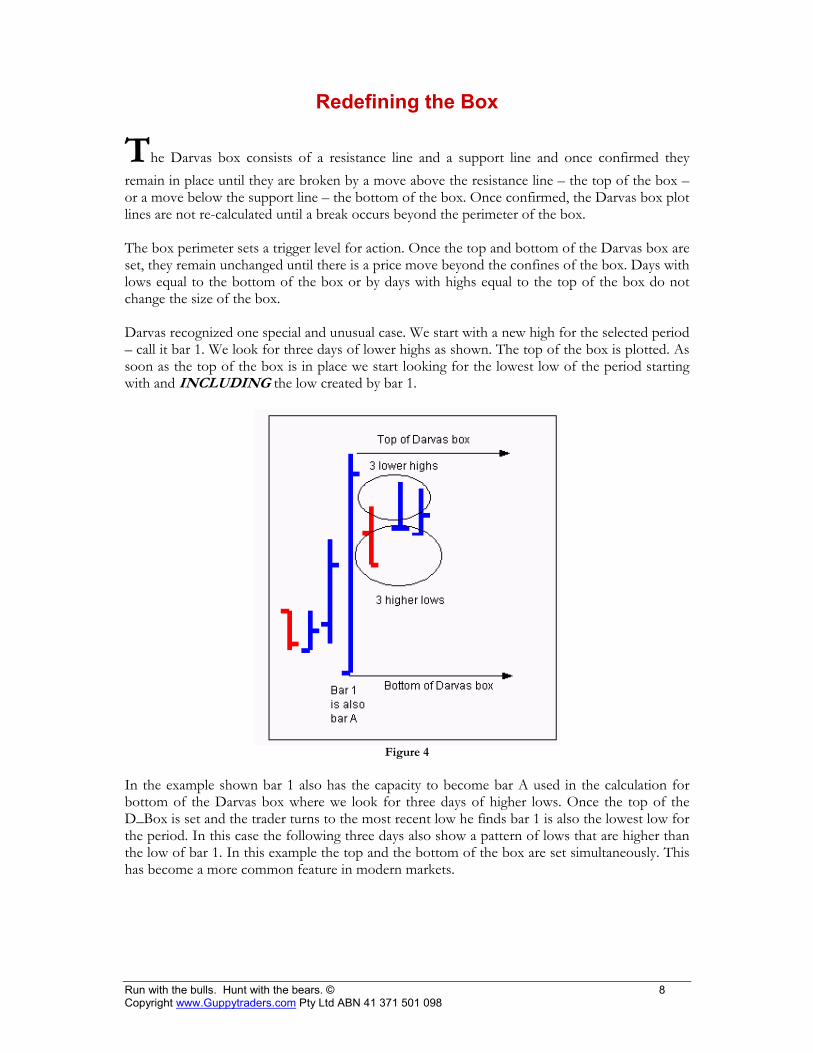
The Darvas box consists of a resistance line and a support line and once confirmed they remain in place until they are broken by a move above the resistance line – the top of the box – or a move below the support line – the bottom of the box. Once confirmed, the Darvas box plot lines are not re-calculated until a break occurs beyond the perimeter of the box. The box perimeter sets a trigger level for action. Once the top and bottom of the Darvas box are set, they remain unchanged until there is a price move beyond the confines of the box. Days with lows equal to the bottom of the box or by days with highs equal to the top of the box do not change the size of the box. Darvas recognized one special and unusual case. We start with a new high for the selected period – call it bar 1. We look for three days of lower highs as shown. The top of the box is plotted. As soon as the top of the box is in place we start looking for the lowest low of the period starting with and INCLUDING the low created by bar 1.
Figure 4
In the example shown bar 1 also has the capacity to become bar A used in the calculation for bottom of the Darvas box where we look for three days of higher lows. Once the top of the D_Box is set and the trader turns to the most recent low he finds bar 1 is also the lowest low for the period. In this case the following three days also show a pattern of lows that are higher than the low of bar 1. In this example the top and the bottom of the box are set simultaneously. This has become a more common feature in modern markets.
Run with the bulls. Hunt with the bears. © 9 Copyright www.Guppytraders.com Pty Ltd ABN 41 371 501 098
Box Limits and Triggers
Modern markets have greater volatility than the markets of the 1960’s. The classic Darvas approach used any price move above or below the Darvas box as an entry or exit signal. We find this a less reliable method in modern markets. We re-set the trigger as a CLOSE above or below the Darvas box. The box construction methods remain the same, but the trigger for action is different.
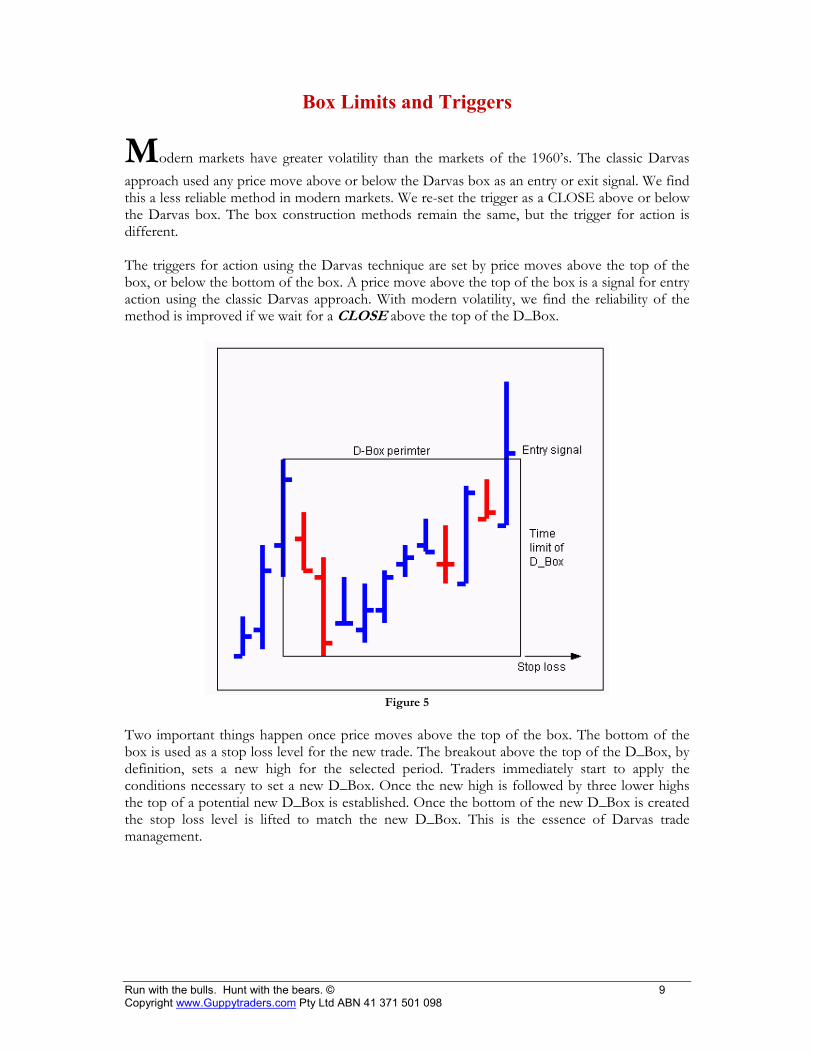
The triggers for action using the Darvas technique are set by price moves above the top of the box, or below the bottom of the box. A price move above the top of the box is a signal for entry action using the classic Darvas approach. With modern volatility, we find the reliability of the method is improved if we wait for a CLOSE above the top of the D_Box.
Figure 5
Two important things happen once price moves above the top of the box. The bottom of the box is used as a stop loss level for the new trade. The breakout above the top of the D_Box, by definition, sets a new high for the selected period. Traders immediately start to apply the conditions necessary to set a new D_Box. Once the new high is followed by three lower highs the top of a potential new D_Box is established. Once the bottom of the new D_Box is created the stop loss level is lifted to match the new D_Box. This is the essence of Darvas trade management.
Run with the bulls. Hunt with the bears. © 10 Copyright www.Guppytraders.com Pty Ltd ABN 41 371 501 098
Figure 6
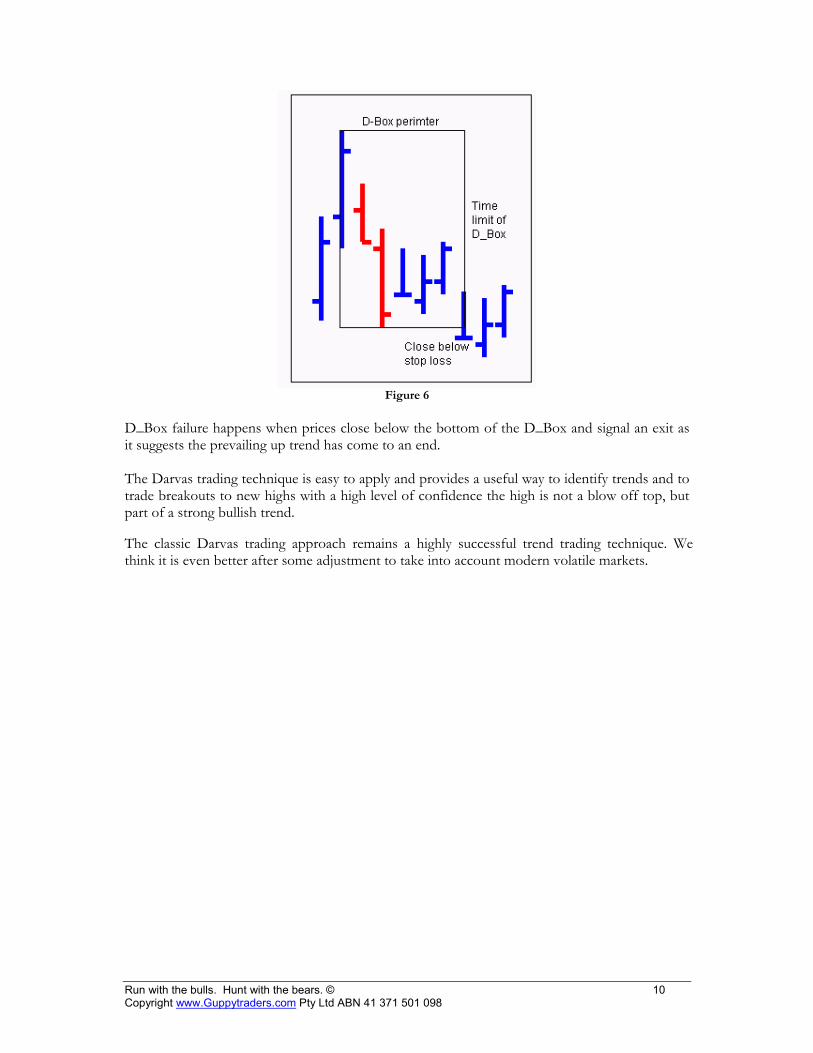
D_Box failure happens when prices close below the bottom of the D_Box and signal an exit as it suggests the prevailing up trend has come to an end.
The Darvas trading technique is easy to apply and provides a useful way to identify trends and to trade breakouts to new highs with a high level of confidence the high is not a blow off top, but part of a strong bullish trend.
The classic Darvas trading approach remains a highly successful trend trading technique. We think it is even better after some adjustment to take into account modern volatile markets.
Run with the bulls. Hunt with the bears. © 11 Copyright www.Guppytraders.com Pty Ltd ABN 41 371 501 098
Modern Darvas Stops
The Darvas box and trailing stop approach is designed to keep the trader in a long term steady trend. In modern volatile markets, this sometimes exposes the trader to an unexpectedly high level of risk because the stop loss level remains unaltered for extended periods. The increased volatility of modern day trading has reduced the risk control elements of the Darvas approach which was developed and applied to less volatile markets. We make four modifications to bring this classic approach into modern markets. Each modification is consistent with the underlying logic of the Darvas method. The new rules are shown in bold. The modern rules are:
• Trade initiated by a new high for the rolling 12 or 6 month period. • All entry decisions are based on the high of the price series. • All exit decisions are based on the close of the series. • Entry action triggered by the first trade at the trigger price. • Exit action managed on the day after the trigger close. • Action is triggered by the close. • Stop loss calculation uses ‘ghost’ boxes where necessary to handle modern
volatility. The most significant change is using the CLOSE to initiate trade entry and exit. This substantially increases the reliability of Darvas style trading in modern markets. The original Darvas approach used the bottom of the most recent D_Box as a stop loss point. The stop loss point was only raised after a new D_Box had been formed. In modern markets prices often move upwards very quickly. The speed of the trend rise is not adequately managed using the Darvas stop loss approach. We developed a “ghost” D_Box to overcome the impact of volatility.
Run with the bulls. Hunt with the bears. © 12 Copyright www.Guppytraders.com Pty Ltd ABN 41 371 501 098
Figure 7
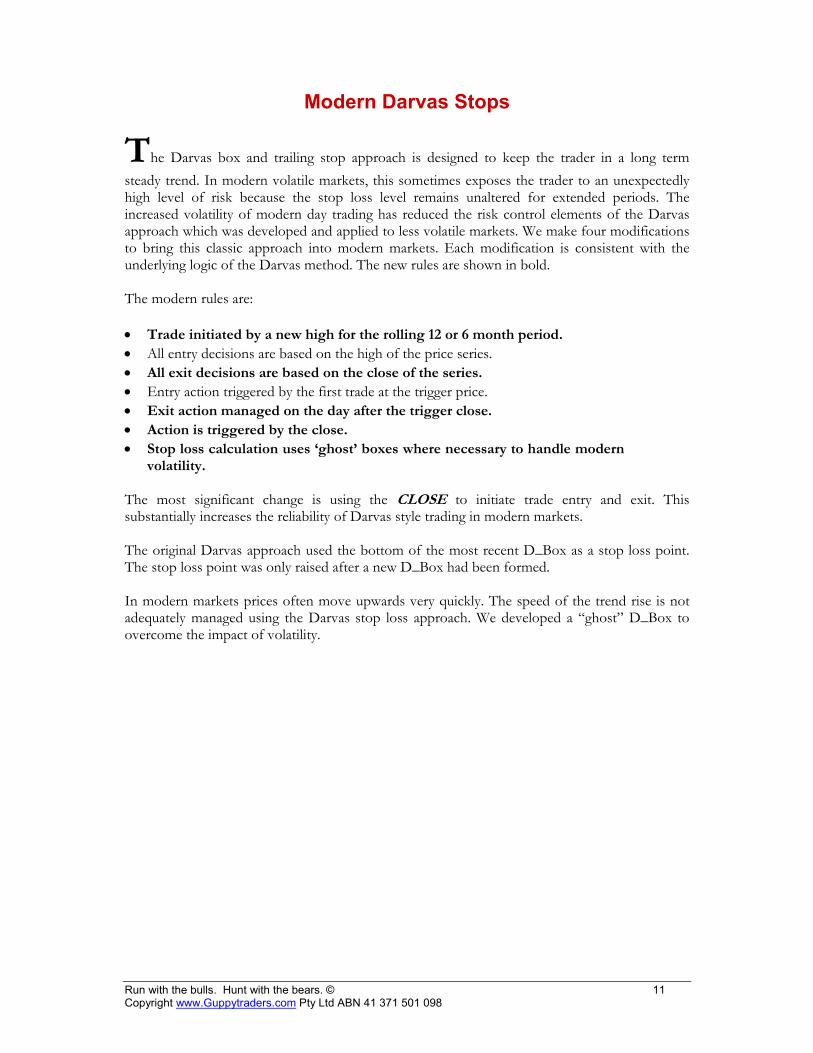
The ghost box uses the height of the last D_Box, measured in cents, to capture the current volatility of the stock. If a new D_Box does not develop quickly then we use a stepped trailing stop loss based on the height of the last box. The height of the first correctly calculated D_Box captures the current bullish and bearish range. We project this range upwards above the existing D_Box as prices move upwards. We do this by simply duplicating the permissible range of price activity as defined the box. This value is stacked on top of the previous valid D_Box. We call this a ghost box and the bottom of this box is used as a stop loss trigger. Ghost boxes are continually added until a new valid D-Box can be created. This method provides a way to set trailing stop loss point in rising trend where there is a substantial gap between validly calculated D-Boxes.
Run with the bulls. Hunt with the bears. © 13 Copyright www.Guppytraders.com Pty Ltd ABN 41 371 501 098
Breakout Darvas
The classic Darvas trading technique is well suited to established bull markets. The Darvas approach is also applied to young bull markets. This is not true breakout trading, but it helps the trader to identify strong young trends. The base modern Darvas rules remain the same, but we add another, shown in bold. The breakout rules are:
• Trade initiated by the second valid D_Box after the initial downtrend breakout. • All entry decisions are based on the high of the price series. • All exit decisions are based on the close of the series. • Entry action triggered by the first trade at the trigger price. • Exit action managed on the day after the trigger close. Action is triggered by the close. • Stop loss calculation uses ‘ghost’ boxes where necessary to handle modern volatility
Figure 8
The Darvas technique is not really designed to work with breakout trading. Darvas trading is based on new twelve month strength and bullish breakouts. Once we move into smaller time frames and apply the technique to breakouts, reliability is reduced.
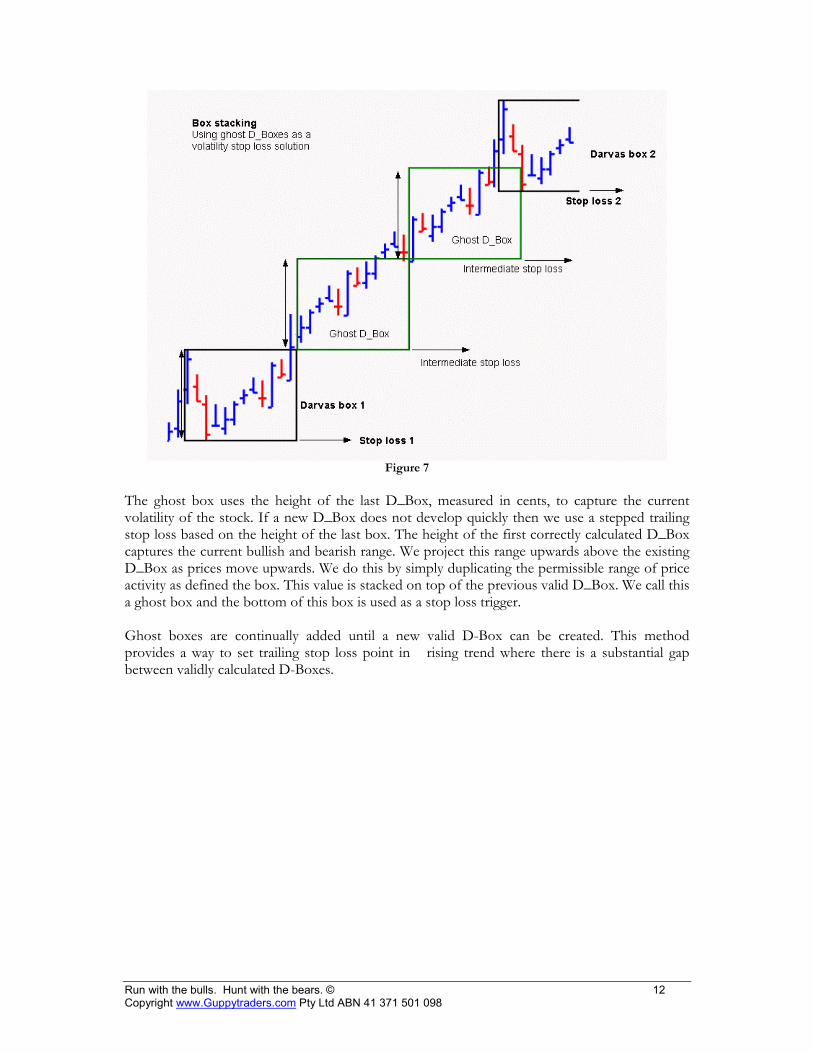
If we apply Darvas to a breakout we are unlikely to get into the trade close to the point of the breakout. Instead we look for an entry point where there is greater confirmation the new breakout is likely to turn into a trend. We use the high of this initial rally to set the top of the first Darvas box and then we set the bottom using the classic rules. The entry alert signal does not come until prices break above the initial high of the first box. The Darvas tools in Guppy Traders Essential Charting allow the application of classic and modern Darvas methods. Ghost boxes are also easily added with a Ghost box tool. The automated calculation in the indicator tools makes it easy to assess the trend compatibility with the Darvas approach.
Run with the bulls. Hunt with the bears. © 14 Copyright www.Guppytraders.com Pty Ltd ABN 41 371 501 098
Darvas trading provides a very different way of understanding trend behavior. It is based on support and resistance points created by a well defined volatility range of price activity. The feature critical to the success of the method is the exacting stop loss calculation. The stop loss trigger is the bottom of the Darvas box. A move below this is an exit trigger in the classics application. A close below this is the exit trigger in the modern application of Darvas trading.
Run with the bulls. Hunt with the bears. © 15 Copyright www.Guppytraders.com Pty Ltd ABN 41 371 501 098
Darvas in Metastock
A classic Metastock Darvas expert can developed by Matthew Ford was originally published in the weekly Tutorials in Applied Technical Analysis. These free formulas can download from www.guppytraders.com under the Trend Trading Formula button.
Name of Indicator: Darvas High Formula:
Periods:=100; { this is the only place the number of periods is set} If((Ref(H,-3) >= Ref(HHV(H,Periods),-4)) AND Ref(H,-3) > Ref(H,-2) AND Ref(H,-3) > Ref(H,-1) AND Ref(H,-3) > H, Ref(H,-3), PREVIOUS );
Name of Indicator: New Darvas High Formula:
dh:= Fml("Darvas High"); def:=IsDefined(dh) AND IsDefined(Ref(dh,-2)); (def AND Ref(def,-1)=0) + (dh AND Ref(dh,-1)<>dh);
Name of Indicator: New Darvas Low Formula:
dh:= Fml("Darvas High"); ndl:=(Ref(L,-3) < Ref(L,-2) AND Ref(L,-3) < Ref(L,-1) AND Ref(L,-3) < L AND Ref(H,-2) < dh AND Ref(H,-1) < dh AND H < dh); def:=IsDefined(dh) AND IsDefined(Ref(dh,-1)); (def AND Ref(def,-1)=0)+ (ndl AND (Ref(ndl,-1) < 1))
Name of Indicator: Darvas Low Formula:
If( Fml("New Darvas Low") , Ref(L,-3), PREVIOUS);
Name of Indicator: Darvas Box End Formula:
end:=BarsSince(Fml("New Darvas High")) < BarsSince(Ref(Fml("New Darvas Low"),-1)); def:=IsDefined(end) AND IsUndefined(Ref(end,-1)); (def AND Ref(def,-1)=0)+ (end AND Fml("New Darvas Low"))
Name of Indicator: Darvas Box High Formula:
dbe:=Fml("Darvas Box End"); dbhi:=If(dbe AND IsDefined(Ref(dbe,-1)), Fml("Darvas High"), PREVIOUS); If(dbhi=0,H+0.0000001,dbhi)
Run with the bulls. Hunt with the bears. © 16 Copyright www.Guppytraders.com Pty Ltd ABN 41 371 501 098
Name of Indicator: Darvas Box Low Formula:
dbe:=Fml("Darvas Box End"); bl:=If(dbe AND IsDefined(Ref(dbe,-1)), Fml("Darvas Low"), PREVIOUS); If(bl=0,L-0.0000001,bl)
Name of Indicator: Darvas Poss Sell Formula:
dsl:=L < Fml("Darvas Box Low"); def:=IsDefined(dsl) AND IsDefined(Ref(dsl,-1)); (def AND Ref(def,-1)=0)+(dsl AND (Ref(dsl,-1)<dsl))
Name of Indicator: Darvas Sell Formula:
sell:=BarsSince(Fml("Darvas Box End")) < BarsSince(Fml("Darvas Poss Sell")); def:=IsDefined(sell) AND IsDefined(Ref(sell,-1)); ((def AND Ref(def,-1)=0) + (sell = 0 AND Ref(sell,-1)=1))
Name of Indicator: Darvas Buy Formula:
dc:= Fml("darvas sell"); { change the following line to H>Fml("Darvas Box Hi") .. for Classic Darvas} db:= C>Fml("Darvas Box Hi") AND (BarsSince(Fml("darvas box end")) < BarsSince(Fml("darvas sell"))); dto:=If(db AND PREVIOUS=0,1,If(dc,0,PREVIOUS)); dto AND (Ref(dto,-1) =0)
Create a new Metastock Expert Advisor for Darvas. Trends tab
Bullish: C >= Fml("Darvas Box Low"); Bearish: C < Fml("Darvas Box Low");
Symbols tab Buy: up arrow graphic, formula Fml("Darvas Buy") Sell: down arrow graphic, formula Fml("Darvas Sell")
Alerts tab Buy: formula Fml("Darvas Buy") and some suitable text message such as
"buy on next open" Sell: formula Fml("Darvas Sell") and some suitable text message such as
"sell on next open"
Run with the bulls. Hunt with the bears. © 17 Copyright www.Guppytraders.com Pty Ltd ABN 41 371 501 098
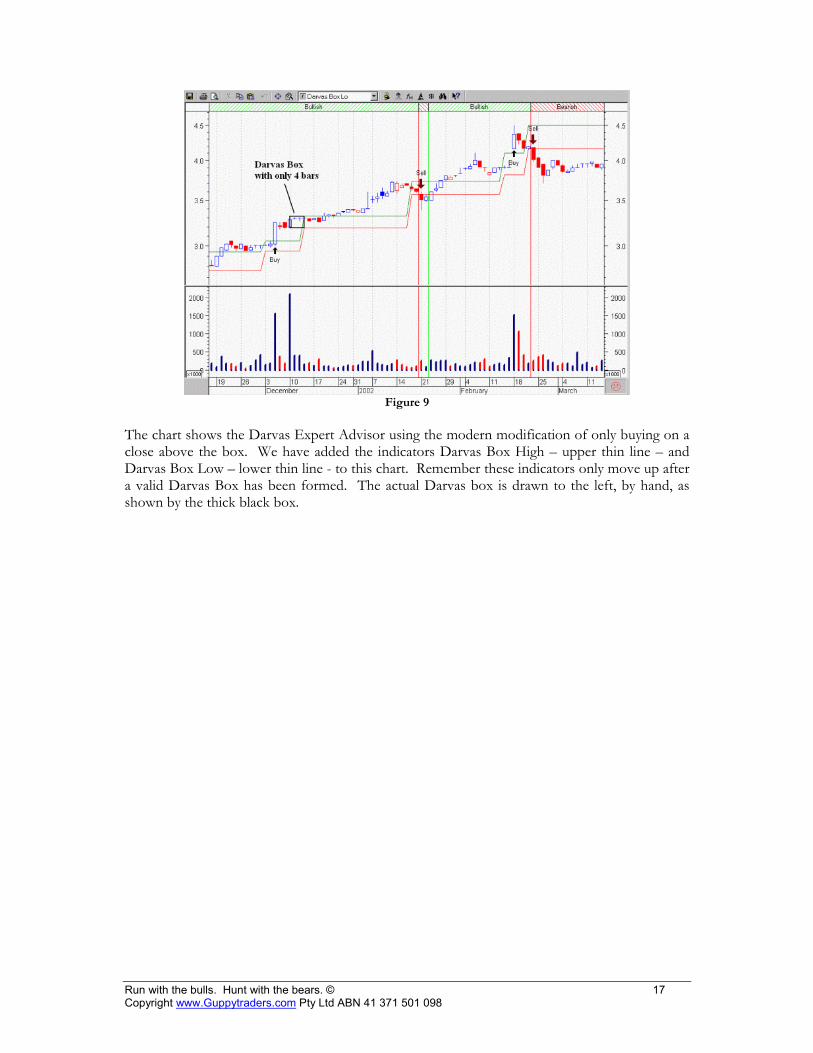
Figure 9
The chart shows the Darvas Expert Advisor using the modern modification of only buying on a close above the box. We have added the indicators Darvas Box High – upper thin line – and Darvas Box Low – lower thin line - to this chart. Remember these indicators only move up after a valid Darvas Box has been formed. The actual Darvas box is drawn to the left, by hand, as shown by the thick black box.
Run with the bulls. Hunt with the bears. © 18 Copyright www.Guppytraders.com Pty Ltd ABN 41 371 501 098
Biography
Daryl Guppy is the author of the best selling Trend Trading, Snapshot Trading and The
36 Strategies of the Chinese for Financial Traders. He is active in Australian, Asian and China markets and provides certified professional training for brokerages. He publishes a weekly newsletter that applies technical charting analysis to these markets. He runs trading workshops in Australia, Asia, China and the US and can be contacted via www.guppytraders.com