Embed Size (px)
Citation preview
NanoTrader – Charting & Trading
NanoTrader 2
Copyright
© Fipertec SARL. All rights reserved. No part of this document may be reproduced without the prior written permission of Fipertec SARL. The technology of NanoTrader is intellectual property of Fipertec SARL. This software and the accompanying files are sold “as is” and without warranties as to performance or any other warrants whether expressed or implied. In particular, Fipertec SARL is not liable for any financial disadvantages when following signals generated by NanoTrader. Any liability of Fipertec SARL will be limited exclusively to product replacement or refund of purchase price.
NanoTrader – Charting & Trading
NanoTrader 3
Contents
1 Introduction ............................................................................................... 11
2 Installation ................................................................................................. 11
3 What is NanoTrader? ................................................................................ 12
4 Getting Started .......................................................................................... 14
5 NanoTrader’s Main Window ...................................................................... 14
6 The Chart Window .................................................................................... 18
6.1 The Toolbars ...................................................................................... 18
6.2 Loading more Historical Data ............................................................. 19
6.3 Specifying the Charting Aggregation .................................................. 20
6.4 The DesignerBar – An Overview ........................................................ 21
6.4.1 Folding the DesignerBar in and out ............................................ 22
6.4.2 Description Area ......................................................................... 22
6.4.3 Changing the Settings ................................................................. 23
6.5 Adding Sentimentors .......................................................................... 23
6.6 Deleting a Sentimentor ...................................................................... 25
6.7 Visualization of a Sentimentor ........................................................... 25
6.8 Aggregation of a Sentimentor (Multiple Time Frame Analysis) .......... 26
6.9 Visual Feedback on Parameter Changes .......................................... 27
6.10 Sentimentor’s Legend Context Menu ................................................. 27
6.11 Rearranging Subwindows .................................................................. 27
6.12 Some Charting Functionality at a Glance ........................................... 29
6.13 Line-Chart, Candle Sticks, Bar-Chart ................................................. 30
6.14 Heikin-Ashi Chart ............................................................................... 30
6.15 Zooming ............................................................................................. 30
6.16 Standalone Views .............................................................................. 31
6.17 TwinCharts ......................................................................................... 31
6.17.1 Adding a TwinChart .................................................................... 32
6.17.2 Visualization of the MasterChart zoom ....................................... 32
6.17.3 Ordering functionality .................................................................. 33
6.17.4 Projection of drawn lines into the MasterChart ........................... 33
6.17.5 Projection Styles for drawn lines ................................................. 34
6.18 Time & Sales Bar ............................................................................... 36
6.19 The InfoBar ........................................................................................ 37
NanoTrader – Charting & Trading
NanoTrader 4
6.19.1 The Data Page ............................................................................ 37
6.19.2 The Sentis Page ......................................................................... 37
6.19.3 The Eval-Page ............................................................................ 38
6.20 The SpeedTrader ............................................................................... 39
6.21 Displaying the Market Depth Histogram in the MasterChart .............. 39
6.22 Displaying the MarketProfile in the MasterChart ................................ 40
6.23 Status bar ........................................................................................... 41
6.24 Visualizing Stops and Profit Targets in the MasterChart .................... 41
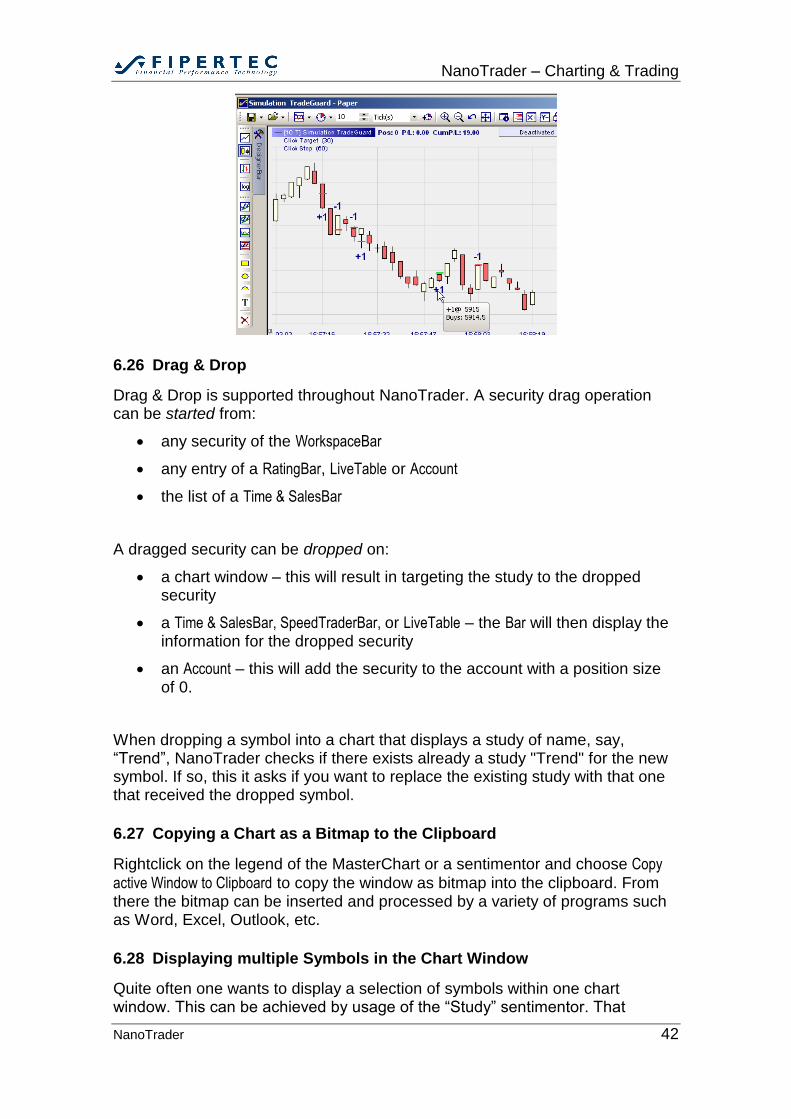
6.25 Visualizing Fills in the MasterChart .................................................... 41
6.26 Drag & Drop ....................................................................................... 42
6.27 Copying a Chart as a Bitmap to the Clipboard ................................... 42
6.28 Displaying multiple Symbols in the Chart Window ............................. 42
6.29 Saving a Study ................................................................................... 44
6.30 Save as Template Study .................................................................... 44
6.31 Save as ‘Stub’ .................................................................................... 44
7 Drawing Into a Chart ................................................................................. 45
7.1 General Notes .................................................................................... 45
7.2 Usage Modes of a Trendline and Horizontal Line .............................. 47
7.3 Defining an Alarm .............................................................................. 48
7.4 Drawing Fibonacci Levels into a Chart ............................................... 49
8 Trading with NanoTrader .......................................................................... 49
8.1 Introduction ........................................................................................ 49
8.2 Train with PaperTrading ..................................................................... 50
8.3 Creating an Account .......................................................................... 50
8.4 Loading an Account ........................................................................... 51
8.5 Closing an Account ............................................................................ 51
8.6 Structure of the AccountBar ............................................................... 51
8.7 Configuring the Account appearance ................................................. 53
8.8 Creating an Account Position ............................................................. 53
8.9 Defining the Symbol Details ............................................................... 53
8.10 Setting Order Defaults ....................................................................... 53
8.10.1 Manually Created Orders ............................................................ 54
8.10.2 Orders Created from the SpeedTrader/ChartTrader ................... 55
8.10.3 Bracket Orders ............................................................................ 55
8.10.4 Important Notes on Risks............................................................ 55
NanoTrader – Charting & Trading
NanoTrader 5
8.10.5 AutoOrder: Entry Orders ............................................................. 56
8.11 Manually Ordering .............................................................................. 58
8.12 Visual Trading: Limit/Stop Price Sliders ............................................. 60
8.13 OCO Entry Orders.............................................................................. 61
8.14 Canceling an Order ............................................................................ 62
8.15 Modifying an Order ............................................................................ 63
8.16 Assigning a Study to an Account Position .......................................... 63
8.17 States of an Assigned Study .............................................................. 63
8.18 Emergency Exit .................................................................................. 66
8.19 Notifications ....................................................................................... 66
8.20 Visual Trading: Click Stop and Click Target ....................................... 66
8.21 Visual Trading: Using Trendlines as Stops ........................................ 67
8.22 The Completed Orders page ............................................................. 68
8.23 DayTrading Statistics ......................................................................... 69
8.23.1 The DayTrading Statistics Dialog ................................................ 69
8.23.2 Definition of a Trade ................................................................... 71
8.23.3 Manually adding fills .................................................................... 72
8.23.4 Fills from Interactive Brokers ...................................................... 73
9 Visual Trading: Tactics and TacticOrders ................................................. 73
9.1 Tactics ................................................................................................ 73
9.1.1 Tactics - How they work .............................................................. 73
9.1.2 Tactics and the TradeGuard ....................................................... 76
9.1.3 Available Tactics ......................................................................... 78
9.2 TacticOrders ...................................................................................... 81
9.2.1 Creating a TacticOrder ................................................................ 81
9.2.2 The “Create TacticOrder” Dialog ................................................. 81
9.2.3 General Settings ......................................................................... 82
9.2.4 Choosing the Active Sentimentors .............................................. 83
9.2.5 Defining the Signal Criteria ......................................................... 84
9.2.6 Defining Long/Short Thresholds ................................................. 85
9.2.7 Order Confirmation and Report................................................... 85
9.2.8 Placing a TacticOrder ................................................................. 86
9.2.9 Modifying a TacticOrder .............................................................. 86
9.2.10 Canceling a TacticOrder ............................................................. 88
9.2.11 Completed TacticOrders ............................................................. 88
NanoTrader – Charting & Trading
NanoTrader 6
9.2.12 Adding or Removing Sentimentors while TacticOrders are active 88
9.2.13 TacticOrder Evaluation ............................................................... 88
10 Visual Trading with the SpeedTrader .................................................... 89
10.1 Patsystems’ Reflector technology ...................................................... 89
10.2 Opening a SpeedTrader .................................................................... 89
10.3 Information shown by the SpeedTrader ............................................. 90
10.3.1 OrderPad .................................................................................... 90
10.3.2 Price Table .................................................................................. 90
10.3.3 Inside Market Indication .............................................................. 92
10.4 Configuring a SpeedTrader ................................................................ 92
10.5 Trading with the SpeedTrader ........................................................... 92
10.6 Using Hot-Keys .................................................................................. 94
10.6.1 Defining Hot Keys ....................................................................... 94
10.7 Defining Order Types ......................................................................... 95
10.8 Trading with the ChartTrader ............................................................. 95
10.9 Using the Reflector mode .................................................................. 96
10.9.1 Holding Prices ............................................................................. 96
10.9.2 Holding Working Orders ............................................................. 98
10.9.3 Inside Market .............................................................................. 99
10.9.4 Orders of the Inside Market ...................................................... 100
11 Using Multiple Stops and Profit Targets .............................................. 101
11.1 Overview .......................................................................................... 101
11.2 Activating Multiple Stops and Profit Targets .................................... 101
11.3 Assigning Volume to the Targets and Stops .................................... 102
11.4 Display of the Profit Targets and Stops in the MasterChart ............. 103
11.5 Monitoring of the Current Risk and Intended Profit .......................... 104
11.6 Automatic Adaptation of Bracket Orders .......................................... 105
11.7 Using Multiple Stops and Profit Targets in AutoOrder Mode ........... 106
11.8 Automatic Handling of Overfills ........................................................ 107
11.9 Backtesting Using Multiple Stops and Profit Targets ....................... 107
12 Disclaimer Concerning Automatic Order Creation ............................... 108
13 Express – Adding Building blocks to NanoTrader ............................... 108
14 Using the PageManager ...................................................................... 108
15 Using the HotKey Manager .................................................................. 109
NanoTrader – Charting & Trading
NanoTrader 7
15.1.1 Overview ................................................................................... 109
15.1.2 Assigning a Hot Key to a study ................................................. 110
15.1.3 Trading with Hot Keys ............................................................... 111
15.1.4 Deactivation of the HotKeys ...................................................... 112
16 Using Stops ......................................................................................... 112
16.1 Time based Stops ............................................................................ 113
16.2 Price based Stops ............................................................................ 114
16.3 Click Stop / Click Target ................................................................... 115
16.4 Trailing Stop / Trailing Stop EoP ...................................................... 115
16.5 Profit Target ..................................................................................... 116
16.6 Time Stop......................................................................................... 116
16.7 Parabolic Stop .................................................................................. 116
16.8 Linear Stop ....................................................................................... 117
16.9 KaseDev Stop .................................................................................. 117
16.10 PeriodsHighLow Stop ................................................................... 118
16.11 BreakEven Stop / BreakEven Stop EoP ....................................... 118
16.12 Trendline Stop .............................................................................. 119
16.13 Trendchannel Stop ....................................................................... 119
17 OneClick Recording and Playback ...................................................... 119
17.1 Converting a Zoom in a MasterChart into a Recording .................... 120
17.2 Create a PlayBack for the Last Trading Session ............................. 121
17.3 Using Live Recording ....................................................................... 121
17.4 Playback of Recordings ................................................................... 122
17.5 A Note on PaperTrading with PlayBacks ......................................... 123
18 LiveTables ........................................................................................... 123
18.1 What is a LiveTable? ....................................................................... 123
18.2 Opening a LiveTable? ...................................................................... 123
18.3 Creating a new LiveTable? .............................................................. 124
18.4 Adding Symbols to a LiveTable........................................................ 124
18.5 Attaching a study to a LiveTable’s symbol ....................................... 125
18.6 Removing a study from a LiveTable ................................................. 126
18.7 Specifying Notifications .................................................................... 126
18.8 Changing the Ordering of the Columns ............................................ 127
18.9 Saving a LiveTable .......................................................................... 127
18.10 Displaying the Charts of a LiveTable study .................................. 127
NanoTrader – Charting & Trading
NanoTrader 8
18.11 Sorting and AutoSorting ............................................................... 128
18.12 Configuring Columns .................................................................... 129
19 LiveStatistics ........................................................................................ 131
19.1 What is LiveStatistics? ..................................................................... 131
19.2 The Basics of LiveStatistics ............................................................. 132
19.3 Configuring the LiveStatistics Sentimentor ...................................... 142
19.3.1 Increasing the Space for Showing the LiveStatistics graphics .. 142
19.3.2 Adding the LiveStatistics Sentimentor to a Study ..................... 142
19.3.3 Price Data parameters .............................................................. 143
19.3.4 Selection parameters ................................................................ 144
19.3.5 Projection parameters ............................................................... 148
19.3.6 Visualization parameters ........................................................... 149
19.3.7 More on the Visualization .......................................................... 154
19.3.8 The LiveStatistics Sentimentor and Trading Systems .............. 156
19.4 A Note of Caution ............................................................................. 156
20 External triggers................................................................................... 156
20.1 What is an external trigger? ............................................................. 156
20.2 Configuration of an external trigger .................................................. 157
20.3 Configuration defaults and monitored directory ............................... 159
20.4 More on external triggers ................................................................. 160
21 Linking Bars and Charts to the Same Symbol ..................................... 161
22 Options ................................................................................................ 162
22.1 Group “General” ............................................................................... 162
23 Working with Patsystems .................................................................... 164
24 Working with CQG ............................................................................... 165
24.1 Installing the CQG-API ..................................................................... 165
24.2 Logging in ........................................................................................ 165
24.3 Handling an already running CQG-API process............................... 166
24.4 Handling SpeedTrader (DOM = Depth of Market) subscriptions ...... 167
24.5 Trading Options on Futures with CQG ............................................. 168
24.5.1 Getting Started .......................................................................... 168
24.5.2 Adding Options ......................................................................... 169
24.5.3 Removing an Option ................................................................. 170
24.5.4 Examples for Tradable Options ................................................ 171
25 Working with WHS CFD/Forex Trading ............................................... 172

NanoTrader – Charting & Trading
NanoTrader 9
25.1 Logging in ........................................................................................ 172
25.2 Settings for WHS CFD/Forex Trading .............................................. 172
25.2.1 General settings ........................................................................ 173
25.2.2 Automatic Price / Order type adjustments ................................ 173
25.3 More Implications of Over-The-Counter vs. Exchanges ................... 174
25.3.1 Interpretation of the Charts – Bid Charts .................................. 174
25.3.2 Using the ChartTrader vs. the SpeedTrader ............................. 175
25.3.3 No AutoAsk/AutoBid Option for Placing Orders ........................ 175
25.4 Advanced Order Types .................................................................... 175
25.4.1 TrailingStop Order..................................................................... 175
25.4.2 Parent & Contingent Orders ...................................................... 176
25.4.3 OCO-Server Orders .................................................................. 178
25.4.4 Limit/Stop-OCO-Server Orders used in TradeGuards .............. 179
25.4.5 TradeGuard in Conjunction with P&C orders ............................ 179
25.5 Working with Price Alarms ............................................................... 180
25.6 Working with PlayBacks ................................................................... 180
26 Working with Interactive Brokers ......................................................... 180
26.1 Settings at the TWS ......................................................................... 180
26.2 Creating an Interactive Brokers Account .......................................... 182
26.3 Specifying Symbols .......................................................................... 182
26.4 Transmitting Changes made in TWS to NanoTrader ....................... 185
26.5 Remarks on using IB data for Charting ............................................ 185
26.6 Assigning historical data from vwd group or eSignal to IB symbols . 185
26.7 Excluding a Symbol from Retrieving Historical Data ........................ 187
26.8 Java Problems ................................................................................. 188
27 Accessing Price Data .......................................................................... 189
27.1 Accessing MetaStock data ............................................................... 189
27.2 Accessing Quote Files ..................................................................... 190
27.2.1 Filename of a Quote File .......................................................... 190
27.2.2 Structure of a Quotes File Line ................................................. 190
27.2.3 The Date Format ....................................................................... 192
27.2.4 The Time Format ...................................................................... 192
27.2.5 The Number Format ................................................................. 193
27.2.6 Missing Values .......................................................................... 193
27.3 Accessing eSignal Data ................................................................... 193
NanoTrader – Charting & Trading
NanoTrader 10
27.4 Accessing CQG Data ....................................................................... 195
27.5 Using the DDE interface .................................................................. 197
27.6 Simulation of Realtime Data ............................................................ 198
28 Backup................................................................................................. 198
29 Cleaning Up ......................................................................................... 199
30 Entering the License Key ..................................................................... 199
31 Feedback ............................................................................................. 199
NanoTrader – Charting & Trading
NanoTrader 11
1 Introduction
Welcome to the world of NanoTrader! This document guides you through the installation process and explains how to work with NanoTrader. It focuses on the functionality of NanoTrader concerning Charting and Trading.
The additional documentation is structured as follows:
NanoTrader – TradingSystems concentrates specifically on the creation of trading systems, optimization, robustness and Walkforward simulation. You will also find the description of the built-in indicators in that document.
NanoTrader-Express describes the programming language Express and the development environment.
All documents are available through NanoTrader’s Help menu.
Depending on your license some functionality might be disabled and thus your windows might slightly differ from the screenshots presented in the documentation. For upgrading of your license please contact your broker or Fipertec.
2 Installation
For installing NanoTrader doubleclick the file NanoTrader_install_all.exe that can be downloaded from
www.fipertec.com and follow the instructions of the setup procedure. Usually the default settings can be used without any changes. After finishing the setup procedure NanoTrader can be started from the windows task bar using Start|Programs|NanoTrader.
By default NanoTrader is installed in the directory c:\Programs\Fipertec\NanoTrader. This directory, or the one you have
chosen in the setup, will be denoted the installation directory.
Detailed information about connecting to your data provider or local data base can be found in the chapter Accessing Price Data. In case NanoTrader is provided to you by your broker please follow the instructions of the broker. In that case NanoTrader will be completely equipped with access to price data and your trading account.
NanoTrader is backward compatible with its predecessor DySen. In case you have a DySen installation on your PC NanoTrader will ask you if you want to import your DySen environment. You might do so, however, you could also start with a fresh installation and copy your DySen studies manually later.
NanoTrader – Charting & Trading
NanoTrader 12
3 What is NanoTrader?
NanoTrader is Fipertec’s next generation product that aims to bring automated trading combined with charting to a whole new level. A decade of experiences and the feedback of thousands of users led to the new design and functionalities presented in NanoTrader.
The main focus of NanoTrader is ease of use paired with unparalleled automated trading capabilities.
NanoTrader consists of a selection of individual modules including charting, manual ordering, trading from the charts, advanced position closing management, and fully automated trading with trading systems. All this functionality is provided in a way that does not require any programming knowledge by the user. However, the Express programming module is optionally available for programmers to enrich the building blocks available in NanoTrader.
In addition, Fipertec is proud to present its latest innovation called Tactics as a major part of NanoTrader.
Tactics is a powerful new technology allowing traders to instantly modify orders and to assign a certain predefined Tactic with a single click of the mouse to a given working order. Depending on the current market situation the trader can decide what tactic is appropriate – and activate it right away without going through lengthy and error prone dialogs.
Want to turn a static stop into a trailing stop? One click. Want to secure your profit once your are break even? One click. Want to move an entry order one tick ahead of the market? One click. Want to move a stop one tick without needing to slide it extremely precisely? One click.
Tactics seamlessly integrates with all of NanoTrader’s auto order capabilities such as TradeGuards and fully automized studies.
Sentimentors – Indicators made alive
NanoTrader is not only the tool of choice for charting and trading, but also when it comes to create full fledged trading systems. The basis for trading systems created with NanoTrader are so-called Sentimentors. A sentimentor is a building block that assigns a sentiment to each period of the chart. A sentiment is a value on a scale of 0 to 100. On this scale 0 represents the worst sentiment and 100 the best. For example, the “Crossing Moving Average” sentimentor would assign a 100 on upward crossings and a 0 on downward crossings. By this simple and intuitive approach each indicator becomes alive. It is not just a drawing on the screen that the trader has to interpret over and over again. Instead, it emits a sentiment at each period thus giving an evaluation of the market from the indicator’s perspective.
NanoTrader allows you to combine any indicators of your choice and to condense their respective sentiments into an overall sentiment. This is achieved by the so-called MetaSentimentor.

NanoTrader – Charting & Trading
NanoTrader 13
This elegant usage of sentiments allows you to include anything into a trading system: indicators, formation analyses, fundamental analyses, Fibonacci retracements, candlestick formations, etc. In addition, fuzzy information and intuitions can also be combined and analyzed in a standardized form.
Throughout this document we will use the terms indicator and sentimentor as synonyms.
NanoTrader’s Instant Backtesting will display all trading signals and statistics continuously as you change your trading system parameters and as live data arrives at your system – there is no need for specific procedures to evaluate the system.
NanoTrader is equipped with the fastest and most flexible optimization engine currently available on the market. This will give you the power to test and polish your trading ideas in-depth.
Once you are satisfied with your trading system you might use it for supporting your discretionary trading style or you can activate it for automatic live trading with just one click.
Enjoy NanoTrader
NanoTrader has a rich functionality to explore. In addition to reading this documentation you should view some of the videos presented in the Help Center – this will give you an excellent start for the usage of NanoTrader.
For learning more about creating and testing trading systems please see the list of Fipertec seminars on this topic as well as online lectures given at www.fipertec.com and www.fipertec.de.
Fipertec is greatly interested in receiving feedback from you and to add functionality aiding you in your daily trading processes. Please do not hesitate to submit your feedback to [email protected].
NanoTrader – Charting & Trading
NanoTrader 14
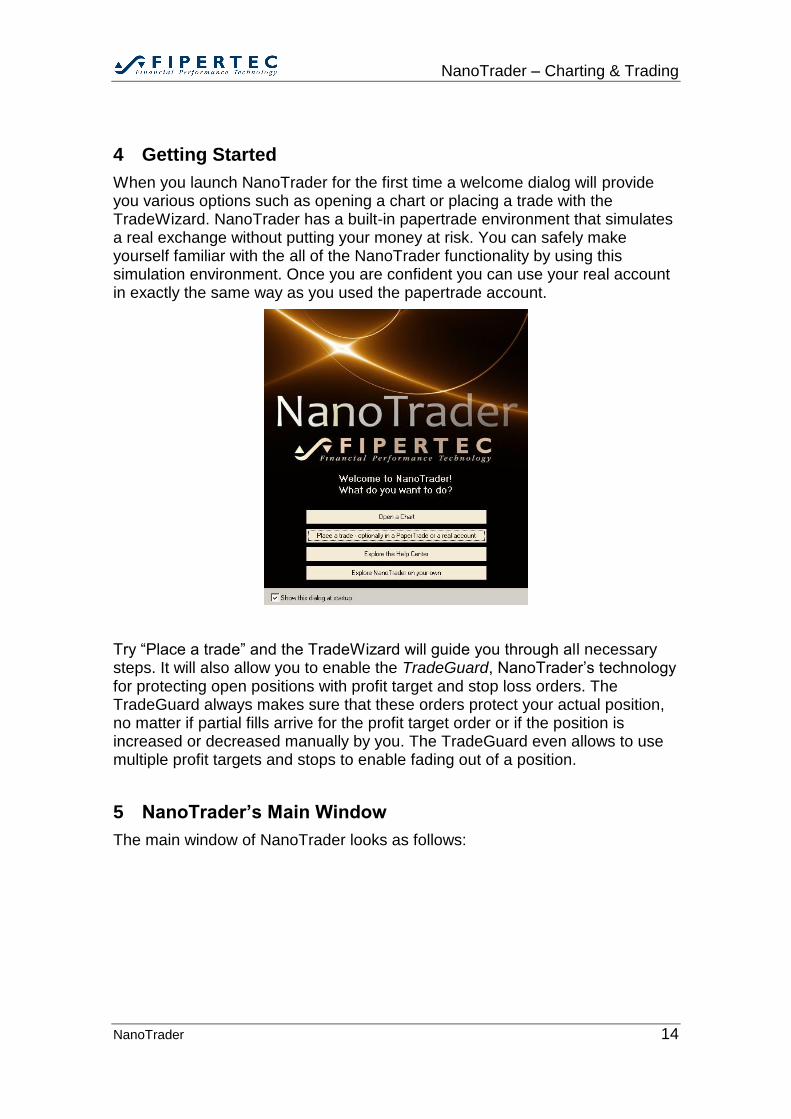
4 Getting Started
When you launch NanoTrader for the first time a welcome dialog will provide you various options such as opening a chart or placing a trade with the TradeWizard. NanoTrader has a built-in papertrade environment that simulates a real exchange without putting your money at risk. You can safely make yourself familiar with the all of the NanoTrader functionality by using this simulation environment. Once you are confident you can use your real account in exactly the same way as you used the papertrade account.
Try “Place a trade” and the TradeWizard will guide you through all necessary steps. It will also allow you to enable the TradeGuard, NanoTrader’s technology for protecting open positions with profit target and stop loss orders. The TradeGuard always makes sure that these orders protect your actual position, no matter if partial fills arrive for the profit target order or if the position is increased or decreased manually by you. The TradeGuard even allows to use multiple profit targets and stops to enable fading out of a position.
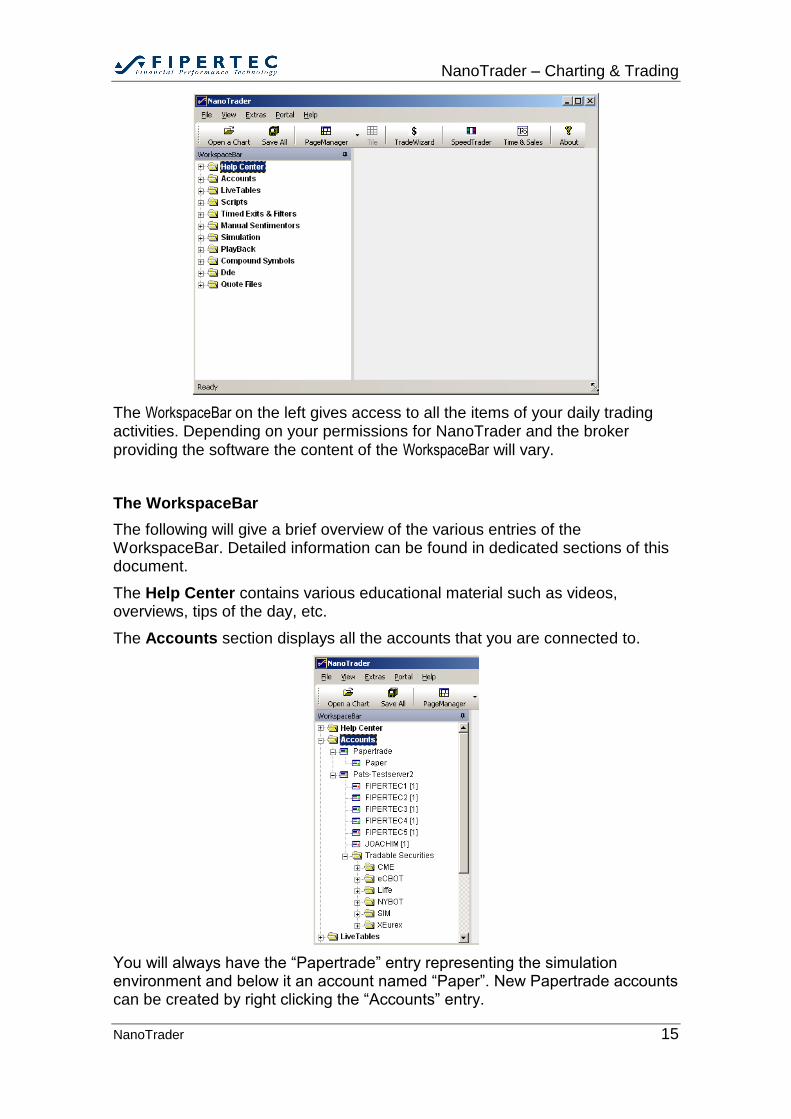
5 NanoTrader’s Main Window
The main window of NanoTrader looks as follows:
NanoTrader – Charting & Trading
NanoTrader 15
The WorkspaceBar on the left gives access to all the items of your daily trading activities. Depending on your permissions for NanoTrader and the broker providing the software the content of the WorkspaceBar will vary.
The WorkspaceBar
The following will give a brief overview of the various entries of the WorkspaceBar. Detailed information can be found in dedicated sections of this document.
The Help Center contains various educational material such as videos, overviews, tips of the day, etc.
The Accounts section displays all the accounts that you are connected to.
You will always have the “Papertrade” entry representing the simulation environment and below it an account named “Paper”. New Papertrade accounts can be created by right clicking the “Accounts” entry.
NanoTrader – Charting & Trading
NanoTrader 16
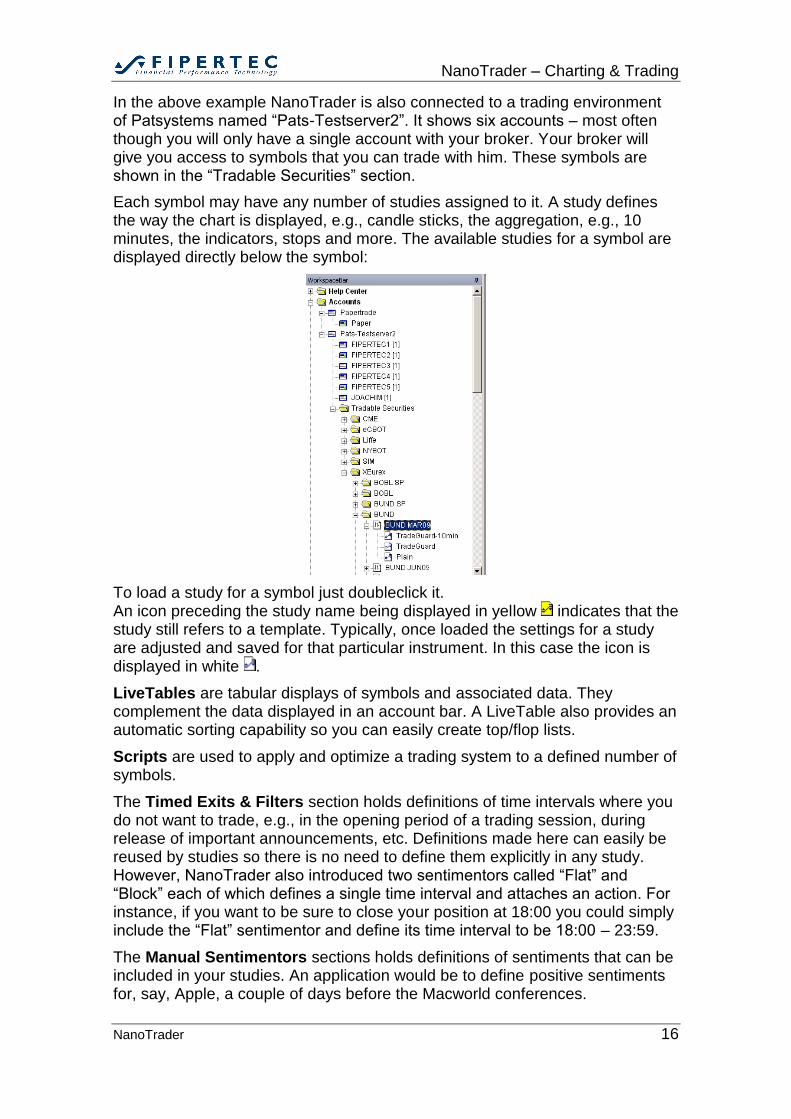
In the above example NanoTrader is also connected to a trading environment of Patsystems named “Pats-Testserver2”. It shows six accounts – most often though you will only have a single account with your broker. Your broker will give you access to symbols that you can trade with him. These symbols are shown in the “Tradable Securities” section.
Each symbol may have any number of studies assigned to it. A study defines the way the chart is displayed, e.g., candle sticks, the aggregation, e.g., 10 minutes, the indicators, stops and more. The available studies for a symbol are displayed directly below the symbol:
To load a study for a symbol just doubleclick it. An icon preceding the study name being displayed in yellow indicates that the study still refers to a template. Typically, once loaded the settings for a study are adjusted and saved for that particular instrument. In this case the icon is displayed in white .
LiveTables are tabular displays of symbols and associated data. They complement the data displayed in an account bar. A LiveTable also provides an automatic sorting capability so you can easily create top/flop lists.
Scripts are used to apply and optimize a trading system to a defined number of symbols.
The Timed Exits & Filters section holds definitions of time intervals where you do not want to trade, e.g., in the opening period of a trading session, during release of important announcements, etc. Definitions made here can easily be reused by studies so there is no need to define them explicitly in any study. However, NanoTrader also introduced two sentimentors called “Flat” and “Block” each of which defines a single time interval and attaches an action. For instance, if you want to be sure to close your position at 18:00 you could simply include the “Flat” sentimentor and define its time interval to be 18:00 – 23:59.
The Manual Sentimentors sections holds definitions of sentiments that can be included in your studies. An application would be to define positive sentiments for, say, Apple, a couple of days before the Macworld conferences.
NanoTrader – Charting & Trading
NanoTrader 17
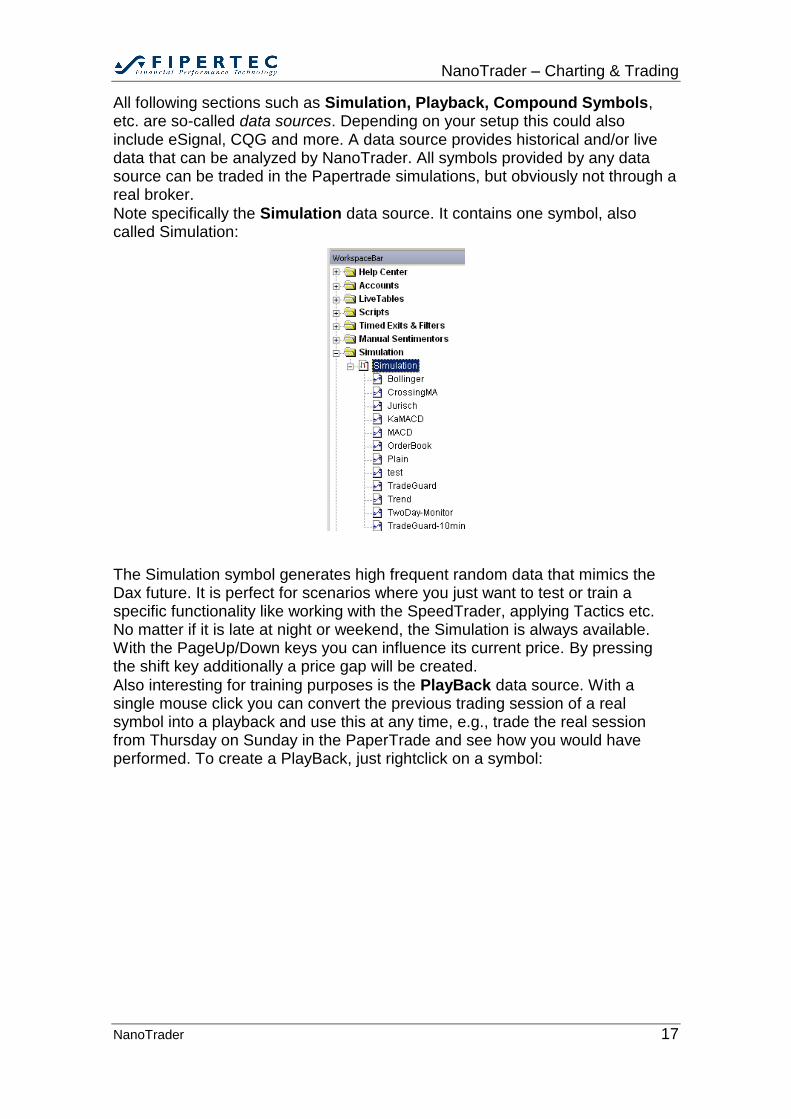
All following sections such as Simulation, Playback, Compound Symbols, etc. are so-called data sources. Depending on your setup this could also include eSignal, CQG and more. A data source provides historical and/or live data that can be analyzed by NanoTrader. All symbols provided by any data source can be traded in the Papertrade simulations, but obviously not through a real broker.
Note specifically the Simulation data source. It contains one symbol, also called Simulation:
The Simulation symbol generates high frequent random data that mimics the Dax future. It is perfect for scenarios where you just want to test or train a specific functionality like working with the SpeedTrader, applying Tactics etc. No matter if it is late at night or weekend, the Simulation is always available. With the PageUp/Down keys you can influence its current price. By pressing the shift key additionally a price gap will be created.
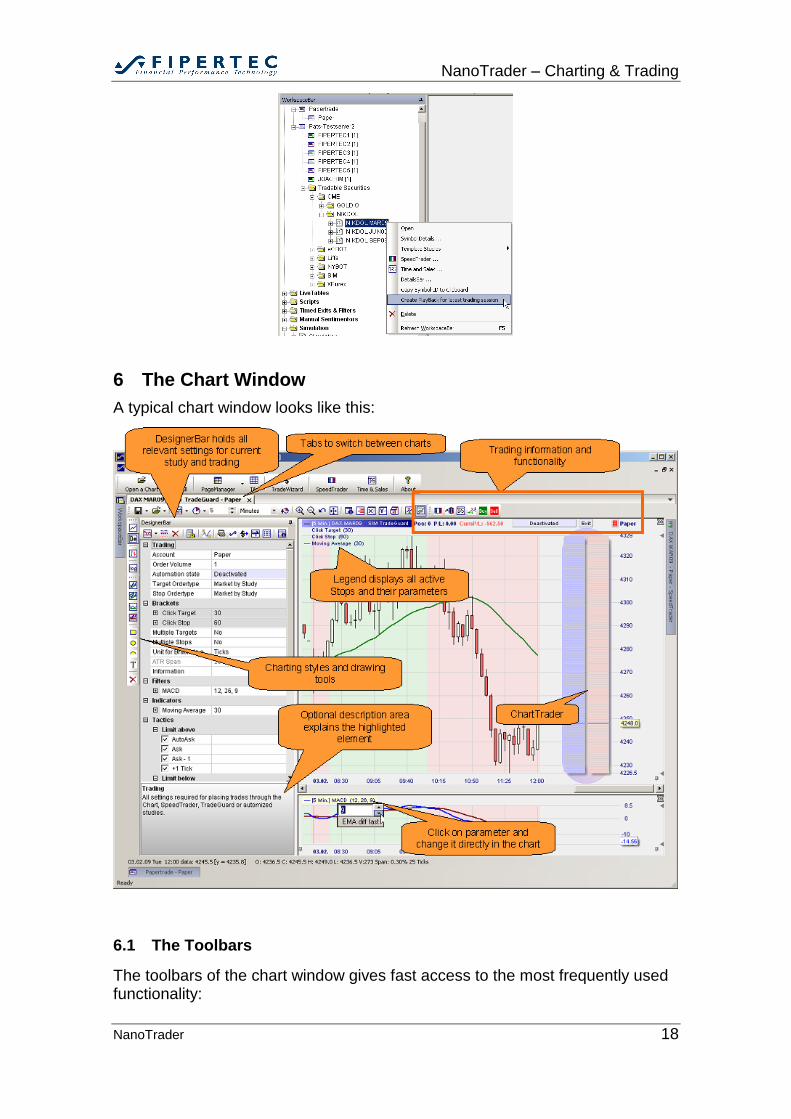
Also interesting for training purposes is the PlayBack data source. With a single mouse click you can convert the previous trading session of a real symbol into a playback and use this at any time, e.g., trade the real session from Thursday on Sunday in the PaperTrade and see how you would have performed. To create a PlayBack, just rightclick on a symbol:
NanoTrader – Charting & Trading
NanoTrader 18
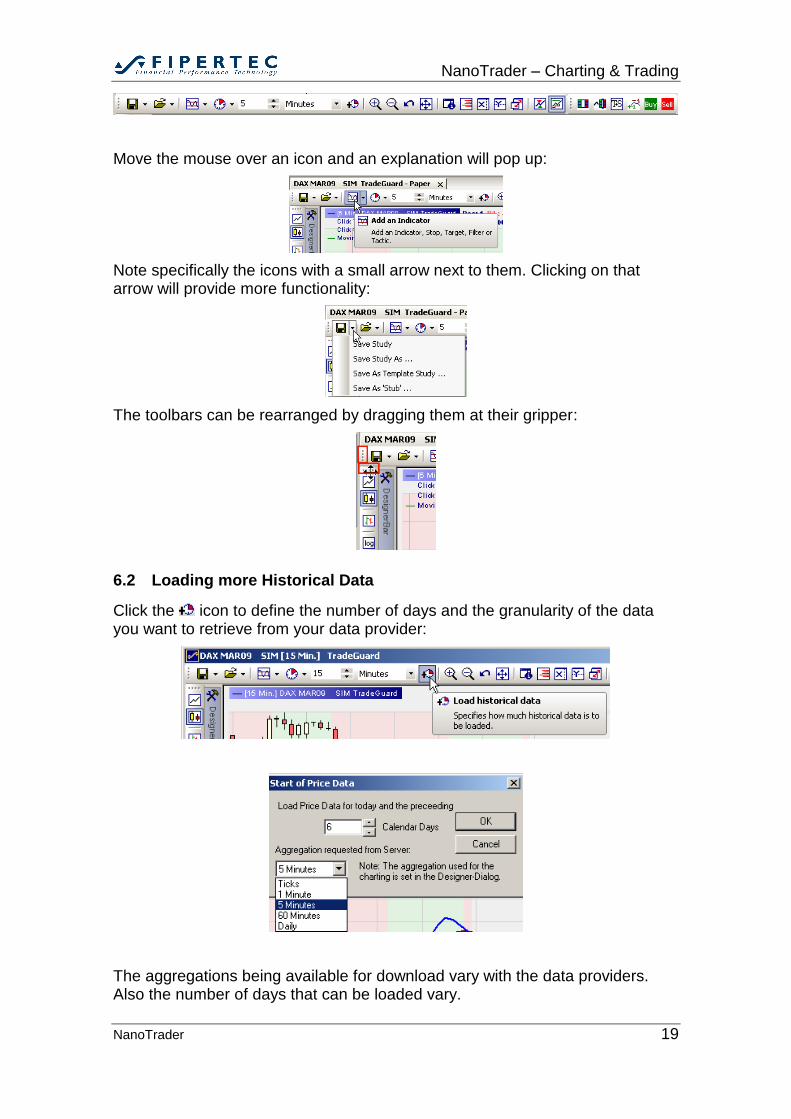
6 The Chart Window
A typical chart window looks like this:
6.1 The Toolbars
The toolbars of the chart window gives fast access to the most frequently used functionality:
NanoTrader – Charting & Trading
NanoTrader 19
Move the mouse over an icon and an explanation will pop up:
Note specifically the icons with a small arrow next to them. Clicking on that arrow will provide more functionality:
The toolbars can be rearranged by dragging them at their gripper:
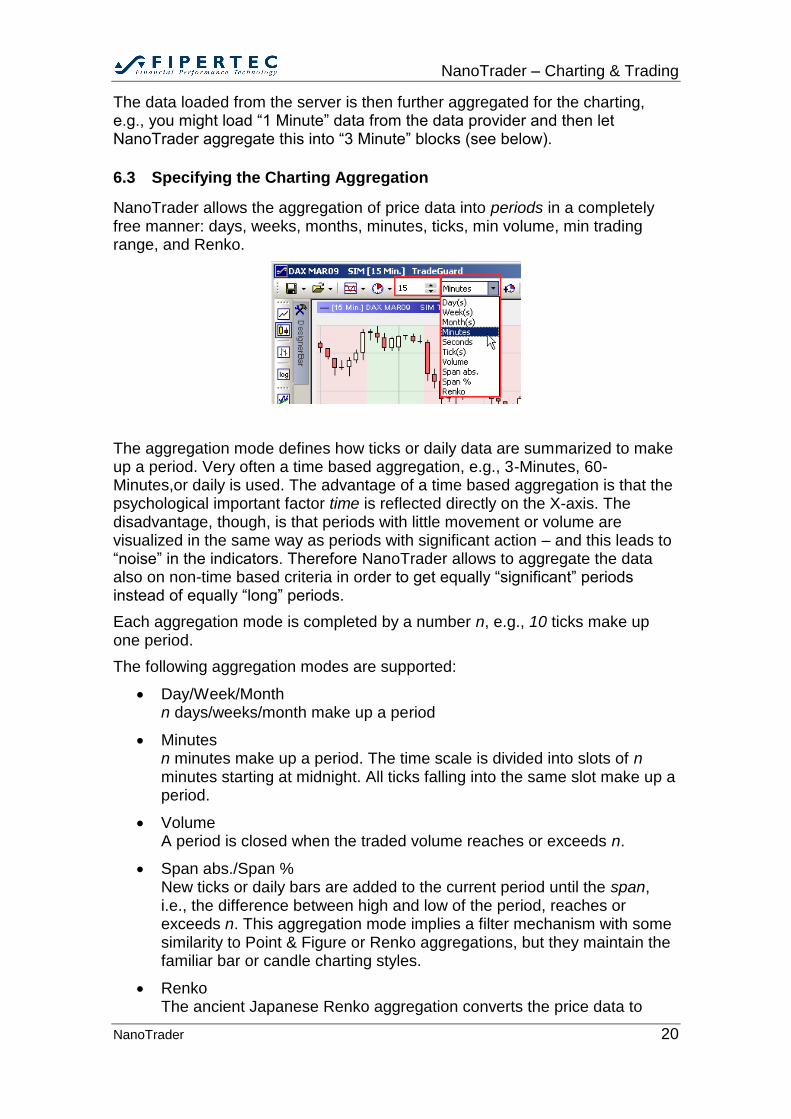
6.2 Loading more Historical Data
Click the icon to define the number of days and the granularity of the data you want to retrieve from your data provider:
The aggregations being available for download vary with the data providers. Also the number of days that can be loaded vary.
NanoTrader – Charting & Trading
NanoTrader 20
The data loaded from the server is then further aggregated for the charting, e.g., you might load “1 Minute” data from the data provider and then let NanoTrader aggregate this into “3 Minute” blocks (see below).
6.3 Specifying the Charting Aggregation
NanoTrader allows the aggregation of price data into periods in a completely free manner: days, weeks, months, minutes, ticks, min volume, min trading range, and Renko.
The aggregation mode defines how ticks or daily data are summarized to make up a period. Very often a time based aggregation, e.g., 3-Minutes, 60-Minutes,or daily is used. The advantage of a time based aggregation is that the psychological important factor time is reflected directly on the X-axis. The disadvantage, though, is that periods with little movement or volume are visualized in the same way as periods with significant action – and this leads to “noise” in the indicators. Therefore NanoTrader allows to aggregate the data also on non-time based criteria in order to get equally “significant” periods instead of equally “long” periods.
Each aggregation mode is completed by a number n, e.g., 10 ticks make up one period.
The following aggregation modes are supported:
Day/Week/Month n days/weeks/month make up a period
Minutes n minutes make up a period. The time scale is divided into slots of n minutes starting at midnight. All ticks falling into the same slot make up a period.
Volume A period is closed when the traded volume reaches or exceeds n.
Span abs./Span % New ticks or daily bars are added to the current period until the span, i.e., the difference between high and low of the period, reaches or exceeds n. This aggregation mode implies a filter mechanism with some similarity to Point & Figure or Renko aggregations, but they maintain the familiar bar or candle charting styles.
Renko The ancient Japanese Renko aggregation converts the price data to
NanoTrader – Charting & Trading
NanoTrader 21
exclude noise automatically. To achieve this it packs the prices into so called bricks. New bricks are created only if the brick size, as defined by the numeric value n as an absolute value, is reached. The color of gap
bricks can be defined through the ColorManager.
All sentimentors are applied on the data resulting from the aggregation.
For realtime securities, each new trading day starts a new period.
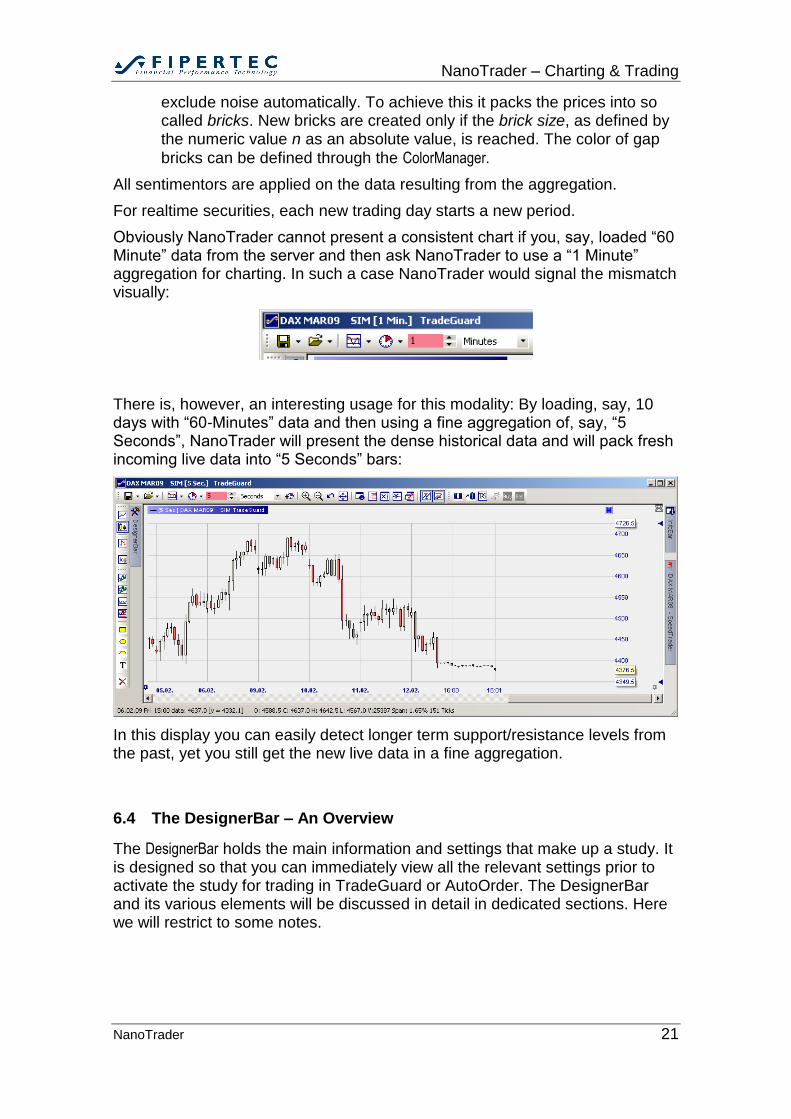
Obviously NanoTrader cannot present a consistent chart if you, say, loaded “60 Minute” data from the server and then ask NanoTrader to use a “1 Minute” aggregation for charting. In such a case NanoTrader would signal the mismatch visually:
There is, however, an interesting usage for this modality: By loading, say, 10 days with “60-Minutes” data and then using a fine aggregation of, say, “5 Seconds”, NanoTrader will present the dense historical data and will pack fresh incoming live data into “5 Seconds” bars:
In this display you can easily detect longer term support/resistance levels from the past, yet you still get the new live data in a fine aggregation.
6.4 The DesignerBar – An Overview
The DesignerBar holds the main information and settings that make up a study. It is designed so that you can immediately view all the relevant settings prior to activate the study for trading in TradeGuard or AutoOrder. The DesignerBar and its various elements will be discussed in detail in dedicated sections. Here we will restrict to some notes.
NanoTrader – Charting & Trading
NanoTrader 22
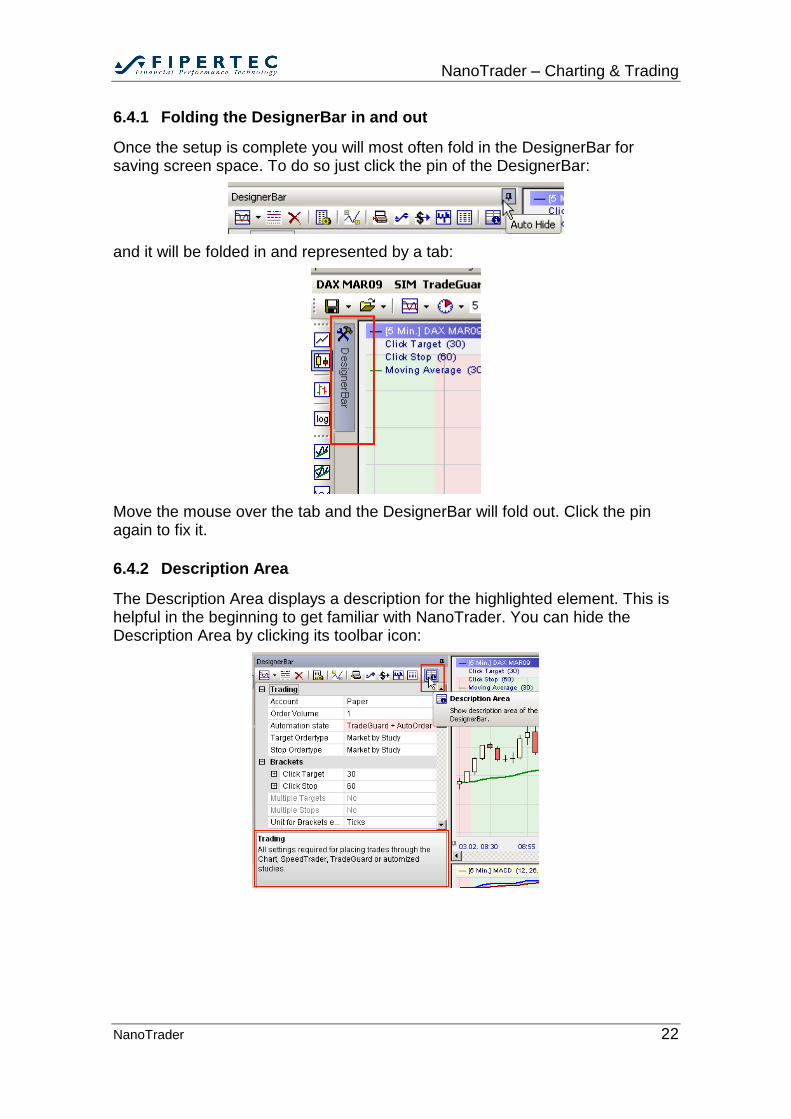
6.4.1 Folding the DesignerBar in and out
Once the setup is complete you will most often fold in the DesignerBar for saving screen space. To do so just click the pin of the DesignerBar:
and it will be folded in and represented by a tab:
Move the mouse over the tab and the DesignerBar will fold out. Click the pin again to fix it.
6.4.2 Description Area
The Description Area displays a description for the highlighted element. This is helpful in the beginning to get familiar with NanoTrader. You can hide the Description Area by clicking its toolbar icon:
NanoTrader – Charting & Trading
NanoTrader 23
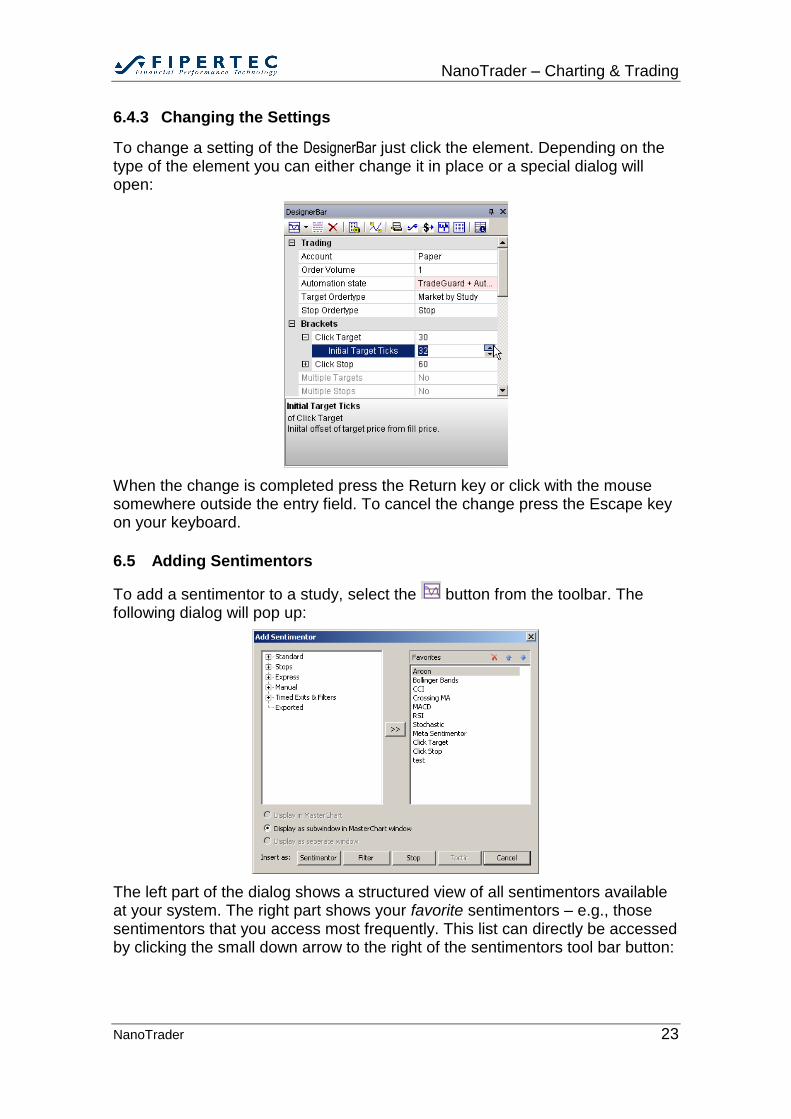
6.4.3 Changing the Settings
To change a setting of the DesignerBar just click the element. Depending on the type of the element you can either change it in place or a special dialog will open:
When the change is completed press the Return key or click with the mouse somewhere outside the entry field. To cancel the change press the Escape key on your keyboard.
6.5 Adding Sentimentors
To add a sentimentor to a study, select the button from the toolbar. The following dialog will pop up:
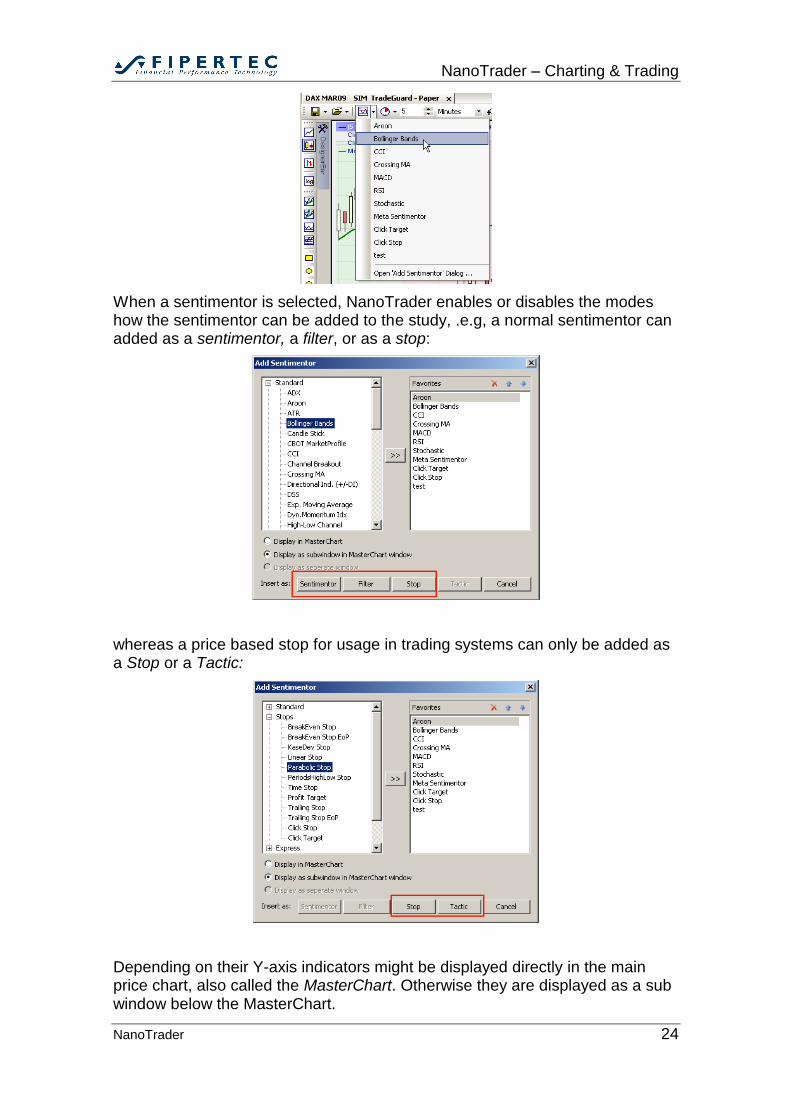
The left part of the dialog shows a structured view of all sentimentors available at your system. The right part shows your favorite sentimentors – e.g., those sentimentors that you access most frequently. This list can directly be accessed by clicking the small down arrow to the right of the sentimentors tool bar button:
NanoTrader – Charting & Trading
NanoTrader 24
When a sentimentor is selected, NanoTrader enables or disables the modes how the sentimentor can be added to the study, .e.g, a normal sentimentor can added as a sentimentor, a filter, or as a stop:
whereas a price based stop for usage in trading systems can only be added as a Stop or a Tactic:
Depending on their Y-axis indicators might be displayed directly in the main price chart, also called the MasterChart. Otherwise they are displayed as a sub window below the MasterChart.
NanoTrader – Charting & Trading
NanoTrader 25
More details on adding sentimentors as Stops or Filters can be found in the accompanying NanoTrader – TradingSystems documentation.
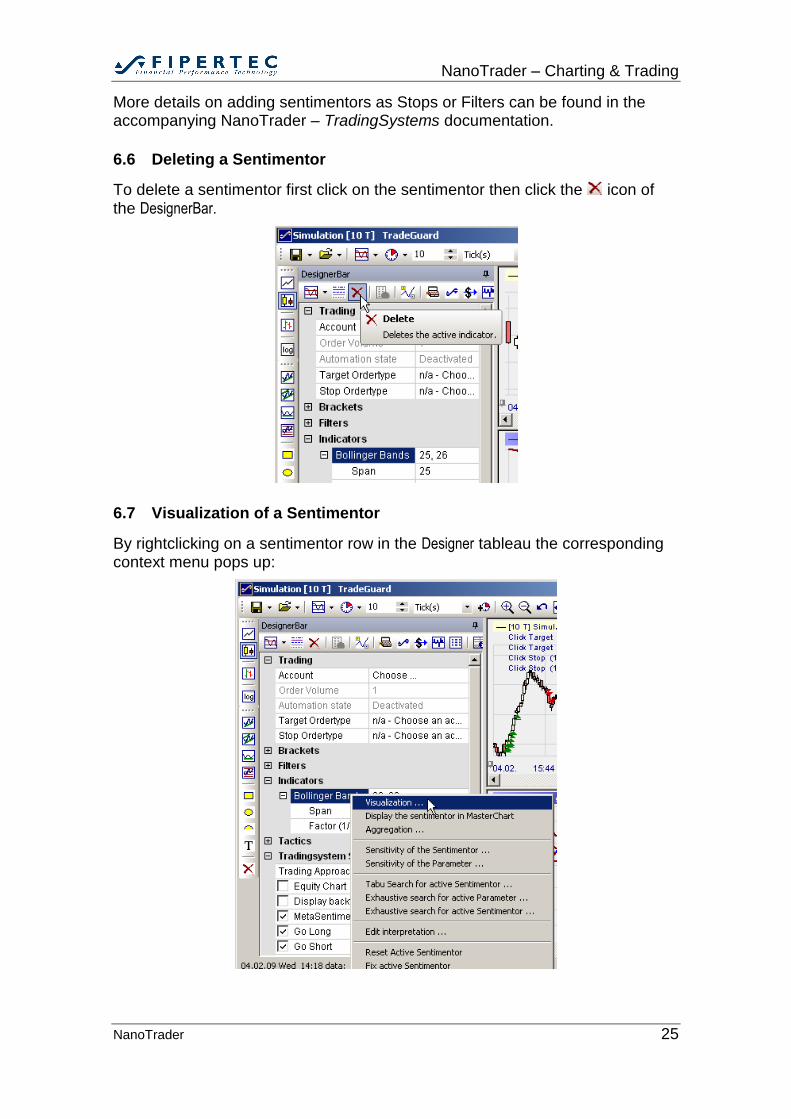
6.6 Deleting a Sentimentor
To delete a sentimentor first click on the sentimentor then click the icon of the DesignerBar.
6.7 Visualization of a Sentimentor
By rightclicking on a sentimentor row in the Designer tableau the corresponding context menu pops up:
NanoTrader – Charting & Trading
NanoTrader 26
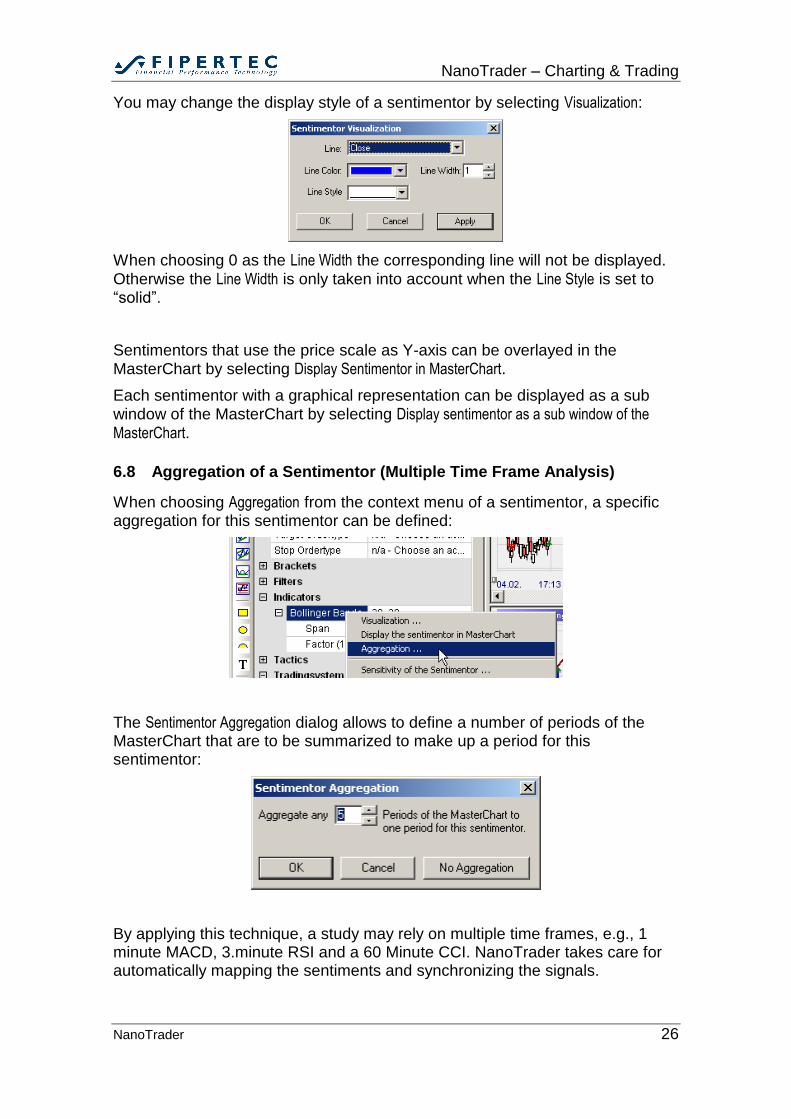
You may change the display style of a sentimentor by selecting Visualization:
When choosing 0 as the Line Width the corresponding line will not be displayed.
Otherwise the Line Width is only taken into account when the Line Style is set to “solid”.
Sentimentors that use the price scale as Y-axis can be overlayed in the MasterChart by selecting Display Sentimentor in MasterChart.
Each sentimentor with a graphical representation can be displayed as a sub window of the MasterChart by selecting Display sentimentor as a sub window of the
MasterChart.
6.8 Aggregation of a Sentimentor (Multiple Time Frame Analysis)
When choosing Aggregation from the context menu of a sentimentor, a specific aggregation for this sentimentor can be defined:
The Sentimentor Aggregation dialog allows to define a number of periods of the MasterChart that are to be summarized to make up a period for this sentimentor:
By applying this technique, a study may rely on multiple time frames, e.g., 1 minute MACD, 3.minute RSI and a 60 Minute CCI. NanoTrader takes care for automatically mapping the sentiments and synchronizing the signals.
NanoTrader – Charting & Trading
NanoTrader 27
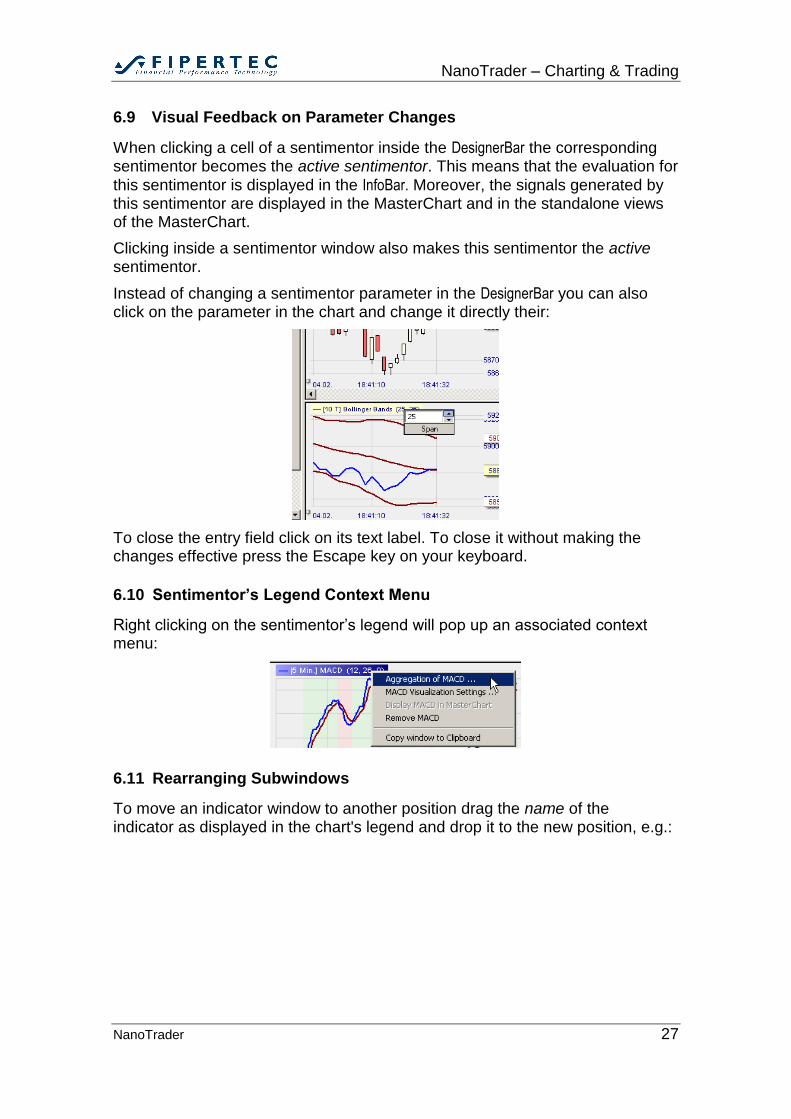
6.9 Visual Feedback on Parameter Changes
When clicking a cell of a sentimentor inside the DesignerBar the corresponding sentimentor becomes the active sentimentor. This means that the evaluation for
this sentimentor is displayed in the InfoBar. Moreover, the signals generated by this sentimentor are displayed in the MasterChart and in the standalone views of the MasterChart.
Clicking inside a sentimentor window also makes this sentimentor the active sentimentor.
Instead of changing a sentimentor parameter in the DesignerBar you can also click on the parameter in the chart and change it directly their:
To close the entry field click on its text label. To close it without making the changes effective press the Escape key on your keyboard.
6.10 Sentimentor’s Legend Context Menu
Right clicking on the sentimentor’s legend will pop up an associated context menu:
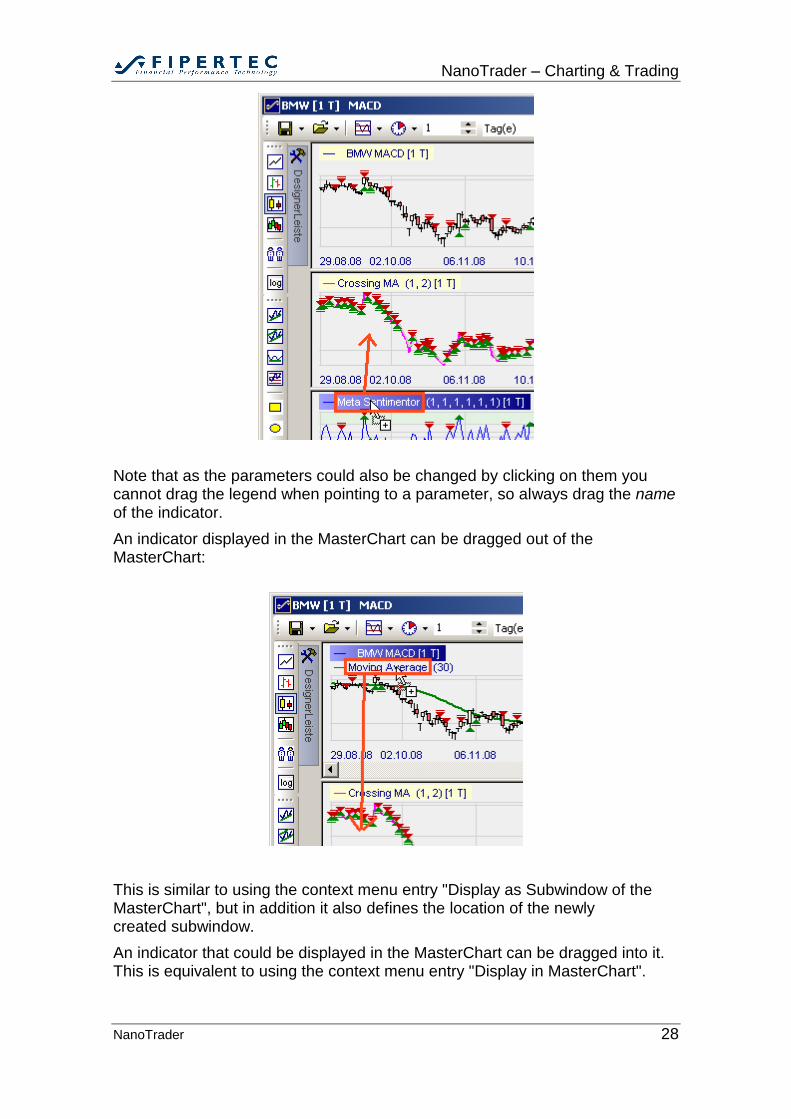
6.11 Rearranging Subwindows
To move an indicator window to another position drag the name of the indicator as displayed in the chart's legend and drop it to the new position, e.g.:
NanoTrader – Charting & Trading
NanoTrader 28
Note that as the parameters could also be changed by clicking on them you cannot drag the legend when pointing to a parameter, so always drag the name of the indicator.
An indicator displayed in the MasterChart can be dragged out of the MasterChart:
This is similar to using the context menu entry "Display as Subwindow of the MasterChart", but in addition it also defines the location of the newly created subwindow.
An indicator that could be displayed in the MasterChart can be dragged into it. This is equivalent to using the context menu entry "Display in MasterChart".
NanoTrader – Charting & Trading
NanoTrader 29
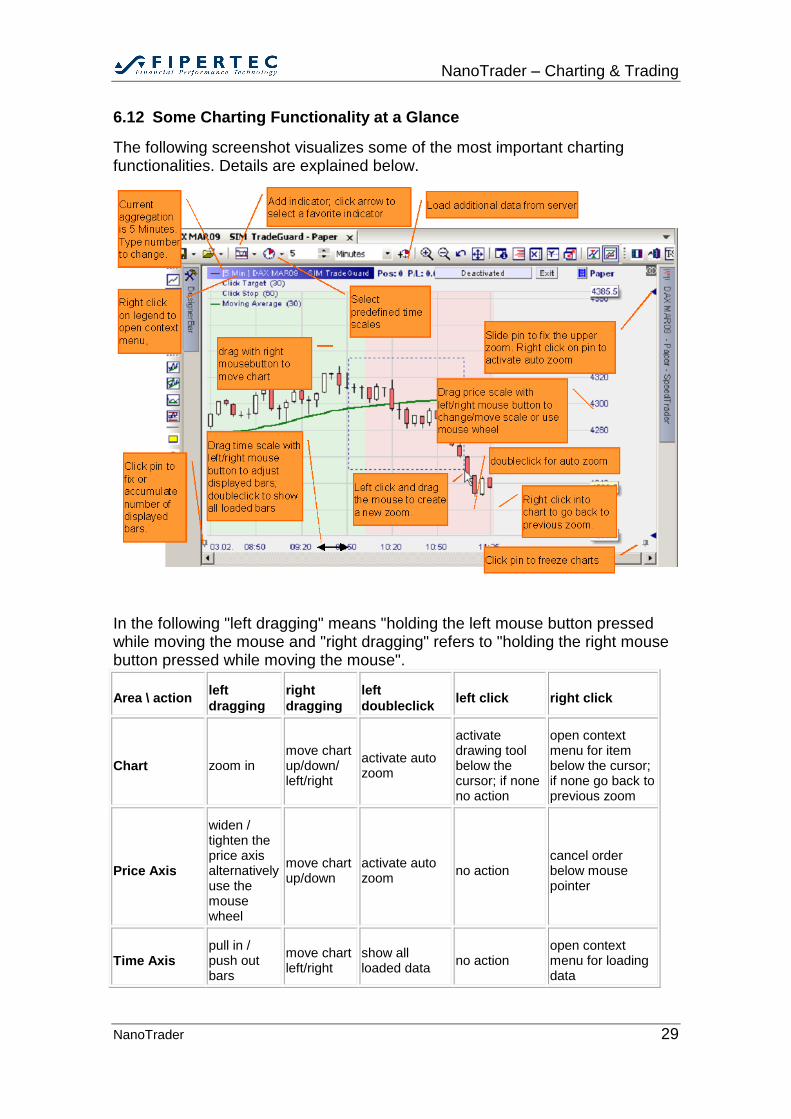
6.12 Some Charting Functionality at a Glance
The following screenshot visualizes some of the most important charting functionalities. Details are explained below.
In the following "left dragging" means "holding the left mouse button pressed while moving the mouse and "right dragging" refers to "holding the right mouse button pressed while moving the mouse".
Area \ action left
dragging
right
dragging
left
doubleclick left click right click
Chart zoom in move chart up/down/ left/right
activate auto zoom
activate drawing tool below the cursor; if none no action
open context menu for item below the cursor; if none go back to previous zoom
Price Axis
widen / tighten the price axis alternatively use the mouse wheel
move chart up/down
activate auto zoom
no action cancel order below mouse pointer
Time Axis pull in / push out bars
move chart left/right
show all loaded data
no action open context menu for loading data
NanoTrader – Charting & Trading
NanoTrader 30
6.13 Line-Chart, Candle Sticks, Bar-Chart
To change the charting style just press the corresponding toolbar button:
. The charting style is saved with the study.
6.14 Heikin-Ashi Chart
The Heikin-Ashi charting style became popular as it visually points out existing trends while keeping the time scale. To activate the Heikin-Ashi display style click the icon. Be aware that although the displayed data looks like standard candles it is a transformation of the original price data and hence the data in general will not represent tradable prices.
Indicators are computed on the original, non-transformed price data, i.e., they do not change if the display style is switched to Heikin-Ashi.
There is also a Heikin-Ashi sentimentor emitting sentiments. By using the sentimentor a classical charting mode showing tradable prices can be combined with the Heikin-Ashi chart.
6.15 Zooming
For zooming you might use the toolbar buttons:
Alternatively, to zoom inside a window press the left mouse button and drag the mouse. This will create a rubberband that marks the region to be zoomed to. When releasing the mouse button the zoom will be executed.
Using a right-click on the chart background you can go back to the previous zoom range.
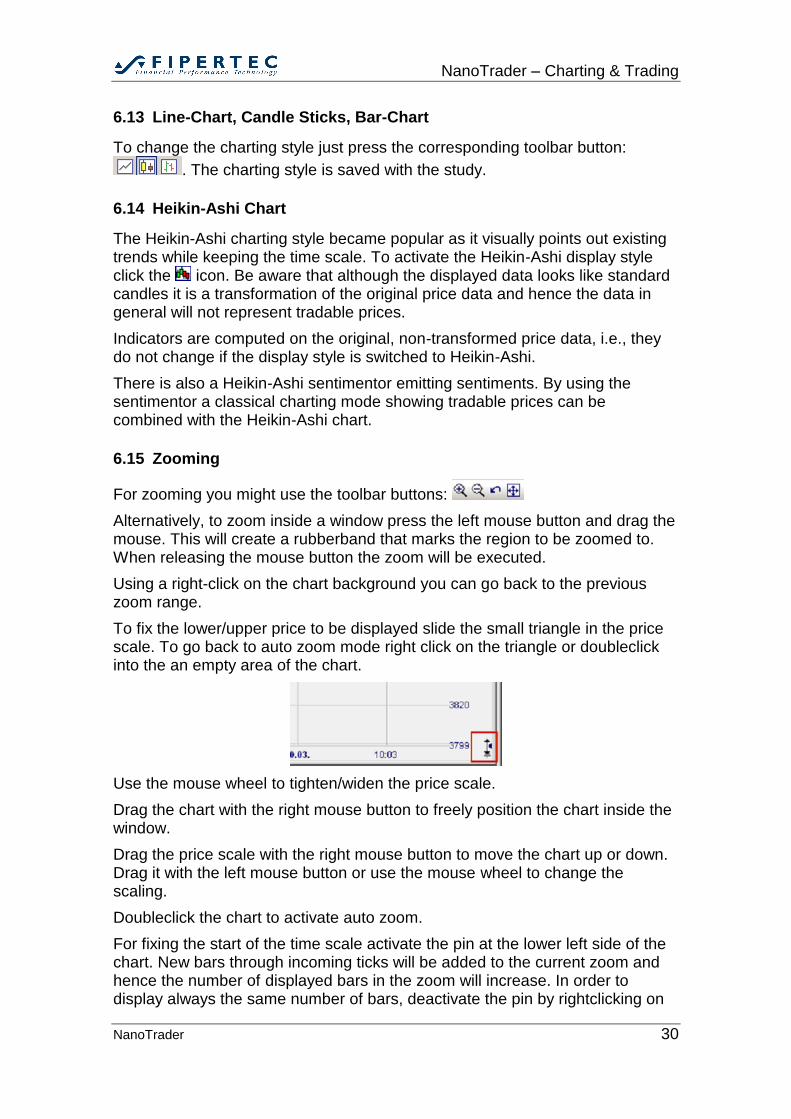
To fix the lower/upper price to be displayed slide the small triangle in the price scale. To go back to auto zoom mode right click on the triangle or doubleclick into the an empty area of the chart.
Use the mouse wheel to tighten/widen the price scale.
Drag the chart with the right mouse button to freely position the chart inside the window.
Drag the price scale with the right mouse button to move the chart up or down. Drag it with the left mouse button or use the mouse wheel to change the scaling.
Doubleclick the chart to activate auto zoom.
For fixing the start of the time scale activate the pin at the lower left side of the chart. New bars through incoming ticks will be added to the current zoom and hence the number of displayed bars in the zoom will increase. In order to display always the same number of bars, deactivate the pin by rightclicking on
NanoTrader – Charting & Trading
NanoTrader 31
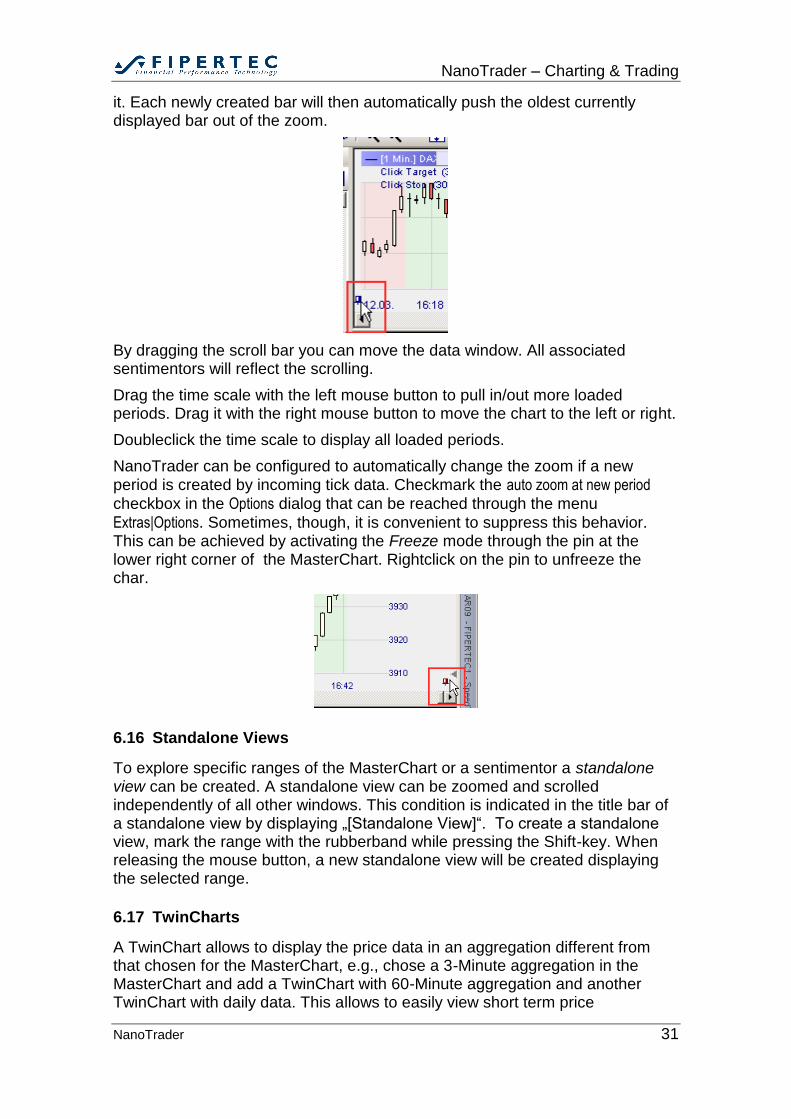
it. Each newly created bar will then automatically push the oldest currently displayed bar out of the zoom.
By dragging the scroll bar you can move the data window. All associated sentimentors will reflect the scrolling.
Drag the time scale with the left mouse button to pull in/out more loaded periods. Drag it with the right mouse button to move the chart to the left or right.
Doubleclick the time scale to display all loaded periods.
NanoTrader can be configured to automatically change the zoom if a new period is created by incoming tick data. Checkmark the auto zoom at new period
checkbox in the Options dialog that can be reached through the menu
Extras|Options. Sometimes, though, it is convenient to suppress this behavior. This can be achieved by activating the Freeze mode through the pin at the lower right corner of the MasterChart. Rightclick on the pin to unfreeze the char.
6.16 Standalone Views
To explore specific ranges of the MasterChart or a sentimentor a standalone view can be created. A standalone view can be zoomed and scrolled independently of all other windows. This condition is indicated in the title bar of a standalone view by displaying „[Standalone View]“. To create a standalone view, mark the range with the rubberband while pressing the Shift-key. When releasing the mouse button, a new standalone view will be created displaying the selected range.
6.17 TwinCharts
A TwinChart allows to display the price data in an aggregation different from that chosen for the MasterChart, e.g., chose a 3-Minute aggregation in the MasterChart and add a TwinChart with 60-Minute aggregation and another TwinChart with daily data. This allows to easily view short term price
NanoTrader – Charting & Trading
NanoTrader 32
movements in relation to long term movements. TwinCharts are also extremely helpful in detecting long term trends and support/resistance levels and to take them into account in the short term trading.
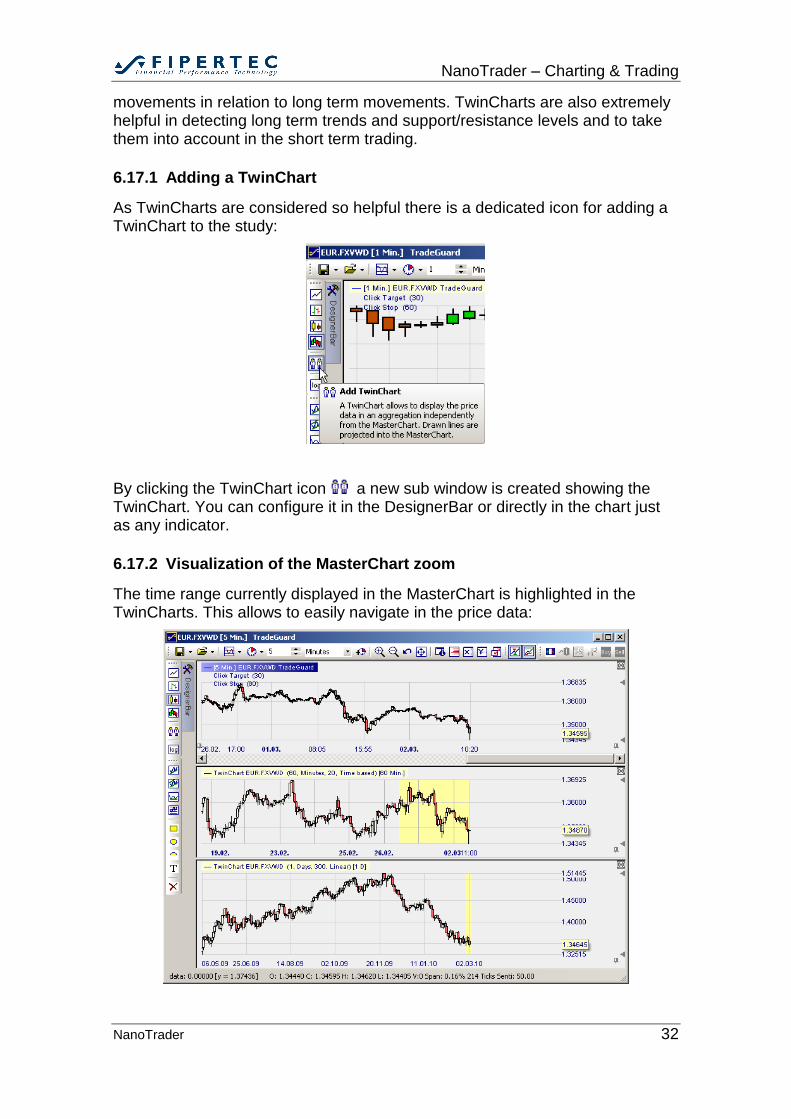
6.17.1 Adding a TwinChart
As TwinCharts are considered so helpful there is a dedicated icon for adding a TwinChart to the study:
By clicking the TwinChart icon a new sub window is created showing the TwinChart. You can configure it in the DesignerBar or directly in the chart just as any indicator.
6.17.2 Visualization of the MasterChart zoom
The time range currently displayed in the MasterChart is highlighted in the TwinCharts. This allows to easily navigate in the price data:
NanoTrader – Charting & Trading
NanoTrader 33
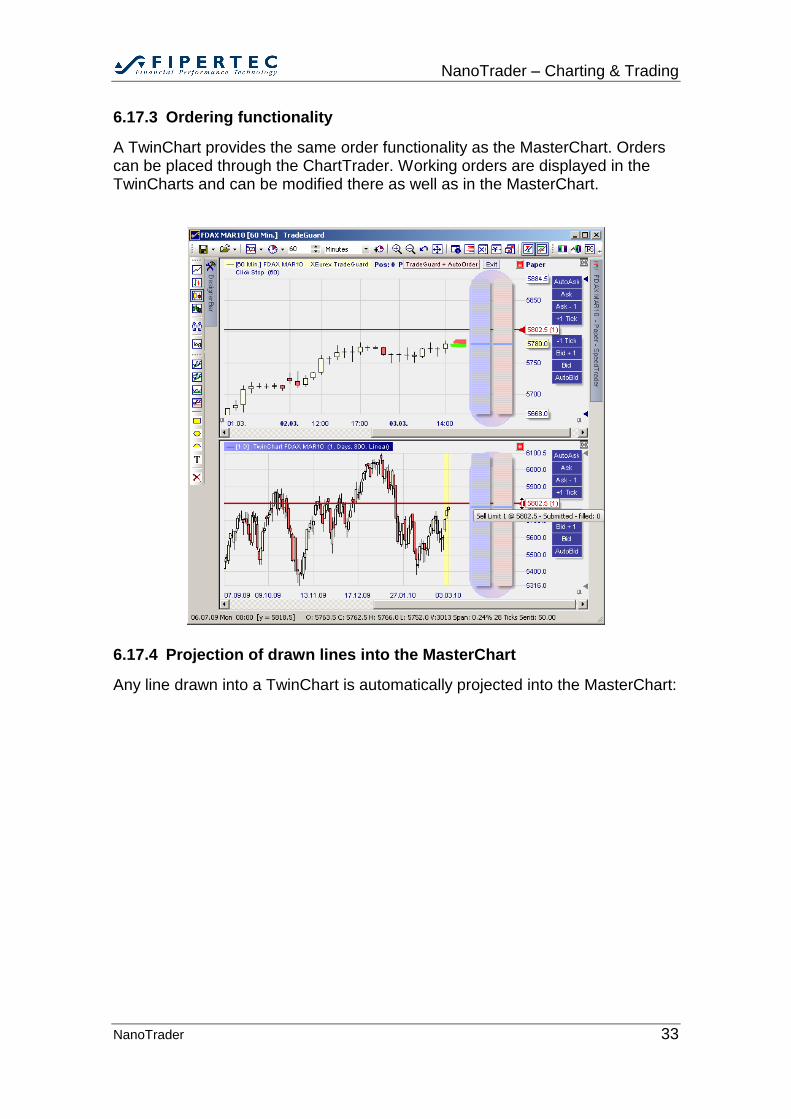
6.17.3 Ordering functionality
A TwinChart provides the same order functionality as the MasterChart. Orders can be placed through the ChartTrader. Working orders are displayed in the TwinCharts and can be modified there as well as in the MasterChart.
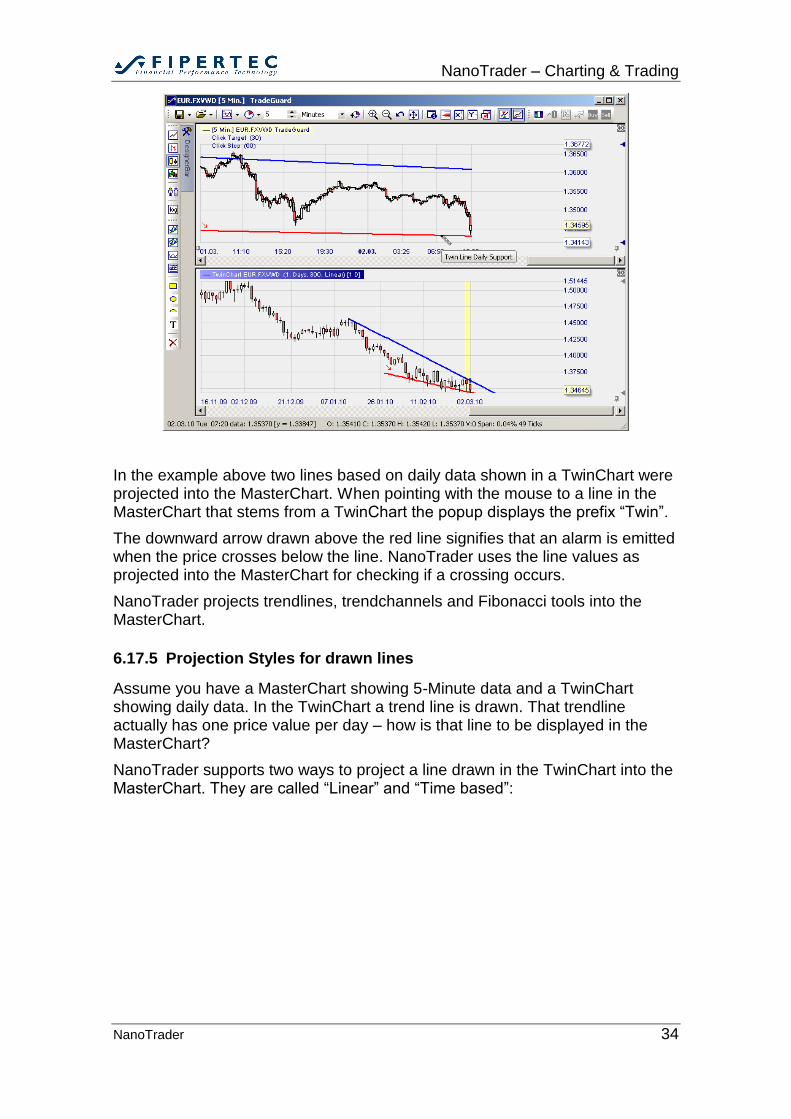
6.17.4 Projection of drawn lines into the MasterChart
Any line drawn into a TwinChart is automatically projected into the MasterChart:
NanoTrader – Charting & Trading
NanoTrader 34
In the example above two lines based on daily data shown in a TwinChart were projected into the MasterChart. When pointing with the mouse to a line in the MasterChart that stems from a TwinChart the popup displays the prefix “Twin”.
The downward arrow drawn above the red line signifies that an alarm is emitted when the price crosses below the line. NanoTrader uses the line values as projected into the MasterChart for checking if a crossing occurs.
NanoTrader projects trendlines, trendchannels and Fibonacci tools into the MasterChart.
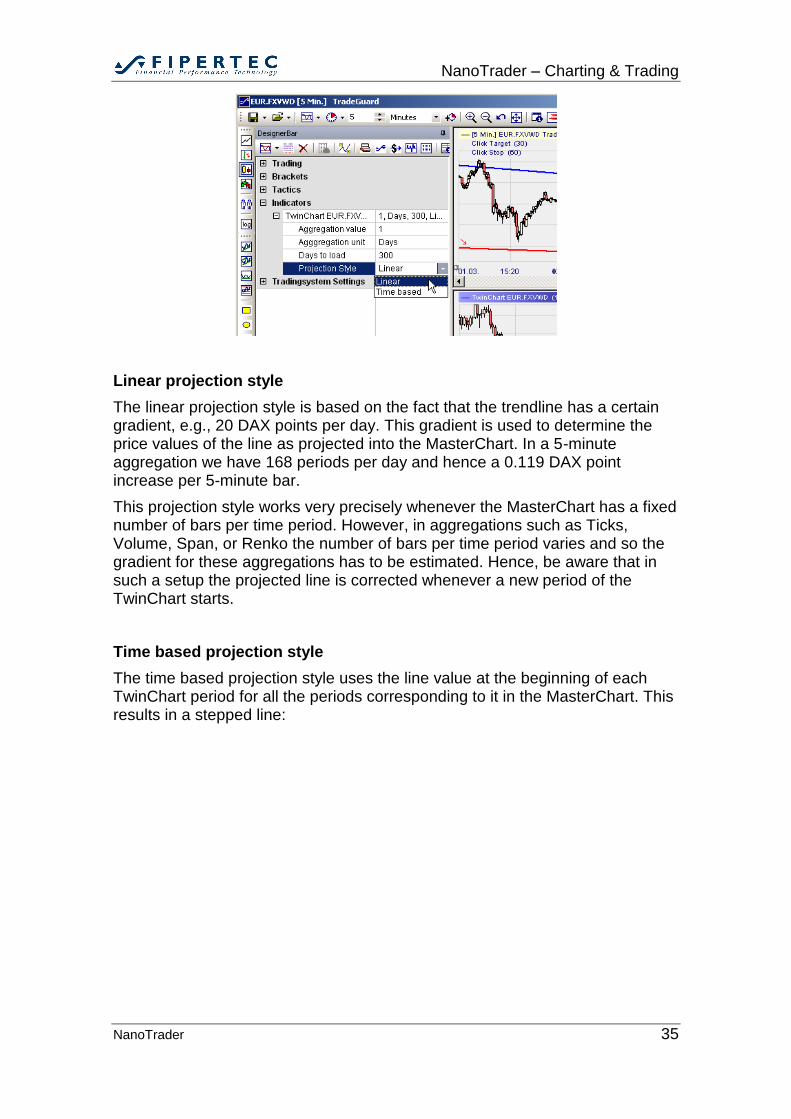
6.17.5 Projection Styles for drawn lines
Assume you have a MasterChart showing 5-Minute data and a TwinChart showing daily data. In the TwinChart a trend line is drawn. That trendline actually has one price value per day – how is that line to be displayed in the MasterChart?
NanoTrader supports two ways to project a line drawn in the TwinChart into the MasterChart. They are called “Linear” and “Time based”:
NanoTrader – Charting & Trading
NanoTrader 35
Linear projection style
The linear projection style is based on the fact that the trendline has a certain gradient, e.g., 20 DAX points per day. This gradient is used to determine the price values of the line as projected into the MasterChart. In a 5-minute aggregation we have 168 periods per day and hence a 0.119 DAX point increase per 5-minute bar.
This projection style works very precisely whenever the MasterChart has a fixed number of bars per time period. However, in aggregations such as Ticks, Volume, Span, or Renko the number of bars per time period varies and so the gradient for these aggregations has to be estimated. Hence, be aware that in such a setup the projected line is corrected whenever a new period of the TwinChart starts.
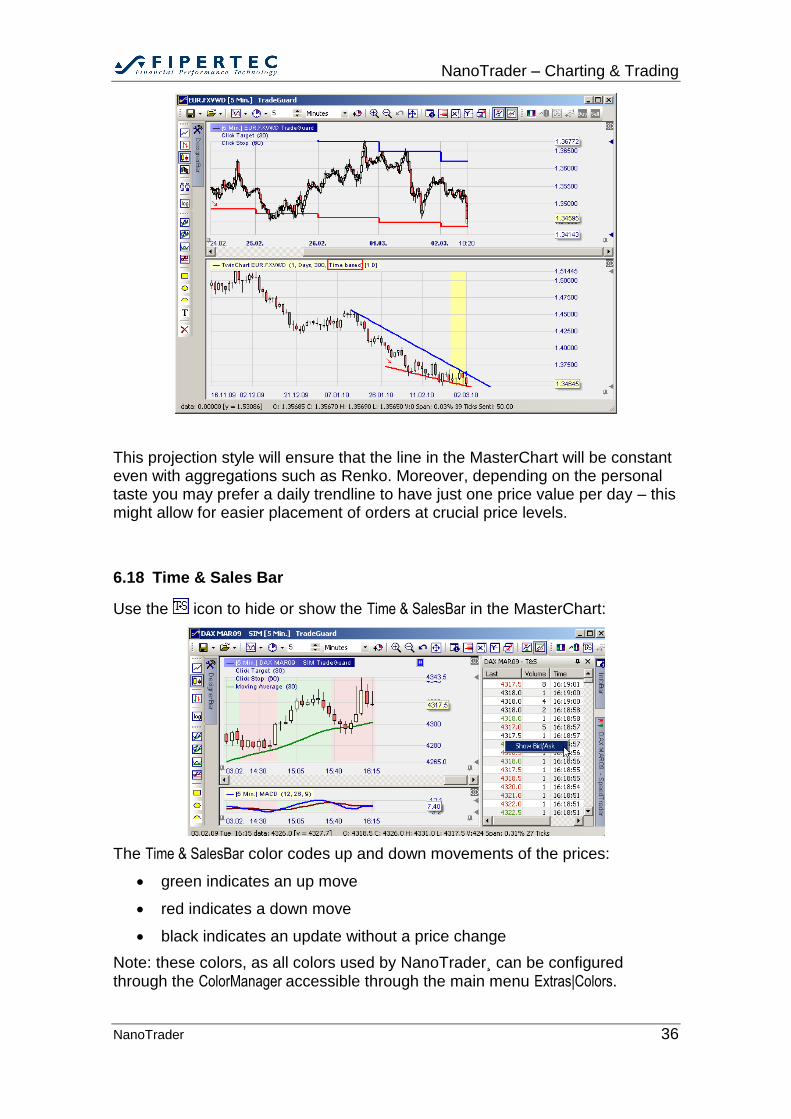
Time based projection style
The time based projection style uses the line value at the beginning of each TwinChart period for all the periods corresponding to it in the MasterChart. This results in a stepped line:
NanoTrader – Charting & Trading
NanoTrader 36
This projection style will ensure that the line in the MasterChart will be constant even with aggregations such as Renko. Moreover, depending on the personal taste you may prefer a daily trendline to have just one price value per day – this might allow for easier placement of orders at crucial price levels.
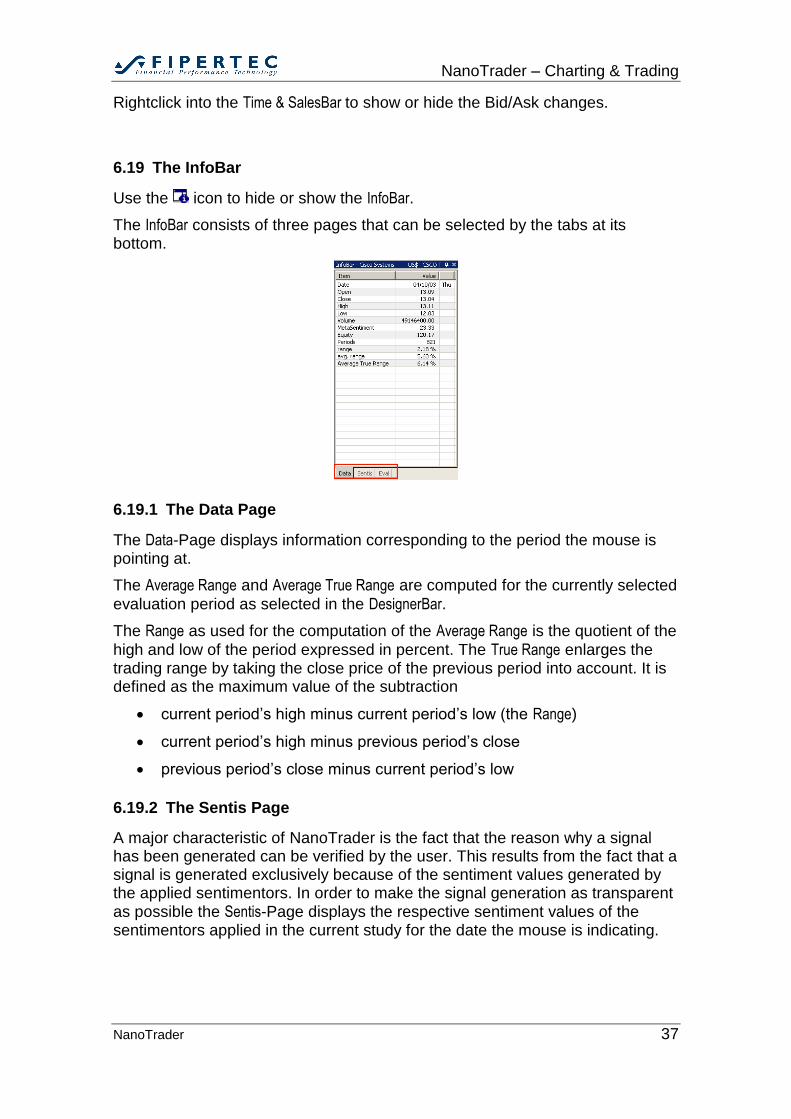
6.18 Time & Sales Bar
Use the icon to hide or show the Time & SalesBar in the MasterChart:
The Time & SalesBar color codes up and down movements of the prices:
green indicates an up move
red indicates a down move
black indicates an update without a price change
Note: these colors, as all colors used by NanoTrader¸ can be configured through the ColorManager accessible through the main menu Extras|Colors.
NanoTrader – Charting & Trading
NanoTrader 37
Rightclick into the Time & SalesBar to show or hide the Bid/Ask changes.
6.19 The InfoBar
Use the icon to hide or show the InfoBar.
The InfoBar consists of three pages that can be selected by the tabs at its bottom.
6.19.1 The Data Page
The Data-Page displays information corresponding to the period the mouse is pointing at.
The Average Range and Average True Range are computed for the currently selected
evaluation period as selected in the DesignerBar.
The Range as used for the computation of the Average Range is the quotient of the
high and low of the period expressed in percent. The True Range enlarges the trading range by taking the close price of the previous period into account. It is defined as the maximum value of the subtraction
current period’s high minus current period’s low (the Range)
current period’s high minus previous period’s close
previous period’s close minus current period’s low
6.19.2 The Sentis Page
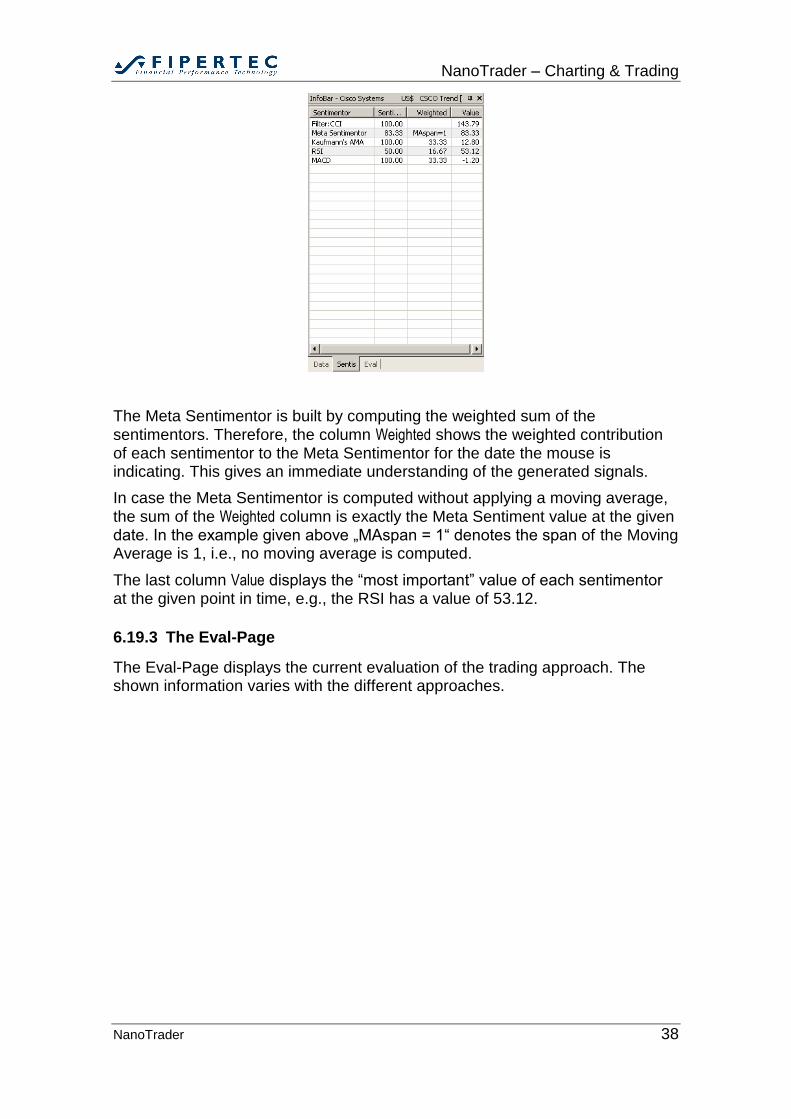
A major characteristic of NanoTrader is the fact that the reason why a signal has been generated can be verified by the user. This results from the fact that a signal is generated exclusively because of the sentiment values generated by the applied sentimentors. In order to make the signal generation as transparent as possible the Sentis-Page displays the respective sentiment values of the sentimentors applied in the current study for the date the mouse is indicating.
NanoTrader – Charting & Trading
NanoTrader 38
The Meta Sentimentor is built by computing the weighted sum of the sentimentors. Therefore, the column Weighted shows the weighted contribution of each sentimentor to the Meta Sentimentor for the date the mouse is indicating. This gives an immediate understanding of the generated signals.
In case the Meta Sentimentor is computed without applying a moving average, the sum of the Weighted column is exactly the Meta Sentiment value at the given date. In the example given above „MAspan = 1“ denotes the span of the Moving Average is 1, i.e., no moving average is computed.
The last column Value displays the “most important” value of each sentimentor at the given point in time, e.g., the RSI has a value of 53.12.
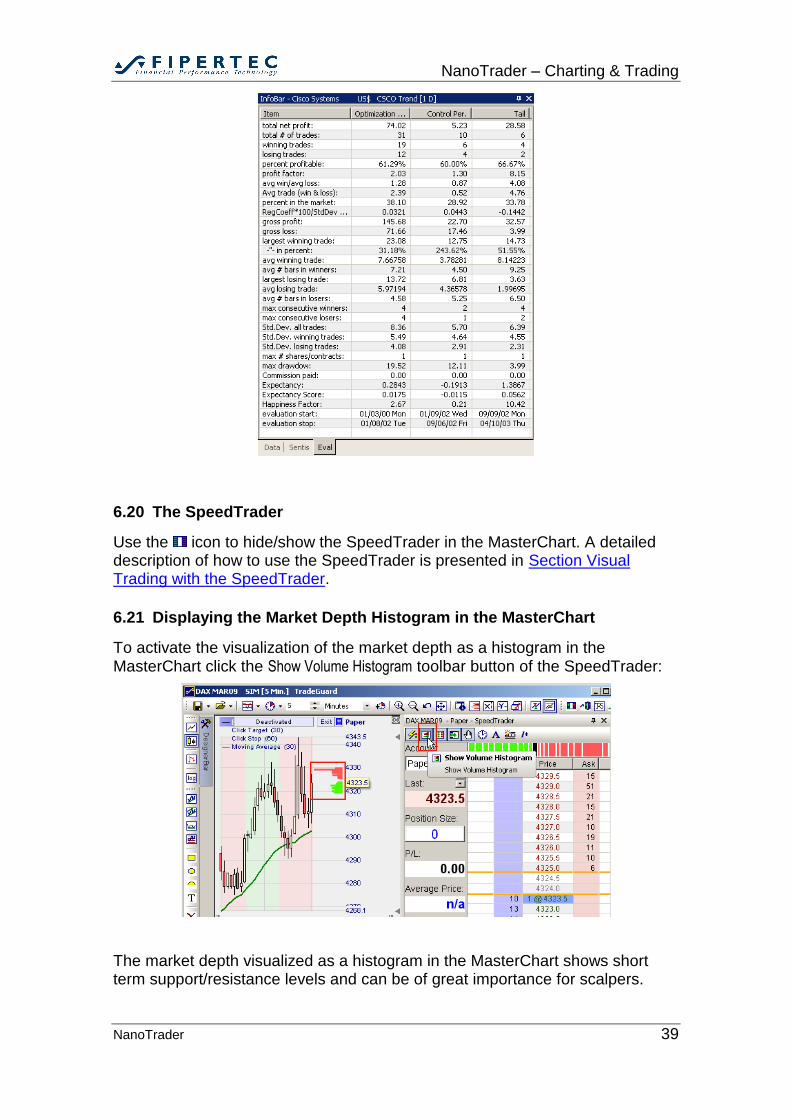
6.19.3 The Eval-Page
The Eval-Page displays the current evaluation of the trading approach. The shown information varies with the different approaches.
NanoTrader – Charting & Trading
NanoTrader 39
6.20 The SpeedTrader
Use the icon to hide/show the SpeedTrader in the MasterChart. A detailed description of how to use the SpeedTrader is presented in Section Visual Trading with the SpeedTrader.
6.21 Displaying the Market Depth Histogram in the MasterChart
To activate the visualization of the market depth as a histogram in the MasterChart click the Show Volume Histogram toolbar button of the SpeedTrader:
The market depth visualized as a histogram in the MasterChart shows short term support/resistance levels and can be of great importance for scalpers.
NanoTrader – Charting & Trading
NanoTrader 40
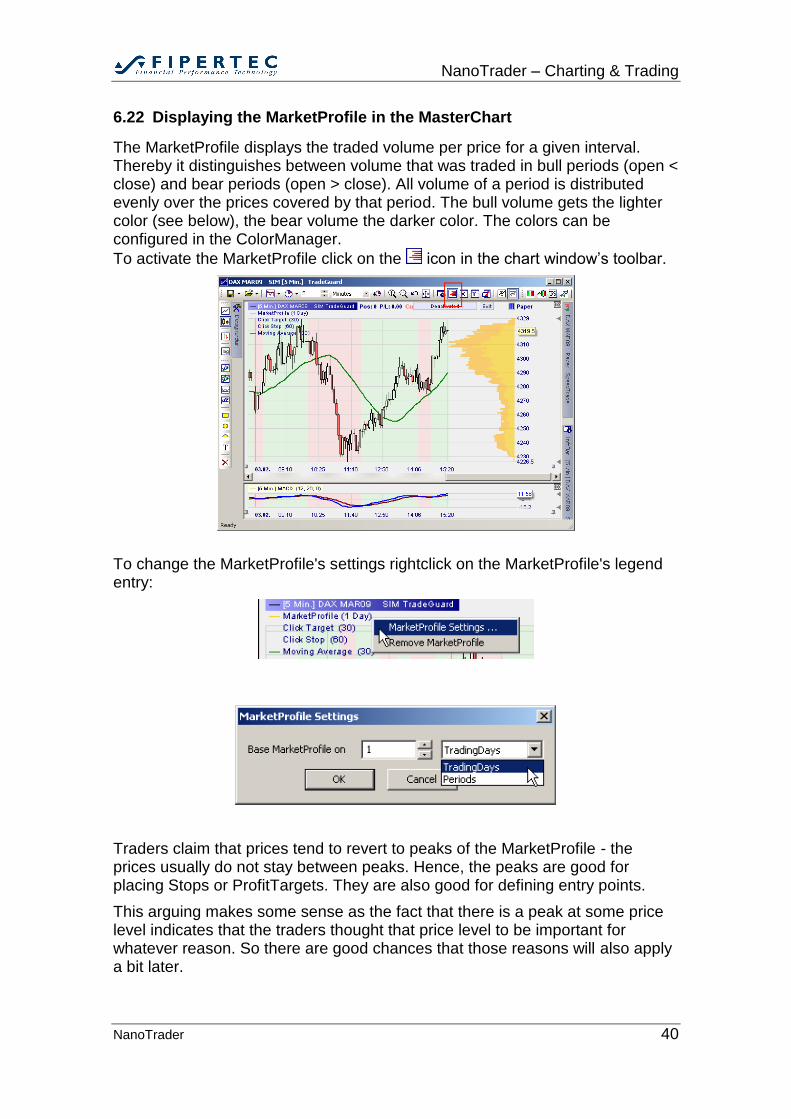
6.22 Displaying the MarketProfile in the MasterChart
The MarketProfile displays the traded volume per price for a given interval. Thereby it distinguishes between volume that was traded in bull periods (open < close) and bear periods (open > close). All volume of a period is distributed evenly over the prices covered by that period. The bull volume gets the lighter color (see below), the bear volume the darker color. The colors can be configured in the ColorManager.
To activate the MarketProfile click on the icon in the chart window’s toolbar.
To change the MarketProfile's settings rightclick on the MarketProfile's legend entry:
Traders claim that prices tend to revert to peaks of the MarketProfile - the prices usually do not stay between peaks. Hence, the peaks are good for placing Stops or ProfitTargets. They are also good for defining entry points.
This arguing makes some sense as the fact that there is a peak at some price level indicates that the traders thought that price level to be important for whatever reason. So there are good chances that those reasons will also apply a bit later.
NanoTrader – Charting & Trading
NanoTrader 41
As the MarketProfile is calculated from the final period backwards it is only displayed if the final period is part of the current zoom.
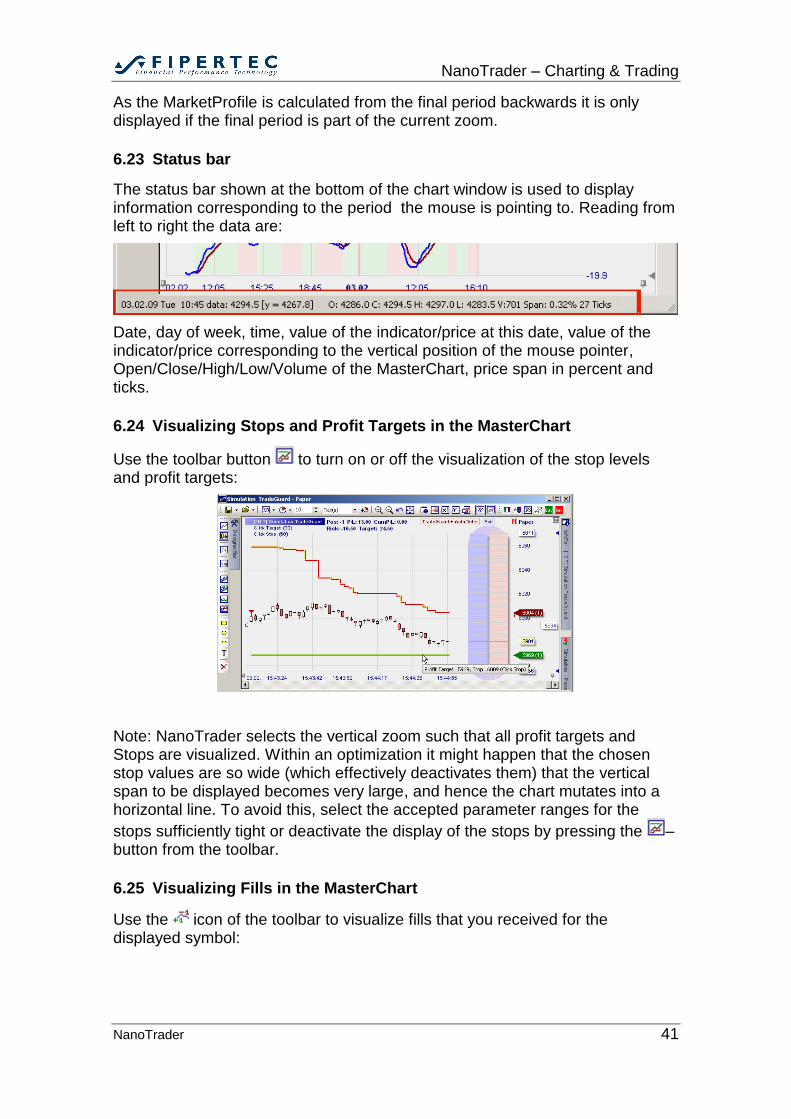
6.23 Status bar
The status bar shown at the bottom of the chart window is used to display information corresponding to the period the mouse is pointing to. Reading from left to right the data are:
Date, day of week, time, value of the indicator/price at this date, value of the indicator/price corresponding to the vertical position of the mouse pointer, Open/Close/High/Low/Volume of the MasterChart, price span in percent and ticks.
6.24 Visualizing Stops and Profit Targets in the MasterChart
Use the toolbar button to turn on or off the visualization of the stop levels and profit targets:
Note: NanoTrader selects the vertical zoom such that all profit targets and Stops are visualized. Within an optimization it might happen that the chosen stop values are so wide (which effectively deactivates them) that the vertical span to be displayed becomes very large, and hence the chart mutates into a horizontal line. To avoid this, select the accepted parameter ranges for the
stops sufficiently tight or deactivate the display of the stops by pressing the –button from the toolbar.
6.25 Visualizing Fills in the MasterChart
Use the icon of the toolbar to visualize fills that you received for the displayed symbol:
NanoTrader – Charting & Trading
NanoTrader 42
6.26 Drag & Drop
Drag & Drop is supported throughout NanoTrader. A security drag operation can be started from:
any security of the WorkspaceBar
any entry of a RatingBar, LiveTable or Account
the list of a Time & SalesBar
A dragged security can be dropped on:
a chart window – this will result in targeting the study to the dropped security
a Time & SalesBar, SpeedTraderBar, or LiveTable – the Bar will then display the information for the dropped security
an Account – this will add the security to the account with a position size of 0.
When dropping a symbol into a chart that displays a study of name, say, “Trend”, NanoTrader checks if there exists already a study "Trend" for the new symbol. If so, this it asks if you want to replace the existing study with that one that received the dropped symbol.
6.27 Copying a Chart as a Bitmap to the Clipboard
Rightclick on the legend of the MasterChart or a sentimentor and choose Copy
active Window to Clipboard to copy the window as bitmap into the clipboard. From there the bitmap can be inserted and processed by a variety of programs such as Word, Excel, Outlook, etc.
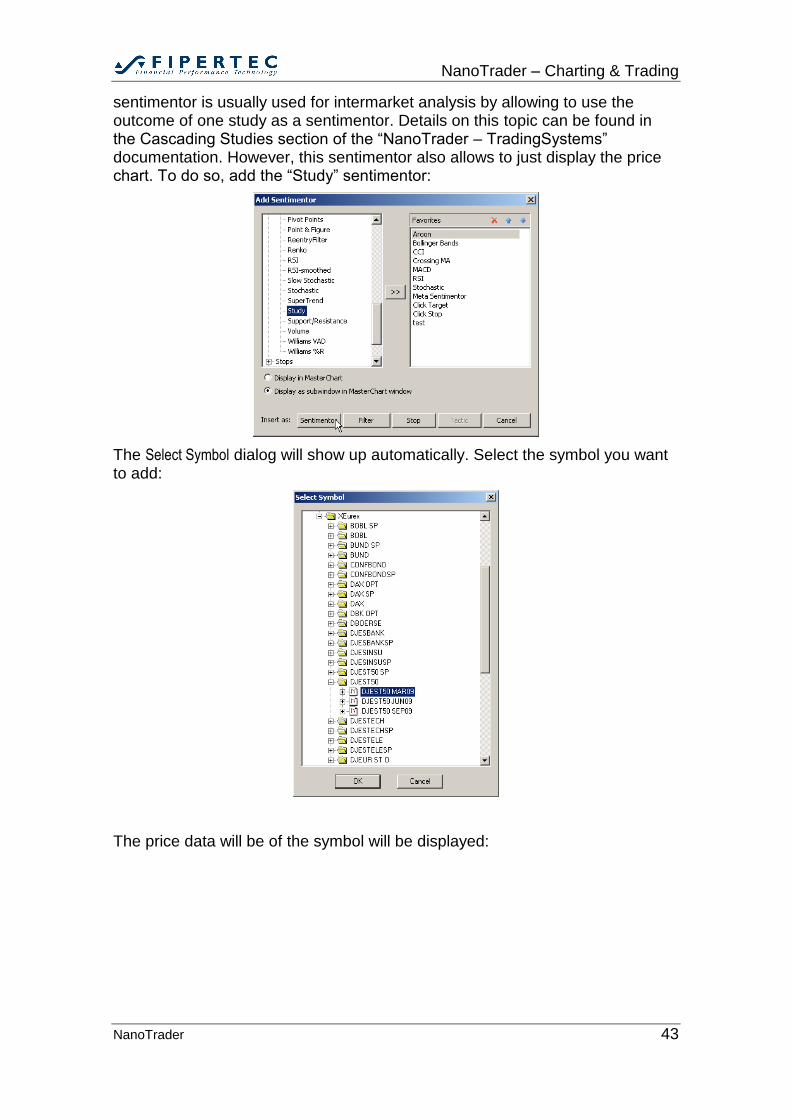
6.28 Displaying multiple Symbols in the Chart Window
Quite often one wants to display a selection of symbols within one chart window. This can be achieved by usage of the “Study” sentimentor. That
NanoTrader – Charting & Trading
NanoTrader 43
sentimentor is usually used for intermarket analysis by allowing to use the outcome of one study as a sentimentor. Details on this topic can be found in the Cascading Studies section of the “NanoTrader – TradingSystems” documentation. However, this sentimentor also allows to just display the price chart. To do so, add the “Study” sentimentor:
The Select Symbol dialog will show up automatically. Select the symbol you want to add:
The price data will be of the symbol will be displayed:
NanoTrader – Charting & Trading
NanoTrader 44
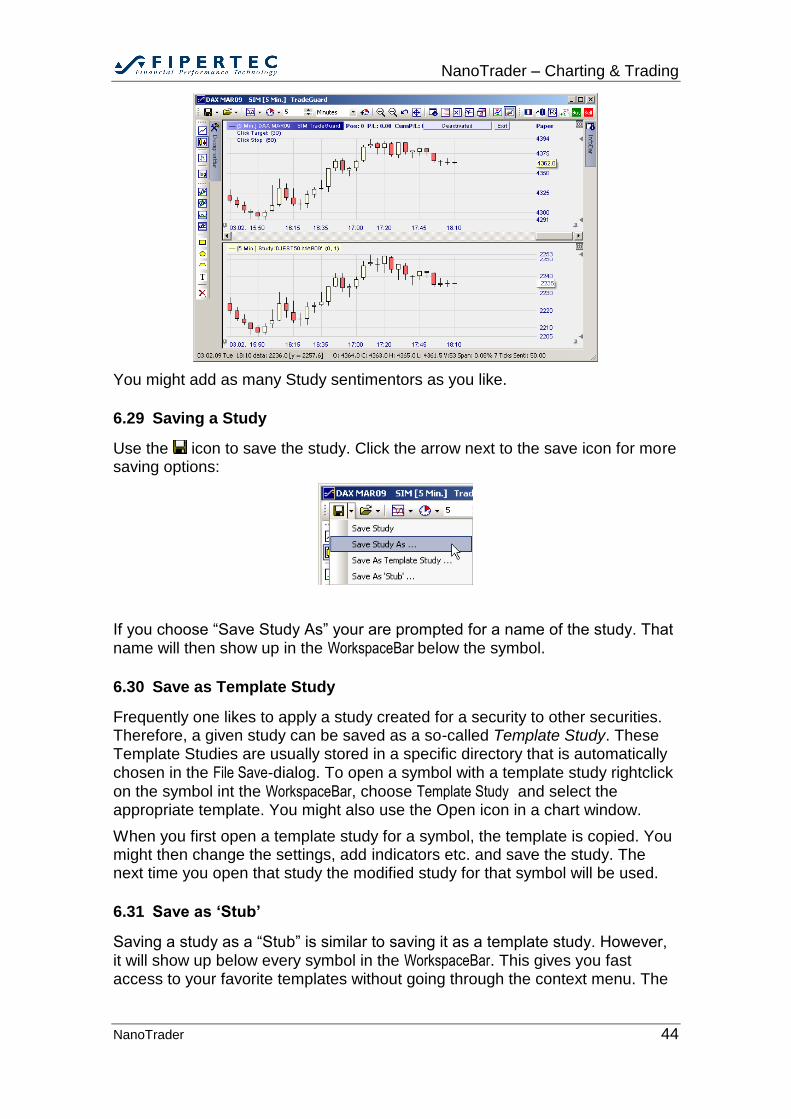
You might add as many Study sentimentors as you like.
6.29 Saving a Study
Use the icon to save the study. Click the arrow next to the save icon for more saving options:
If you choose “Save Study As” your are prompted for a name of the study. That name will then show up in the WorkspaceBar below the symbol.
6.30 Save as Template Study
Frequently one likes to apply a study created for a security to other securities. Therefore, a given study can be saved as a so-called Template Study. These Template Studies are usually stored in a specific directory that is automatically chosen in the File Save-dialog. To open a symbol with a template study rightclick
on the symbol int the WorkspaceBar, choose Template Study and select the appropriate template. You might also use the Open icon in a chart window.
When you first open a template study for a symbol, the template is copied. You might then change the settings, add indicators etc. and save the study. The next time you open that study the modified study for that symbol will be used.
6.31 Save as ‘Stub’
Saving a study as a “Stub” is similar to saving it as a template study. However, it will show up below every symbol in the WorkspaceBar. This gives you fast access to your favorite templates without going through the context menu. The
NanoTrader – Charting & Trading
NanoTrader 45
TradeGuard study that is available for every symbol also is based on a stub. You might overwrite it with your own preferred settings.
As long as a Stub template study has not been opened for a particular symbol the corresponding icon in the WorkspaceBar will be displayed in yellow , otherwise in white .
7 Drawing Into a Chart
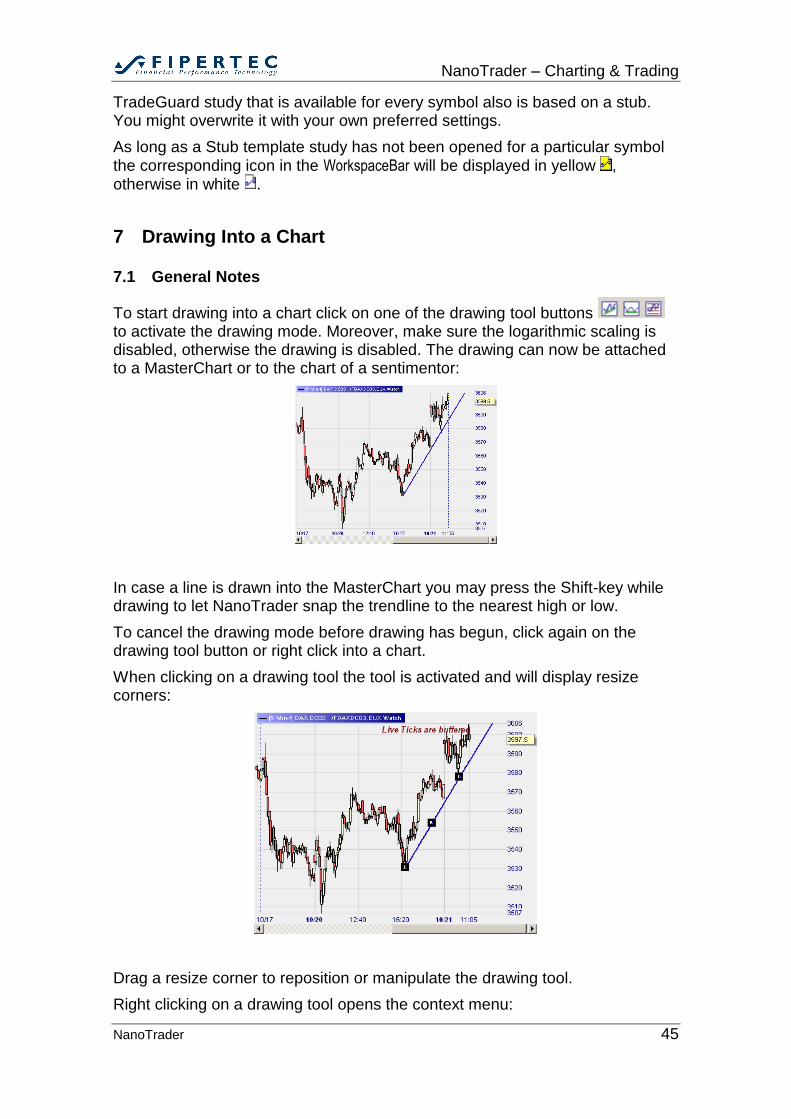
7.1 General Notes
To start drawing into a chart click on one of the drawing tool buttons to activate the drawing mode. Moreover, make sure the logarithmic scaling is disabled, otherwise the drawing is disabled. The drawing can now be attached to a MasterChart or to the chart of a sentimentor:
In case a line is drawn into the MasterChart you may press the Shift-key while drawing to let NanoTrader snap the trendline to the nearest high or low.
To cancel the drawing mode before drawing has begun, click again on the drawing tool button or right click into a chart.
When clicking on a drawing tool the tool is activated and will display resize corners:
Drag a resize corner to reposition or manipulate the drawing tool.
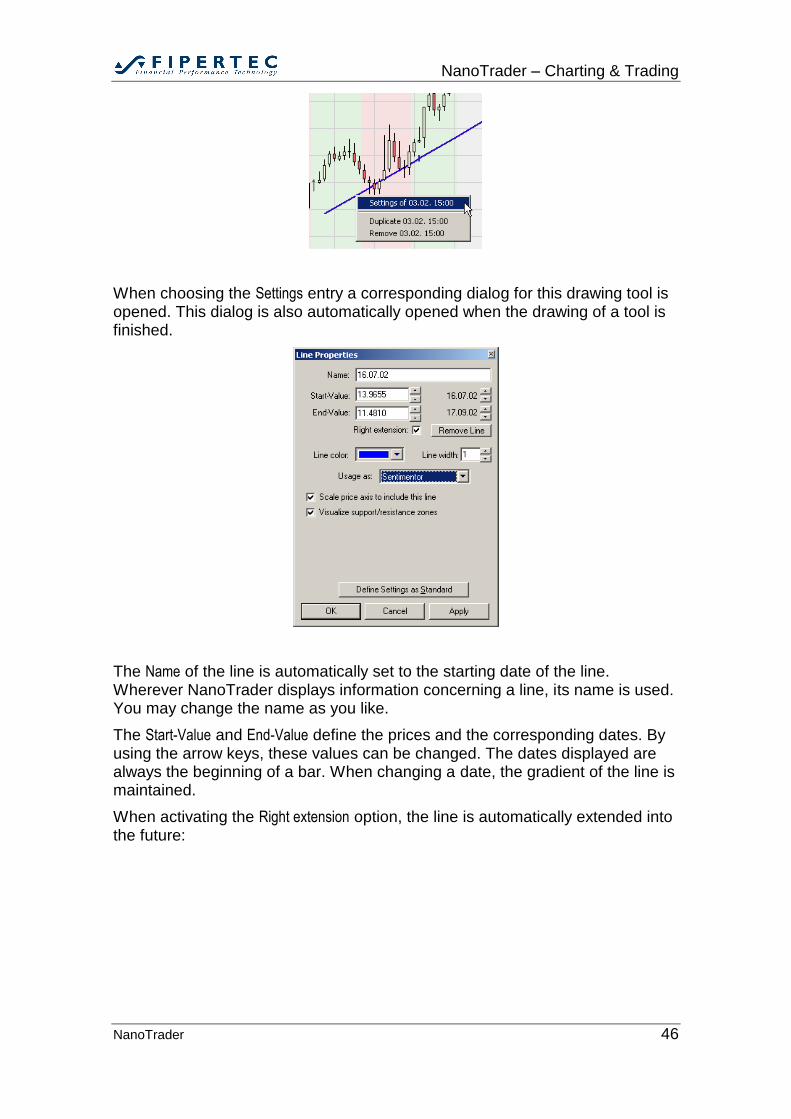
Right clicking on a drawing tool opens the context menu:
NanoTrader – Charting & Trading
NanoTrader 46
When choosing the Settings entry a corresponding dialog for this drawing tool is opened. This dialog is also automatically opened when the drawing of a tool is finished.
The Name of the line is automatically set to the starting date of the line. Wherever NanoTrader displays information concerning a line, its name is used. You may change the name as you like.
The Start-Value and End-Value define the prices and the corresponding dates. By using the arrow keys, these values can be changed. The dates displayed are always the beginning of a bar. When changing a date, the gradient of the line is maintained.
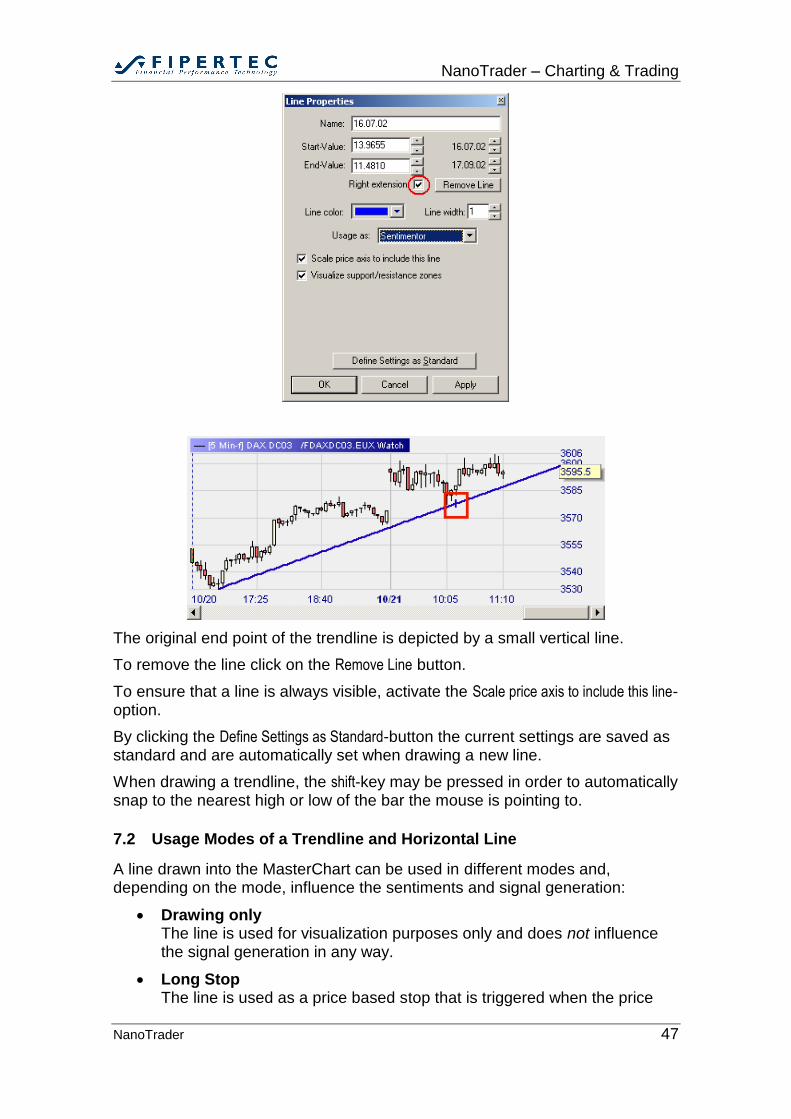
When activating the Right extension option, the line is automatically extended into the future:
NanoTrader – Charting & Trading
NanoTrader 47
The original end point of the trendline is depicted by a small vertical line.
To remove the line click on the Remove Line button.
To ensure that a line is always visible, activate the Scale price axis to include this line-option.
By clicking the Define Settings as Standard-button the current settings are saved as standard and are automatically set when drawing a new line.
When drawing a trendline, the shift-key may be pressed in order to automatically snap to the nearest high or low of the bar the mouse is pointing to.
7.2 Usage Modes of a Trendline and Horizontal Line
A line drawn into the MasterChart can be used in different modes and, depending on the mode, influence the sentiments and signal generation:
Drawing only The line is used for visualization purposes only and does not influence the signal generation in any way.
Long Stop The line is used as a price based stop that is triggered when the price
NanoTrader – Charting & Trading
NanoTrader 48
crosses the line from above (this usage is especially interesting in conjunction with the TradeGuard functionality)
Short Stop Analogical to the Long Stop. A position is closed when the line is crossed from below.
Sentimentor Stop The line is created as a Sentimentor Stop with. The interpretation of a trendline for generating the corresponding sentiment uses so called support/resistance zones, where the line has a high significance. The
visualization of this zones can be toggled with the Visualize
support/resistance zones-option. A specific TrendlineSentimentor explains the Trendline-Sentimentor in detail. (See the manual “NanoTrader – TradingSystems”).
Sentimentor Analogical to Sentimentor Stop. The trendline is created as a sentimentor and influences the overall sentiment.
Filter The trendline is used as a normal Sentimentor applied as a filter.
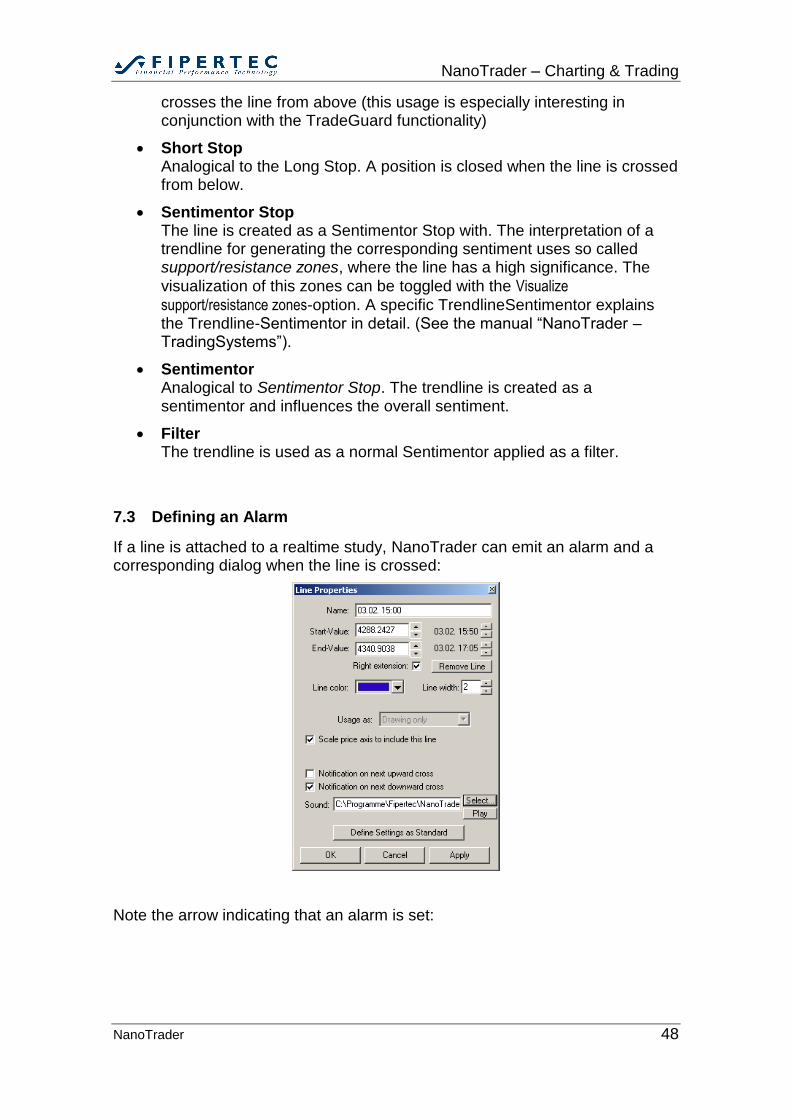
7.3 Defining an Alarm
If a line is attached to a realtime study, NanoTrader can emit an alarm and a corresponding dialog when the line is crossed:
Note the arrow indicating that an alarm is set:
NanoTrader – Charting & Trading
NanoTrader 49
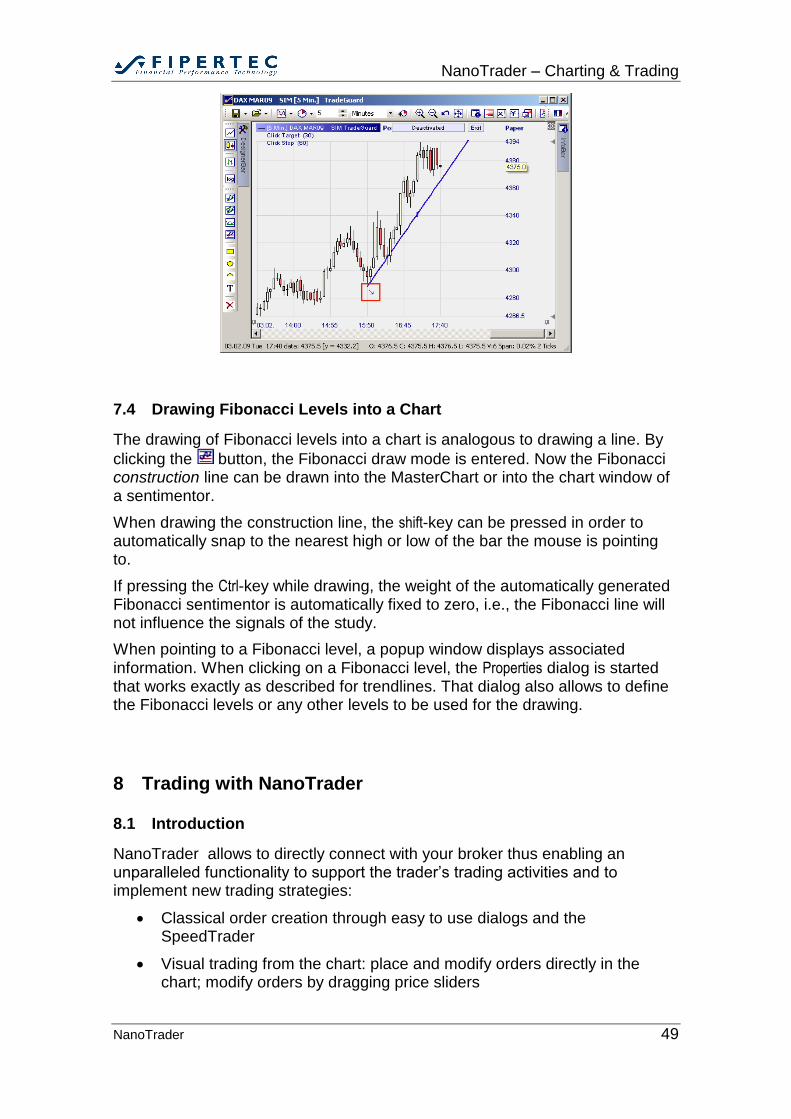
7.4 Drawing Fibonacci Levels into a Chart
The drawing of Fibonacci levels into a chart is analogous to drawing a line. By
clicking the button, the Fibonacci draw mode is entered. Now the Fibonacci construction line can be drawn into the MasterChart or into the chart window of a sentimentor.
When drawing the construction line, the shift-key can be pressed in order to automatically snap to the nearest high or low of the bar the mouse is pointing to.
If pressing the Ctrl-key while drawing, the weight of the automatically generated Fibonacci sentimentor is automatically fixed to zero, i.e., the Fibonacci line will not influence the signals of the study.
When pointing to a Fibonacci level, a popup window displays associated information. When clicking on a Fibonacci level, the Properties dialog is started that works exactly as described for trendlines. That dialog also allows to define the Fibonacci levels or any other levels to be used for the drawing.
8 Trading with NanoTrader
8.1 Introduction
NanoTrader allows to directly connect with your broker thus enabling an unparalleled functionality to support the trader’s trading activities and to implement new trading strategies:
Classical order creation through easy to use dialogs and the SpeedTrader
Visual trading from the chart: place and modify orders directly in the chart; modify orders by dragging price sliders
NanoTrader – Charting & Trading
NanoTrader 50
TradeGuard: As soon as your entry order is filled the TradeGuard manages the exit of the position according to the criteria you defined, e.g., stops, profit targets, patterns, indicators, etc.
Bracket Orders: The TradeGuard can automatically maintain pairs of closing orders for taking profit when a profit target is reached and for reducing losses or securing profits. These orders can be held directly at the exchange for minimizing risks at infrastructure breakdowns.
Fade Out: You can place as many Bracket Orders as you like to achieve a so-called Fade Out out of a position, e.g. three profit targets and two stops. The TradeGuard manages all Bracket Orders fully automatically.
Tactics: This is a powerful new technology introduced by NanoTrader allowing traders to instantly modify orders and to assign a certain predefined tactic with a single click of the mouse to a given working order, e.g., trail, go breakeven, always stay at the best bid/ask etc.
Pattern Trading: NanoTrader continually looks out for patterns in a large number of markets – and orders immediately in case a pattern is detected.
TradingSystems: Let NanoTrader trade your trading system – fully automatic
Scalping: Trading approaches requiring a large number of trades can be realized efficiently
MultiAccount Trading: a signal of a study can be routed to multiple accounts.
8.2 Train with PaperTrading
NanoTrader has a built-in papertrade environment that simulates a real exchange without putting your money at risk. You can safely make yourself familiar with the all of the NanoTrader functionality by using this simulation environment. Once you are confident you can use your real account in exactly the same way as you used the papertrade account.
8.3 Creating an Account
In case your are connected to a Patsystems environment your accounts inside NanoTrader will be created automatically. For all other brokers you will need to create them manually. Therefore rightclick on the Accounts entry in the
WorkspaceBar, choose the account type and follow the instructions.
NanoTrader – Charting & Trading
NanoTrader 51
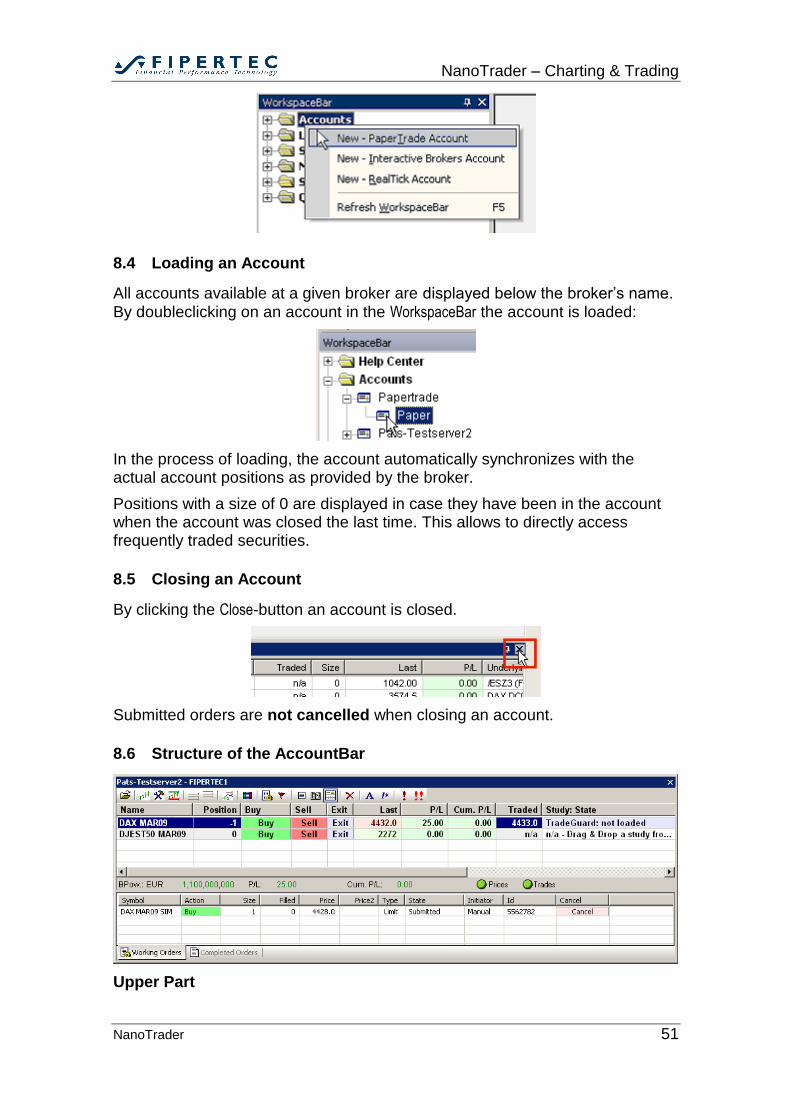
8.4 Loading an Account
All accounts available at a given broker are displayed below the broker’s name. By doubleclicking on an account in the WorkspaceBar the account is loaded:
In the process of loading, the account automatically synchronizes with the actual account positions as provided by the broker.
Positions with a size of 0 are displayed in case they have been in the account when the account was closed the last time. This allows to directly access frequently traded securities.
8.5 Closing an Account
By clicking the Close-button an account is closed.
Submitted orders are not cancelled when closing an account.
8.6 Structure of the AccountBar
Upper Part
NanoTrader – Charting & Trading
NanoTrader 52
The upper part of an account window shows the current account positions. The columns have the following meaning:
Name: descriptive name of the security as given by the data provider or defined manually
Symbol: the symbol used for trading the security at the broker. (This may differ from the symbol used for getting the price data from.)
Buy/Sell/Exit: create a buy/sell/exit order manually
Position: current position size of the security. A negative sign is used for short positions.
Traded: The average price paid for establishing the position. This price is the basis for calculating the position P/L.
P/L: the profit/loss in the current open position in the currency the symbol is traded in
Cum.P/L: the cumulated profit/loss of all closed positions in the currency the symbol is traded in
Last: price of last trade as provided by the broker. Clicking into this cell opens an order dialog where you might buy or sell.
Study – State: The name and state of the study assigned to the position. Clicking into this cell changes the state. See below for a detailed discussion.
Underlying Ticker: The name of the security used for creating signals. The name of the data provider is given in parenthesis. Note that the underlying ticker may be different from the traded security, e.g., the security may be an option that is traded in case the corresponding underlying creates a signal.
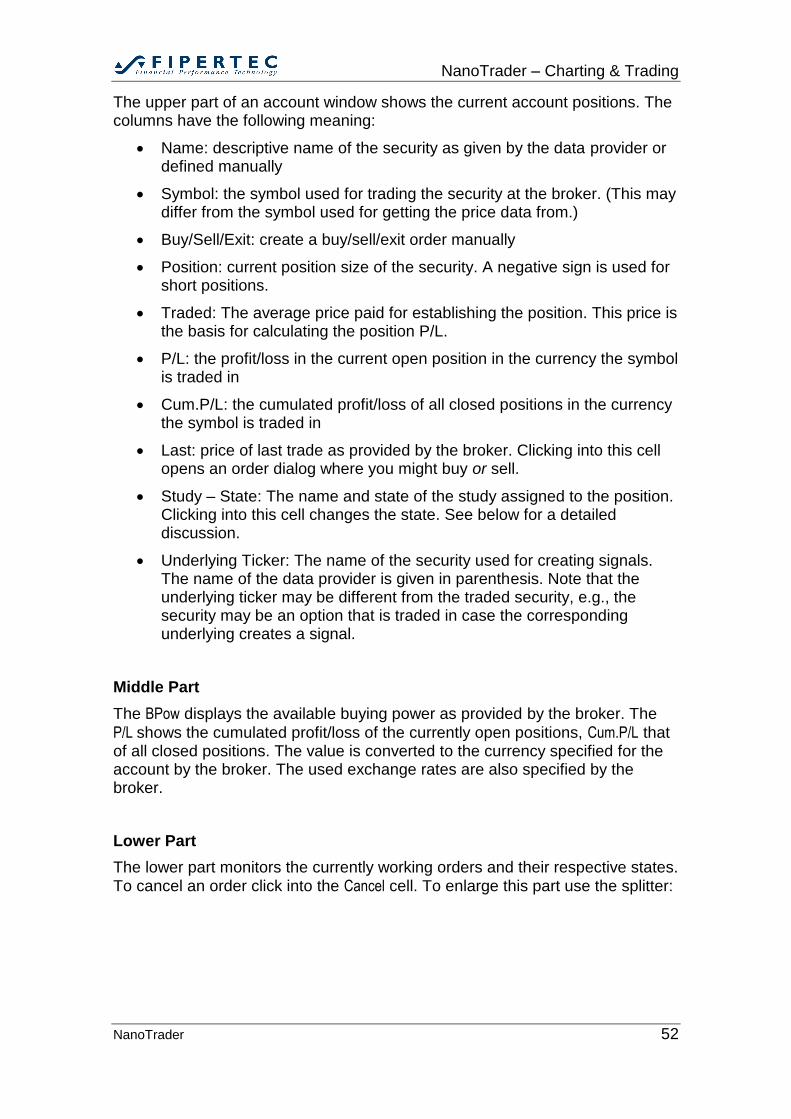
Middle Part
The BPow displays the available buying power as provided by the broker. The
P/L shows the cumulated profit/loss of the currently open positions, Cum.P/L that of all closed positions. The value is converted to the currency specified for the account by the broker. The used exchange rates are also specified by the broker.
Lower Part
The lower part monitors the currently working orders and their respective states.
To cancel an order click into the Cancel cell. To enlarge this part use the splitter:
NanoTrader – Charting & Trading
NanoTrader 53
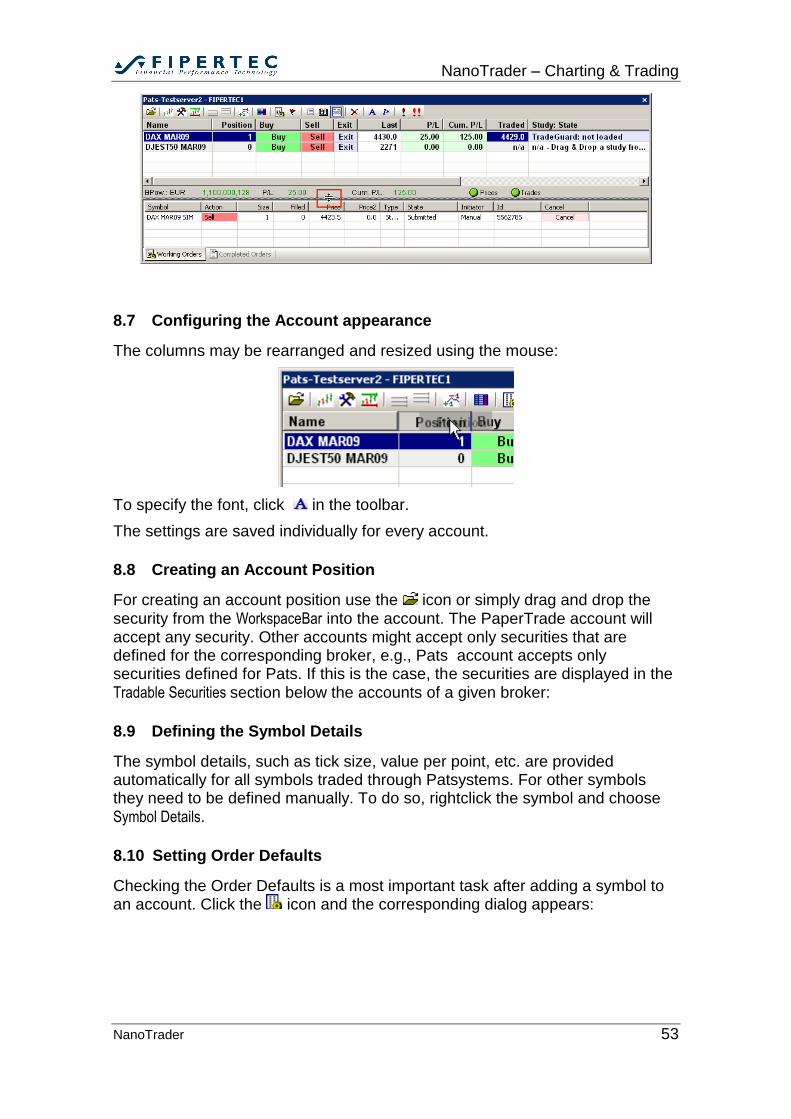
8.7 Configuring the Account appearance
The columns may be rearranged and resized using the mouse:
To specify the font, click in the toolbar.
The settings are saved individually for every account.
8.8 Creating an Account Position
For creating an account position use the icon or simply drag and drop the security from the WorkspaceBar into the account. The PaperTrade account will accept any security. Other accounts might accept only securities that are defined for the corresponding broker, e.g., Pats account accepts only securities defined for Pats. If this is the case, the securities are displayed in the Tradable Securities section below the accounts of a given broker:
8.9 Defining the Symbol Details
The symbol details, such as tick size, value per point, etc. are provided automatically for all symbols traded through Patsystems. For other symbols they need to be defined manually. To do so, rightclick the symbol and choose Symbol Details.
8.10 Setting Order Defaults
Checking the Order Defaults is a most important task after adding a symbol to an account. Click the icon and the corresponding dialog appears:
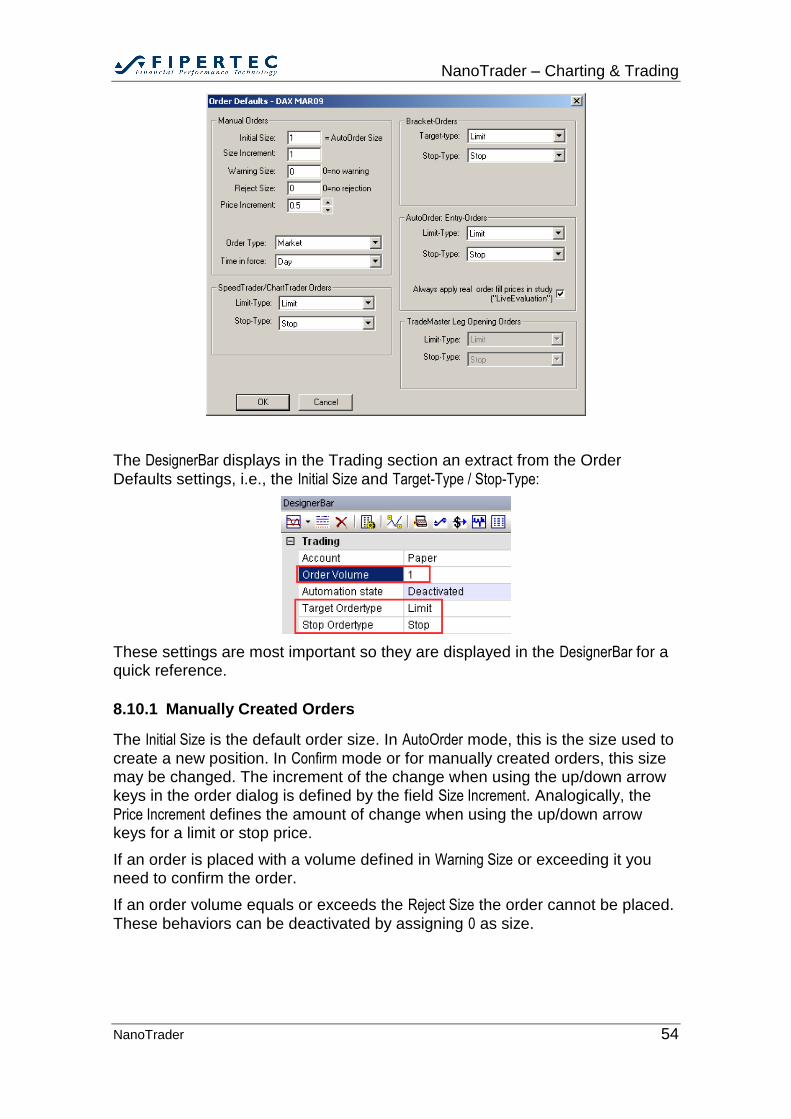
NanoTrader – Charting & Trading
NanoTrader 54
The DesignerBar displays in the Trading section an extract from the Order
Defaults settings, i.e., the Initial Size and Target-Type / Stop-Type:
These settings are most important so they are displayed in the DesignerBar for a quick reference.
8.10.1 Manually Created Orders
The Initial Size is the default order size. In AutoOrder mode, this is the size used to
create a new position. In Confirm mode or for manually created orders, this size may be changed. The increment of the change when using the up/down arrow keys in the order dialog is defined by the field Size Increment. Analogically, the
Price Increment defines the amount of change when using the up/down arrow keys for a limit or stop price.
If an order is placed with a volume defined in Warning Size or exceeding it you need to confirm the order.
If an order volume equals or exceeds the Reject Size the order cannot be placed.
These behaviors can be deactivated by assigning 0 as size.
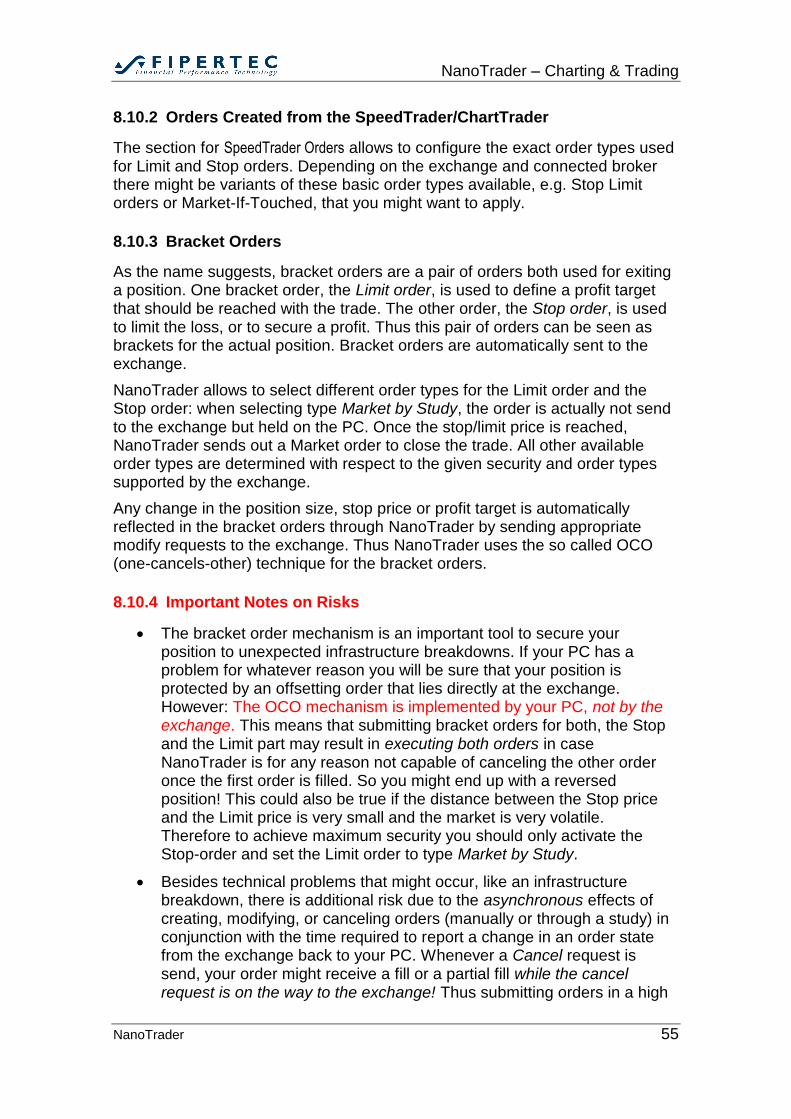
NanoTrader – Charting & Trading
NanoTrader 55
8.10.2 Orders Created from the SpeedTrader/ChartTrader
The section for SpeedTrader Orders allows to configure the exact order types used for Limit and Stop orders. Depending on the exchange and connected broker there might be variants of these basic order types available, e.g. Stop Limit orders or Market-If-Touched, that you might want to apply.
8.10.3 Bracket Orders
As the name suggests, bracket orders are a pair of orders both used for exiting a position. One bracket order, the Limit order, is used to define a profit target that should be reached with the trade. The other order, the Stop order, is used to limit the loss, or to secure a profit. Thus this pair of orders can be seen as brackets for the actual position. Bracket orders are automatically sent to the exchange.
NanoTrader allows to select different order types for the Limit order and the Stop order: when selecting type Market by Study, the order is actually not send to the exchange but held on the PC. Once the stop/limit price is reached, NanoTrader sends out a Market order to close the trade. All other available order types are determined with respect to the given security and order types supported by the exchange.
Any change in the position size, stop price or profit target is automatically reflected in the bracket orders through NanoTrader by sending appropriate modify requests to the exchange. Thus NanoTrader uses the so called OCO (one-cancels-other) technique for the bracket orders.
8.10.4 Important Notes on Risks
The bracket order mechanism is an important tool to secure your position to unexpected infrastructure breakdowns. If your PC has a problem for whatever reason you will be sure that your position is protected by an offsetting order that lies directly at the exchange. However: The OCO mechanism is implemented by your PC, not by the exchange. This means that submitting bracket orders for both, the Stop and the Limit part may result in executing both orders in case NanoTrader is for any reason not capable of canceling the other order once the first order is filled. So you might end up with a reversed position! This could also be true if the distance between the Stop price and the Limit price is very small and the market is very volatile. Therefore to achieve maximum security you should only activate the Stop-order and set the Limit order to type Market by Study.
Besides technical problems that might occur, like an infrastructure breakdown, there is additional risk due to the asynchronous effects of creating, modifying, or canceling orders (manually or through a study) in conjunction with the time required to report a change in an order state from the exchange back to your PC. Whenever a Cancel request is send, your order might receive a fill or a partial fill while the cancel request is on the way to the exchange! Thus submitting orders in a high
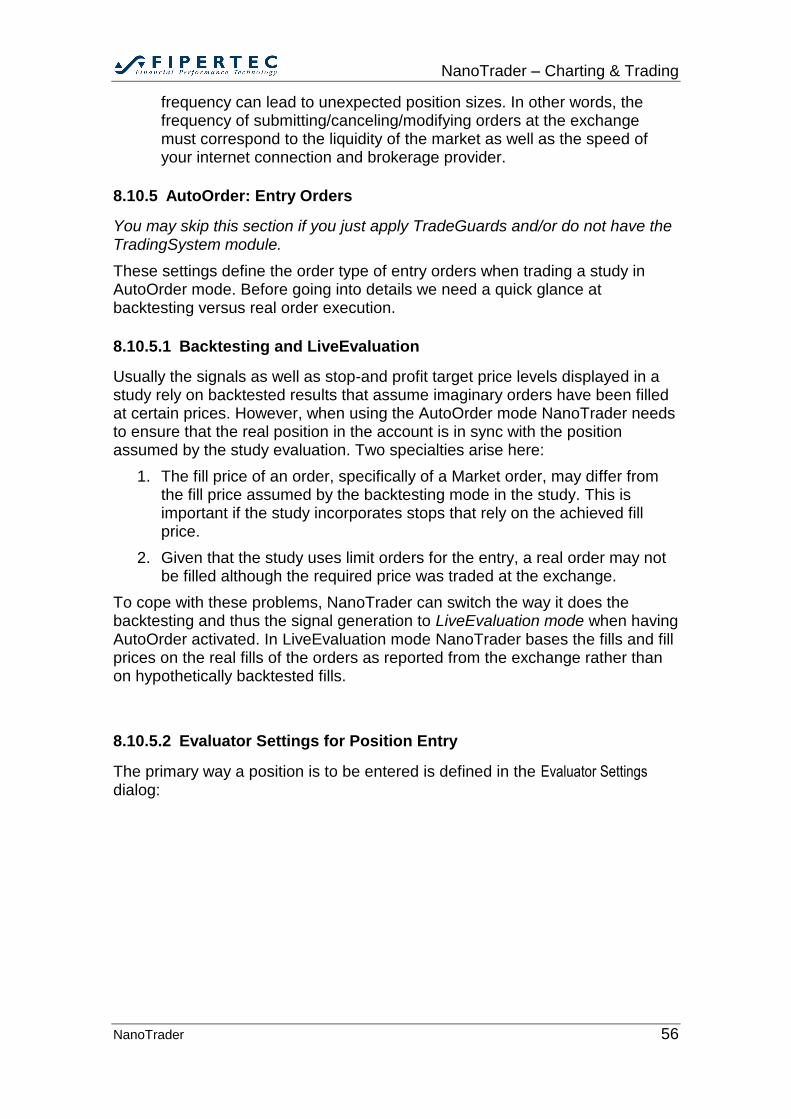
NanoTrader – Charting & Trading
NanoTrader 56
frequency can lead to unexpected position sizes. In other words, the frequency of submitting/canceling/modifying orders at the exchange must correspond to the liquidity of the market as well as the speed of your internet connection and brokerage provider.
8.10.5 AutoOrder: Entry Orders
You may skip this section if you just apply TradeGuards and/or do not have the TradingSystem module.
These settings define the order type of entry orders when trading a study in AutoOrder mode. Before going into details we need a quick glance at backtesting versus real order execution.
8.10.5.1 Backtesting and LiveEvaluation
Usually the signals as well as stop-and profit target price levels displayed in a study rely on backtested results that assume imaginary orders have been filled at certain prices. However, when using the AutoOrder mode NanoTrader needs to ensure that the real position in the account is in sync with the position assumed by the study evaluation. Two specialties arise here:
1. The fill price of an order, specifically of a Market order, may differ from the fill price assumed by the backtesting mode in the study. This is important if the study incorporates stops that rely on the achieved fill price.
2. Given that the study uses limit orders for the entry, a real order may not be filled although the required price was traded at the exchange.
To cope with these problems, NanoTrader can switch the way it does the backtesting and thus the signal generation to LiveEvaluation mode when having AutoOrder activated. In LiveEvaluation mode NanoTrader bases the fills and fill prices on the real fills of the orders as reported from the exchange rather than on hypothetically backtested fills.
8.10.5.2 Evaluator Settings for Position Entry
The primary way a position is to be entered is defined in the Evaluator Settings dialog:
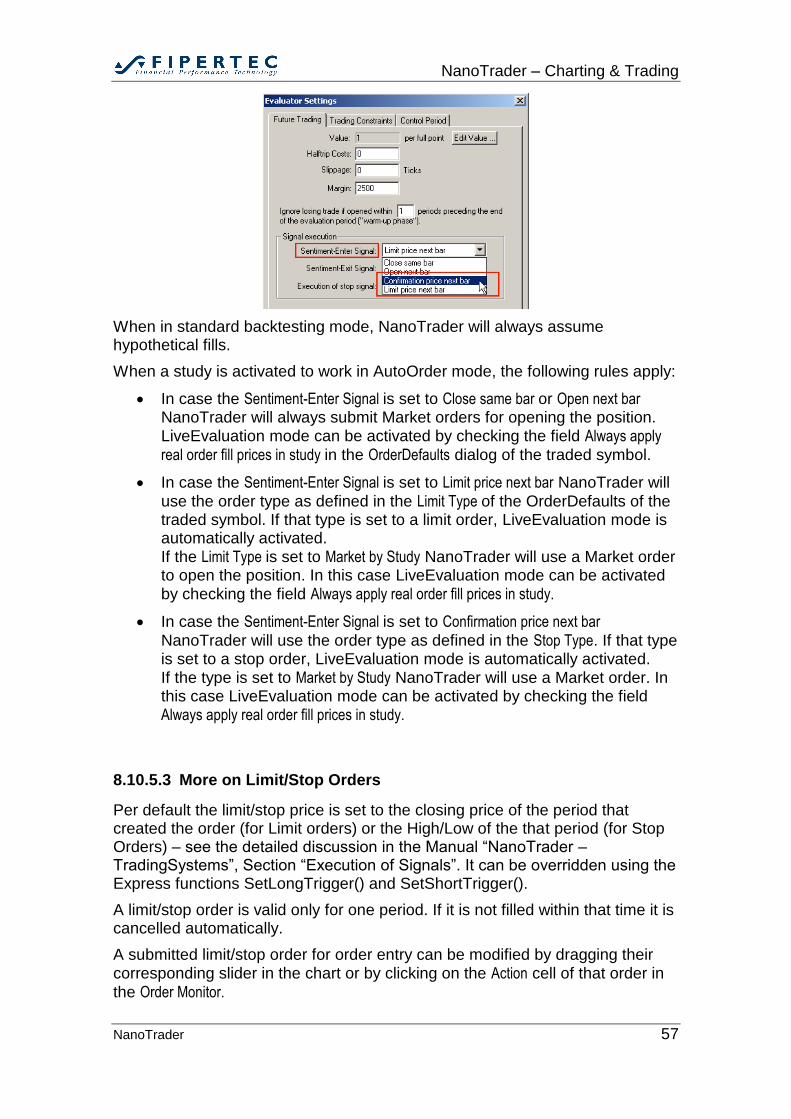
NanoTrader – Charting & Trading
NanoTrader 57
When in standard backtesting mode, NanoTrader will always assume hypothetical fills.
When a study is activated to work in AutoOrder mode, the following rules apply:
In case the Sentiment-Enter Signal is set to Close same bar or Open next bar NanoTrader will always submit Market orders for opening the position. LiveEvaluation mode can be activated by checking the field Always apply
real order fill prices in study in the OrderDefaults dialog of the traded symbol.
In case the Sentiment-Enter Signal is set to Limit price next bar NanoTrader will
use the order type as defined in the Limit Type of the OrderDefaults of the traded symbol. If that type is set to a limit order, LiveEvaluation mode is automatically activated. If the Limit Type is set to Market by Study NanoTrader will use a Market order to open the position. In this case LiveEvaluation mode can be activated by checking the field Always apply real order fill prices in study.
In case the Sentiment-Enter Signal is set to Confirmation price next bar
NanoTrader will use the order type as defined in the Stop Type. If that type is set to a stop order, LiveEvaluation mode is automatically activated. If the type is set to Market by Study NanoTrader will use a Market order. In this case LiveEvaluation mode can be activated by checking the field Always apply real order fill prices in study.
8.10.5.3 More on Limit/Stop Orders
Per default the limit/stop price is set to the closing price of the period that created the order (for Limit orders) or the High/Low of the that period (for Stop Orders) – see the detailed discussion in the Manual “NanoTrader – TradingSystems”, Section “Execution of Signals”. It can be overridden using the Express functions SetLongTrigger() and SetShortTrigger().
A limit/stop order is valid only for one period. If it is not filled within that time it is cancelled automatically.
A submitted limit/stop order for order entry can be modified by dragging their corresponding slider in the chart or by clicking on the Action cell of that order in
the Order Monitor.
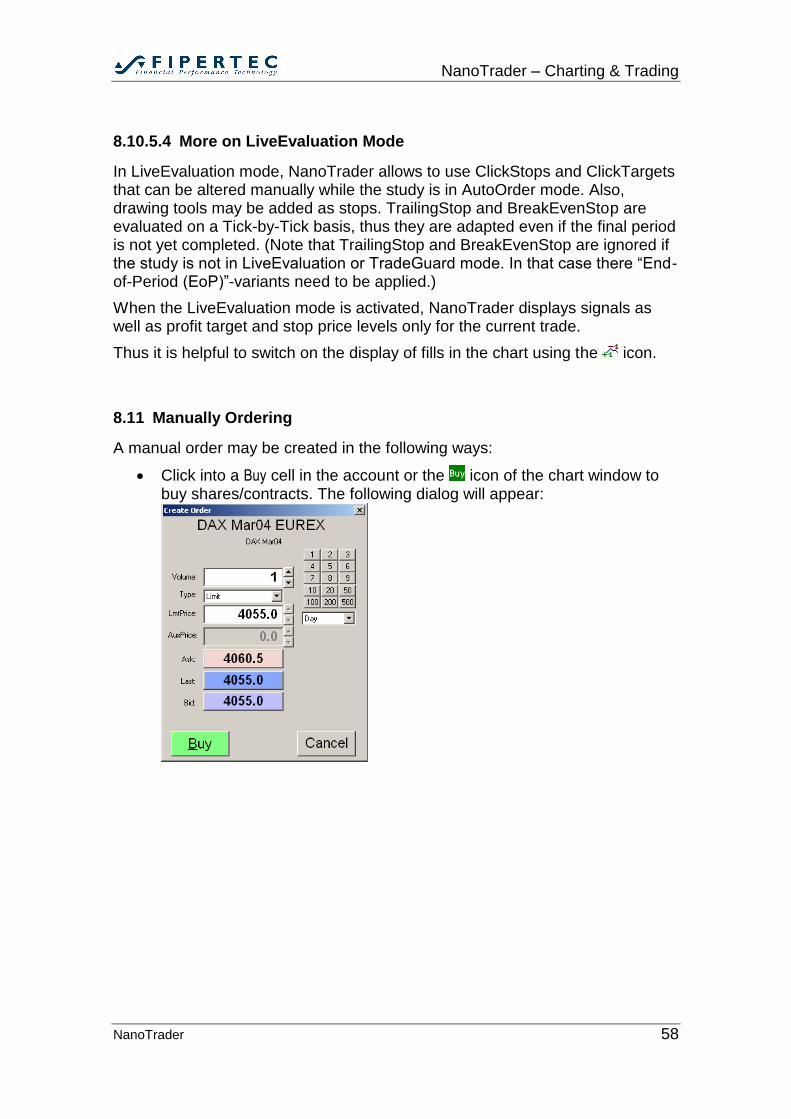
NanoTrader – Charting & Trading
NanoTrader 58
8.10.5.4 More on LiveEvaluation Mode
In LiveEvaluation mode, NanoTrader allows to use ClickStops and ClickTargets that can be altered manually while the study is in AutoOrder mode. Also, drawing tools may be added as stops. TrailingStop and BreakEvenStop are evaluated on a Tick-by-Tick basis, thus they are adapted even if the final period is not yet completed. (Note that TrailingStop and BreakEvenStop are ignored if the study is not in LiveEvaluation or TradeGuard mode. In that case there “End-of-Period (EoP)”-variants need to be applied.)
When the LiveEvaluation mode is activated, NanoTrader displays signals as well as profit target and stop price levels only for the current trade.
Thus it is helpful to switch on the display of fills in the chart using the icon.
8.11 Manually Ordering
A manual order may be created in the following ways:
Click into a Buy cell in the account or the icon of the chart window to buy shares/contracts. The following dialog will appear:
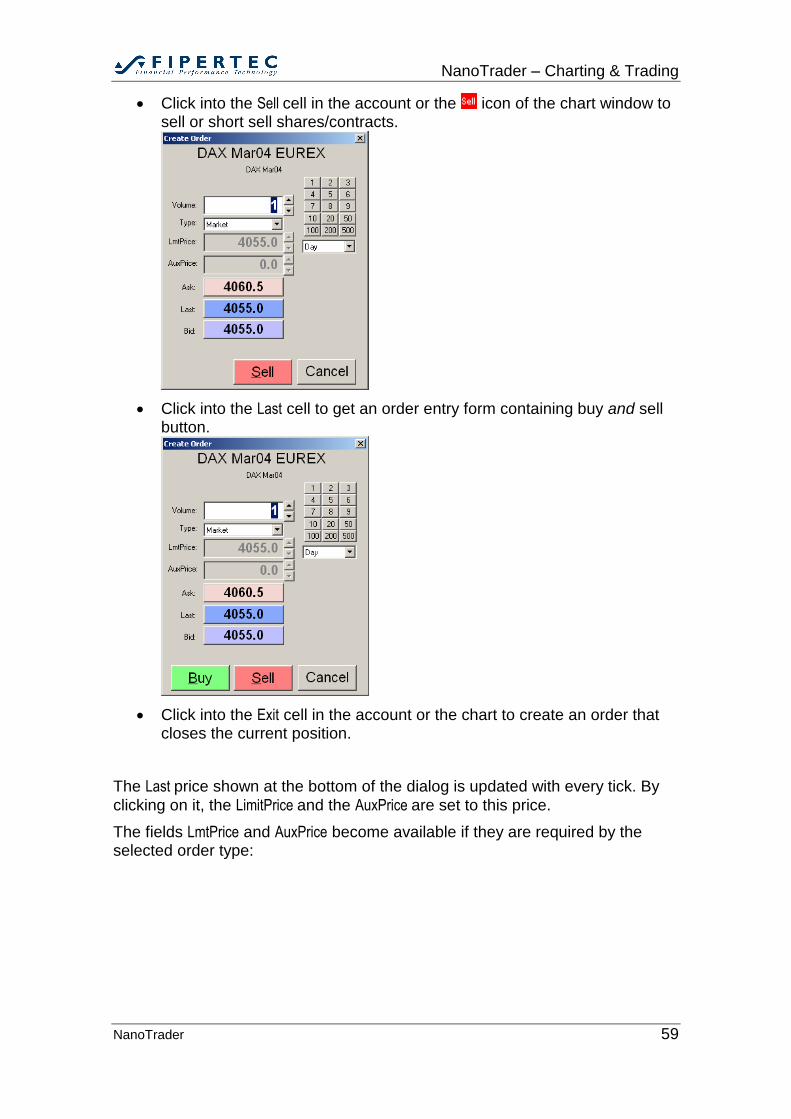
NanoTrader – Charting & Trading
NanoTrader 59
Click into the Sell cell in the account or the icon of the chart window to sell or short sell shares/contracts.
Click into the Last cell to get an order entry form containing buy and sell button.
Click into the Exit cell in the account or the chart to create an order that closes the current position.
The Last price shown at the bottom of the dialog is updated with every tick. By
clicking on it, the LimitPrice and the AuxPrice are set to this price.
The fields LmtPrice and AuxPrice become available if they are required by the selected order type:
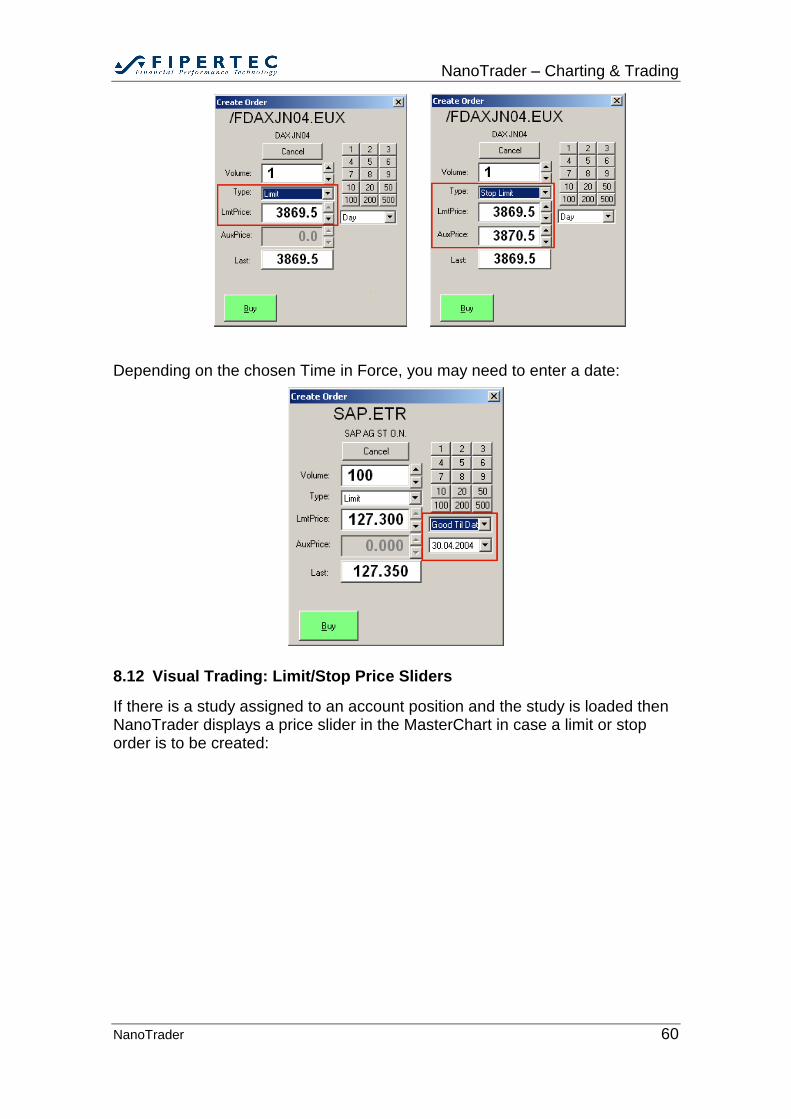
NanoTrader – Charting & Trading
NanoTrader 60
Depending on the chosen Time in Force, you may need to enter a date:
8.12 Visual Trading: Limit/Stop Price Sliders
If there is a study assigned to an account position and the study is loaded then NanoTrader displays a price slider in the MasterChart in case a limit or stop order is to be created:
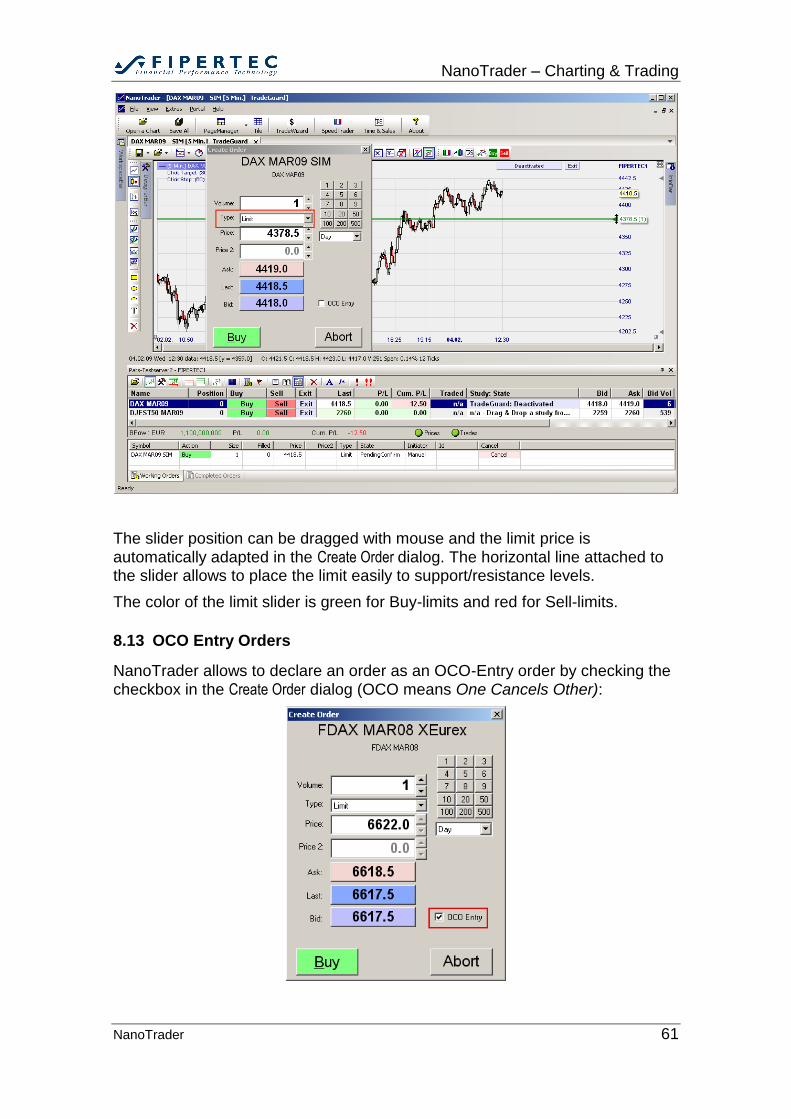
NanoTrader – Charting & Trading
NanoTrader 61
The slider position can be dragged with mouse and the limit price is automatically adapted in the Create Order dialog. The horizontal line attached to the slider allows to place the limit easily to support/resistance levels.
The color of the limit slider is green for Buy-limits and red for Sell-limits.
8.13 OCO Entry Orders
NanoTrader allows to declare an order as an OCO-Entry order by checking the checkbox in the Create Order dialog (OCO means One Cancels Other):
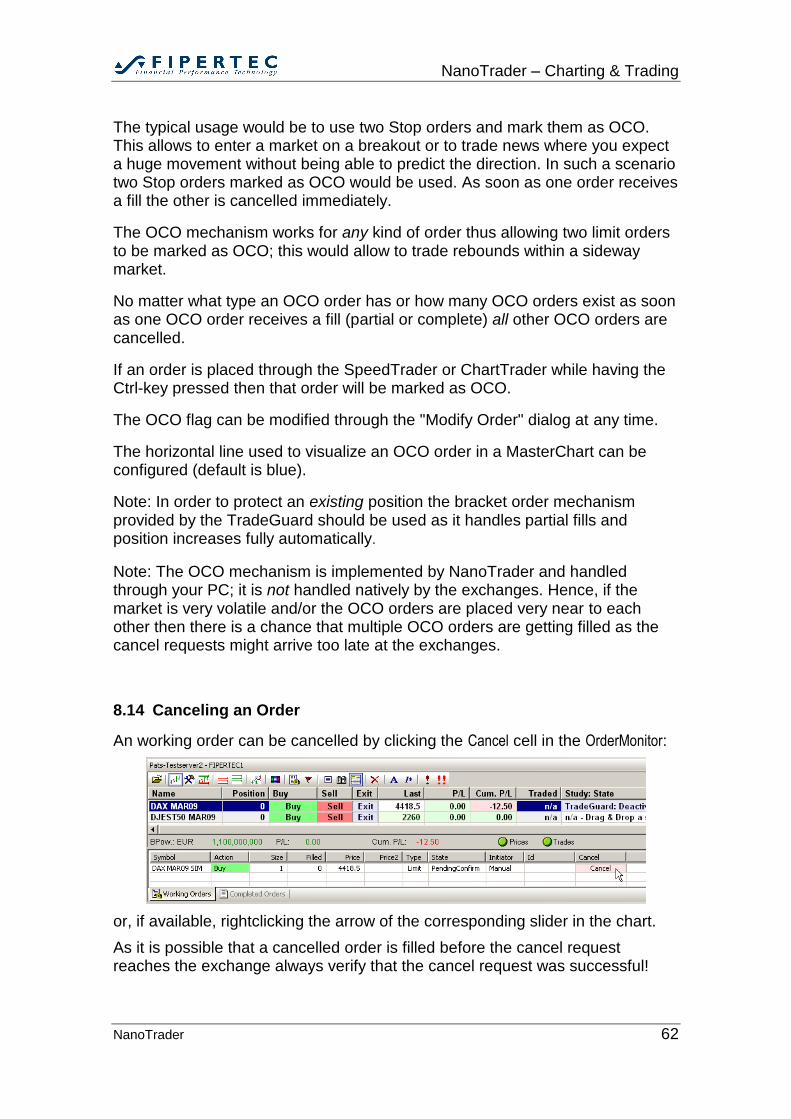
NanoTrader – Charting & Trading
NanoTrader 62
The typical usage would be to use two Stop orders and mark them as OCO. This allows to enter a market on a breakout or to trade news where you expect a huge movement without being able to predict the direction. In such a scenario two Stop orders marked as OCO would be used. As soon as one order receives a fill the other is cancelled immediately.
The OCO mechanism works for any kind of order thus allowing two limit orders to be marked as OCO; this would allow to trade rebounds within a sideway market.
No matter what type an OCO order has or how many OCO orders exist as soon as one OCO order receives a fill (partial or complete) all other OCO orders are cancelled.
If an order is placed through the SpeedTrader or ChartTrader while having the Ctrl-key pressed then that order will be marked as OCO.
The OCO flag can be modified through the "Modify Order" dialog at any time.
The horizontal line used to visualize an OCO order in a MasterChart can be configured (default is blue).
Note: In order to protect an existing position the bracket order mechanism provided by the TradeGuard should be used as it handles partial fills and position increases fully automatically.
Note: The OCO mechanism is implemented by NanoTrader and handled through your PC; it is not handled natively by the exchanges. Hence, if the market is very volatile and/or the OCO orders are placed very near to each other then there is a chance that multiple OCO orders are getting filled as the cancel requests might arrive too late at the exchanges.
8.14 Canceling an Order
An working order can be cancelled by clicking the Cancel cell in the OrderMonitor:
or, if available, rightclicking the arrow of the corresponding slider in the chart.
As it is possible that a cancelled order is filled before the cancel request reaches the exchange always verify that the cancel request was successful!
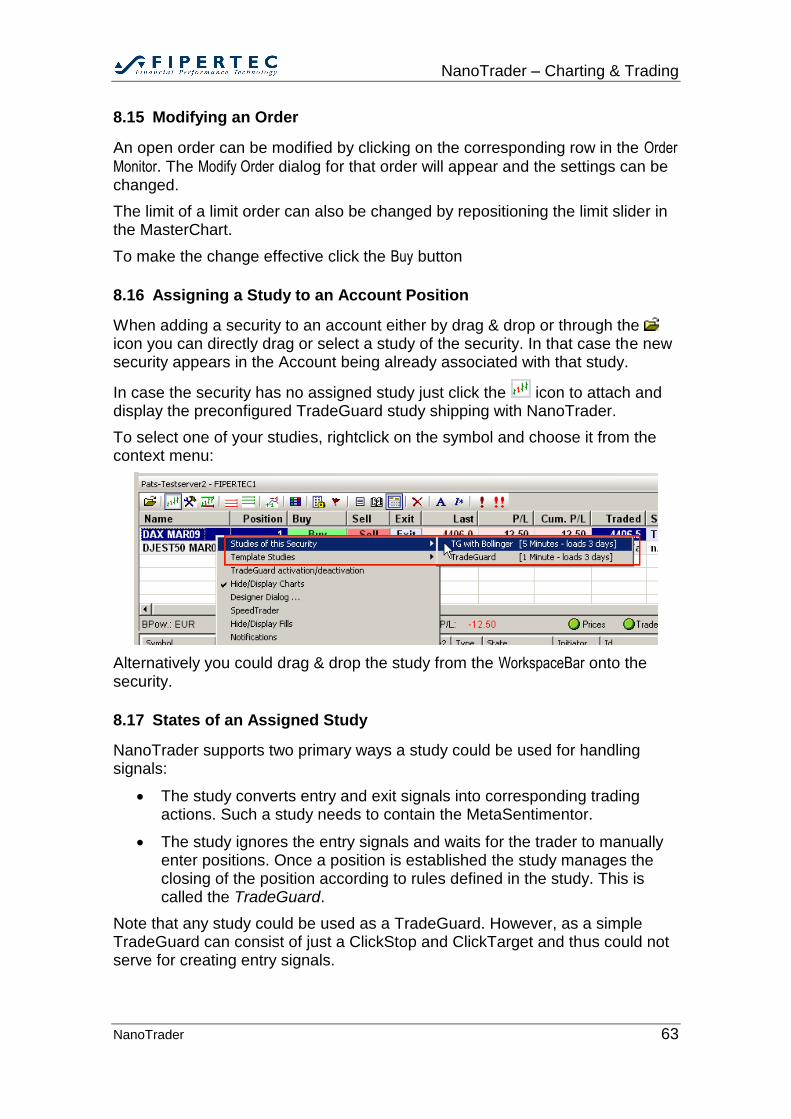
NanoTrader – Charting & Trading
NanoTrader 63
8.15 Modifying an Order
An open order can be modified by clicking on the corresponding row in the Order
Monitor. The Modify Order dialog for that order will appear and the settings can be changed.
The limit of a limit order can also be changed by repositioning the limit slider in the MasterChart.
To make the change effective click the Buy button
8.16 Assigning a Study to an Account Position
When adding a security to an account either by drag & drop or through the icon you can directly drag or select a study of the security. In that case the new security appears in the Account being already associated with that study.
In case the security has no assigned study just click the icon to attach and display the preconfigured TradeGuard study shipping with NanoTrader.
To select one of your studies, rightclick on the symbol and choose it from the context menu:
Alternatively you could drag & drop the study from the WorkspaceBar onto the security.
8.17 States of an Assigned Study
NanoTrader supports two primary ways a study could be used for handling signals:
The study converts entry and exit signals into corresponding trading actions. Such a study needs to contain the MetaSentimentor.
The study ignores the entry signals and waits for the trader to manually enter positions. Once a position is established the study manages the closing of the position according to rules defined in the study. This is called the TradeGuard.
Note that any study could be used as a TradeGuard. However, as a simple TradeGuard can consist of just a ClickStop and ClickTarget and thus could not serve for creating entry signals.
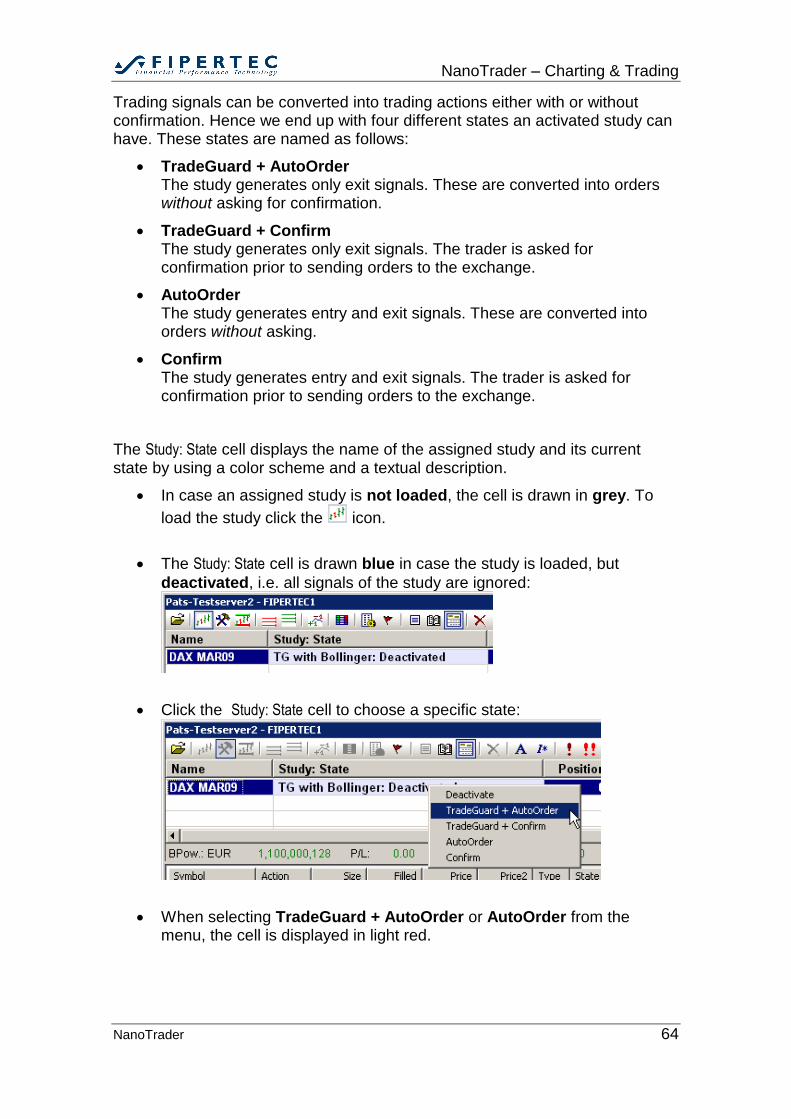
NanoTrader – Charting & Trading
NanoTrader 64
Trading signals can be converted into trading actions either with or without confirmation. Hence we end up with four different states an activated study can have. These states are named as follows:
TradeGuard + AutoOrder The study generates only exit signals. These are converted into orders without asking for confirmation.
TradeGuard + Confirm The study generates only exit signals. The trader is asked for confirmation prior to sending orders to the exchange.
AutoOrder The study generates entry and exit signals. These are converted into orders without asking.
Confirm The study generates entry and exit signals. The trader is asked for confirmation prior to sending orders to the exchange.
The Study: State cell displays the name of the assigned study and its current state by using a color scheme and a textual description.
In case an assigned study is not loaded, the cell is drawn in grey. To
load the study click the icon.
The Study: State cell is drawn blue in case the study is loaded, but
deactivated, i.e. all signals of the study are ignored:
Click the Study: State cell to choose a specific state:
When selecting TradeGuard + AutoOrder or AutoOrder from the menu, the cell is displayed in light red.
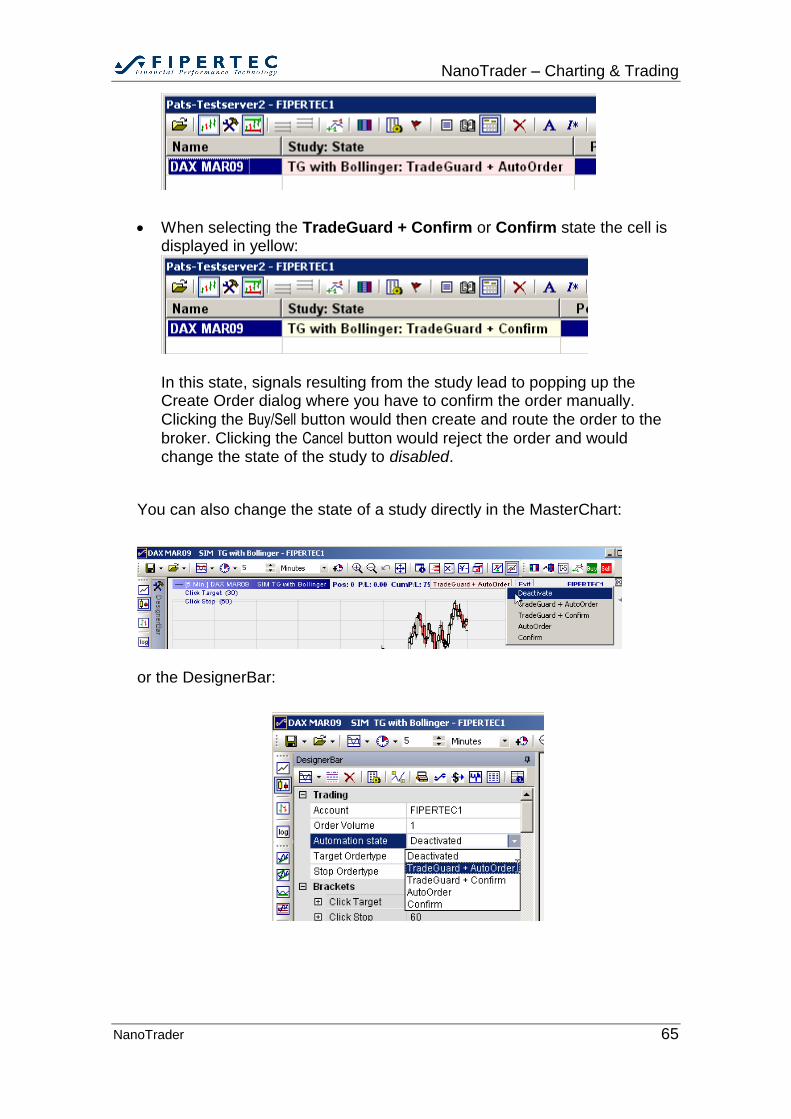
NanoTrader – Charting & Trading
NanoTrader 65
When selecting the TradeGuard + Confirm or Confirm state the cell is displayed in yellow:
In this state, signals resulting from the study lead to popping up the Create Order dialog where you have to confirm the order manually. Clicking the Buy/Sell button would then create and route the order to the
broker. Clicking the Cancel button would reject the order and would change the state of the study to disabled.
You can also change the state of a study directly in the MasterChart:
or the DesignerBar:
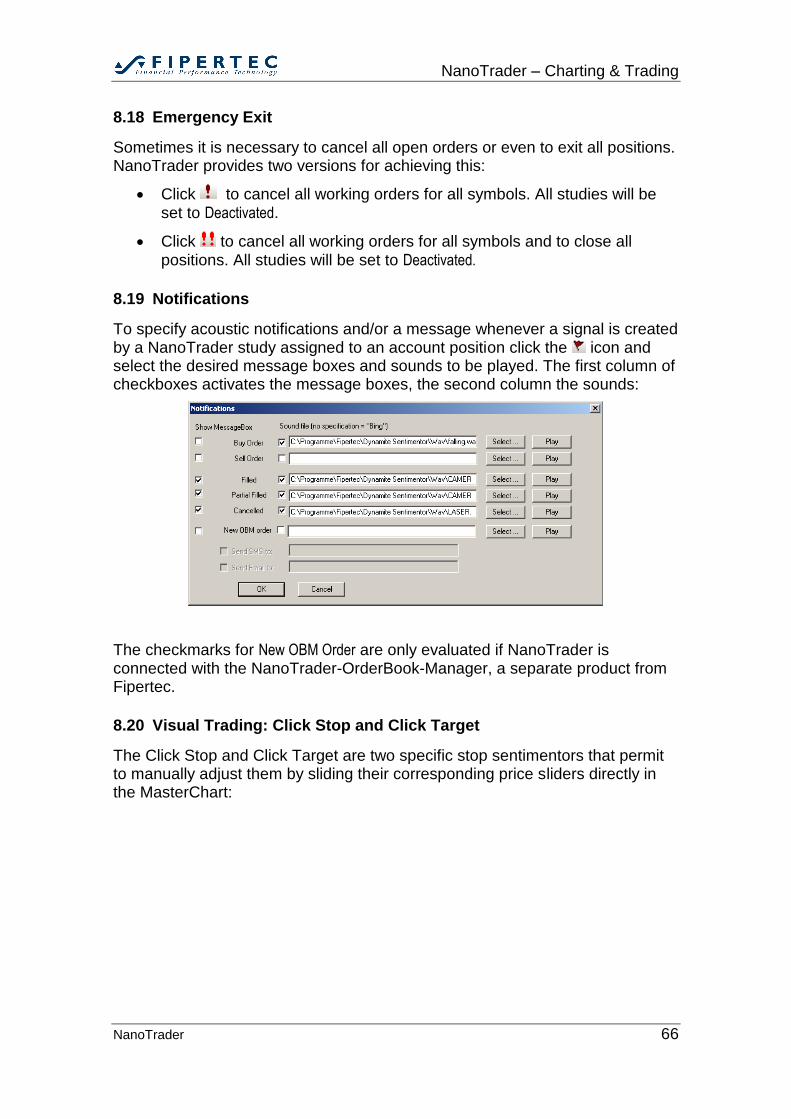
NanoTrader – Charting & Trading
NanoTrader 66
8.18 Emergency Exit
Sometimes it is necessary to cancel all open orders or even to exit all positions. NanoTrader provides two versions for achieving this:
Click to cancel all working orders for all symbols. All studies will be set to Deactivated.
Click to cancel all working orders for all symbols and to close all positions. All studies will be set to Deactivated.
8.19 Notifications
To specify acoustic notifications and/or a message whenever a signal is created by a NanoTrader study assigned to an account position click the icon and select the desired message boxes and sounds to be played. The first column of checkboxes activates the message boxes, the second column the sounds:
The checkmarks for New OBM Order are only evaluated if NanoTrader is connected with the NanoTrader-OrderBook-Manager, a separate product from Fipertec.
8.20 Visual Trading: Click Stop and Click Target
The Click Stop and Click Target are two specific stop sentimentors that permit to manually adjust them by sliding their corresponding price sliders directly in the MasterChart:
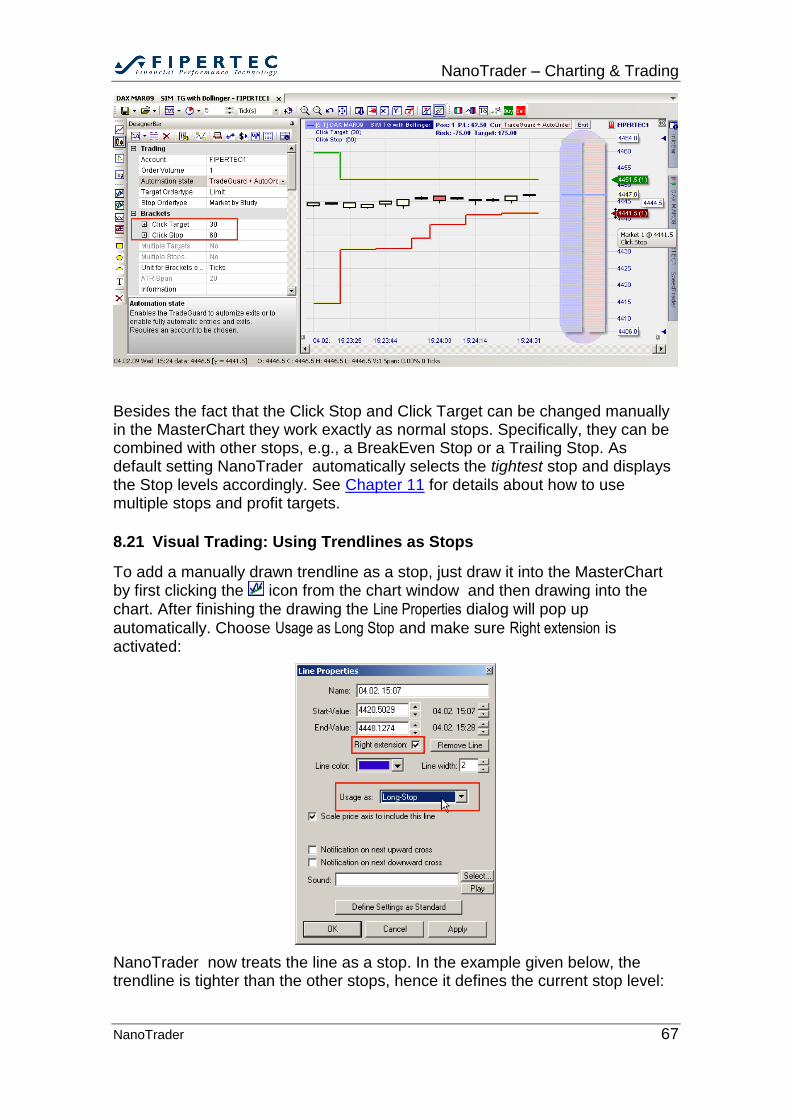
NanoTrader – Charting & Trading
NanoTrader 67
Besides the fact that the Click Stop and Click Target can be changed manually in the MasterChart they work exactly as normal stops. Specifically, they can be combined with other stops, e.g., a BreakEven Stop or a Trailing Stop. As default setting NanoTrader automatically selects the tightest stop and displays the Stop levels accordingly. See Chapter 11 for details about how to use multiple stops and profit targets.
8.21 Visual Trading: Using Trendlines as Stops
To add a manually drawn trendline as a stop, just draw it into the MasterChart by first clicking the icon from the chart window and then drawing into the chart. After finishing the drawing the Line Properties dialog will pop up
automatically. Choose Usage as Long Stop and make sure Right extension is activated:
NanoTrader now treats the line as a stop. In the example given below, the trendline is tighter than the other stops, hence it defines the current stop level:
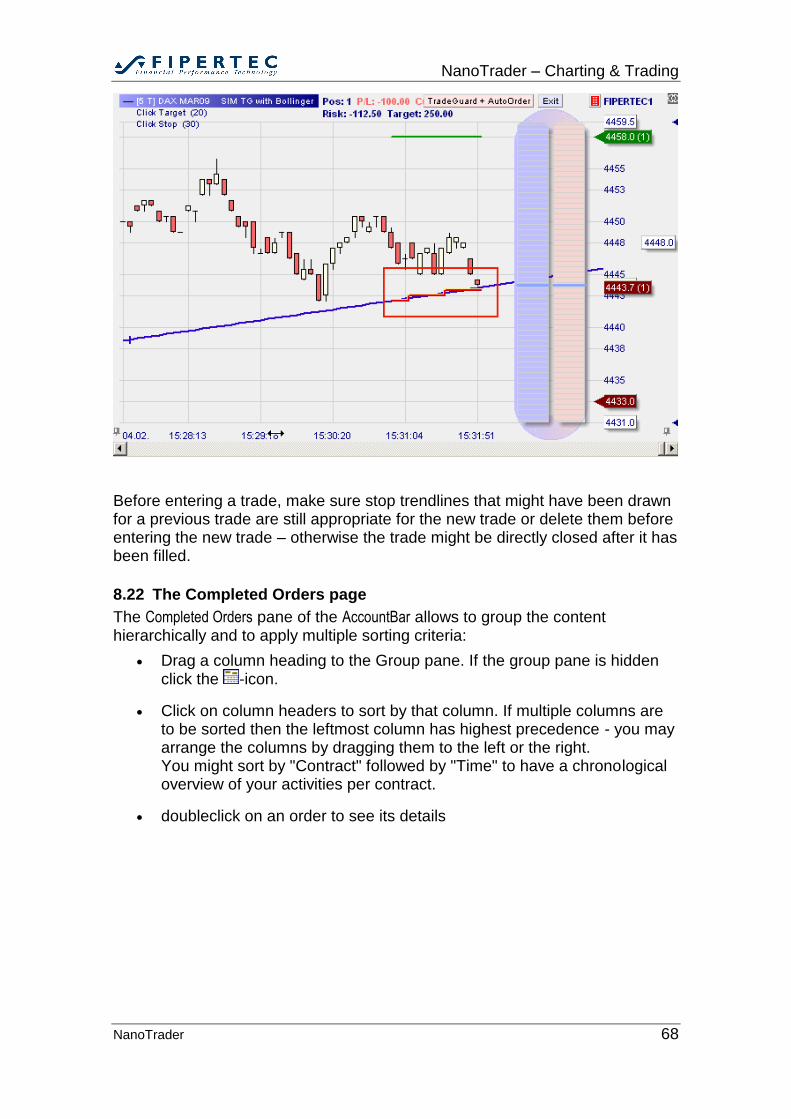
NanoTrader – Charting & Trading
NanoTrader 68
Before entering a trade, make sure stop trendlines that might have been drawn for a previous trade are still appropriate for the new trade or delete them before entering the new trade – otherwise the trade might be directly closed after it has been filled.
8.22 The Completed Orders page
The Completed Orders pane of the AccountBar allows to group the content hierarchically and to apply multiple sorting criteria:
Drag a column heading to the Group pane. If the group pane is hidden click the -icon.
Click on column headers to sort by that column. If multiple columns are to be sorted then the leftmost column has highest precedence - you may arrange the columns by dragging them to the left or the right. You might sort by "Contract" followed by "Time" to have a chronological overview of your activities per contract.
doubleclick on an order to see its details

NanoTrader – Charting & Trading
NanoTrader 69
8.23 DayTrading Statistics
This feature evaluates the fills of a trading day and condenses them to trades. All trades are then displayed graphically in a histogram, a trade list, and a set of statistics.
8.23.1 The DayTrading Statistics Dialog
To open the Daytrading-Statistics click the toolbar button in the account window:
The DayTrading Statistics dialog looks as follows:
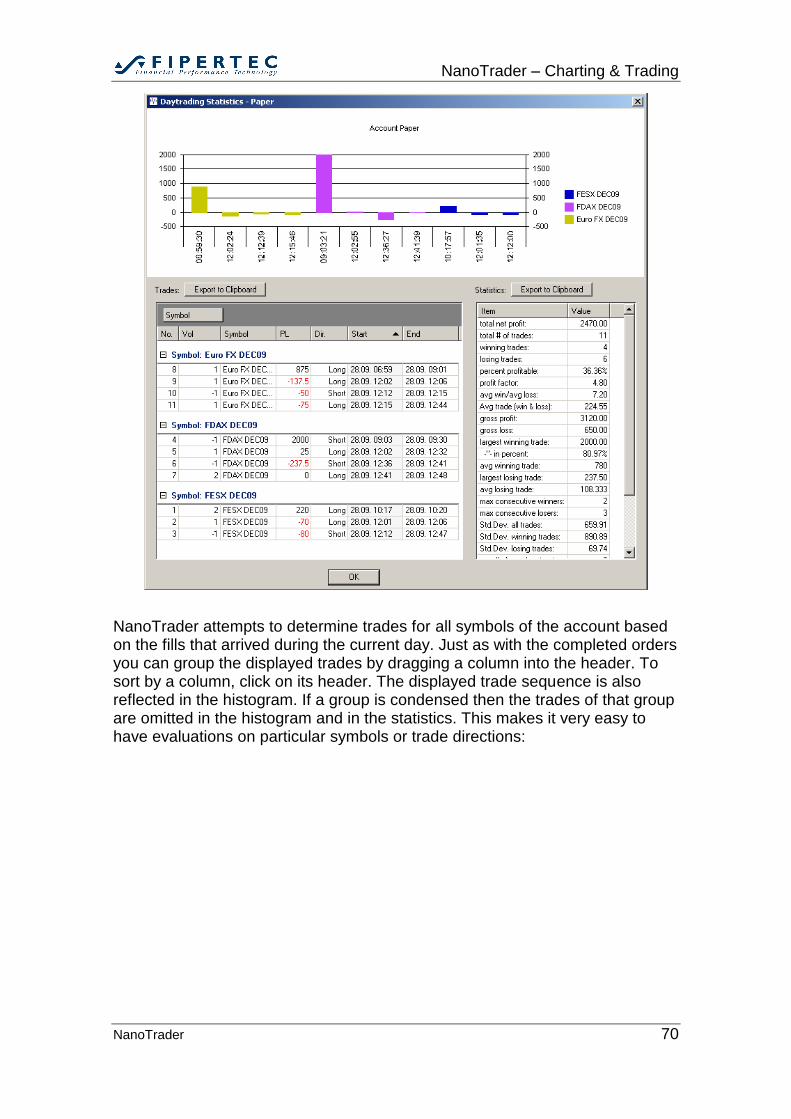
NanoTrader – Charting & Trading
NanoTrader 70
NanoTrader attempts to determine trades for all symbols of the account based on the fills that arrived during the current day. Just as with the completed orders you can group the displayed trades by dragging a column into the header. To sort by a column, click on its header. The displayed trade sequence is also reflected in the histogram. If a group is condensed then the trades of that group are omitted in the histogram and in the statistics. This makes it very easy to have evaluations on particular symbols or trade directions:
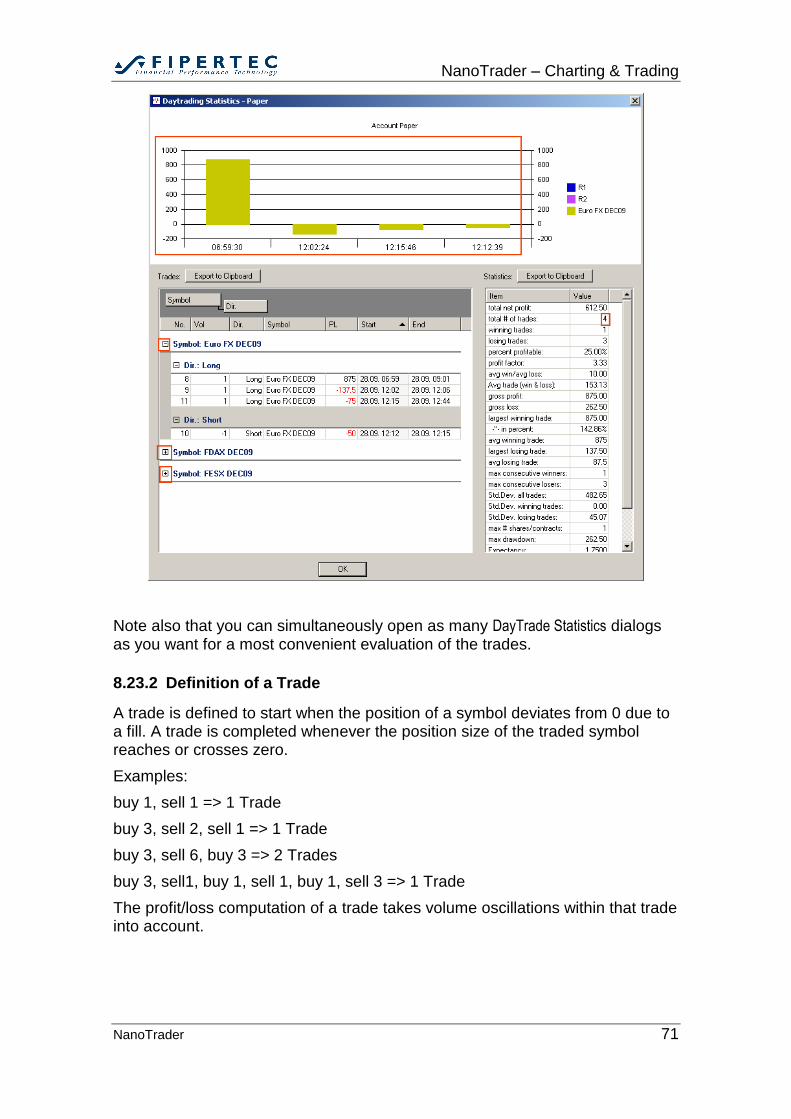
NanoTrader – Charting & Trading
NanoTrader 71
Note also that you can simultaneously open as many DayTrade Statistics dialogs as you want for a most convenient evaluation of the trades.
8.23.2 Definition of a Trade
A trade is defined to start when the position of a symbol deviates from 0 due to a fill. A trade is completed whenever the position size of the traded symbol reaches or crosses zero.
Examples:
buy 1, sell 1 => 1 Trade
buy 3, sell 2, sell 1 => 1 Trade
buy 3, sell 6, buy 3 => 2 Trades
buy 3, sell1, buy 1, sell 1, buy 1, sell 3 => 1 Trade
The profit/loss computation of a trade takes volume oscillations within that trade into account.
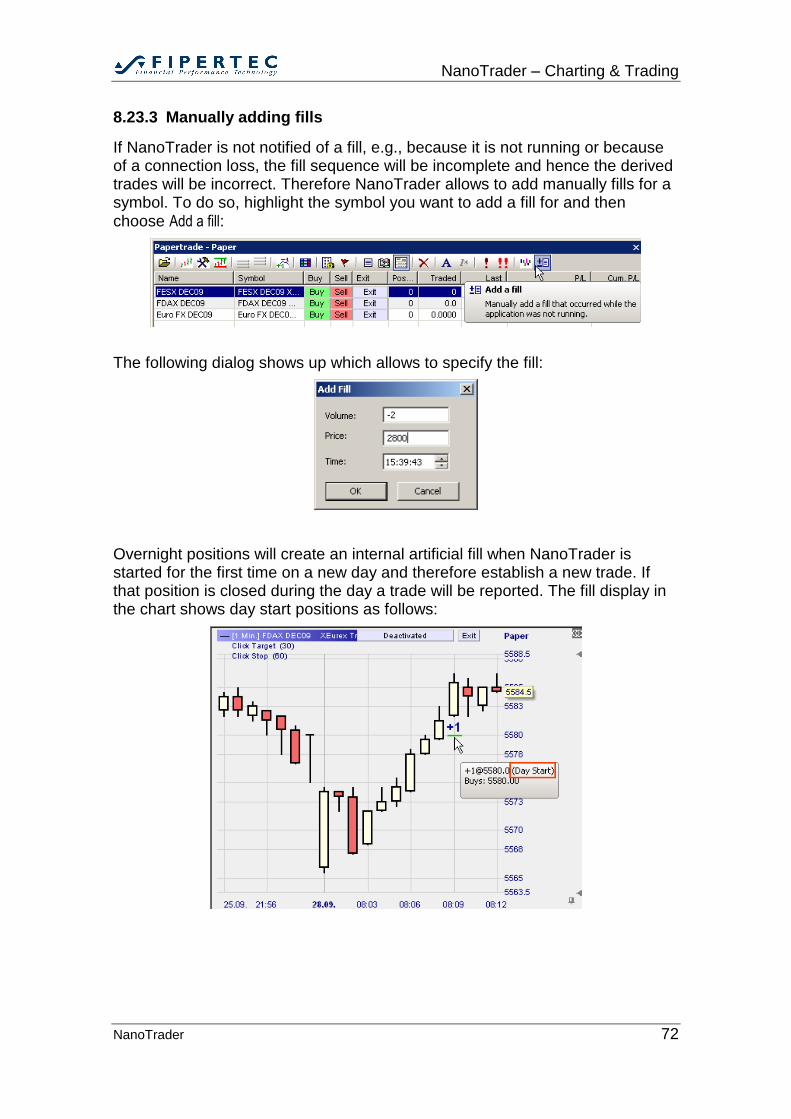
NanoTrader – Charting & Trading
NanoTrader 72
8.23.3 Manually adding fills
If NanoTrader is not notified of a fill, e.g., because it is not running or because of a connection loss, the fill sequence will be incomplete and hence the derived trades will be incorrect. Therefore NanoTrader allows to add manually fills for a symbol. To do so, highlight the symbol you want to add a fill for and then choose Add a fill:
The following dialog shows up which allows to specify the fill:
Overnight positions will create an internal artificial fill when NanoTrader is started for the first time on a new day and therefore establish a new trade. If that position is closed during the day a trade will be reported. The fill display in the chart shows day start positions as follows:
NanoTrader – Charting & Trading
NanoTrader 73
8.23.4 Fills from Interactive Brokers
Interactive Brokers adapts the execution price of an order with the paid commissions. Therefore the calculated p/l for a trade will deviate slightly from the real p/l.
Moreover, Interactive Brokers sometimes fails in reporting all partial fills for a given order. NanoTrader internally recreates missing partial fills, but sometimes the execution price cannot be reconstructed. This results again in the p/l deviating slightly from the real p/l.
However, the DayTrade Statistics still gives a valuable overview of the occurred trades and their statistics.
9 Visual Trading: Tactics and TacticOrders
As opposed to creating a full fledged trading system consisting of entry and exit rules that perform good over a longer period of time, the core idea of the Tactics is to allow the trader to do an ad-hoc decision of either how to manage an existing position or when to submit a new order by taking advantage of the decision support features of NanoTrader. NanoTrader supports the following variants of Tactics:
A simple Tactic can be activated for an order that is already submitted to an exchange. Such a Tactic automatically adapts the Limit or Stop price of that order.
A TacticOrder is a special order type managed by NanoTrader. It monitors a selection of the sentimentors of an underlying study and creates a Market order as soon as the sentimentors meet the signal condition as defined in the TacticOrder. The main principle is similar to a voting where the majority determines the action given the majority is “strong” enough. Here the voters are the selected sentimentors.
9.1 Tactics
9.1.1 Tactics - How they work
Each working order is visualized in the chart by a slider:
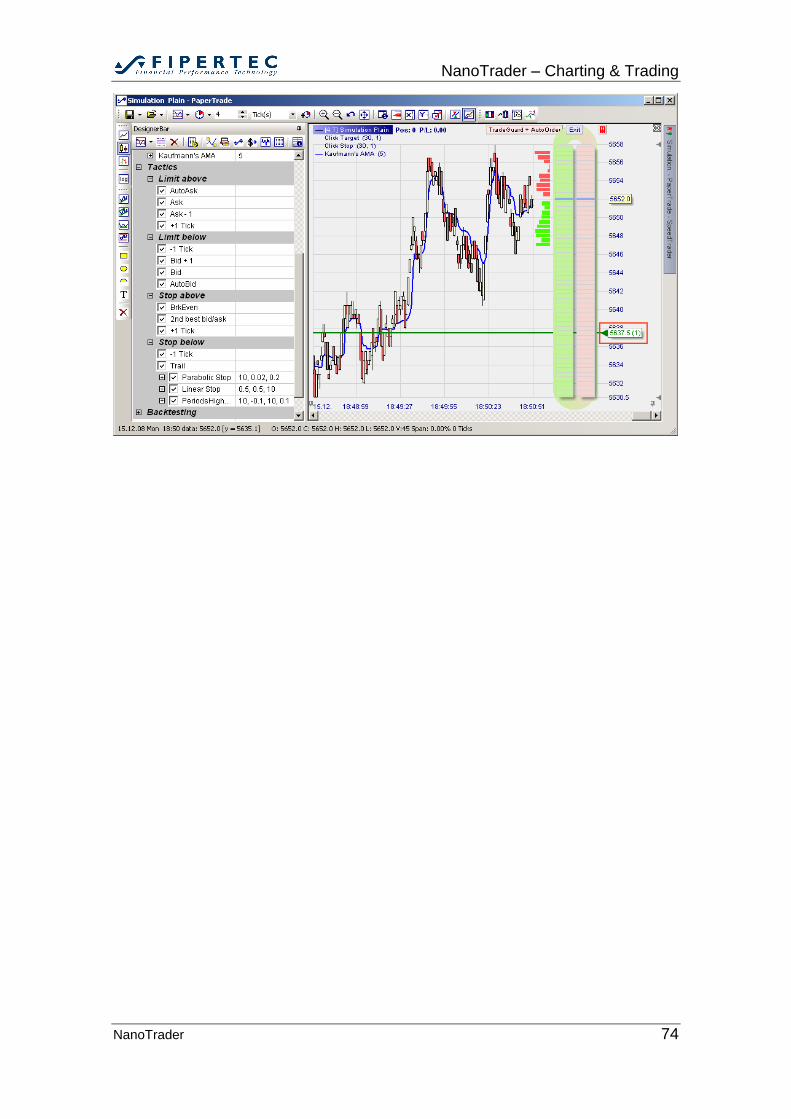
NanoTrader – Charting & Trading
NanoTrader 74
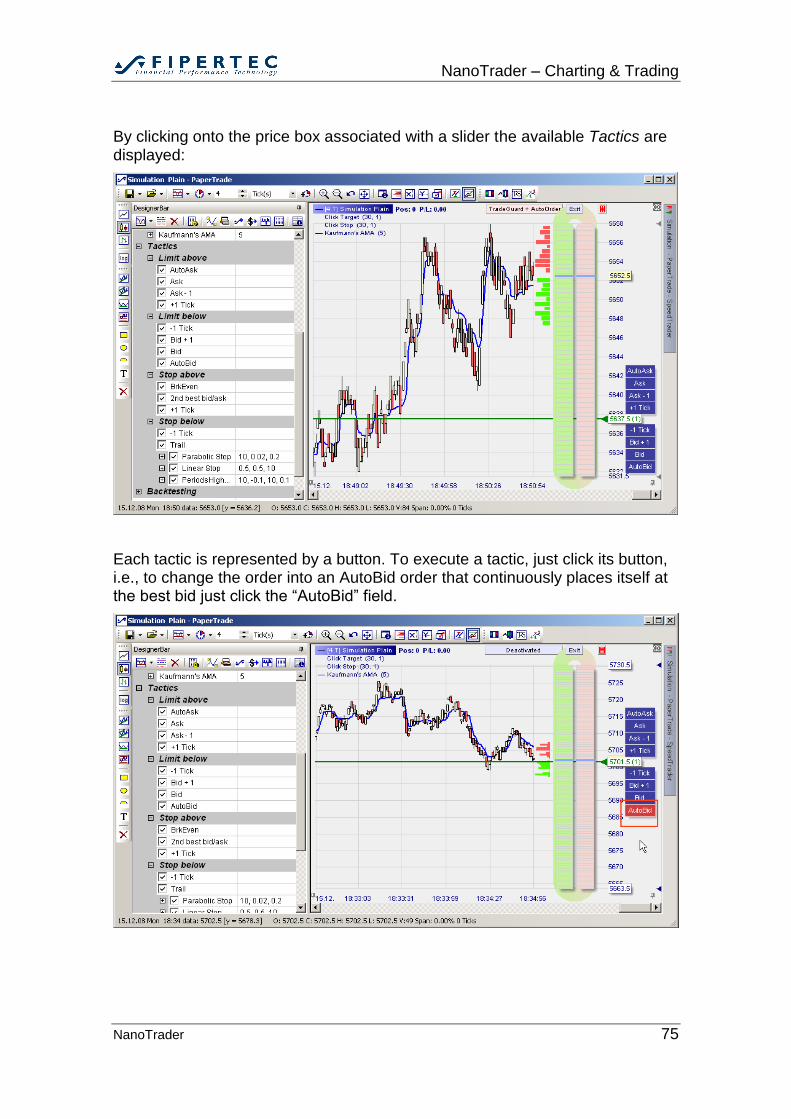
NanoTrader – Charting & Trading
NanoTrader 75
By clicking onto the price box associated with a slider the available Tactics are displayed:
Each tactic is represented by a button. To execute a tactic, just click its button, i.e., to change the order into an AutoBid order that continuously places itself at the best bid just click the “AutoBid” field.
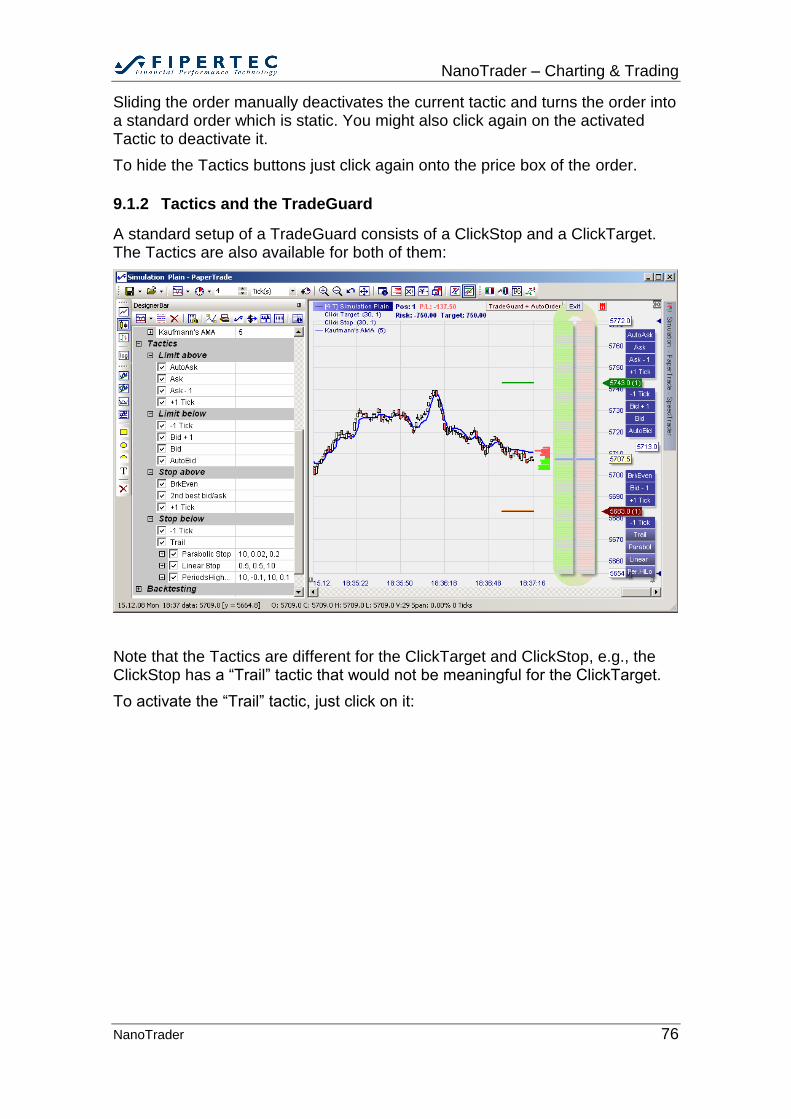
NanoTrader – Charting & Trading
NanoTrader 76
Sliding the order manually deactivates the current tactic and turns the order into a standard order which is static. You might also click again on the activated Tactic to deactivate it.
To hide the Tactics buttons just click again onto the price box of the order.
9.1.2 Tactics and the TradeGuard
A standard setup of a TradeGuard consists of a ClickStop and a ClickTarget. The Tactics are also available for both of them:
Note that the Tactics are different for the ClickTarget and ClickStop, e.g., the ClickStop has a “Trail” tactic that would not be meaningful for the ClickTarget.
To activate the “Trail” tactic, just click on it:
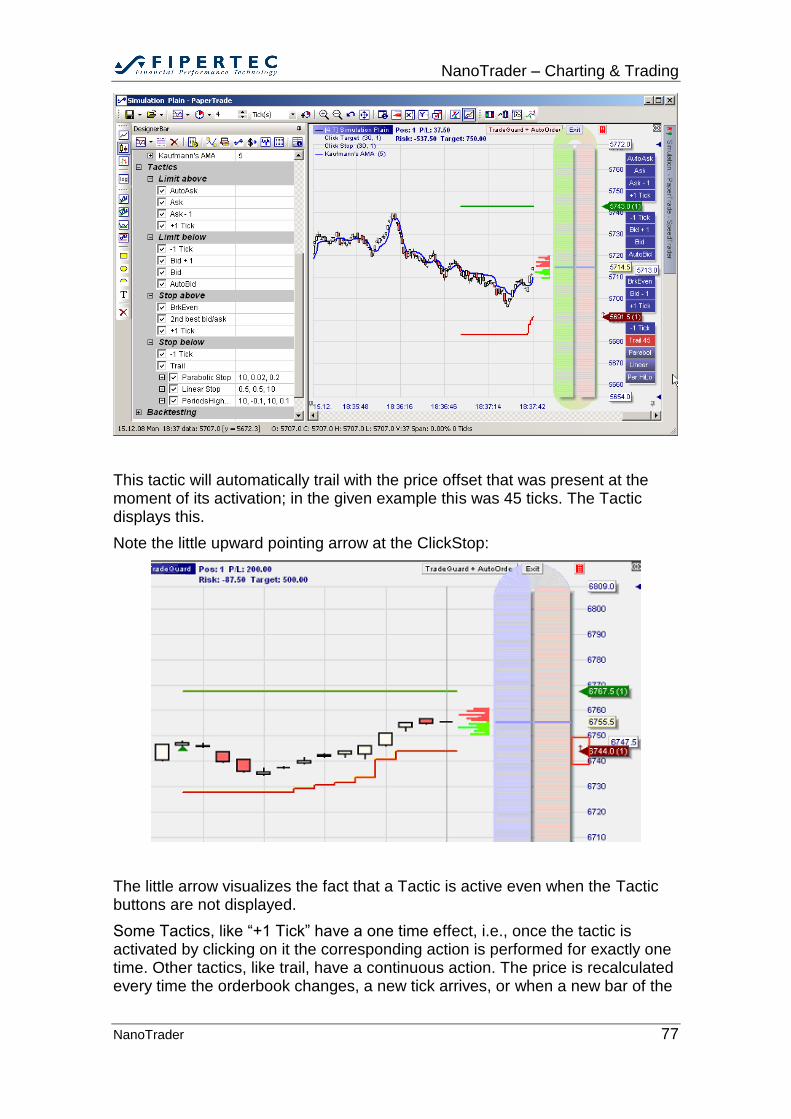
NanoTrader – Charting & Trading
NanoTrader 77
This tactic will automatically trail with the price offset that was present at the moment of its activation; in the given example this was 45 ticks. The Tactic displays this.
Note the little upward pointing arrow at the ClickStop:
The little arrow visualizes the fact that a Tactic is active even when the Tactic buttons are not displayed.
Some Tactics, like “+1 Tick” have a one time effect, i.e., once the tactic is activated by clicking on it the corresponding action is performed for exactly one time. Other tactics, like trail, have a continuous action. The price is recalculated every time the orderbook changes, a new tick arrives, or when a new bar of the
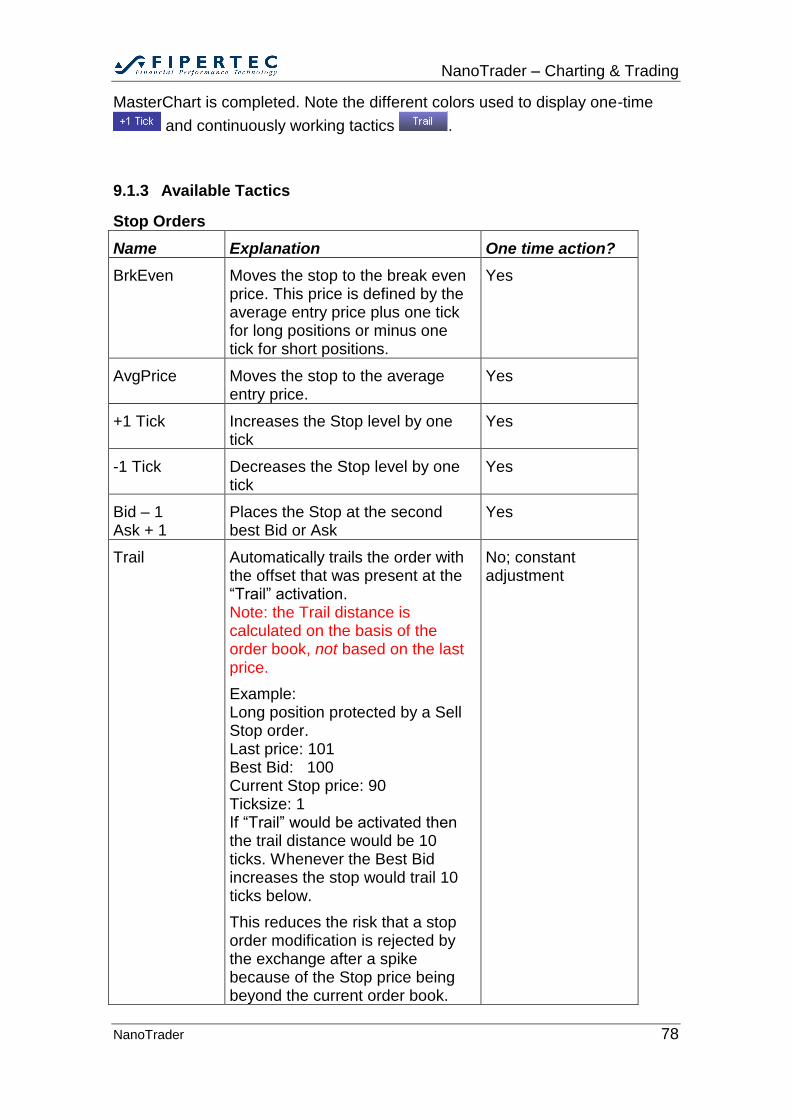
NanoTrader – Charting & Trading
NanoTrader 78
MasterChart is completed. Note the different colors used to display one-time
and continuously working tactics .
9.1.3 Available Tactics
Stop Orders
Name Explanation One time action?
BrkEven Moves the stop to the break even price. This price is defined by the average entry price plus one tick for long positions or minus one tick for short positions.
Yes
AvgPrice Moves the stop to the average entry price.
Yes
+1 Tick Increases the Stop level by one tick
Yes
-1 Tick Decreases the Stop level by one tick
Yes
Bid – 1 Ask + 1
Places the Stop at the second best Bid or Ask
Yes
Trail Automatically trails the order with the offset that was present at the “Trail” activation. Note: the Trail distance is calculated on the basis of the order book, not based on the last price.
Example: Long position protected by a Sell Stop order. Last price: 101 Best Bid: 100 Current Stop price: 90 Ticksize: 1 If “Trail” would be activated then the trail distance would be 10 ticks. Whenever the Best Bid increases the stop would trail 10 ticks below.
This reduces the risk that a stop order modification is rejected by the exchange after a spike because of the Stop price being beyond the current order book.
No; constant adjustment
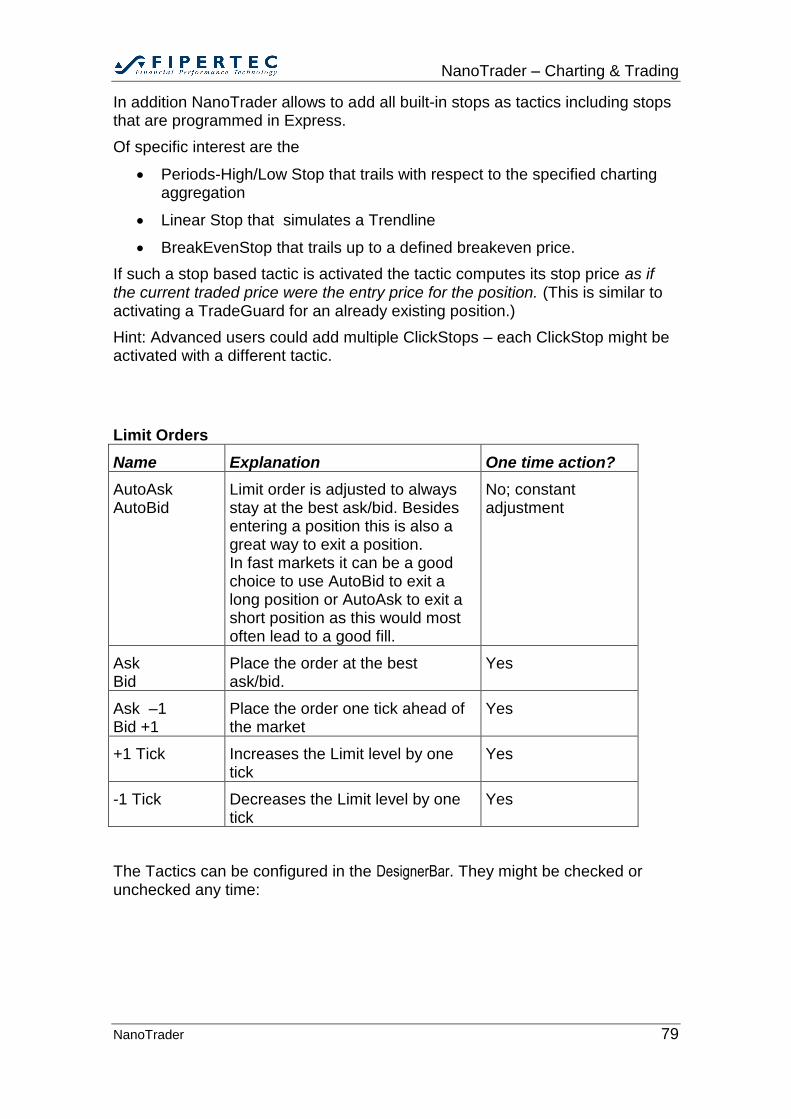
NanoTrader – Charting & Trading
NanoTrader 79
In addition NanoTrader allows to add all built-in stops as tactics including stops that are programmed in Express.
Of specific interest are the
Periods-High/Low Stop that trails with respect to the specified charting aggregation
Linear Stop that simulates a Trendline
BreakEvenStop that trails up to a defined breakeven price.
If such a stop based tactic is activated the tactic computes its stop price as if the current traded price were the entry price for the position. (This is similar to activating a TradeGuard for an already existing position.)
Hint: Advanced users could add multiple ClickStops – each ClickStop might be activated with a different tactic.
Limit Orders
Name Explanation One time action?
AutoAsk AutoBid
Limit order is adjusted to always stay at the best ask/bid. Besides entering a position this is also a great way to exit a position. In fast markets it can be a good choice to use AutoBid to exit a long position or AutoAsk to exit a short position as this would most often lead to a good fill.
No; constant adjustment
Ask Bid
Place the order at the best ask/bid.
Yes
Ask –1 Bid +1
Place the order one tick ahead of the market
Yes
+1 Tick Increases the Limit level by one tick
Yes
-1 Tick Decreases the Limit level by one tick
Yes
The Tactics can be configured in the DesignerBar. They might be checked or unchecked any time:
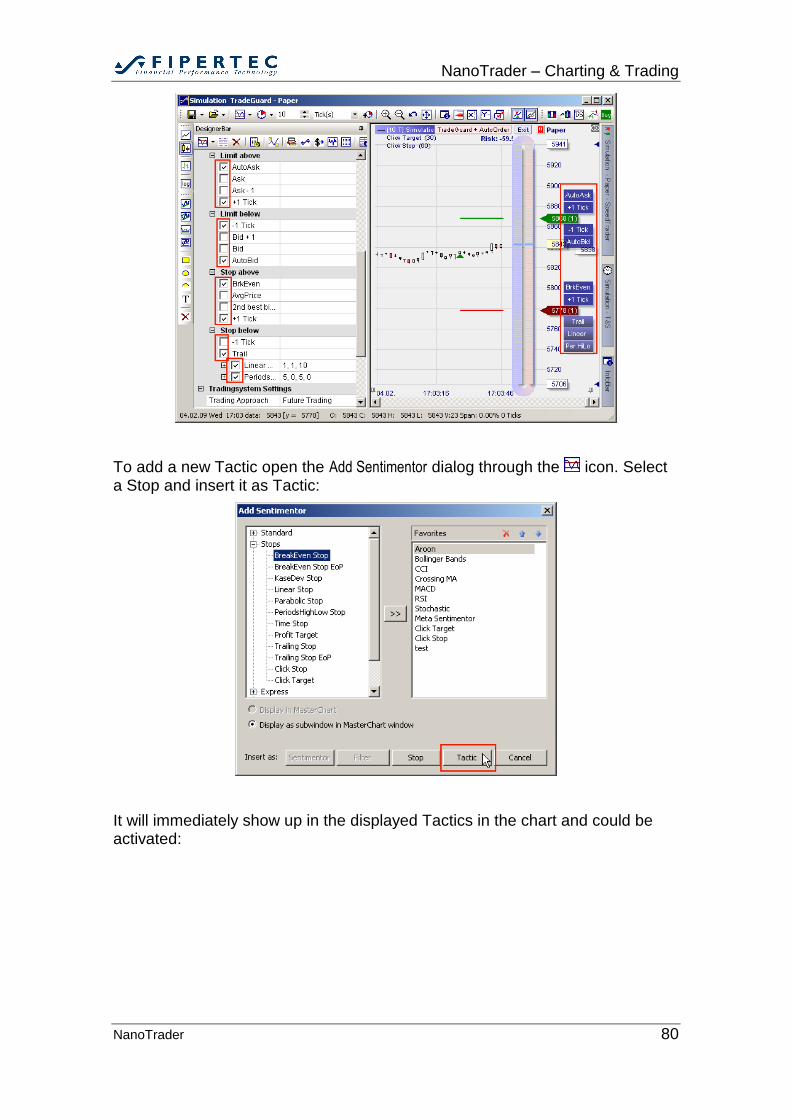
NanoTrader – Charting & Trading
NanoTrader 80
To add a new Tactic open the Add Sentimentor dialog through the icon. Select a Stop and insert it as Tactic:
It will immediately show up in the displayed Tactics in the chart and could be activated:
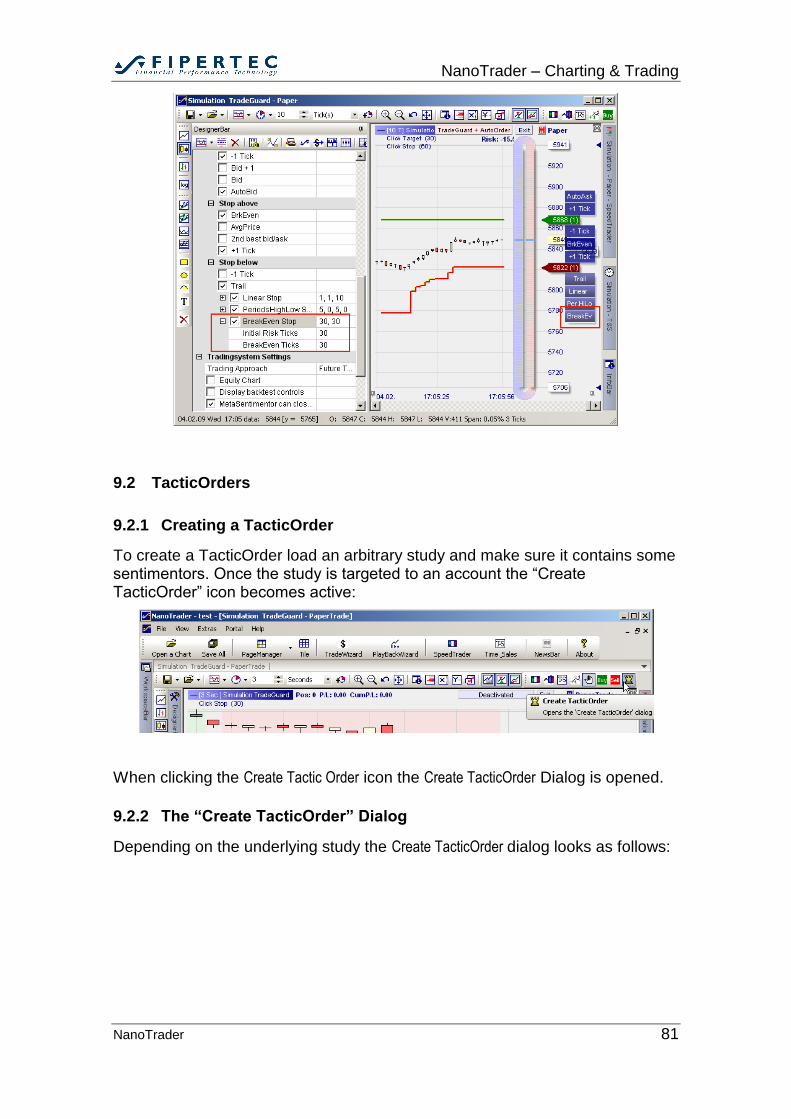
NanoTrader – Charting & Trading
NanoTrader 81
9.2 TacticOrders
9.2.1 Creating a TacticOrder
To create a TacticOrder load an arbitrary study and make sure it contains some sentimentors. Once the study is targeted to an account the “Create TacticOrder” icon becomes active:
When clicking the Create Tactic Order icon the Create TacticOrder Dialog is opened.
9.2.2 The “Create TacticOrder” Dialog
Depending on the underlying study the Create TacticOrder dialog looks as follows:
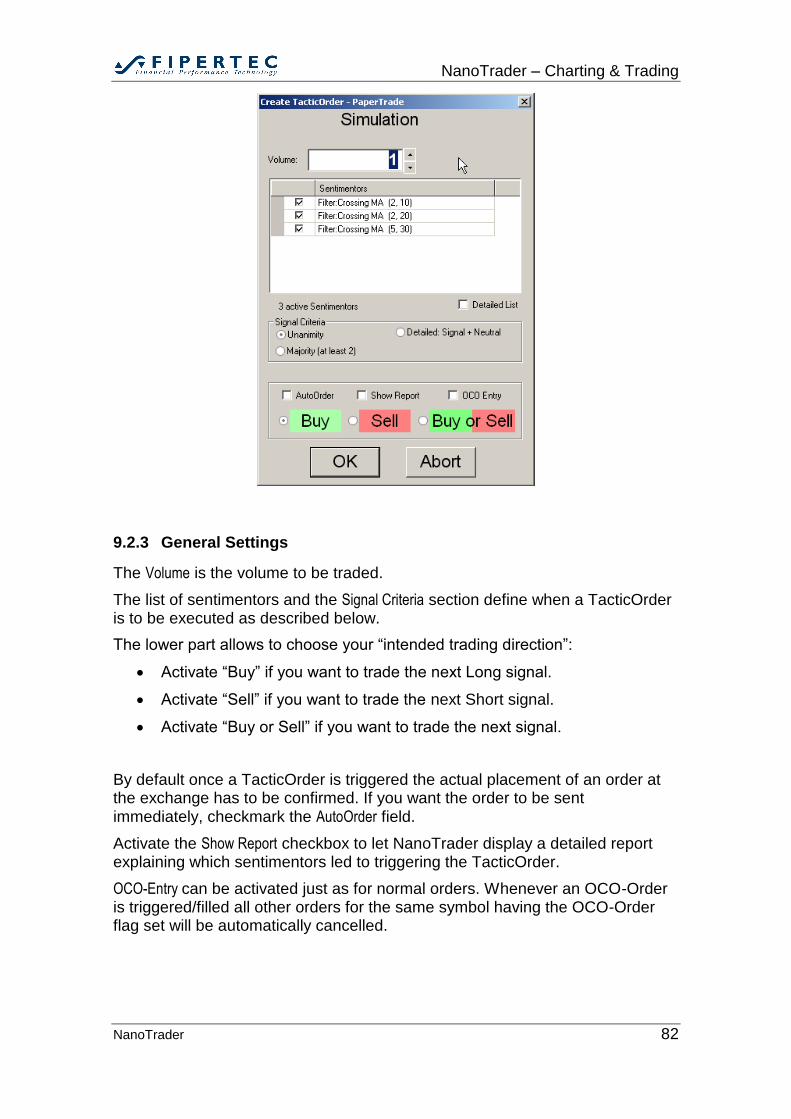
NanoTrader – Charting & Trading
NanoTrader 82
9.2.3 General Settings
The Volume is the volume to be traded.
The list of sentimentors and the Signal Criteria section define when a TacticOrder is to be executed as described below.
The lower part allows to choose your “intended trading direction”:
Activate “Buy” if you want to trade the next Long signal.
Activate “Sell” if you want to trade the next Short signal.
Activate “Buy or Sell” if you want to trade the next signal.
By default once a TacticOrder is triggered the actual placement of an order at the exchange has to be confirmed. If you want the order to be sent immediately, checkmark the AutoOrder field.
Activate the Show Report checkbox to let NanoTrader display a detailed report explaining which sentimentors led to triggering the TacticOrder.
OCO-Entry can be activated just as for normal orders. Whenever an OCO-Order is triggered/filled all other orders for the same symbol having the OCO-Order flag set will be automatically cancelled.
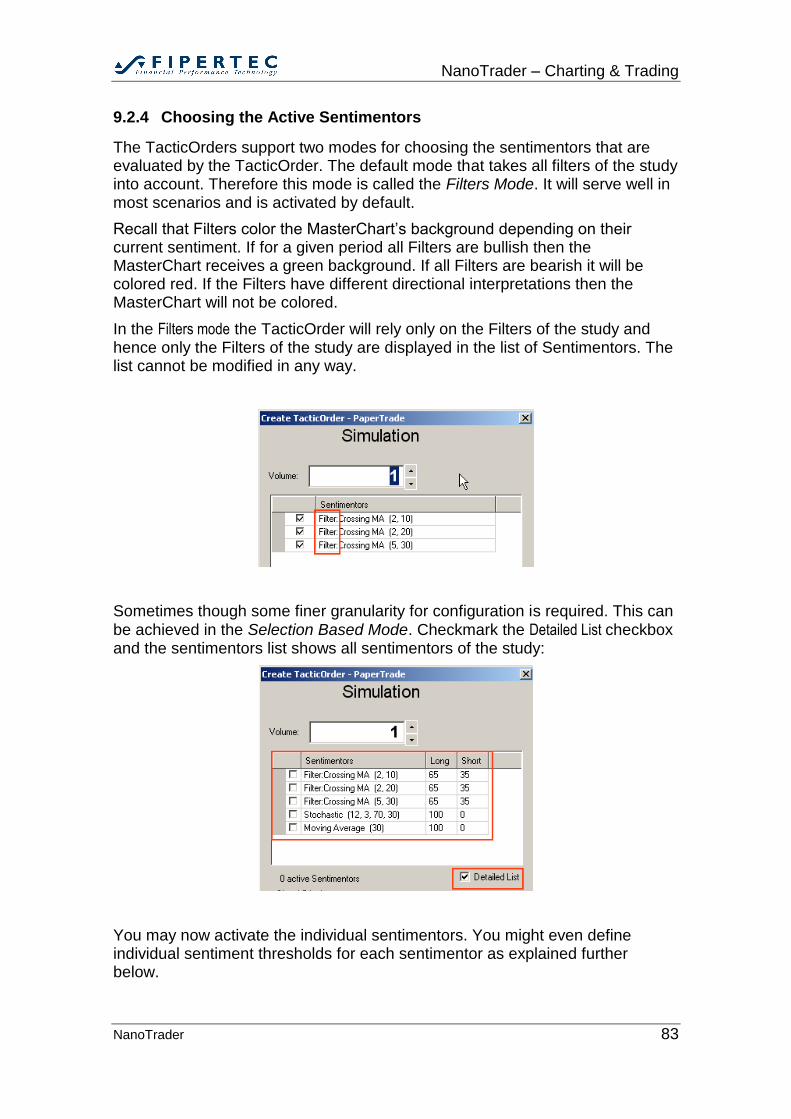
NanoTrader – Charting & Trading
NanoTrader 83
9.2.4 Choosing the Active Sentimentors
The TacticOrders support two modes for choosing the sentimentors that are evaluated by the TacticOrder. The default mode that takes all filters of the study into account. Therefore this mode is called the Filters Mode. It will serve well in most scenarios and is activated by default.
Recall that Filters color the MasterChart’s background depending on their current sentiment. If for a given period all Filters are bullish then the MasterChart receives a green background. If all Filters are bearish it will be colored red. If the Filters have different directional interpretations then the MasterChart will not be colored.
In the Filters mode the TacticOrder will rely only on the Filters of the study and hence only the Filters of the study are displayed in the list of Sentimentors. The list cannot be modified in any way.
Sometimes though some finer granularity for configuration is required. This can be achieved in the Selection Based Mode. Checkmark the Detailed List checkbox and the sentimentors list shows all sentimentors of the study:
You may now activate the individual sentimentors. You might even define individual sentiment thresholds for each sentimentor as explained further below.
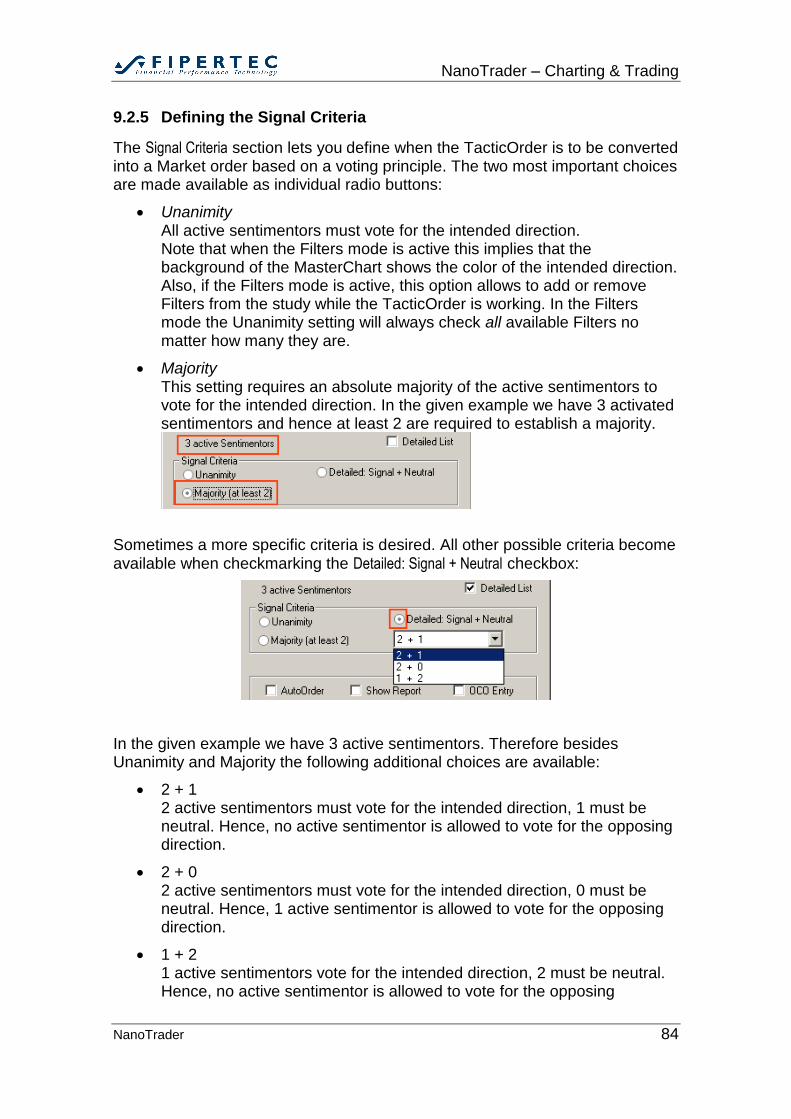
NanoTrader – Charting & Trading
NanoTrader 84
9.2.5 Defining the Signal Criteria
The Signal Criteria section lets you define when the TacticOrder is to be converted into a Market order based on a voting principle. The two most important choices are made available as individual radio buttons:
Unanimity All active sentimentors must vote for the intended direction. Note that when the Filters mode is active this implies that the background of the MasterChart shows the color of the intended direction. Also, if the Filters mode is active, this option allows to add or remove Filters from the study while the TacticOrder is working. In the Filters mode the Unanimity setting will always check all available Filters no matter how many they are.
Majority This setting requires an absolute majority of the active sentimentors to vote for the intended direction. In the given example we have 3 activated sentimentors and hence at least 2 are required to establish a majority.
Sometimes a more specific criteria is desired. All other possible criteria become available when checkmarking the Detailed: Signal + Neutral checkbox:
In the given example we have 3 active sentimentors. Therefore besides Unanimity and Majority the following additional choices are available:
2 + 1 2 active sentimentors must vote for the intended direction, 1 must be neutral. Hence, no active sentimentor is allowed to vote for the opposing direction.
2 + 0 2 active sentimentors must vote for the intended direction, 0 must be neutral. Hence, 1 active sentimentor is allowed to vote for the opposing direction.
1 + 2 1 active sentimentors vote for the intended direction, 2 must be neutral. Hence, no active sentimentor is allowed to vote for the opposing
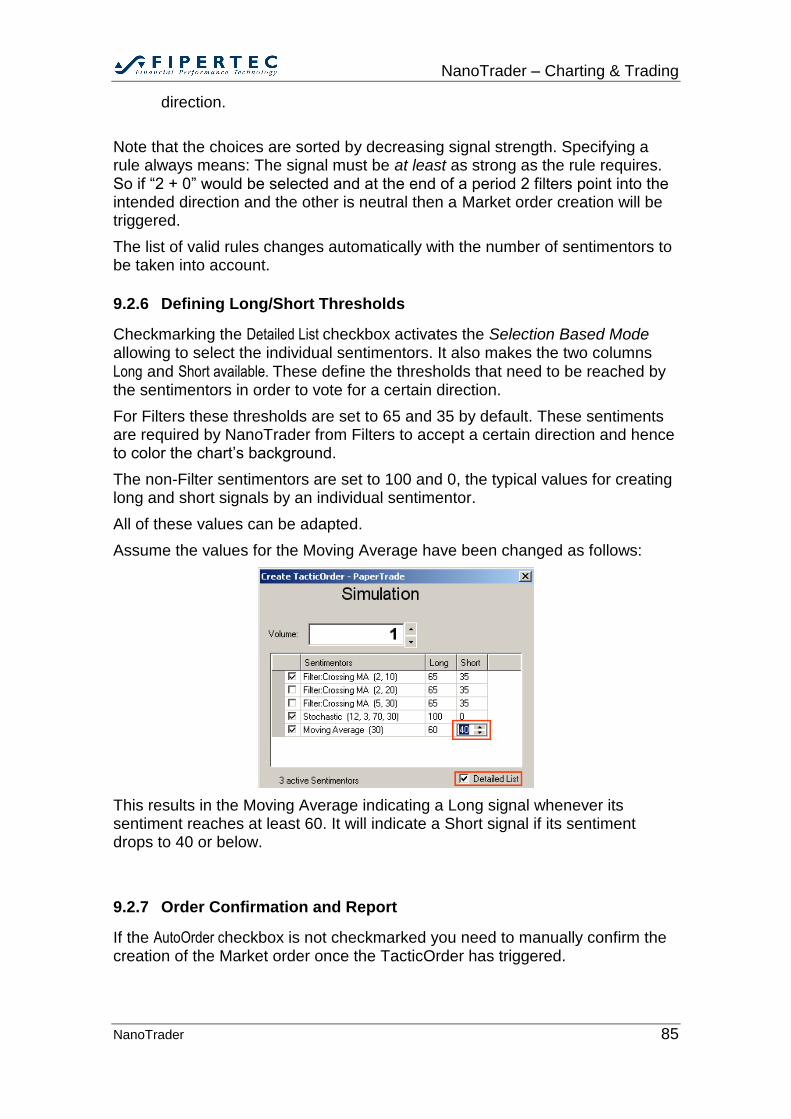
NanoTrader – Charting & Trading
NanoTrader 85
direction.
Note that the choices are sorted by decreasing signal strength. Specifying a rule always means: The signal must be at least as strong as the rule requires. So if “2 + 0” would be selected and at the end of a period 2 filters point into the intended direction and the other is neutral then a Market order creation will be triggered.
The list of valid rules changes automatically with the number of sentimentors to be taken into account.
9.2.6 Defining Long/Short Thresholds
Checkmarking the Detailed List checkbox activates the Selection Based Mode allowing to select the individual sentimentors. It also makes the two columns
Long and Short available. These define the thresholds that need to be reached by the sentimentors in order to vote for a certain direction.
For Filters these thresholds are set to 65 and 35 by default. These sentiments are required by NanoTrader from Filters to accept a certain direction and hence to color the chart’s background.
The non-Filter sentimentors are set to 100 and 0, the typical values for creating long and short signals by an individual sentimentor.
All of these values can be adapted.
Assume the values for the Moving Average have been changed as follows:
This results in the Moving Average indicating a Long signal whenever its sentiment reaches at least 60. It will indicate a Short signal if its sentiment drops to 40 or below.
9.2.7 Order Confirmation and Report
If the AutoOrder checkbox is not checkmarked you need to manually confirm the creation of the Market order once the TacticOrder has triggered.
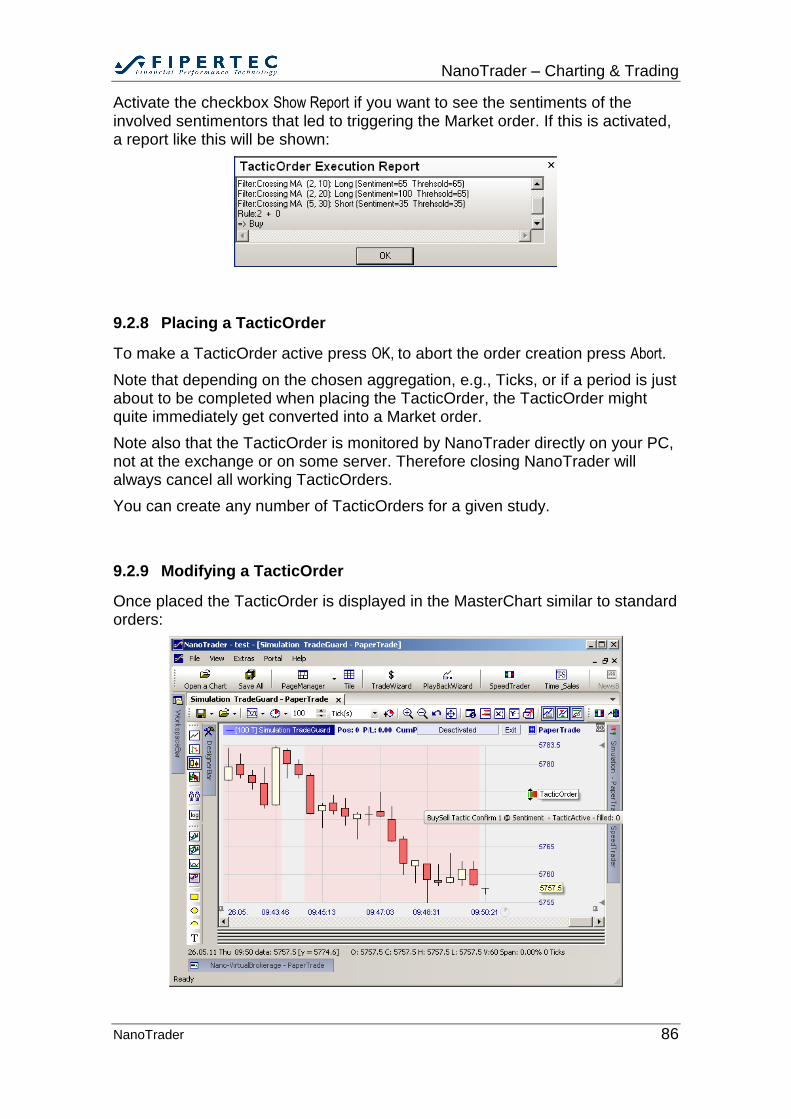
NanoTrader – Charting & Trading
NanoTrader 86
Activate the checkbox Show Report if you want to see the sentiments of the involved sentimentors that led to triggering the Market order. If this is activated, a report like this will be shown:
9.2.8 Placing a TacticOrder
To make a TacticOrder active press OK, to abort the order creation press Abort.
Note that depending on the chosen aggregation, e.g., Ticks, or if a period is just about to be completed when placing the TacticOrder, the TacticOrder might quite immediately get converted into a Market order.
Note also that the TacticOrder is monitored by NanoTrader directly on your PC, not at the exchange or on some server. Therefore closing NanoTrader will always cancel all working TacticOrders.
You can create any number of TacticOrders for a given study.
9.2.9 Modifying a TacticOrder
Once placed the TacticOrder is displayed in the MasterChart similar to standard orders:
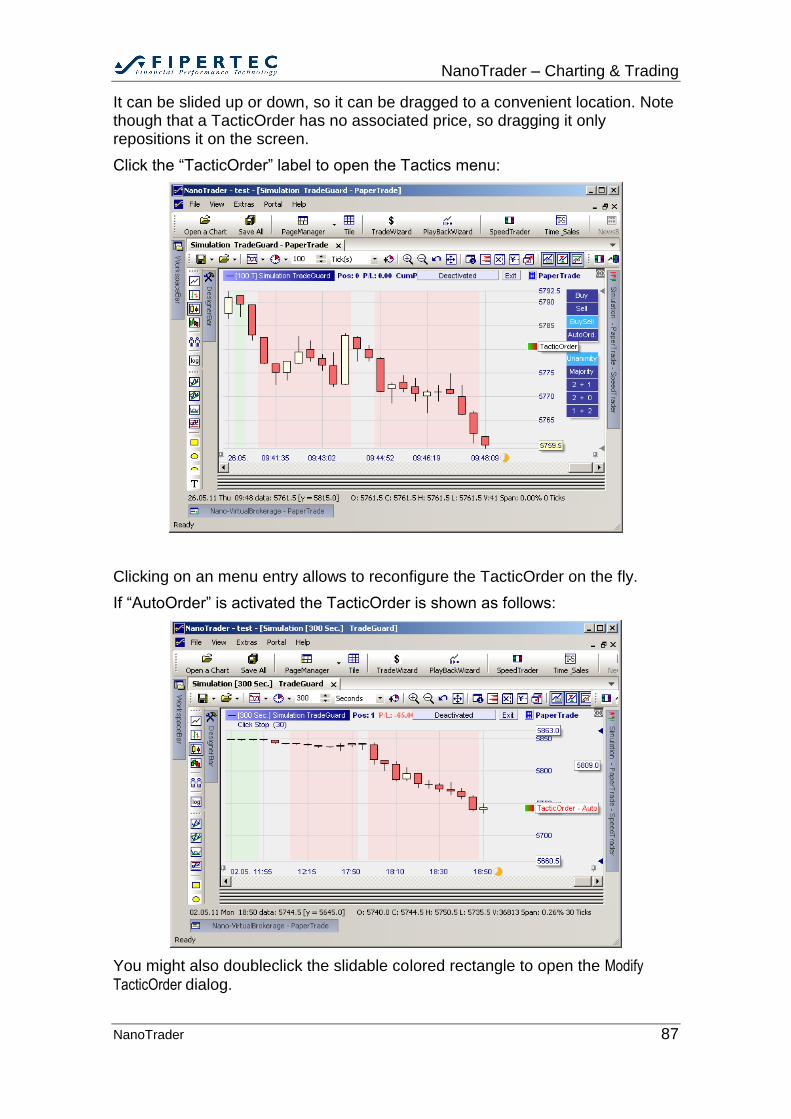
NanoTrader – Charting & Trading
NanoTrader 87
It can be slided up or down, so it can be dragged to a convenient location. Note though that a TacticOrder has no associated price, so dragging it only repositions it on the screen.
Click the “TacticOrder” label to open the Tactics menu:
Clicking on an menu entry allows to reconfigure the TacticOrder on the fly.
If “AutoOrder” is activated the TacticOrder is shown as follows:
You might also doubleclick the slidable colored rectangle to open the Modify
TacticOrder dialog.
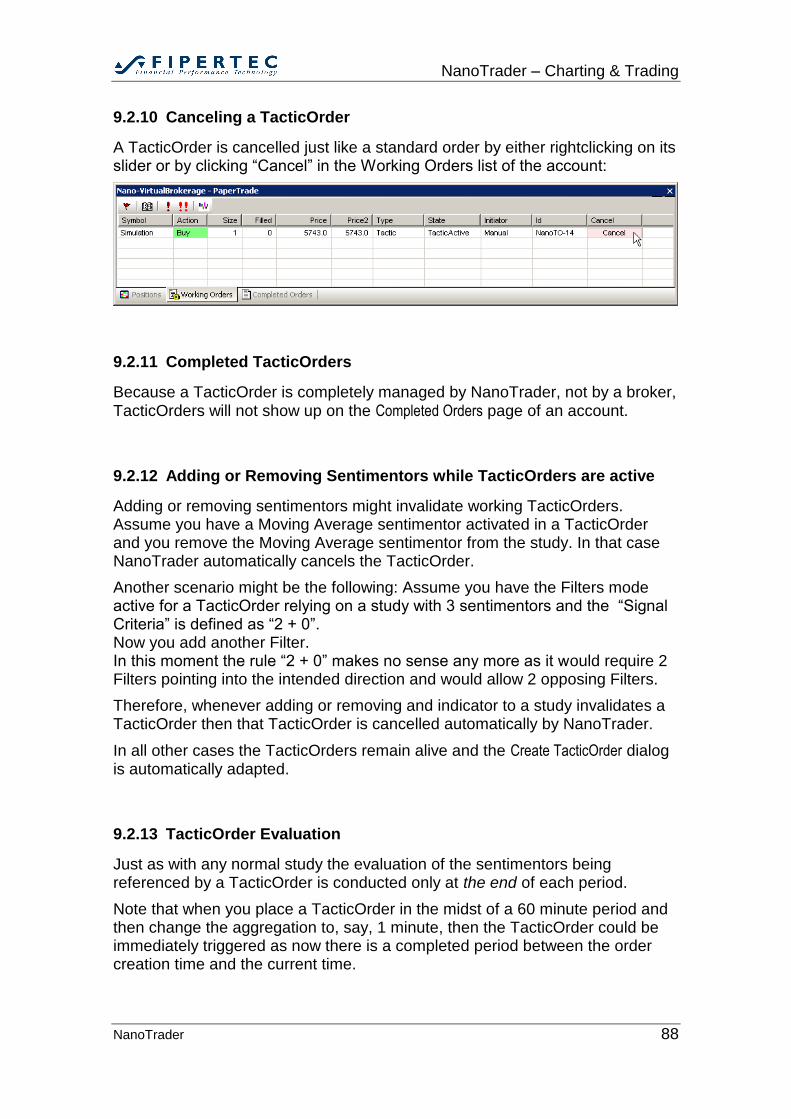
NanoTrader – Charting & Trading
NanoTrader 88
9.2.10 Canceling a TacticOrder
A TacticOrder is cancelled just like a standard order by either rightclicking on its slider or by clicking “Cancel” in the Working Orders list of the account:
9.2.11 Completed TacticOrders
Because a TacticOrder is completely managed by NanoTrader, not by a broker, TacticOrders will not show up on the Completed Orders page of an account.
9.2.12 Adding or Removing Sentimentors while TacticOrders are active
Adding or removing sentimentors might invalidate working TacticOrders. Assume you have a Moving Average sentimentor activated in a TacticOrder and you remove the Moving Average sentimentor from the study. In that case NanoTrader automatically cancels the TacticOrder.
Another scenario might be the following: Assume you have the Filters mode active for a TacticOrder relying on a study with 3 sentimentors and the “Signal Criteria” is defined as “2 + 0”. Now you add another Filter. In this moment the rule “2 + 0” makes no sense any more as it would require 2 Filters pointing into the intended direction and would allow 2 opposing Filters.
Therefore, whenever adding or removing and indicator to a study invalidates a TacticOrder then that TacticOrder is cancelled automatically by NanoTrader.
In all other cases the TacticOrders remain alive and the Create TacticOrder dialog is automatically adapted.
9.2.13 TacticOrder Evaluation
Just as with any normal study the evaluation of the sentimentors being referenced by a TacticOrder is conducted only at the end of each period.
Note that when you place a TacticOrder in the midst of a 60 minute period and then change the aggregation to, say, 1 minute, then the TacticOrder could be immediately triggered as now there is a completed period between the order creation time and the current time.
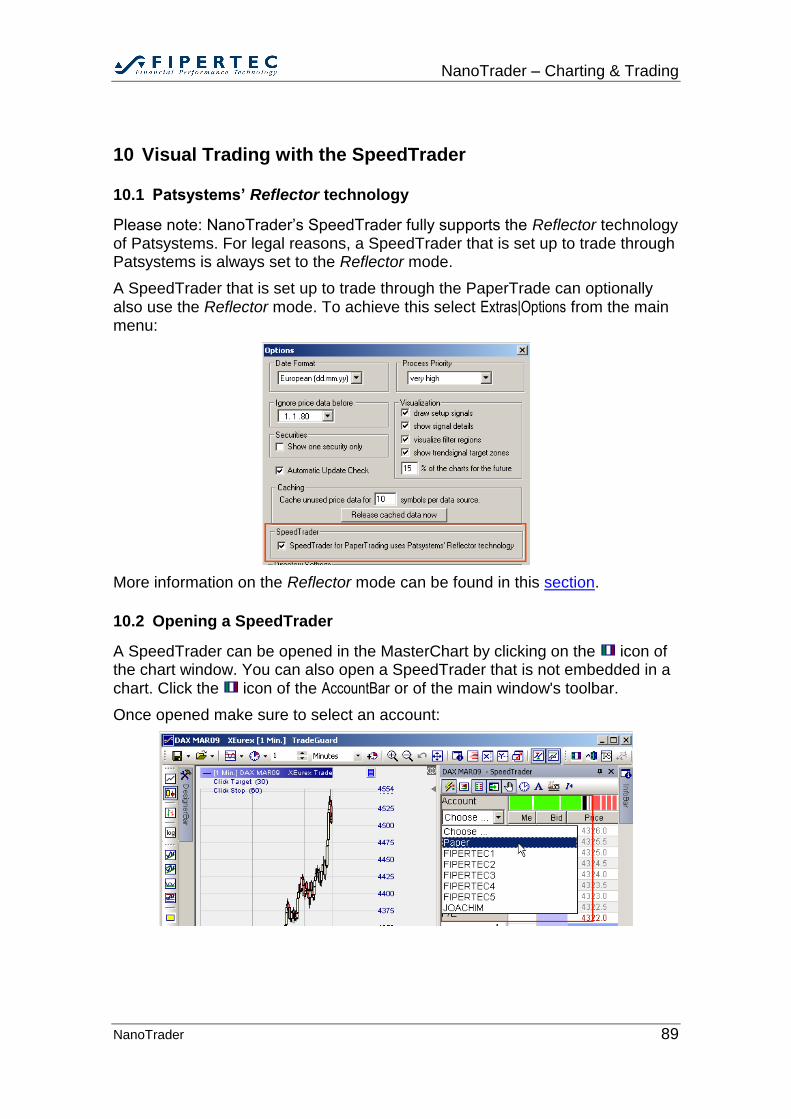
NanoTrader – Charting & Trading
NanoTrader 89
10 Visual Trading with the SpeedTrader
10.1 Patsystems’ Reflector technology
Please note: NanoTrader’s SpeedTrader fully supports the Reflector technology of Patsystems. For legal reasons, a SpeedTrader that is set up to trade through Patsystems is always set to the Reflector mode.
A SpeedTrader that is set up to trade through the PaperTrade can optionally also use the Reflector mode. To achieve this select Extras|Options from the main menu:
More information on the Reflector mode can be found in this section.
10.2 Opening a SpeedTrader
A SpeedTrader can be opened in the MasterChart by clicking on the icon of the chart window. You can also open a SpeedTrader that is not embedded in a chart. Click the icon of the AccountBar or of the main window's toolbar.
Once opened make sure to select an account:

NanoTrader – Charting & Trading
NanoTrader 90
If the Account field is not displayed click the icon in the SpeedTrader’s toolbar. This will open the so-called OrderPad containing the account selection box.
10.3 Information shown by the SpeedTrader
10.3.1 OrderPad
The left part of the SpeedTrader – denoted the OrderPad – shows information for
the currently assigned account
the color coded last traded price and last traded volume
the current position size in the assigned account
the corresponding open P/L
the average price paid to build the position
the order volume to be used when creating orders. By clicking on the position size, the order volume is set accordingly.
Moreover it shows buttons for deleting a subset or all working orders and to exit the complete position.
10.3.2 Price Table
The Volume column shows a histogram of the currently active best bids and asks.
The Me-columns show the trader’s buy or sell orders. An order is displayed in the form order size[current partial fill], e.g, 5[2]. In case price gaps are hidden the Me-columns will not be displayed.
The price column shows color coded trading prices:
A price with an available Ask is shown in red
A price with an available Bid is shown green
The last traded price shows a blue background
The average price for creating the current position show a green rectangle
Clicking on an any column heading will center the shown prices around the best bid/best ask spread.
In case an order is outside the displayed price range, the header of the Me columns show respective red arrows:
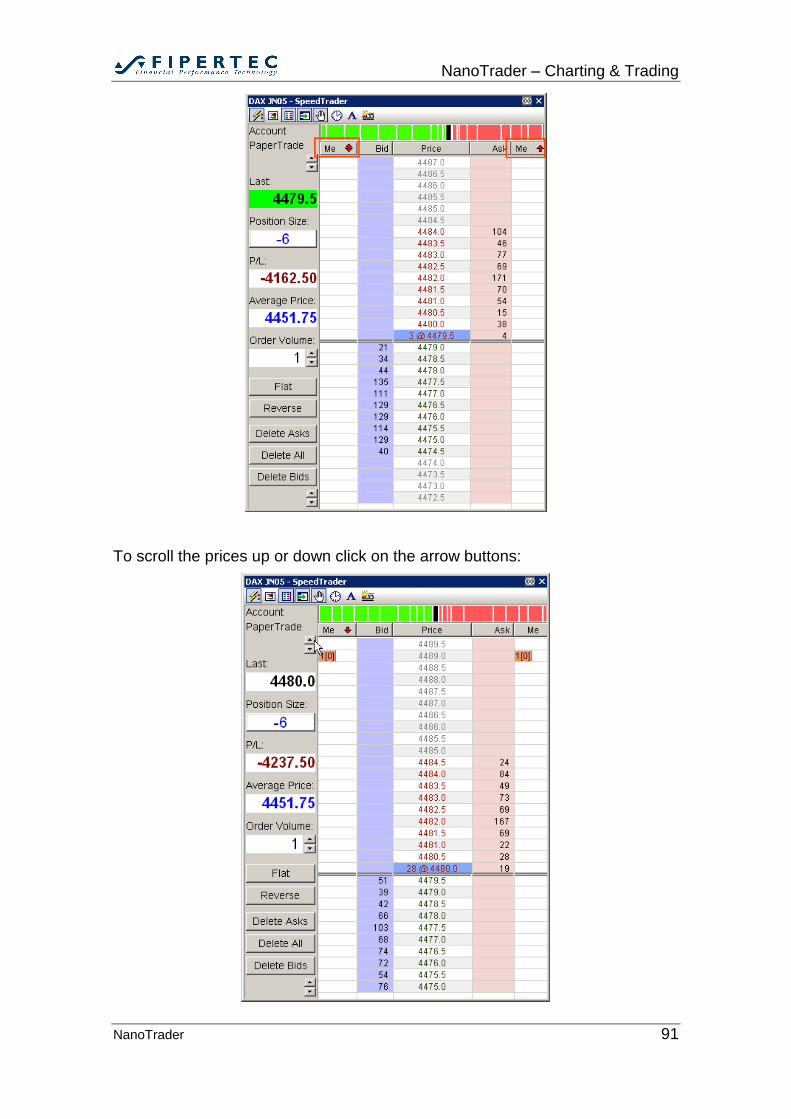
NanoTrader – Charting & Trading
NanoTrader 91
To scroll the prices up or down click on the arrow buttons:
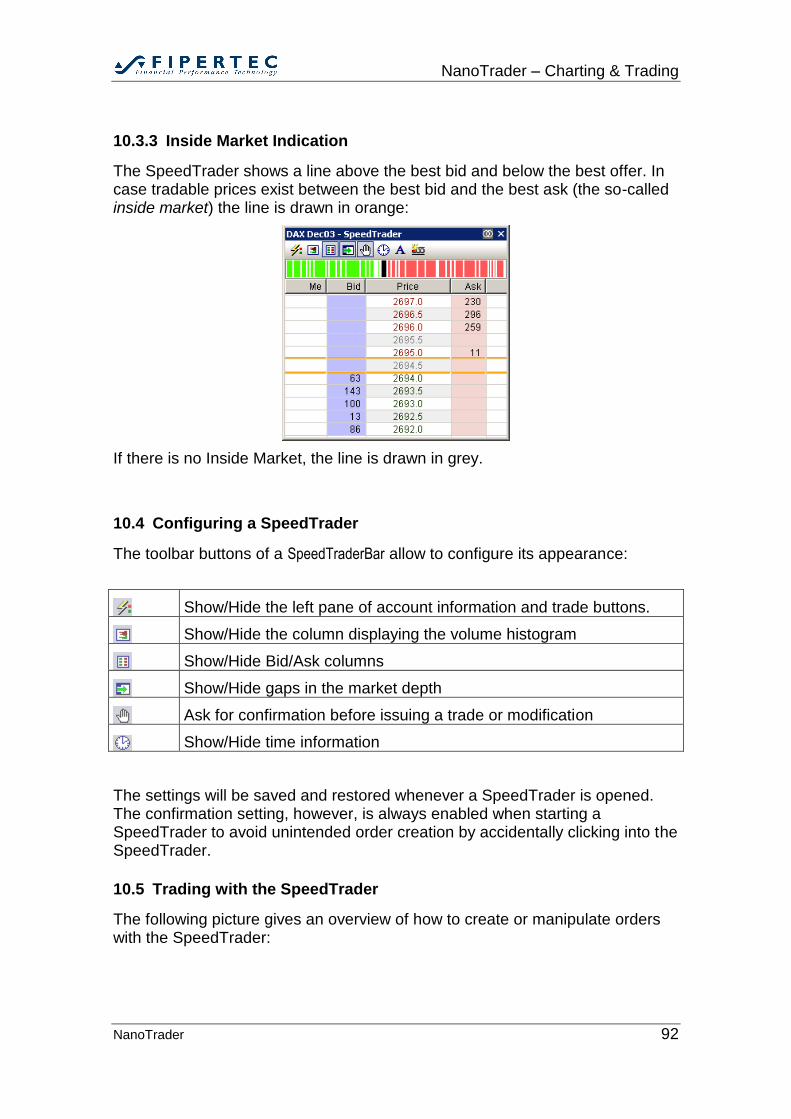
NanoTrader – Charting & Trading
NanoTrader 92
10.3.3 Inside Market Indication
The SpeedTrader shows a line above the best bid and below the best offer. In case tradable prices exist between the best bid and the best ask (the so-called inside market) the line is drawn in orange:
If there is no Inside Market, the line is drawn in grey.
10.4 Configuring a SpeedTrader
The toolbar buttons of a SpeedTraderBar allow to configure its appearance:
Show/Hide the left pane of account information and trade buttons.
Show/Hide the column displaying the volume histogram
Show/Hide Bid/Ask columns
Show/Hide gaps in the market depth
Ask for confirmation before issuing a trade or modification
Show/Hide time information
The settings will be saved and restored whenever a SpeedTrader is opened. The confirmation setting, however, is always enabled when starting a SpeedTrader to avoid unintended order creation by accidentally clicking into the SpeedTrader.
10.5 Trading with the SpeedTrader
The following picture gives an overview of how to create or manipulate orders with the SpeedTrader:
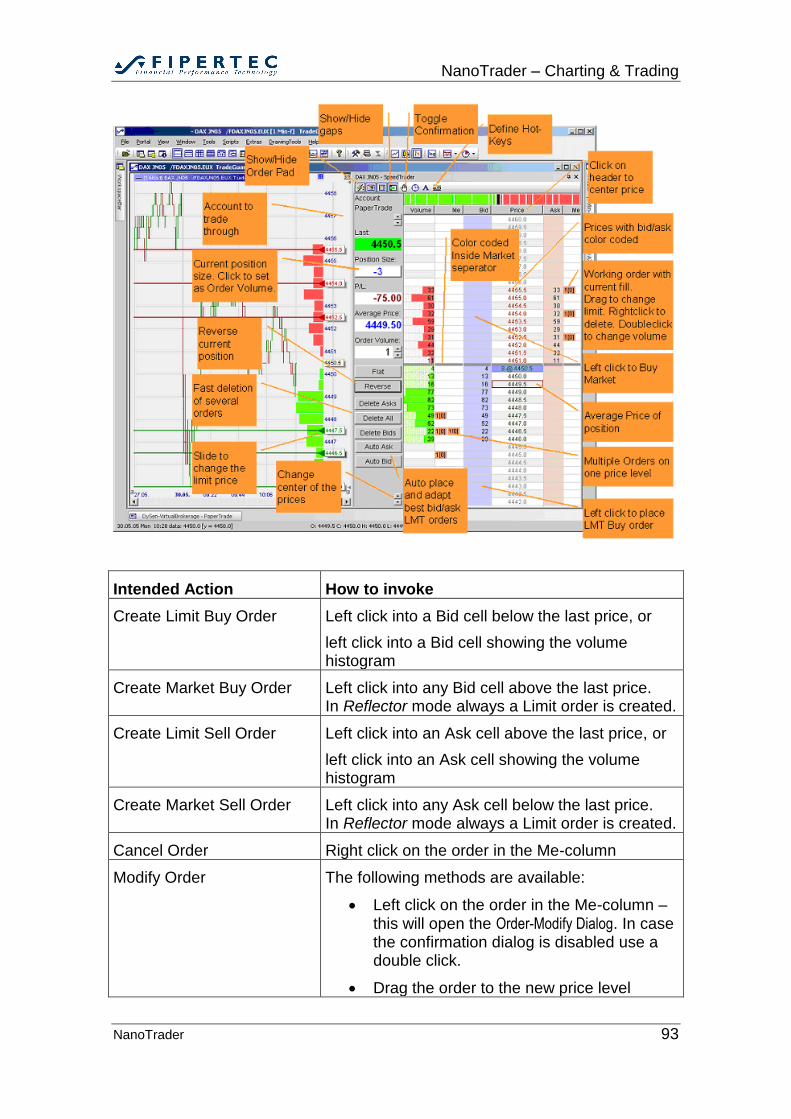
NanoTrader – Charting & Trading
NanoTrader 93
Intended Action How to invoke
Create Limit Buy Order Left click into a Bid cell below the last price, or
left click into a Bid cell showing the volume histogram
Create Market Buy Order Left click into any Bid cell above the last price. In Reflector mode always a Limit order is created.
Create Limit Sell Order Left click into an Ask cell above the last price, or
left click into an Ask cell showing the volume histogram
Create Market Sell Order Left click into any Ask cell below the last price. In Reflector mode always a Limit order is created.
Cancel Order Right click on the order in the Me-column
Modify Order The following methods are available:
Left click on the order in the Me-column – this will open the Order-Modify Dialog. In case the confirmation dialog is disabled use a double click.
Drag the order to the new price level
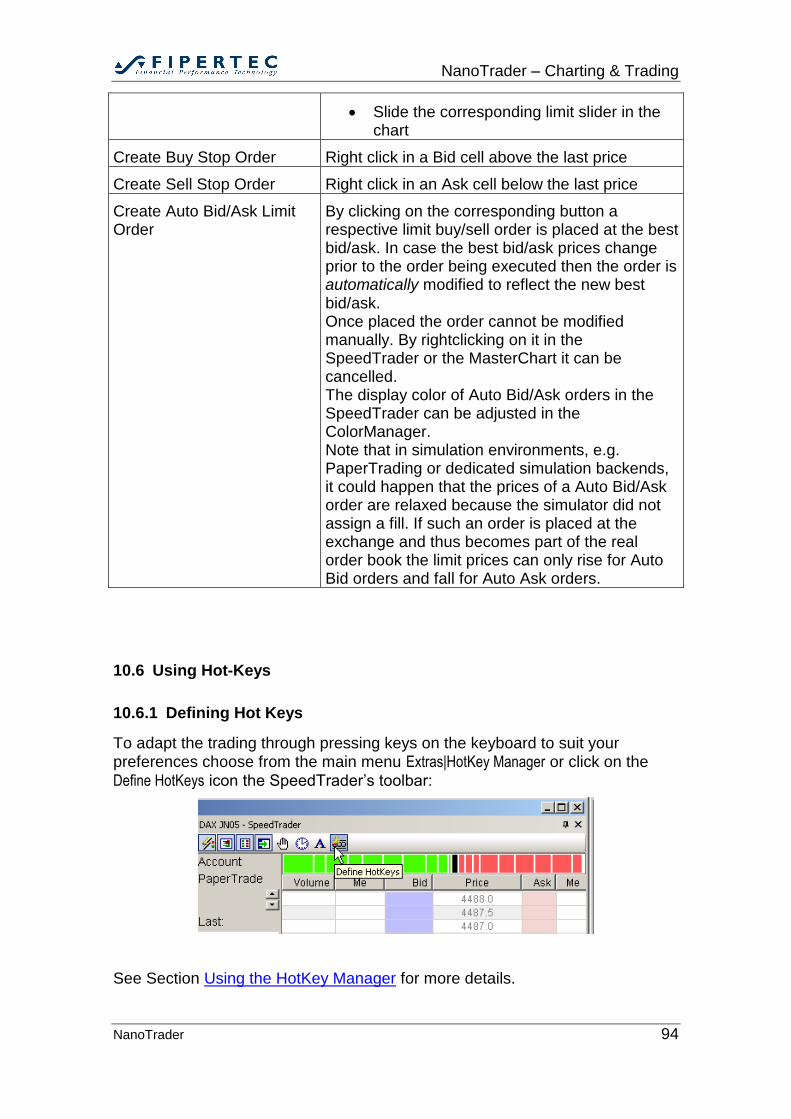
NanoTrader – Charting & Trading
NanoTrader 94
Slide the corresponding limit slider in the chart
Create Buy Stop Order Right click in a Bid cell above the last price
Create Sell Stop Order Right click in an Ask cell below the last price
Create Auto Bid/Ask Limit Order
By clicking on the corresponding button a respective limit buy/sell order is placed at the best bid/ask. In case the best bid/ask prices change prior to the order being executed then the order is automatically modified to reflect the new best bid/ask. Once placed the order cannot be modified manually. By rightclicking on it in the SpeedTrader or the MasterChart it can be cancelled. The display color of Auto Bid/Ask orders in the SpeedTrader can be adjusted in the ColorManager. Note that in simulation environments, e.g. PaperTrading or dedicated simulation backends, it could happen that the prices of a Auto Bid/Ask order are relaxed because the simulator did not assign a fill. If such an order is placed at the exchange and thus becomes part of the real order book the limit prices can only rise for Auto Bid orders and fall for Auto Ask orders.
10.6 Using Hot-Keys
10.6.1 Defining Hot Keys
To adapt the trading through pressing keys on the keyboard to suit your preferences choose from the main menu Extras|HotKey Manager or click on the
Define HotKeys icon the SpeedTrader’s toolbar:
See Section Using the HotKey Manager for more details.
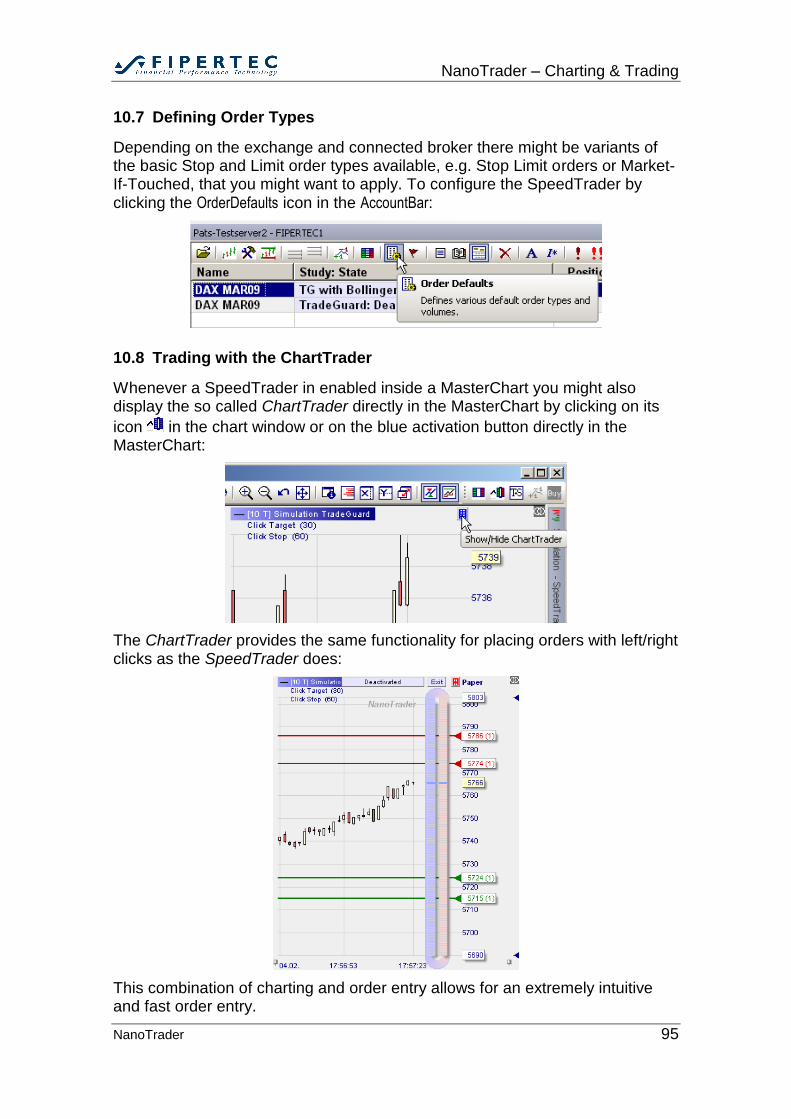
NanoTrader – Charting & Trading
NanoTrader 95
10.7 Defining Order Types
Depending on the exchange and connected broker there might be variants of the basic Stop and Limit order types available, e.g. Stop Limit orders or Market-If-Touched, that you might want to apply. To configure the SpeedTrader by clicking the OrderDefaults icon in the AccountBar:
10.8 Trading with the ChartTrader
Whenever a SpeedTrader in enabled inside a MasterChart you might also display the so called ChartTrader directly in the MasterChart by clicking on its
icon in the chart window or on the blue activation button directly in the MasterChart:
The ChartTrader provides the same functionality for placing orders with left/right clicks as the SpeedTrader does:
This combination of charting and order entry allows for an extremely intuitive and fast order entry.
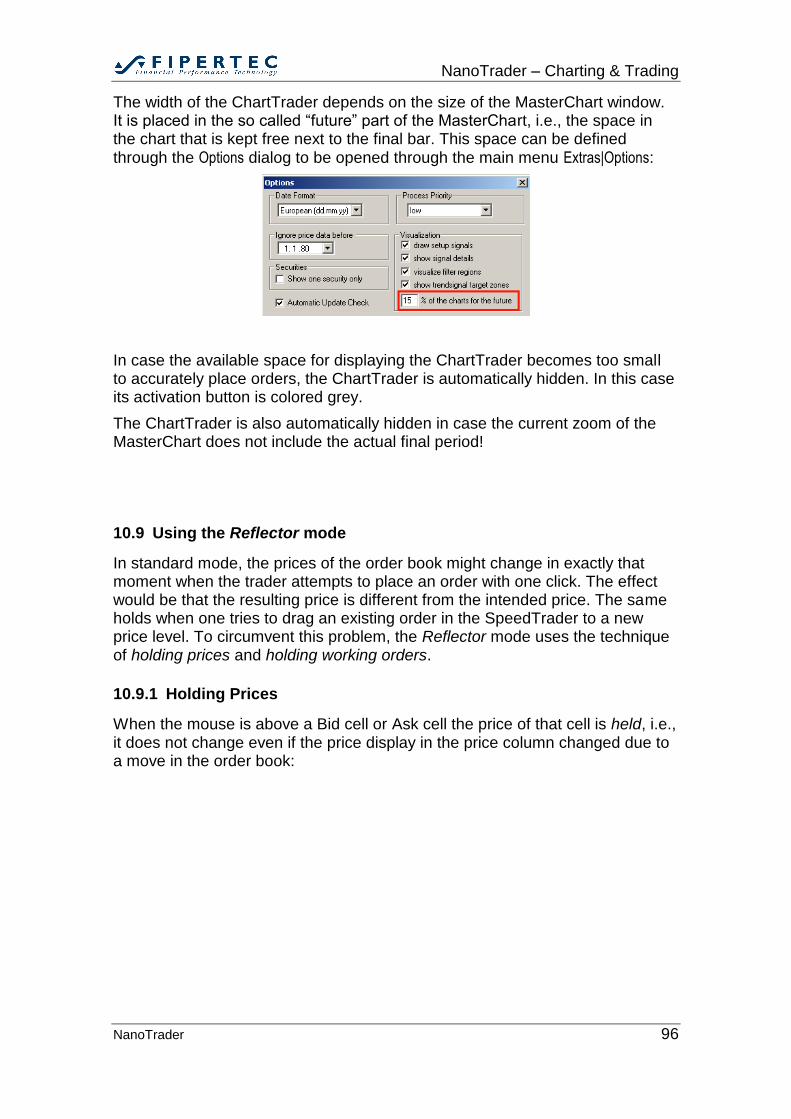
NanoTrader – Charting & Trading
NanoTrader 96
The width of the ChartTrader depends on the size of the MasterChart window. It is placed in the so called “future” part of the MasterChart, i.e., the space in the chart that is kept free next to the final bar. This space can be defined through the Options dialog to be opened through the main menu Extras|Options:
In case the available space for displaying the ChartTrader becomes too small to accurately place orders, the ChartTrader is automatically hidden. In this case its activation button is colored grey.
The ChartTrader is also automatically hidden in case the current zoom of the MasterChart does not include the actual final period!
10.9 Using the Reflector mode
In standard mode, the prices of the order book might change in exactly that moment when the trader attempts to place an order with one click. The effect would be that the resulting price is different from the intended price. The same holds when one tries to drag an existing order in the SpeedTrader to a new price level. To circumvent this problem, the Reflector mode uses the technique of holding prices and holding working orders.
10.9.1 Holding Prices
When the mouse is above a Bid cell or Ask cell the price of that cell is held, i.e., it does not change even if the price display in the price column changed due to a move in the order book:
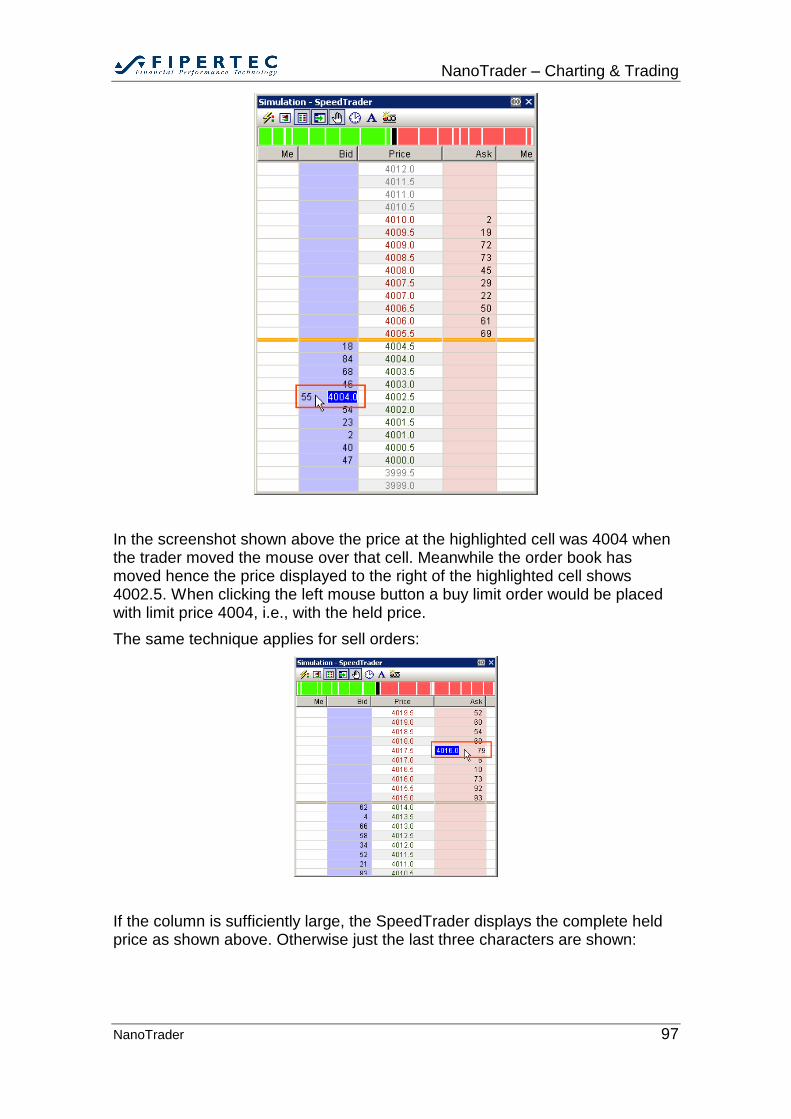
NanoTrader – Charting & Trading
NanoTrader 97
In the screenshot shown above the price at the highlighted cell was 4004 when the trader moved the mouse over that cell. Meanwhile the order book has moved hence the price displayed to the right of the highlighted cell shows 4002.5. When clicking the left mouse button a buy limit order would be placed with limit price 4004, i.e., with the held price.
The same technique applies for sell orders:
If the column is sufficiently large, the SpeedTrader displays the complete held price as shown above. Otherwise just the last three characters are shown:
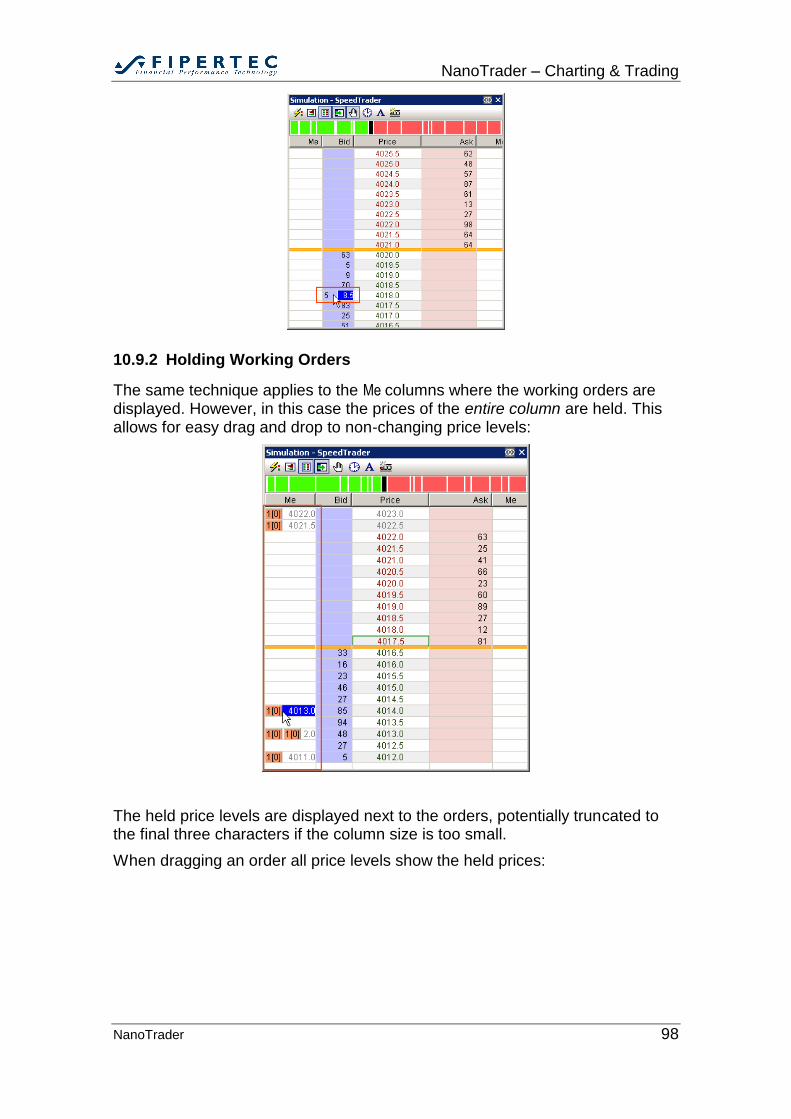
NanoTrader – Charting & Trading
NanoTrader 98
10.9.2 Holding Working Orders
The same technique applies to the Me columns where the working orders are displayed. However, in this case the prices of the entire column are held. This allows for easy drag and drop to non-changing price levels:
The held price levels are displayed next to the orders, potentially truncated to the final three characters if the column size is too small.
When dragging an order all price levels show the held prices:
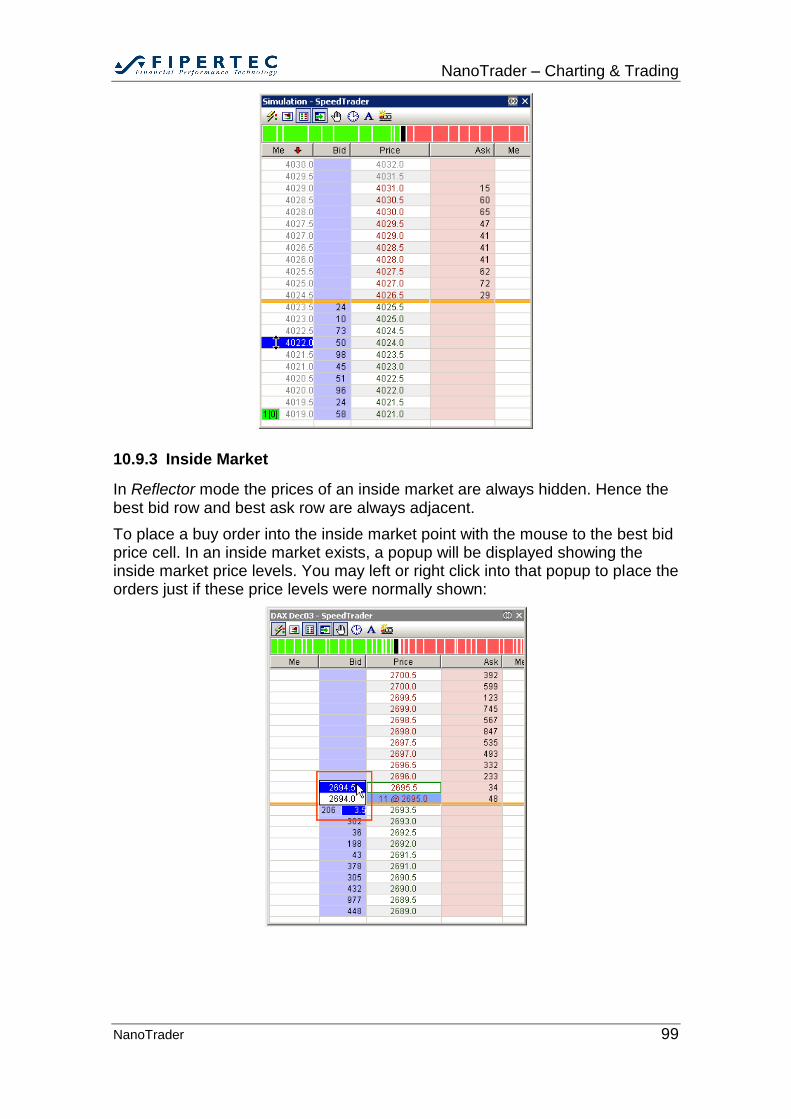
NanoTrader – Charting & Trading
NanoTrader 99
10.9.3 Inside Market
In Reflector mode the prices of an inside market are always hidden. Hence the best bid row and best ask row are always adjacent.
To place a buy order into the inside market point with the mouse to the best bid price cell. In an inside market exists, a popup will be displayed showing the inside market price levels. You may left or right click into that popup to place the orders just if these price levels were normally shown:
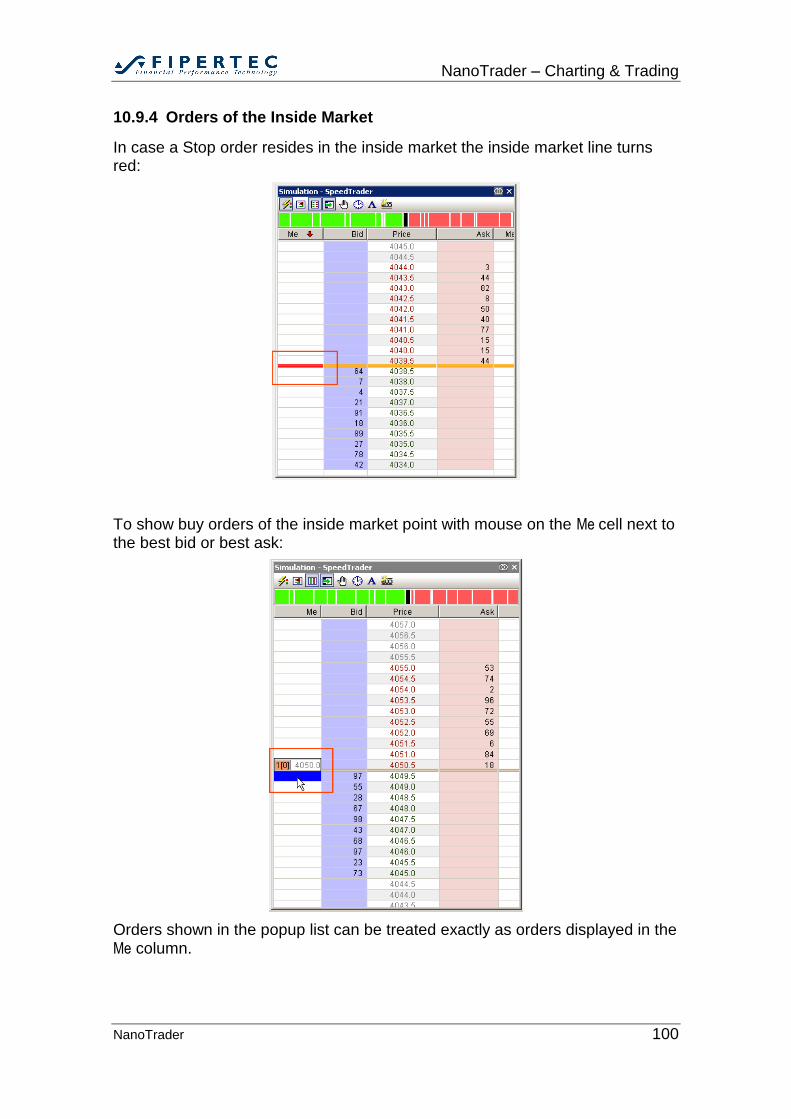
NanoTrader – Charting & Trading
NanoTrader 100
10.9.4 Orders of the Inside Market
In case a Stop order resides in the inside market the inside market line turns red:
To show buy orders of the inside market point with mouse on the Me cell next to the best bid or best ask:
Orders shown in the popup list can be treated exactly as orders displayed in the Me column.
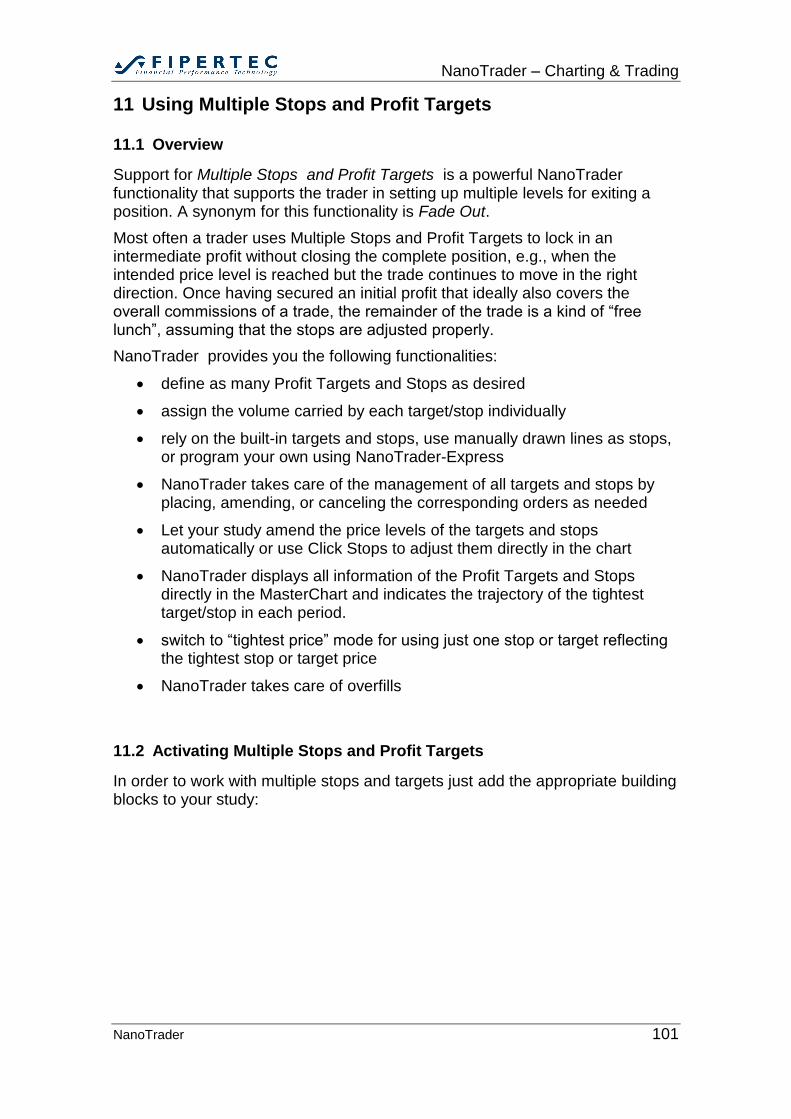
NanoTrader – Charting & Trading
NanoTrader 101
11 Using Multiple Stops and Profit Targets
11.1 Overview
Support for Multiple Stops and Profit Targets is a powerful NanoTrader functionality that supports the trader in setting up multiple levels for exiting a position. A synonym for this functionality is Fade Out.
Most often a trader uses Multiple Stops and Profit Targets to lock in an intermediate profit without closing the complete position, e.g., when the intended price level is reached but the trade continues to move in the right direction. Once having secured an initial profit that ideally also covers the overall commissions of a trade, the remainder of the trade is a kind of “free lunch”, assuming that the stops are adjusted properly.
NanoTrader provides you the following functionalities:
define as many Profit Targets and Stops as desired
assign the volume carried by each target/stop individually
rely on the built-in targets and stops, use manually drawn lines as stops, or program your own using NanoTrader-Express
NanoTrader takes care of the management of all targets and stops by placing, amending, or canceling the corresponding orders as needed
Let your study amend the price levels of the targets and stops automatically or use Click Stops to adjust them directly in the chart
NanoTrader displays all information of the Profit Targets and Stops directly in the MasterChart and indicates the trajectory of the tightest target/stop in each period.
switch to “tightest price” mode for using just one stop or target reflecting the tightest stop or target price
NanoTrader takes care of overfills
11.2 Activating Multiple Stops and Profit Targets
In order to work with multiple stops and targets just add the appropriate building blocks to your study:
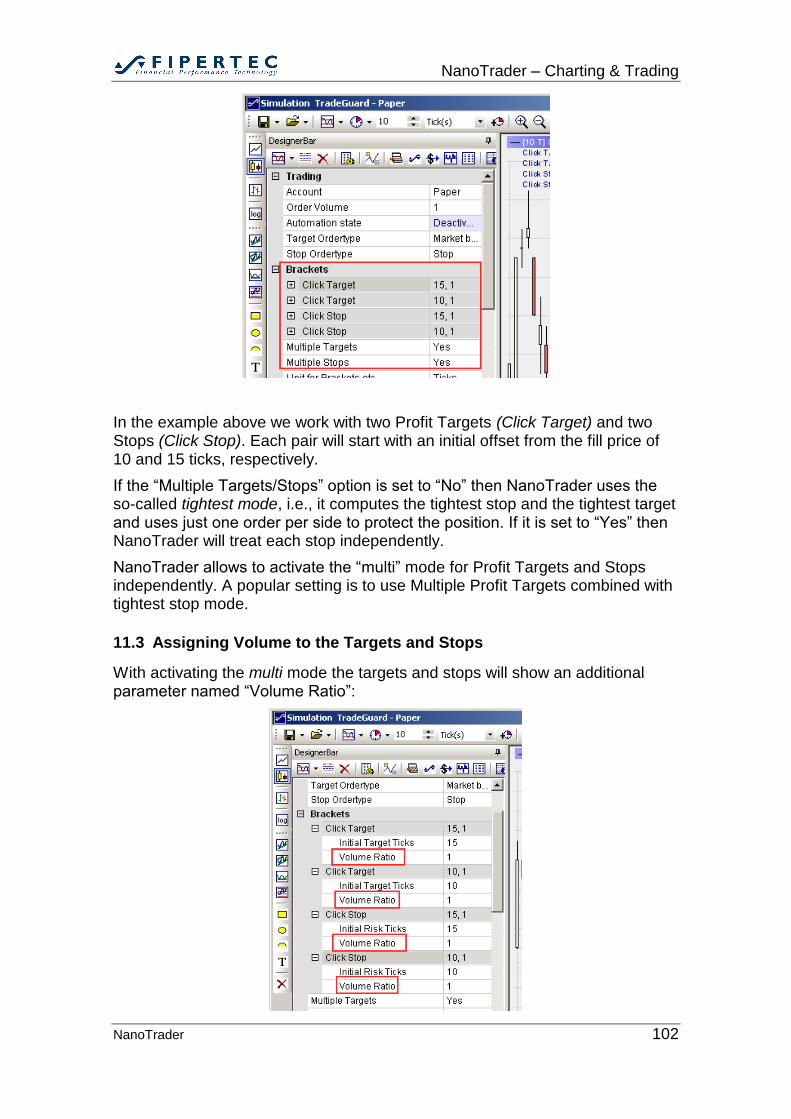
NanoTrader – Charting & Trading
NanoTrader 102
In the example above we work with two Profit Targets (Click Target) and two Stops (Click Stop). Each pair will start with an initial offset from the fill price of 10 and 15 ticks, respectively.
If the “Multiple Targets/Stops” option is set to “No” then NanoTrader uses the so-called tightest mode, i.e., it computes the tightest stop and the tightest target and uses just one order per side to protect the position. If it is set to “Yes” then NanoTrader will treat each stop independently.
NanoTrader allows to activate the “multi” mode for Profit Targets and Stops independently. A popular setting is to use Multiple Profit Targets combined with tightest stop mode.
11.3 Assigning Volume to the Targets and Stops
With activating the multi mode the targets and stops will show an additional parameter named “Volume Ratio”:
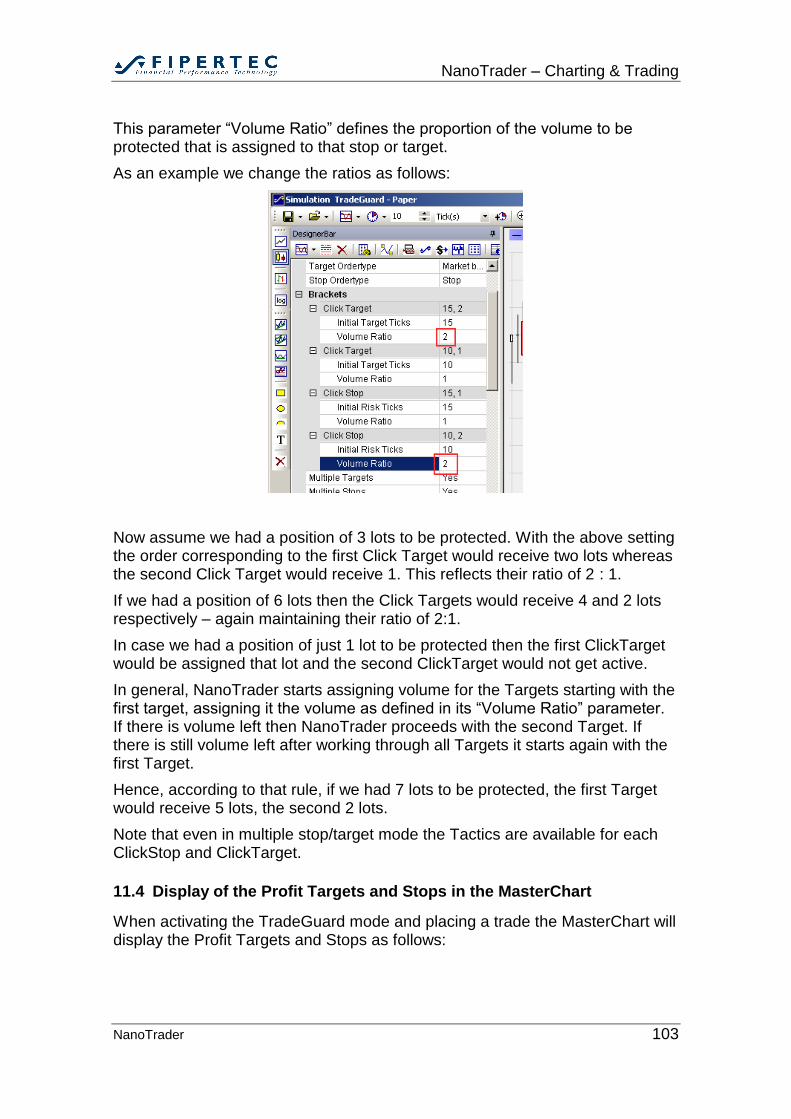
NanoTrader – Charting & Trading
NanoTrader 103
This parameter “Volume Ratio” defines the proportion of the volume to be protected that is assigned to that stop or target.
As an example we change the ratios as follows:
Now assume we had a position of 3 lots to be protected. With the above setting the order corresponding to the first Click Target would receive two lots whereas the second Click Target would receive 1. This reflects their ratio of 2 : 1.
If we had a position of 6 lots then the Click Targets would receive 4 and 2 lots respectively – again maintaining their ratio of 2:1.
In case we had a position of just 1 lot to be protected then the first ClickTarget would be assigned that lot and the second ClickTarget would not get active.
In general, NanoTrader starts assigning volume for the Targets starting with the first target, assigning it the volume as defined in its “Volume Ratio” parameter. If there is volume left then NanoTrader proceeds with the second Target. If there is still volume left after working through all Targets it starts again with the first Target.
Hence, according to that rule, if we had 7 lots to be protected, the first Target would receive 5 lots, the second 2 lots.
Note that even in multiple stop/target mode the Tactics are available for each ClickStop and ClickTarget.
11.4 Display of the Profit Targets and Stops in the MasterChart
When activating the TradeGuard mode and placing a trade the MasterChart will display the Profit Targets and Stops as follows:
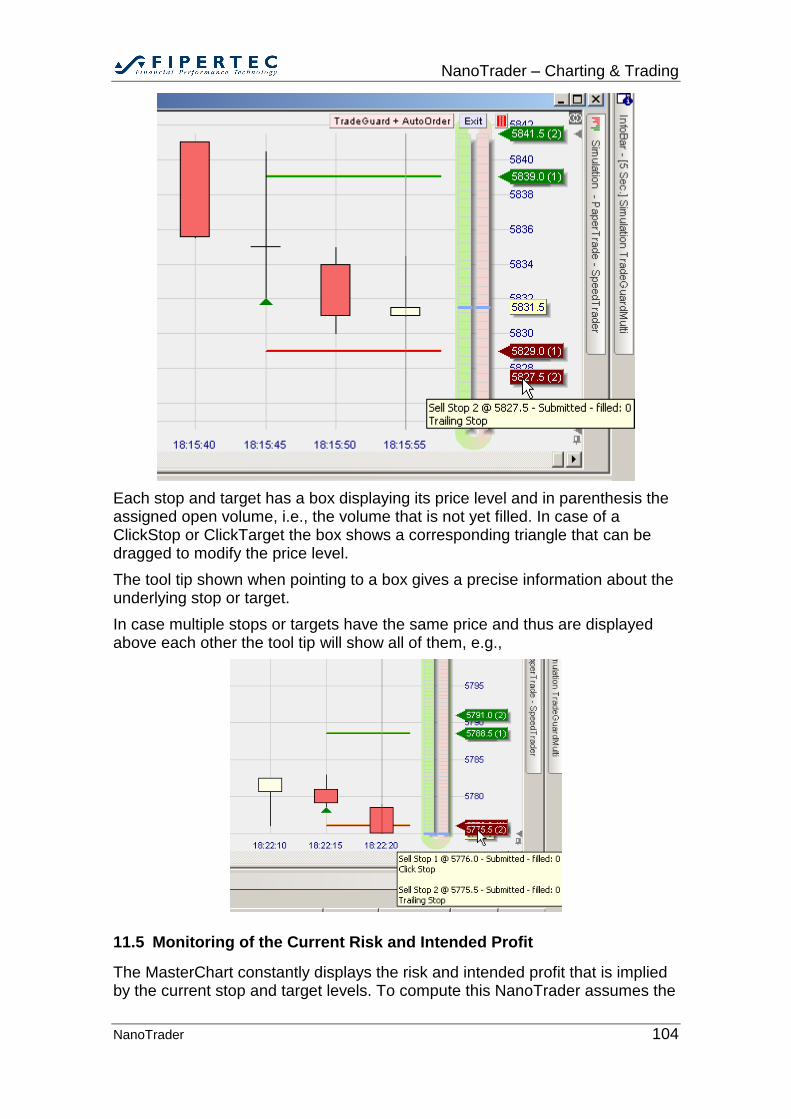
NanoTrader – Charting & Trading
NanoTrader 104
Each stop and target has a box displaying its price level and in parenthesis the assigned open volume, i.e., the volume that is not yet filled. In case of a ClickStop or ClickTarget the box shows a corresponding triangle that can be dragged to modify the price level.
The tool tip shown when pointing to a box gives a precise information about the underlying stop or target.
In case multiple stops or targets have the same price and thus are displayed above each other the tool tip will show all of them, e.g.,
11.5 Monitoring of the Current Risk and Intended Profit
The MasterChart constantly displays the risk and intended profit that is implied by the current stop and target levels. To compute this NanoTrader assumes the
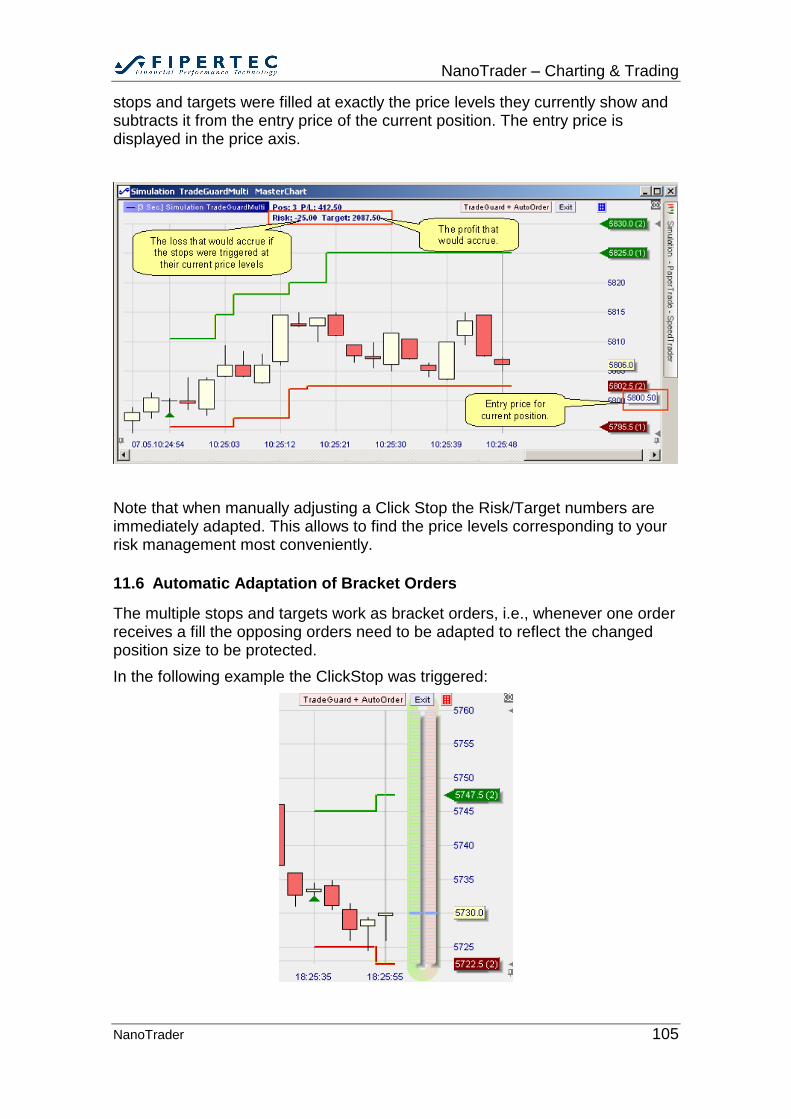
NanoTrader – Charting & Trading
NanoTrader 105
stops and targets were filled at exactly the price levels they currently show and subtracts it from the entry price of the current position. The entry price is displayed in the price axis.
Note that when manually adjusting a Click Stop the Risk/Target numbers are immediately adapted. This allows to find the price levels corresponding to your risk management most conveniently.
11.6 Automatic Adaptation of Bracket Orders
The multiple stops and targets work as bracket orders, i.e., whenever one order receives a fill the opposing orders need to be adapted to reflect the changed position size to be protected.
In the following example the ClickStop was triggered:

NanoTrader – Charting & Trading
NanoTrader 106
As a result the remaining volume to be protected is 2. From our example setting above this means all the volume goes to the first ClickTarget – hence the second ClickTarget is deactivated. In case the bracket order setting was such that there was a real order placed at the exchange for this ClickTarget then that order would have been cancelled.
Note also the change of the indications for the tightest stop and target.
In the following example first a ClickStop was filled and finally the Trailing Stop:
11.7 Using Multiple Stops and Profit Targets in AutoOrder Mode
As opposed to TradeGuard mode the AutoOrder mode allows a study not just to close a position but also to open a position.
In order to enable Multiple Stops and Profit Targets in AutoOrder mode the “LiveEvaluation” of the OrderDefaults dialog needs to be turned on:
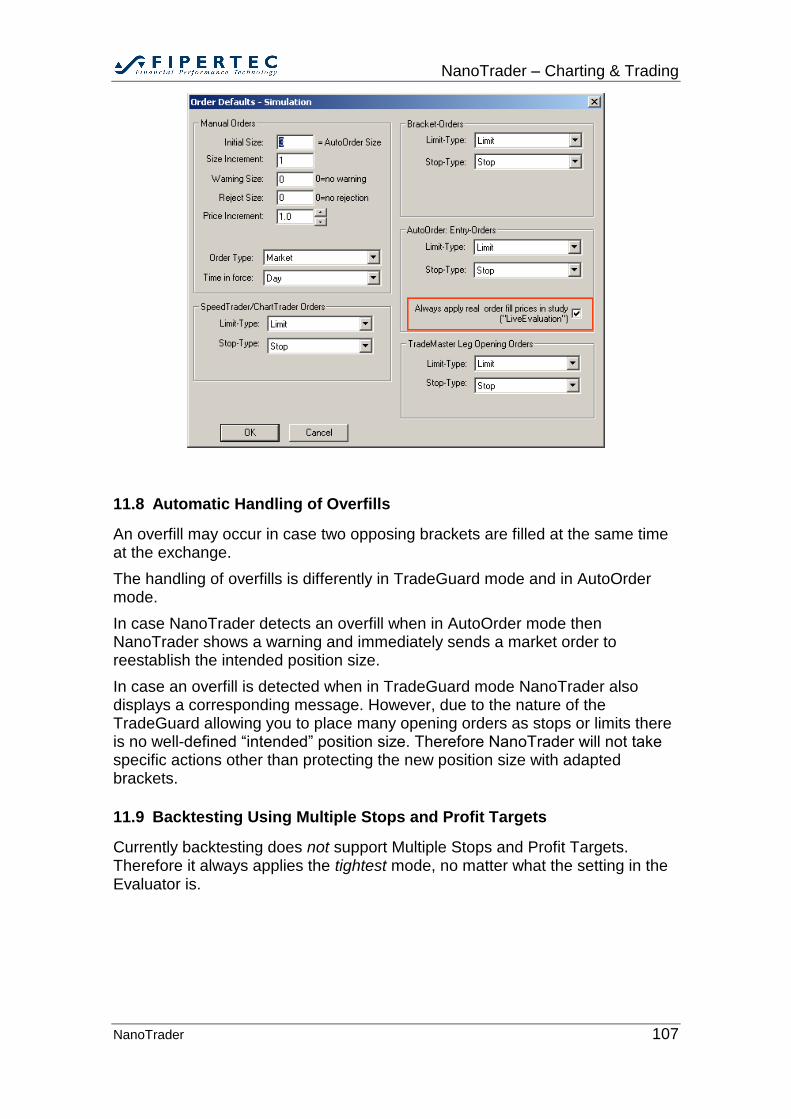
NanoTrader – Charting & Trading
NanoTrader 107
11.8 Automatic Handling of Overfills
An overfill may occur in case two opposing brackets are filled at the same time at the exchange.
The handling of overfills is differently in TradeGuard mode and in AutoOrder mode.
In case NanoTrader detects an overfill when in AutoOrder mode then NanoTrader shows a warning and immediately sends a market order to reestablish the intended position size.
In case an overfill is detected when in TradeGuard mode NanoTrader also displays a corresponding message. However, due to the nature of the TradeGuard allowing you to place many opening orders as stops or limits there is no well-defined “intended” position size. Therefore NanoTrader will not take specific actions other than protecting the new position size with adapted brackets.
11.9 Backtesting Using Multiple Stops and Profit Targets
Currently backtesting does not support Multiple Stops and Profit Targets. Therefore it always applies the tightest mode, no matter what the setting in the Evaluator is.
NanoTrader – Charting & Trading
NanoTrader 108
12 Disclaimer Concerning Automatic Order Creation
Automatic order creation requires a complex infrastructure where all components have to work accurately (e.g., PC stability, internet, broker, trading platform, data provider, study configuration). Therefore, Fipertec rejects any liability for damage resulting from using NanoTrader in the trading process.
In particular when using the automatic order creation provided by NanoTrader the trader is advised to continually observe the trading activities initiated by NanoTrader!
13 Express – Adding Building blocks to NanoTrader
NanoTrader-Express allows to program sentimentors that can be used in exactly the same way as the built-in sentimentors, i.e., they can be combined with other sentimentors and of course they can be optimized. Thus, the NanoTrader framework in conjunction with the Express environment gives you an unparalleled power for specifying, optimizing, backtesting, and applying your trading ideas.
Note that it is not a prerequisite to have the NanoTrader-TradingSystem permission to take advantage of Express. You might use Express to compute and plot classical indicators as well as creating graphical annotations to the chart or issuing messages and alarms.
Access to the programming environment of Express requires a specific permission. However, NanoTrader allows users without the Express permission to execute and view Express scripts, but they cannot change or create scripts on their own. In order to enable an Express script (or a study containing an Express script) to be executed by an "ExecuteOnly" user that script needs to be opened once with the Express editor by a user having the Express permission. When closing/saving the editor NanoTrader silently adds a watermark to the script which is required for being executable by "ExecuteOnly" users.
We encourage programmers to spread their Express creations among the NanoTrader users.
14 Using the PageManager
Once a number of studies and Bars have been loaded and the chart windows are arranged, the complete layout can be saved as a page. Definition of pages allow to switch between arrangements with one click:
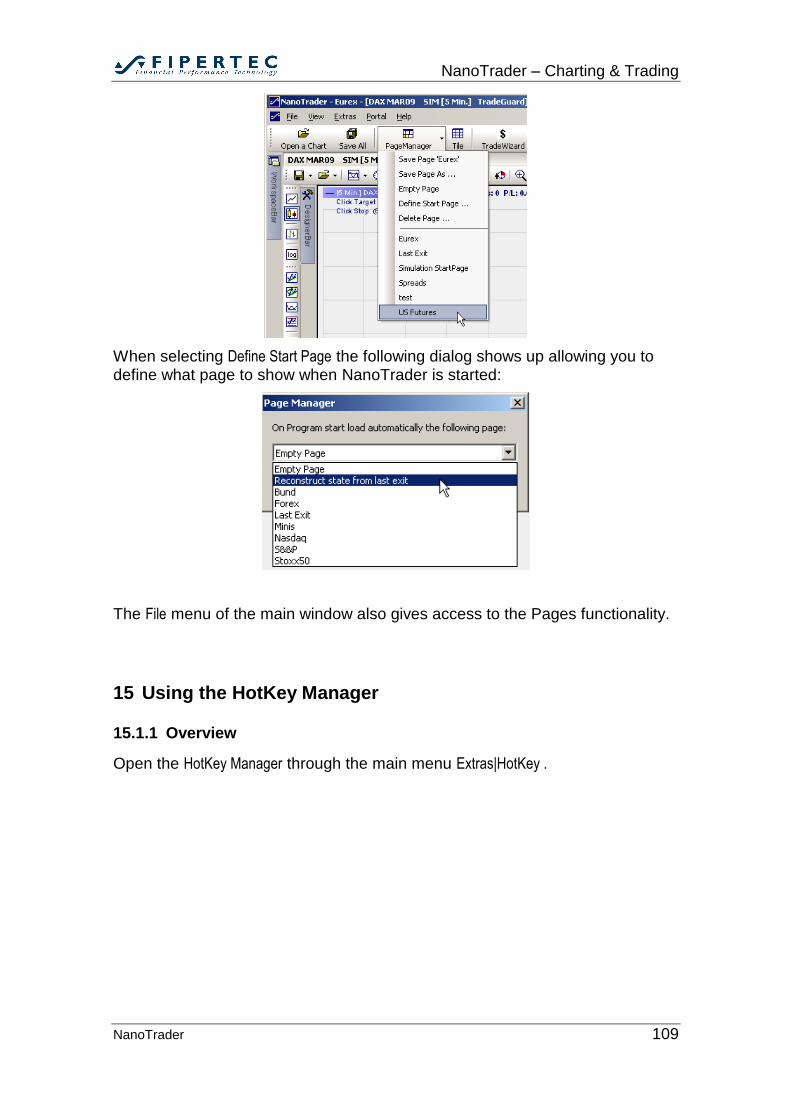
NanoTrader – Charting & Trading
NanoTrader 109
When selecting Define Start Page the following dialog shows up allowing you to define what page to show when NanoTrader is started:
The File menu of the main window also gives access to the Pages functionality.
15 Using the HotKey Manager
15.1.1 Overview
Open the HotKey Manager through the main menu Extras|HotKey .
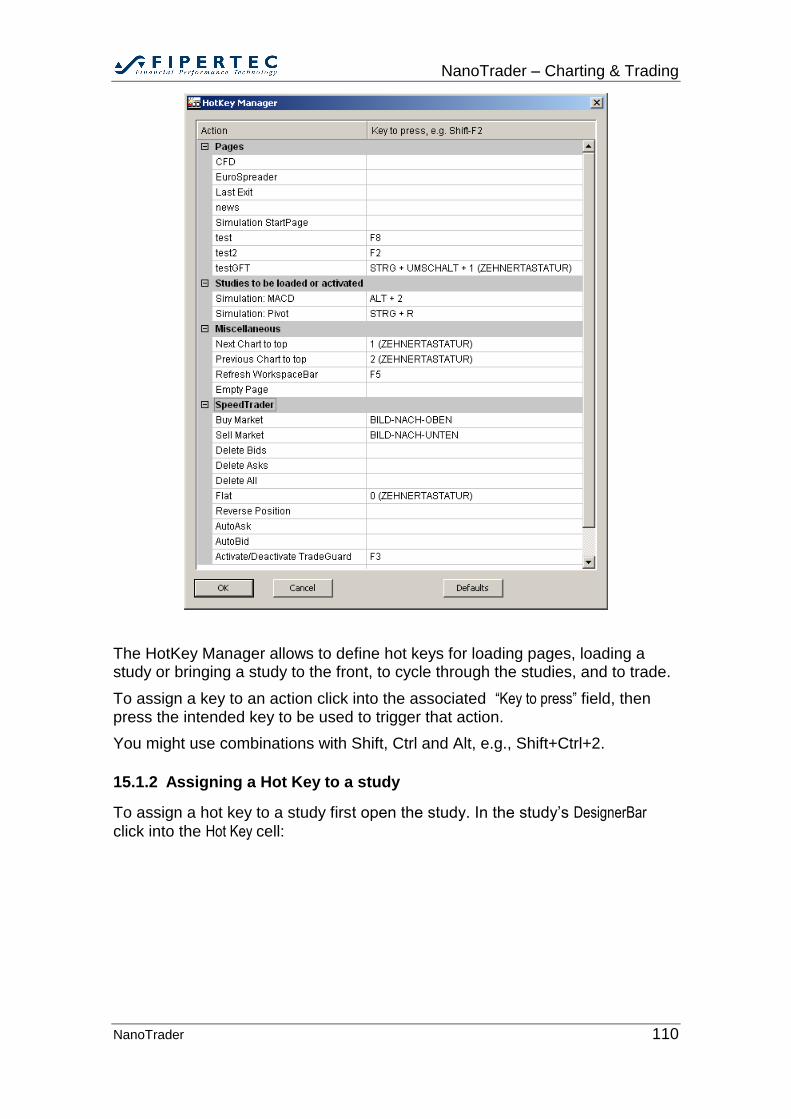
NanoTrader – Charting & Trading
NanoTrader 110
The HotKey Manager allows to define hot keys for loading pages, loading a study or bringing a study to the front, to cycle through the studies, and to trade.
To assign a key to an action click into the associated “Key to press” field, then press the intended key to be used to trigger that action.
You might use combinations with Shift, Ctrl and Alt, e.g., Shift+Ctrl+2.
15.1.2 Assigning a Hot Key to a study
To assign a hot key to a study first open the study. In the study’s DesignerBar
click into the Hot Key cell:
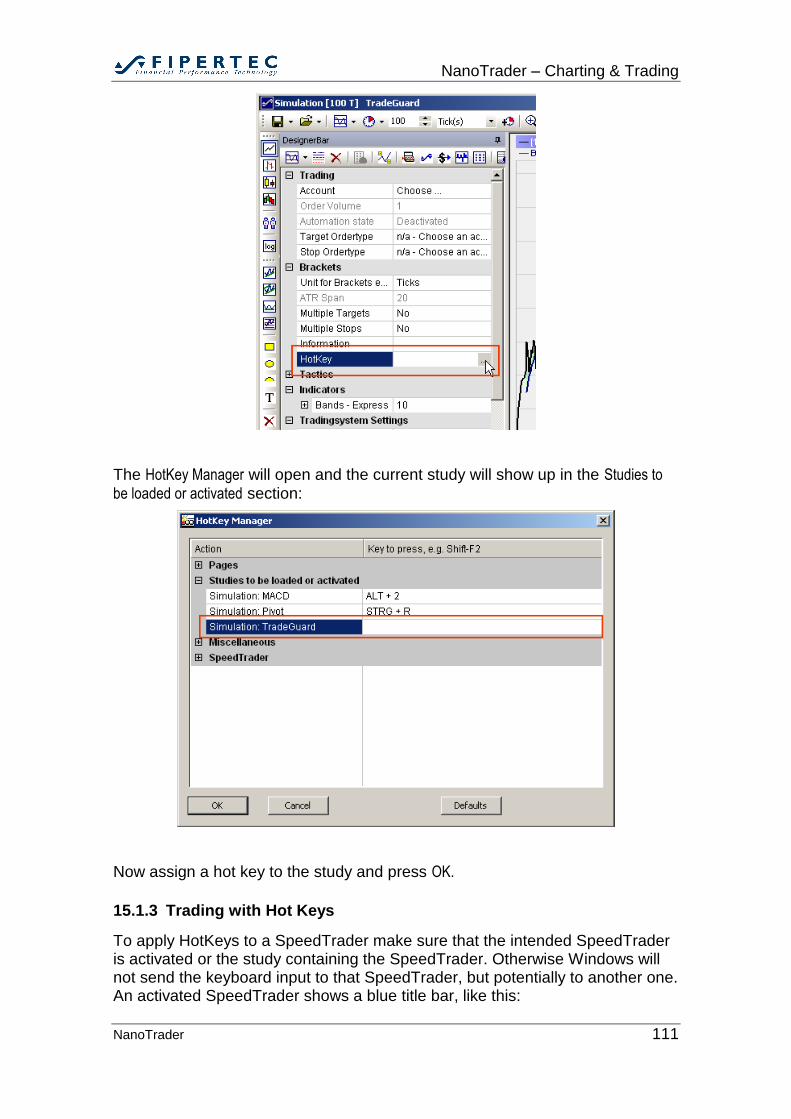
NanoTrader – Charting & Trading
NanoTrader 111
The HotKey Manager will open and the current study will show up in the Studies to
be loaded or activated section:
Now assign a hot key to the study and press OK.
15.1.3 Trading with Hot Keys
To apply HotKeys to a SpeedTrader make sure that the intended SpeedTrader is activated or the study containing the SpeedTrader. Otherwise Windows will not send the keyboard input to that SpeedTrader, but potentially to another one. An activated SpeedTrader shows a blue title bar, like this:
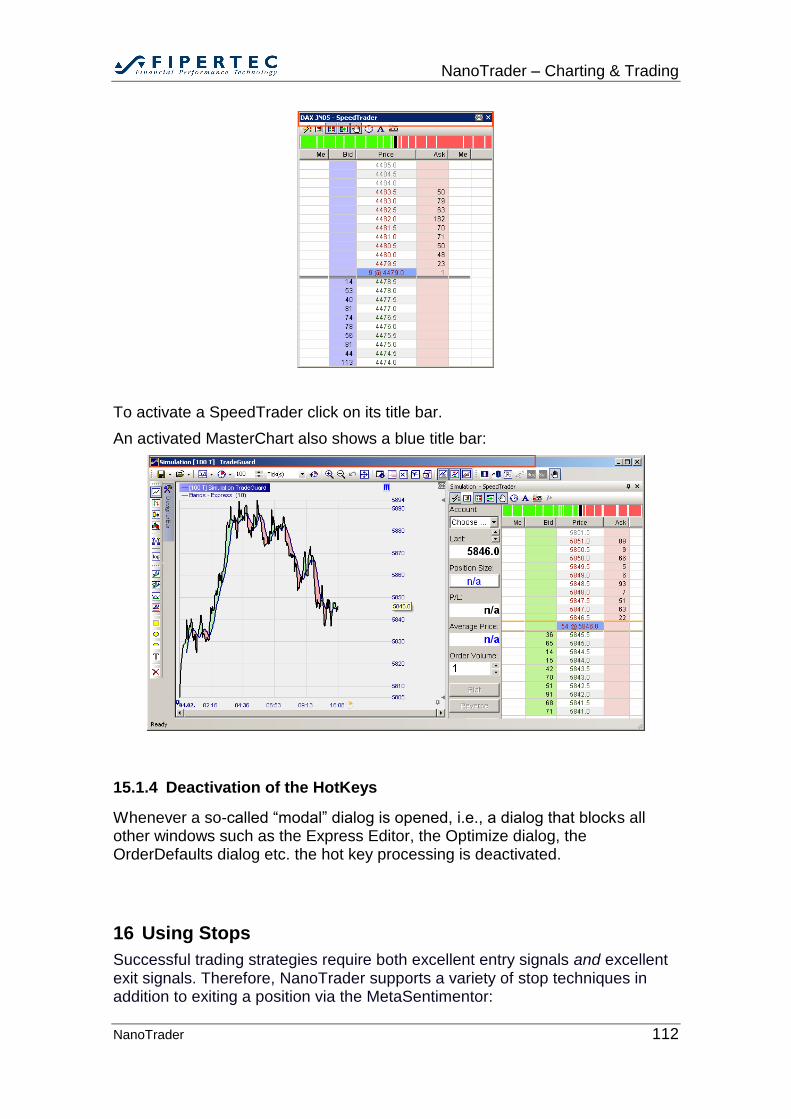
NanoTrader – Charting & Trading
NanoTrader 112
To activate a SpeedTrader click on its title bar.
An activated MasterChart also shows a blue title bar:
15.1.4 Deactivation of the HotKeys
Whenever a so-called “modal” dialog is opened, i.e., a dialog that blocks all other windows such as the Express Editor, the Optimize dialog, the OrderDefaults dialog etc. the hot key processing is deactivated.
16 Using Stops
Successful trading strategies require both excellent entry signals and excellent exit signals. Therefore, NanoTrader supports a variety of stop techniques in addition to exiting a position via the MetaSentimentor:
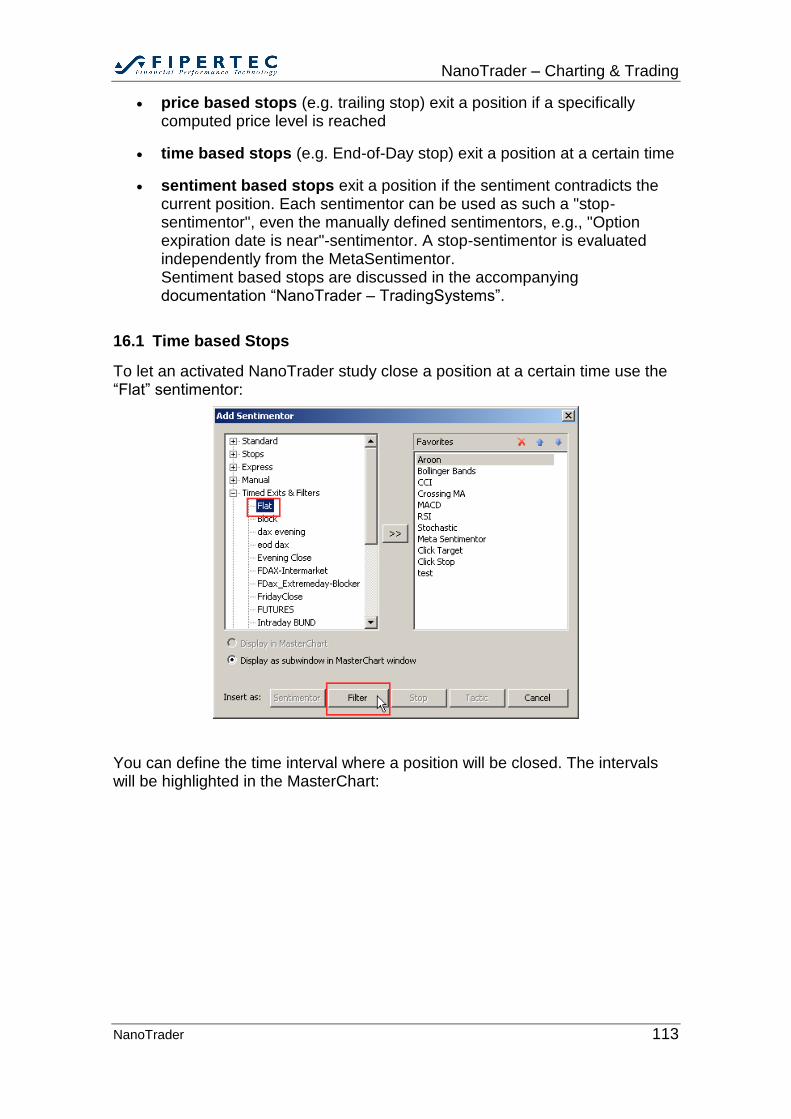
NanoTrader – Charting & Trading
NanoTrader 113
price based stops (e.g. trailing stop) exit a position if a specifically computed price level is reached
time based stops (e.g. End-of-Day stop) exit a position at a certain time
sentiment based stops exit a position if the sentiment contradicts the current position. Each sentimentor can be used as such a "stop-sentimentor", even the manually defined sentimentors, e.g., "Option expiration date is near"-sentimentor. A stop-sentimentor is evaluated independently from the MetaSentimentor. Sentiment based stops are discussed in the accompanying documentation “NanoTrader – TradingSystems”.
16.1 Time based Stops
To let an activated NanoTrader study close a position at a certain time use the “Flat” sentimentor:
You can define the time interval where a position will be closed. The intervals will be highlighted in the MasterChart:
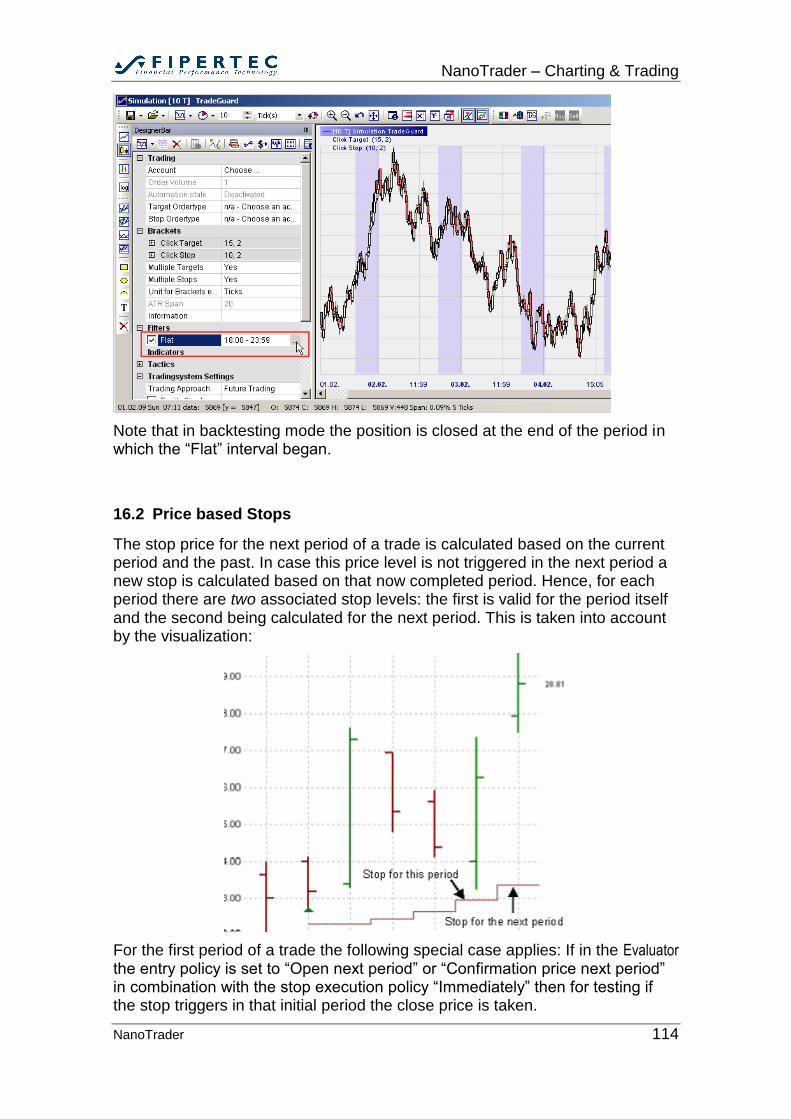
NanoTrader – Charting & Trading
NanoTrader 114
Note that in backtesting mode the position is closed at the end of the period in which the “Flat” interval began.
16.2 Price based Stops
The stop price for the next period of a trade is calculated based on the current period and the past. In case this price level is not triggered in the next period a new stop is calculated based on that now completed period. Hence, for each period there are two associated stop levels: the first is valid for the period itself and the second being calculated for the next period. This is taken into account by the visualization:
For the first period of a trade the following special case applies: If in the Evaluator the entry policy is set to “Open next period” or “Confirmation price next period” in combination with the stop execution policy “Immediately” then for testing if the stop triggers in that initial period the close price is taken.
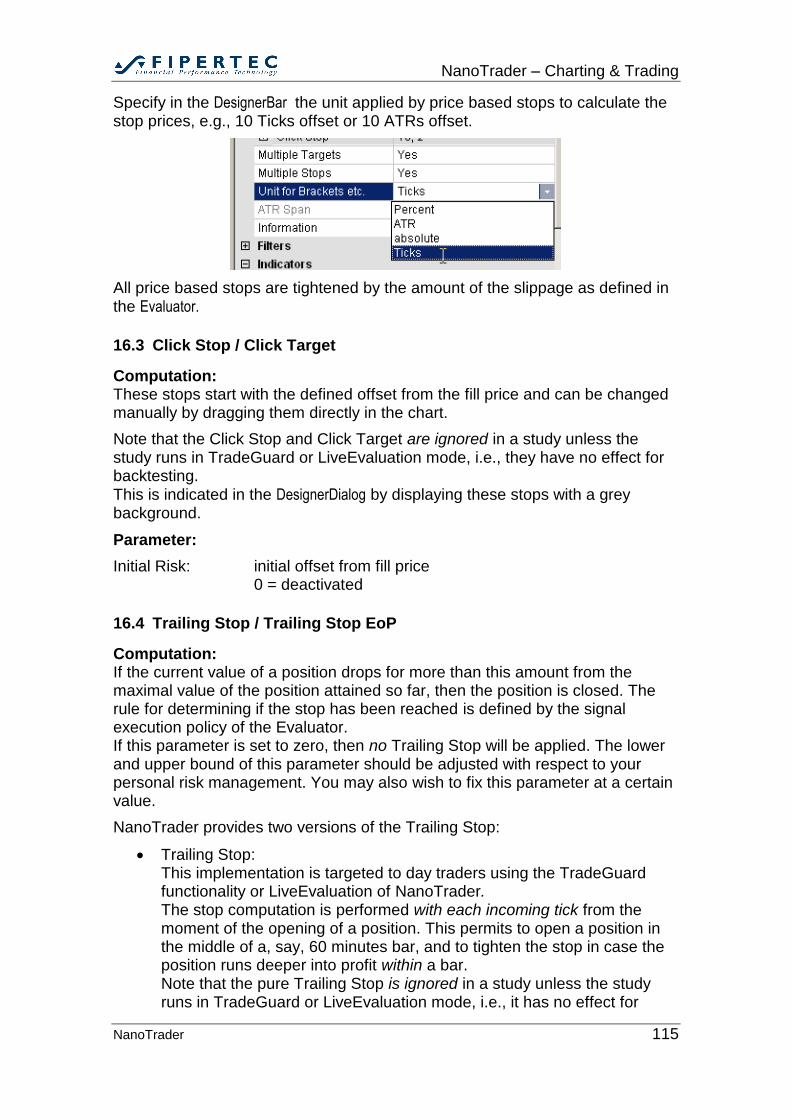
NanoTrader – Charting & Trading
NanoTrader 115
Specify in the DesignerBar the unit applied by price based stops to calculate the stop prices, e.g., 10 Ticks offset or 10 ATRs offset.
All price based stops are tightened by the amount of the slippage as defined in the Evaluator.
16.3 Click Stop / Click Target
Computation: These stops start with the defined offset from the fill price and can be changed manually by dragging them directly in the chart.
Note that the Click Stop and Click Target are ignored in a study unless the study runs in TradeGuard or LiveEvaluation mode, i.e., they have no effect for backtesting. This is indicated in the DesignerDialog by displaying these stops with a grey background.
Parameter:
Initial Risk: initial offset from fill price 0 = deactivated
16.4 Trailing Stop / Trailing Stop EoP
Computation: If the current value of a position drops for more than this amount from the maximal value of the position attained so far, then the position is closed. The rule for determining if the stop has been reached is defined by the signal execution policy of the Evaluator. If this parameter is set to zero, then no Trailing Stop will be applied. The lower and upper bound of this parameter should be adjusted with respect to your personal risk management. You may also wish to fix this parameter at a certain value.
NanoTrader provides two versions of the Trailing Stop:
Trailing Stop: This implementation is targeted to day traders using the TradeGuard functionality or LiveEvaluation of NanoTrader. The stop computation is performed with each incoming tick from the moment of the opening of a position. This permits to open a position in the middle of a, say, 60 minutes bar, and to tighten the stop in case the position runs deeper into profit within a bar. Note that the pure Trailing Stop is ignored in a study unless the study runs in TradeGuard or LiveEvaluation mode, i.e., it has no effect for
NanoTrader – Charting & Trading
NanoTrader 116
backtesting. This is indicated in the DesignerDialog by displaying the stop with a grey background.
Trailing Stop EoP (End of Period): As the name suggests, the actual stop value is computed only at the completion of a period based on the close of that period.
Parameter:
Long Stop: initial offset from fill price for long positions 0 = deactivate Stop for long positions
Short Stop: initial offset from fill price for short positions 0 = deactivate Stop for short positions
16.5 Profit Target
Computation: If the price changed for the specified amount in the direction of the position with respect to the opening price of the trade then the position is closed. The rule for determining if the profit target has been reached is defined by the signal execution policy of the Evaluator.
Parameter:
Target Long: offset from fill price for long positions 0 = deactivate Stop for long positions
Target Short: offset from fill price for short positions 0 = deactivate Stop for short positions
16.6 Time Stop
Computation: An open position is closed if it survived Max Periods periods.
Parameter: Max Periods: maximal duration of a trade. (0 = deactivate Stop)
16.7 Parabolic Stop
Computation:
1. Determination of the SIP (Significant Point), which equals the initial stop PS(t). For long positions the SIP is the lowest low of the previous span periods. For short positions the SIP is the highest high of the previous span periods.

NanoTrader – Charting & Trading
NanoTrader 117
2. Determination of the AF (Acceleration Factor). As a default, the AF has an initial value of 0.02 that is increased by 0.02 after each period until a maximum of 0.20 is reached.
3. For long positions, the EP (Extreme Point) is the highest high reached within the trade. For short positions, the EP is the lowest low
4. Computation of the Parabolic Stop of the next period: PS (t+1) = PS (t) + AF(t) * (EPTrade - PS (t)) AF(t+1) = min (Acceleration Max, AF(t) + Acceleration increment)
Parameter:
Span for initial High/Low: number of periods for determining the highest high/lowest low.
Acceleration Increment: the increment of the acceleration factor
Acceleration Max: the maximal value of the acceleration factor
16.8 Linear Stop
Computation: Starting from the entry price a straight line with a fixed gradient is computed. When crossing the line, the stop is executed. The applied unit is specified in the evaluator (percental, multiple of ATR, absolute).
Parameter: Long Gradient: minimal price increase per period for long positions
Short Gradient: minimal price decrease per period for short positions
Offset: the offset is subtracted from the entry price for long positions, added to the entry price for short positions
16.9 KaseDev Stop
Computation:
1. Computation of the True Range
2. Computation of the Moving Average of True Range: ATR
3. Computation of the standard deviation of the True Ranges: SDEV
4. Computation of the Dev Stop Reversal Value: DDEV
5. DDEV = ATR + (f * SDEV )
6. Dev Stop Long = Trade High – DDEV Dev Stop Short = Trade Low + DDEV
Trade High denotes the highest high during the trade, Trade Low the lowest low.
Note that because of the incorporation of the standard deviations of the true ranges the KaseDev Stop may rise and fall. In other words, the KaseDev Stop enables a trade to “breath with the volatility”.
NanoTrader – Charting & Trading
NanoTrader 118
Parameter:
Span ATR: number of periods used to compute the ATR
Span StdDev: number of periods used to compute the standard deviation of the True Ranges
StdDevs: corresponds the factor f from the formula given above
16.10 PeriodsHighLow Stop
Computation: The stop for a long position is defined by the n-periods low – delta.
For a short position, the stop is the n-periods high + delta.
The applied unit is specified in the evaluator (percental, multiple of ATR, absolute).
The stop is implemented in a way such that it cannot be widened within a trade, i.e., it has an implicit trailing characteristic.
Parameter: Periods for Low: number of periods for determining the low
Stop = Low + Delta: correction of the low
Periods for High: number of periods for determining the high
Stop = High + Delta: correction of the high
16.11 BreakEven Stop / BreakEven Stop EoP
Computation: The calculation of the BreakEven stop relies on two primary stop levels. The first level gets active directly after entering the trade. This level is called “Initial Risk”. In case the trade develops into the correct direction, the stop is changed like a trailing stop until it reaches the “BreakEven level”. From this point on, the stop stays constant.
As with the Trailing Stop, NanoTrader provides an End of Period (EoP) implementation and a Tick by Tick implementation. For details please see the comments on the TrailingStop.
Note that the pure Trailing Stop is ignored in a study unless the study runs in TradeGuard or LiveEvaluation mode, i.e., it has no effect for backtesting. This is indicated in the DesignerDialog by displaying the stop with a grey background.
Parameter: Initial Risk: Offset for the initial risk with respect to the entry price
BreakEven: Offset for the BreakEven level. If set to 0 the BreakEven-part is disabled, i.e., the stop works just as a trailing stop.
NanoTrader – Charting & Trading
NanoTrader 119
16.12 Trendline Stop
A trendline drawn into a MasterChart as a stop provides a price rounded to the nearest multiple of a tick. The stop price created through a trendline is used identical to those of all other stops.
16.13 Trendchannel Stop
A trendchannel drawn into a MasterChart as a stop provides a price rounded to the multiple of a tick. When used as a “Long Stop”, the lower line of the channel is used for the price computation (because most often there should be an upward trend when trading long). When used as a “Short Stop”, the upper line is used.
17 OneClick Recording and Playback
The most effective way for a trader to train a new trading technique or a new market is by way of having live data of this market in conjunction with a PaperTrading feature. However, it can get extremely time consuming to really get confident with the various characteristics of a market – simply because they will probably enfold over multiple trading days, if not weeks.
Also, in a training environment such as seminars it is extremely helpful to have real data at hand representing special market conditions such as mini crashes, reactions to announcements of economic data etc.
The OneClick Recording and Playback feature of NanoTrader addresses these needs. It allows to easily convert price data into a Recording that can be used as a Playback thereby giving the trader the live experience of receiving the data.
At a glance OneClick Recording and Playback provides the following functionalities:
Convert a zoom in a MasterChart into a Recording with the click of a button
Convert the last trading session of a tradable security into a Recording. This allows to train on that data without having seen the chart before.
Use Live Recording for capturing the trades and the orderbook.
The Playback allows you to receive the data in realtime or in any acceleration you choose. It also allows to Pause or move forward stepwise for a most detailed examination of the market.
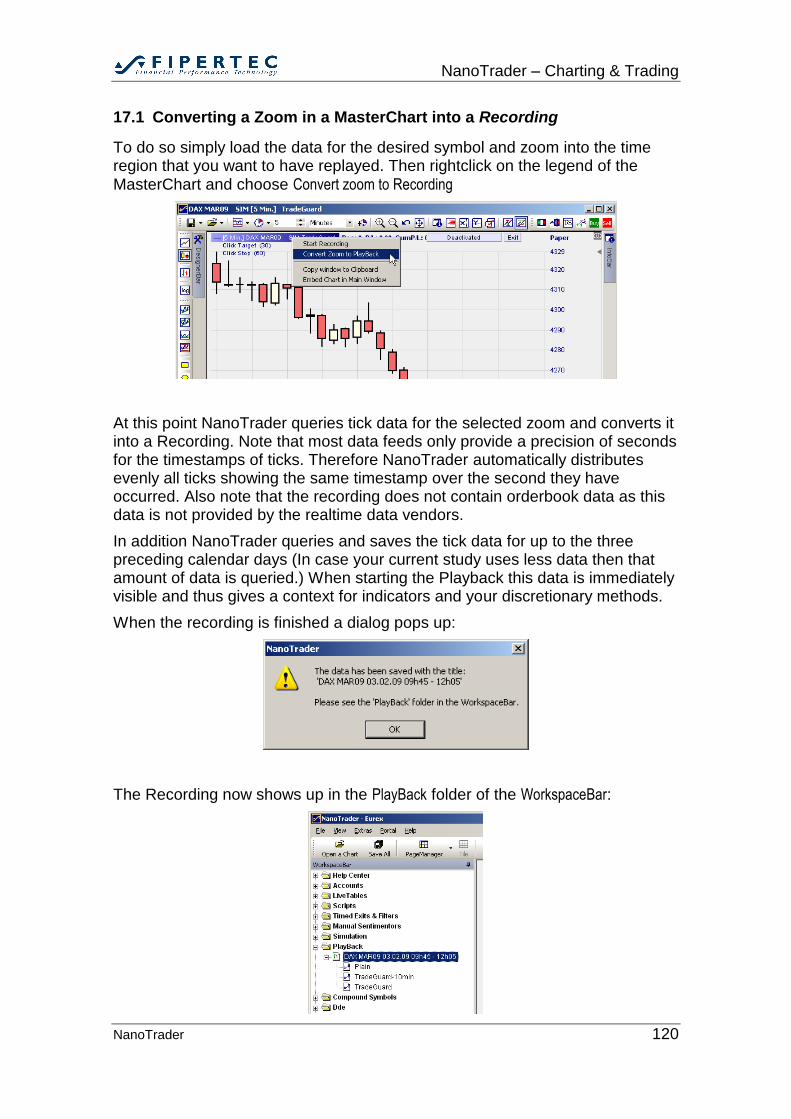
NanoTrader – Charting & Trading
NanoTrader 120
17.1 Converting a Zoom in a MasterChart into a Recording
To do so simply load the data for the desired symbol and zoom into the time region that you want to have replayed. Then rightclick on the legend of the MasterChart and choose Convert zoom to Recording
At this point NanoTrader queries tick data for the selected zoom and converts it into a Recording. Note that most data feeds only provide a precision of seconds for the timestamps of ticks. Therefore NanoTrader automatically distributes evenly all ticks showing the same timestamp over the second they have occurred. Also note that the recording does not contain orderbook data as this data is not provided by the realtime data vendors.
In addition NanoTrader queries and saves the tick data for up to the three preceding calendar days (In case your current study uses less data then that amount of data is queried.) When starting the Playback this data is immediately visible and thus gives a context for indicators and your discretionary methods.
When the recording is finished a dialog pops up:
The Recording now shows up in the PlayBack folder of the WorkspaceBar:
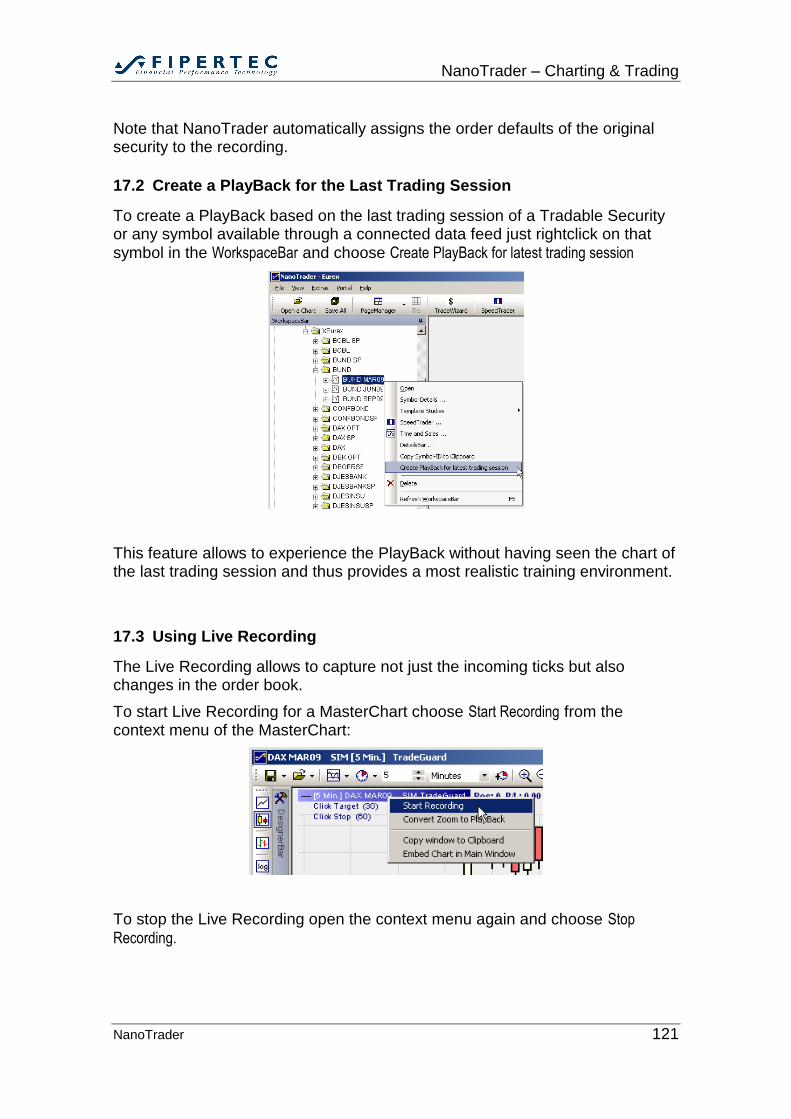
NanoTrader – Charting & Trading
NanoTrader 121
Note that NanoTrader automatically assigns the order defaults of the original security to the recording.
17.2 Create a PlayBack for the Last Trading Session
To create a PlayBack based on the last trading session of a Tradable Security or any symbol available through a connected data feed just rightclick on that symbol in the WorkspaceBar and choose Create PlayBack for latest trading session
This feature allows to experience the PlayBack without having seen the chart of the last trading session and thus provides a most realistic training environment.
17.3 Using Live Recording
The Live Recording allows to capture not just the incoming ticks but also changes in the order book.
To start Live Recording for a MasterChart choose Start Recording from the context menu of the MasterChart:
To stop the Live Recording open the context menu again and choose Stop
Recording.
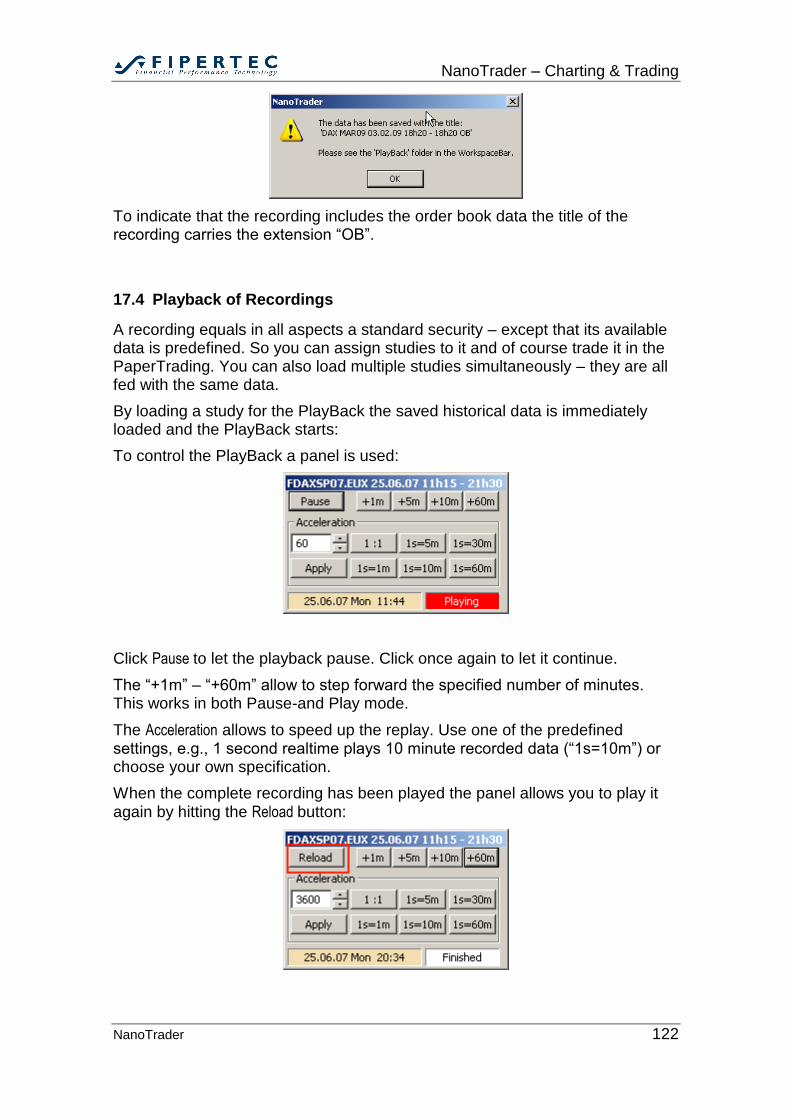
NanoTrader – Charting & Trading
NanoTrader 122
To indicate that the recording includes the order book data the title of the recording carries the extension “OB”.
17.4 Playback of Recordings
A recording equals in all aspects a standard security – except that its available data is predefined. So you can assign studies to it and of course trade it in the PaperTrading. You can also load multiple studies simultaneously – they are all fed with the same data.
By loading a study for the PlayBack the saved historical data is immediately loaded and the PlayBack starts:
To control the PlayBack a panel is used:
Click Pause to let the playback pause. Click once again to let it continue.
The “+1m” – “+60m” allow to step forward the specified number of minutes. This works in both Pause-and Play mode.
The Acceleration allows to speed up the replay. Use one of the predefined settings, e.g., 1 second realtime plays 10 minute recorded data (“1s=10m”) or choose your own specification.
When the complete recording has been played the panel allows you to play it again by hitting the Reload button:
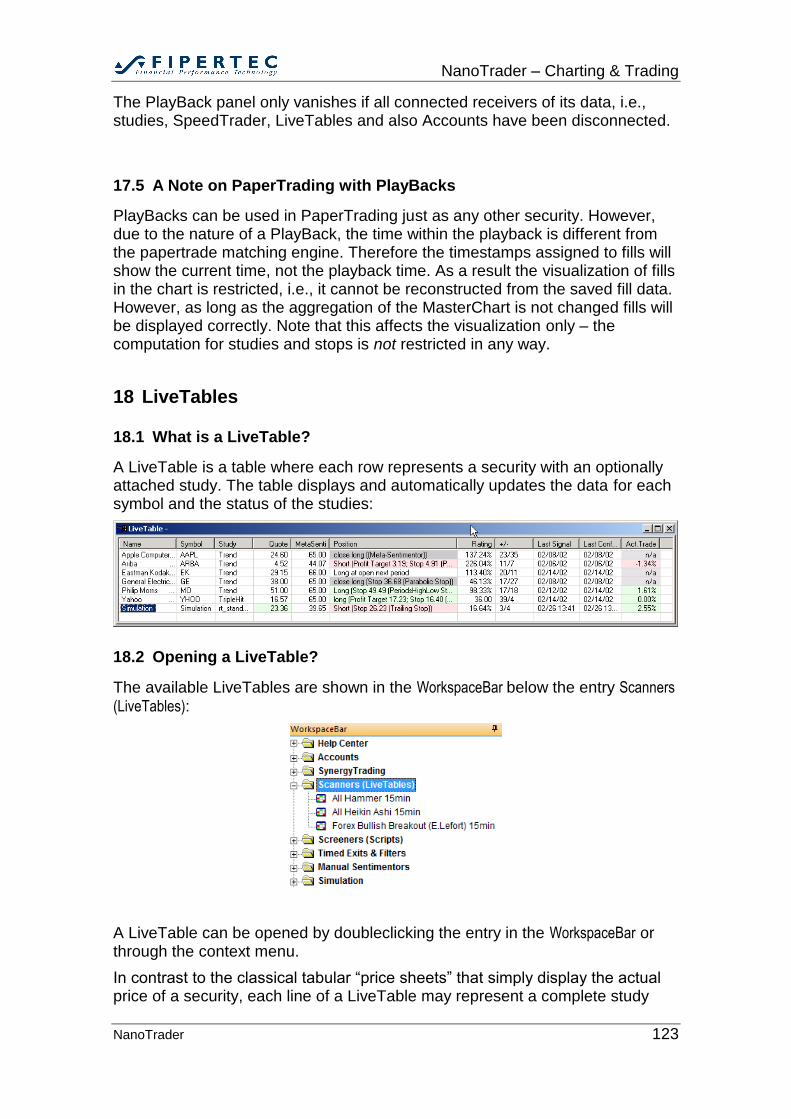
NanoTrader – Charting & Trading
NanoTrader 123
The PlayBack panel only vanishes if all connected receivers of its data, i.e., studies, SpeedTrader, LiveTables and also Accounts have been disconnected.
17.5 A Note on PaperTrading with PlayBacks
PlayBacks can be used in PaperTrading just as any other security. However, due to the nature of a PlayBack, the time within the playback is different from the papertrade matching engine. Therefore the timestamps assigned to fills will show the current time, not the playback time. As a result the visualization of fills in the chart is restricted, i.e., it cannot be reconstructed from the saved fill data. However, as long as the aggregation of the MasterChart is not changed fills will be displayed correctly. Note that this affects the visualization only – the computation for studies and stops is not restricted in any way.
18 LiveTables
18.1 What is a LiveTable?
A LiveTable is a table where each row represents a security with an optionally attached study. The table displays and automatically updates the data for each symbol and the status of the studies:
18.2 Opening a LiveTable?
The available LiveTables are shown in the WorkspaceBar below the entry Scanners
(LiveTables):
A LiveTable can be opened by doubleclicking the entry in the WorkspaceBar or through the context menu.
In contrast to the classical tabular “price sheets” that simply display the actual price of a security, each line of a LiveTable may represent a complete study
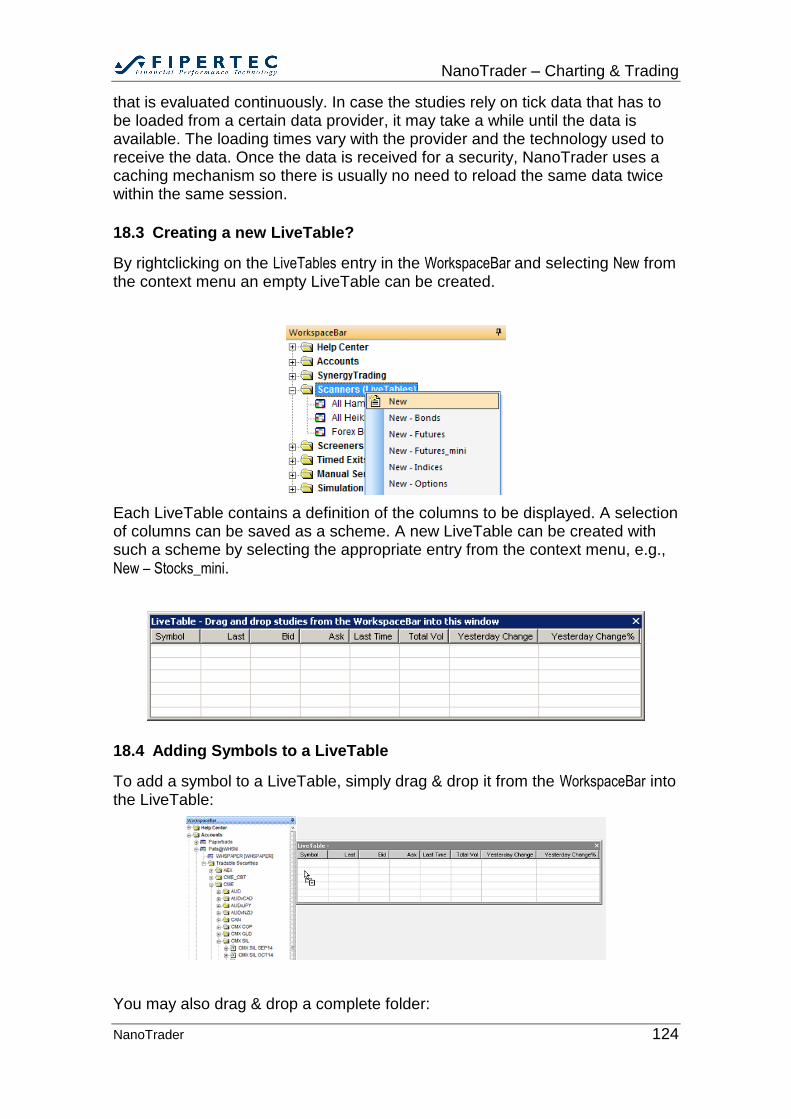
NanoTrader – Charting & Trading
NanoTrader 124
that is evaluated continuously. In case the studies rely on tick data that has to be loaded from a certain data provider, it may take a while until the data is available. The loading times vary with the provider and the technology used to receive the data. Once the data is received for a security, NanoTrader uses a caching mechanism so there is usually no need to reload the same data twice within the same session.
18.3 Creating a new LiveTable?
By rightclicking on the LiveTables entry in the WorkspaceBar and selecting New from the context menu an empty LiveTable can be created.
Each LiveTable contains a definition of the columns to be displayed. A selection of columns can be saved as a scheme. A new LiveTable can be created with such a scheme by selecting the appropriate entry from the context menu, e.g., New – Stocks_mini.
18.4 Adding Symbols to a LiveTable
To add a symbol to a LiveTable, simply drag & drop it from the WorkspaceBar into the LiveTable:
You may also drag & drop a complete folder:
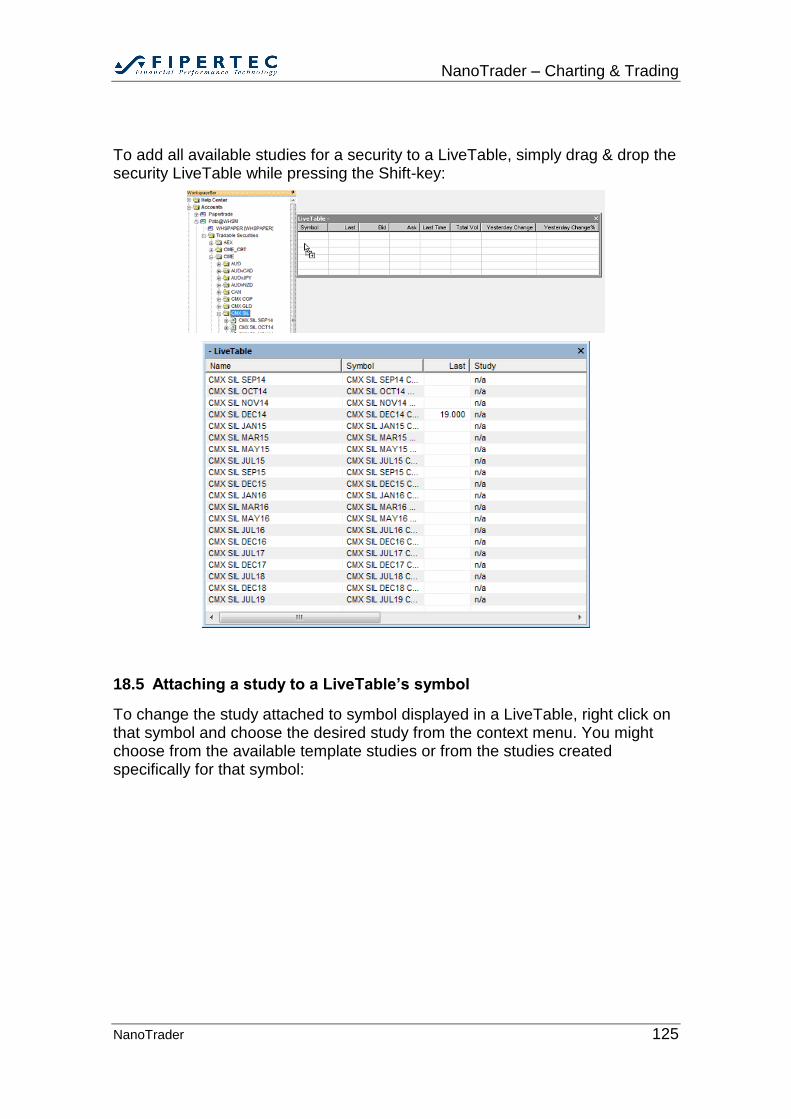
NanoTrader – Charting & Trading
NanoTrader 125
To add all available studies for a security to a LiveTable, simply drag & drop the security LiveTable while pressing the Shift-key:
18.5 Attaching a study to a LiveTable’s symbol
To change the study attached to symbol displayed in a LiveTable, right click on that symbol and choose the desired study from the context menu. You might choose from the available template studies or from the studies created specifically for that symbol:
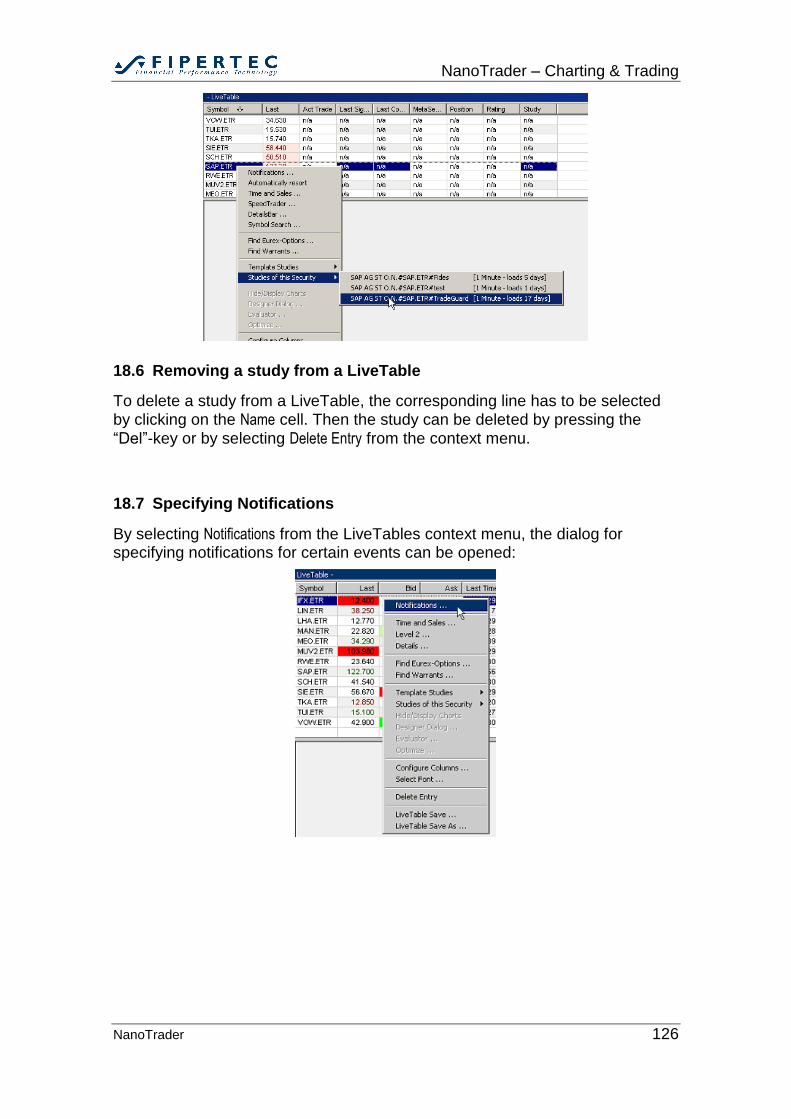
NanoTrader – Charting & Trading
NanoTrader 126
18.6 Removing a study from a LiveTable
To delete a study from a LiveTable, the corresponding line has to be selected by clicking on the Name cell. Then the study can be deleted by pressing the
“Del”-key or by selecting Delete Entry from the context menu.
18.7 Specifying Notifications
By selecting Notifications from the LiveTables context menu, the dialog for specifying notifications for certain events can be opened:
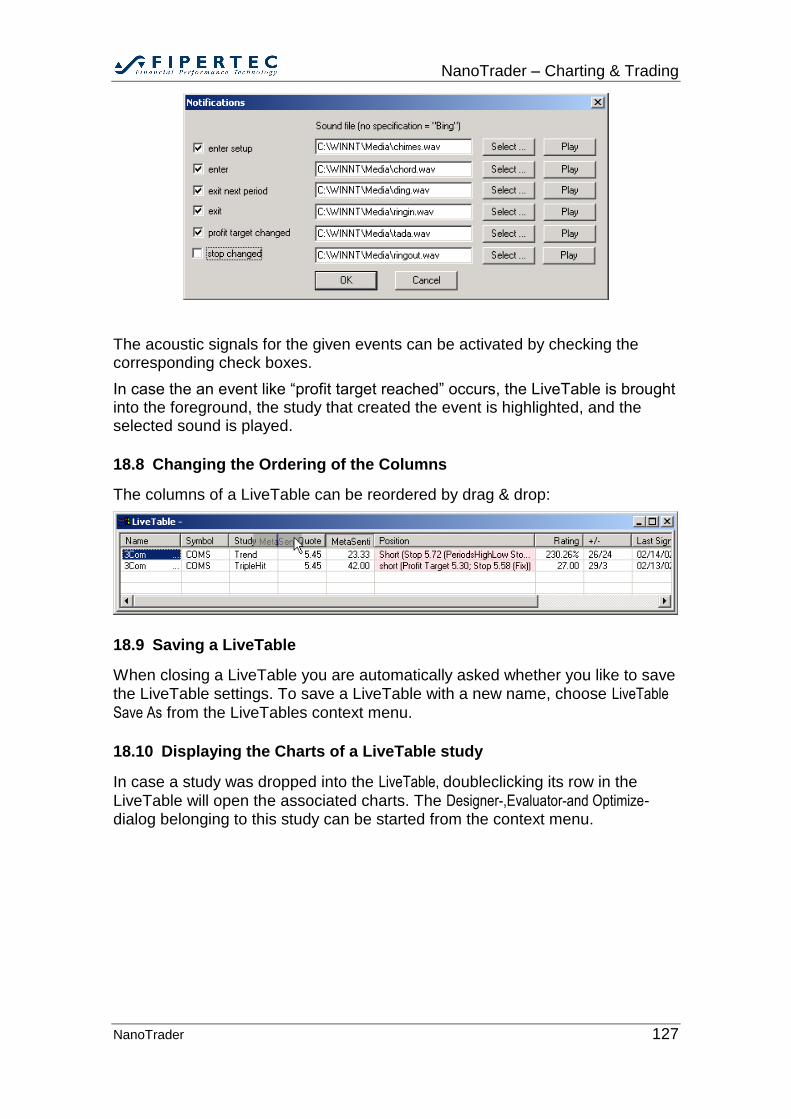
NanoTrader – Charting & Trading
NanoTrader 127
The acoustic signals for the given events can be activated by checking the corresponding check boxes.
In case the an event like “profit target reached” occurs, the LiveTable is brought into the foreground, the study that created the event is highlighted, and the selected sound is played.
18.8 Changing the Ordering of the Columns
The columns of a LiveTable can be reordered by drag & drop:
18.9 Saving a LiveTable
When closing a LiveTable you are automatically asked whether you like to save the LiveTable settings. To save a LiveTable with a new name, choose LiveTable
Save As from the LiveTables context menu.
18.10 Displaying the Charts of a LiveTable study
In case a study was dropped into the LiveTable, doubleclicking its row in the
LiveTable will open the associated charts. The Designer-,Evaluator-and Optimize-dialog belonging to this study can be started from the context menu.
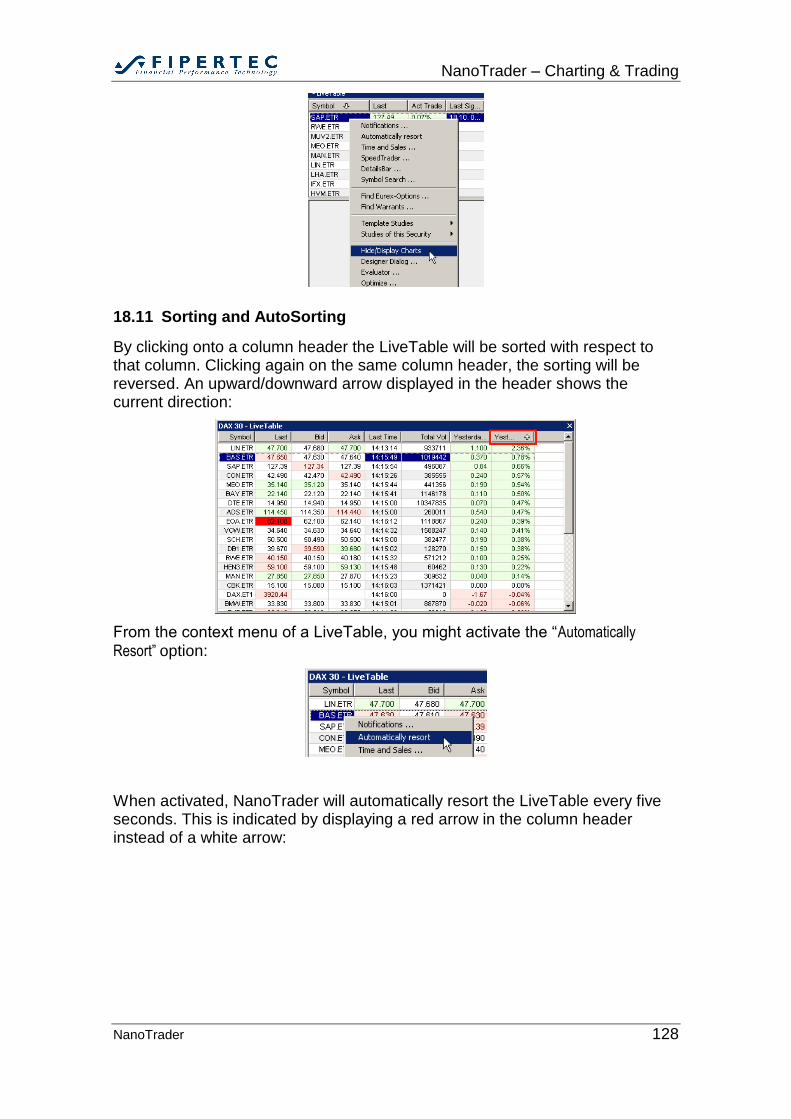
NanoTrader – Charting & Trading
NanoTrader 128
18.11 Sorting and AutoSorting
By clicking onto a column header the LiveTable will be sorted with respect to that column. Clicking again on the same column header, the sorting will be reversed. An upward/downward arrow displayed in the header shows the current direction:
From the context menu of a LiveTable, you might activate the “Automatically
Resort” option:
When activated, NanoTrader will automatically resort the LiveTable every five seconds. This is indicated by displaying a red arrow in the column header instead of a white arrow:
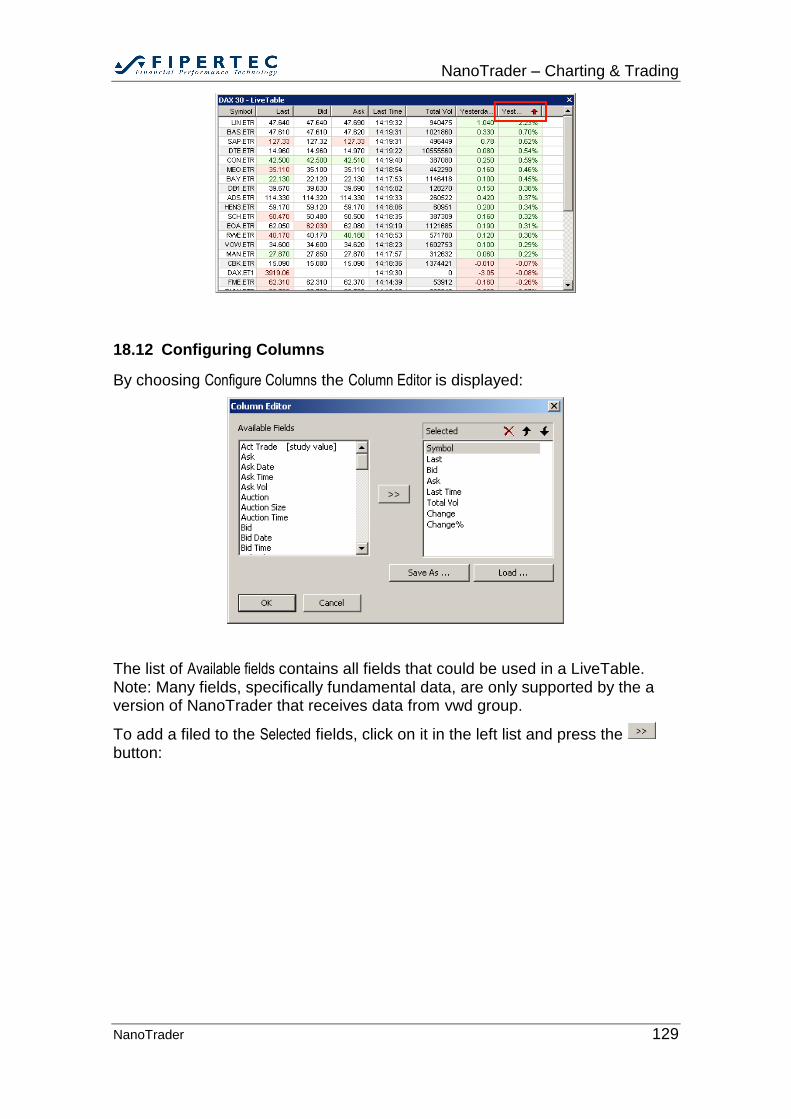
NanoTrader – Charting & Trading
NanoTrader 129
18.12 Configuring Columns
By choosing Configure Columns the Column Editor is displayed:
The list of Available fields contains all fields that could be used in a LiveTable. Note: Many fields, specifically fundamental data, are only supported by the a version of NanoTrader that receives data from vwd group.
To add a filed to the Selected fields, click on it in the left list and press the button:
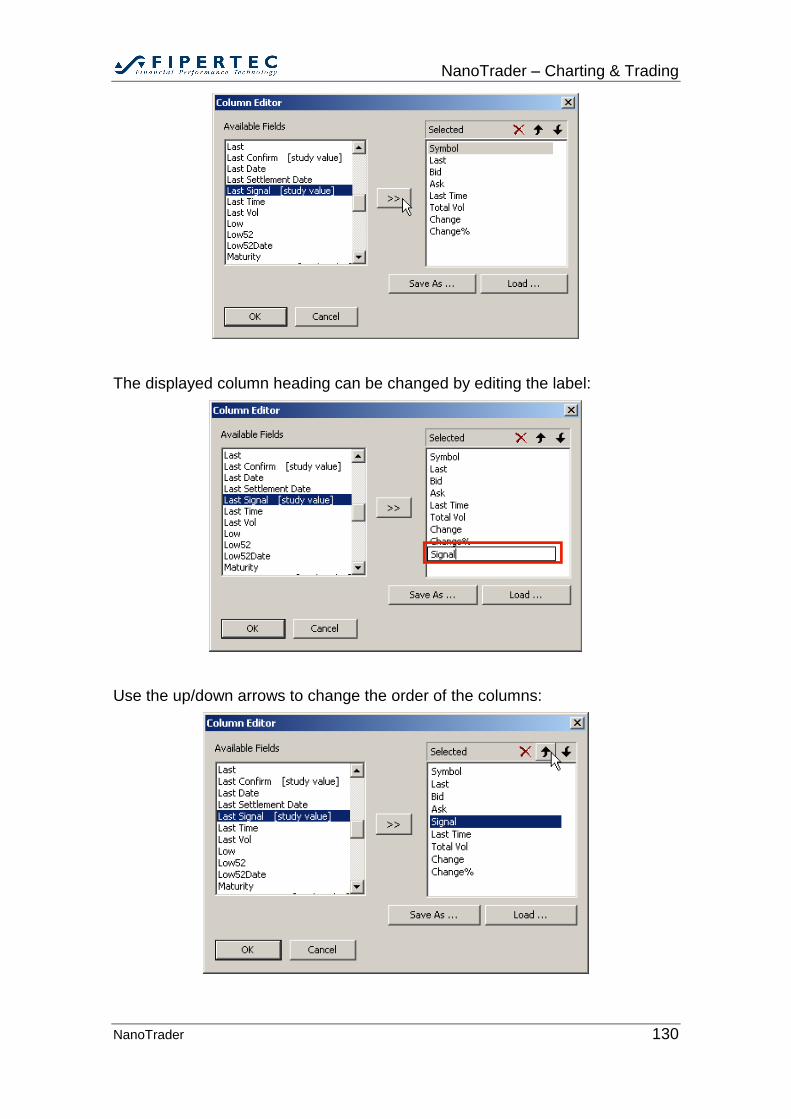
NanoTrader – Charting & Trading
NanoTrader 130
The displayed column heading can be changed by editing the label:
Use the up/down arrows to change the order of the columns:
NanoTrader – Charting & Trading
NanoTrader 131
A selection of columns may be saved by clicking on Save As or loaded by
clicking Load.
19 LiveStatistics
19.1 What is LiveStatistics?
Imagine you are observing a chart. The candles are developing on the screen in front of you and suddenly you feel like detecting some kind of characteristic chart movement. Wouldn’t it be great to see if there have been similar situations in the past and then to check how the price developments went on afterwards? Imagine you had a tool that would do that tedious work for you. It would take a portion of the chart and then scan the past for situations that are in some sense similar. That tool would also analyze the price movements that occurred afterwards. And what’s best - it would project the outcome of this analysis into your chart, hence giving you a precise picture of what happened retrospectively with your just discovered characteristic chart movement. Instantly you would get answers to questions like:
How often did that scenario occur?
Where did the prices go after, say, 3, 6 and 9 periods? And where are these prices in relation to the current last traded price?
Is there a bias in a certain direction or is it just random?
How much movement did occur in the past to get a feeling for a potential achievable profit and a reasonable stop?
This imaginary tool is available as NanoTrader’s module LiveStatistics. Amongst others it will answer questions like those from above visually and explicitly. As an example, the following screenshot displays the so-called expected trading range computed from the chart movement inside the dashed box:
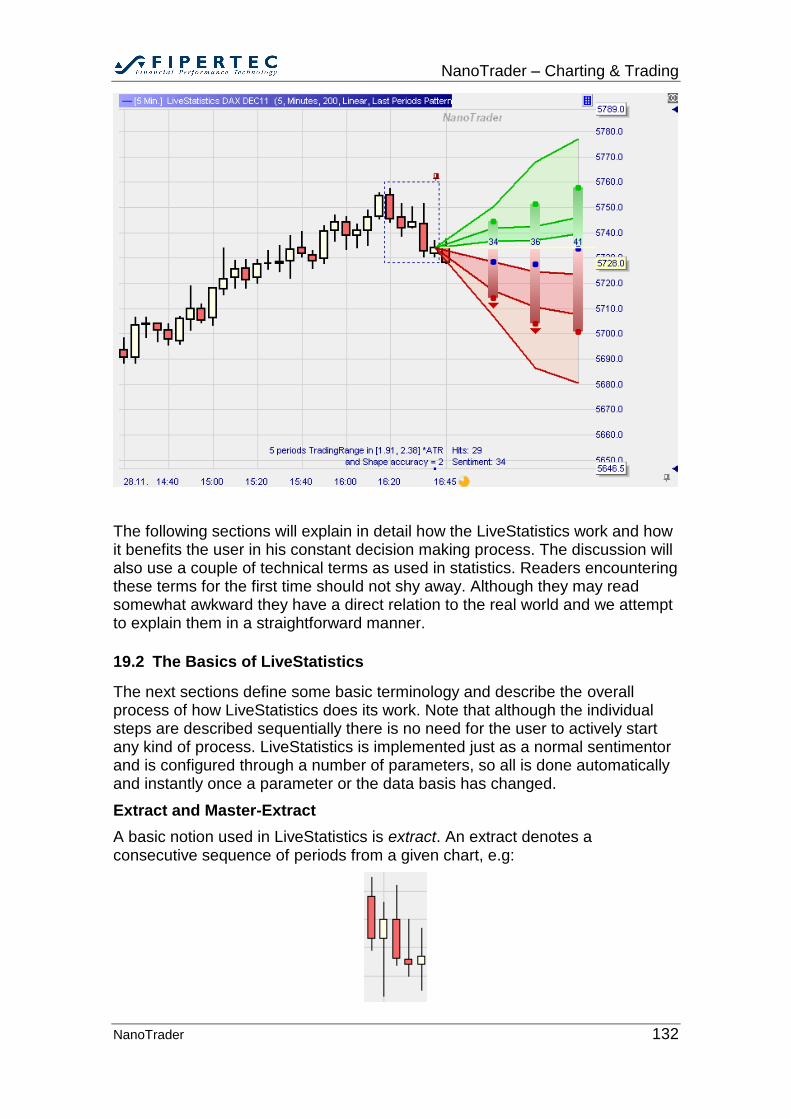
NanoTrader – Charting & Trading
NanoTrader 132
The following sections will explain in detail how the LiveStatistics work and how it benefits the user in his constant decision making process. The discussion will also use a couple of technical terms as used in statistics. Readers encountering these terms for the first time should not shy away. Although they may read somewhat awkward they have a direct relation to the real world and we attempt to explain them in a straightforward manner.
19.2 The Basics of LiveStatistics
The next sections define some basic terminology and describe the overall process of how LiveStatistics does its work. Note that although the individual steps are described sequentially there is no need for the user to actively start any kind of process. LiveStatistics is implemented just as a normal sentimentor and is configured through a number of parameters, so all is done automatically and instantly once a parameter or the data basis has changed.
Extract and Master-Extract
A basic notion used in LiveStatistics is extract. An extract denotes a consecutive sequence of periods from a given chart, e.g:
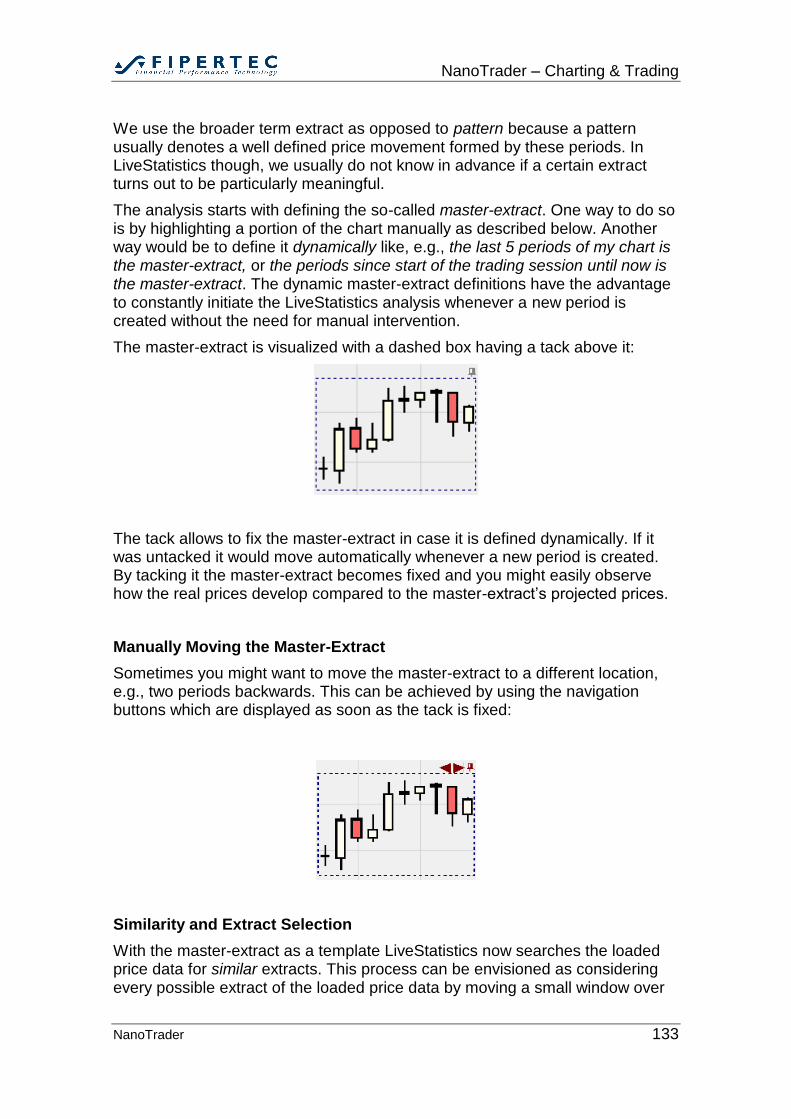
NanoTrader – Charting & Trading
NanoTrader 133
We use the broader term extract as opposed to pattern because a pattern usually denotes a well defined price movement formed by these periods. In LiveStatistics though, we usually do not know in advance if a certain extract turns out to be particularly meaningful.
The analysis starts with defining the so-called master-extract. One way to do so is by highlighting a portion of the chart manually as described below. Another way would be to define it dynamically like, e.g., the last 5 periods of my chart is the master-extract, or the periods since start of the trading session until now is the master-extract. The dynamic master-extract definitions have the advantage to constantly initiate the LiveStatistics analysis whenever a new period is created without the need for manual intervention.
The master-extract is visualized with a dashed box having a tack above it:
The tack allows to fix the master-extract in case it is defined dynamically. If it was untacked it would move automatically whenever a new period is created. By tacking it the master-extract becomes fixed and you might easily observe how the real prices develop compared to the master-extract’s projected prices.
Manually Moving the Master-Extract
Sometimes you might want to move the master-extract to a different location, e.g., two periods backwards. This can be achieved by using the navigation buttons which are displayed as soon as the tack is fixed:
Similarity and Extract Selection
With the master-extract as a template LiveStatistics now searches the loaded price data for similar extracts. This process can be envisioned as considering every possible extract of the loaded price data by moving a small window over
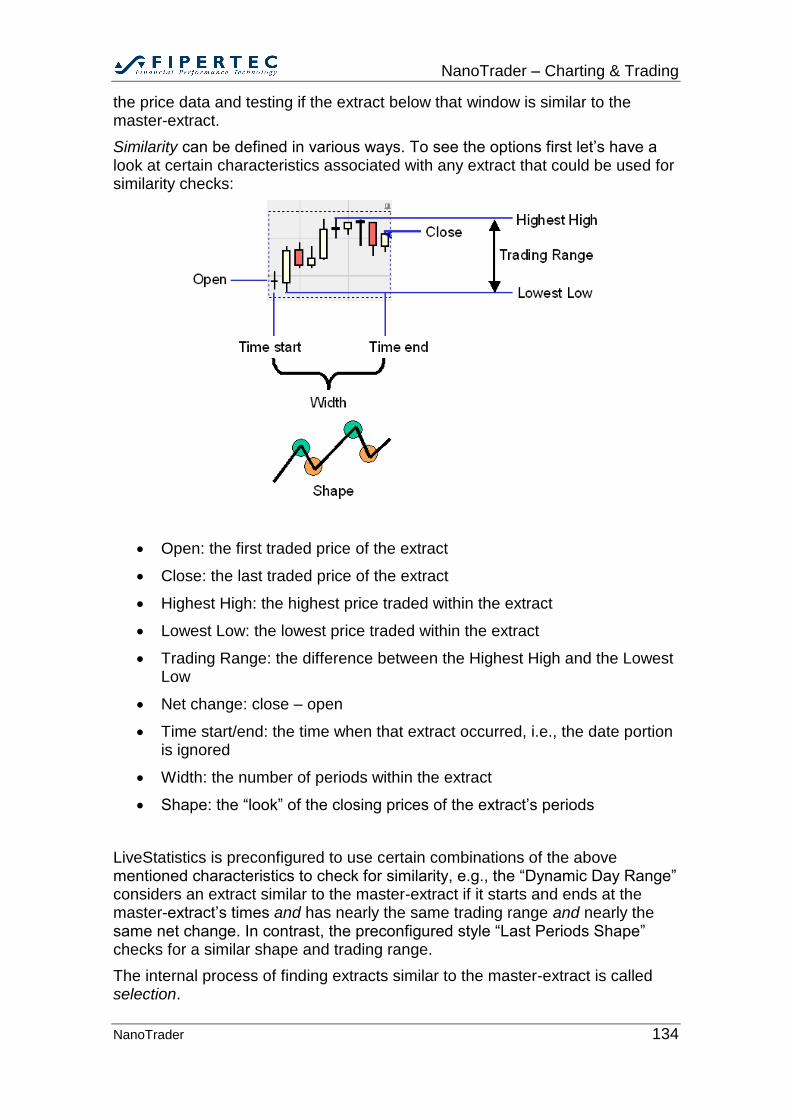
NanoTrader – Charting & Trading
NanoTrader 134
the price data and testing if the extract below that window is similar to the master-extract.
Similarity can be defined in various ways. To see the options first let’s have a look at certain characteristics associated with any extract that could be used for similarity checks:
Open: the first traded price of the extract
Close: the last traded price of the extract
Highest High: the highest price traded within the extract
Lowest Low: the lowest price traded within the extract
Trading Range: the difference between the Highest High and the Lowest Low
Net change: close – open
Time start/end: the time when that extract occurred, i.e., the date portion is ignored
Width: the number of periods within the extract
Shape: the “look” of the closing prices of the extract’s periods
LiveStatistics is preconfigured to use certain combinations of the above mentioned characteristics to check for similarity, e.g., the “Dynamic Day Range” considers an extract similar to the master-extract if it starts and ends at the master-extract’s times and has nearly the same trading range and nearly the same net change. In contrast, the preconfigured style “Last Periods Shape” checks for a similar shape and trading range.
The internal process of finding extracts similar to the master-extract is called selection.
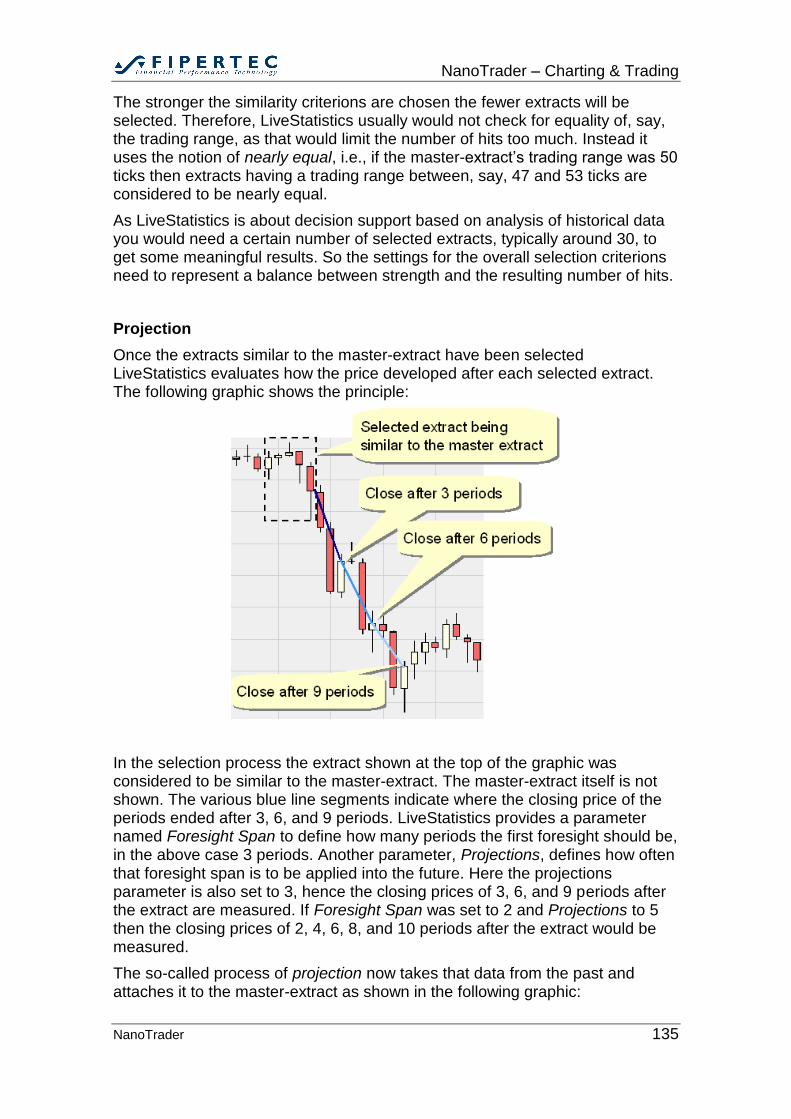
NanoTrader – Charting & Trading
NanoTrader 135
The stronger the similarity criterions are chosen the fewer extracts will be selected. Therefore, LiveStatistics usually would not check for equality of, say, the trading range, as that would limit the number of hits too much. Instead it uses the notion of nearly equal, i.e., if the master-extract’s trading range was 50 ticks then extracts having a trading range between, say, 47 and 53 ticks are considered to be nearly equal.
As LiveStatistics is about decision support based on analysis of historical data you would need a certain number of selected extracts, typically around 30, to get some meaningful results. So the settings for the overall selection criterions need to represent a balance between strength and the resulting number of hits.
Projection
Once the extracts similar to the master-extract have been selected LiveStatistics evaluates how the price developed after each selected extract. The following graphic shows the principle:
In the selection process the extract shown at the top of the graphic was considered to be similar to the master-extract. The master-extract itself is not shown. The various blue line segments indicate where the closing price of the periods ended after 3, 6, and 9 periods. LiveStatistics provides a parameter named Foresight Span to define how many periods the first foresight should be, in the above case 3 periods. Another parameter, Projections, defines how often that foresight span is to be applied into the future. Here the projections parameter is also set to 3, hence the closing prices of 3, 6, and 9 periods after the extract are measured. If Foresight Span was set to 2 and Projections to 5 then the closing prices of 2, 4, 6, 8, and 10 periods after the extract would be measured.
The so-called process of projection now takes that data from the past and attaches it to the master-extract as shown in the following graphic:
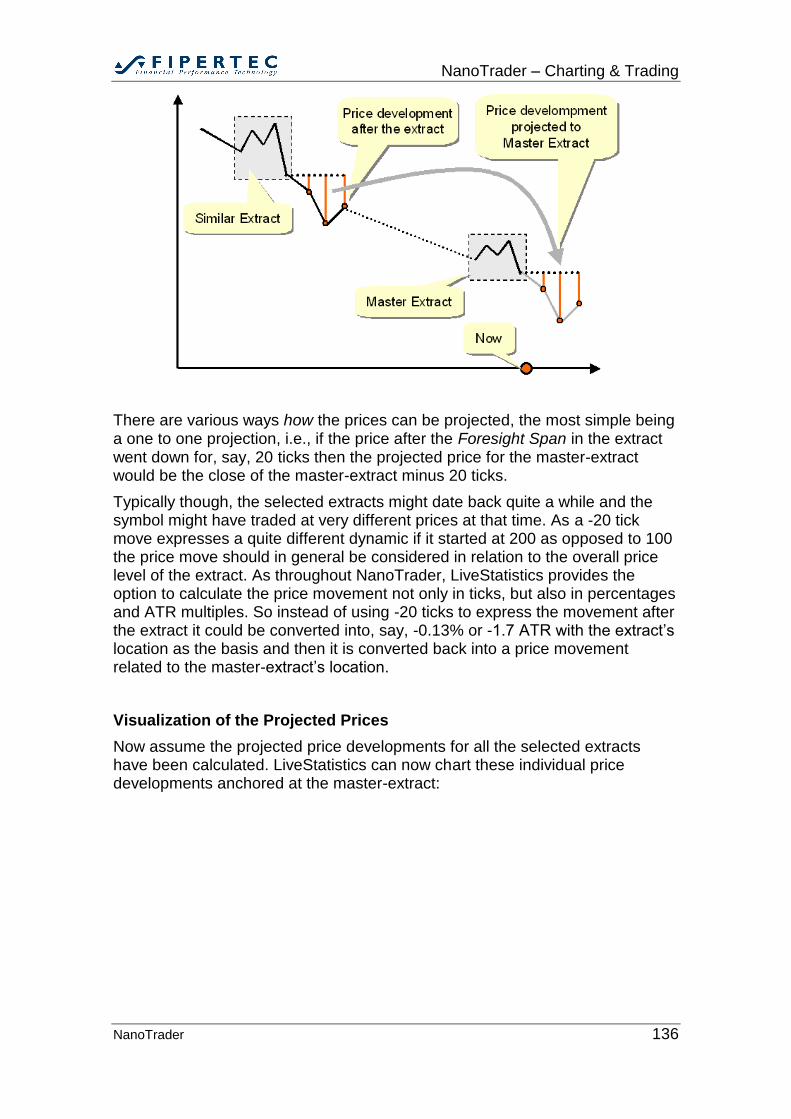
NanoTrader – Charting & Trading
NanoTrader 136
There are various ways how the prices can be projected, the most simple being a one to one projection, i.e., if the price after the Foresight Span in the extract went down for, say, 20 ticks then the projected price for the master-extract would be the close of the master-extract minus 20 ticks.
Typically though, the selected extracts might date back quite a while and the symbol might have traded at very different prices at that time. As a -20 tick move expresses a quite different dynamic if it started at 200 as opposed to 100 the price move should in general be considered in relation to the overall price level of the extract. As throughout NanoTrader, LiveStatistics provides the option to calculate the price movement not only in ticks, but also in percentages and ATR multiples. So instead of using -20 ticks to express the movement after the extract it could be converted into, say, -0.13% or -1.7 ATR with the extract’s location as the basis and then it is converted back into a price movement related to the master-extract’s location.
Visualization of the Projected Prices
Now assume the projected price developments for all the selected extracts have been calculated. LiveStatistics can now chart these individual price developments anchored at the master-extract:
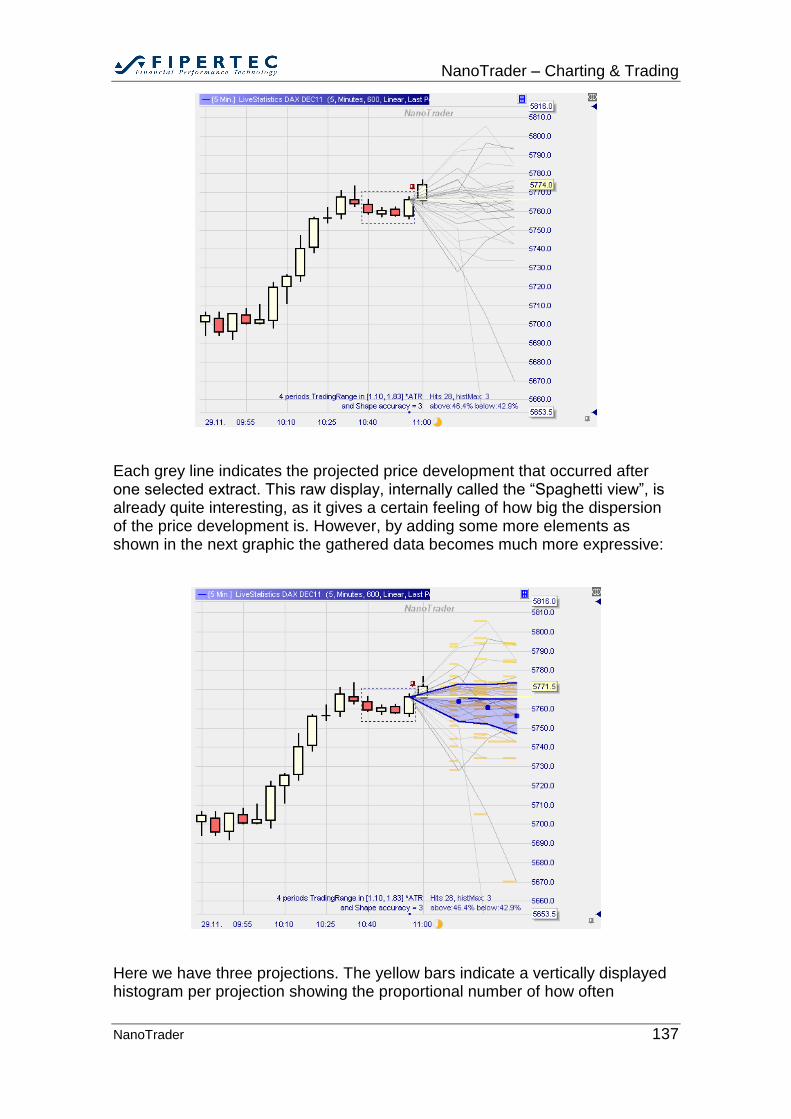
NanoTrader – Charting & Trading
NanoTrader 137
Each grey line indicates the projected price development that occurred after one selected extract. This raw display, internally called the “Spaghetti view”, is already quite interesting, as it gives a certain feeling of how big the dispersion of the price development is. However, by adding some more elements as shown in the next graphic the gathered data becomes much more expressive:
Here we have three projections. The yellow bars indicate a vertically displayed histogram per projection showing the proportional number of how often
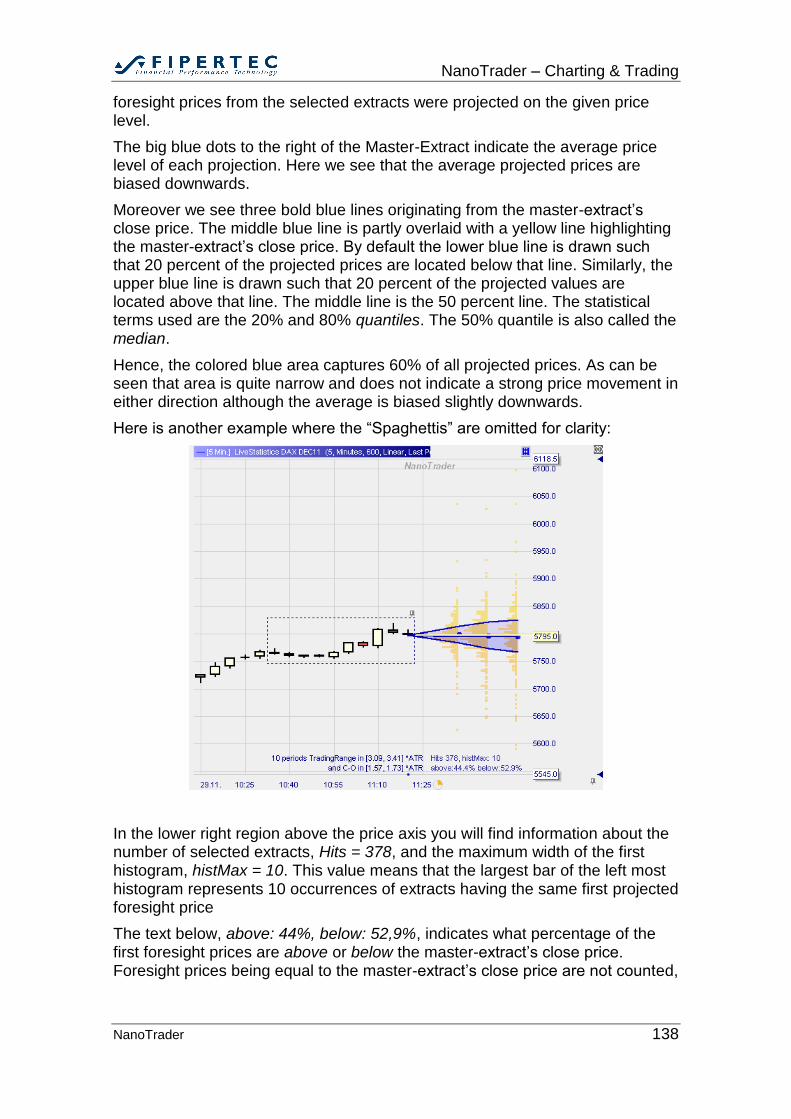
NanoTrader – Charting & Trading
NanoTrader 138
foresight prices from the selected extracts were projected on the given price level.
The big blue dots to the right of the Master-Extract indicate the average price level of each projection. Here we see that the average projected prices are biased downwards.
Moreover we see three bold blue lines originating from the master-extract’s close price. The middle blue line is partly overlaid with a yellow line highlighting the master-extract’s close price. By default the lower blue line is drawn such that 20 percent of the projected prices are located below that line. Similarly, the upper blue line is drawn such that 20 percent of the projected values are located above that line. The middle line is the 50 percent line. The statistical terms used are the 20% and 80% quantiles. The 50% quantile is also called the median.
Hence, the colored blue area captures 60% of all projected prices. As can be seen that area is quite narrow and does not indicate a strong price movement in either direction although the average is biased slightly downwards.
Here is another example where the “Spaghettis” are omitted for clarity:
In the lower right region above the price axis you will find information about the number of selected extracts, Hits = 378, and the maximum width of the first histogram, histMax = 10. This value means that the largest bar of the left most histogram represents 10 occurrences of extracts having the same first projected foresight price
The text below, above: 44%, below: 52,9%, indicates what percentage of the first foresight prices are above or below the master-extract’s close price. Foresight prices being equal to the master-extract’s close price are not counted,
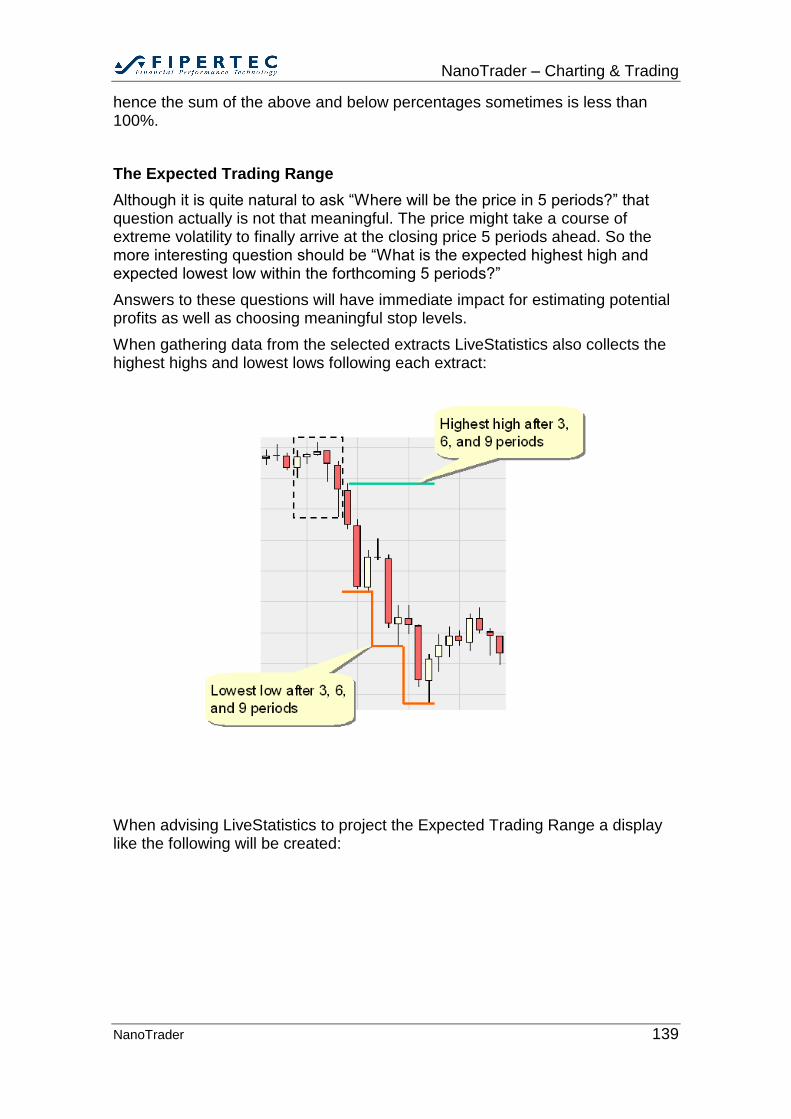
NanoTrader – Charting & Trading
NanoTrader 139
hence the sum of the above and below percentages sometimes is less than 100%.
The Expected Trading Range
Although it is quite natural to ask “Where will be the price in 5 periods?” that question actually is not that meaningful. The price might take a course of extreme volatility to finally arrive at the closing price 5 periods ahead. So the more interesting question should be “What is the expected highest high and expected lowest low within the forthcoming 5 periods?”
Answers to these questions will have immediate impact for estimating potential profits as well as choosing meaningful stop levels.
When gathering data from the selected extracts LiveStatistics also collects the highest highs and lowest lows following each extract:
When advising LiveStatistics to project the Expected Trading Range a display like the following will be created:
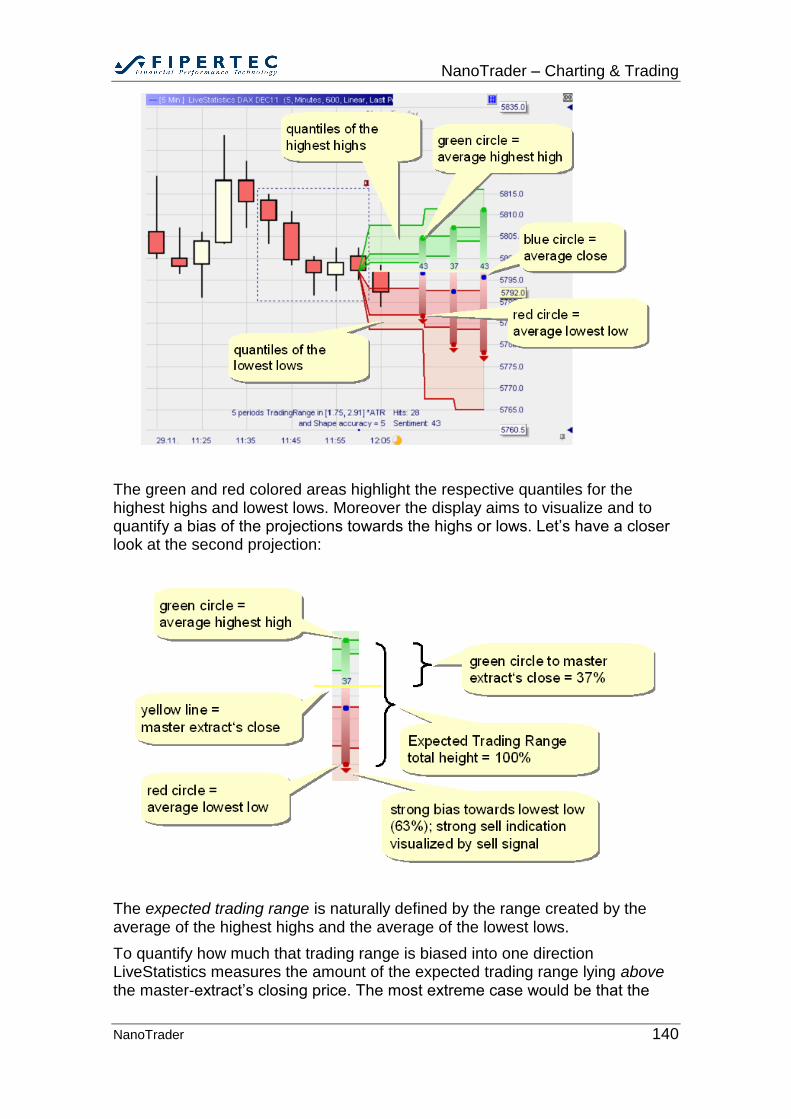
NanoTrader – Charting & Trading
NanoTrader 140
The green and red colored areas highlight the respective quantiles for the highest highs and lowest lows. Moreover the display aims to visualize and to quantify a bias of the projections towards the highs or lows. Let’s have a closer look at the second projection:
The expected trading range is naturally defined by the range created by the average of the highest highs and the average of the lowest lows.
To quantify how much that trading range is biased into one direction LiveStatistics measures the amount of the expected trading range lying above the master-extract’s closing price. The most extreme case would be that the
NanoTrader – Charting & Trading
NanoTrader 141
complete expected trading range, i.e., 100% of that range, is located above the master-extract’s closing price. This would lead to a quantification value of 100. If it was located completely below the master-extract’s close the value would be 0.
This quantification in the range from 0 to 100 is inline with NanoTrader’s general usage of sentiments as 100 indicates the most bullish sentiment and 0 the most bearish sentiment. In the above case only 37% of the expected trading range are above the master-extract’s close price, equaling a sentiment of 37. This is considered to be a quite bearish situation and hence a sell signal is displayed below the expected trading range.
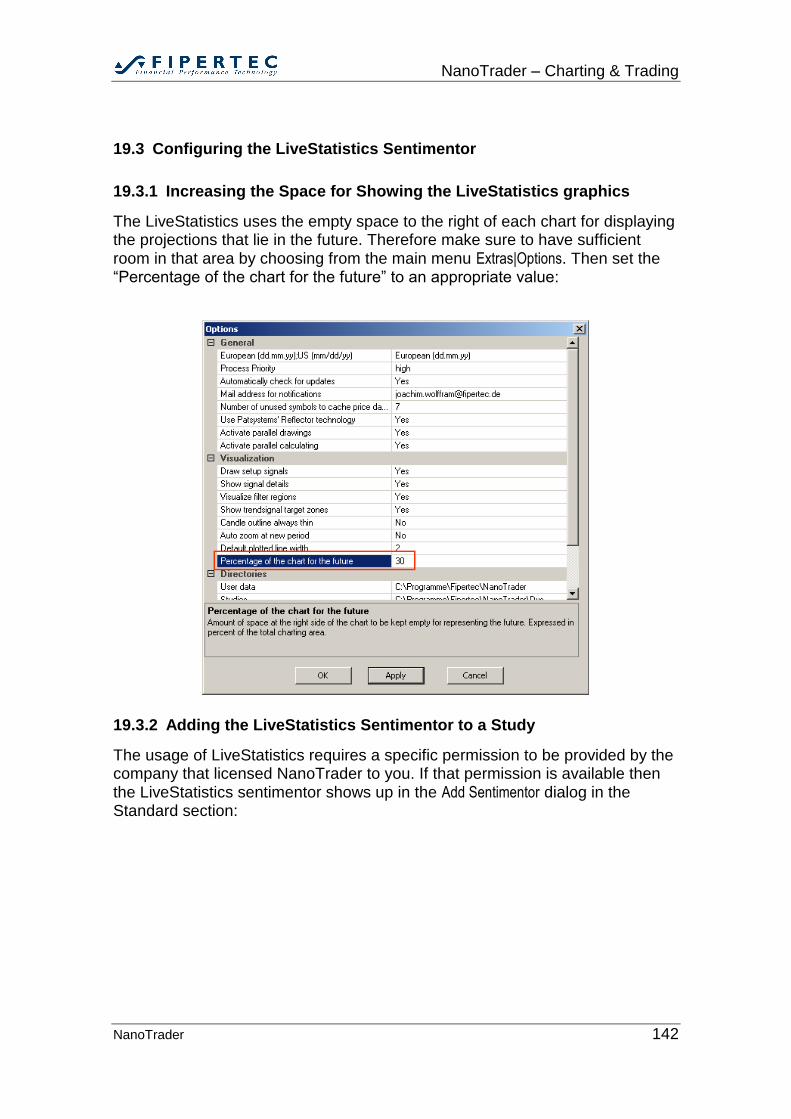
NanoTrader – Charting & Trading
NanoTrader 142
19.3 Configuring the LiveStatistics Sentimentor
19.3.1 Increasing the Space for Showing the LiveStatistics graphics
The LiveStatistics uses the empty space to the right of each chart for displaying the projections that lie in the future. Therefore make sure to have sufficient room in that area by choosing from the main menu Extras|Options. Then set the “Percentage of the chart for the future” to an appropriate value:
19.3.2 Adding the LiveStatistics Sentimentor to a Study
The usage of LiveStatistics requires a specific permission to be provided by the company that licensed NanoTrader to you. If that permission is available then the LiveStatistics sentimentor shows up in the Add Sentimentor dialog in the Standard section:
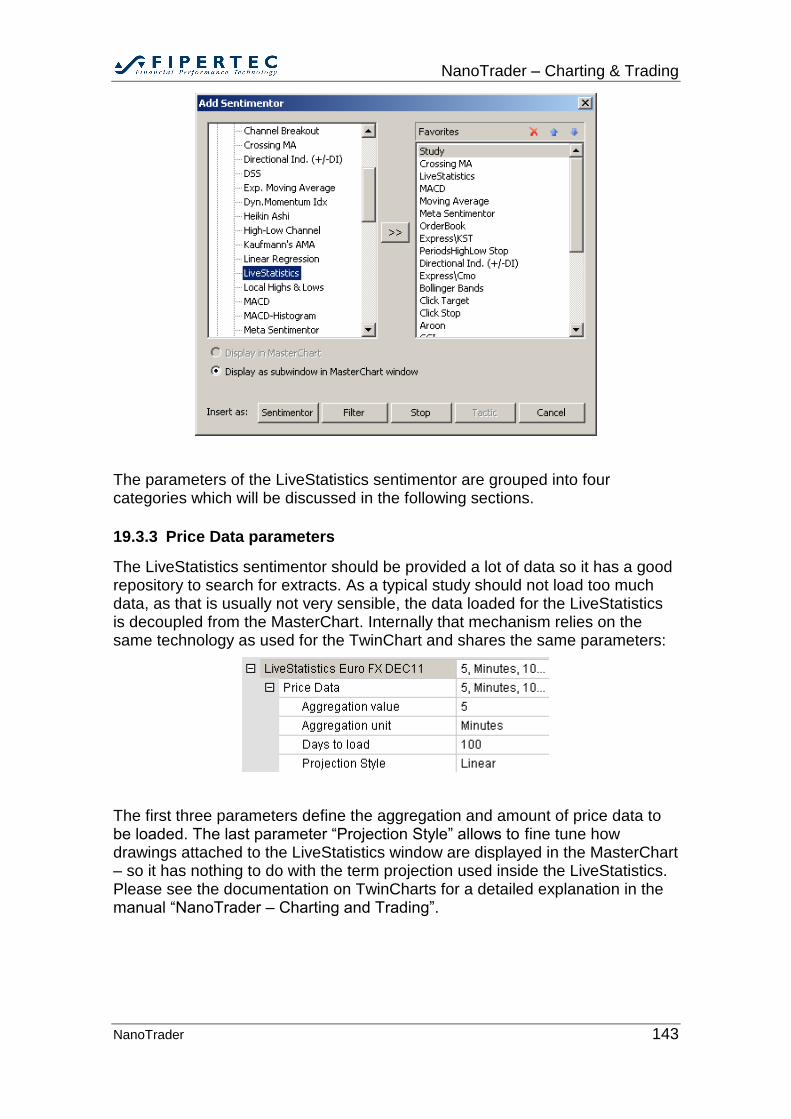
NanoTrader – Charting & Trading
NanoTrader 143
The parameters of the LiveStatistics sentimentor are grouped into four categories which will be discussed in the following sections.
19.3.3 Price Data parameters
The LiveStatistics sentimentor should be provided a lot of data so it has a good repository to search for extracts. As a typical study should not load too much data, as that is usually not very sensible, the data loaded for the LiveStatistics is decoupled from the MasterChart. Internally that mechanism relies on the same technology as used for the TwinChart and shares the same parameters:
The first three parameters define the aggregation and amount of price data to be loaded. The last parameter “Projection Style” allows to fine tune how drawings attached to the LiveStatistics window are displayed in the MasterChart – so it has nothing to do with the term projection used inside the LiveStatistics. Please see the documentation on TwinCharts for a detailed explanation in the manual “NanoTrader – Charting and Trading”.
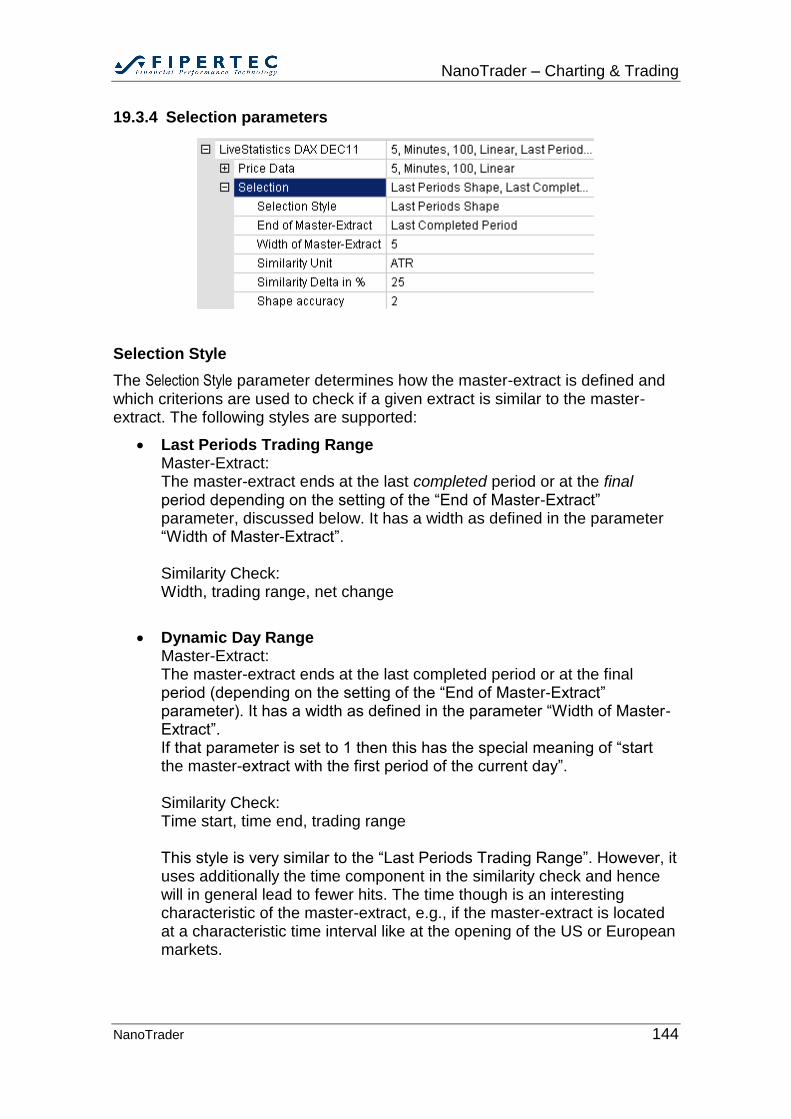
NanoTrader – Charting & Trading
NanoTrader 144
19.3.4 Selection parameters
Selection Style
The Selection Style parameter determines how the master-extract is defined and which criterions are used to check if a given extract is similar to the master-extract. The following styles are supported:
Last Periods Trading Range Master-Extract: The master-extract ends at the last completed period or at the final period depending on the setting of the “End of Master-Extract” parameter, discussed below. It has a width as defined in the parameter “Width of Master-Extract”. Similarity Check: Width, trading range, net change
Dynamic Day Range Master-Extract: The master-extract ends at the last completed period or at the final period (depending on the setting of the “End of Master-Extract” parameter). It has a width as defined in the parameter “Width of Master-Extract”. If that parameter is set to 1 then this has the special meaning of “start the master-extract with the first period of the current day”. Similarity Check: Time start, time end, trading range This style is very similar to the “Last Periods Trading Range”. However, it uses additionally the time component in the similarity check and hence will in general lead to fewer hits. The time though is an interesting characteristic of the master-extract, e.g., if the master-extract is located at a characteristic time interval like at the opening of the US or European markets.
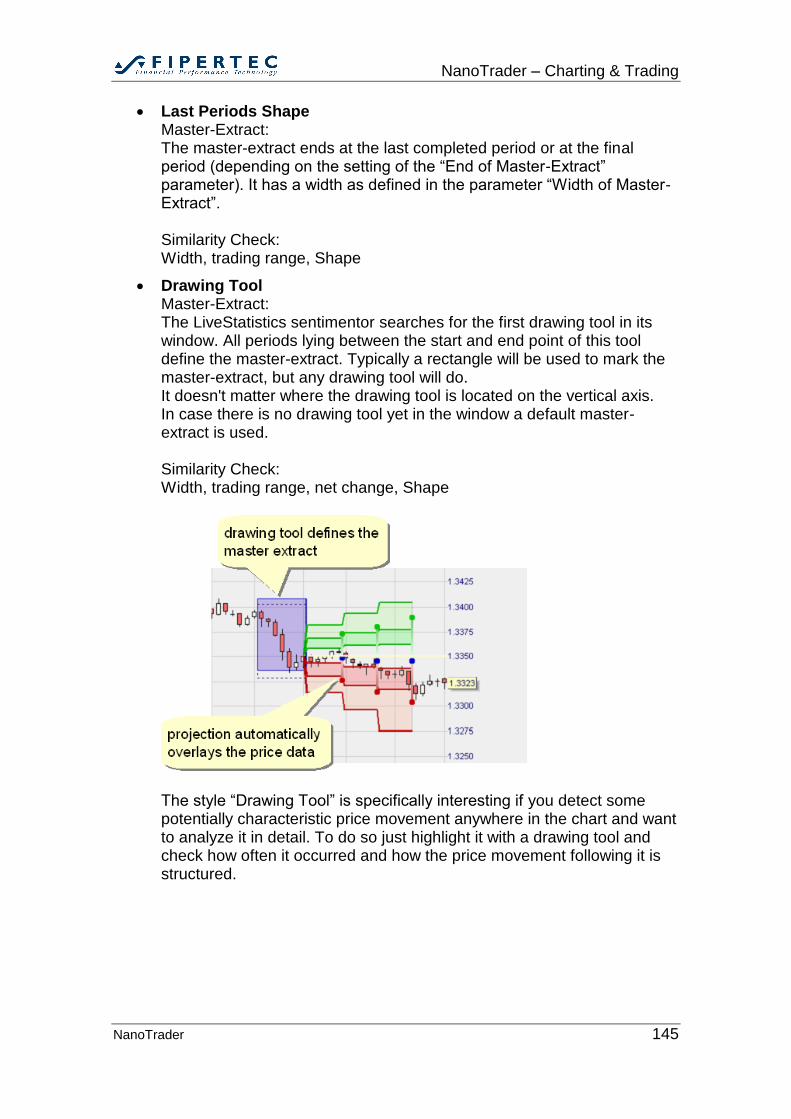
NanoTrader – Charting & Trading
NanoTrader 145
Last Periods Shape Master-Extract: The master-extract ends at the last completed period or at the final period (depending on the setting of the “End of Master-Extract” parameter). It has a width as defined in the parameter “Width of Master-Extract”. Similarity Check: Width, trading range, Shape
Drawing Tool Master-Extract: The LiveStatistics sentimentor searches for the first drawing tool in its window. All periods lying between the start and end point of this tool define the master-extract. Typically a rectangle will be used to mark the master-extract, but any drawing tool will do. It doesn't matter where the drawing tool is located on the vertical axis. In case there is no drawing tool yet in the window a default master-extract is used. Similarity Check: Width, trading range, net change, Shape
The style “Drawing Tool” is specifically interesting if you detect some potentially characteristic price movement anywhere in the chart and want to analyze it in detail. To do so just highlight it with a drawing tool and check how often it occurred and how the price movement following it is structured.
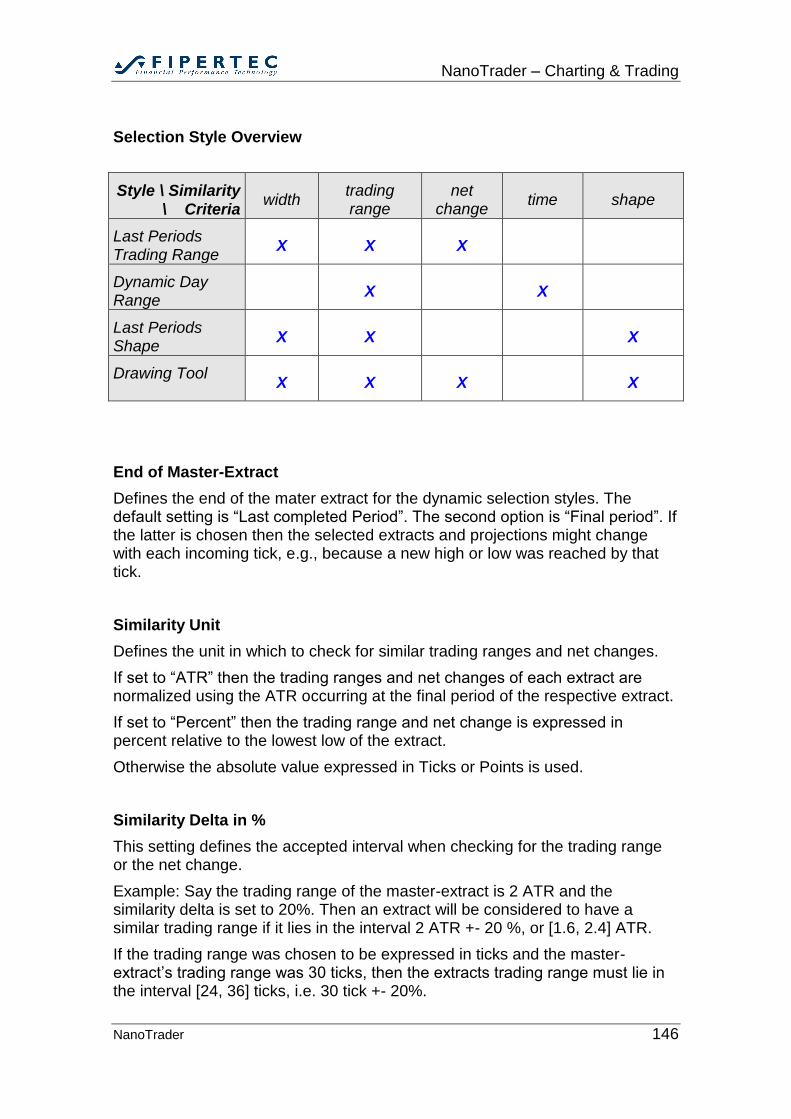
NanoTrader – Charting & Trading
NanoTrader 146
Selection Style Overview
Style \ Similarity \ Criteria
width trading range
net change
time shape
Last Periods Trading Range
X X X
Dynamic Day Range
X X
Last Periods Shape
X X X
Drawing Tool
X X X X
End of Master-Extract
Defines the end of the mater extract for the dynamic selection styles. The default setting is “Last completed Period”. The second option is “Final period”. If the latter is chosen then the selected extracts and projections might change with each incoming tick, e.g., because a new high or low was reached by that tick.
Similarity Unit
Defines the unit in which to check for similar trading ranges and net changes.
If set to “ATR” then the trading ranges and net changes of each extract are normalized using the ATR occurring at the final period of the respective extract.
If set to “Percent” then the trading range and net change is expressed in percent relative to the lowest low of the extract.
Otherwise the absolute value expressed in Ticks or Points is used.
Similarity Delta in %
This setting defines the accepted interval when checking for the trading range or the net change.
Example: Say the trading range of the master-extract is 2 ATR and the similarity delta is set to 20%. Then an extract will be considered to have a similar trading range if it lies in the interval 2 ATR +- 20 %, or [1.6, 2.4] ATR.
If the trading range was chosen to be expressed in ticks and the master-extract’s trading range was 30 ticks, then the extracts trading range must lie in the interval [24, 36] ticks, i.e. 30 tick +- 20%.
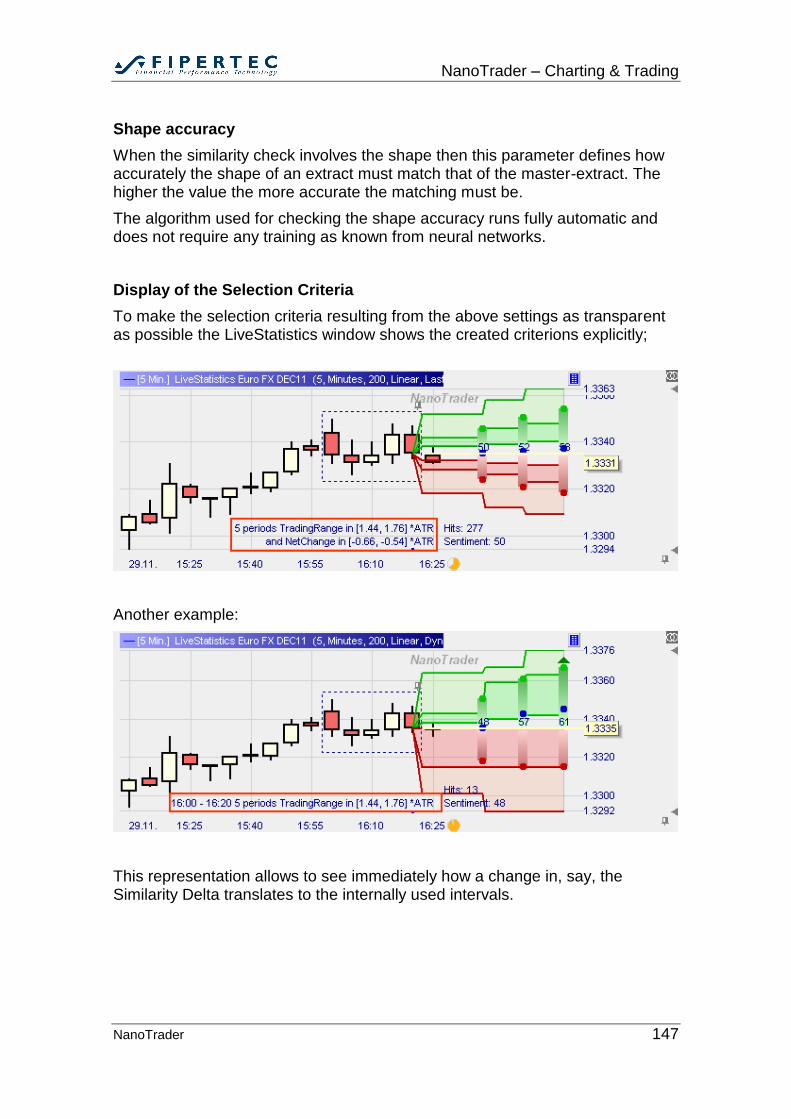
NanoTrader – Charting & Trading
NanoTrader 147
Shape accuracy
When the similarity check involves the shape then this parameter defines how accurately the shape of an extract must match that of the master-extract. The higher the value the more accurate the matching must be.
The algorithm used for checking the shape accuracy runs fully automatic and does not require any training as known from neural networks.
Display of the Selection Criteria
To make the selection criteria resulting from the above settings as transparent as possible the LiveStatistics window shows the created criterions explicitly;
Another example:
This representation allows to see immediately how a change in, say, the Similarity Delta translates to the internally used intervals.
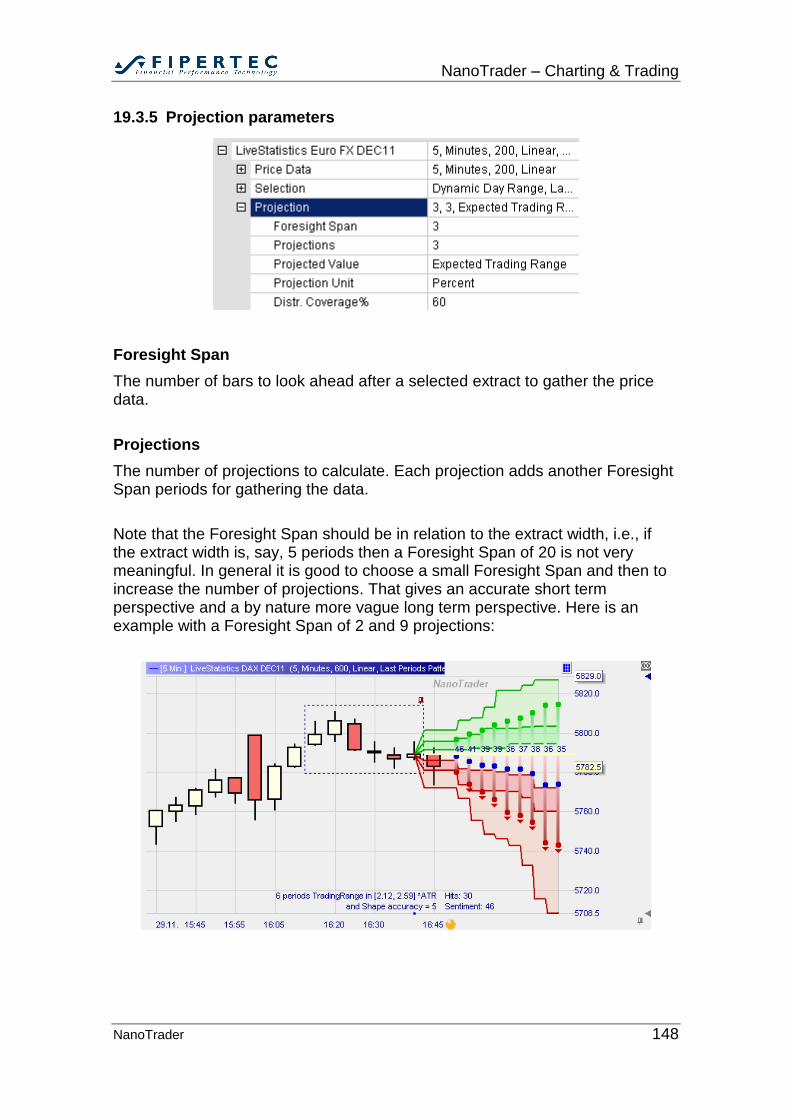
NanoTrader – Charting & Trading
NanoTrader 148
19.3.5 Projection parameters
Foresight Span
The number of bars to look ahead after a selected extract to gather the price data.
Projections
The number of projections to calculate. Each projection adds another Foresight Span periods for gathering the data.
Note that the Foresight Span should be in relation to the extract width, i.e., if the extract width is, say, 5 periods then a Foresight Span of 20 is not very meaningful. In general it is good to choose a small Foresight Span and then to increase the number of projections. That gives an accurate short term perspective and a by nature more vague long term perspective. Here is an example with a Foresight Span of 2 and 9 projections:
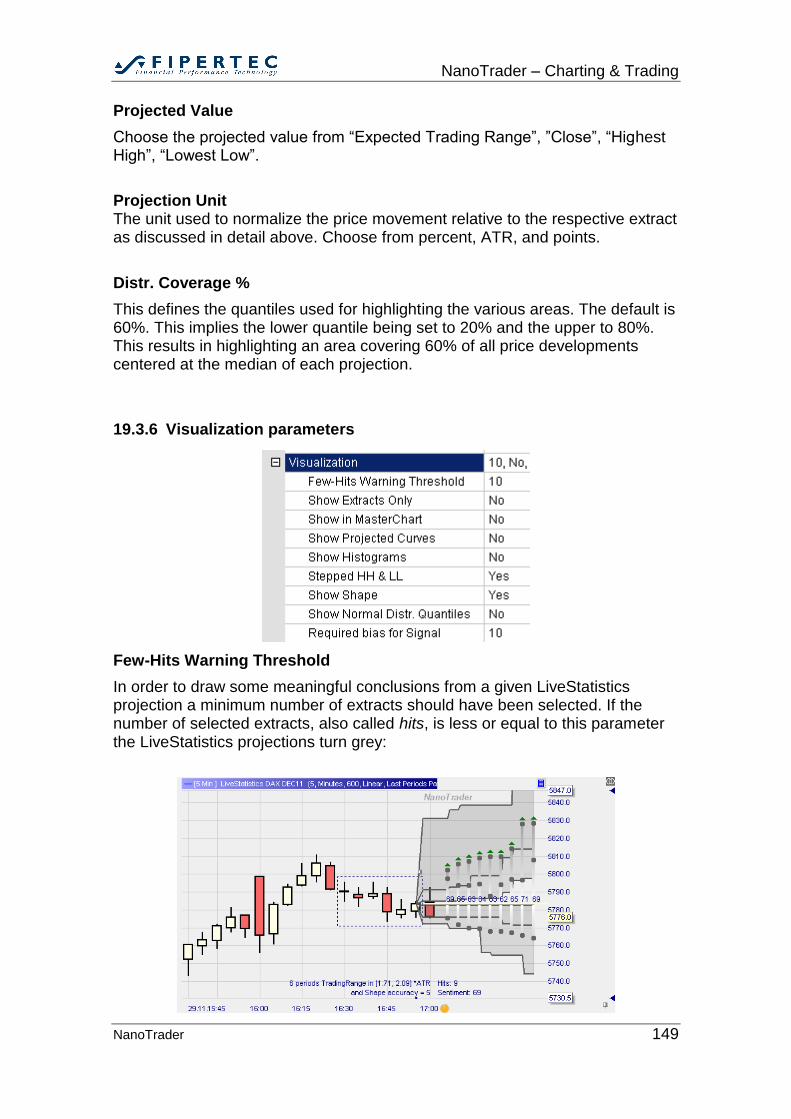
NanoTrader – Charting & Trading
NanoTrader 149
Projected Value
Choose the projected value from “Expected Trading Range”, ”Close”, “Highest High”, “Lowest Low”.
Projection Unit The unit used to normalize the price movement relative to the respective extract as discussed in detail above. Choose from percent, ATR, and points.
Distr. Coverage %
This defines the quantiles used for highlighting the various areas. The default is 60%. This implies the lower quantile being set to 20% and the upper to 80%. This results in highlighting an area covering 60% of all price developments centered at the median of each projection.
19.3.6 Visualization parameters
Few-Hits Warning Threshold
In order to draw some meaningful conclusions from a given LiveStatistics projection a minimum number of extracts should have been selected. If the number of selected extracts, also called hits, is less or equal to this parameter the LiveStatistics projections turn grey:
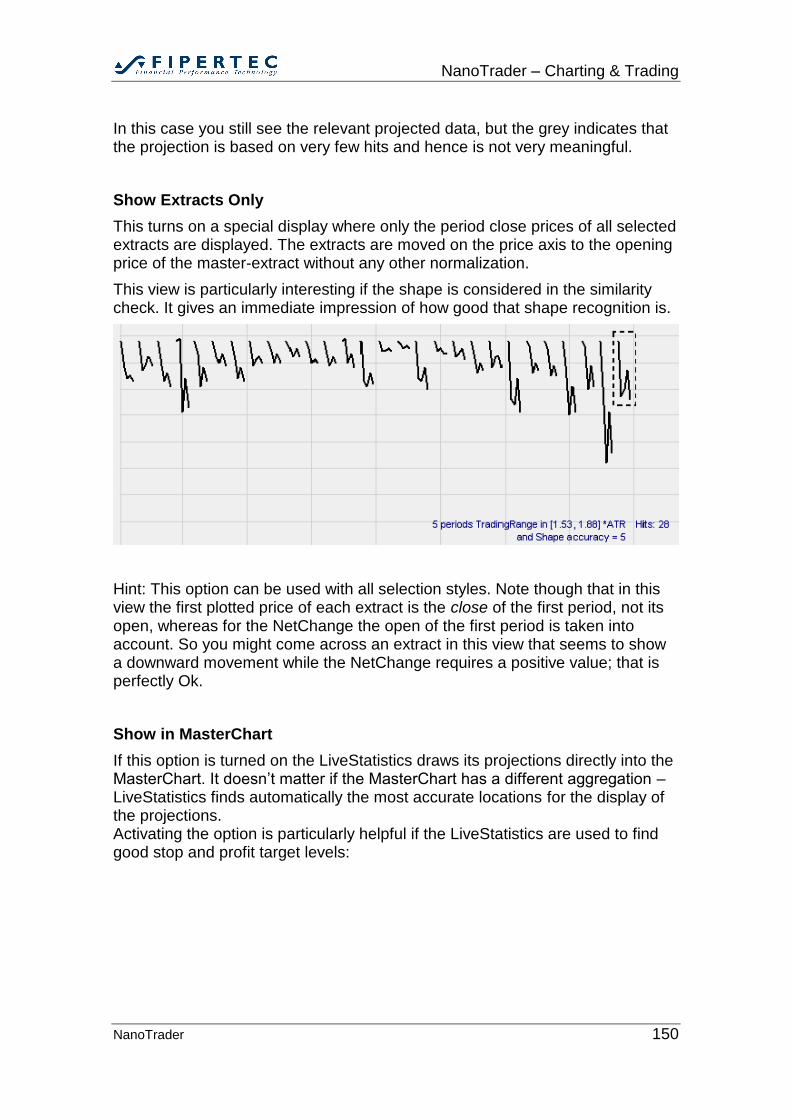
NanoTrader – Charting & Trading
NanoTrader 150
In this case you still see the relevant projected data, but the grey indicates that the projection is based on very few hits and hence is not very meaningful.
Show Extracts Only
This turns on a special display where only the period close prices of all selected extracts are displayed. The extracts are moved on the price axis to the opening price of the master-extract without any other normalization.
This view is particularly interesting if the shape is considered in the similarity check. It gives an immediate impression of how good that shape recognition is.
Hint: This option can be used with all selection styles. Note though that in this view the first plotted price of each extract is the close of the first period, not its open, whereas for the NetChange the open of the first period is taken into account. So you might come across an extract in this view that seems to show a downward movement while the NetChange requires a positive value; that is perfectly Ok.
Show in MasterChart
If this option is turned on the LiveStatistics draws its projections directly into the MasterChart. It doesn’t matter if the MasterChart has a different aggregation – LiveStatistics finds automatically the most accurate locations for the display of the projections. Activating the option is particularly helpful if the LiveStatistics are used to find good stop and profit target levels:
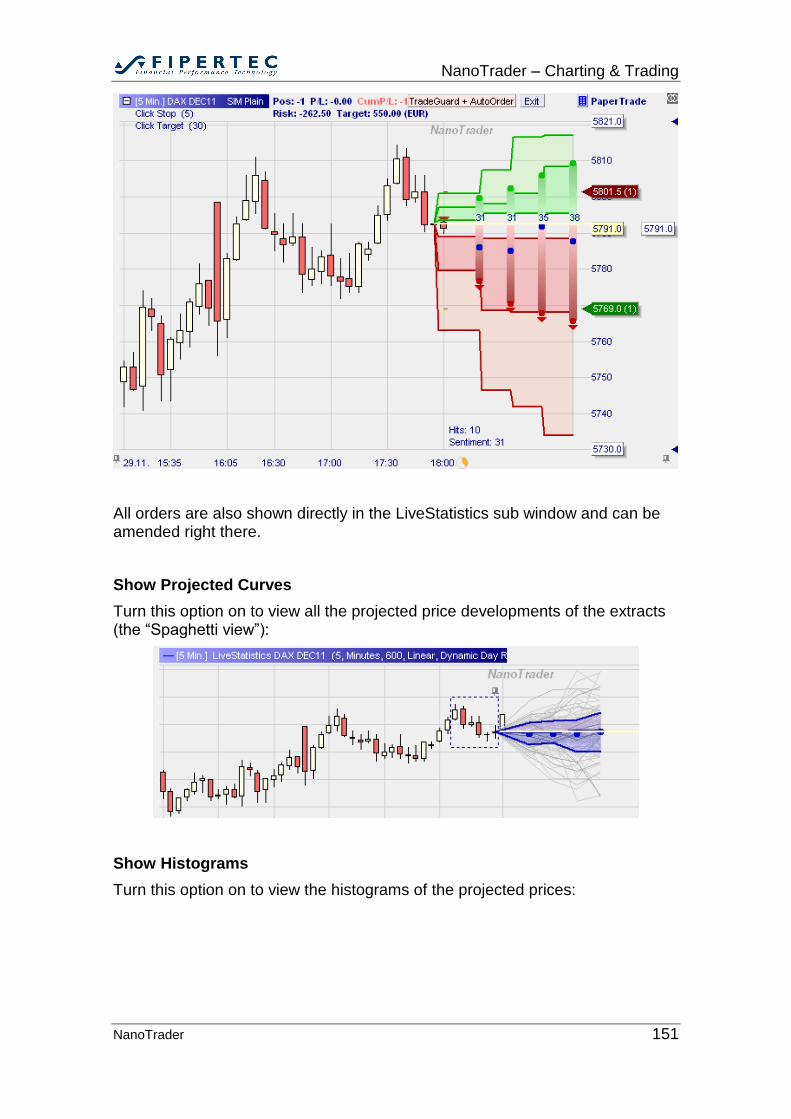
NanoTrader – Charting & Trading
NanoTrader 151
All orders are also shown directly in the LiveStatistics sub window and can be amended right there.
Show Projected Curves
Turn this option on to view all the projected price developments of the extracts (the “Spaghetti view”):
Show Histograms
Turn this option on to view the histograms of the projected prices:
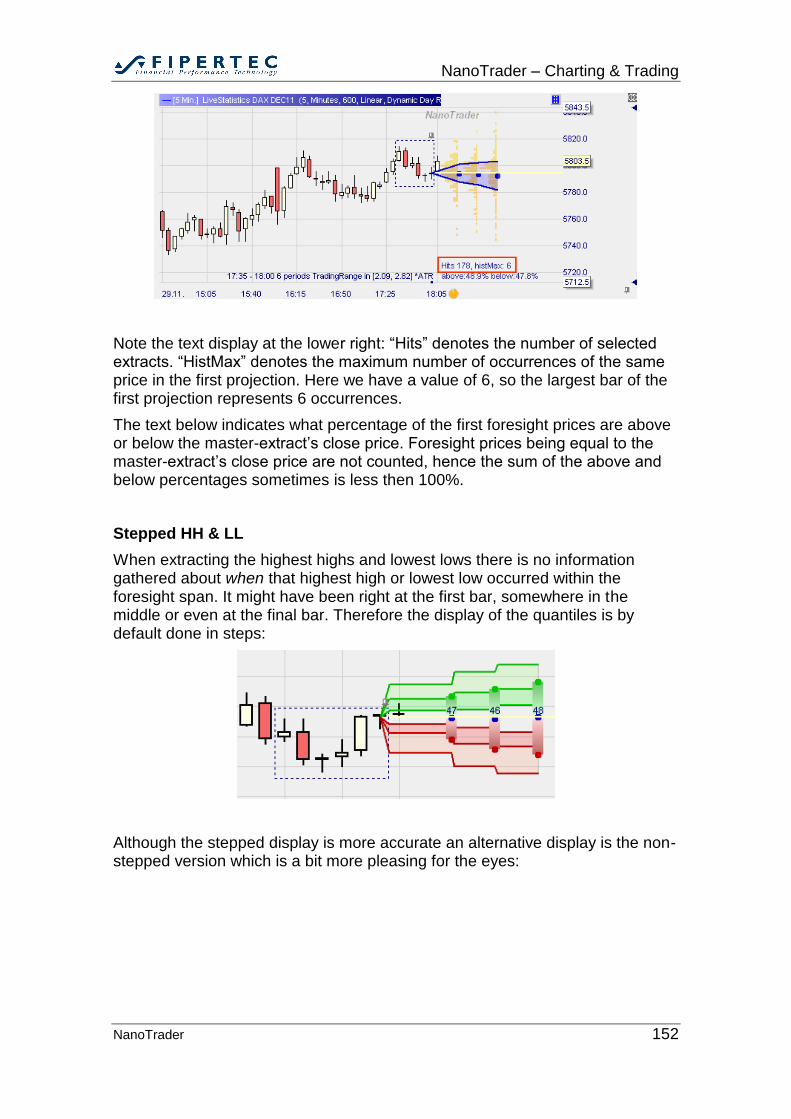
NanoTrader – Charting & Trading
NanoTrader 152
Note the text display at the lower right: “Hits” denotes the number of selected extracts. “HistMax” denotes the maximum number of occurrences of the same price in the first projection. Here we have a value of 6, so the largest bar of the first projection represents 6 occurrences.
The text below indicates what percentage of the first foresight prices are above or below the master-extract’s close price. Foresight prices being equal to the master-extract’s close price are not counted, hence the sum of the above and below percentages sometimes is less then 100%.
Stepped HH & LL
When extracting the highest highs and lowest lows there is no information gathered about when that highest high or lowest low occurred within the foresight span. It might have been right at the first bar, somewhere in the middle or even at the final bar. Therefore the display of the quantiles is by default done in steps:
Although the stepped display is more accurate an alternative display is the non-stepped version which is a bit more pleasing for the eyes:
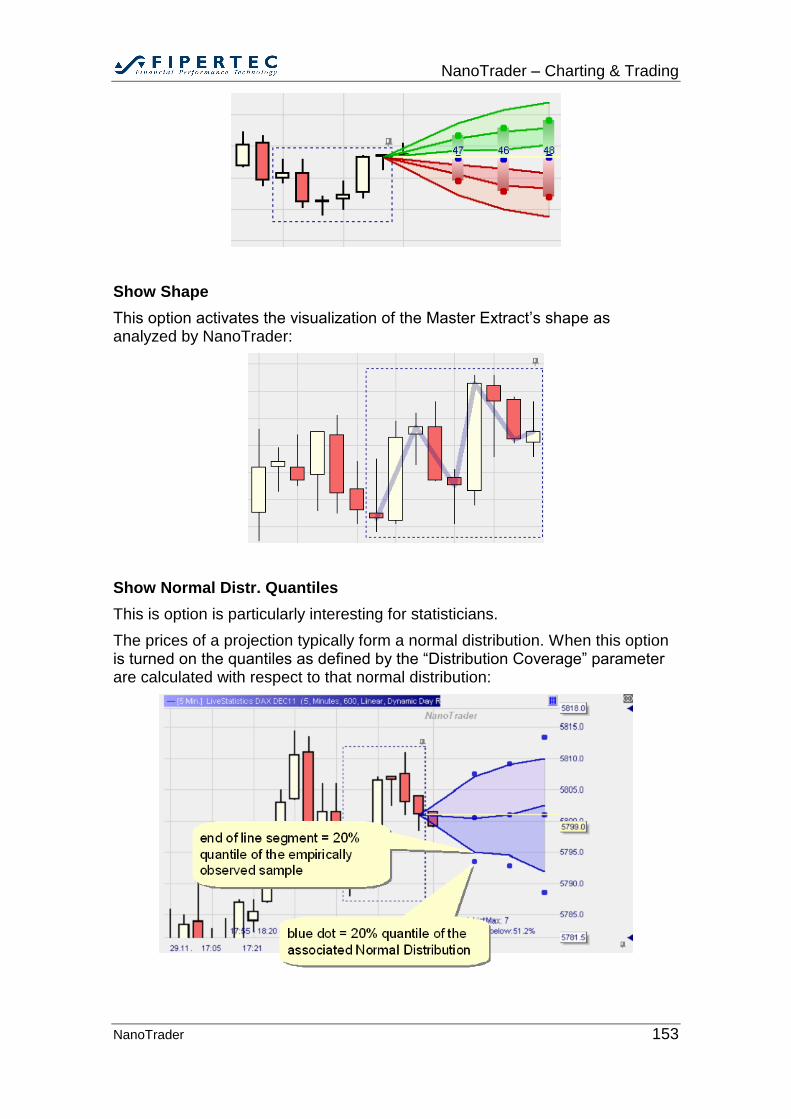
NanoTrader – Charting & Trading
NanoTrader 153
Show Shape
This option activates the visualization of the Master Extract’s shape as analyzed by NanoTrader:
Show Normal Distr. Quantiles
This is option is particularly interesting for statisticians.
The prices of a projection typically form a normal distribution. When this option is turned on the quantiles as defined by the “Distribution Coverage” parameter are calculated with respect to that normal distribution:
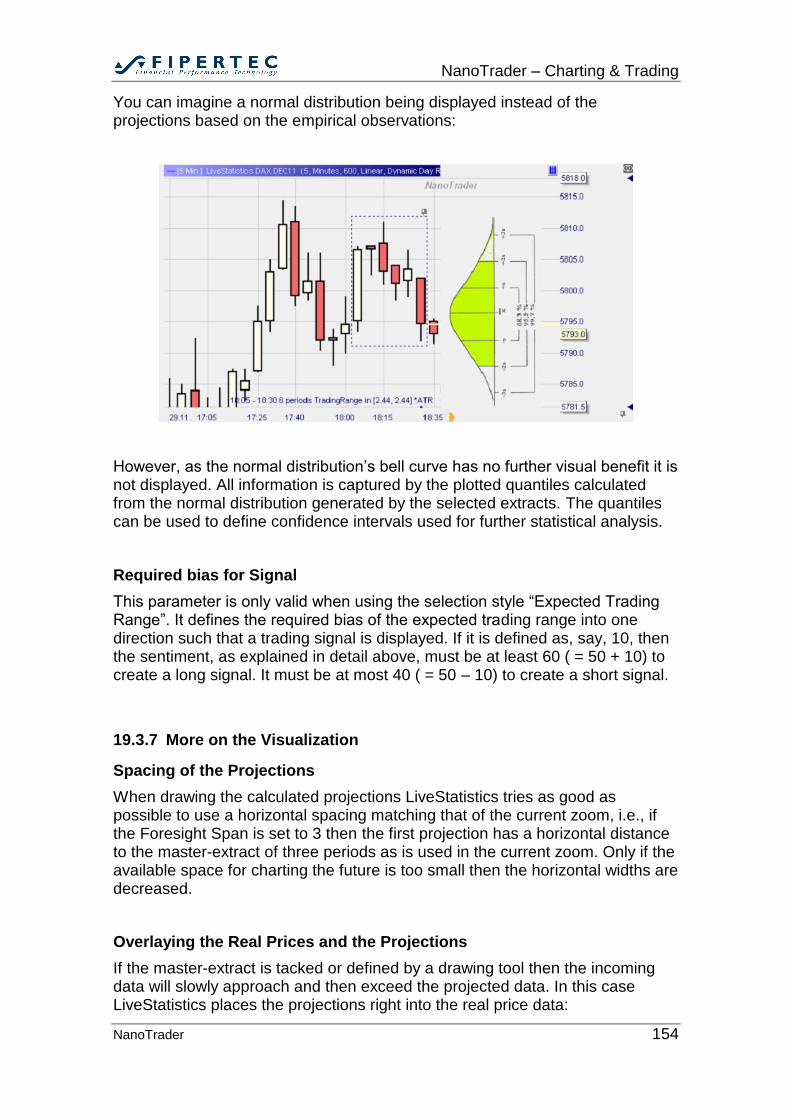
NanoTrader – Charting & Trading
NanoTrader 154
You can imagine a normal distribution being displayed instead of the projections based on the empirical observations:
However, as the normal distribution’s bell curve has no further visual benefit it is not displayed. All information is captured by the plotted quantiles calculated from the normal distribution generated by the selected extracts. The quantiles can be used to define confidence intervals used for further statistical analysis.
Required bias for Signal
This parameter is only valid when using the selection style “Expected Trading Range”. It defines the required bias of the expected trading range into one direction such that a trading signal is displayed. If it is defined as, say, 10, then the sentiment, as explained in detail above, must be at least 60 ( = 50 + 10) to create a long signal. It must be at most 40 ( = 50 – 10) to create a short signal.
19.3.7 More on the Visualization
Spacing of the Projections
When drawing the calculated projections LiveStatistics tries as good as possible to use a horizontal spacing matching that of the current zoom, i.e., if the Foresight Span is set to 3 then the first projection has a horizontal distance to the master-extract of three periods as is used in the current zoom. Only if the available space for charting the future is too small then the horizontal widths are decreased.
Overlaying the Real Prices and the Projections
If the master-extract is tacked or defined by a drawing tool then the incoming data will slowly approach and then exceed the projected data. In this case LiveStatistics places the projections right into the real price data:
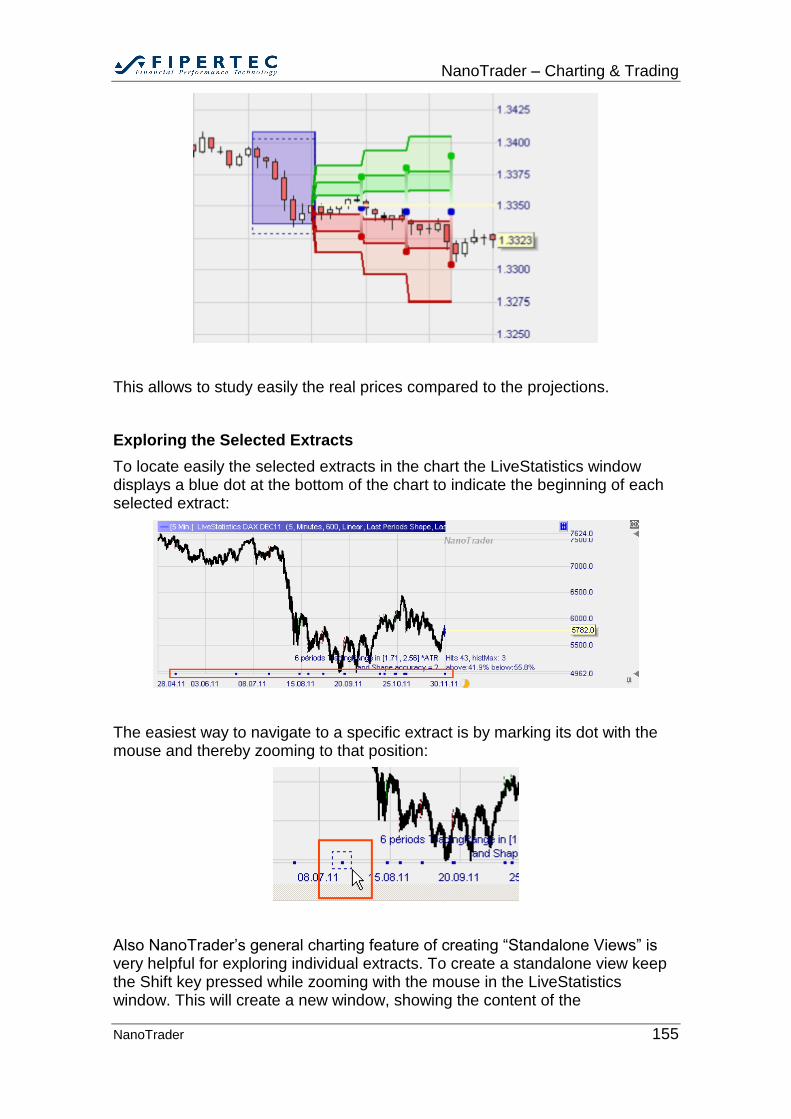
NanoTrader – Charting & Trading
NanoTrader 155
This allows to study easily the real prices compared to the projections.
Exploring the Selected Extracts
To locate easily the selected extracts in the chart the LiveStatistics window displays a blue dot at the bottom of the chart to indicate the beginning of each selected extract:
The easiest way to navigate to a specific extract is by marking its dot with the mouse and thereby zooming to that position:
Also NanoTrader’s general charting feature of creating “Standalone Views” is very helpful for exploring individual extracts. To create a standalone view keep the Shift key pressed while zooming with the mouse in the LiveStatistics window. This will create a new window, showing the content of the
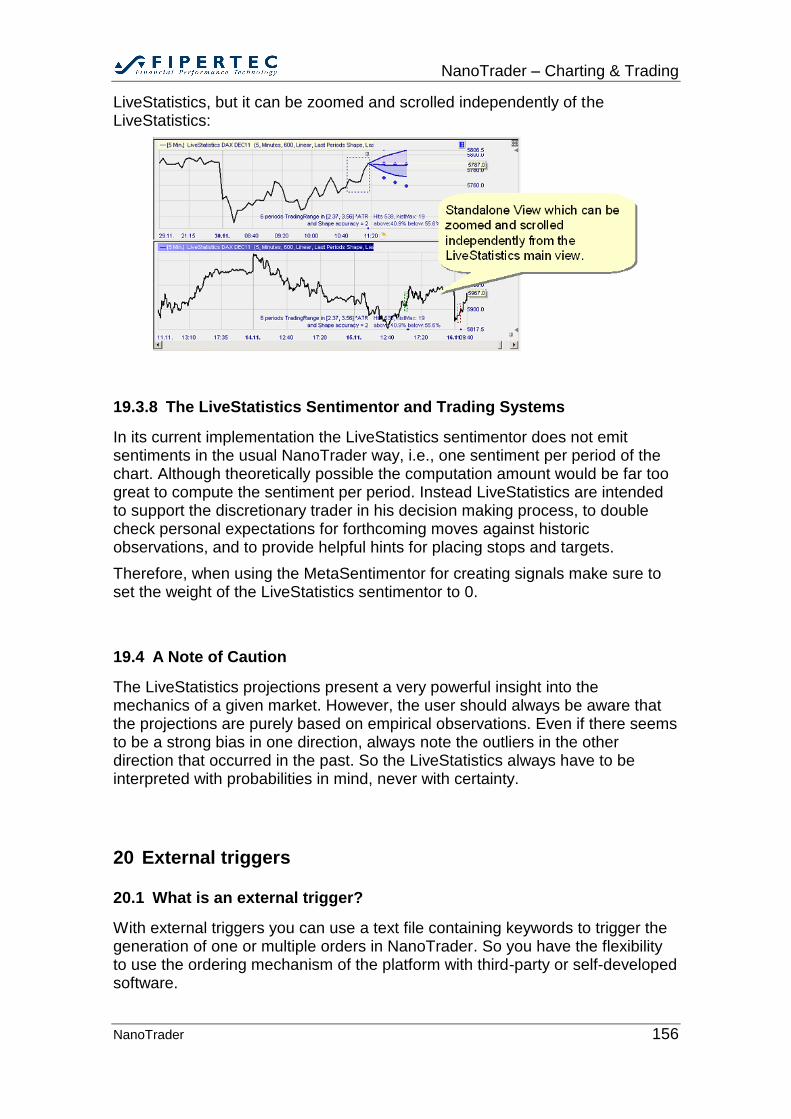
NanoTrader – Charting & Trading
NanoTrader 156
LiveStatistics, but it can be zoomed and scrolled independently of the LiveStatistics:
19.3.8 The LiveStatistics Sentimentor and Trading Systems
In its current implementation the LiveStatistics sentimentor does not emit sentiments in the usual NanoTrader way, i.e., one sentiment per period of the chart. Although theoretically possible the computation amount would be far too great to compute the sentiment per period. Instead LiveStatistics are intended to support the discretionary trader in his decision making process, to double check personal expectations for forthcoming moves against historic observations, and to provide helpful hints for placing stops and targets.
Therefore, when using the MetaSentimentor for creating signals make sure to set the weight of the LiveStatistics sentimentor to 0.
19.4 A Note of Caution
The LiveStatistics projections present a very powerful insight into the mechanics of a given market. However, the user should always be aware that the projections are purely based on empirical observations. Even if there seems to be a strong bias in one direction, always note the outliers in the other direction that occurred in the past. So the LiveStatistics always have to be interpreted with probabilities in mind, never with certainty.
20 External triggers
20.1 What is an external trigger?
With external triggers you can use a text file containing keywords to trigger the generation of one or multiple orders in NanoTrader. So you have the flexibility to use the ordering mechanism of the platform with third-party or self-developed software.
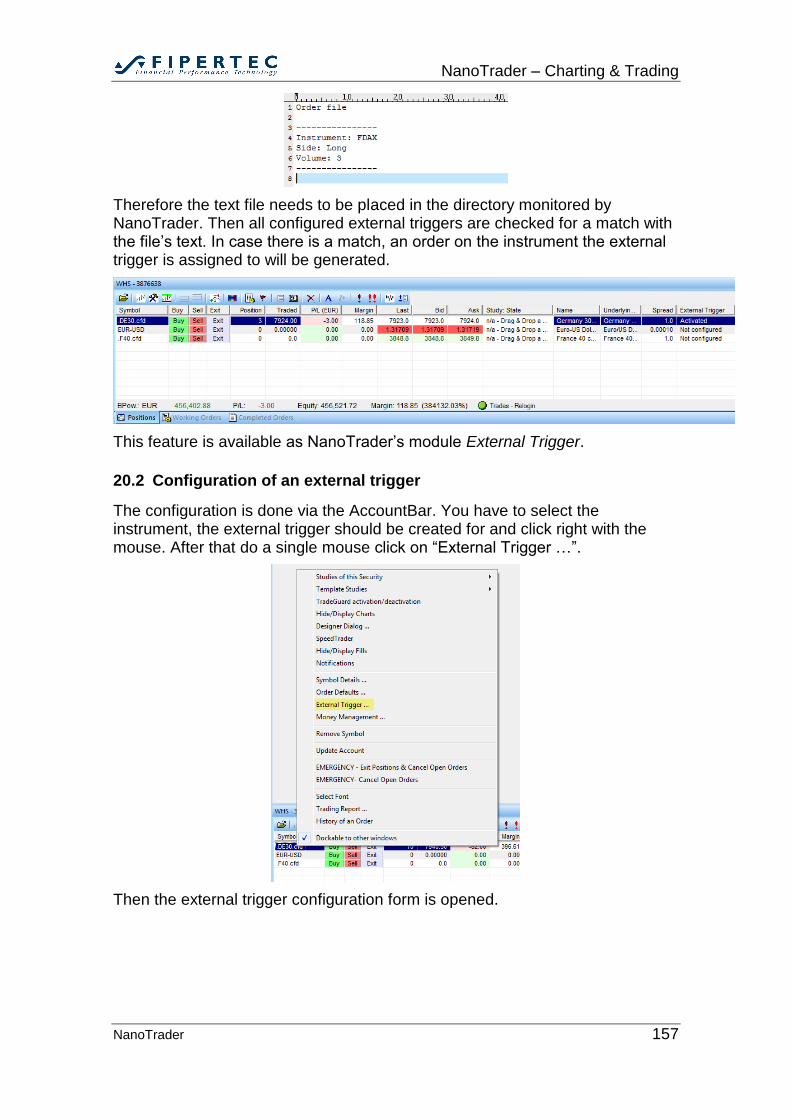
NanoTrader – Charting & Trading
NanoTrader 157
Therefore the text file needs to be placed in the directory monitored by NanoTrader. Then all configured external triggers are checked for a match with the file’s text. In case there is a match, an order on the instrument the external trigger is assigned to will be generated.
This feature is available as NanoTrader’s module External Trigger.
20.2 Configuration of an external trigger
The configuration is done via the AccountBar. You have to select the instrument, the external trigger should be created for and click right with the mouse. After that do a single mouse click on “External Trigger …”.
Then the external trigger configuration form is opened.
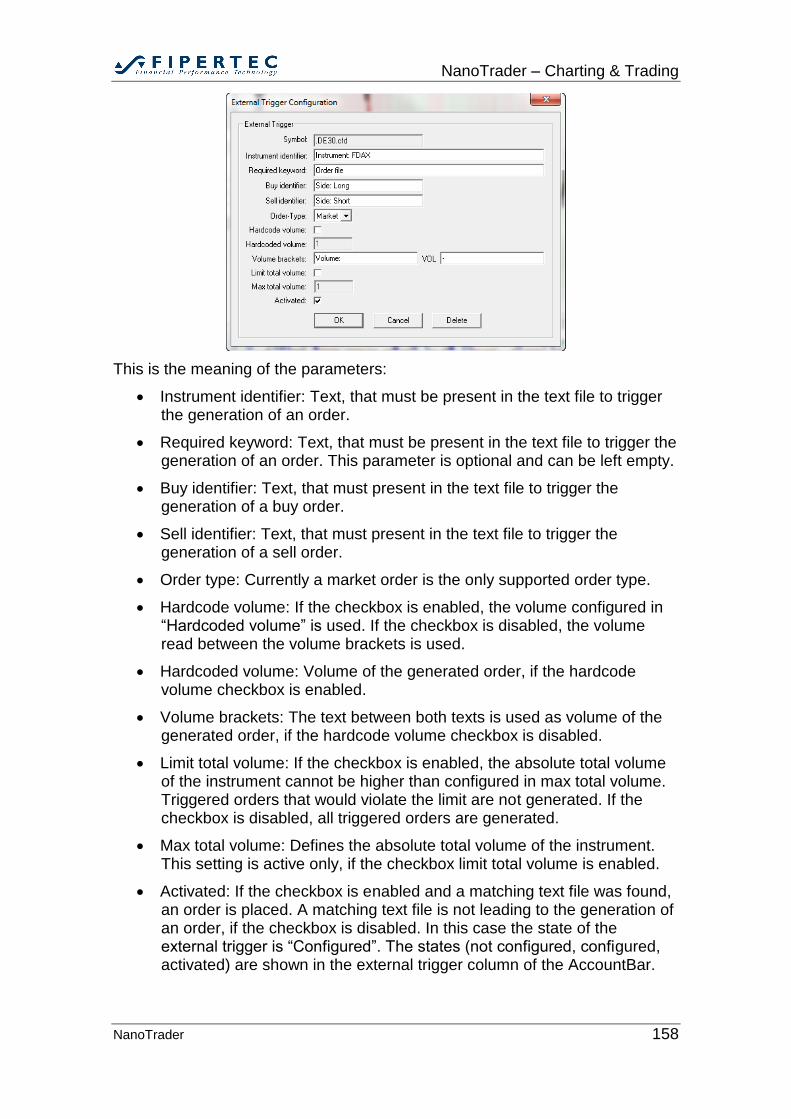
NanoTrader – Charting & Trading
NanoTrader 158
This is the meaning of the parameters:
Instrument identifier: Text, that must be present in the text file to trigger the generation of an order.
Required keyword: Text, that must be present in the text file to trigger the generation of an order. This parameter is optional and can be left empty.
Buy identifier: Text, that must present in the text file to trigger the generation of a buy order.
Sell identifier: Text, that must present in the text file to trigger the generation of a sell order.
Order type: Currently a market order is the only supported order type.
Hardcode volume: If the checkbox is enabled, the volume configured in “Hardcoded volume” is used. If the checkbox is disabled, the volume read between the volume brackets is used.
Hardcoded volume: Volume of the generated order, if the hardcode volume checkbox is enabled.
Volume brackets: The text between both texts is used as volume of the generated order, if the hardcode volume checkbox is disabled.
Limit total volume: If the checkbox is enabled, the absolute total volume of the instrument cannot be higher than configured in max total volume. Triggered orders that would violate the limit are not generated. If the checkbox is disabled, all triggered orders are generated.
Max total volume: Defines the absolute total volume of the instrument. This setting is active only, if the checkbox limit total volume is enabled.
Activated: If the checkbox is enabled and a matching text file was found, an order is placed. A matching text file is not leading to the generation of an order, if the checkbox is disabled. In this case the state of the external trigger is “Configured”. The states (not configured, configured, activated) are shown in the external trigger column of the AccountBar.
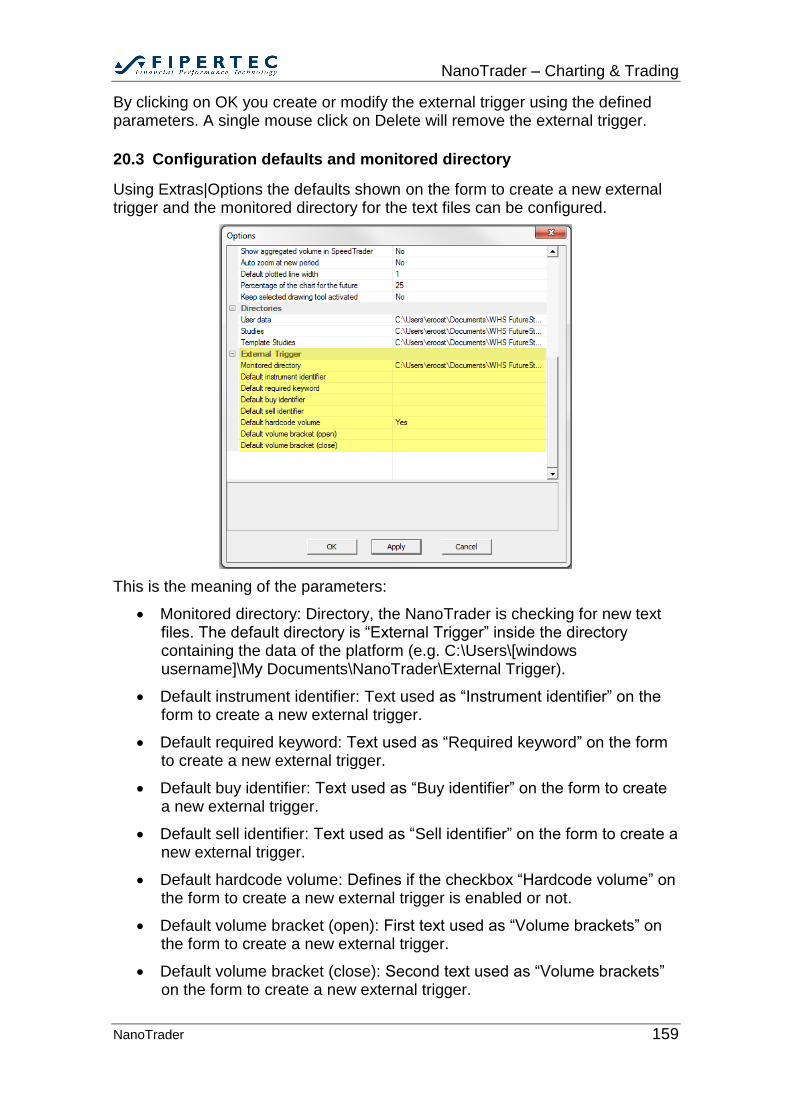
NanoTrader – Charting & Trading
NanoTrader 159
By clicking on OK you create or modify the external trigger using the defined parameters. A single mouse click on Delete will remove the external trigger.
20.3 Configuration defaults and monitored directory
Using Extras|Options the defaults shown on the form to create a new external trigger and the monitored directory for the text files can be configured.
This is the meaning of the parameters:
Monitored directory: Directory, the NanoTrader is checking for new text files. The default directory is “External Trigger” inside the directory containing the data of the platform (e.g. C:\Users\[windows username]\My Documents\NanoTrader\External Trigger).
Default instrument identifier: Text used as “Instrument identifier” on the form to create a new external trigger.
Default required keyword: Text used as “Required keyword” on the form to create a new external trigger.
Default buy identifier: Text used as “Buy identifier” on the form to create a new external trigger.
Default sell identifier: Text used as “Sell identifier” on the form to create a new external trigger.
Default hardcode volume: Defines if the checkbox “Hardcode volume” on the form to create a new external trigger is enabled or not.
Default volume bracket (open): First text used as “Volume brackets” on the form to create a new external trigger.
Default volume bracket (close): Second text used as “Volume brackets” on the form to create a new external trigger.
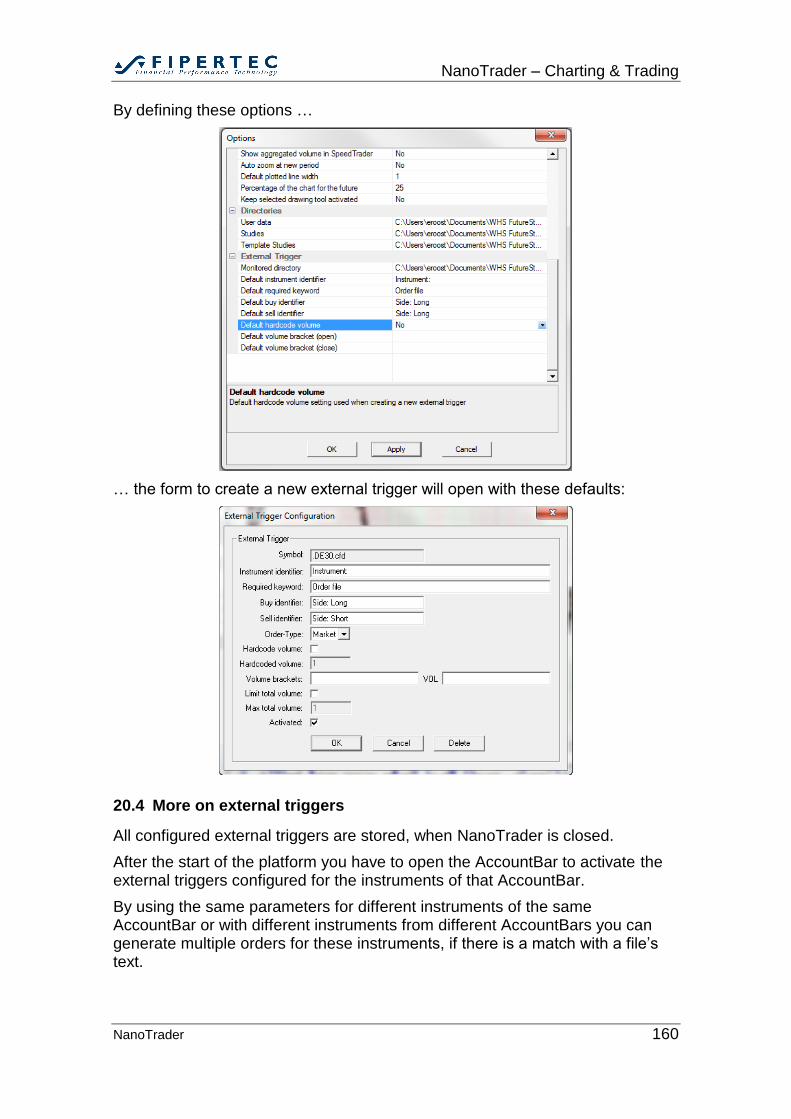
NanoTrader – Charting & Trading
NanoTrader 160
By defining these options …
… the form to create a new external trigger will open with these defaults:
20.4 More on external triggers
All configured external triggers are stored, when NanoTrader is closed.
After the start of the platform you have to open the AccountBar to activate the external triggers configured for the instruments of that AccountBar.
By using the same parameters for different instruments of the same AccountBar or with different instruments from different AccountBars you can generate multiple orders for these instruments, if there is a match with a file’s text.
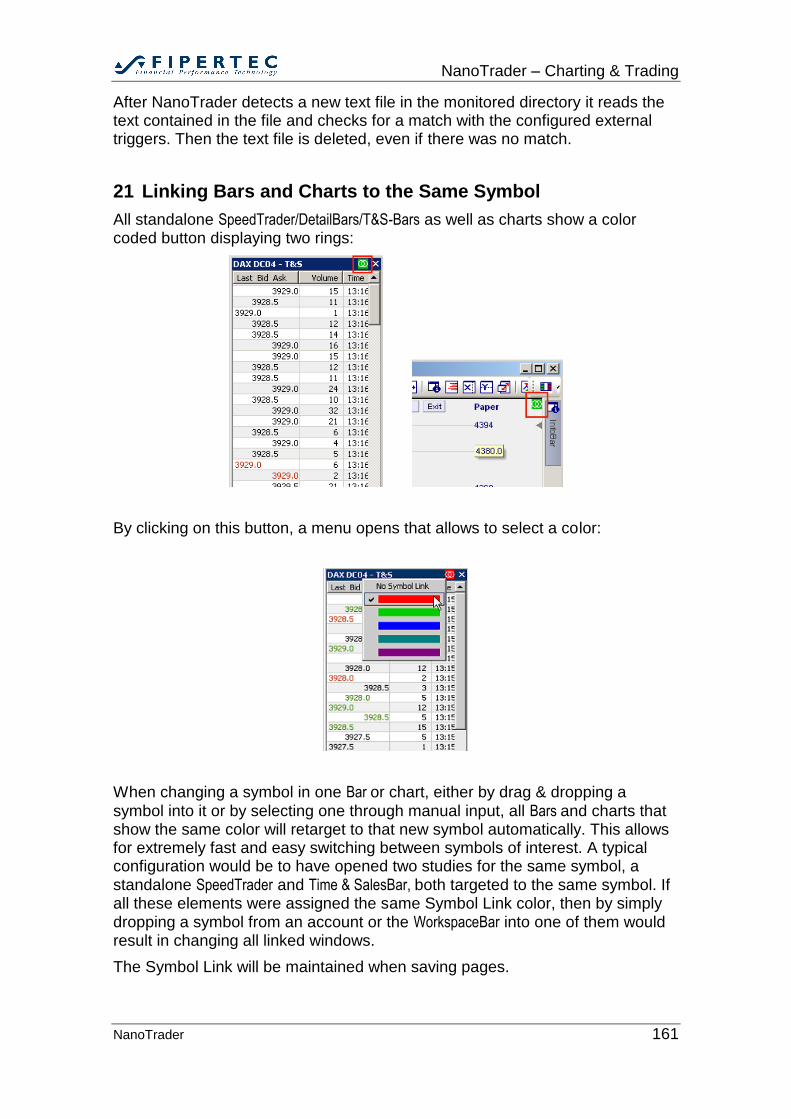
NanoTrader – Charting & Trading
NanoTrader 161
After NanoTrader detects a new text file in the monitored directory it reads the text contained in the file and checks for a match with the configured external triggers. Then the text file is deleted, even if there was no match.
21 Linking Bars and Charts to the Same Symbol
All standalone SpeedTrader/DetailBars/T&S-Bars as well as charts show a color coded button displaying two rings:
By clicking on this button, a menu opens that allows to select a color:
When changing a symbol in one Bar or chart, either by drag & dropping a
symbol into it or by selecting one through manual input, all Bars and charts that show the same color will retarget to that new symbol automatically. This allows for extremely fast and easy switching between symbols of interest. A typical configuration would be to have opened two studies for the same symbol, a
standalone SpeedTrader and Time & SalesBar, both targeted to the same symbol. If all these elements were assigned the same Symbol Link color, then by simply dropping a symbol from an account or the WorkspaceBar into one of them would result in changing all linked windows.
The Symbol Link will be maintained when saving pages.
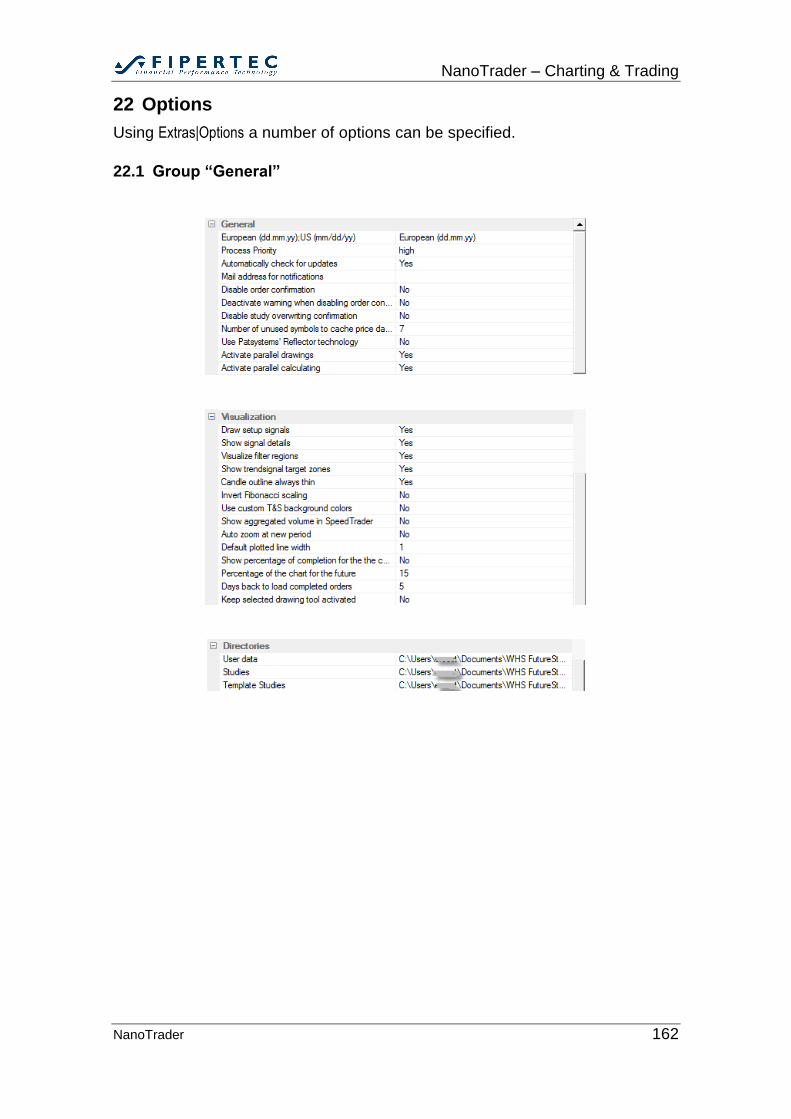
NanoTrader – Charting & Trading
NanoTrader 162
22 Options
Using Extras|Options a number of options can be specified.
22.1 Group “General”
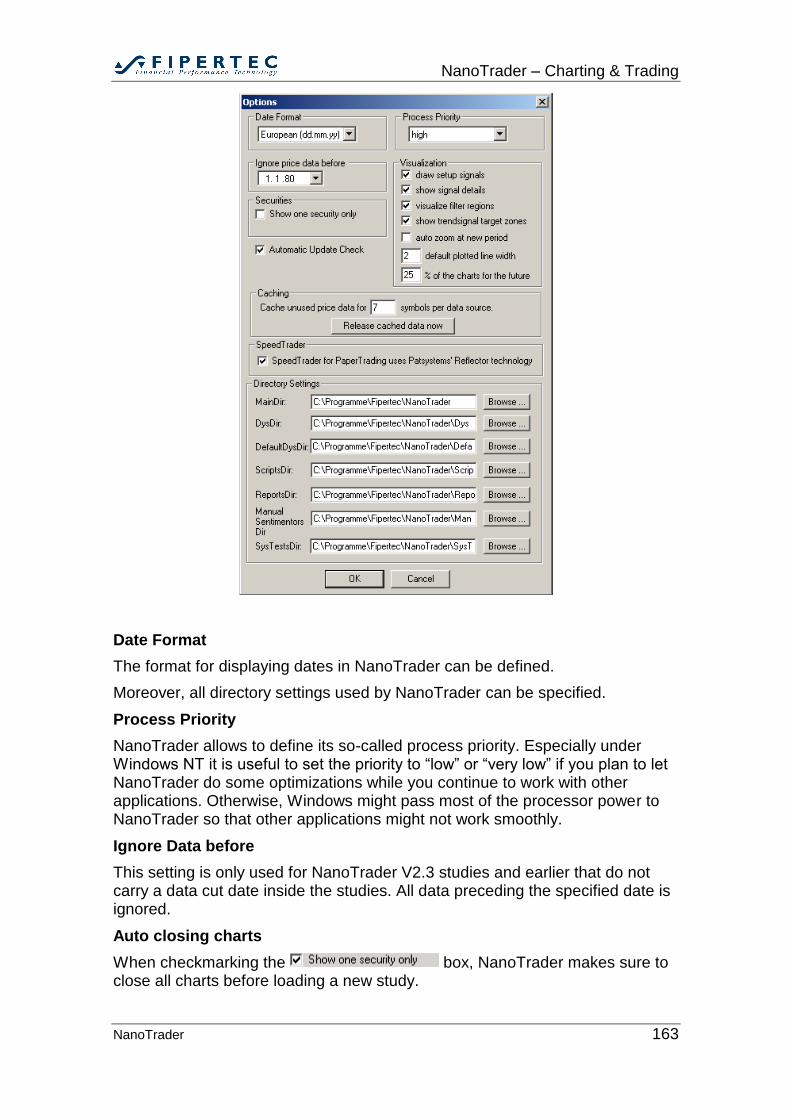
NanoTrader – Charting & Trading
NanoTrader 163
Date Format
The format for displaying dates in NanoTrader can be defined.
Moreover, all directory settings used by NanoTrader can be specified.
Process Priority
NanoTrader allows to define its so-called process priority. Especially under Windows NT it is useful to set the priority to “low” or “very low” if you plan to let NanoTrader do some optimizations while you continue to work with other applications. Otherwise, Windows might pass most of the processor power to NanoTrader so that other applications might not work smoothly.
Ignore Data before
This setting is only used for NanoTrader V2.3 studies and earlier that do not carry a data cut date inside the studies. All data preceding the specified date is ignored.
Auto closing charts
When checkmarking the box, NanoTrader makes sure to close all charts before loading a new study.
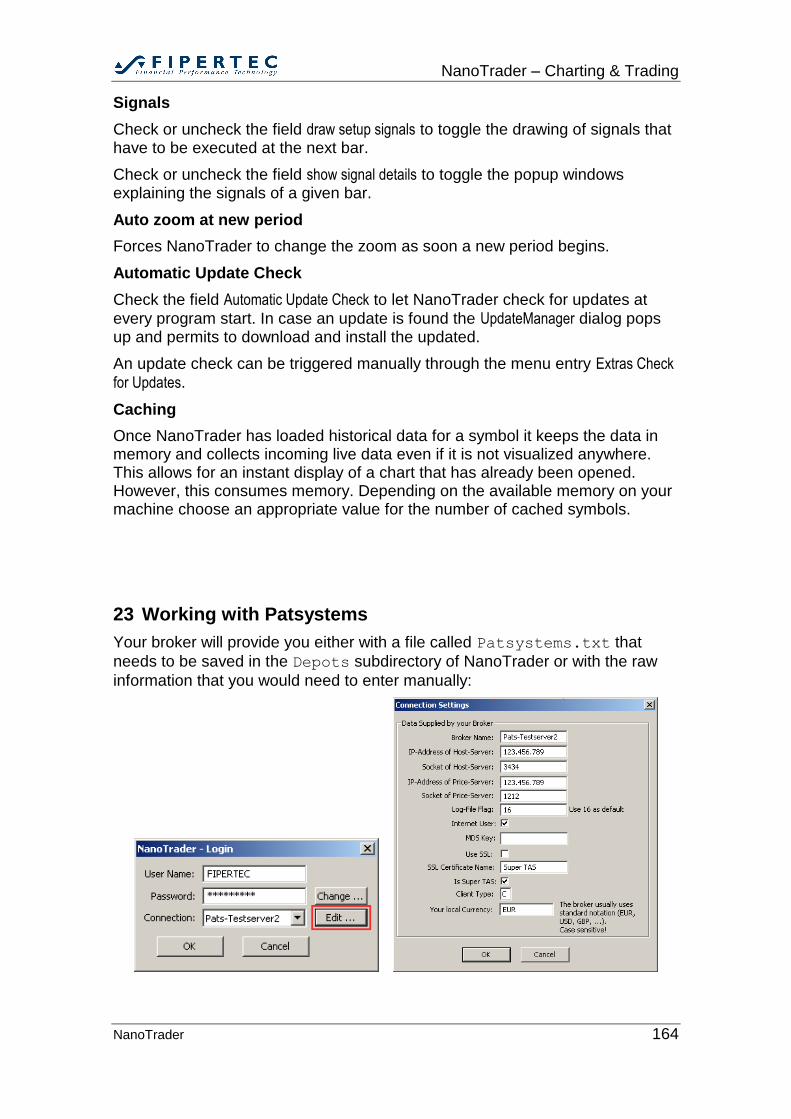
NanoTrader – Charting & Trading
NanoTrader 164
Signals
Check or uncheck the field draw setup signals to toggle the drawing of signals that have to be executed at the next bar.
Check or uncheck the field show signal details to toggle the popup windows explaining the signals of a given bar.
Auto zoom at new period
Forces NanoTrader to change the zoom as soon a new period begins.
Automatic Update Check
Check the field Automatic Update Check to let NanoTrader check for updates at
every program start. In case an update is found the UpdateManager dialog pops up and permits to download and install the updated.
An update check can be triggered manually through the menu entry Extras Check
for Updates.
Caching
Once NanoTrader has loaded historical data for a symbol it keeps the data in memory and collects incoming live data even if it is not visualized anywhere. This allows for an instant display of a chart that has already been opened. However, this consumes memory. Depending on the available memory on your machine choose an appropriate value for the number of cached symbols.
23 Working with Patsystems
Your broker will provide you either with a file called Patsystems.txt that
needs to be saved in the Depots subdirectory of NanoTrader or with the raw
information that you would need to enter manually:
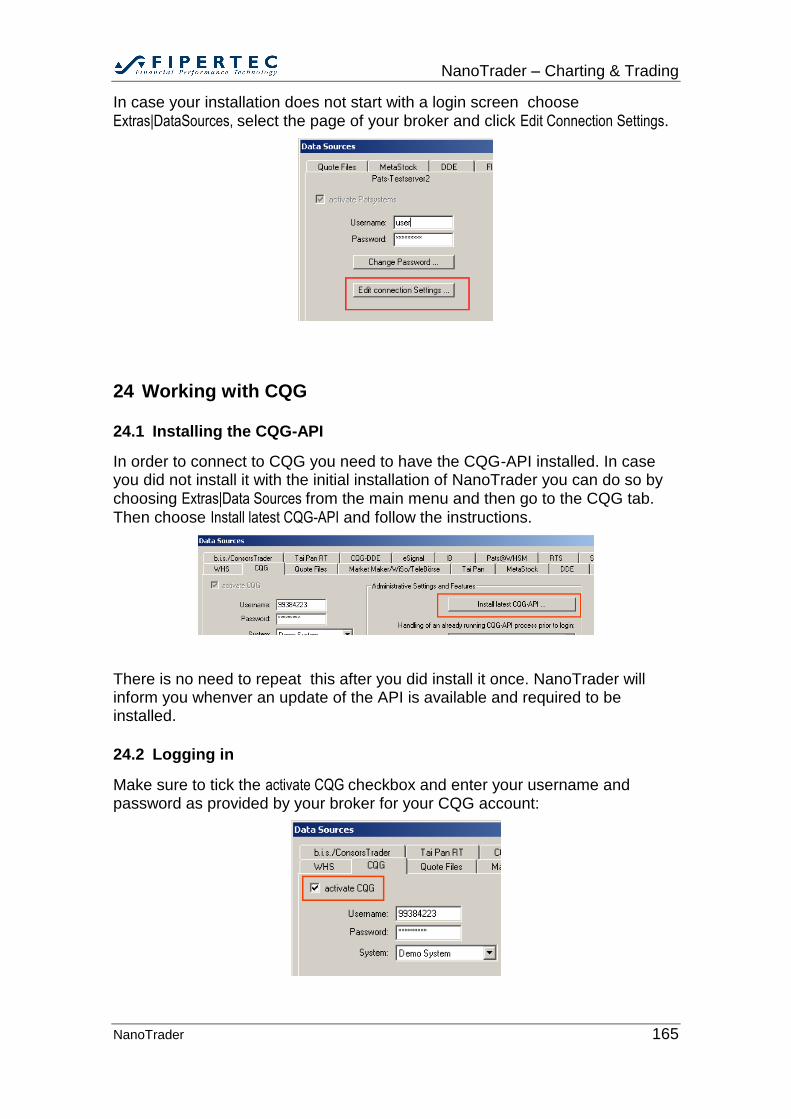
NanoTrader – Charting & Trading
NanoTrader 165
In case your installation does not start with a login screen choose Extras|DataSources, select the page of your broker and click Edit Connection Settings.
24 Working with CQG
24.1 Installing the CQG-API
In order to connect to CQG you need to have the CQG-API installed. In case you did not install it with the initial installation of NanoTrader you can do so by choosing Extras|Data Sources from the main menu and then go to the CQG tab.
Then choose Install latest CQG-API and follow the instructions.
There is no need to repeat this after you did install it once. NanoTrader will inform you whenver an update of the API is available and required to be installed.
24.2 Logging in
Make sure to tick the activate CQG checkbox and enter your username and password as provided by your broker for your CQG account:
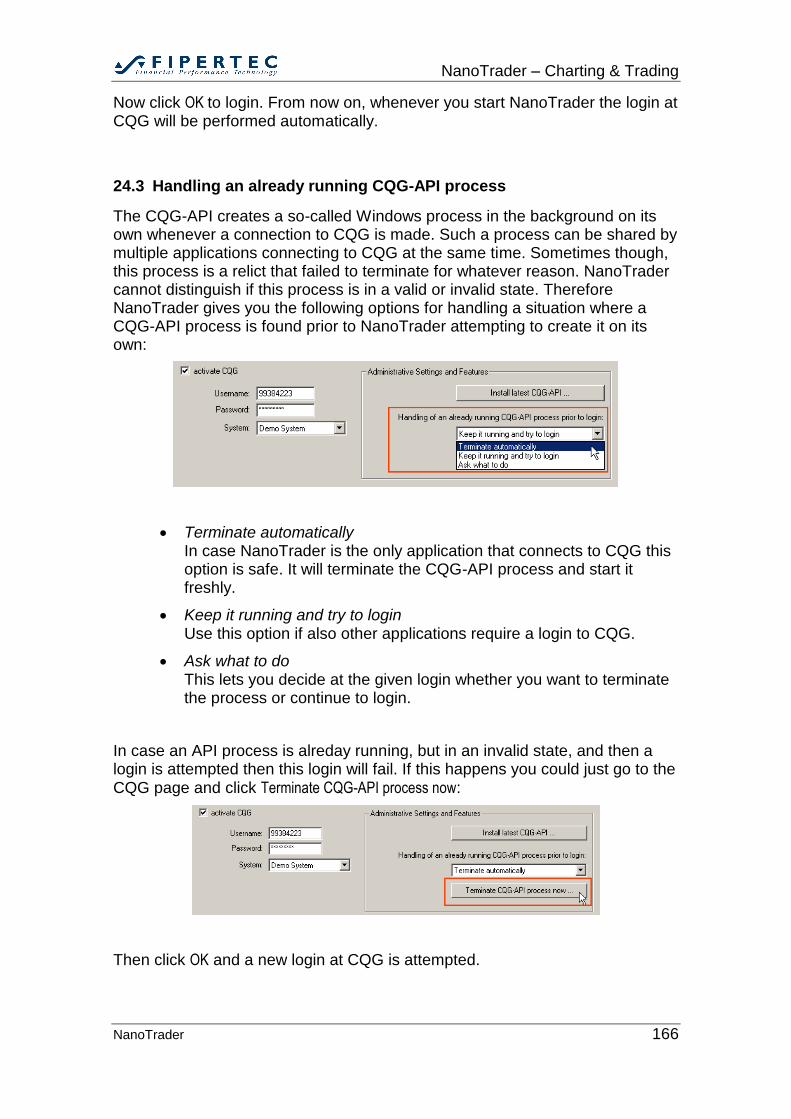
NanoTrader – Charting & Trading
NanoTrader 166
Now click OK to login. From now on, whenever you start NanoTrader the login at CQG will be performed automatically.
24.3 Handling an already running CQG-API process
The CQG-API creates a so-called Windows process in the background on its own whenever a connection to CQG is made. Such a process can be shared by multiple applications connecting to CQG at the same time. Sometimes though, this process is a relict that failed to terminate for whatever reason. NanoTrader cannot distinguish if this process is in a valid or invalid state. Therefore NanoTrader gives you the following options for handling a situation where a CQG-API process is found prior to NanoTrader attempting to create it on its own:
Terminate automatically In case NanoTrader is the only application that connects to CQG this option is safe. It will terminate the CQG-API process and start it freshly.
Keep it running and try to login Use this option if also other applications require a login to CQG.
Ask what to do This lets you decide at the given login whether you want to terminate the process or continue to login.
In case an API process is alreday running, but in an invalid state, and then a login is attempted then this login will fail. If this happens you could just go to the CQG page and click Terminate CQG-API process now:
Then click OK and a new login at CQG is attempted.
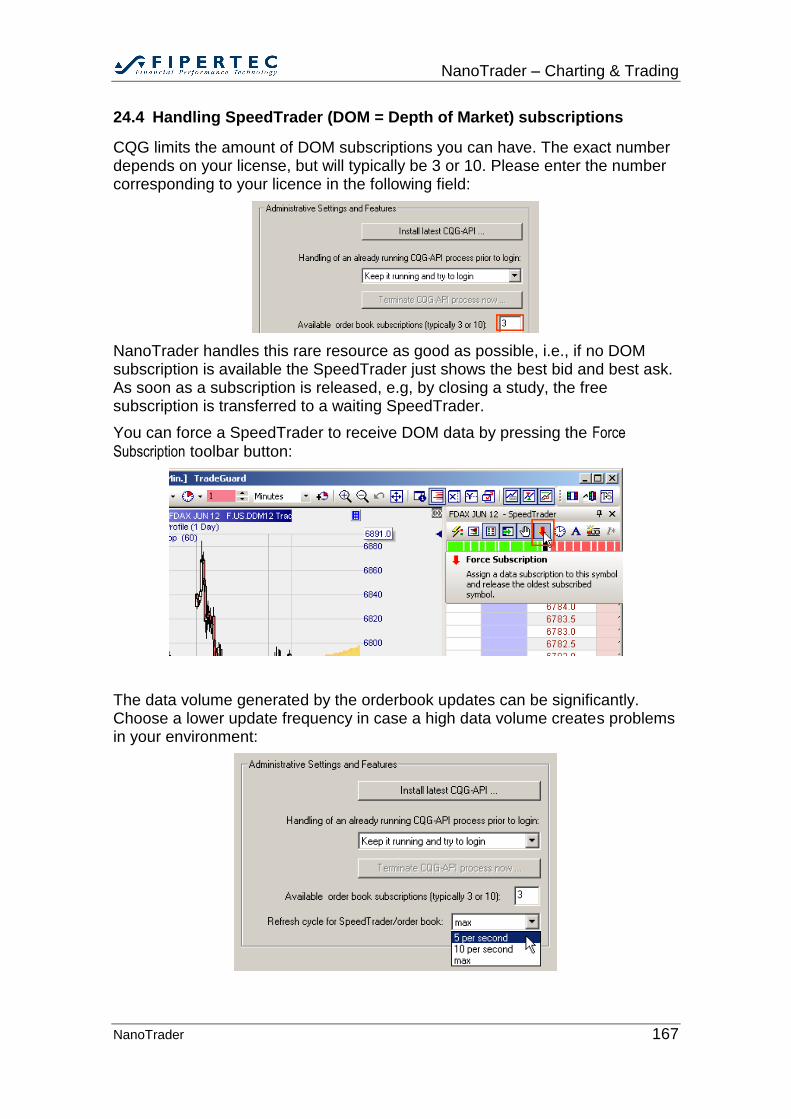
NanoTrader – Charting & Trading
NanoTrader 167
24.4 Handling SpeedTrader (DOM = Depth of Market) subscriptions
CQG limits the amount of DOM subscriptions you can have. The exact number depends on your license, but will typically be 3 or 10. Please enter the number corresponding to your licence in the following field:
NanoTrader handles this rare resource as good as possible, i.e., if no DOM subscription is available the SpeedTrader just shows the best bid and best ask. As soon as a subscription is released, e.g, by closing a study, the free subscription is transferred to a waiting SpeedTrader.
You can force a SpeedTrader to receive DOM data by pressing the Force
Subscription toolbar button:
The data volume generated by the orderbook updates can be significantly. Choose a lower update frequency in case a high data volume creates problems in your environment:
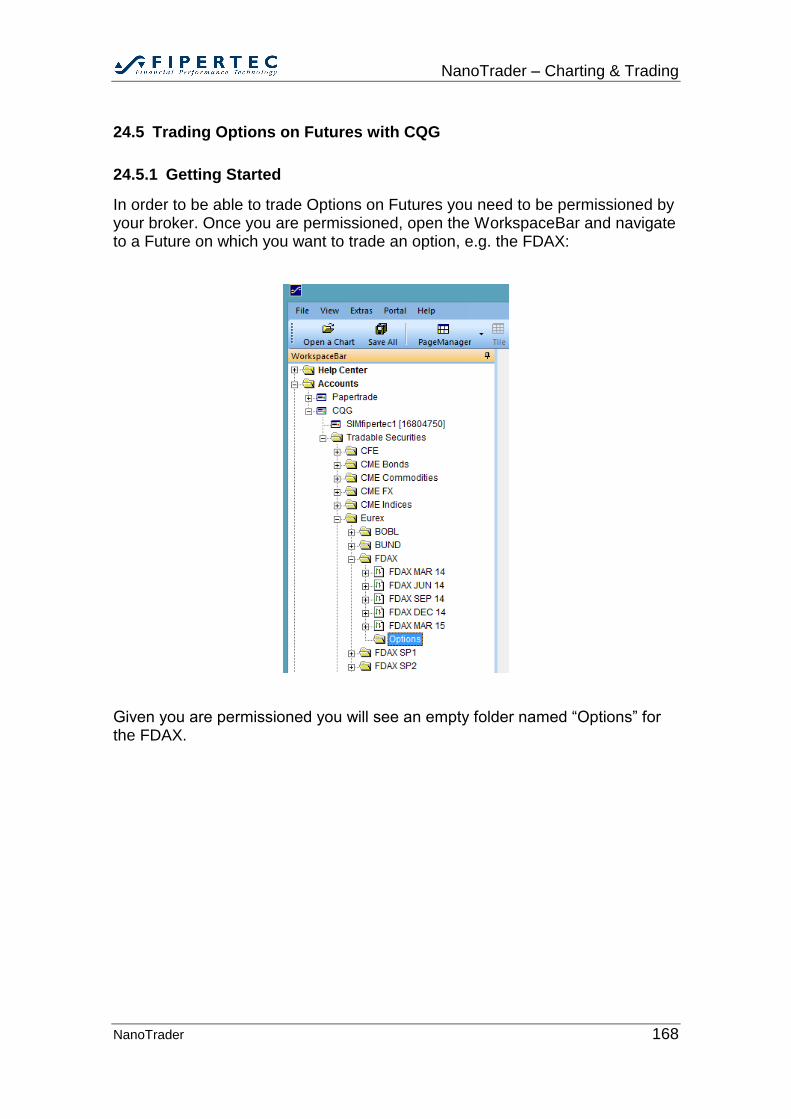
NanoTrader – Charting & Trading
NanoTrader 168
24.5 Trading Options on Futures with CQG
24.5.1 Getting Started
In order to be able to trade Options on Futures you need to be permissioned by your broker. Once you are permissioned, open the WorkspaceBar and navigate to a Future on which you want to trade an option, e.g. the FDAX:
Given you are permissioned you will see an empty folder named “Options” for the FDAX.
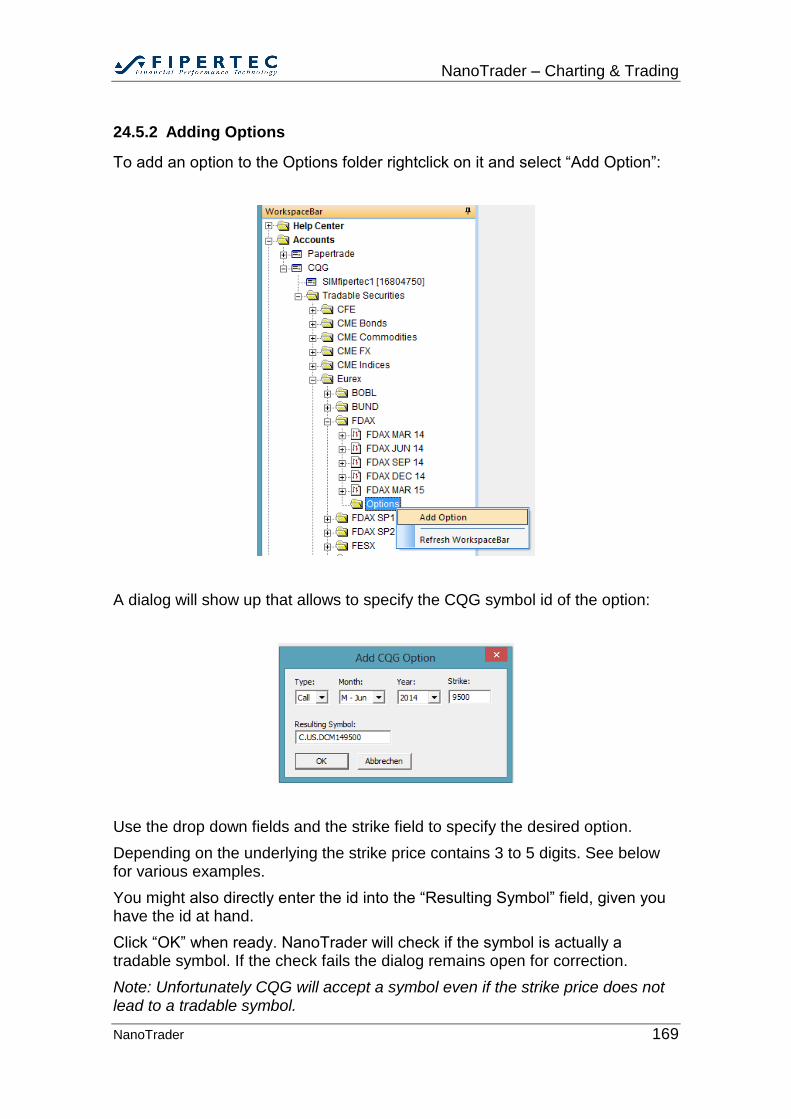
NanoTrader – Charting & Trading
NanoTrader 169
24.5.2 Adding Options
To add an option to the Options folder rightclick on it and select “Add Option”:
A dialog will show up that allows to specify the CQG symbol id of the option:
Use the drop down fields and the strike field to specify the desired option.
Depending on the underlying the strike price contains 3 to 5 digits. See below for various examples.
You might also directly enter the id into the “Resulting Symbol” field, given you have the id at hand.
Click “OK” when ready. NanoTrader will check if the symbol is actually a tradable symbol. If the check fails the dialog remains open for correction.
Note: Unfortunately CQG will accept a symbol even if the strike price does not lead to a tradable symbol.
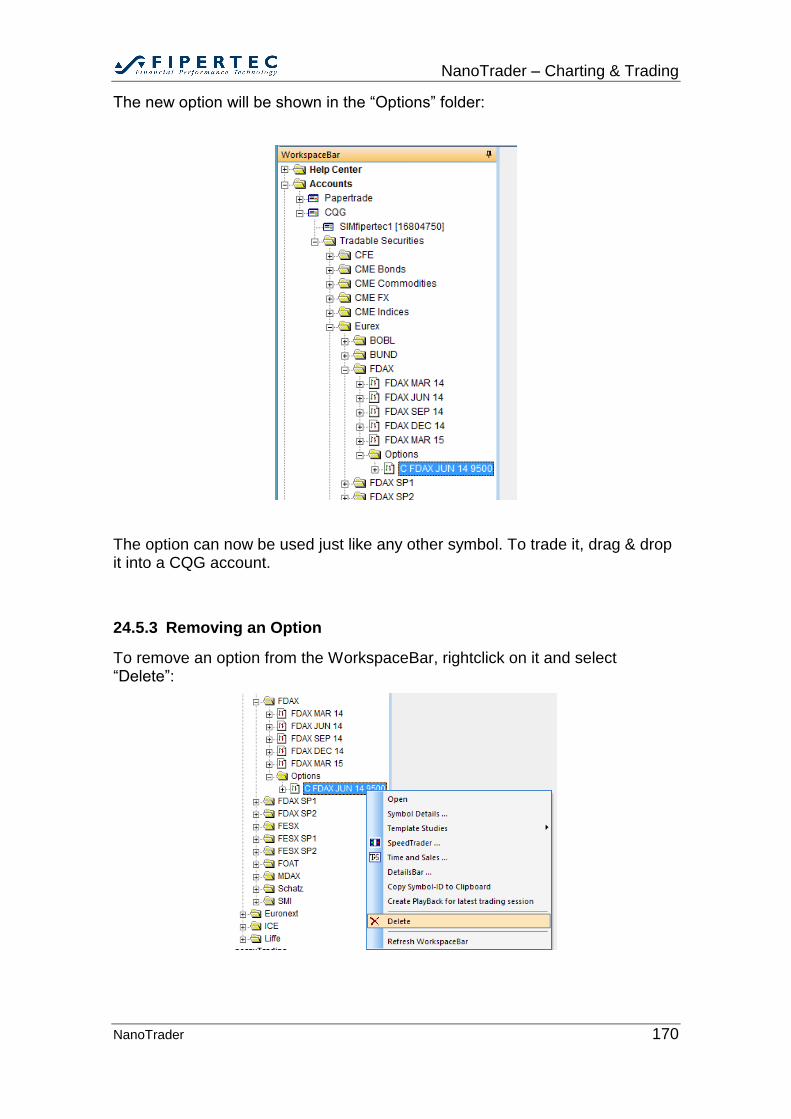
NanoTrader – Charting & Trading
NanoTrader 170
The new option will be shown in the “Options” folder:
The option can now be used just like any other symbol. To trade it, drag & drop it into a CQG account.
24.5.3 Removing an Option
To remove an option from the WorkspaceBar, rightclick on it and select “Delete”:
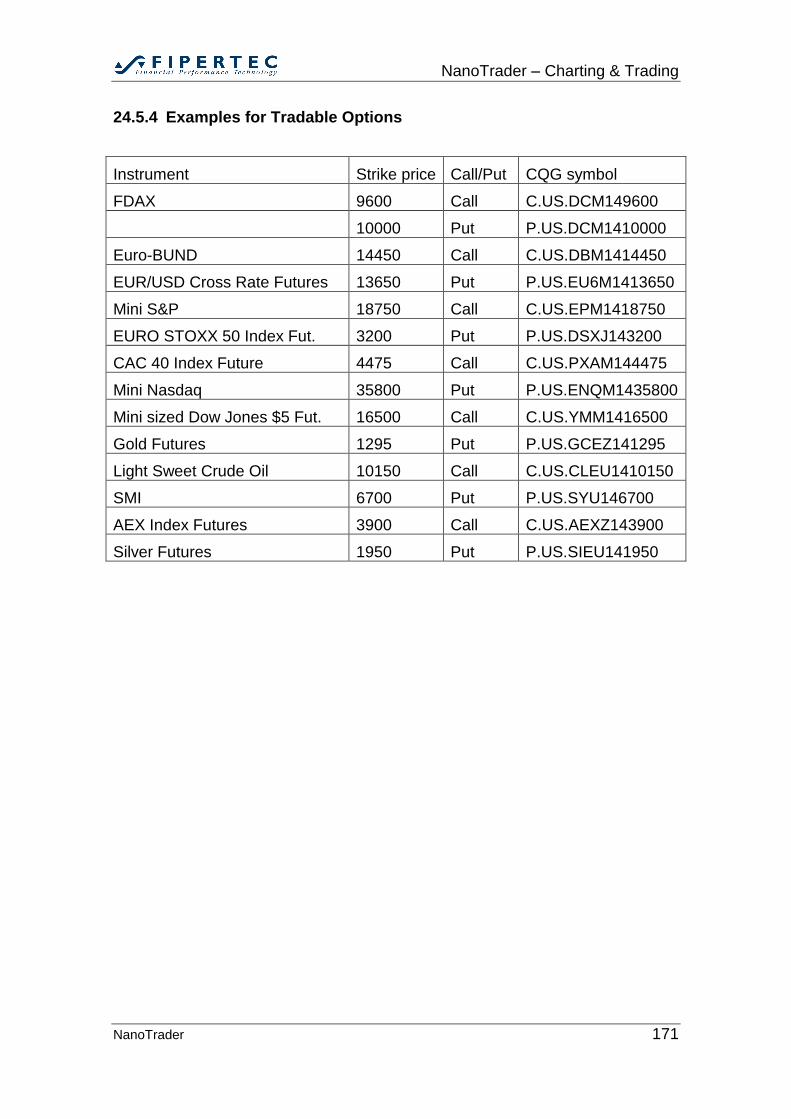
NanoTrader – Charting & Trading
NanoTrader 171
24.5.4 Examples for Tradable Options
Instrument Strike price Call/Put CQG symbol
FDAX 9600 Call C.US.DCM149600
10000 Put P.US.DCM1410000
Euro-BUND 14450 Call C.US.DBM1414450
EUR/USD Cross Rate Futures 13650 Put P.US.EU6M1413650
Mini S&P 18750 Call C.US.EPM1418750
EURO STOXX 50 Index Fut. 3200 Put P.US.DSXJ143200
CAC 40 Index Future 4475 Call C.US.PXAM144475
Mini Nasdaq 35800 Put P.US.ENQM1435800
Mini sized Dow Jones $5 Fut. 16500 Call C.US.YMM1416500
Gold Futures 1295 Put P.US.GCEZ141295
Light Sweet Crude Oil 10150 Call C.US.CLEU1410150
SMI 6700 Put P.US.SYU146700
AEX Index Futures 3900 Call C.US.AEXZ143900
Silver Futures 1950 Put P.US.SIEU141950

NanoTrader – Charting & Trading
NanoTrader 172
25 Working with WHS CFD/Forex Trading
25.1 Logging in
Your broker will provide you with your username and password. When you start NanoTrader for the first time the following login dialog appears:
Enter your data and select the system that you want to connect to. The “Demo System” is a simulation environment for testing purposes whereas the “Live Trading System” works with your real account.
If you do not want to connect to the CFD/Forex Trading click on the Deactivate
Connection button. You can reactivate the connection any time through the main
menu Extras|Data Sources|WHS.
25.2 Settings for WHS CFD/Forex Trading
To open the Settings dialog for CFD/Forex Trading choose Extras|Data
Sources|WHS from the main menu. The following dialog appears:
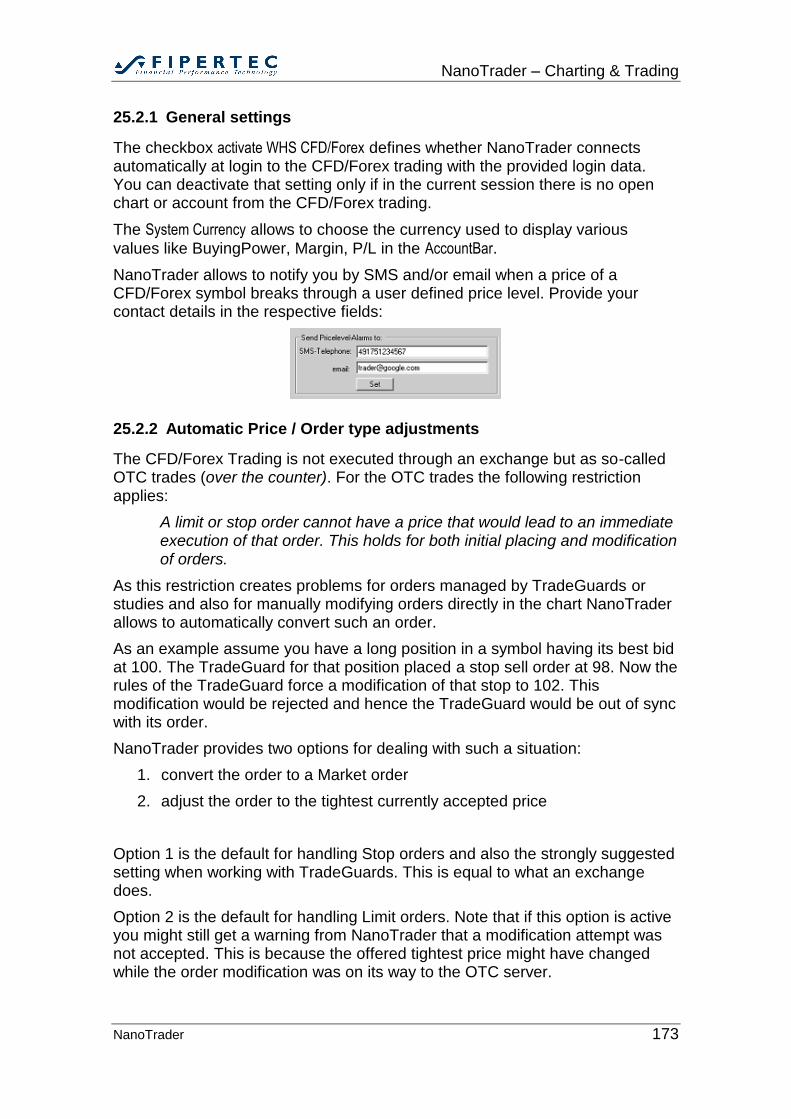
NanoTrader – Charting & Trading
NanoTrader 173
25.2.1 General settings
The checkbox activate WHS CFD/Forex defines whether NanoTrader connects automatically at login to the CFD/Forex trading with the provided login data. You can deactivate that setting only if in the current session there is no open chart or account from the CFD/Forex trading.
The System Currency allows to choose the currency used to display various
values like BuyingPower, Margin, P/L in the AccountBar.
NanoTrader allows to notify you by SMS and/or email when a price of a CFD/Forex symbol breaks through a user defined price level. Provide your contact details in the respective fields:
25.2.2 Automatic Price / Order type adjustments
The CFD/Forex Trading is not executed through an exchange but as so-called OTC trades (over the counter). For the OTC trades the following restriction applies:
A limit or stop order cannot have a price that would lead to an immediate execution of that order. This holds for both initial placing and modification of orders.
As this restriction creates problems for orders managed by TradeGuards or studies and also for manually modifying orders directly in the chart NanoTrader allows to automatically convert such an order.
As an example assume you have a long position in a symbol having its best bid at 100. The TradeGuard for that position placed a stop sell order at 98. Now the rules of the TradeGuard force a modification of that stop to 102. This modification would be rejected and hence the TradeGuard would be out of sync with its order.
NanoTrader provides two options for dealing with such a situation:
1. convert the order to a Market order
2. adjust the order to the tightest currently accepted price
Option 1 is the default for handling Stop orders and also the strongly suggested setting when working with TradeGuards. This is equal to what an exchange does.
Option 2 is the default for handling Limit orders. Note that if this option is active you might still get a warning from NanoTrader that a modification attempt was not accepted. This is because the offered tightest price might have changed while the order modification was on its way to the OTC server.
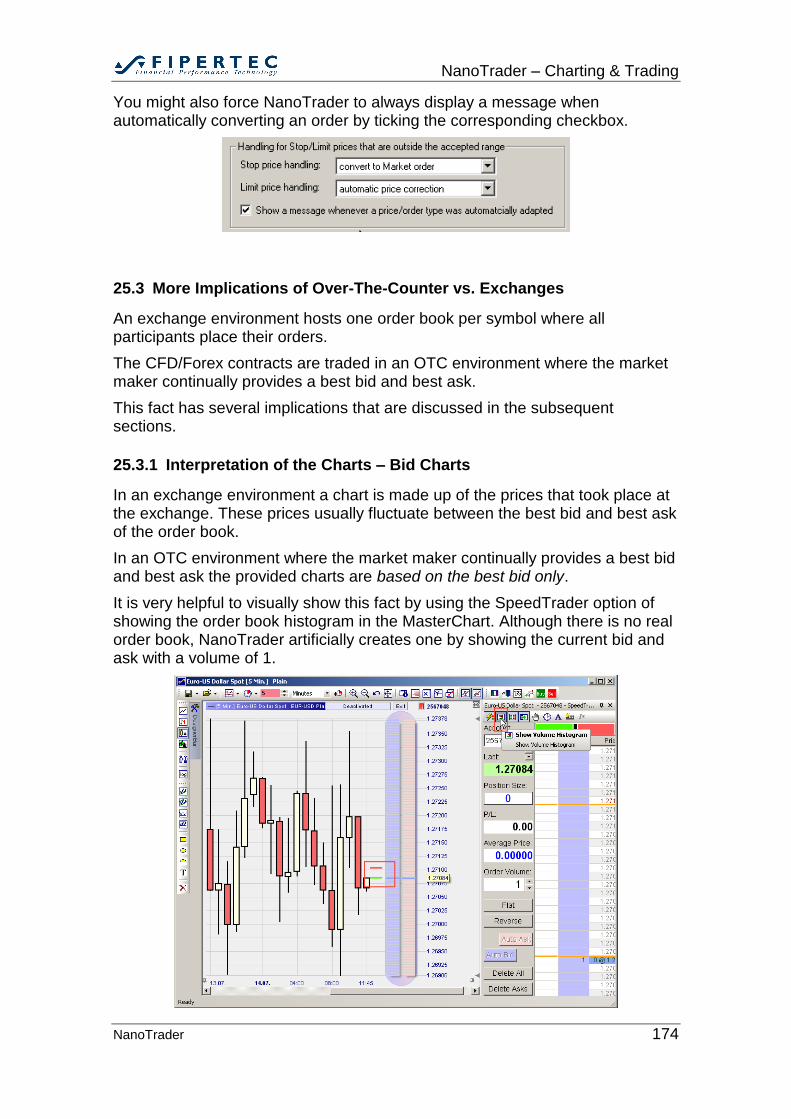
NanoTrader – Charting & Trading
NanoTrader 174
You might also force NanoTrader to always display a message when automatically converting an order by ticking the corresponding checkbox.
25.3 More Implications of Over-The-Counter vs. Exchanges
An exchange environment hosts one order book per symbol where all participants place their orders.
The CFD/Forex contracts are traded in an OTC environment where the market maker continually provides a best bid and best ask.
This fact has several implications that are discussed in the subsequent sections.
25.3.1 Interpretation of the Charts – Bid Charts
In an exchange environment a chart is made up of the prices that took place at the exchange. These prices usually fluctuate between the best bid and best ask of the order book.
In an OTC environment where the market maker continually provides a best bid and best ask the provided charts are based on the best bid only.
It is very helpful to visually show this fact by using the SpeedTrader option of showing the order book histogram in the MasterChart. Although there is no real order book, NanoTrader artificially creates one by showing the current bid and ask with a volume of 1.
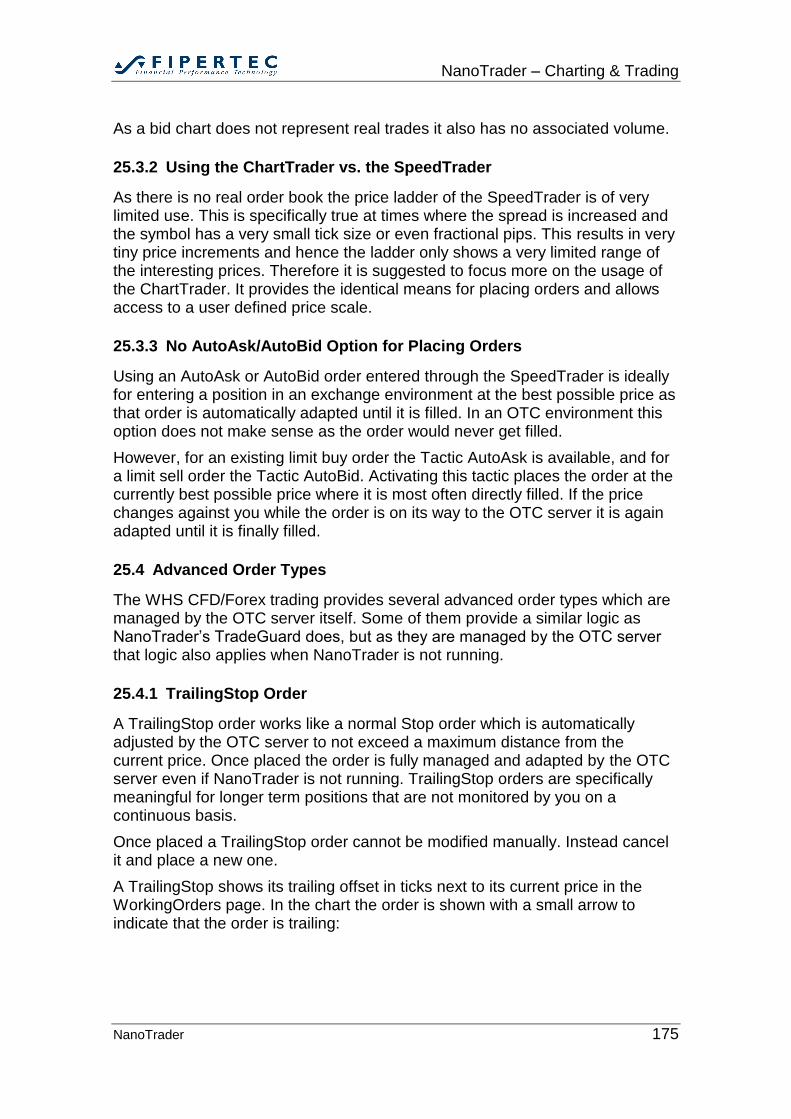
NanoTrader – Charting & Trading
NanoTrader 175
As a bid chart does not represent real trades it also has no associated volume.
25.3.2 Using the ChartTrader vs. the SpeedTrader
As there is no real order book the price ladder of the SpeedTrader is of very limited use. This is specifically true at times where the spread is increased and the symbol has a very small tick size or even fractional pips. This results in very tiny price increments and hence the ladder only shows a very limited range of the interesting prices. Therefore it is suggested to focus more on the usage of the ChartTrader. It provides the identical means for placing orders and allows access to a user defined price scale.
25.3.3 No AutoAsk/AutoBid Option for Placing Orders
Using an AutoAsk or AutoBid order entered through the SpeedTrader is ideally for entering a position in an exchange environment at the best possible price as that order is automatically adapted until it is filled. In an OTC environment this option does not make sense as the order would never get filled.
However, for an existing limit buy order the Tactic AutoAsk is available, and for a limit sell order the Tactic AutoBid. Activating this tactic places the order at the currently best possible price where it is most often directly filled. If the price changes against you while the order is on its way to the OTC server it is again adapted until it is finally filled.
25.4 Advanced Order Types
The WHS CFD/Forex trading provides several advanced order types which are managed by the OTC server itself. Some of them provide a similar logic as NanoTrader’s TradeGuard does, but as they are managed by the OTC server that logic also applies when NanoTrader is not running.
25.4.1 TrailingStop Order
A TrailingStop order works like a normal Stop order which is automatically adjusted by the OTC server to not exceed a maximum distance from the current price. Once placed the order is fully managed and adapted by the OTC server even if NanoTrader is not running. TrailingStop orders are specifically meaningful for longer term positions that are not monitored by you on a continuous basis.
Once placed a TrailingStop order cannot be modified manually. Instead cancel it and place a new one.
A TrailingStop shows its trailing offset in ticks next to its current price in the WorkingOrders page. In the chart the order is shown with a small arrow to indicate that the order is trailing:
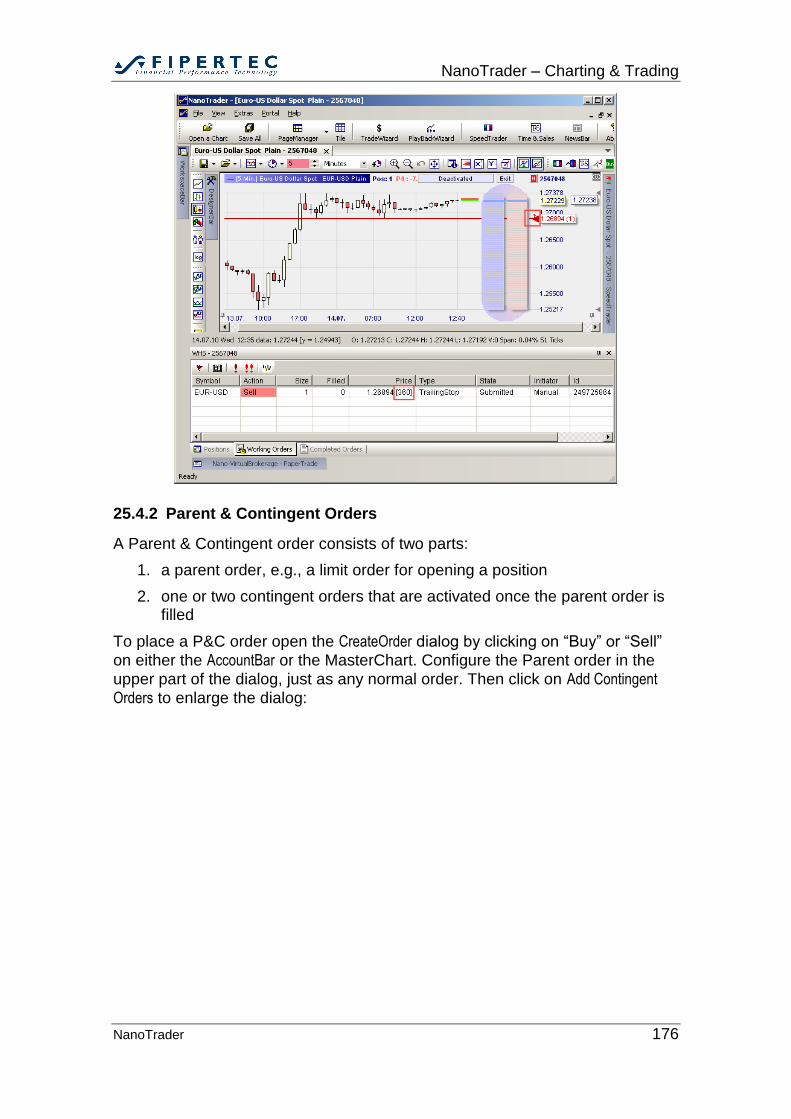
NanoTrader – Charting & Trading
NanoTrader 176
25.4.2 Parent & Contingent Orders
A Parent & Contingent order consists of two parts:
1. a parent order, e.g., a limit order for opening a position
2. one or two contingent orders that are activated once the parent order is filled
To place a P&C order open the CreateOrder dialog by clicking on “Buy” or “Sell”
on either the AccountBar or the MasterChart. Configure the Parent order in the
upper part of the dialog, just as any normal order. Then click on Add Contingent
Orders to enlarge the dialog:
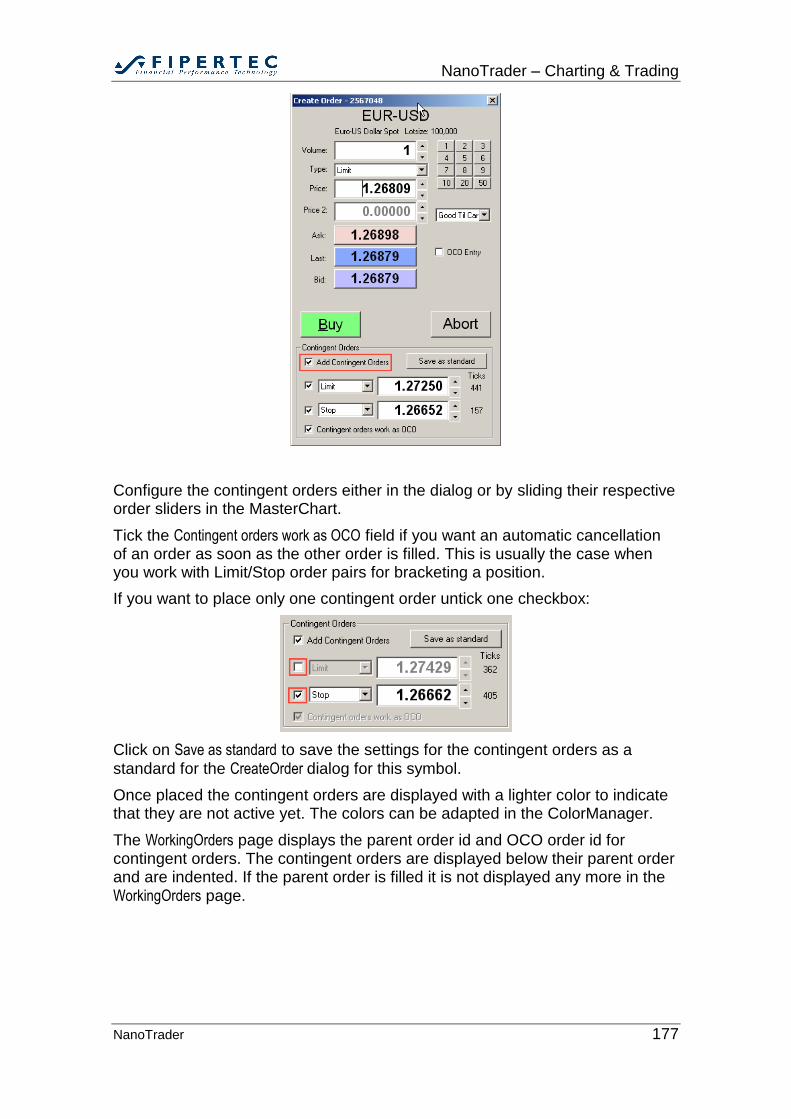
NanoTrader – Charting & Trading
NanoTrader 177
Configure the contingent orders either in the dialog or by sliding their respective order sliders in the MasterChart.
Tick the Contingent orders work as OCO field if you want an automatic cancellation of an order as soon as the other order is filled. This is usually the case when you work with Limit/Stop order pairs for bracketing a position.
If you want to place only one contingent order untick one checkbox:
Click on Save as standard to save the settings for the contingent orders as a
standard for the CreateOrder dialog for this symbol.
Once placed the contingent orders are displayed with a lighter color to indicate that they are not active yet. The colors can be adapted in the ColorManager.
The WorkingOrders page displays the parent order id and OCO order id for contingent orders. The contingent orders are displayed below their parent order and are indented. If the parent order is filled it is not displayed any more in the WorkingOrders page.
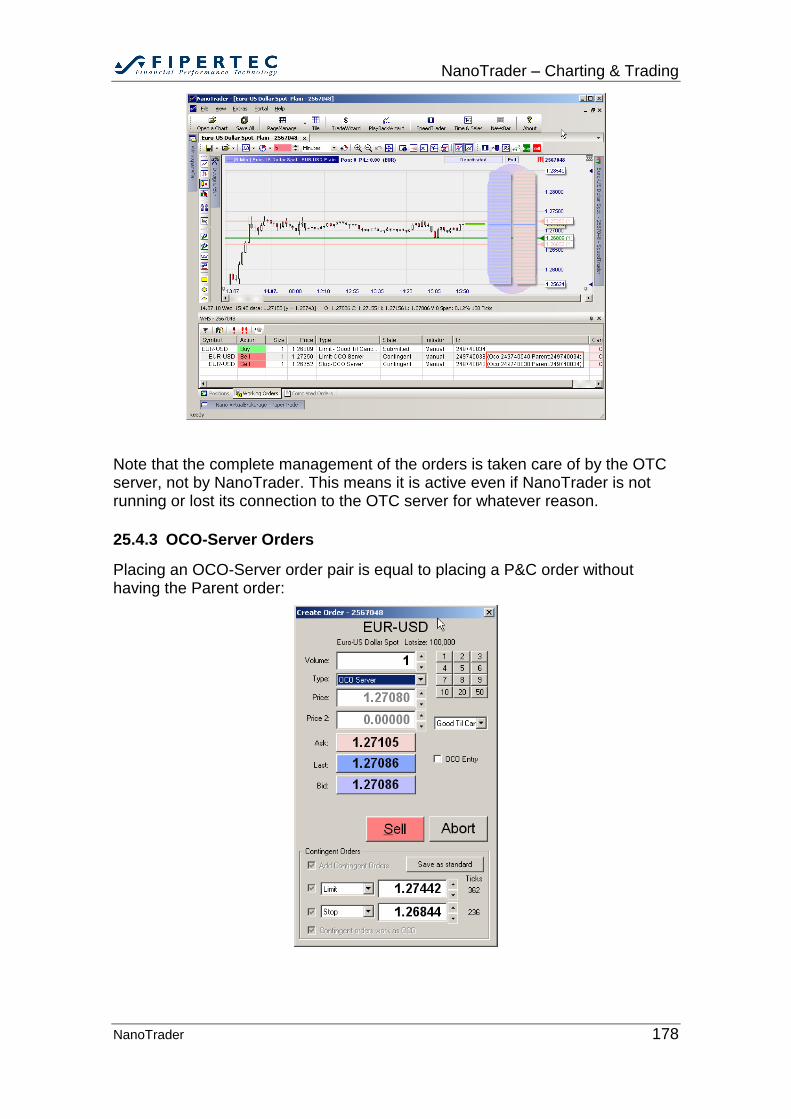
NanoTrader – Charting & Trading
NanoTrader 178
Note that the complete management of the orders is taken care of by the OTC server, not by NanoTrader. This means it is active even if NanoTrader is not running or lost its connection to the OTC server for whatever reason.
25.4.3 OCO-Server Orders
Placing an OCO-Server order pair is equal to placing a P&C order without having the Parent order:
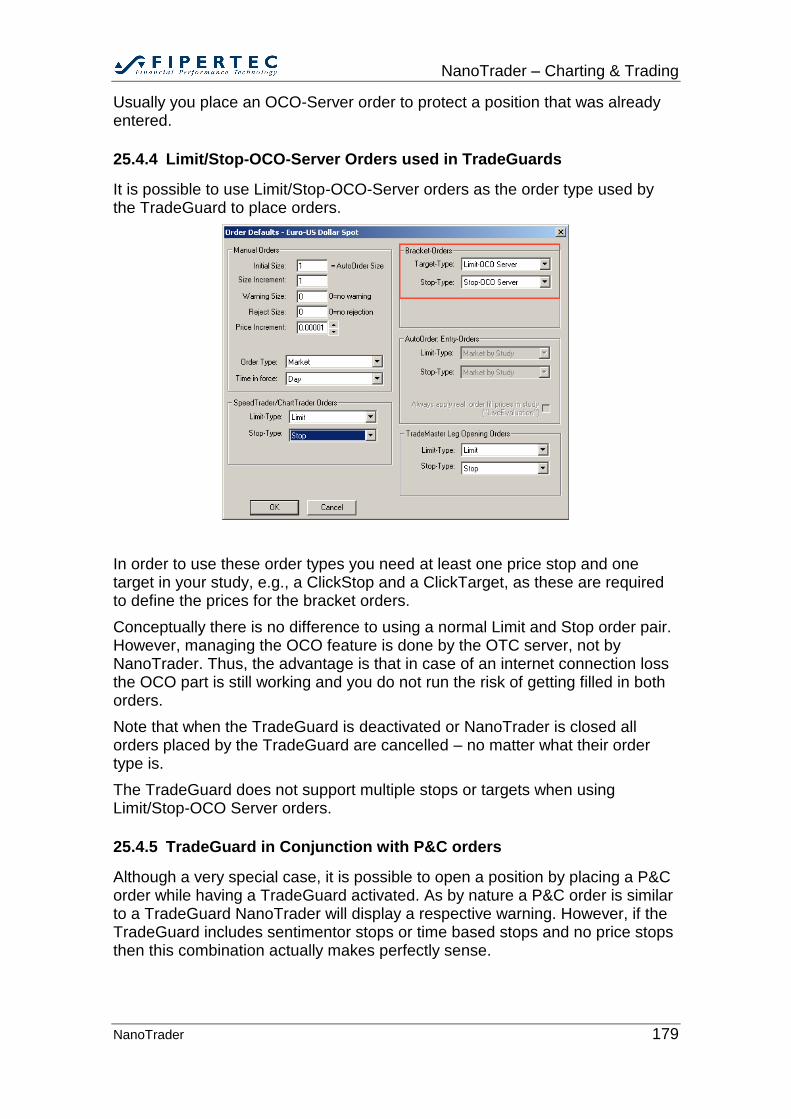
NanoTrader – Charting & Trading
NanoTrader 179
Usually you place an OCO-Server order to protect a position that was already entered.
25.4.4 Limit/Stop-OCO-Server Orders used in TradeGuards
It is possible to use Limit/Stop-OCO-Server orders as the order type used by the TradeGuard to place orders.
In order to use these order types you need at least one price stop and one target in your study, e.g., a ClickStop and a ClickTarget, as these are required to define the prices for the bracket orders.
Conceptually there is no difference to using a normal Limit and Stop order pair. However, managing the OCO feature is done by the OTC server, not by NanoTrader. Thus, the advantage is that in case of an internet connection loss the OCO part is still working and you do not run the risk of getting filled in both orders.
Note that when the TradeGuard is deactivated or NanoTrader is closed all orders placed by the TradeGuard are cancelled – no matter what their order type is.
The TradeGuard does not support multiple stops or targets when using Limit/Stop-OCO Server orders.
25.4.5 TradeGuard in Conjunction with P&C orders
Although a very special case, it is possible to open a position by placing a P&C order while having a TradeGuard activated. As by nature a P&C order is similar to a TradeGuard NanoTrader will display a respective warning. However, if the TradeGuard includes sentimentor stops or time based stops and no price stops then this combination actually makes perfectly sense.
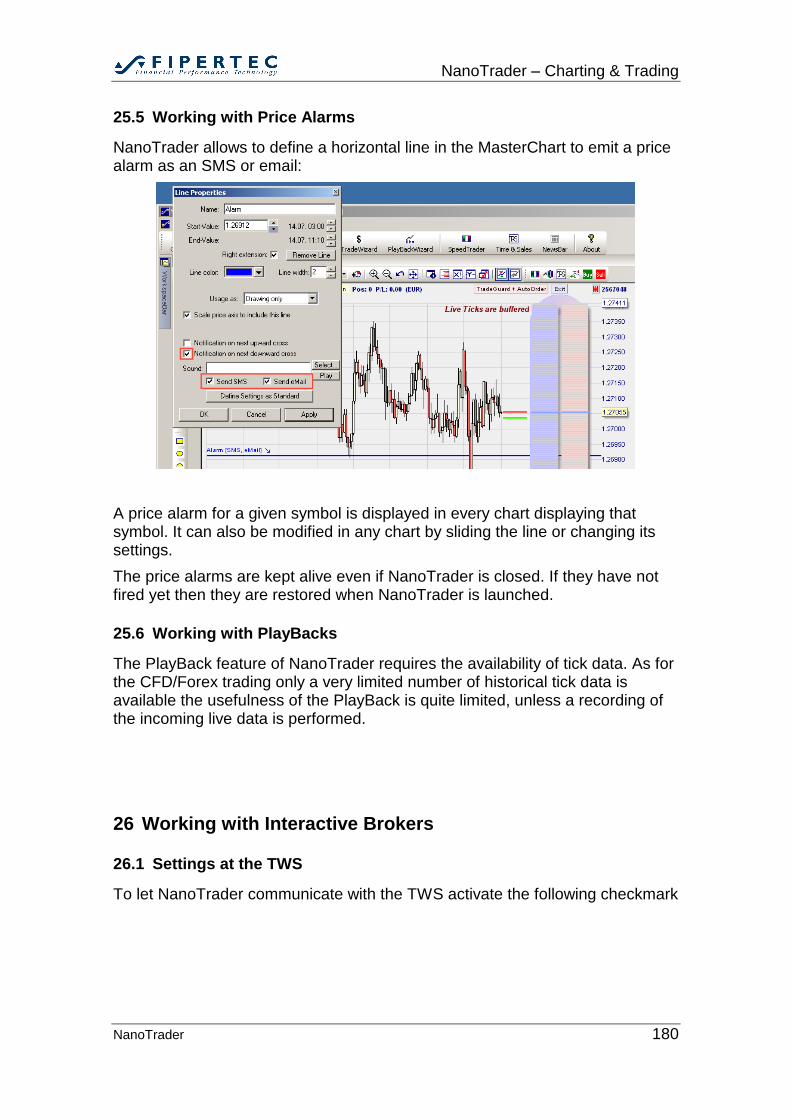
NanoTrader – Charting & Trading
NanoTrader 180
25.5 Working with Price Alarms
NanoTrader allows to define a horizontal line in the MasterChart to emit a price alarm as an SMS or email:
A price alarm for a given symbol is displayed in every chart displaying that symbol. It can also be modified in any chart by sliding the line or changing its settings.
The price alarms are kept alive even if NanoTrader is closed. If they have not fired yet then they are restored when NanoTrader is launched.
25.6 Working with PlayBacks
The PlayBack feature of NanoTrader requires the availability of tick data. As for the CFD/Forex trading only a very limited number of historical tick data is available the usefulness of the PlayBack is quite limited, unless a recording of the incoming live data is performed.
26 Working with Interactive Brokers
26.1 Settings at the TWS
To let NanoTrader communicate with the TWS activate the following checkmark
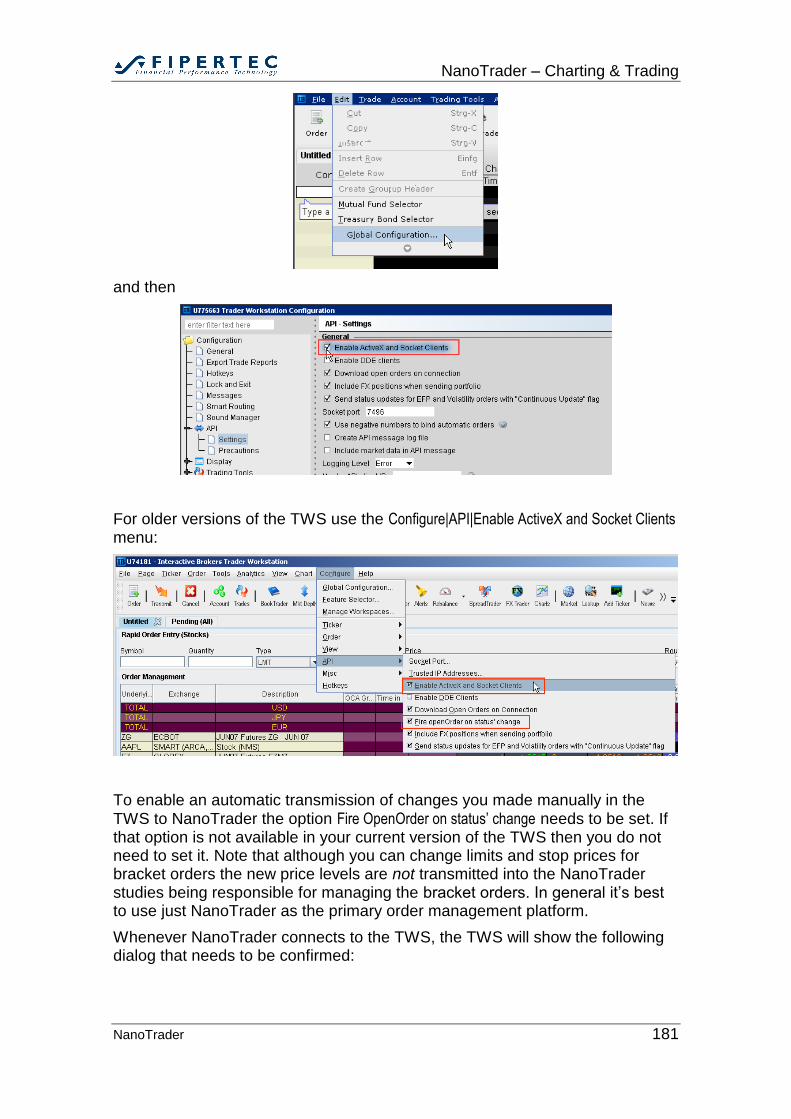
NanoTrader – Charting & Trading
NanoTrader 181
and then
For older versions of the TWS use the Configure|API|Enable ActiveX and Socket Clients menu:
To enable an automatic transmission of changes you made manually in the TWS to NanoTrader the option Fire OpenOrder on status’ change needs to be set. If that option is not available in your current version of the TWS then you do not need to set it. Note that although you can change limits and stop prices for bracket orders the new price levels are not transmitted into the NanoTrader studies being responsible for managing the bracket orders. In general it’s best to use just NanoTrader as the primary order management platform.
Whenever NanoTrader connects to the TWS, the TWS will show the following dialog that needs to be confirmed:
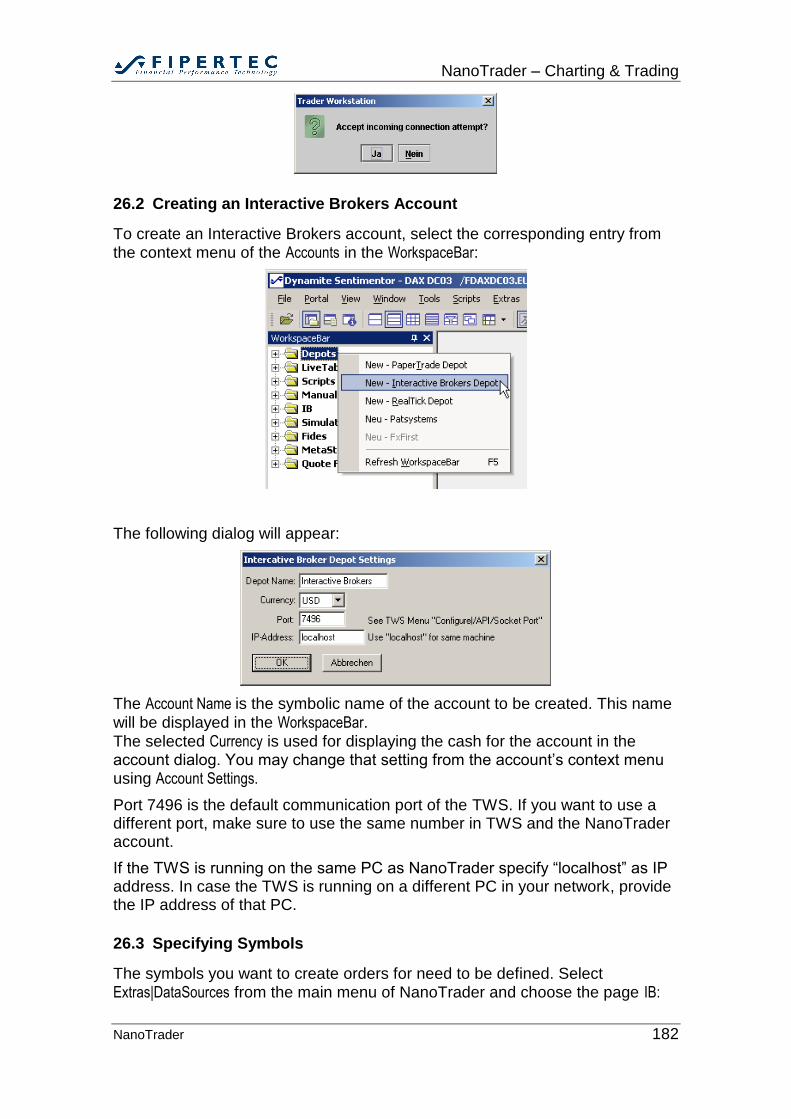
NanoTrader – Charting & Trading
NanoTrader 182
26.2 Creating an Interactive Brokers Account
To create an Interactive Brokers account, select the corresponding entry from the context menu of the Accounts in the WorkspaceBar:
The following dialog will appear:
The Account Name is the symbolic name of the account to be created. This name
will be displayed in the WorkspaceBar.
The selected Currency is used for displaying the cash for the account in the account dialog. You may change that setting from the account’s context menu using Account Settings.
Port 7496 is the default communication port of the TWS. If you want to use a different port, make sure to use the same number in TWS and the NanoTrader account.
If the TWS is running on the same PC as NanoTrader specify “localhost” as IP address. In case the TWS is running on a different PC in your network, provide the IP address of that PC.
26.3 Specifying Symbols
The symbols you want to create orders for need to be defined. Select Extras|DataSources from the main menu of NanoTrader and choose the page IB:
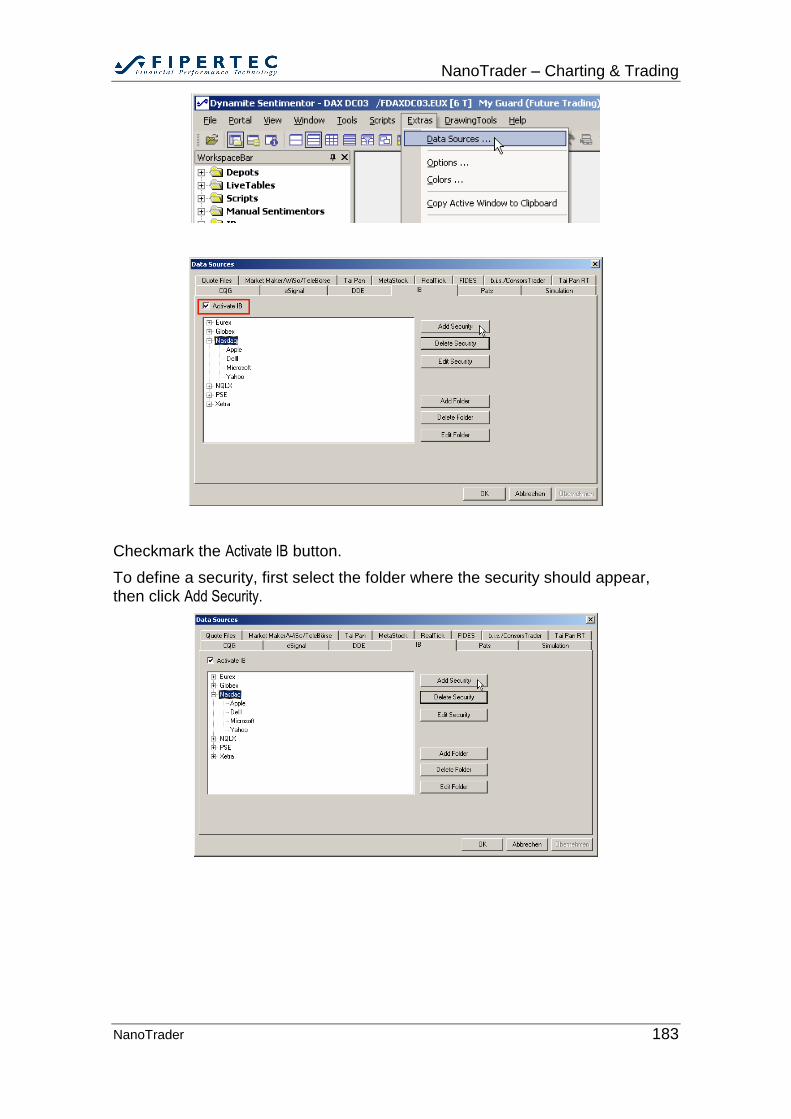
NanoTrader – Charting & Trading
NanoTrader 183
Checkmark the Activate IB button.
To define a security, first select the folder where the security should appear, then click Add Security.
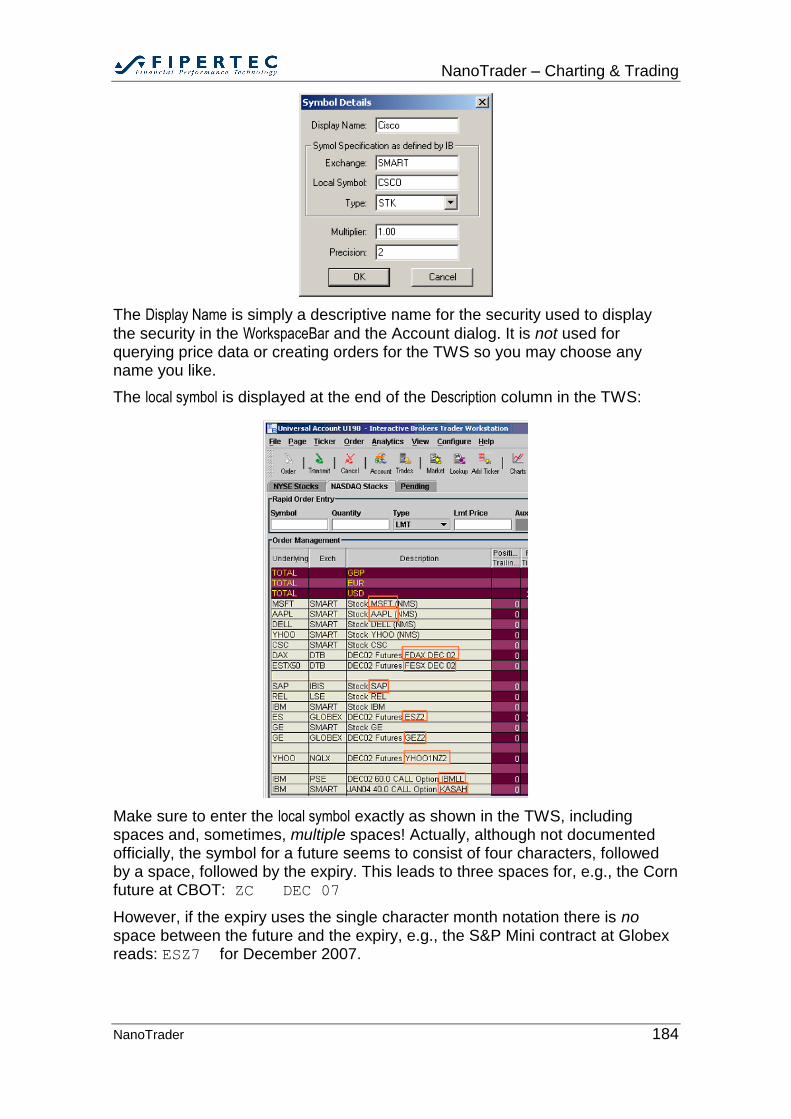
NanoTrader – Charting & Trading
NanoTrader 184
The Display Name is simply a descriptive name for the security used to display
the security in the WorkspaceBar and the Account dialog. It is not used for querying price data or creating orders for the TWS so you may choose any name you like.
The local symbol is displayed at the end of the Description column in the TWS:
Make sure to enter the local symbol exactly as shown in the TWS, including spaces and, sometimes, multiple spaces! Actually, although not documented officially, the symbol for a future seems to consist of four characters, followed by a space, followed by the expiry. This leads to three spaces for, e.g., the Corn future at CBOT: ZC DEC 07
However, if the expiry uses the single character month notation there is no space between the future and the expiry, e.g., the S&P Mini contract at Globex reads: ESZ7 for December 2007.
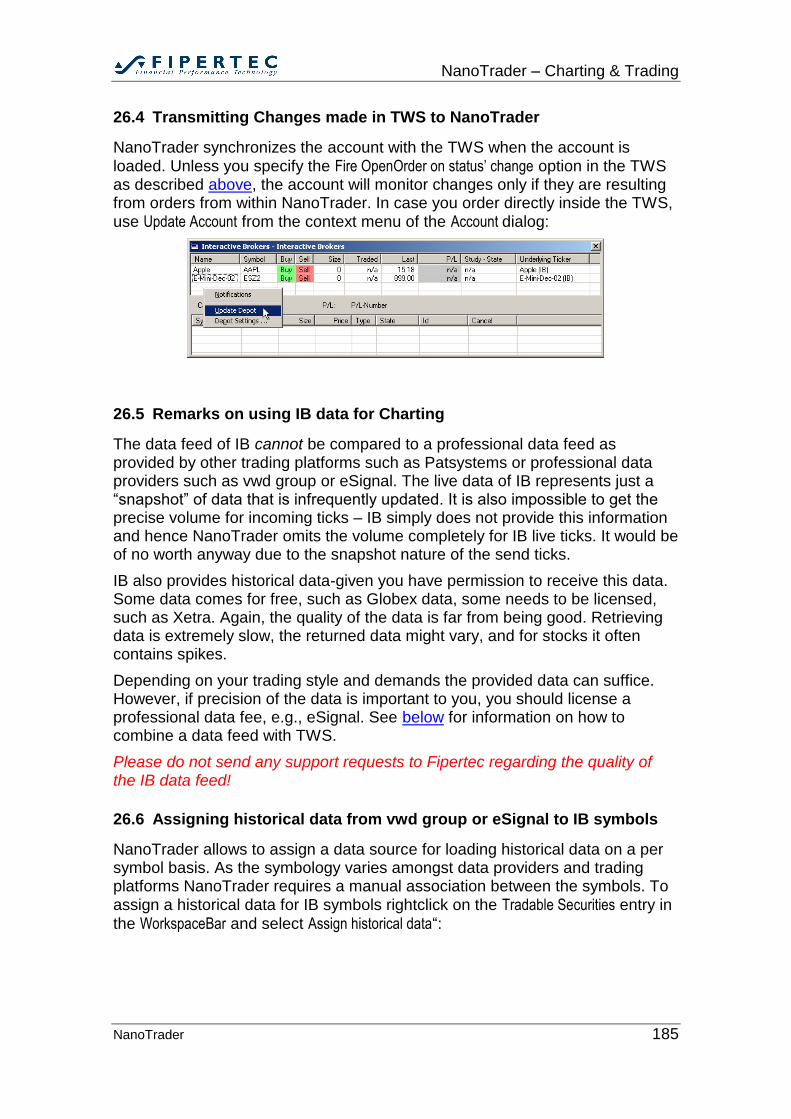
NanoTrader – Charting & Trading
NanoTrader 185
26.4 Transmitting Changes made in TWS to NanoTrader
NanoTrader synchronizes the account with the TWS when the account is loaded. Unless you specify the Fire OpenOrder on status’ change option in the TWS as described above, the account will monitor changes only if they are resulting from orders from within NanoTrader. In case you order directly inside the TWS, use Update Account from the context menu of the Account dialog:
26.5 Remarks on using IB data for Charting
The data feed of IB cannot be compared to a professional data feed as provided by other trading platforms such as Patsystems or professional data providers such as vwd group or eSignal. The live data of IB represents just a “snapshot” of data that is infrequently updated. It is also impossible to get the precise volume for incoming ticks – IB simply does not provide this information and hence NanoTrader omits the volume completely for IB live ticks. It would be of no worth anyway due to the snapshot nature of the send ticks.
IB also provides historical data-given you have permission to receive this data. Some data comes for free, such as Globex data, some needs to be licensed, such as Xetra. Again, the quality of the data is far from being good. Retrieving data is extremely slow, the returned data might vary, and for stocks it often contains spikes.
Depending on your trading style and demands the provided data can suffice. However, if precision of the data is important to you, you should license a professional data fee, e.g., eSignal. See below for information on how to combine a data feed with TWS.
Please do not send any support requests to Fipertec regarding the quality of the IB data feed!
26.6 Assigning historical data from vwd group or eSignal to IB symbols
NanoTrader allows to assign a data source for loading historical data on a per symbol basis. As the symbology varies amongst data providers and trading platforms NanoTrader requires a manual association between the symbols. To assign a historical data for IB symbols rightclick on the Tradable Securities entry in
the WorkspaceBar and select Assign historical data“:
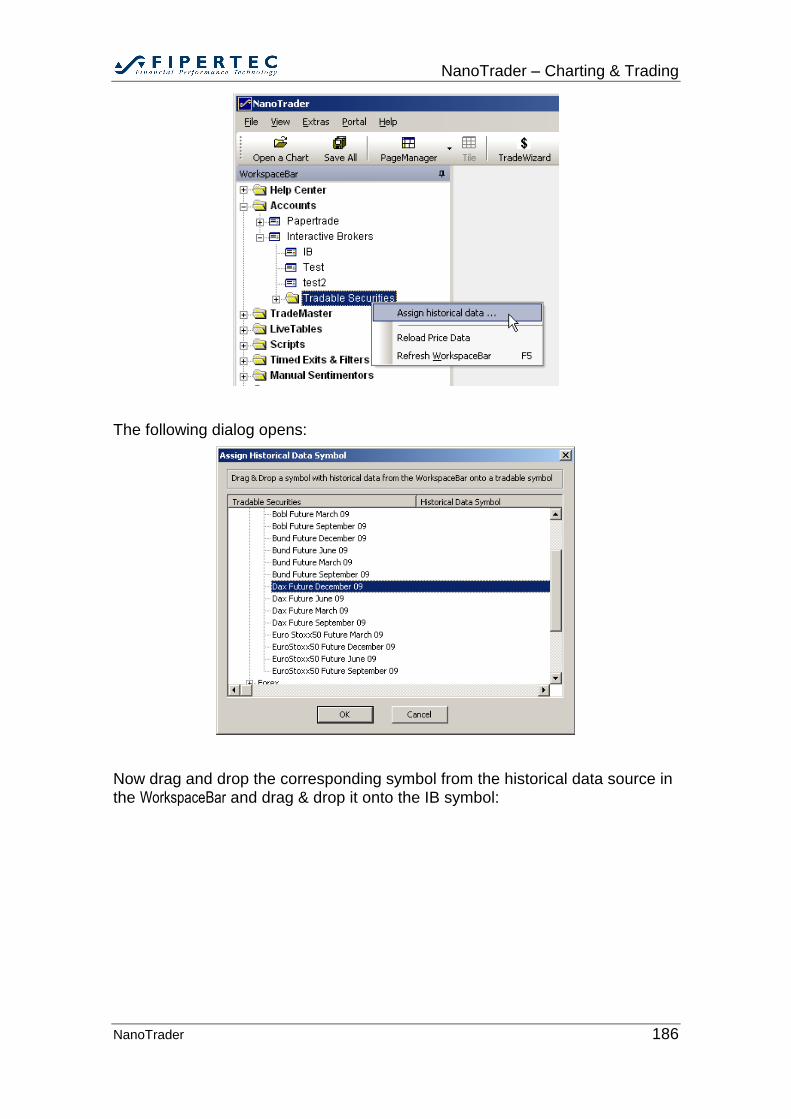
NanoTrader – Charting & Trading
NanoTrader 186
The following dialog opens:
Now drag and drop the corresponding symbol from the historical data source in the WorkspaceBar and drag & drop it onto the IB symbol:
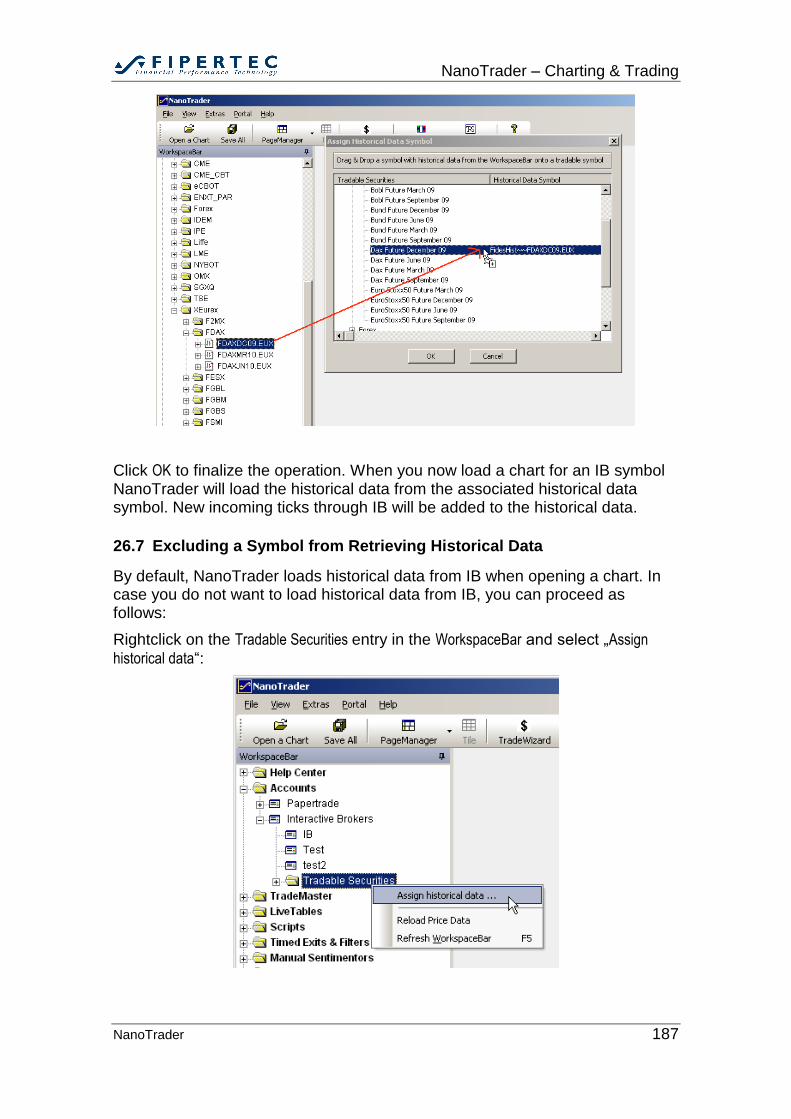
NanoTrader – Charting & Trading
NanoTrader 187
Click OK to finalize the operation. When you now load a chart for an IB symbol NanoTrader will load the historical data from the associated historical data symbol. New incoming ticks through IB will be added to the historical data.
26.7 Excluding a Symbol from Retrieving Historical Data
By default, NanoTrader loads historical data from IB when opening a chart. In case you do not want to load historical data from IB, you can proceed as follows:
Rightclick on the Tradable Securities entry in the WorkspaceBar and select „Assign
historical data“:
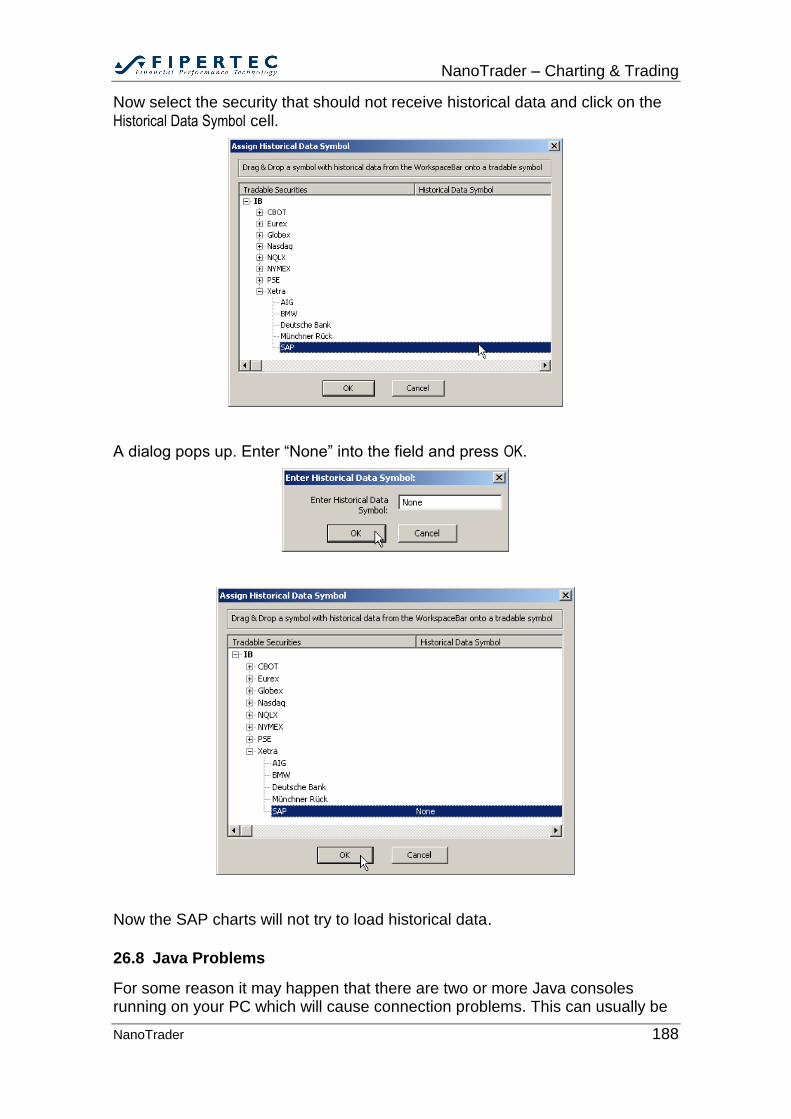
NanoTrader – Charting & Trading
NanoTrader 188
Now select the security that should not receive historical data and click on the Historical Data Symbol cell.
A dialog pops up. Enter “None” into the field and press OK.
Now the SAP charts will not try to load historical data.
26.8 Java Problems
For some reason it may happen that there are two or more Java consoles running on your PC which will cause connection problems. This can usually be
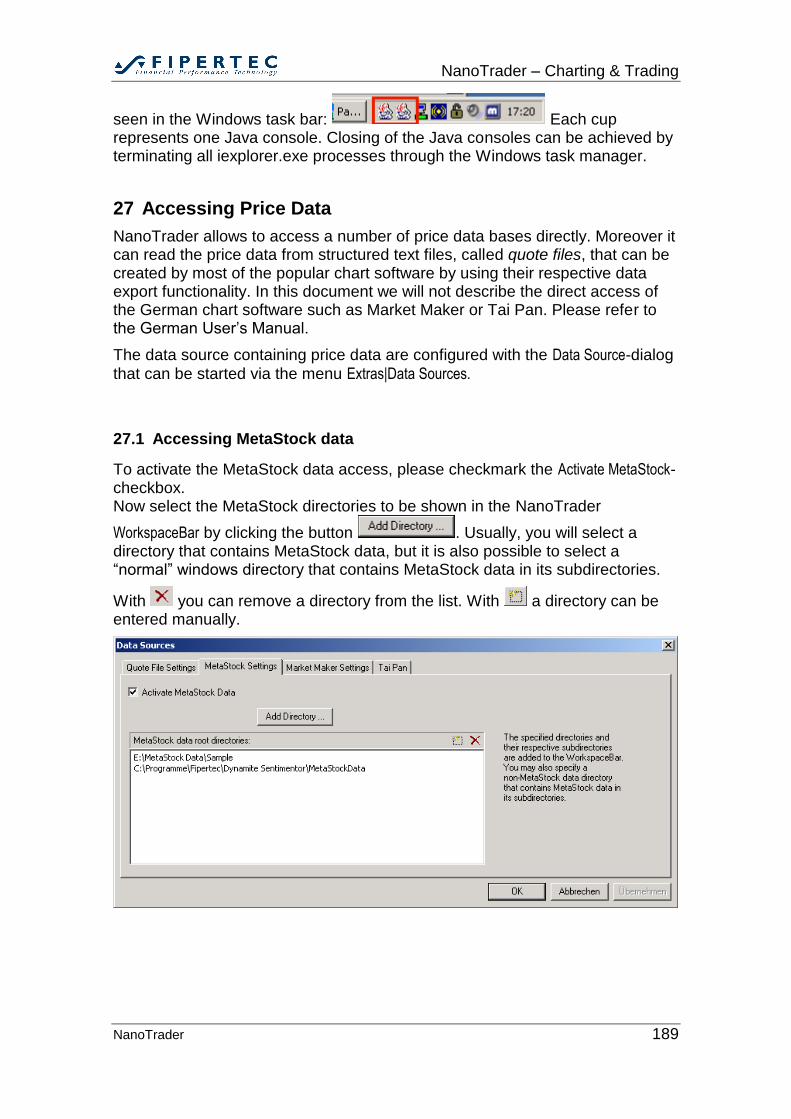
NanoTrader – Charting & Trading
NanoTrader 189
seen in the Windows task bar: Each cup represents one Java console. Closing of the Java consoles can be achieved by terminating all iexplorer.exe processes through the Windows task manager.
27 Accessing Price Data
NanoTrader allows to access a number of price data bases directly. Moreover it can read the price data from structured text files, called quote files, that can be created by most of the popular chart software by using their respective data export functionality. In this document we will not describe the direct access of the German chart software such as Market Maker or Tai Pan. Please refer to the German User’s Manual.
The data source containing price data are configured with the Data Source-dialog
that can be started via the menu Extras|Data Sources.
27.1 Accessing MetaStock data
To activate the MetaStock data access, please checkmark the Activate MetaStock-checkbox. Now select the MetaStock directories to be shown in the NanoTrader
WorkspaceBar by clicking the button . Usually, you will select a directory that contains MetaStock data, but it is also possible to select a “normal” windows directory that contains MetaStock data in its subdirectories.
With you can remove a directory from the list. With a directory can be entered manually.
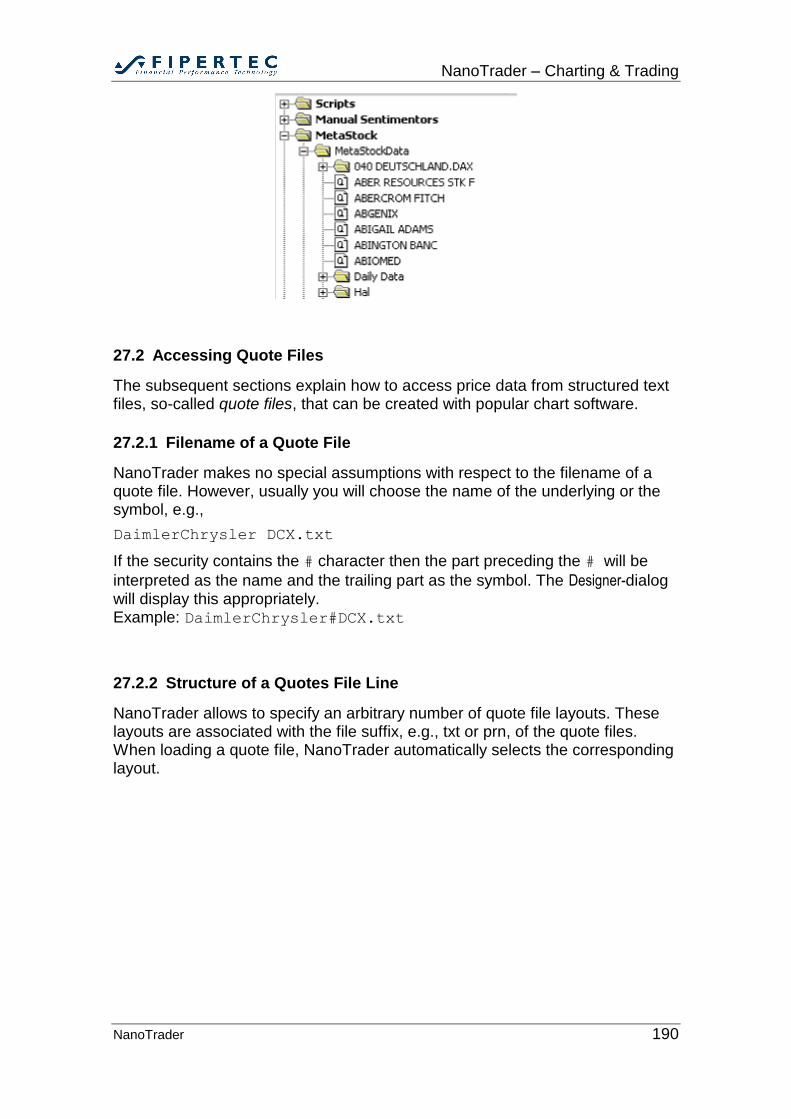
NanoTrader – Charting & Trading
NanoTrader 190
27.2 Accessing Quote Files
The subsequent sections explain how to access price data from structured text files, so-called quote files, that can be created with popular chart software.
27.2.1 Filename of a Quote File
NanoTrader makes no special assumptions with respect to the filename of a quote file. However, usually you will choose the name of the underlying or the symbol, e.g.,
DaimlerChrysler DCX.txt
If the security contains the # character then the part preceding the # will be
interpreted as the name and the trailing part as the symbol. The Designer-dialog will display this appropriately. Example: DaimlerChrysler#DCX.txt
27.2.2 Structure of a Quotes File Line
NanoTrader allows to specify an arbitrary number of quote file layouts. These layouts are associated with the file suffix, e.g., txt or prn, of the quote files. When loading a quote file, NanoTrader automatically selects the corresponding layout.
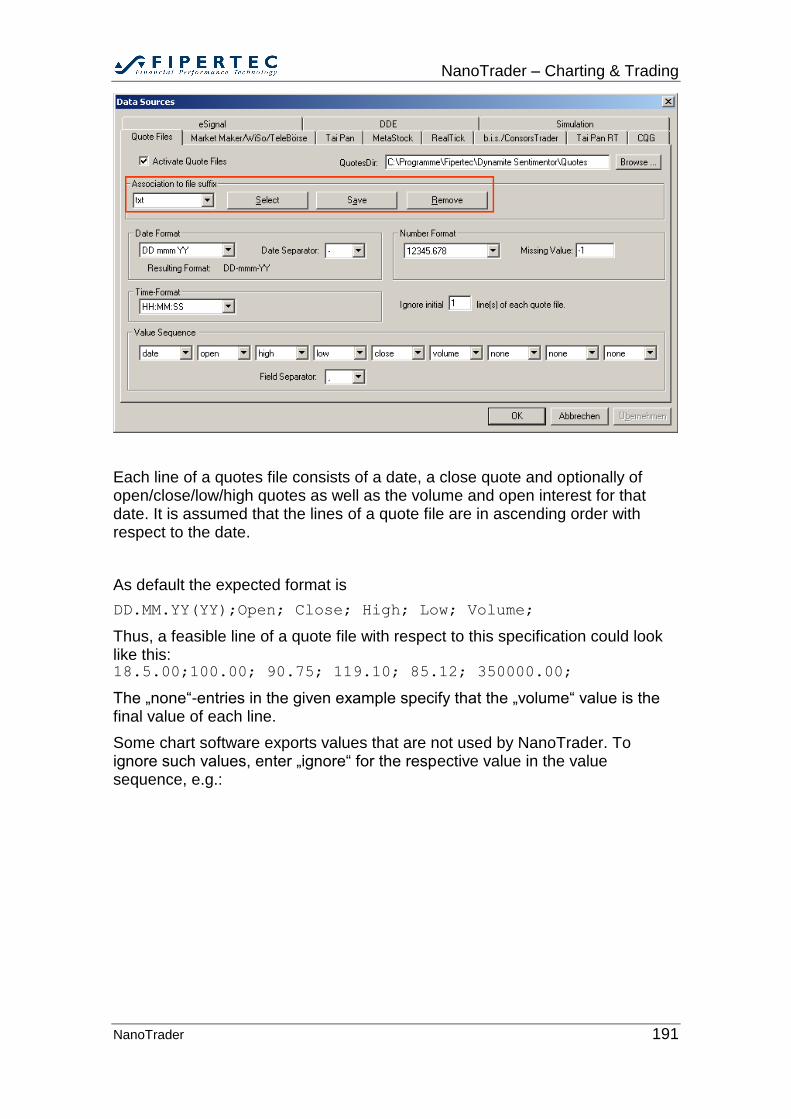
NanoTrader – Charting & Trading
NanoTrader 191
Each line of a quotes file consists of a date, a close quote and optionally of open/close/low/high quotes as well as the volume and open interest for that date. It is assumed that the lines of a quote file are in ascending order with respect to the date.
As default the expected format is
DD.MM.YY(YY);Open; Close; High; Low; Volume;
Thus, a feasible line of a quote file with respect to this specification could look like this: 18.5.00;100.00; 90.75; 119.10; 85.12; 350000.00;
The „none“-entries in the given example specify that the „volume“ value is the final value of each line.
Some chart software exports values that are not used by NanoTrader. To ignore such values, enter „ignore“ for the respective value in the value sequence, e.g.:
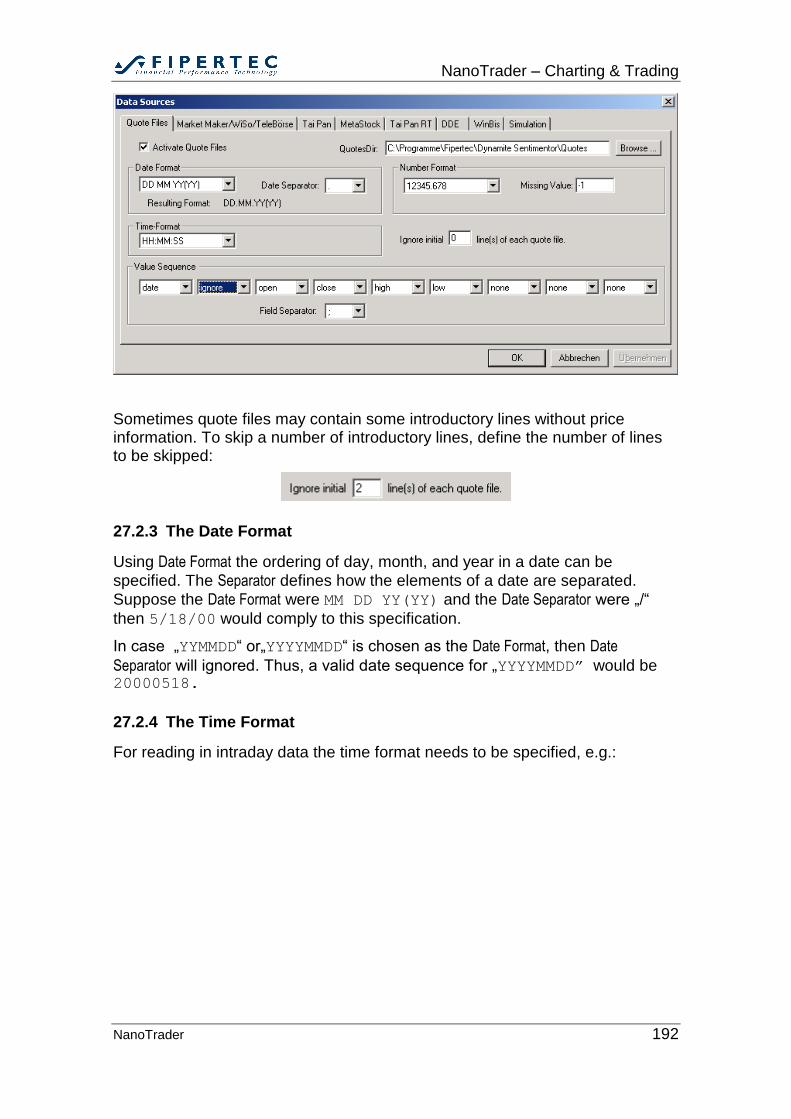
NanoTrader – Charting & Trading
NanoTrader 192
Sometimes quote files may contain some introductory lines without price information. To skip a number of introductory lines, define the number of lines to be skipped:
27.2.3 The Date Format
Using Date Format the ordering of day, month, and year in a date can be
specified. The Separator defines how the elements of a date are separated.
Suppose the Date Format were MM DD YY(YY) and the Date Separator were „/“
then 5/18/00 would comply to this specification.
In case „YYMMDD“ or„YYYYMMDD“ is chosen as the Date Format, then Date
Separator will ignored. Thus, a valid date sequence for „YYYYMMDD” would be 20000518.
27.2.4 The Time Format
For reading in intraday data the time format needs to be specified, e.g.:
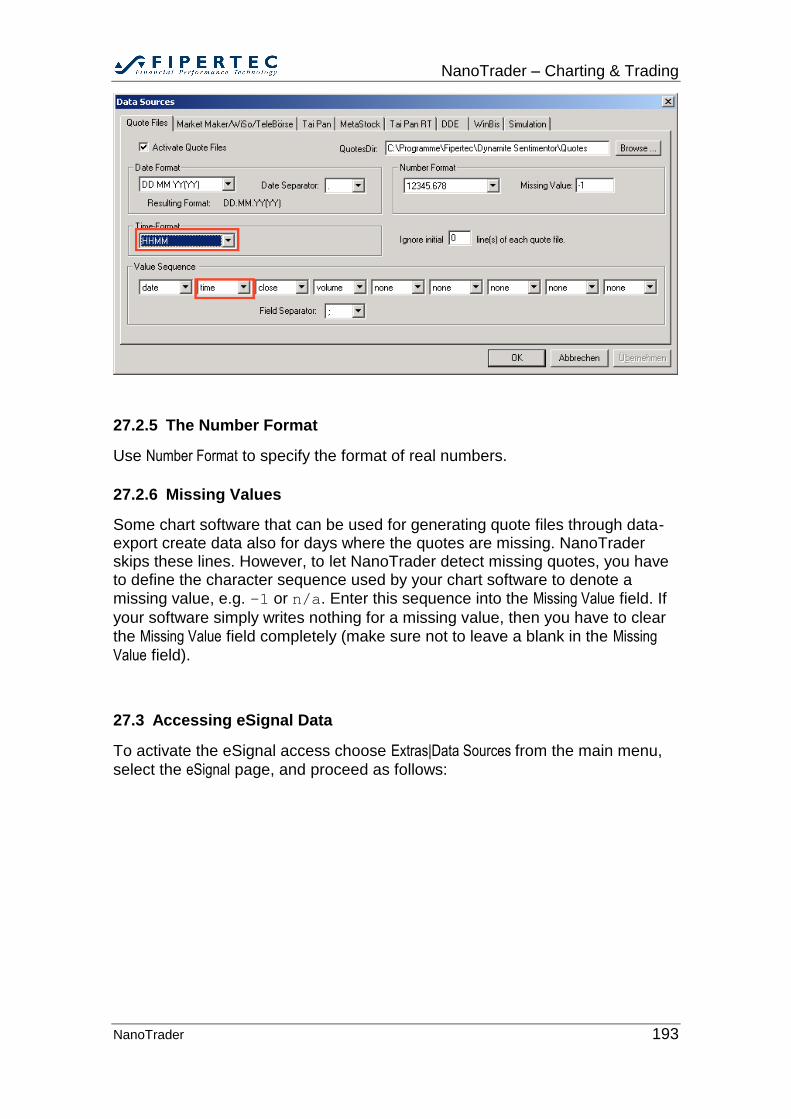
NanoTrader – Charting & Trading
NanoTrader 193
27.2.5 The Number Format
Use Number Format to specify the format of real numbers.
27.2.6 Missing Values
Some chart software that can be used for generating quote files through data-export create data also for days where the quotes are missing. NanoTrader skips these lines. However, to let NanoTrader detect missing quotes, you have to define the character sequence used by your chart software to denote a missing value, e.g. –1 or n/a. Enter this sequence into the Missing Value field. If
your software simply writes nothing for a missing value, then you have to clear the Missing Value field completely (make sure not to leave a blank in the Missing
Value field).
27.3 Accessing eSignal Data
To activate the eSignal access choose Extras|Data Sources from the main menu,
select the eSignal page, and proceed as follows:
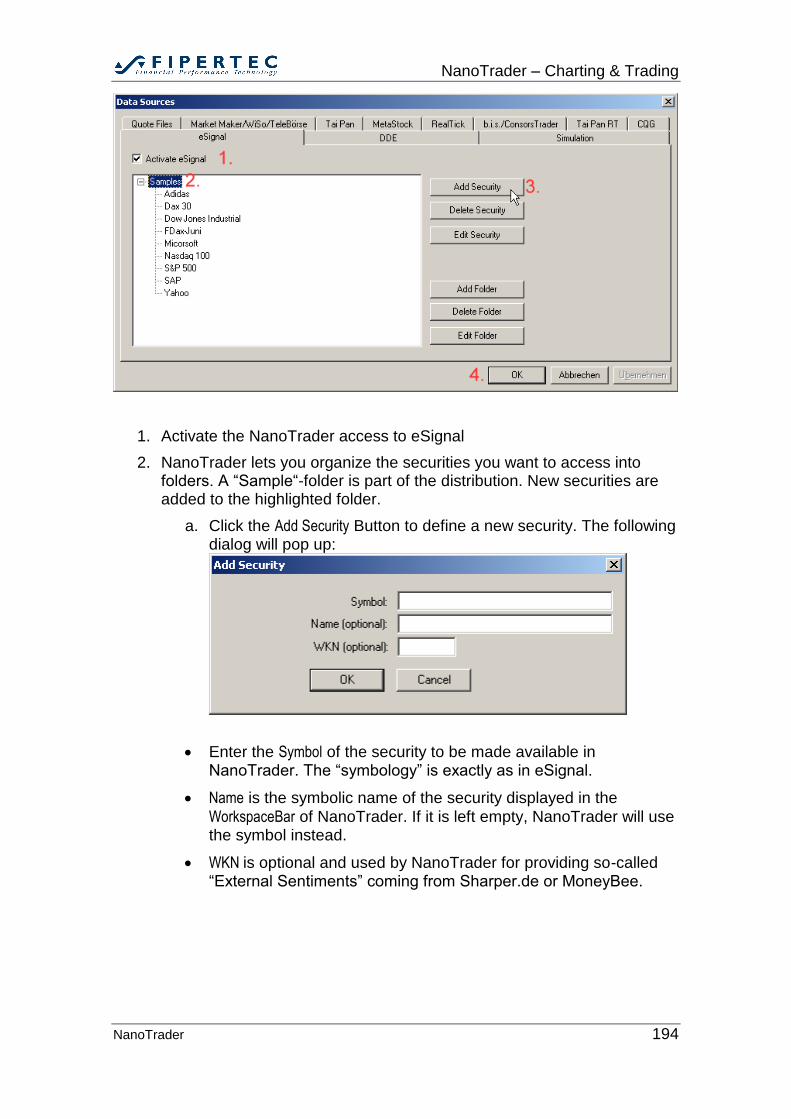
NanoTrader – Charting & Trading
NanoTrader 194
1. Activate the NanoTrader access to eSignal
2. NanoTrader lets you organize the securities you want to access into folders. A “Sample“-folder is part of the distribution. New securities are added to the highlighted folder.
a. Click the Add Security Button to define a new security. The following dialog will pop up:
Enter the Symbol of the security to be made available in NanoTrader. The “symbology” is exactly as in eSignal.
Name is the symbolic name of the security displayed in the
WorkspaceBar of NanoTrader. If it is left empty, NanoTrader will use the symbol instead.
WKN is optional and used by NanoTrader for providing so-called “External Sentiments” coming from Sharper.de or MoneyBee.
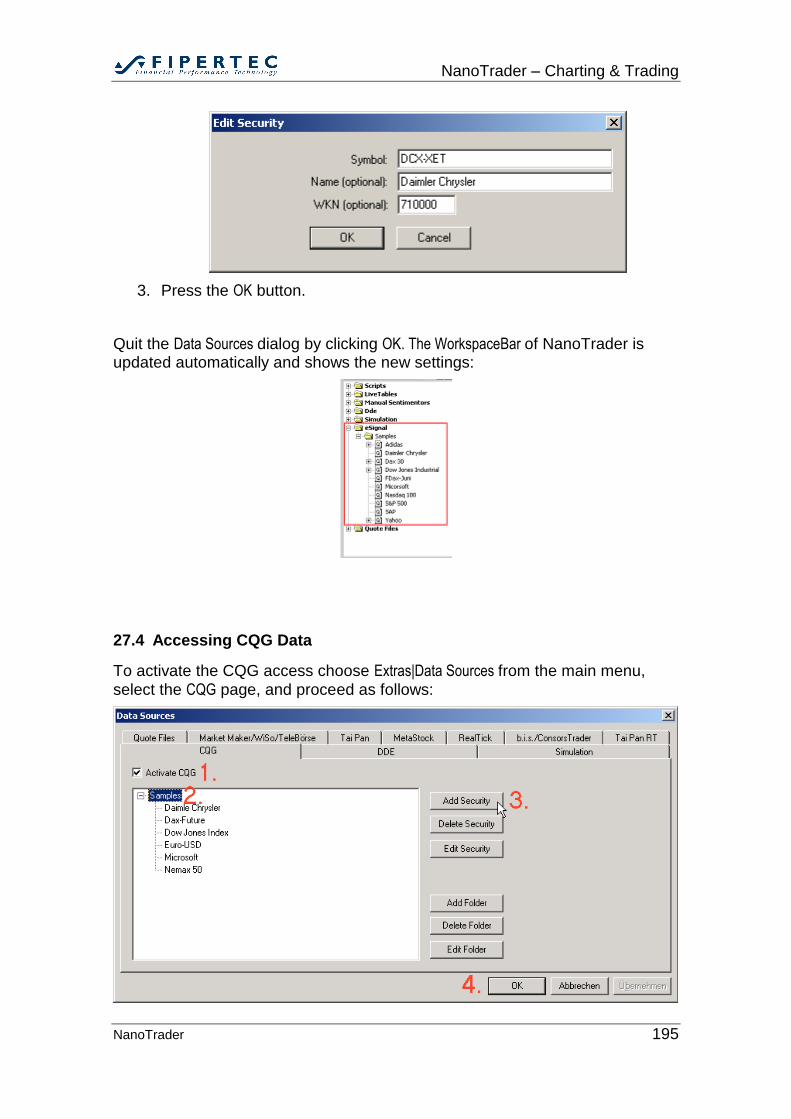
NanoTrader – Charting & Trading
NanoTrader 195
3. Press the OK button.
Quit the Data Sources dialog by clicking OK. The WorkspaceBar of NanoTrader is updated automatically and shows the new settings:
27.4 Accessing CQG Data
To activate the CQG access choose Extras|Data Sources from the main menu,
select the CQG page, and proceed as follows:
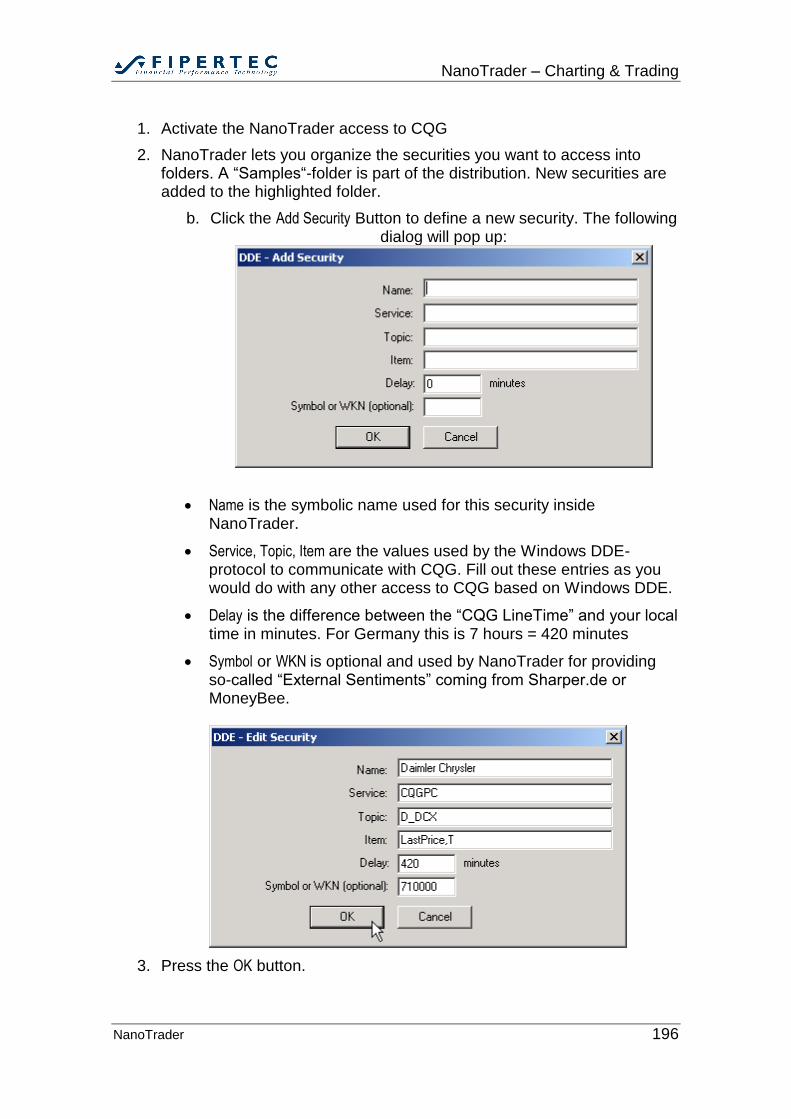
NanoTrader – Charting & Trading
NanoTrader 196
1. Activate the NanoTrader access to CQG
2. NanoTrader lets you organize the securities you want to access into folders. A “Samples“-folder is part of the distribution. New securities are added to the highlighted folder.
b. Click the Add Security Button to define a new security. The following dialog will pop up:
Name is the symbolic name used for this security inside NanoTrader.
Service, Topic, Item are the values used by the Windows DDE-protocol to communicate with CQG. Fill out these entries as you would do with any other access to CQG based on Windows DDE.
Delay is the difference between the “CQG LineTime” and your local time in minutes. For Germany this is 7 hours = 420 minutes
Symbol or WKN is optional and used by NanoTrader for providing so-called “External Sentiments” coming from Sharper.de or MoneyBee.
3. Press the OK button.
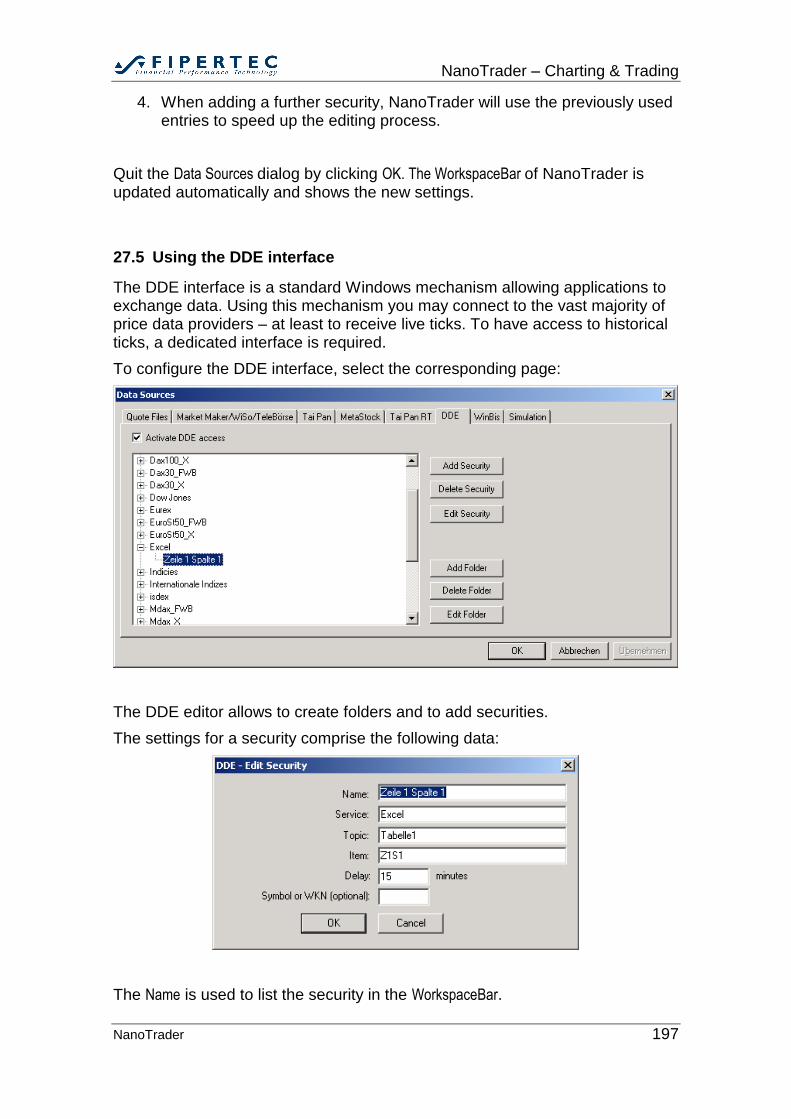
NanoTrader – Charting & Trading
NanoTrader 197
4. When adding a further security, NanoTrader will use the previously used entries to speed up the editing process.
Quit the Data Sources dialog by clicking OK. The WorkspaceBar of NanoTrader is updated automatically and shows the new settings.
27.5 Using the DDE interface
The DDE interface is a standard Windows mechanism allowing applications to exchange data. Using this mechanism you may connect to the vast majority of price data providers – at least to receive live ticks. To have access to historical ticks, a dedicated interface is required.
To configure the DDE interface, select the corresponding page:
The DDE editor allows to create folders and to add securities.
The settings for a security comprise the following data:
The Name is used to list the security in the WorkspaceBar.
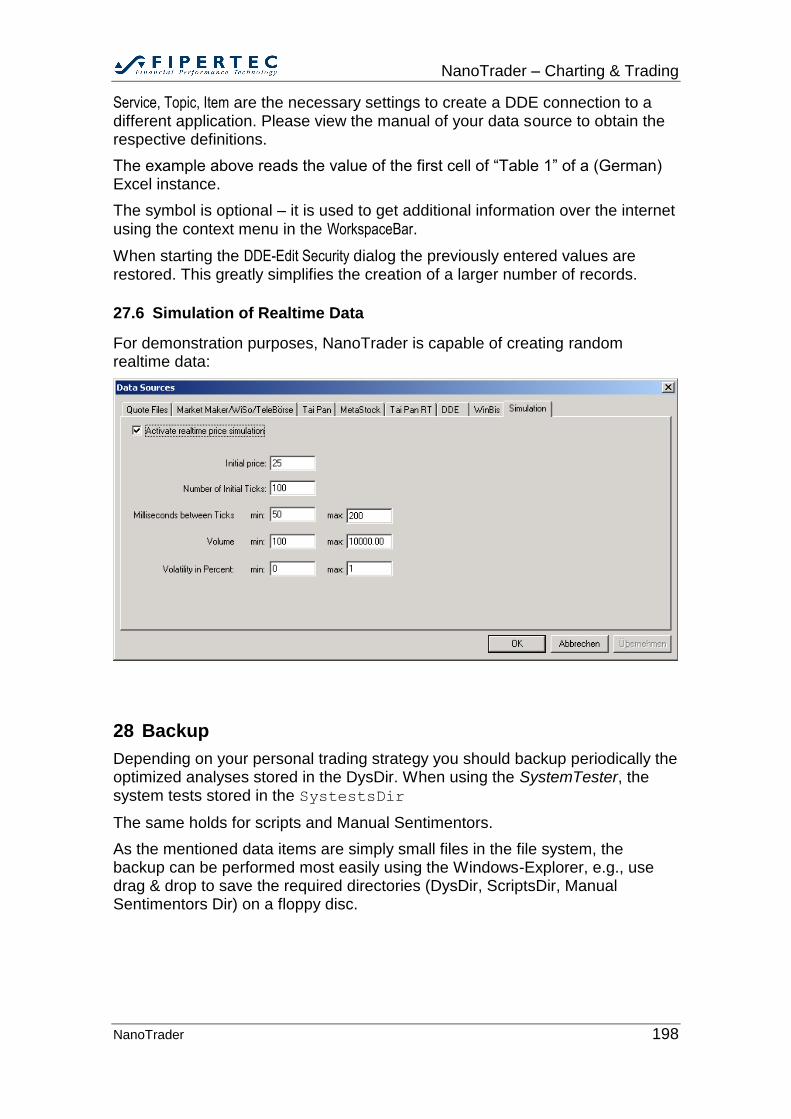
NanoTrader – Charting & Trading
NanoTrader 198
Service, Topic, Item are the necessary settings to create a DDE connection to a different application. Please view the manual of your data source to obtain the respective definitions.
The example above reads the value of the first cell of “Table 1” of a (German) Excel instance.
The symbol is optional – it is used to get additional information over the internet using the context menu in the WorkspaceBar.
When starting the DDE-Edit Security dialog the previously entered values are restored. This greatly simplifies the creation of a larger number of records.
27.6 Simulation of Realtime Data
For demonstration purposes, NanoTrader is capable of creating random realtime data:
28 Backup
Depending on your personal trading strategy you should backup periodically the optimized analyses stored in the DysDir. When using the SystemTester, the system tests stored in the SystestsDir
The same holds for scripts and Manual Sentimentors.
As the mentioned data items are simply small files in the file system, the backup can be performed most easily using the Windows-Explorer, e.g., use drag & drop to save the required directories (DysDir, ScriptsDir, Manual Sentimentors Dir) on a floppy disc.
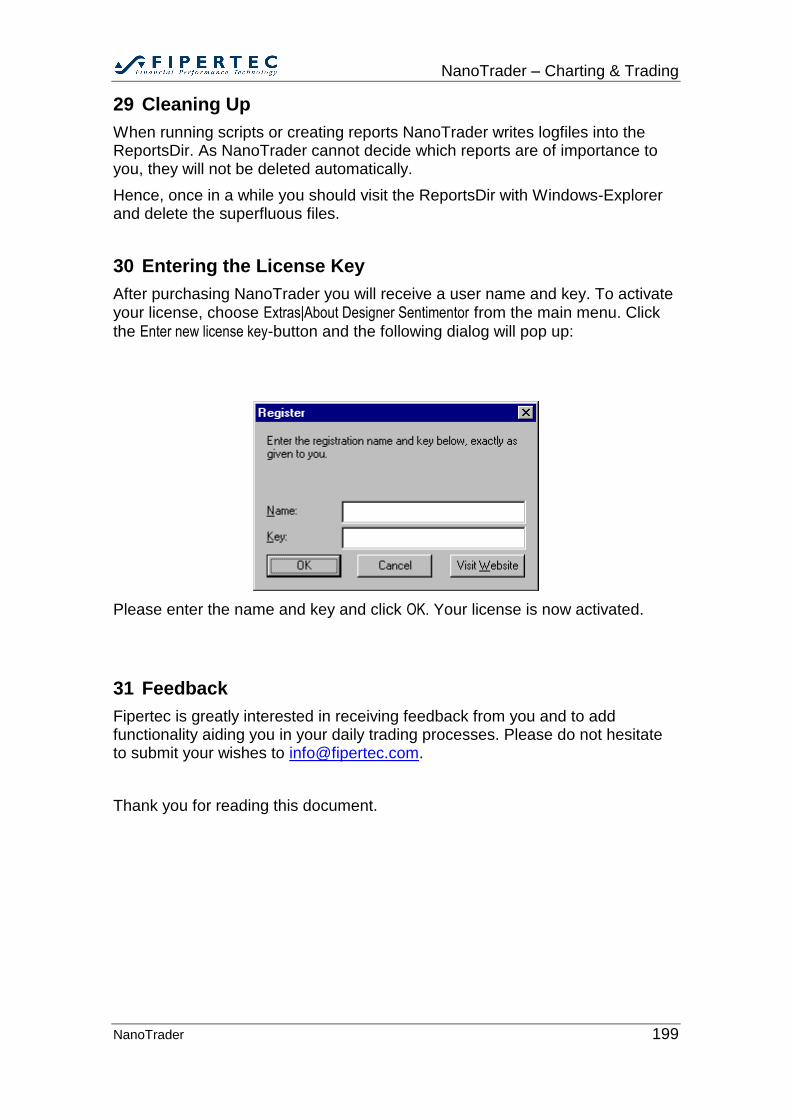
NanoTrader – Charting & Trading
NanoTrader 199
29 Cleaning Up
When running scripts or creating reports NanoTrader writes logfiles into the ReportsDir. As NanoTrader cannot decide which reports are of importance to you, they will not be deleted automatically.
Hence, once in a while you should visit the ReportsDir with Windows-Explorer and delete the superfluous files.
30 Entering the License Key
After purchasing NanoTrader you will receive a user name and key. To activate your license, choose Extras|About Designer Sentimentor from the main menu. Click
the Enter new license key-button and the following dialog will pop up:
Please enter the name and key and click OK. Your license is now activated.
31 Feedback
Fipertec is greatly interested in receiving feedback from you and to add functionality aiding you in your daily trading processes. Please do not hesitate to submit your wishes to [email protected].
Thank you for reading this document.