Embed Size (px)
Citation preview
Danske Bank to Ireland
Acquisition of
National Irish Bank & Northern Bank
Copenhagen, December 14, 2004

2
Agenda
� Transaction highlights 3
� Strategic rationale & value creation 8
� Compliance issues 22
� Further process 23
� Further information on the Web 24
3
Transaction summary- Increased focus on retail banking
� Danske Bank to acquire National Irish Bank (NIB) and Northern
Bank (NB) for GBP967m / DKr10.4bn
� Expands foreign retail lending by 37% to DKr203bn
� Business development and enhanced productivity through
efficient use of IT
� Total cost synergies of approximately DKr350m
� Earnings per share accretive in 2006 after conversion
� Capital ratios will be close to targets by year-end 2005
� Guidance for 2004: core earnings of about DKr12bn
Transaction highlights

4
Vision for the acquisition- Develop the retail business from a stable base
� Stable and profitable base from which to expand operations
� Leading bank in Northern Ireland with potential to grow retail business
� Attractive position in the Republic of Ireland as beachhead for expansion
in fast-growing Irish market
� Basis for improving services and product offerings
� Leverage Danske Bank�s retail expertise
� Enhance productivity through efficient use of IT
� Danske Bank�s size will enhance ability to compete with larger local
players
� Expand branch network over time, leveraging existing infrastructure
Transaction highlights
5
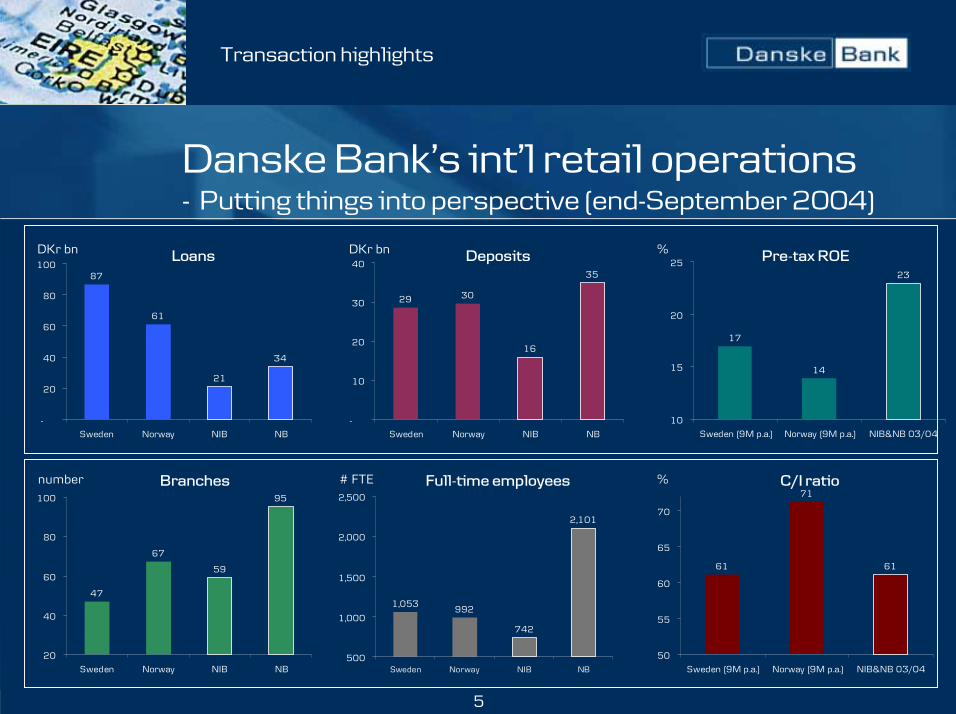
61
71
61
50
55
60
65
70
Sweden (9M p.a.) Norway (9M p.a.) NIB&NB 03/04
17
14
23
10
15
20
25
Sweden (9M p.a.) Norway (9M p.a.) NIB&NB 03/04
29 30
16
35
-
10
20
30
40
Sweden Norway NIB NB
87
61
21
34
-
20
40
60
80
100
Sweden Norway NIB NB
1,053992
742
2,101
500
1,000
1,500
2,000
2,500
Sweden Norway NIB NB
47
67
59
95
20
40
60
80
100
Sweden Norway NIB NB
Danske Bank�s int�l retail operations- Putting things into perspective (end-September 2004)
Transaction highlights
Loans Deposits
Branches Full-time employees
DKr bn DKr bn
# FTEnumber
Pre-tax ROE%
C/I ratio%
6
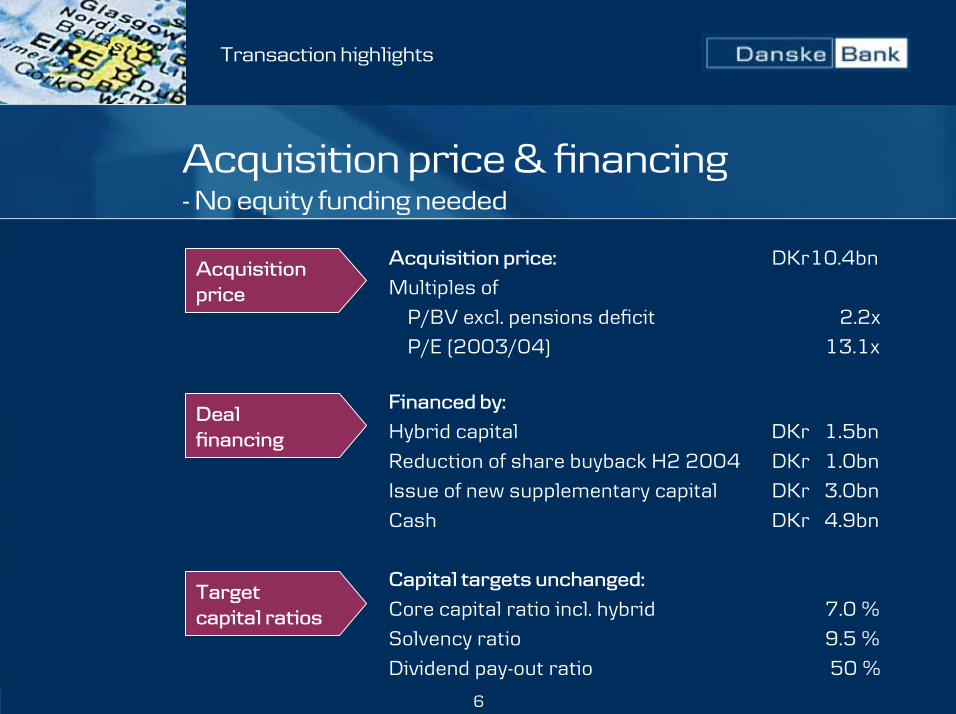
Acquisition price & financing- No equity funding needed
Transaction highlights
Acquisition price: DKr10.4bnMultiples of
P/BV excl. pensions deficit 2.2xP/E (2003/04) 13.1x
Financed by:Hybrid capital DKr 1.5bn
Reduction of share buyback H2 2004 DKr 1.0bnIssue of new supplementary capital DKr 3.0bn
Cash DKr 4.9bn
Capital targets unchanged:
Core capital ratio incl. hybrid 7.0 %Solvency ratio 9.5 %
Dividend pay-out ratio 50 %
Acquisition price
Deal financing
Target capital ratios
7
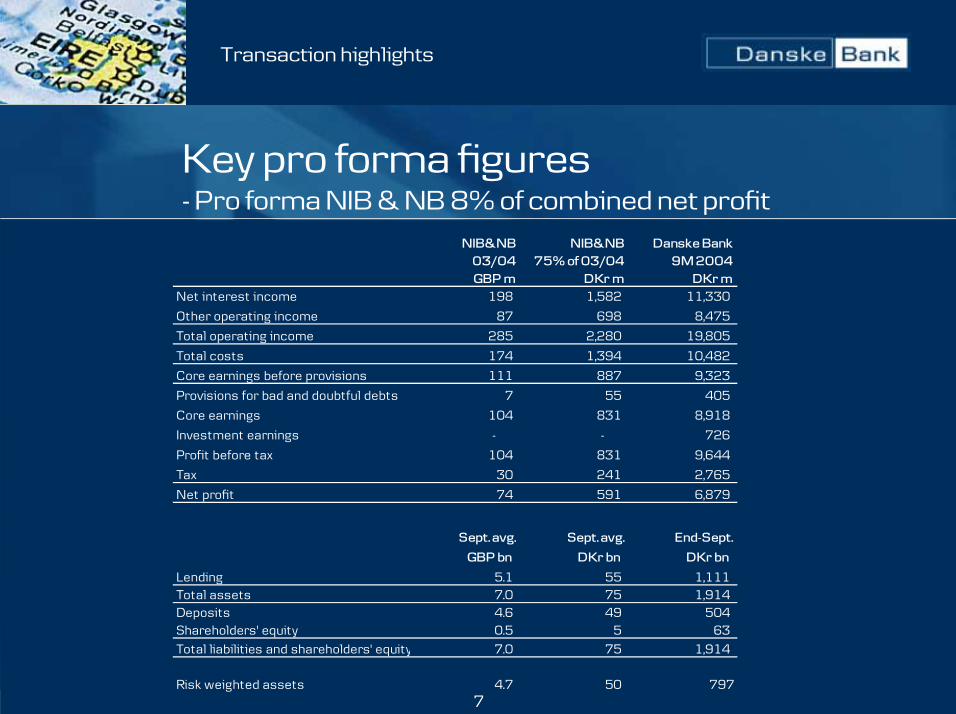
Key pro forma figures- Pro forma NIB & NB 8% of combined net profit
Transaction highlights
NIB&NB 03/04GBP m
NIB&NB 75% of 03/04
DKr m
Danske Bank9M 2004
DKr mNet interest income 198 1,582 11,330
Other operating income 87 698 8,475
Total operating income 285 2,280 19,805
Total costs 174 1,394 10,482
Core earnings before provisions 111 887 9,323
Provisions for bad and doubtful debts 7 55 405
Core earnings 104 831 8,918
Investment earnings - - 726
Profit before tax 104 831 9,644
Tax 30 241 2,765
Net profit 74 591 6,879
Sept. avg. Sept. avg. End-Sept.
GBP bn DKr bn DKr bn
Lending 5.1 55 1,111 Total assets 7.0 75 1,914 Deposits 4.6 49 504 Shareholders' equity 0.5 5 63 Total liabilities and shareholders' equity 7.0 75 1,914
Risk weighted assets 4.7 50 797
8
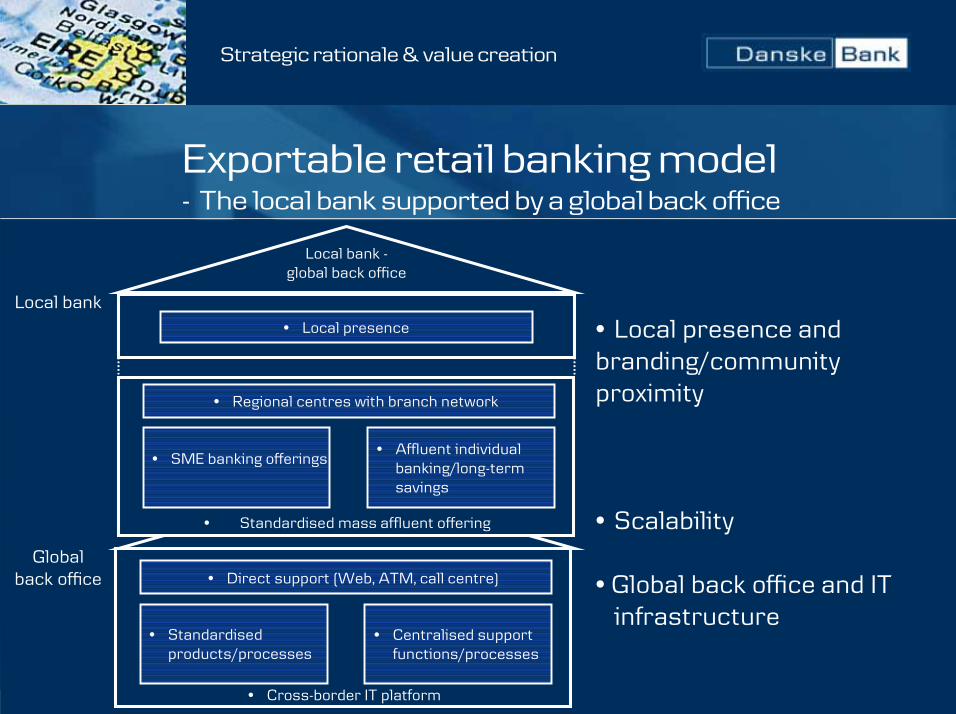
Exportable retail banking model- The local bank supported by a global back office
Local bank -global back office
� Local presence
Local bank
Globalback office
� Standardised mass affluent offering
� Cross-border IT platform
� Regional centres with branch network
� SME banking offerings� Affluent individual
banking/long-termsavings
� Direct support (Web, ATM, call centre)
� Standardisedproducts/processes
� Centralised supportfunctions/processes
� Local presence and branding/community proximity
� Scalability � Global back office and IT
infrastructure
Strategic rationale & value creation
9
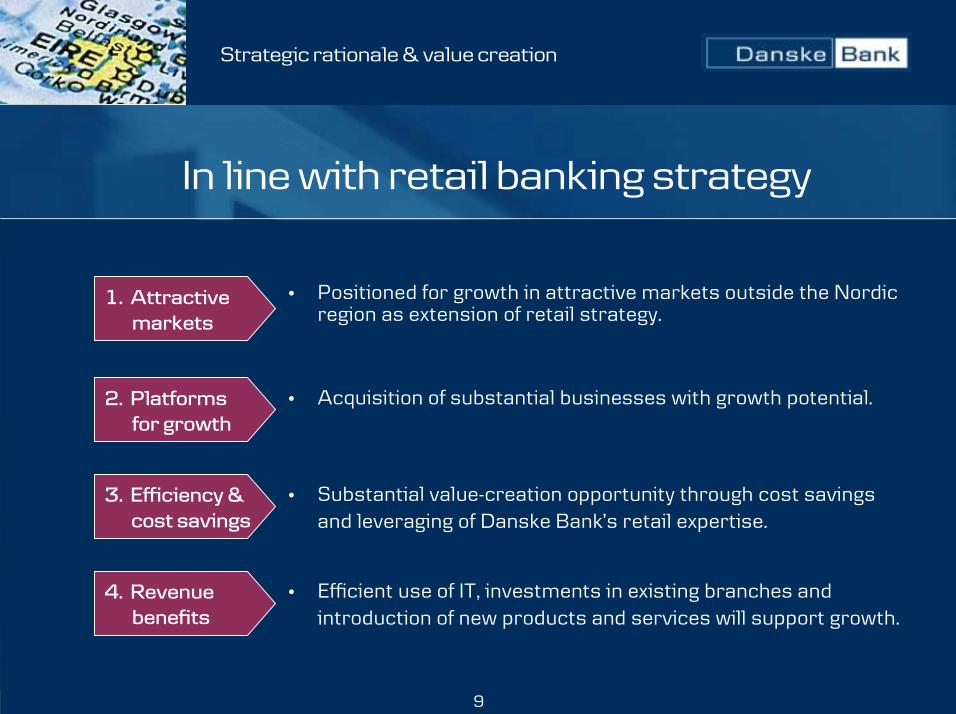
In line with retail banking strategy
� Positioned for growth in attractive markets outside the Nordicregion as extension of retail strategy.
Strategic rationale & value creation
1. Attractive markets
2. Platformsfor growth
� Acquisition of substantial businesses with growth potential.
3. Efficiency & cost savings
� Substantial value-creation opportunity through cost savingsand leveraging of Danske Bank�s retail expertise.
4. Revenuebenefits
� Efficient use of IT, investments in existing branches andintroduction of new products and services will support growth.

10
3.7%
4.7% 4.9% 4.6%3.9% 3.7%
2003 2004E 2005E 2006E 2007E 2008E
Highest growth in the EU
2.2%
3.2%
2.3%2.0%
2.4% 2.5%
2003 2004E 2005E 2006E 2007E 2008E
Republic of Ireland
� Fastest growing economy in the EU from1994 to 2002
� Strong demographics, low interest rates, andcorporate tax rates with financial supportfrom EU
The United Kingdom
� Northern Ireland fastest growing
regional economy in the UK in 2004
� Stable growth underpinned by improving
political situation and EU/UK funding
1. Attractive markets
Strategic rationale & value creation
Source: GS Research & Economist intelligence unit
Source: GS Research & Economist intelligence unit
GDP growth (Y/Y real growth) Republic of Ireland
GDP growth (Y/Y real growth) The United Kingdom
GDP growth (Y/Y real growth) Euro zone
GDP growth (Y/Y real growth) Euro zone

11
0
40
80
120
19
94
19
95
19
96
19
97
19
98
19
99
20
00
20
01
20
02
20
03
20
04
E
20
05
E
20
06
E
5
15
25
35
High lending growth in Ireland
Republic of Ireland - Retail lending
� Average annual lending growth of 20% in thepast five years
� Growth expectations lower, but still healthyoutlook
1. Attractive markets
Strategic rationale & value creation
Source: Central Bank & Financial Services of Ireland/Danske Bank
Source: Central Bank & Financial Services of Ireland/Danske Bank
Retail bank lending, EUR bn / Rep. of Ireland
Mortgage lending , EUR bn / Rep. of Ireland
Annual growth, % (right hand scale)
Annual growth, % (right hand scale)
0
40
80
120
19
94
19
95
19
96
19
97
19
98
19
99
20
00
20
01
20
02
20
03
20
04
E
20
05
E
20
06
E
5
15
25
35
Republic of Ireland � Mortgage lending
� Average annual lending growth close to 25%in the past five years, supported by lowerinterest rates
� Growth expectations lower, but still 15-20%

12
66
26
8 3
47 49
Contribution(after bad debts)
Overview of NIB and NB- Focus on personal and business financial services
NIB & NB
Personal Financial Services Business Financial Services Wealth Management Other
GBP m
� Total income 148.3
� Direct costs 49.4
� Contribution
after bad debts 95.7
GBP m
� Total income 115.0
� Direct costs 19.8
� Contribution
after bad debts 91.5
GBP m
� Total income 12.2
� Direct costs 6.0
� Contribution
after bad debts 6.2
GBP m
� Total income 9.8
� Direct costs 37.0
� Contribution
after bad debts -27.4
Personal Financial services
Business Financial services
Wealth Management
2. Platformsfor growth
Strategic rationale & value creation
4
4254
Total income Direct costs
Y/E Sept. 30, 2004

13
Good match- Similar focus, products and philosophy
2. Platformsfor growth
� National Irish Bank and Northern Bankmake a good fit with Danske Bank�s
structure and strategy� Shared business philosophy:
- Product strategy- Distribution strategy
- Infrastructure
� The acquisition is in line with Danske Bank�s pronounced retail strategy� Opportunity to grow outside the Nordic
market 200019991998199719961995
2001200220032004
Divested/downscaled e.g.:
Banking Activities UK
Banking Activities US
Danske Securities
Strategic rationale & value creation
Danske Bank NIB NBCustomer focus Retail Retail Retail
Products Full product range
Standard products
Standard products
Distribution Branches, e-banking, telephone
Branches, 2nd tier e-bank,telephone*
Branches, 2nd tier e-bank,telephone*
Branding Local Local Local
Back office Centralised(global)
Decentralised Decentralised
*Outsourced
Cur
rent
str
uctu
re
14
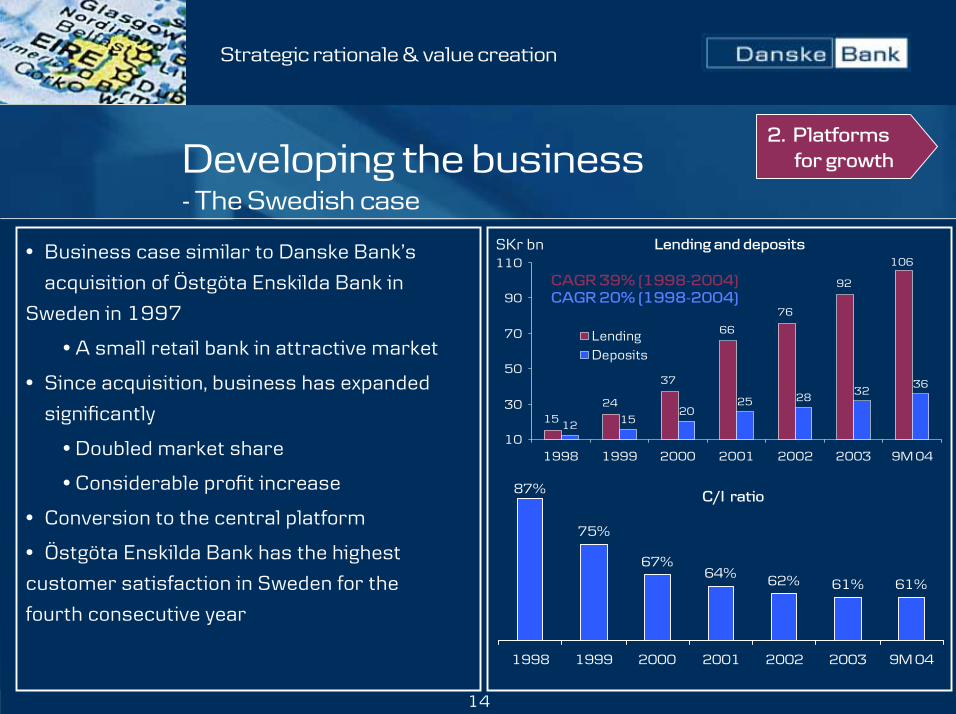
87%
75%
67%64% 62% 61% 61%
1998 1999 2000 2001 2002 2003 9M 04
15
24
37
66
76
92
106
12 1520
25 2832
36
10
30
50
70
90
110
1998 1999 2000 2001 2002 2003 9M 04
LendingDeposits
Developing the business- The Swedish case
2. Platformsfor growth
� Business case similar to Danske Bank�s
acquisition of Östgöta Enskilda Bank in
Sweden in 1997
� A small retail bank in attractive market
� Since acquisition, business has expanded
significantly
� Doubled market share
� Considerable profit increase
� Conversion to the central platform
� Östgöta Enskilda Bank has the highest
customer satisfaction in Sweden for the
fourth consecutive year
Strategic rationale & value creation
Lending and depositsSKr bn
C/I ratio
CAGR 39% (1998-2004)CAGR 20% (1998-2004)

15
15
8
11
25
41
Key financials- National Irish Bank
� The portfolio is dominated by mortgages
� Prudent credit policies:
- Loan loss ratio 14 bp (Y/E Sept. 30, 04)
2. Platformsfor growth
� 59 branches and 13 business banking
centres
� Increasing focus on HNW and larger SME
� 134,000 retail, 25,000 premium and 8,000
business banking customers
� 742 full-time employees
September 2004: Total lending GBP 2.0bn
Portfolio composition (30 Aug., 2004)
Strategic rationale & value creation
Mortgages
Property & construction
Wholesale & retail
Personal lending & credit cards
Other
Y/E 30 Sept. (GBPm) 2003 2004 4 year CAGR
Net interest income 60.1 63.8 8.4
Other operating income 19.7 18.6 -2.1
Total operating income 79.8 82.4 5.6
Direct costs 34.9 35.9 1.1
Contribution 44.9 46.5 9.7
Provisions for bad debts -1.1 2.7 8.5
Contribution after bad debts 46.1 43.8 9.7
For the ease of comparison NIB�s financials are stated in GBP
16
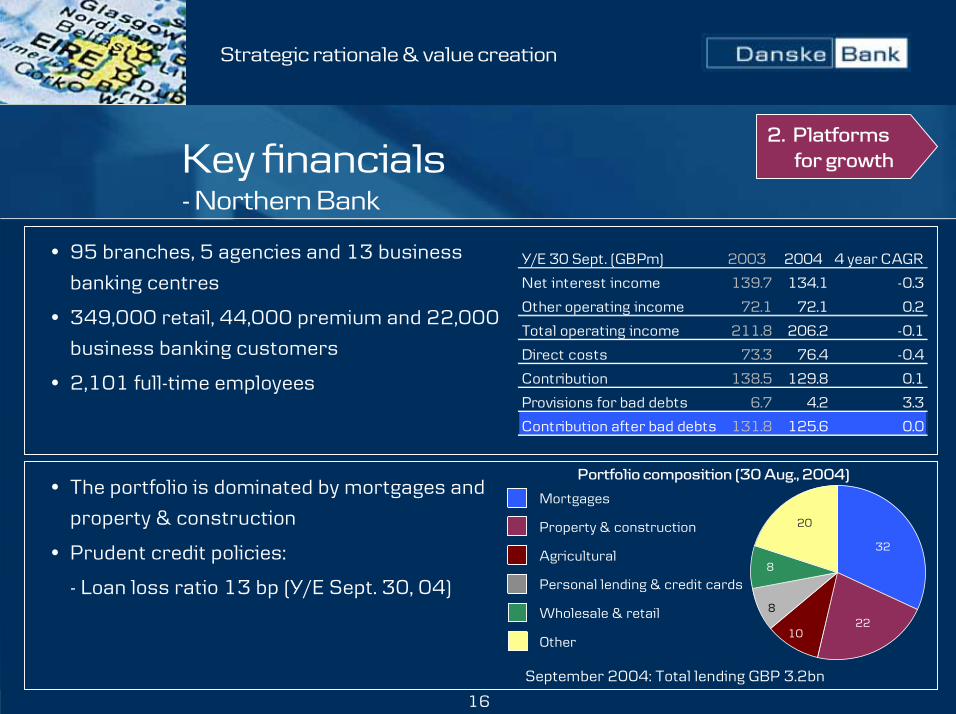
20
32
2210
8
8
Key financials- Northern Bank
� 95 branches, 5 agencies and 13 business
banking centres
� 349,000 retail, 44,000 premium and 22,000
business banking customers
� 2,101 full-time employees
2. Platformsfor growth
September 2004: Total lending GBP 3.2bn
� The portfolio is dominated by mortgages and
property & construction
� Prudent credit policies:
- Loan loss ratio 13 bp (Y/E Sept. 30, 04)
Portfolio composition (30 Aug., 2004)
Strategic rationale & value creation
Y/E 30 Sept. (GBPm) 2003 2004 4 year CAGR
Net interest income 139.7 134.1 -0.3
Other operating income 72.1 72.1 0.2
Total operating income 211.8 206.2 -0.1
Direct costs 73.3 76.4 -0.4
Contribution 138.5 129.8 0.1
Provisions for bad debts 6.7 4.2 3.3
Contribution after bad debts 131.8 125.6 0.0
Mortgages
Property & construction
Agricultural
Personal lending & credit cards
Wholesale & retail
Other

17
••••
••••
••••••••
•••• ••••
One Group � One System- Competitive advantage
••••
Fokus Bank 2001
ÖEB 2000 & 2002
BG Bank 2002
DBI Luxembourg2003
Hamburg Branch1999 DB Polska 2003
••••London Branch 1998
••••••••National Irish Bank mid-2006
Northern Bank mid-2006
3. Efficiency & cost savings
••••Helsinki Branch 1997
18
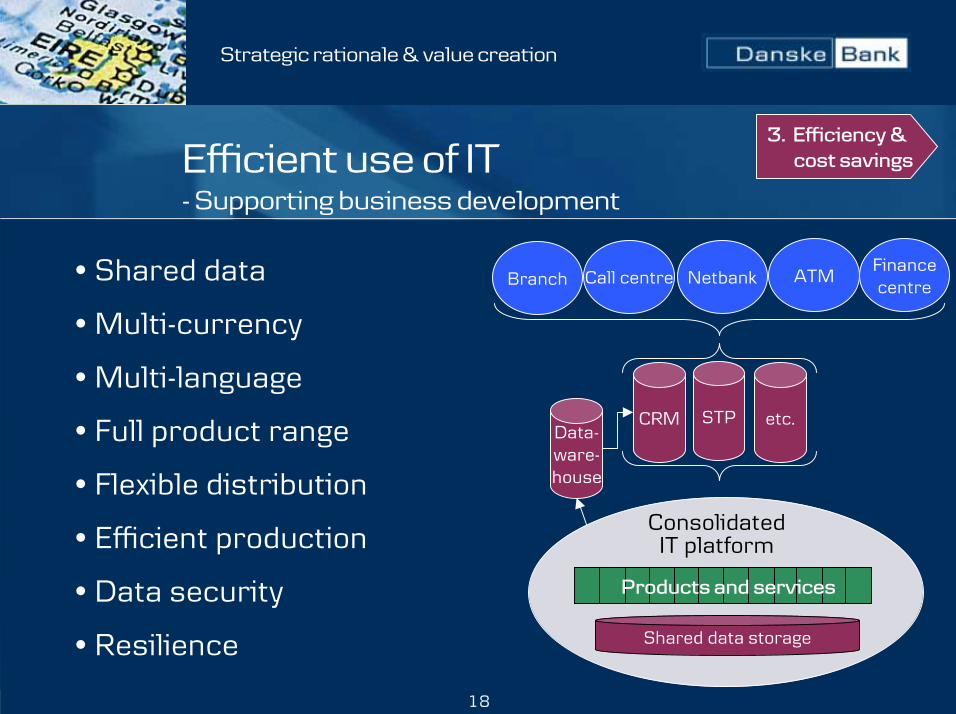
Efficient use of IT- Supporting business development
� Shared data
� Multi-currency
� Multi-language
� Full product range
� Flexible distribution
� Efficient production
� Data security
� Resilience Shared data storage
ConsolidatedIT platform
Data-ware-house
CRM STP etc.
Branch Call centre Netbank ATMFinancecentre
Products and services
3. Efficiency & cost savings
Strategic rationale & value creation
19
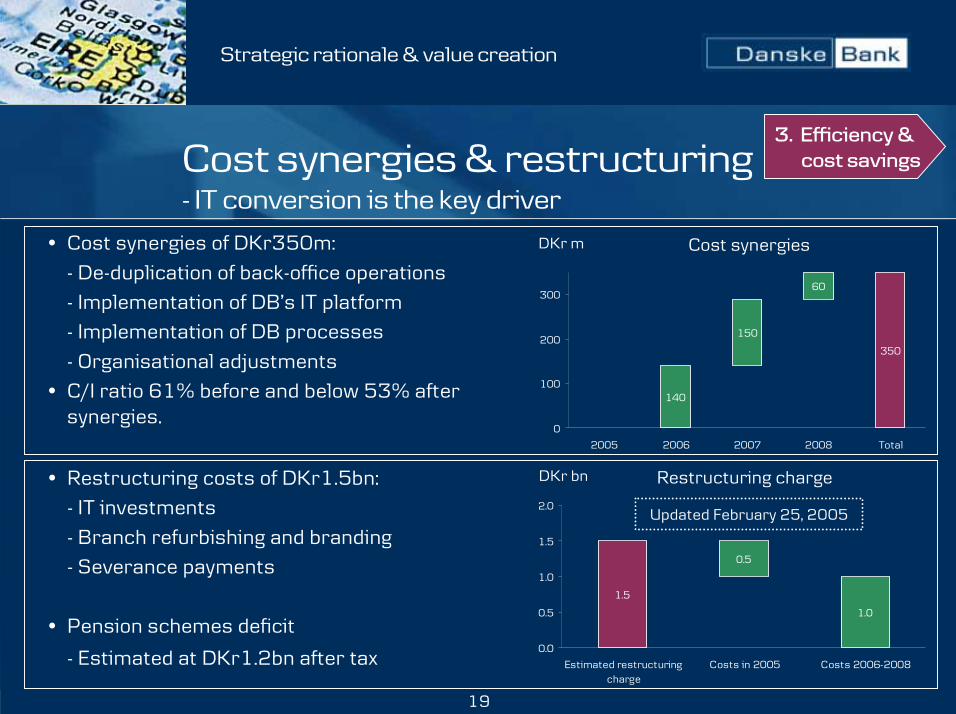
0.5
1.0
1.5
0.0
0.5
1.0
1.5
2.0
Estimated restructuringcharge
Costs in 2005 Costs 2006-2008
140
150
60
350
0
100
200
300
2005 2006 2007 2008 Total
Cost synergies & restructuring- IT conversion is the key driver
� Cost synergies of DKr350m:
- De-duplication of back-office operations- Implementation of DB�s IT platform- Implementation of DB processes
- Organisational adjustments� C/I ratio 61% before and below 53% after
synergies.
Cost synergies
Strategic rationale & value creation
DKr m
� Restructuring costs of DKr1.5bn:- IT investments
- Branch refurbishing and branding- Severance payments
� Pension schemes deficit
- Estimated at DKr1.2bn after tax
DKr bn Restructuring charge
3. Efficiency & cost savings
Updated February 25, 2005

20
Business development- Overview
� Productivity enhanced byinvestments in IT and otherinvestments in existing branches
� Introduction of high quality productsand services
� 2005-2006 focus on conversionand optimisation
� 2006-2012 above-market growth
� In the longer term, branch expansionwill be key to driving increased cross-sales across the Group
Strategic rationale & value creation
4. Revenuebenefits
2005 2006 2007 2008 2009 2010 2011 2012 2013
Conversion Above-market growth
=< market growth
> marketgrowth
Market shares
21
Indemnity on compliance issues
� National Irish Bank has been the object of high court
investigation relating to:
� Mis-selling offshore investment products
� Failing to comply with certain statutory tax collection
responsibilities
� Overcharging of fees and interest
� Investigations have focused on the period 1988 to 1998
� No pending issues with authorities
� Danske Bank will not bear any risk relating to these matters
� Full indemnification from NAB
Compliance issues
22
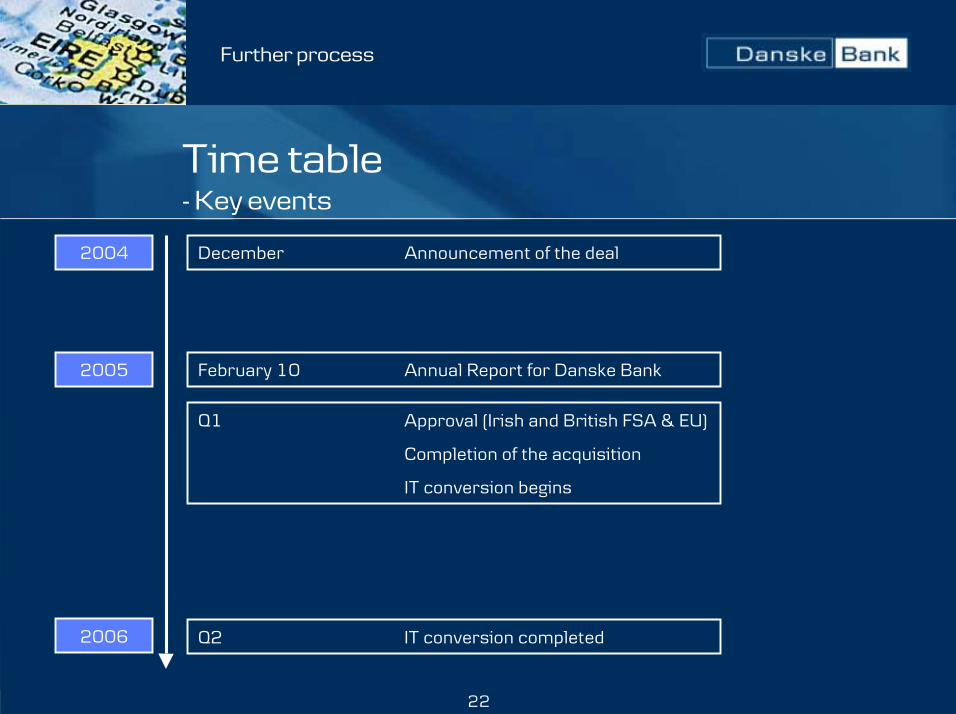
Time table- Key events
Further process
2005
2006
Q1 Approval (Irish and British FSA & EU)
Completion of the acquisition
IT conversion begins
Q2 IT conversion completed
2004 December Announcement of the deal
February 10 Annual Report for Danske Bank
For more information, please visit
www.danskebank.com/irireland