Embed Size (px)
Citation preview

FACES OF JOBLESSNESS IN PORTUGAL: ANATOMY OF EMPLOYMENT BARRIERS Daniele Pacifico and Céline Thévenot

Policy Analysis Note (PAN) for Portugal © OECD 2016 5
TABLE OF CONTENTS
1. INTRODUCTION .................................................................................................................................... 7
2. LABOUR MARKET AND SOCIAL CONTEXT ................................................................................. 10
3. EMPLOYMENT BARRIERS IN PORTUGAL .................................................................................... 16
4. FACES OF JOBLESSNESS IN PORTUGAL .......................................................................................... 20
5. CONCLUSIONS .................................................................................................................................... 26
ANNEX A. LATENT CLASS RESULTS ...................................................................................................... 30
ANNEX B. LATENT CLASS ANALYSIS AND MODEL SELECTION .................................................... 33
Tables
Table 2.1. People at risk of poverty or social exclusion ............................................................................ 12 Table 3.1. Employment6barrier indicators ................................................................................................ 18 Table A.1. Latent class estimates ............................................................................................................... 30 Table A.2. Characterisation of the latent groups ....................................................................................... 30 Table A.3. Characterisation of the group with zero or near-zero earnings in Group 3 .............................. 32
Figures
Figure 2.1. Employment rates: mild recovery from the crisis.................................................................... 10 Figure 2.2. Dynamics of population groups with potential labour market difficulties .............................. 15 Figure 2.3. Composition of the Portuguese population with labour market difficulties ............................ 15 Figure 3.1. Employment barrier: conceptual framework ........................................................................... 16 Figure 3.2. Number of simultaneous barriers ............................................................................................ 19 Figure 4.1. Share of individuals facing multiple employment barriers in each group ............................... 25 Figure B.1. Selection of the optimal number of latent classes ................................................................... 34
Boxes
Box 2.1. Individuals with potential labour market difficulties (target population) .................................... 14 Box 4.1. Group 1: “Older women with health limitations, low education and limited work experience” 20 Box 4.2. Group 2: “Prime-age long-term unemployed with low education and scarce job opportunities”21 Box 4.3. Group 3: “Underemployed workers with low education” ........................................................... 22 Box 4.4. Group 4: “Early retirees with health limitations, low education and long employment record” 22 Box 4.5. Group 5: “Long-term unemployed youth without any past work experience and scarce job
opportunities” ............................................................................................................................................. 23 Box 4.6. Group 6: “Early retirees with weak financial work incentives” .................................................. 23 Box 4.7. Group 7: “Women with low education and without any past work experience” ........................ 24 Box 4.8. Group 8: “Unemployed youth with limited work experience” ................................................... 24 Box 4.9. Group 9: “Mothers with care responsibilities and limited work experience” ............................. 25
Policy Analysis Note (PAN) for Portugal © OECD 2016 6
ACKNOWLEDGEMENTS
This document was produced with the financial assistance of the European Union Programme for
Employment and Social Innovation “EaSI” (2014-2020, EC-OECD grant agreement VS/2016/0005,
DI150038). It is part of a joint project between EC and OECD (VS/2016/0005 (DI150038), Cooperation
with the OECD on Assessing Activating and Enabling Benefits and Services in the EU) covering six
countries: Estonia, Ireland, Italy, Lithuania, Portugal and Spain.
The report incorporates feedback received during the project kick-off seminar, held at OECD in Paris
on 3 March 2016 with the participation of the EC and representatives from all participating countries. Lead
authors gratefully acknowledge contributions from colleagues at the OECD (James Browne, Rodrigo
Fernandez, Herwig Immervoll), as well as comments from colleagues at the World Bank (Aylin
Isik-Dikmelik, Sandor Karacsony, Natalia Millan, Mirey Ovadiya, Frieda Vandeninden, Michele Davide
Zini), who are undertaking a parallel and closely related joint project with the EC covering six further EU
Member States. All views and any errors in this report are the responsibility of the authors. In particular,
the report should not be reported as representing the official views of the OECD, of the European Union,
or of their member countries.
This project is co-funded by the European Union
Policy Analysis Note (PAN) for Portugal © OECD 2016 7
1. INTRODUCTION
This Policy Analysis Note (PAN) for Portugal assesses the characteristics and employment barriers of
working-age individuals with no or weak labour-market attachment. It is one of six such country notes in a
joint EC-OECD project covering Estonia, Ireland, Italy, Lithuania, Portugal and Spain. The objective of
this project is to provide a novel perspective on employment difficulties, and to aid in the identification of
policy approaches to overcome them. The project website at http://www.oecd.org/social/faces-of-
joblessness.htm provides further information.
Each PAN develops profiles of key employment barriers and quantifies their incidence and intensity
among jobless individuals and among those who work or earn very little or intermittently. The underlying
conceptual framework and statistical approach is described in an associated methodological background
paper (Fernandez et al., 2016; Immervoll and Isik-Dikmelik, 2016) and is consistent with that employed in
a related EC-World Bank activity covering six further EU countries. The empirical results from each PAN
will be used to inform a dialogue on policy approaches and options that could address the most prevalent
employment barriers in selected population groups and strengthen their labour-market attachment. This
dialogue will take place in a second part of the EC-OECD project. Its results and an associated policy
inventory will be presented in a series of six Country Policy Papers (CPP).
A key motivation behind this project is the finding from the literature on activation and employment-
support policies (AESPs), and on social protection systems more generally, that careful targeting and
tailoring to individual circumstances are crucial factors for policy success.1 However, policy discussions do
not necessarily reflect this. They often refer to broader labour-market groups such as “young people”,
“older workers”, “people with disabilities” or “lone parents”. Similarities of employment barriers among
members of such broader groups are implicitly assumed but not well documented (for instance, being
“young” is not an employment barrier). As a result, policy interventions targeted on the basis of
characteristics such as age, health status or family situation alone may be ill-adapted to the needs of jobless
individuals and those with precarious employment patterns. An in-depth inventory of people’s employment
barriers, and an identification of groups who share similar combinations of labour-market obstacles, can
contribute to a better match between individual needs and available support, and make associated policy
interventions more effective and less costly.
Countries frequently seek to account for individual circumstances and labour-market difficulties by
means of powerful statistical tools that “profile” individual benefit claimants using administrative data.
Such tools are useful for tailoring the employment programmes that each registered individual is offered.
They often rely on administrative data, which have distinct advantages, but tend to cover only a subset of
the out-of-work population, such as the registered unemployed. As a result, the profiling tools built around
these data typically cannot be used to provide a broader perspective on the employment barriers facing the
entire population of those with no or weak labour market attachment. This note complements existing
profiling instruments by adopting more of a “birds-eye” approach that considers the employment barriers
of all those with no or weak labour market attachment. This sizeable and heterogeneous group constitutes
the potential client group for AESPs. Understanding their employment barriers is not only important for
linking up services provided by different institutions, but it is also essential for identifying groups who
would benefit from employment-related programmes or incentives, and who are not currently clients of
any of the institutions providing such measures.
A comprehensive assessment of potential employment barriers requires detailed information on
people’s skills, work history, health status, household circumstances and incomes. The European Union
1. See for example OECD (2013a, 2013b, 2014a, 2015a); Immervoll and Scarpetta (2012); Arias et al.
(2014); World Bank (2013); European Commission (EC) (2015); Eurofound (2012).
Policy Analysis Note (PAN) for Portugal © OECD 2016 8
Survey on Income and Living Conditions (EU-SILC) contains rich information for identifying and
assessing potential barriers to employment and is the primary source of data for this note. EU-SILC offers
cross-country comparability, an extended reference period2 over which one can assess the respondents’
main activity status, and detailed information on individual and family circumstances including people’s
work-related skills end education, work history, health status, income sources, tax liabilities and benefit
amounts. However, there is a relatively long time-lag between data collection and availability (EU-SILC
2014 was made available in February 2016). EU-SILC also contains less detailed information on labour-
force status than standard labour-force surveys.
In Portugal, 39% of the working age population3 can be considered to face potential labour-market
difficulties according to SILC data for 2014. The remainder of this note refers to this group as the “target
population”. Of these 39%, 29% did not work at all throughout the reference period4 and a further 10% had
“weak labour market attachment” with either unstable jobs, limited working hours or zero or near-zero
earnings. Potential employment barriers that are particularly common among the “target population”
include no recent work experience (74% of the target population), low education (73%), scarce job
opportunities (43%) and health limitations (39%). Other potential barriers, such as high levels of non-
labour income and care responsibilities are frequent for some sub-groups, but less prevalent overall.
The results of the statistical clustering analysis suggest that the target population can be separated
into nine distinct groups with similar employment-barrier profiles within each group. Focusing on the
prevailing characteristics in each group, the emerging clusters may be summarised as follows:
1. “Older women with health limitations, low education and limited work experience” (22% of those
with no or weak labour market attachment)
2. “Prime-age long-term unemployed with low education and scarce job opportunities” (20%)
3. “Underemployed workers with low education” (12%)
4. “Early retirees with health limitations, low education and long employment record” (12%)
5. “Long-term unemployed youth without any past work experience and scarce job opportunities” (9%)
6. “Early retirees with weak financial work incentives” (9%)
7. “Women with low education and without any past work experience” (7%)
8. “Unemployed youth with limited work experience” (6%)
9. “Mothers with care responsibilities and limited work experience” (3%)
These group labels indicate that commonly used proxy groupings, which are commonly referred to in
the policy debate, such as “women”, “disabled”, or “youth”, include distinct sub-groups with very
different employment-barrier profiles. For instance, the following combinations of employment barriers are
common for women: low education with limited work experience (Group 1), low education without any past
(paid) work experience (Group 7), and limited work experience and care responsibilities (Group 9).
Employment barriers are also highly heterogeneous for youth (Groups 5 and 8) and older individuals
(Groups 4 and 6).As shown in Section 4, these groups also differ markedly with respect to their poverty risks,
material deprivation levels and other family or individual circumstances.
2. EU-SILC data provide information on individuals’ labour-market status at different points in time during
the reference year (each of the 12 months) and at the time of the interview. This note uses all 13 data points
to characterise people’s employment status.
3. Ages 18 to 64, excluding individuals in full-time education or compulsory military service.
4. This compares well with results from the EU Labour Force Survey, which show 39.4% as the proportion of
working-age people in Portugal who were not in paid work during different points in 2013 (the reference
year for the 2014 SILC). Some of them will have been out of work for only part of the year, so the LFS
share is expected to be higher.
Policy Analysis Note (PAN) for Portugal © OECD 2016 9
Most individuals in the target population face more than one potential employment barrier
simultaneously. Four in five face at least two barriers, and about one half show three or more. For instance, as
the label indicates, most of the “Prime-age long term unemployed with low education and scarce job
opportunities” (Group 2) combine low labour demand in their labour-market segment with employability
problems due to low education. Similarly, many “Older women with health limitations, low education and
limited work experience” (Group 1) lack work experience, education and also have health limitations that
may limit their availability for paid work. Addressing one type of employment obstacle may not be enough
to boost employment levels. From a policy perspective, these results point to a need to carefully combine or
sequence different activation and employment support measures, and to co-ordinate them across policy domains
and institutions.
The rest of this note proceeds as follows. Section 2 provides some background information on the
evolution of social and labour market conditions in Portugal and how this compares with other EU
countries. Section 3 uses the most recent EU-SILC data to construct quantitative indicators of the intensity
and incidence of different types of employment barriers. Section 4 applies a statistical clustering technique
to organise the population of individuals with no or weak labour-market attachment into groups with
homogeneous combinations of employment barriers. It also presents key demographic and socio-economic
characteristics that are relevant for deciding policy priorities and approaches for each group. A short
concluding section highlights selected possible directions for extending the approach further.
Policy Analysis Note (PAN) for Portugal © OECD 2016 10
2. LABOUR MARKET AND SOCIAL CONTEXT
Trends in employment, unemployment and labour-market inactivity
As in all six countries covered in this project, the economic crisis has significantly impacted the
labour market in Portugal, in turn causing increased poverty and material deprivation. The employment
rate in Portugal was three percentage points (ppts) above the EU average before the onset of the crisis; it
then fell steadily between 2008 and 2013 and started a mild recovery since then.
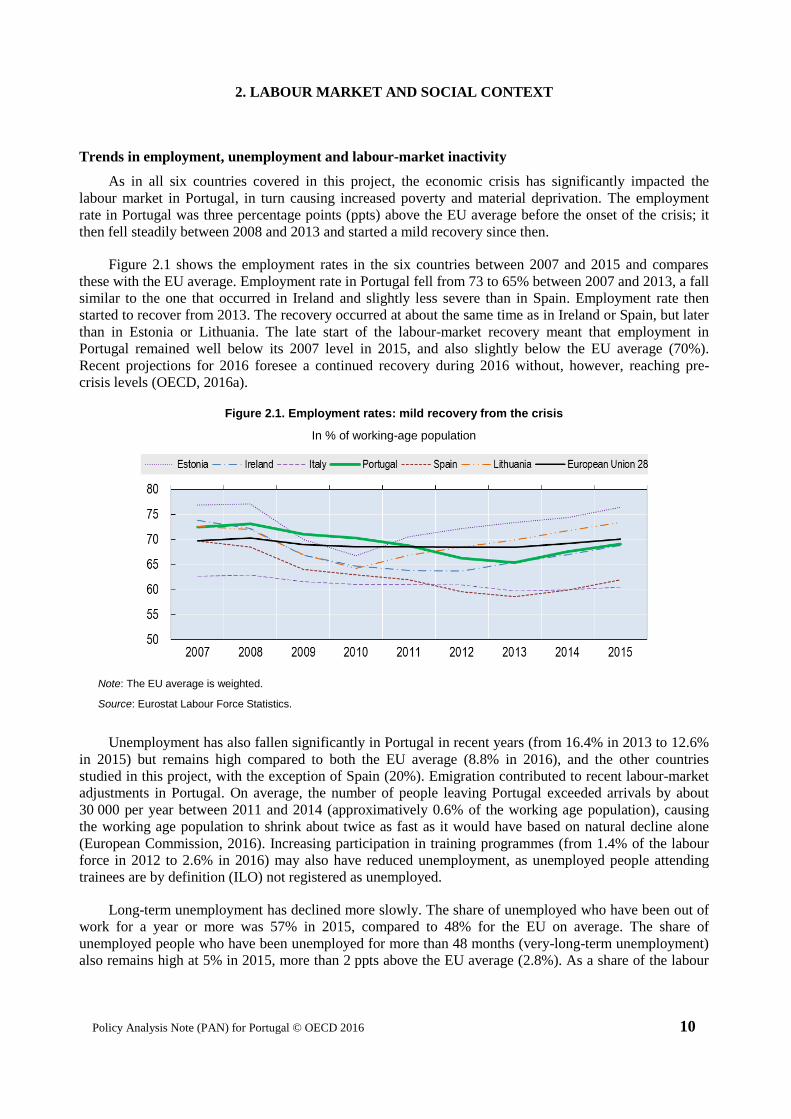
Figure 2.1 shows the employment rates in the six countries between 2007 and 2015 and compares
these with the EU average. Employment rate in Portugal fell from 73 to 65% between 2007 and 2013, a fall
similar to the one that occurred in Ireland and slightly less severe than in Spain. Employment rate then
started to recover from 2013. The recovery occurred at about the same time as in Ireland or Spain, but later
than in Estonia or Lithuania. The late start of the labour-market recovery meant that employment in
Portugal remained well below its 2007 level in 2015, and also slightly below the EU average (70%).
Recent projections for 2016 foresee a continued recovery during 2016 without, however, reaching pre-
crisis levels (OECD, 2016a).
Figure 2.1. Employment rates: mild recovery from the crisis
In % of working-age population
Note: The EU average is weighted.
Source: Eurostat Labour Force Statistics.
Unemployment has also fallen significantly in Portugal in recent years (from 16.4% in 2013 to 12.6%
in 2015) but remains high compared to both the EU average (8.8% in 2016), and the other countries
studied in this project, with the exception of Spain (20%). Emigration contributed to recent labour-market
adjustments in Portugal. On average, the number of people leaving Portugal exceeded arrivals by about
30 000 per year between 2011 and 2014 (approximatively 0.6% of the working age population), causing
the working age population to shrink about twice as fast as it would have based on natural decline alone
(European Commission, 2016). Increasing participation in training programmes (from 1.4% of the labour
force in 2012 to 2.6% in 2016) may also have reduced unemployment, as unemployed people attending
trainees are by definition (ILO) not registered as unemployed.
Long-term unemployment has declined more slowly. The share of unemployed who have been out of
work for a year or more was 57% in 2015, compared to 48% for the EU on average. The share of
unemployed people who have been unemployed for more than 48 months (very-long-term unemployment)
also remains high at 5% in 2015, more than 2 ppts above the EU average (2.8%). As a share of the labour

Policy Analysis Note (PAN) for Portugal © OECD 2016 11
force, long-term unemployment peaked at 9.3% in 2013 and declined to 7.2% by 2015 (the EU average in
2015 was 4.5%).
Despite signs of improvement in education level and school drop-out rates, the low level of education
of the labour force is a major challenge for the labour market and a key reason for persistently high rates of
long-term unemployment (European Commission, 2016, OECD, 2014, OECD, forthcoming). In 2014, only
65% of the population aged 25-34 had attained upper secondary education or higher, well below the EU
average of 83%. Moreover, the gap in employment outcomes between those with high and low levels of
education5 is smaller than in most EU Member States, suggesting that macroeconomic skills mismatches,
though on the rise, are limited, and that the demand for high-skilled workers is moderate. In the long run,
however, the low skill level of Portugal’s labour force can act as a barrier to the country’s competitiveness.
(European Commission, 2016; OECD, forthcoming). In recent years, Portugal has nevertheless made
significant improvements in the educational attainment of its adult population (OECD, 2015e).
Activation measures are crucial to connect people with jobs. Over the period 2011-2015, Portugal
took several steps to strengthen its activation framework (OECD, forthcoming). Recent measures have
reduced the generosity of unemployment benefits, both in terms of the replacement rate of unemployment
insurance and the maximum duration of benefits. Despite the fact that the recent reforms also strengthened
the safety net provided by unemployment benefits (i.e., made them more accessible), they reach only 45%
of the unemployed, and have a built-in bias towards older workers (due for example to existing links
between benefit duration and age, see OECD, 2014; OECD, forthcoming). The offer of short-term training
has been expanded while new hiring subsidies have been introduced and significantly ramped up since
2012: the number of beneficiaries of hiring subsidies increased from a very low number in 2011 to nearly
50 000 over the first ten months of 2015. However, there may be a need now to refocus some of these
programmes on those who need them the most, i.e. youth and the long-term unemployed seem to benefit
less from these programs (OECD. Subsidised internships have been designed to help groups at the margins
of the labour market (particularly youth and the low-skilled) gain valuable work experience. Several
changes were introduced to these programmes with the intention of broadening their coverage. As a result,
the number of participants in these programmes increased significantly from less than 20 000 in 2011 to
more than 70 000 in 2014. While subsidised internship programmes appear to have a positive impact on
the employment outcomes of participants, further analysis suggests that the low-skilled appear to benefit
less from such programmes than better skilled individuals (OECD, forthcoming).
The rise in unemployment in the aftermath of the economic crisis has particularly affected young
people, whose unemployment rate reached 38% in 2013. It dropped to 32% in 2015, still 12 ppts above the
EU average. One out of six young adults aged 15-24 is neither in a job, nor preparing for employment. The
number of young people aged 15-24 not in employment, education or training (NEET) has also decreased
since 2010 and at 11.3% in 2015 it was 0.7 ppts below the EU average. “Low-skilled” youth (those with a
low level of education6) face much higher unemployment risks in Portugal than in other European
countries (40% in 2014 compared to the EU average of 30%). In 2012, Portugal launched its strategic
programme to tackle youth unemployment (Impulso Jovem, OECD, forthcoming). The reach of the
programme is limited as the majority of NEETs are not registered with the Public Employment Service
(OECD, forthcoming, European Commission, 2016). The government has acknowledged this challenge
and has taken steps to simplify the registration process by means of an online platform. In addition an
outreach campaign designed specifically for NEETs is being developed jointly with the ILO.
5. The education level refers to the ISCED classification. High education corresponds to upper secondary and
post- secondary education (ISCED 4-6), low education corresponds to below secondary and primary levels
of education (ISCED 0-2).
Policy Analysis Note (PAN) for Portugal © OECD 2016 12
Incidence of economic hardship
Portugal has one of the most unequal income distributions in Europe. The Gini coefficient for the
disposable income is high at 0.34 in 2013, against and EU average of 0.31. Between 2004 and 2009,
inequality had been on a downward trend but inequality has subsequently remained at an elevated level
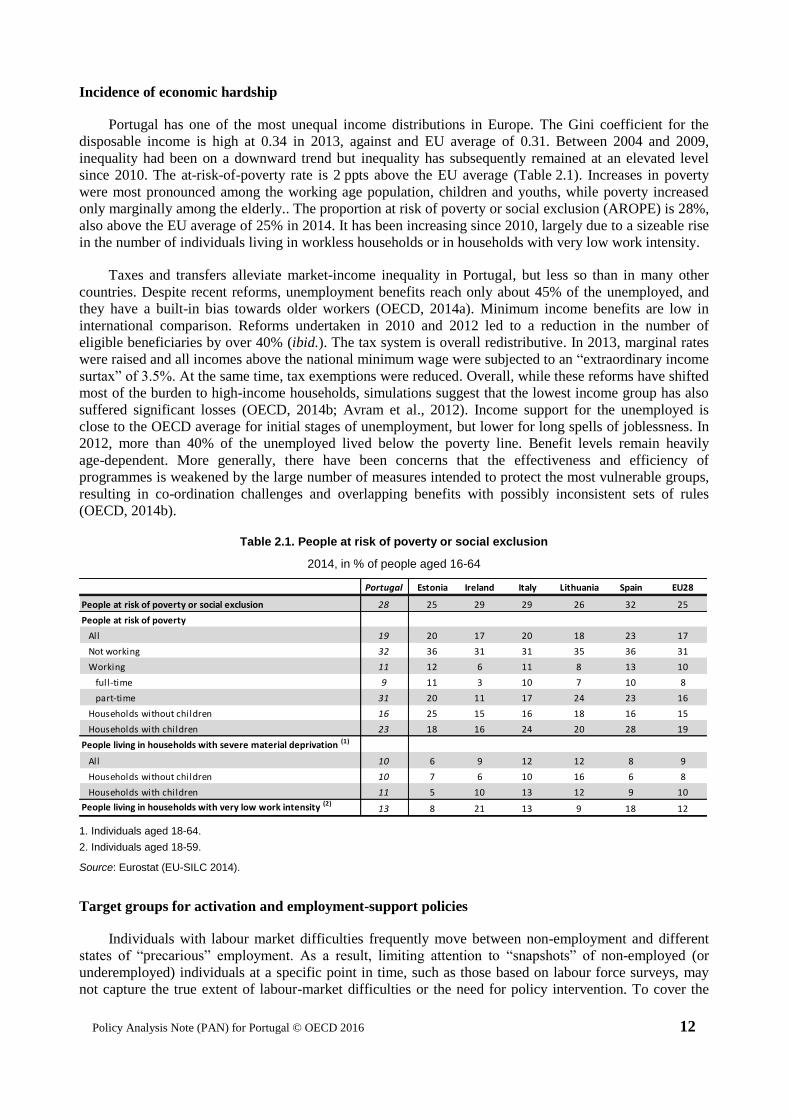
since 2010. The at-risk-of-poverty rate is 2 ppts above the EU average (Table 2.1). Increases in poverty
were most pronounced among the working age population, children and youths, while poverty increased
only marginally among the elderly.. The proportion at risk of poverty or social exclusion (AROPE) is 28%,
also above the EU average of 25% in 2014. It has been increasing since 2010, largely due to a sizeable rise
in the number of individuals living in workless households or in households with very low work intensity.
Taxes and transfers alleviate market-income inequality in Portugal, but less so than in many other
countries. Despite recent reforms, unemployment benefits reach only about 45% of the unemployed, and
they have a built-in bias towards older workers (OECD, 2014a). Minimum income benefits are low in
international comparison. Reforms undertaken in 2010 and 2012 led to a reduction in the number of
eligible beneficiaries by over 40% (ibid.). The tax system is overall redistributive. In 2013, marginal rates
were raised and all incomes above the national minimum wage were subjected to an “extraordinary income
surtax” of 3.5%. At the same time, tax exemptions were reduced. Overall, while these reforms have shifted
most of the burden to high-income households, simulations suggest that the lowest income group has also
suffered significant losses (OECD, 2014b; Avram et al., 2012). Income support for the unemployed is
close to the OECD average for initial stages of unemployment, but lower for long spells of joblessness. In
2012, more than 40% of the unemployed lived below the poverty line. Benefit levels remain heavily
age-dependent. More generally, there have been concerns that the effectiveness and efficiency of
programmes is weakened by the large number of measures intended to protect the most vulnerable groups,
resulting in co-ordination challenges and overlapping benefits with possibly inconsistent sets of rules
(OECD, 2014b).
Table 2.1. People at risk of poverty or social exclusion
2014, in % of people aged 16-64
1. Individuals aged 18-64.
2. Individuals aged 18-59.
Source: Eurostat (EU-SILC 2014).
Target groups for activation and employment-support policies
Individuals with labour market difficulties frequently move between non-employment and different
states of “precarious” employment. As a result, limiting attention to “snapshots” of non-employed (or
underemployed) individuals at a specific point in time, such as those based on labour force surveys, may
not capture the true extent of labour-market difficulties or the need for policy intervention. To cover the
Portugal Estonia Ireland Italy Lithuania Spain EU28
People at risk of poverty or social exclusion 28 25 29 29 26 32 25
People at risk of poverty
All 19 20 17 20 18 23 17
Not working 32 36 31 31 35 36 31
Working 11 12 6 11 8 13 10
full-time 9 11 3 10 7 10 8
part-time 31 20 11 17 24 23 16
Households without children 16 25 15 16 18 16 15
Households with children 23 18 16 24 20 28 19
People living in households with severe material deprivation (1)
All 10 6 9 12 12 8 9
Households without children 10 7 6 10 16 6 8
Households with children 11 5 10 13 12 9 10
People living in households with very low work intensity (2)13 8 21 13 9 18 12
Policy Analysis Note (PAN) for Portugal © OECD 2016 13
potential scope of AESPs, the target population of the analysis in this note therefore includes working-
age individuals who are “persistently” out of work (either unemployed or labour-market inactive for more
than 12 consecutive months) as well as individuals whose labour-market attachment is “weak”.6 “Weak”
labour-market attachment can include individuals with unstable jobs working only sporadically, those on
restricted working hours, and those with very low earnings (due to, for example, working informally or in
very low productivity self-employment). Box 2.1 defines the sub-groups of this population and explains
how they are identified using the EU-SILC data. The target population is a sub-set of the reference
population of working-age adults relevant for AESPs. The reference population, in turn, is defined as all
working-age adults except for full-time students and those in compulsory military service as these groups
are typically outside the scope of AESPs. For simplicity, the rest of this note also refers to this reference
group as the “working-age population”.
Clearly, not everybody experiencing potential labour market difficulties may be an intended target for
AESPs.7 The broad definition of labour market difficulties adopted in this note is not intended to be
prescriptive about the appropriate scope of AESPs; instead, it seeks to inform policy decisions by
documenting the employment barriers and circumstances of individuals with no or weak labour market
attachment. The approach is thus descriptive and takes no position on whether policy intervention is
justified for specific groups. The resulting profiles of employment barriers are intended to facilitate
discussions of the strengths and limitations of different policy interventions for concrete groups of
individuals. They can also be used to help inform decisions on whether to channel additional policy efforts
towards specific priority groups.
6. We do not attempt to distinguish between voluntary and involuntary joblessness or reduced work intensity.
Individuals can of course choose to be out of work, or in part-time or part-year employment, voluntarily,
and some surveys ask respondents whether they “want to work”. However, those saying they do not want
employment, or prefer to work part-time or part-year, may do so as a result of employment barriers they
face, such as care obligations or weak financial incentives, which policy might potentially address. If
extended voluntary labour-market inactivity or underemployment creates or exacerbate certain types of
employment barriers, it may subsequently give rise to involuntary labour-market detachment or partial
employment in later periods.
7. It is worth noting that, with a definition of working-age as 18-64, some individuals whom policy makers
may wish to include in the scope of AESPs are not included in the target group in this note. Although the
18-64 age cut-offs are common in comparative empirical work, they are becoming less suitable as
populations age, especially in countries that are actively seeking to increase retirement ages beyond 65.
Policy Analysis Note (PAN) for Portugal © OECD 2016 14
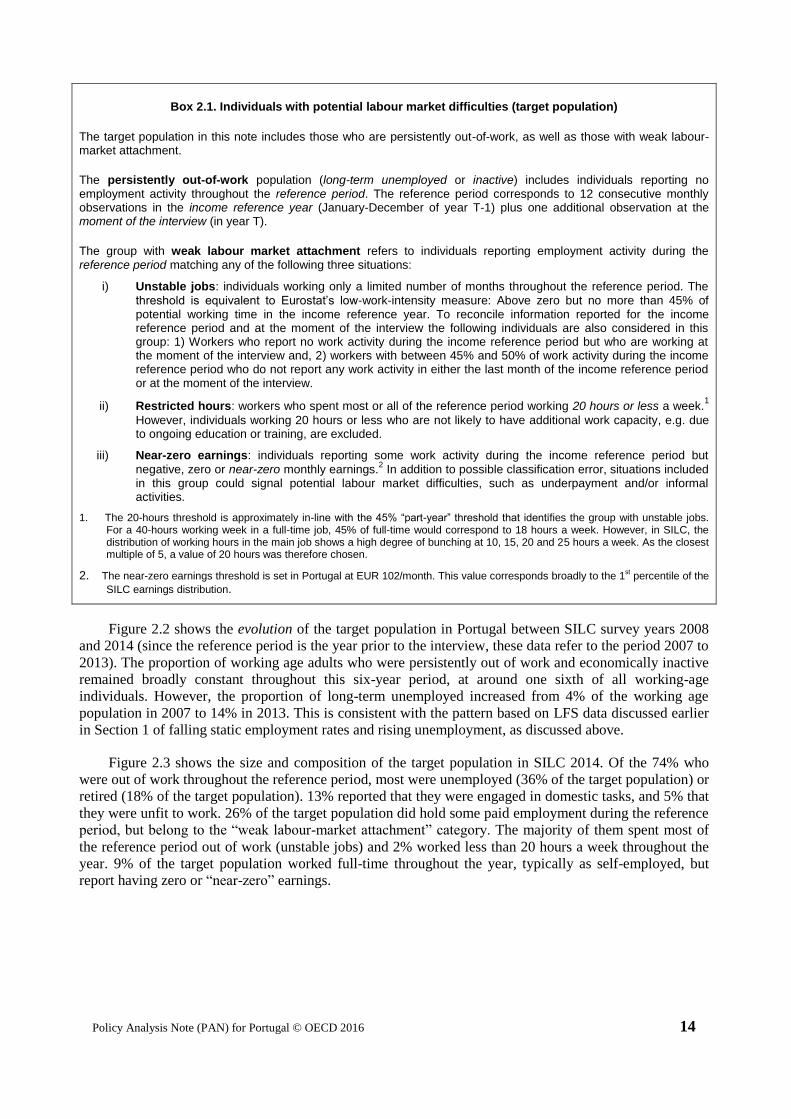
Box 2.1. Individuals with potential labour market difficulties (target population)
The target population in this note includes those who are persistently out-of-work, as well as those with weak labour-market attachment.
The persistently out-of-work population (long-term unemployed or inactive) includes individuals reporting no employment activity throughout the reference period. The reference period corresponds to 12 consecutive monthly observations in the income reference year (January-December of year T-1) plus one additional observation at the moment of the interview (in year T).
The group with weak labour market attachment refers to individuals reporting employment activity during the reference period matching any of the following three situations:
i) Unstable jobs: individuals working only a limited number of months throughout the reference period. The
threshold is equivalent to Eurostat’s low-work-intensity measure: Above zero but no more than 45% of potential working time in the income reference year. To reconcile information reported for the income reference period and at the moment of the interview the following individuals are also considered in this group: 1) Workers who report no work activity during the income reference period but who are working at the moment of the interview and, 2) workers with between 45% and 50% of work activity during the income reference period who do not report any work activity in either the last month of the income reference period or at the moment of the interview.
ii) Restricted hours: workers who spent most or all of the reference period working 20 hours or less a week.1
However, individuals working 20 hours or less who are not likely to have additional work capacity, e.g. due to ongoing education or training, are excluded.
iii) Near-zero earnings: individuals reporting some work activity during the income reference period but
negative, zero or near-zero monthly earnings.2 In addition to possible classification error, situations included
in this group could signal potential labour market difficulties, such as underpayment and/or informal activities.
1. The 20-hours threshold is approximately in-line with the 45% “part-year” threshold that identifies the group with unstable jobs. For a 40-hours working week in a full-time job, 45% of full-time would correspond to 18 hours a week. However, in SILC, the distribution of working hours in the main job shows a high degree of bunching at 10, 15, 20 and 25 hours a week. As the closest multiple of 5, a value of 20 hours was therefore chosen.
2. The near-zero earnings threshold is set in Portugal at EUR 102/month. This value corresponds broadly to the 1st percentile of the
SILC earnings distribution.
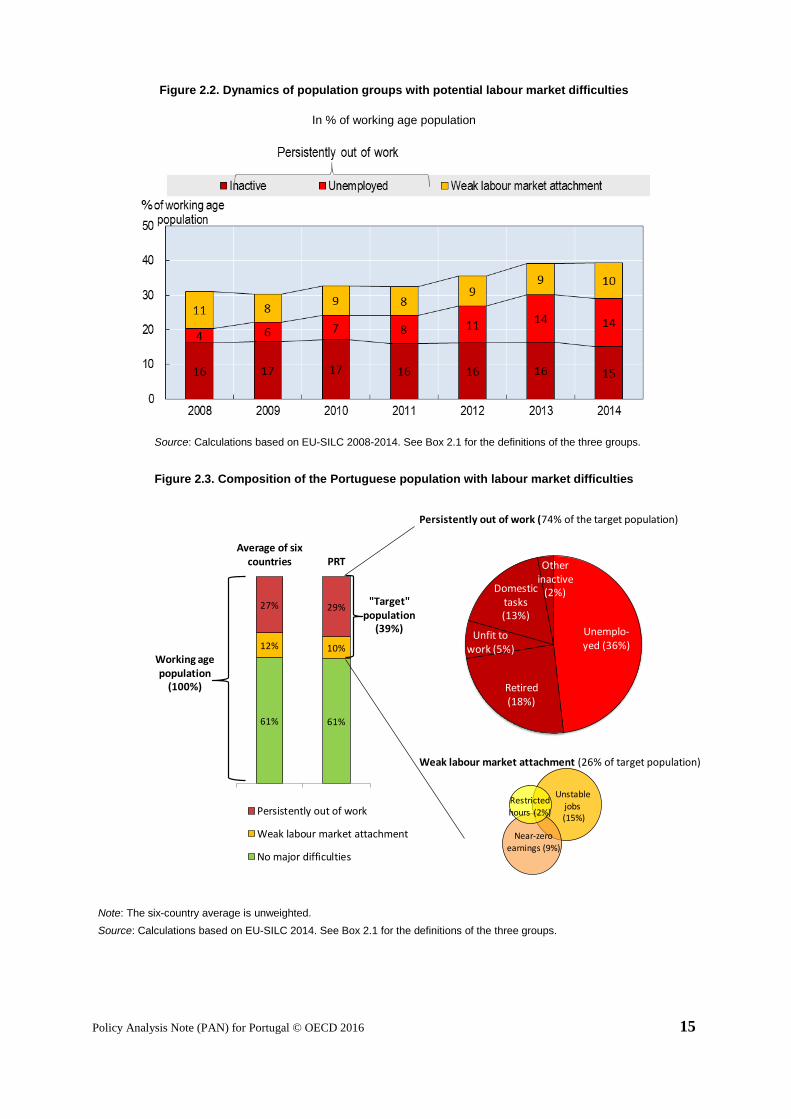
Figure 2.2 shows the evolution of the target population in Portugal between SILC survey years 2008
and 2014 (since the reference period is the year prior to the interview, these data refer to the period 2007 to
2013). The proportion of working age adults who were persistently out of work and economically inactive
remained broadly constant throughout this six-year period, at around one sixth of all working-age
individuals. However, the proportion of long-term unemployed increased from 4% of the working age
population in 2007 to 14% in 2013. This is consistent with the pattern based on LFS data discussed earlier
in Section 1 of falling static employment rates and rising unemployment, as discussed above.
Figure 2.3 shows the size and composition of the target population in SILC 2014. Of the 74% who
were out of work throughout the reference period, most were unemployed (36% of the target population) or
retired (18% of the target population). 13% reported that they were engaged in domestic tasks, and 5% that
they were unfit to work. 26% of the target population did hold some paid employment during the reference
period, but belong to the “weak labour-market attachment” category. The majority of them spent most of
the reference period out of work (unstable jobs) and 2% worked less than 20 hours a week throughout the
year. 9% of the target population worked full-time throughout the year, typically as self-employed, but
report having zero or “near-zero” earnings.
Policy Analysis Note (PAN) for Portugal © OECD 2016 15
Figure 2.2. Dynamics of population groups with potential labour market difficulties
In % of working age population
Source: Calculations based on EU-SILC 2008-2014. See Box 2.1 for the definitions of the three groups.
Figure 2.3. Composition of the Portuguese population with labour market difficulties
Note: The six-country average is unweighted.
Source: Calculations based on EU-SILC 2014. See Box 2.1 for the definitions of the three groups.
Persistently out of work (74% of the target population)
Weak labour market attachment (26% of target population)
Unemplo-yed (36%)
Retired (18%)
Unfit to work (5%)
Domestic tasks (13%)
Other inactive
(2%)
61% 61%
12% 10%
27% 29%
Average of sixcountries PRT
Persistently out of work
Weak labour market attachment
No major difficulties
Restricted
hours (2%)
Near-zeroearnings (9%)
Unstable jobs(15%)
"Target" population
(39%)
Working age population
(100%)
Policy Analysis Note (PAN) for Portugal © OECD 2016 16
3. EMPLOYMENT BARRIERS IN PORTUGAL
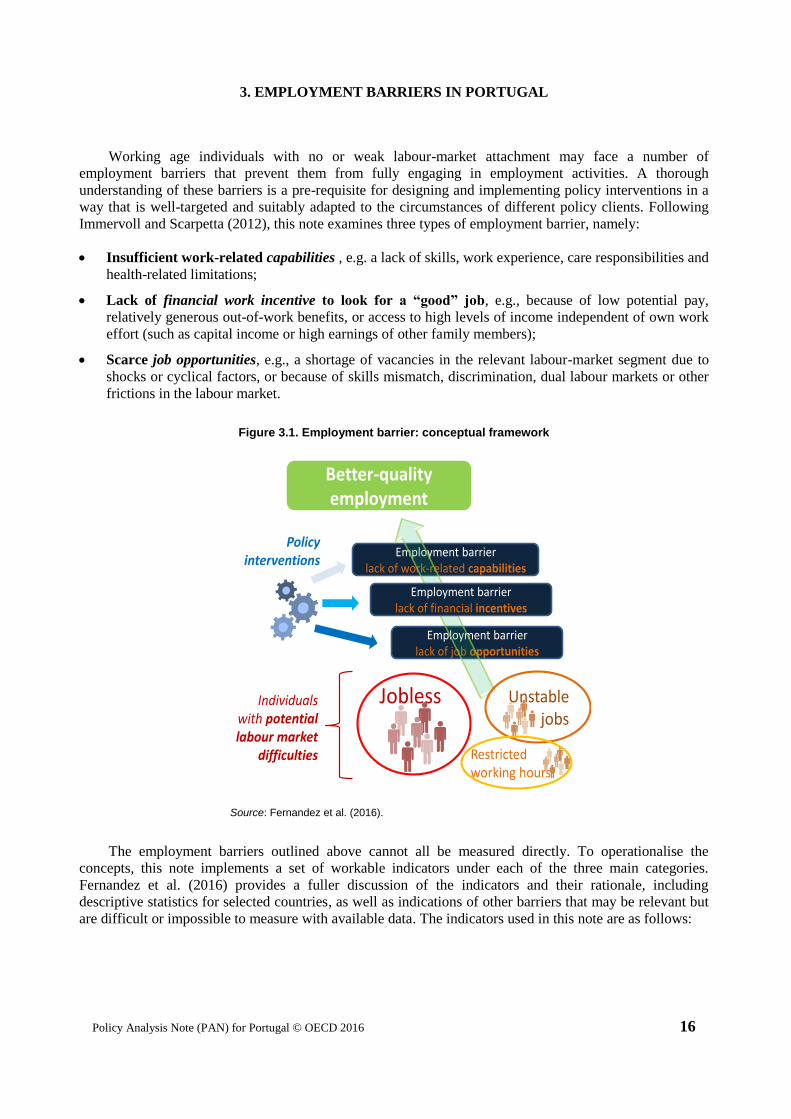
Working age individuals with no or weak labour-market attachment may face a number of
employment barriers that prevent them from fully engaging in employment activities. A thorough
understanding of these barriers is a pre-requisite for designing and implementing policy interventions in a
way that is well-targeted and suitably adapted to the circumstances of different policy clients. Following
Immervoll and Scarpetta (2012), this note examines three types of employment barrier, namely:
Insufficient work-related capabilities , e.g. a lack of skills, work experience, care responsibilities and
health-related limitations;
Lack of financial work incentive to look for a “good” job, e.g., because of low potential pay,
relatively generous out-of-work benefits, or access to high levels of income independent of own work
effort (such as capital income or high earnings of other family members);
Scarce job opportunities, e.g., a shortage of vacancies in the relevant labour-market segment due to
shocks or cyclical factors, or because of skills mismatch, discrimination, dual labour markets or other
frictions in the labour market.
Figure 3.1. Employment barrier: conceptual framework
Source: Fernandez et al. (2016).
The employment barriers outlined above cannot all be measured directly. To operationalise the
concepts, this note implements a set of workable indicators under each of the three main categories.
Fernandez et al. (2016) provides a fuller discussion of the indicators and their rationale, including
descriptive statistics for selected countries, as well as indications of other barriers that may be relevant but
are difficult or impossible to measure with available data. The indicators used in this note are as follows:
Employment barrierlack of job opportunities
Employment barrierlack of work-related capabilities
Better-qualityemployment
Policy interventions
Individuals with potential labour market
difficulties
Employment barrierlack of financial incentives
Jobless Unstable jobs
Restricted working hours
Policy Analysis Note (PAN) for Portugal © OECD 2016 17
Capability, item 1. “Low” education. The indicator takes the value 1 if an individual has a
lower-secondary degree or less (ISCED-11 standards).
Capability, item 2. Two measures of work experience:
No recent work experience: if an individual did no paid work during the reference period
(i.e. they were without employment for at least 12 months).
“Low” relative total work experience: the indicator takes one of three values: 1 for those
who have no past work experience at all, 2 for those who have some work experience but
have worked less than 60% of the time since they left full-time education, and 3 otherwise
(i.e., if their total work experience is not “low”).
Capability, item 3. Health limitations: If an individual reports some or severe long-standing
physical or mental limitations in daily activities.
Capability, item 4. Care responsibilities: if an individual has a (minor or adult) family member
who requires care8 and is either the only potential care giver in the household, or the only person
in the household who is economically inactive or working part-time because of care
responsibilities.
Incentives, item 1. “High” non-labour income: if the household’s income other than that
relating to the work efforts of the individual in question,9, is more than 1.4 times the median
value among the reference population (EUR 4 790/year, adjusted for household size).
Incentives, item 2. “High” earnings-replacement benefits: if an individual’s earnings-
replacement benefits received during the reference year exceed 60% of their estimated potential
earnings in work.10
Opportunity (one item only). “Scarce” job opportunities: if an individual has a “high” risk of
not finding a job despite active job-search during at least seven months, and willingness to take
up employment (as stated at the moment of the SILC interview). The risk is estimated in a
regression including region, age group, gender, level of professional skills and education as
independent variables and being long term unemployed or involuntarily working part time as the
dependent variable (see Fernandez et al., 2016 for more details). Individuals with an estimated
risk of more than 1.6 times the median value in the working-age population are considered to
face “scarce” job opportunities. Scarce job opportunities not only present a barrier to employment
in the short term, but if jobseekers become discouraged and stop active job search, it could lead
to further problems in the longer run.
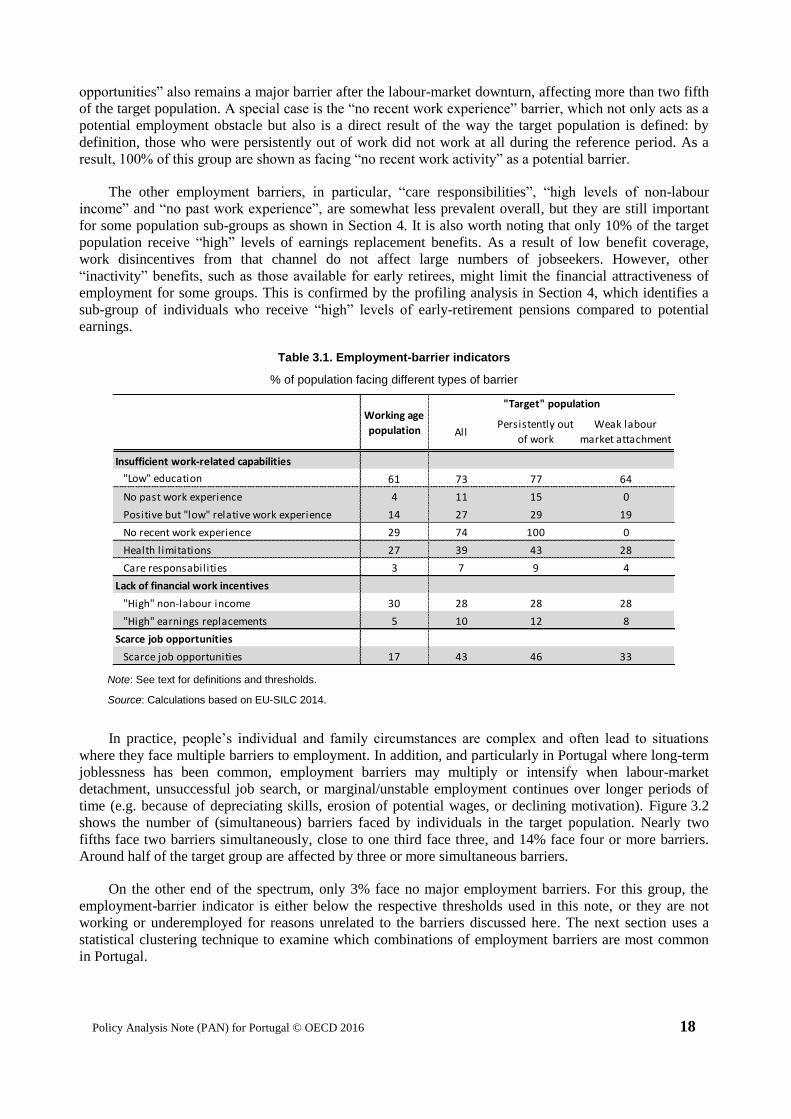
Table 3.1 shows the share of individuals in the target and the broader working-age populations facing
each employment barrier. As expected, and as required for the employment-barrier indicators to be
plausible, the incidence of each barrier is significantly higher in the group with potential labour-market
difficulties (i.e., the target population). In most cases, barriers are also more prevalent among those who
were out of work throughout the entire reference period than for those with weak labour-market
attachment. Consistent with the discussion of skills deficiencies in Section 2, the most common barrier in
Portugal is low education, which is faced by about three quarters of the target population. “Scarce job
8. Family members assumed to require care are children under the age of 12 receiving less than 30 hours of
non-parental childcare a week and adults reporting severe limitations in daily activities due to their health
and being economically inactive throughout the reference period (and in the case of those of working age,
that permanent disability is the reason for their inactivity).
9. This includes earnings, individual-level earnings replacement benefits, and the individual’s share of
household-level earnings replacement benefits.
10 . Potential earnings are estimated in SILC with a regression model corrected for sample selection. See
Fernandez et al. (2016) for details.
Policy Analysis Note (PAN) for Portugal © OECD 2016 18
opportunities” also remains a major barrier after the labour-market downturn, affecting more than two fifth
of the target population. A special case is the “no recent work experience” barrier, which not only acts as a
potential employment obstacle but also is a direct result of the way the target population is defined: by
definition, those who were persistently out of work did not work at all during the reference period. As a
result, 100% of this group are shown as facing “no recent work activity” as a potential barrier.
The other employment barriers, in particular, “care responsibilities”, “high levels of non-labour
income” and “no past work experience”, are somewhat less prevalent overall, but they are still important
for some population sub-groups as shown in Section 4. It is also worth noting that only 10% of the target
population receive “high” levels of earnings replacement benefits. As a result of low benefit coverage,
work disincentives from that channel do not affect large numbers of jobseekers. However, other
“inactivity” benefits, such as those available for early retirees, might limit the financial attractiveness of
employment for some groups. This is confirmed by the profiling analysis in Section 4, which identifies a
sub-group of individuals who receive “high” levels of early-retirement pensions compared to potential
earnings.
Table 3.1. Employment-barrier indicators
% of population facing different types of barrier
Note: See text for definitions and thresholds.
Source: Calculations based on EU-SILC 2014.
In practice, people’s individual and family circumstances are complex and often lead to situations
where they face multiple barriers to employment. In addition, and particularly in Portugal where long-term
joblessness has been common, employment barriers may multiply or intensify when labour-market
detachment, unsuccessful job search, or marginal/unstable employment continues over longer periods of
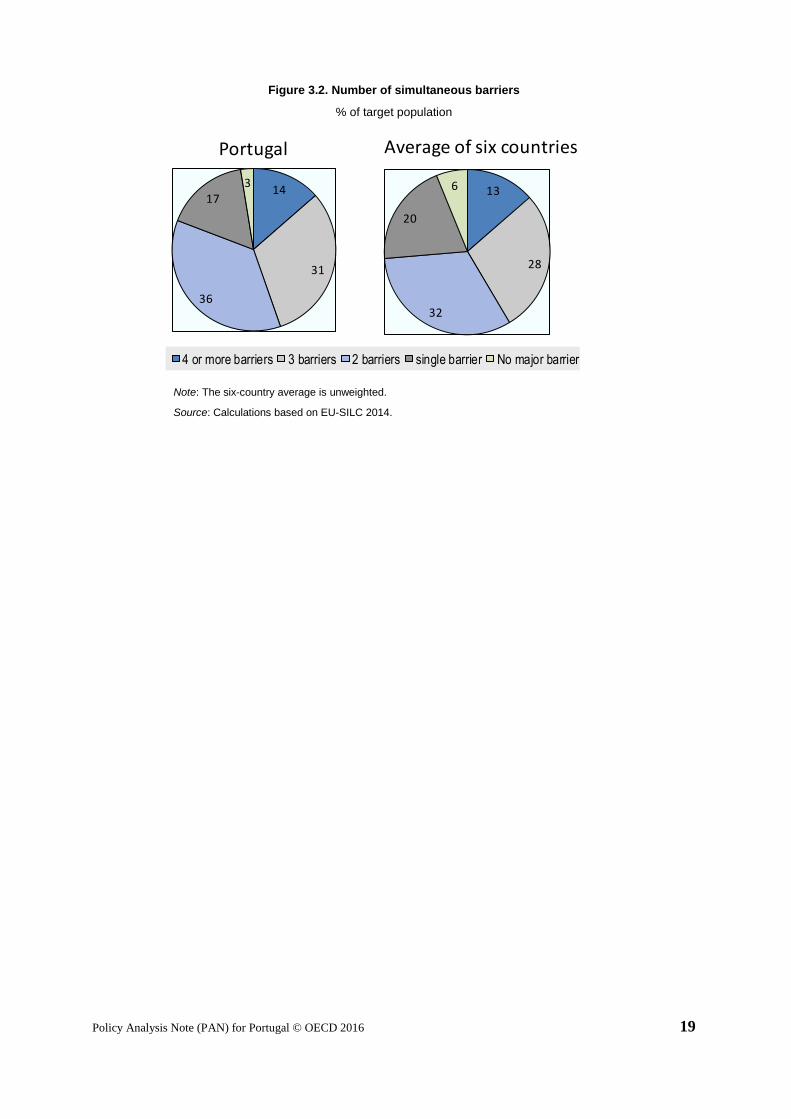
time (e.g. because of depreciating skills, erosion of potential wages, or declining motivation). Figure 3.2
shows the number of (simultaneous) barriers faced by individuals in the target population. Nearly two
fifths face two barriers simultaneously, close to one third face three, and 14% face four or more barriers.
Around half of the target group are affected by three or more simultaneous barriers.
On the other end of the spectrum, only 3% face no major employment barriers. For this group, the
employment-barrier indicator is either below the respective thresholds used in this note, or they are not
working or underemployed for reasons unrelated to the barriers discussed here. The next section uses a
statistical clustering technique to examine which combinations of employment barriers are most common
in Portugal.
AllPersistently out
of work
Weak labour
market attachment
Insufficient work-related capabilities
"Low" education 61 73 77 64
No past work experience 4 11 15 0
Positive but "low" relative work experience 14 27 29 19
No recent work experience 29 74 100 0
Health limitations 27 39 43 28
Care responsabilities 3 7 9 4
Lack of financial work incentives
"High" non-labour income 30 28 28 28
"High" earnings replacements 5 10 12 8
Scarce job opportunities
Scarce job opportunities 17 43 46 33
"Target" populationWorking age
population
Policy Analysis Note (PAN) for Portugal © OECD 2016 19
Figure 3.2. Number of simultaneous barriers
% of target population
Note: The six-country average is unweighted.
Source: Calculations based on EU-SILC 2014.
14
31
36
173
4 or more barriers 3 barriers 2 barriers single barrier No major barrier
13
28
32
20
6
Portugal Average of six countries
Policy Analysis Note (PAN) for Portugal © OECD 2016 20
4. FACES OF JOBLESSNESS IN PORTUGAL
This section applies the method described in Fernandez et al. (2016) to segment the target population
into groups of individuals with similar combinations of employment barriers. Using the 2014 SILC data
for Portugal, the segmentation process leads to the identification of nine groups of individuals with no or
weak labour market attachment (the “target population”).11
The following paragraphs describe each group in detail. At the end of each paragraph a box reports a
Venn diagram showing extent and degree of overlap of the main barriers characterising the group, as well
as a list of selected individual and household characteristics with a “high” probability of occurrence within
the group. Together, this information can help attach suitable labels (“faces”) to group members, although
the labels are necessarily arbitrary to some extent and cannot substitute for careful examination of the
comprehensive list of employment barriers and socio-economic characteristics, as reported in Annex
Tables A.1 and A.2.
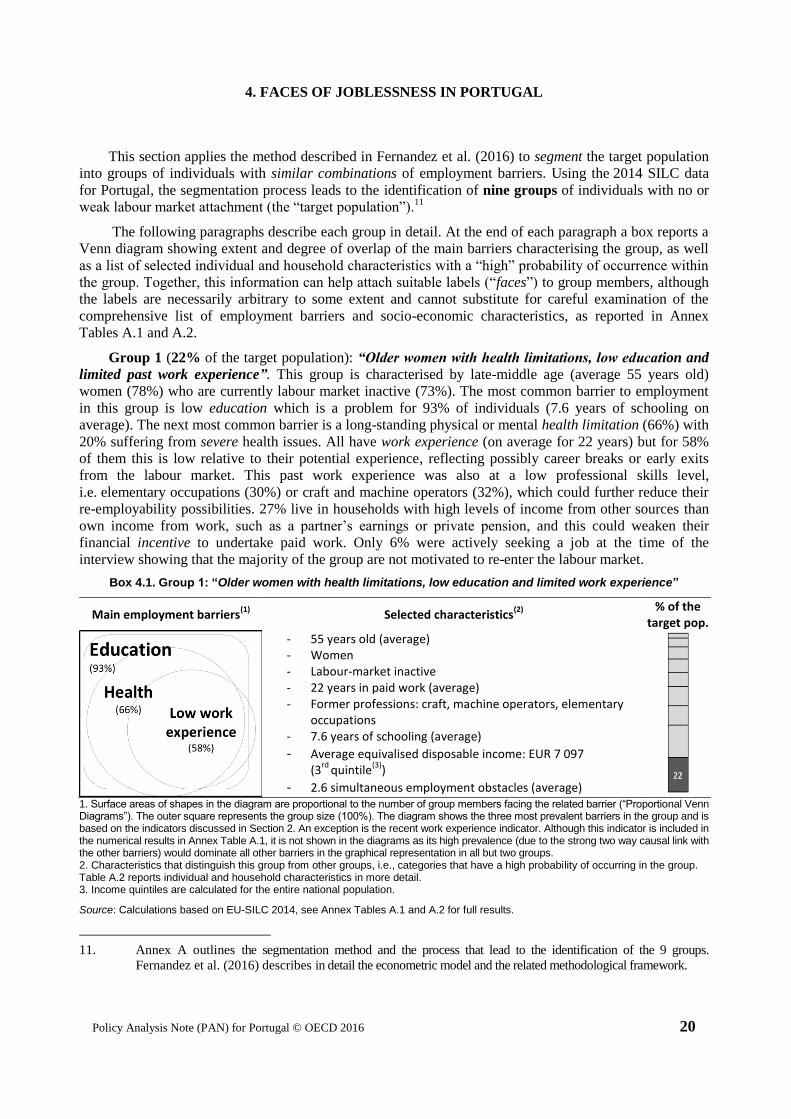
Group 1 (22% of the target population): “Older women with health limitations, low education and
limited past work experience”. This group is characterised by late-middle age (average 55 years old)
women (78%) who are currently labour market inactive (73%). The most common barrier to employment
in this group is low education which is a problem for 93% of individuals (7.6 years of schooling on
average). The next most common barrier is a long-standing physical or mental health limitation (66%) with
20% suffering from severe health issues. All have work experience (on average for 22 years) but for 58%
of them this is low relative to their potential experience, reflecting possibly career breaks or early exits
from the labour market. This past work experience was also at a low professional skills level,
i.e. elementary occupations (30%) or craft and machine operators (32%), which could further reduce their
re-employability possibilities. 27% live in households with high levels of income from other sources than
own income from work, such as a partner’s earnings or private pension, and this could weaken their
financial incentive to undertake paid work. Only 6% were actively seeking a job at the time of the
interview showing that the majority of the group are not motivated to re-enter the labour market.
Box 4.1. Group 1: “Older women with health limitations, low education and limited work experience”
Main employment barriers(1)
Selected characteristics(2)
% of the
target pop.
- 55 years old (average) - Women - Labour-market inactive - 22 years in paid work (average) - Former professions: craft, machine operators, elementary
occupations - 7.6 years of schooling (average)
- Average equivalised disposable income: EUR 7 097 (3
rd quintile
(3))
- 2.6 simultaneous employment obstacles (average) 1. Surface areas of shapes in the diagram are proportional to the number of group members facing the related barrier (“Proportional Venn Diagrams”). The outer square represents the group size (100%). The diagram shows the three most prevalent barriers in the group and is based on the indicators discussed in Section 2. An exception is the recent work experience indicator. Although this indicator is included in the numerical results in Annex Table A.1, it is not shown in the diagrams as its high prevalence (due to the strong two way causal link with the other barriers) would dominate all other barriers in the graphical representation in all but two groups. 2. Characteristics that distinguish this group from other groups, i.e., categories that have a high probability of occurring in the group. Table A.2 reports individual and household characteristics in more detail. 3. Income quintiles are calculated for the entire national population.
Source: Calculations based on EU-SILC 2014, see Annex Tables A.1 and A.2 for full results.
11. Annex A outlines the segmentation method and the process that lead to the identification of the 9 groups.
Fernandez et al. (2016) describes in detail the econometric model and the related methodological framework.
Policy Analysis Note (PAN) for Portugal © OECD 2016 21
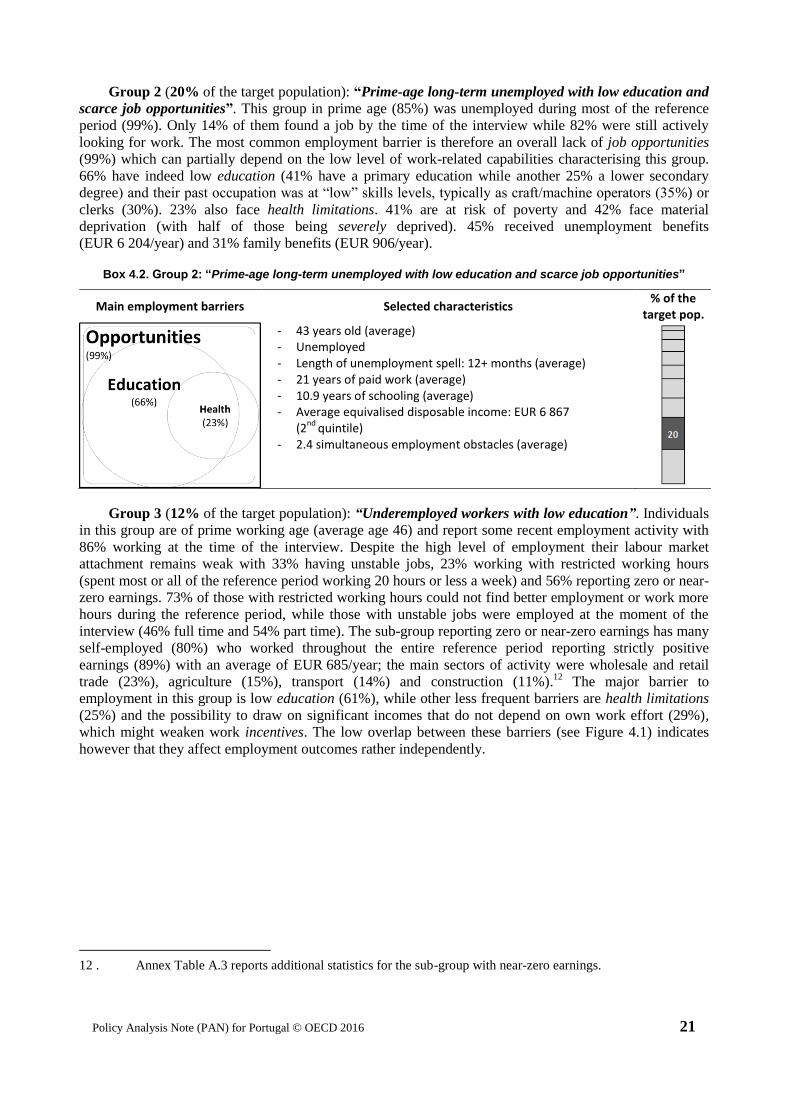
Group 2 (20% of the target population): “Prime-age long-term unemployed with low education and
scarce job opportunities”. This group in prime age (85%) was unemployed during most of the reference
period (99%). Only 14% of them found a job by the time of the interview while 82% were still actively
looking for work. The most common employment barrier is therefore an overall lack of job opportunities
(99%) which can partially depend on the low level of work-related capabilities characterising this group.
66% have indeed low education (41% have a primary education while another 25% a lower secondary
degree) and their past occupation was at “low” skills levels, typically as craft/machine operators (35%) or
clerks (30%). 23% also face health limitations. 41% are at risk of poverty and 42% face material
deprivation (with half of those being severely deprived). 45% received unemployment benefits
(EUR 6 204/year) and 31% family benefits (EUR 906/year).
Box 4.2. Group 2: “Prime-age long-term unemployed with low education and scarce job opportunities”
Main employment barriers Selected characteristics % of the
target pop.
- 43 years old (average) - Unemployed - Length of unemployment spell: 12+ months (average) - 21 years of paid work (average) - 10.9 years of schooling (average) - Average equivalised disposable income: EUR 6 867
(2nd
quintile) - 2.4 simultaneous employment obstacles (average)
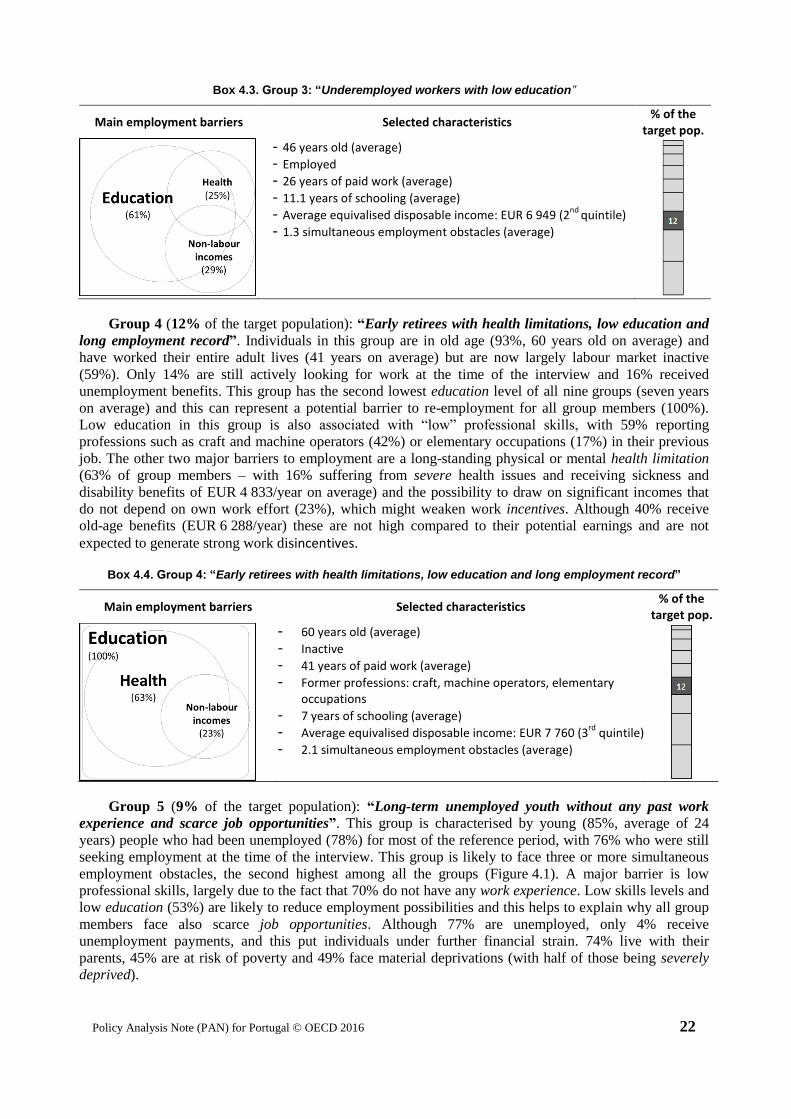
Group 3 (12% of the target population): “Underemployed workers with low education”. Individuals
in this group are of prime working age (average age 46) and report some recent employment activity with
86% working at the time of the interview. Despite the high level of employment their labour market
attachment remains weak with 33% having unstable jobs, 23% working with restricted working hours
(spent most or all of the reference period working 20 hours or less a week) and 56% reporting zero or near-
zero earnings. 73% of those with restricted working hours could not find better employment or work more
hours during the reference period, while those with unstable jobs were employed at the moment of the
interview (46% full time and 54% part time). The sub-group reporting zero or near-zero earnings has many
self-employed (80%) who worked throughout the entire reference period reporting strictly positive
earnings (89%) with an average of EUR 685/year; the main sectors of activity were wholesale and retail
trade (23%), agriculture (15%), transport (14%) and construction (11%).12
The major barrier to
employment in this group is low education (61%), while other less frequent barriers are health limitations
(25%) and the possibility to draw on significant incomes that do not depend on own work effort (29%),
which might weaken work incentives. The low overlap between these barriers (see Figure 4.1) indicates
however that they affect employment outcomes rather independently.
12 . Annex Table A.3 reports additional statistics for the sub-group with near-zero earnings.
Policy Analysis Note (PAN) for Portugal © OECD 2016 22
Box 4.3. Group 3: “Underemployed workers with low education”
Main employment barriers Selected characteristics % of the
target pop.
- 46 years old (average)
- Employed
- 26 years of paid work (average)
- 11.1 years of schooling (average)
- Average equivalised disposable income: EUR 6 949 (2nd
quintile)
- 1.3 simultaneous employment obstacles (average)
Group 4 (12% of the target population): “Early retirees with health limitations, low education and
long employment record”. Individuals in this group are in old age (93%, 60 years old on average) and
have worked their entire adult lives (41 years on average) but are now largely labour market inactive
(59%). Only 14% are still actively looking for work at the time of the interview and 16% received
unemployment benefits. This group has the second lowest education level of all nine groups (seven years
on average) and this can represent a potential barrier to re-employment for all group members (100%).
Low education in this group is also associated with “low” professional skills, with 59% reporting
professions such as craft and machine operators (42%) or elementary occupations (17%) in their previous
job. The other two major barriers to employment are a long-standing physical or mental health limitation
(63% of group members – with 16% suffering from severe health issues and receiving sickness and
disability benefits of EUR 4 833/year on average) and the possibility to draw on significant incomes that
do not depend on own work effort (23%), which might weaken work incentives. Although 40% receive
old-age benefits (EUR 6 288/year) these are not high compared to their potential earnings and are not
expected to generate strong work disincentives.
Box 4.4. Group 4: “Early retirees with health limitations, low education and long employment record”
Main employment barriers Selected characteristics % of the
target pop.
- 60 years old (average)
- Inactive
- 41 years of paid work (average)
- Former professions: craft, machine operators, elementary occupations
- 7 years of schooling (average)
- Average equivalised disposable income: EUR 7 760 (3rd
quintile) - 2.1 simultaneous employment obstacles (average)
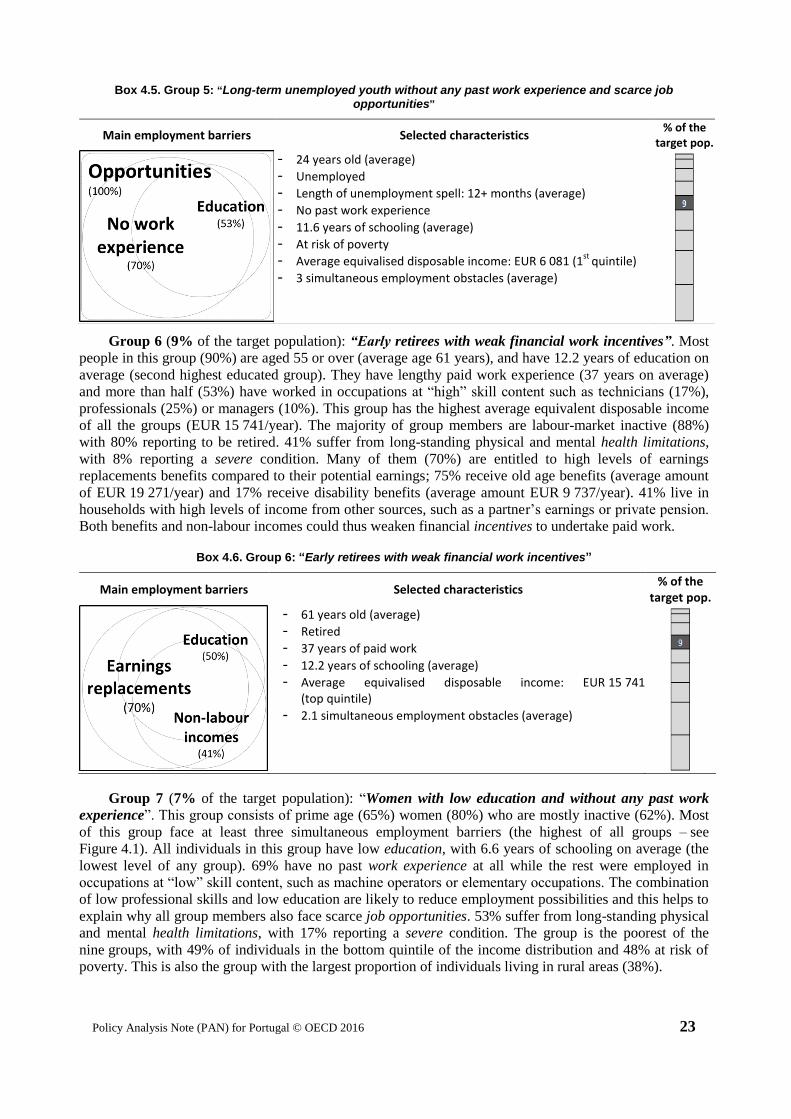
Group 5 (9% of the target population): “Long-term unemployed youth without any past work
experience and scarce job opportunities”. This group is characterised by young (85%, average of 24
years) people who had been unemployed (78%) for most of the reference period, with 76% who were still
seeking employment at the time of the interview. This group is likely to face three or more simultaneous
employment obstacles, the second highest among all the groups (Figure 4.1). A major barrier is low
professional skills, largely due to the fact that 70% do not have any work experience. Low skills levels and
low education (53%) are likely to reduce employment possibilities and this helps to explain why all group
members face also scarce job opportunities. Although 77% are unemployed, only 4% receive
unemployment payments, and this put individuals under further financial strain. 74% live with their
parents, 45% are at risk of poverty and 49% face material deprivations (with half of those being severely
deprived).
Policy Analysis Note (PAN) for Portugal © OECD 2016 23
Box 4.5. Group 5: “Long-term unemployed youth without any past work experience and scarce job opportunities”
Group 6 (9% of the target population): “Early retirees with weak financial work incentives”. Most
people in this group (90%) are aged 55 or over (average age 61 years), and have 12.2 years of education on
average (second highest educated group). They have lengthy paid work experience (37 years on average)
and more than half (53%) have worked in occupations at “high” skill content such as technicians (17%),
professionals (25%) or managers (10%). This group has the highest average equivalent disposable income
of all the groups (EUR 15 741/year). The majority of group members are labour-market inactive (88%)
with 80% reporting to be retired. 41% suffer from long-standing physical and mental health limitations,
with 8% reporting a severe condition. Many of them (70%) are entitled to high levels of earnings
replacements benefits compared to their potential earnings; 75% receive old age benefits (average amount
of EUR 19 271/year) and 17% receive disability benefits (average amount EUR 9 737/year). 41% live in
households with high levels of income from other sources, such as a partner’s earnings or private pension.
Both benefits and non-labour incomes could thus weaken financial incentives to undertake paid work.
Box 4.6. Group 6: “Early retirees with weak financial work incentives”
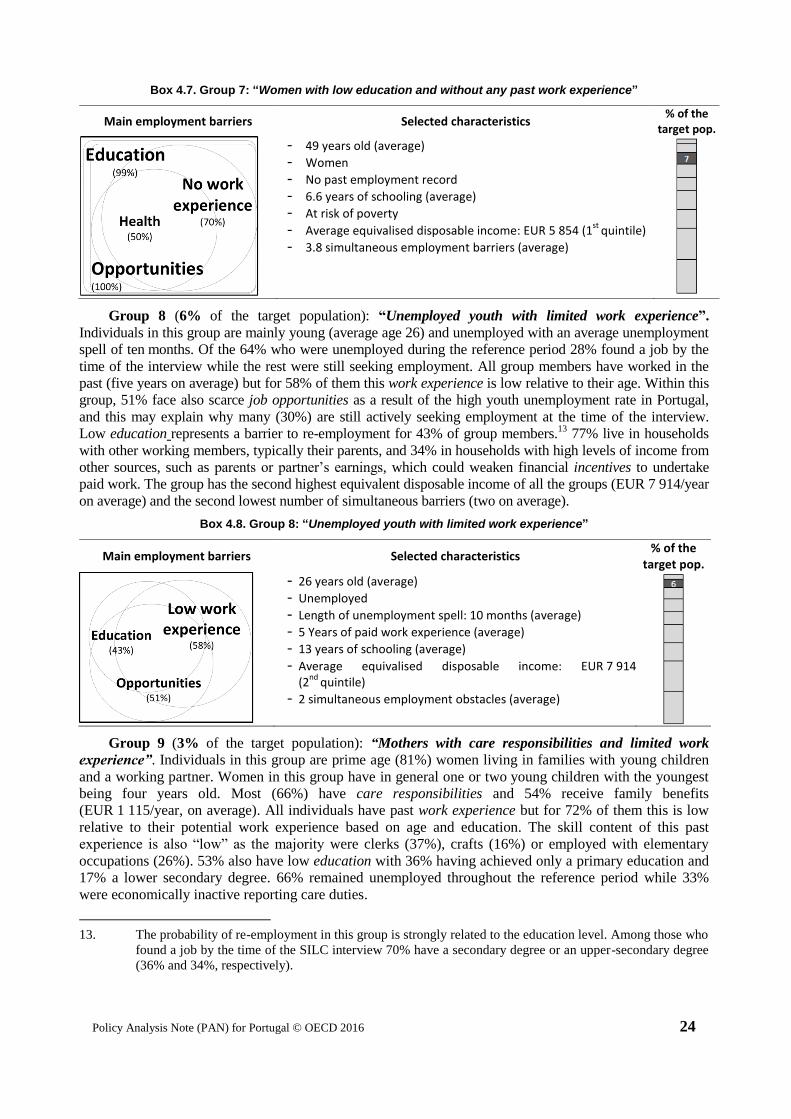
Group 7 (7% of the target population): “Women with low education and without any past work
experience”. This group consists of prime age (65%) women (80%) who are mostly inactive (62%). Most
of this group face at least three simultaneous employment barriers (the highest of all groups – see
Figure 4.1). All individuals in this group have low education, with 6.6 years of schooling on average (the
lowest level of any group). 69% have no past work experience at all while the rest were employed in
occupations at “low” skill content, such as machine operators or elementary occupations. The combination
of low professional skills and low education are likely to reduce employment possibilities and this helps to
explain why all group members also face scarce job opportunities. 53% suffer from long-standing physical
and mental health limitations, with 17% reporting a severe condition. The group is the poorest of the
nine groups, with 49% of individuals in the bottom quintile of the income distribution and 48% at risk of
poverty. This is also the group with the largest proportion of individuals living in rural areas (38%).
Main employment barriers Selected characteristics % of the
target pop.
- 24 years old (average)
- Unemployed
- Length of unemployment spell: 12+ months (average)
- No past work experience
- 11.6 years of schooling (average)
- At risk of poverty
- Average equivalised disposable income: EUR 6 081 (1st
quintile)
- 3 simultaneous employment obstacles (average)
Main employment barriers Selected characteristics % of the
target pop.
- 61 years old (average)
- Retired
- 37 years of paid work
- 12.2 years of schooling (average)
- Average equivalised disposable income: EUR 15 741 (top quintile)
- 2.1 simultaneous employment obstacles (average)
Policy Analysis Note (PAN) for Portugal © OECD 2016 24
Box 4.7. Group 7: “Women with low education and without any past work experience”
Group 8 (6% of the target population): “Unemployed youth with limited work experience”.
Individuals in this group are mainly young (average age 26) and unemployed with an average unemployment
spell of ten months. Of the 64% who were unemployed during the reference period 28% found a job by the
time of the interview while the rest were still seeking employment. All group members have worked in the
past (five years on average) but for 58% of them this work experience is low relative to their age. Within this
group, 51% face also scarce job opportunities as a result of the high youth unemployment rate in Portugal,
and this may explain why many (30%) are still actively seeking employment at the time of the interview.
Low education represents a barrier to re-employment for 43% of group members.13
77% live in households
with other working members, typically their parents, and 34% in households with high levels of income from
other sources, such as parents or partner’s earnings, which could weaken financial incentives to undertake
paid work. The group has the second highest equivalent disposable income of all the groups (EUR 7 914/year
on average) and the second lowest number of simultaneous barriers (two on average).
Box 4.8. Group 8: “Unemployed youth with limited work experience”
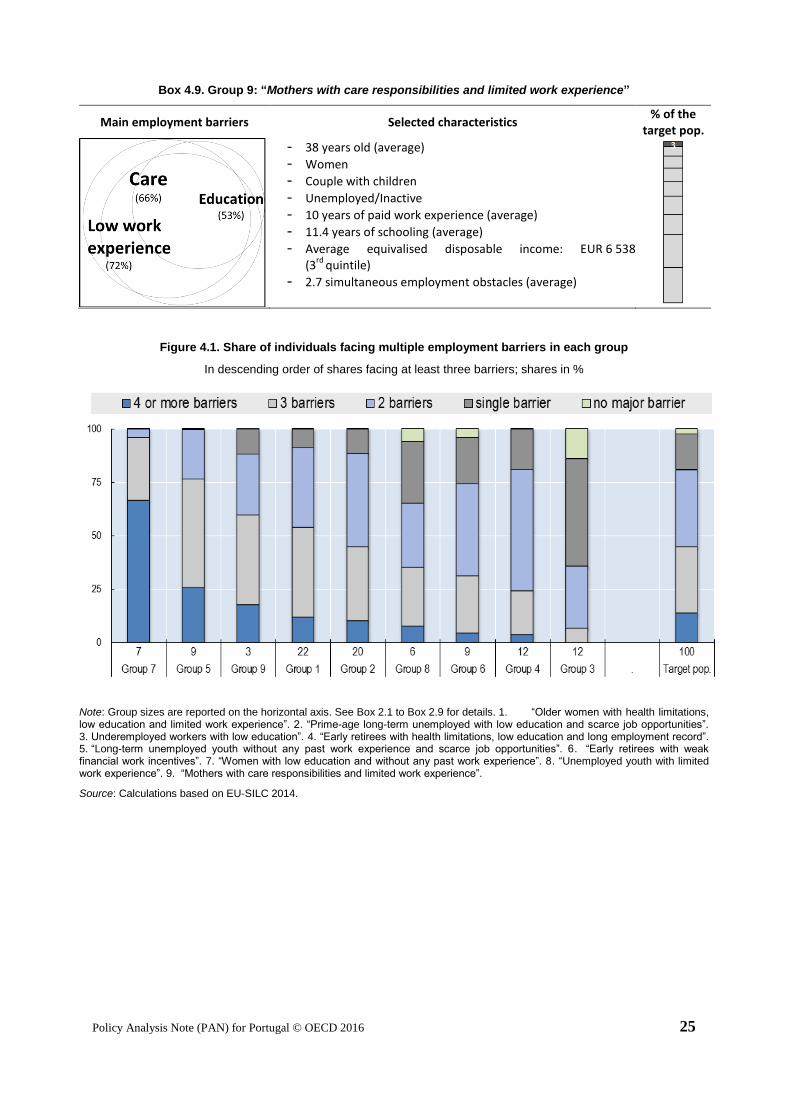
Group 9 (3% of the target population): “Mothers with care responsibilities and limited work
experience”. Individuals in this group are prime age (81%) women living in families with young children
and a working partner. Women in this group have in general one or two young children with the youngest
being four years old. Most (66%) have care responsibilities and 54% receive family benefits
(EUR 1 115/year, on average). All individuals have past work experience but for 72% of them this is low
relative to their potential work experience based on age and education. The skill content of this past
experience is also “low” as the majority were clerks (37%), crafts (16%) or employed with elementary
occupations (26%). 53% also have low education with 36% having achieved only a primary education and
17% a lower secondary degree. 66% remained unemployed throughout the reference period while 33%
were economically inactive reporting care duties.
13. The probability of re-employment in this group is strongly related to the education level. Among those who
found a job by the time of the SILC interview 70% have a secondary degree or an upper-secondary degree
(36% and 34%, respectively).
Main employment barriers Selected characteristics % of the
target pop.
- 49 years old (average)
- Women
- No past employment record
- 6.6 years of schooling (average)
- At risk of poverty - Average equivalised disposable income: EUR 5 854 (1
st quintile)
- 3.8 simultaneous employment barriers (average)
Main employment barriers Selected characteristics % of the
target pop.
- 26 years old (average)
- Unemployed
- Length of unemployment spell: 10 months (average)
- 5 Years of paid work experience (average)
- 13 years of schooling (average)
- Average equivalised disposable income: EUR 7 914 (2
nd quintile)
- 2 simultaneous employment obstacles (average)
Policy Analysis Note (PAN) for Portugal © OECD 2016 25
Box 4.9. Group 9: “Mothers with care responsibilities and limited work experience”
Main employment barriers Selected characteristics % of the
target pop.
- 38 years old (average)
- Women
- Couple with children
- Unemployed/Inactive
- 10 years of paid work experience (average)
- 11.4 years of schooling (average)
- Average equivalised disposable income: EUR 6 538 (3
rd quintile)
- 2.7 simultaneous employment obstacles (average)
Figure 4.1. Share of individuals facing multiple employment barriers in each group
In descending order of shares facing at least three barriers; shares in %
Note: Group sizes are reported on the horizontal axis. See Box 2.1 to Box 2.9 for details. 1. “Older women with health limitations, low education and limited work experience”. 2. “Prime-age long-term unemployed with low education and scarce job opportunities”. 3. Underemployed workers with low education”. 4. “Early retirees with health limitations, low education and long employment record”. 5. “Long-term unemployed youth without any past work experience and scarce job opportunities”. 6. “Early retirees with weak financial work incentives”. 7. “Women with low education and without any past work experience”. 8. “Unemployed youth with limited work experience”. 9. “Mothers with care responsibilities and limited work experience”.
Source: Calculations based on EU-SILC 2014.
Policy Analysis Note (PAN) for Portugal © OECD 2016 26
5. CONCLUSIONS
This note has used a novel method for identifying, analysing and visualising the most common
employment barrier profiles characterising the Portuguese population with potential labour market
difficulties. The underlying premise is that out-of-work individuals (unemployed and inactive) and workers
with weak labour market attachment face a number of possible employment obstacles, and each of them
may call for different policy responses. The success of activation and employment-support policies
(AESPs), and of social protection measures more generally, is expected to hinge on effective strategies to
target and tailor policy interventions to these barriers and to individual circumstances.
The segmentation method used in this note has uncovered patterns that can provide concrete guidance
for policy design and targeting strategies in Portugal. Results show that “short-hand” groupings that are
often referred to in the policy debate, such as “youth”, “women”, “unemployed”, are far from
homogeneous, and may distract attention from the specific employment obstacles that policies seek to
address. Indeed, some of these categories include several distinct sub-groups with very different
combinations of employment barriers.
For example, the statistical clustering has identified three quite different groups of women that are
likely to respond to policies in different ways. One group is characterised by limited work experience and
no major barriers to employment other than the need to care for children. For this group training
programmes and affordable childcare may represent the most effective policy mix. A larger group isolates
older women who combine low education with health limitations. In this case active labour market policies
to tackle skills deficits should go together with flexible work arrangements. A third group has no past work
experience at all and very low levels of education. In this case a longer-term approach to addressing
employment barriers may be necessary.
The statistical clustering has identified two groups of older people facing different employment
barriers. Both have low education and a long employment record but one has health limitations, whereas
the other lives in relatively rich households and receives high earnings replacement benefits. Again, these
differences suggest scope for employing quite different policy approaches for different groups of older
working-age people.
The statistical clustering has also identified two distinct sub-groups among the youth. Both are
unemployed, one is trying to find a job for the first time and is facing scarce job opportunities while the
other has some professional skills deficits but is slowly managing to return to paid work. In view of these
different characteristics, a uniform approach regarding youth policies would likely be inappropriate.
Although the clustering results do not in themselves say which groups should be the focus for AESPs,
they may highlight priority groups for policy interventions. For instance, very high poverty risks, a large
number of young people or a strong over-representation of women in some groups may signal a need to
review whether existing targeting strategies meet governments’ social cohesion objectives. A high poverty
risk combined with weak work incentives may call for caution in applying benefits recipient requirements
(such as for some individuals in Group 3). By contrast, groups with relatively high incomes and financial
disincentives caused by high levels of income replacement benefits (such as Group 6) may indicate scope
for targeted benefit reductions or for tightening benefit eligibility conditions.
Likewise, information on the intensity and number of barriers faced by individuals can inform
difficult policy decisions involving trade-offs between helping those in greatest need and targeting those
who are likely to be the most responsive to policy interventions. For example, it is debatable whether
resources should be channelled primarily to those with severe or multiple barriers who are, in some sense,

Policy Analysis Note (PAN) for Portugal © OECD 2016 27
furthest from obtaining or holding a stable job or to groups with moderate employment difficulties, for
whom policy interventions may have a greater probability of success.
A forthcoming Country Policy Paper to be produced as part of this project will take stock of existing
policy measures for some of the groups identified here. Based on that policy inventory, it will seek to
analyse whether they are well-aligned with the employment barriers identified in this paper.
Policy Analysis Note (PAN) for Portugal © OECD 2016 28
REFERENCES
Arias, O.S., C. Sánchez-Páramo, M. E. Dávalos, I. Santos, E.R. Tiongson, C. Grun, N. de Andrade Falcão,
G. Saiovici and C.A. Cancho (2014), Back to Work: Growing with Jobs in Europe and Central Asia,
Washington, DC, doi:10.1596/978-0-8213-9910-1.
Avram, S., F. Figari, C. Leventi, H. Levy, J. Navicke, M. Matsaganis, E. Militaru, A. Paulus, O. Rastrigina
and H. Sutherland (2012), “The Distributional Effects of Fiscal Consolidation in Nine
EU Countries”, Research Note 01/2012, Employment, Social Affairs & Inclusion, December
Card, D., J. Kluve and A.Weber (2010), “Active Labour Market Analysis Policy Evaluations: A Meta-
Analysis”, Economic Journal, No. 120.
Collins, L.M. and S.T. Lanza (2013), Latent Class and Latent Transition Analysis: With Applications in the
Social, Behavioral, and Health Sciences, Vol. 718, John Wiley & Sons.
Eurofound (2012a), “NEETS - Young People Not in Employment, Education or Training: Characteristics,
Costs and Policy Responses in Europe”, Publications Office of the European Union, Luxembourg.
Eurofound (2012b), “Fifth European Working Condition Survey”, Publications Office of the European
Union, Luxembourg.
European Commission (2016a), “Country Report: Portugal 2016”, Commission Staff Working Document.
European Commission (2016b), “Employment and Social Developments in Europe”.
European Commission (2015), “Upskilling Unemployed Adults (aged 25 to 64): The Organisation,
Profiling and Targeting of Training Provision”, Publications Office of the European Union,
Luxembourg.
Fernandez , R., H. Immervoll, D. Pacifico and C. Thévenot (2016), “Faces of Joblessness. Characterising
Employment Barriers to Inform Policy”, Forthcoming SEM Working Paper, OECD, Paris.
Immervoll, H. and A. Isik-Dikmelik (2016), “Cooperation with the OECD on Assessing Activating and
Enabling Benefits and Services in the EU: OECD-World Bank Joint Methodological Report”,
unpublished report submitted to the European Commission, March.
Immervoll, H. and S. Scarpetta (2012), “Activation and Employment Support Policies in OECD Countries.
An Overview of Current Approaches”, IZA Journal of Labor Policy, Vol. 1(1), pp. 1-20.
OECD (forthcoming), “Labour Market Reforms in Portugal 2011-2015 – A preliminary Assessment”,
OECD, Paris.
OECD (2016a), OECD Employment Outlook 2016, OECD Publishing, Paris.
OECD (2016b), Getting Skills Right: Assessing and Anticipating Changing Skill Needs, OECD
Publishing, Paris (forthcoming).
OECD (2015a), “Activation Policies for More Inclusive Labour Markets”, in OECD Employment Outlook
2015, OECD Publishing, Paris, http://dx.doi.org/10.1787/empl_outlook-2015-7-en.
OECD (2015c), Education at a Glance: OECD Indicators, OECD Publishing, Paris.
Policy Analysis Note (PAN) for Portugal © OECD 2016 29
OECD (2015d), International Migration Outlook 2015, OECD Publishing, Paris.
OECD (2014a), OECD Economic Surveys: Portugal 2014, OECD Publishing, Paris.
OECD (2014a), “The Crisis and its Aftermath: A ‘Stress Test’ for Societies and for Social Policies”,
Society at a Glance: OECD Indicators, OECD Publishing, Paris.
OECD (2013a), “Activation Strategies for Stronger and More Inclusive Labour Markets in G20 Countries:
Key Policy Challenges and Good Practices”, G20Task Force on Employment, Report prepared for
the G20 Summit in St. Petersburg, July, http://www.oecd.org/g20.
OECD (2013b), “Activating Jobseekers: Lessons from Seven OECD Countries”, in OECD Employment
Outlook 2013, OECD Publishing, Paris, http://dx.doi.org/10.1787/empl_outlook-2013-7-en.
OECD (2013c), The OECD Action Plan for Youth – Giving Youth a Better Start in the Labour Market,
OECD Publishing, Paris.
OECD (2008), “Declaring Work or Staying Underground: Informal Employment in Seven OECD
Countries”, Employment Outlook 2008, OECD Publishing, Paris.
Schneider, F. (2015), “Size and Development of the Shadow Economy of 31 European and 5 Other OECD
Countries from 2003 to 2015: Different Developments”, mimeo,
http://www.econ.jku.at/members/Schneider/files/publications/2015/ShadEcEurope31.pdf.
Vermunt J. K. and J. Magidson (2016), Technical Guide for Latent GOLD 5.1: Basic, Advanced, and
Syntax, Statistical Innovations Inc., Belmont, MA.
Policy Analysis Note (PAN) for Portugal © OECD 2016 30
ANNEX A
LATENT CLASS RESULTS
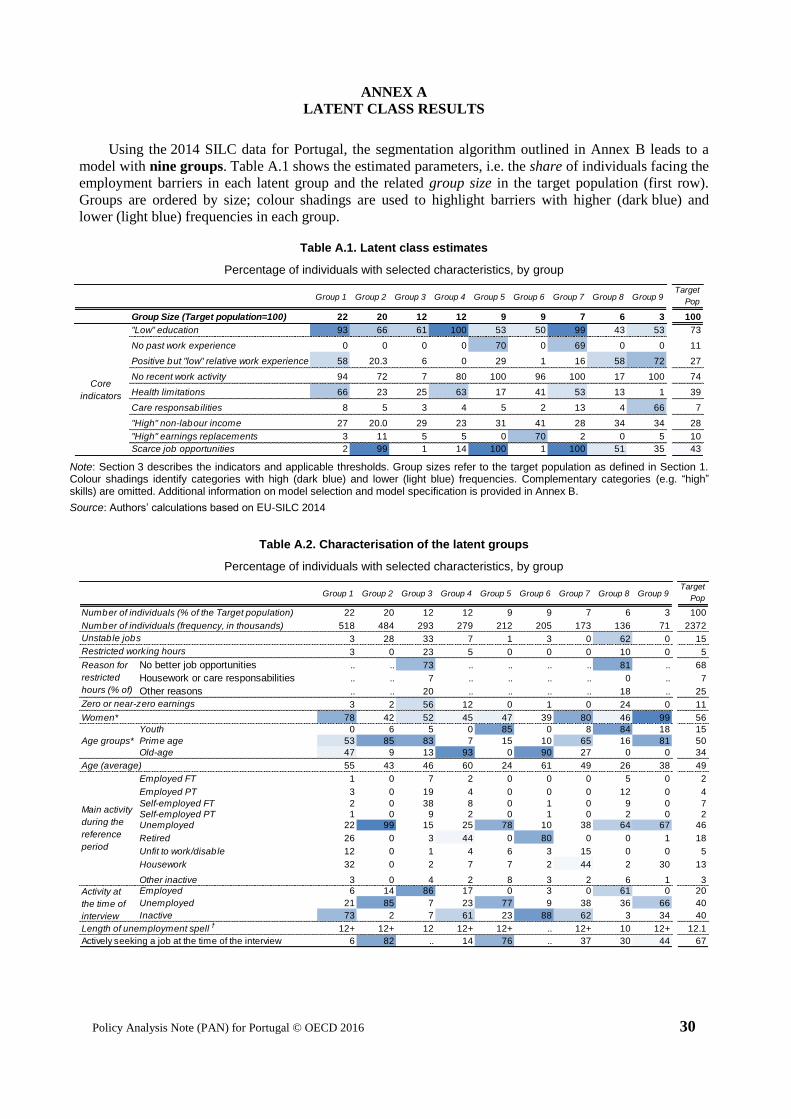
Using the 2014 SILC data for Portugal, the segmentation algorithm outlined in Annex B leads to a
model with nine groups. Table A.1 shows the estimated parameters, i.e. the share of individuals facing the
employment barriers in each latent group and the related group size in the target population (first row).
Groups are ordered by size; colour shadings are used to highlight barriers with higher (dark blue) and
lower (light blue) frequencies in each group.
Table A.1. Latent class estimates
Percentage of individuals with selected characteristics, by group
Note: Section 3 describes the indicators and applicable thresholds. Group sizes refer to the target population as defined in Section 1. Colour shadings identify categories with high (dark blue) and lower (light blue) frequencies. Complementary categories (e.g. “high” skills) are omitted. Additional information on model selection and model specification is provided in Annex B.
Source: Authors’ calculations based on EU-SILC 2014
Table A.2. Characterisation of the latent groups
Percentage of individuals with selected characteristics, by group
Group 1 Group 2 Group 3 Group 4 Group 5 Group 6 Group 7 Group 8 Group 9Target
Pop
Group Size (Target population=100) 22 20 12 12 9 9 7 6 3 100
"Low" education 93 66 61 100 53 50 99 43 53 73
No past work experience 0 0 0 0 70 0 69 0 0 11
Positive but "low" relative work experience 58 20.3 6 0 29 1 16 58 72 27
No recent work activity 94 72 7 80 100 96 100 17 100 74
Health limitations 66 23 25 63 17 41 53 13 1 39
Care responsabilities 8 5 3 4 5 2 13 4 66 7
"High" non-labour income 27 20.0 29 23 31 41 28 34 34 28
"High" earnings replacements 3 11 5 5 0 70 2 0 5 10
Scarce job opportunities 2 99 1 14 100 1 100 51 35 43
Core
indicators
Group 1 Group 2 Group 3 Group 4 Group 5 Group 6 Group 7 Group 8 Group 9Target
Pop
Number of individuals (% of the Target population) 22 20 12 12 9 9 7 6 3 100
Number of individuals (frequency, in thousands) 518 484 293 279 212 205 173 136 71 2372
Unstable jobs 3 28 33 7 1 3 0 62 0 15
Restricted working hours 3 0 23 5 0 0 0 10 0 5
No better job opportunities .. .. 73 .. .. .. .. 81 .. 68
Housework or care responsabilities .. .. 7 .. .. .. .. 0 .. 7
Other reasons .. .. 20 .. .. .. .. 18 .. 25
Zero or near-zero earnings 3 2 56 12 0 1 0 24 0 11
Women* 78 42 52 45 47 39 80 46 99 56
Youth 0 6 5 0 85 0 8 84 18 15
Prime age 53 85 83 7 15 10 65 16 81 50
Old-age 47 9 13 93 0 90 27 0 0 34
Age (average) 55 43 46 60 24 61 49 26 38 49
Employed FT 1 0 7 2 0 0 0 5 0 2
Employed PT 3 0 19 4 0 0 0 12 0 4
Self-employed FT 2 0 38 8 0 1 0 9 0 7Self-employed PT 1 0 9 2 0 1 0 2 0 2Unemployed 22 99 15 25 78 10 38 64 67 46
Retired 26 0 3 44 0 80 0 0 1 18
Unfit to work/disable 12 0 1 4 6 3 15 0 0 5
Housework 32 0 2 7 7 2 44 2 30 13
Other inactive 3 0 4 2 8 3 2 6 1 3Employed 6 14 86 17 0 3 0 61 0 20
Unemployed 21 85 7 23 77 9 38 36 66 40
Inactive 73 2 7 61 23 88 62 3 34 40
Length of unemployment spell†
12+ 12+ 12 12+ 12+ .. 12+ 10 12+ 12.1
Actively seeking a job at the time of the interview 6 82 .. 14 76 .. 37 30 44 67
Age groups*
Main activity
during the
reference
period
Activity at
the time of
interview
Reason for
restricted
hours (% of)
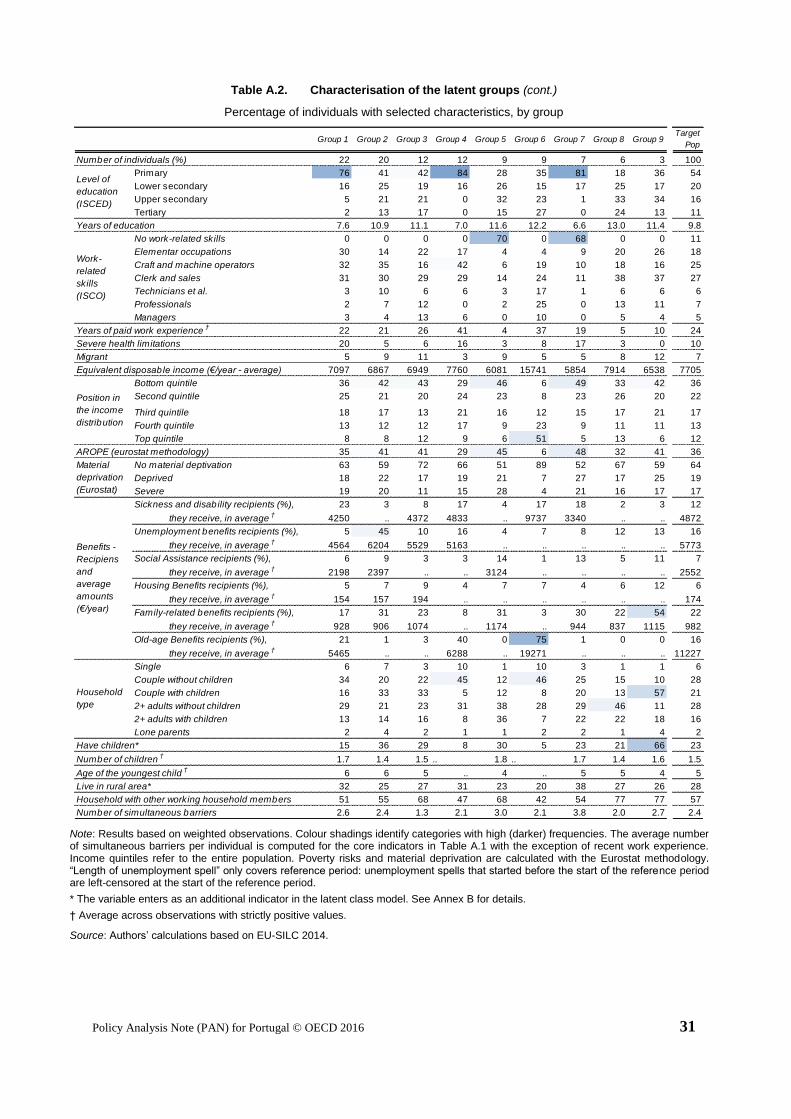
Policy Analysis Note (PAN) for Portugal © OECD 2016 31
Table A.2. Characterisation of the latent groups (cont.)
Percentage of individuals with selected characteristics, by group
Note: Results based on weighted observations. Colour shadings identify categories with high (darker) frequencies. The average number of simultaneous barriers per individual is computed for the core indicators in Table A.1 with the exception of recent work experience. Income quintiles refer to the entire population. Poverty risks and material deprivation are calculated with the Eurostat methodology. “Length of unemployment spell” only covers reference period: unemployment spells that started before the start of the reference period are left-censored at the start of the reference period.
* The variable enters as an additional indicator in the latent class model. See Annex B for details.
† Average across observations with strictly positive values.
Source: Authors’ calculations based on EU-SILC 2014.
Group 1 Group 2 Group 3 Group 4 Group 5 Group 6 Group 7 Group 8 Group 9Target
Pop
Number of individuals (%) 22 20 12 12 9 9 7 6 3 100
Primary 76 41 42 84 28 35 81 18 36 54
Lower secondary 16 25 19 16 26 15 17 25 17 20
Upper secondary 5 21 21 0 32 23 1 33 34 16
Tertiary 2 13 17 0 15 27 0 24 13 11
Years of education 7.6 10.9 11.1 7.0 11.6 12.2 6.6 13.0 11.4 9.8
No work-related skills 0 0 0 0 70 0 68 0 0 11
Elementar occupations 30 14 22 17 4 4 9 20 26 18
Craft and machine operators 32 35 16 42 6 19 10 18 16 25
Clerk and sales 31 30 29 29 14 24 11 38 37 27
Technicians et al. 3 10 6 6 3 17 1 6 6 6
Professionals 2 7 12 0 2 25 0 13 11 7
Managers 3 4 13 6 0 10 0 5 4 5
Years of paid work experience†
22 21 26 41 4 37 19 5 10 24
Severe health limitations 20 5 6 16 3 8 17 3 0 10
Migrant 5 9 11 3 9 5 5 8 12 7
Equivalent disposable income (€/year - average) 7097 6867 6949 7760 6081 15741 5854 7914 6538 7705
Bottom quintile 36 42 43 29 46 6 49 33 42 36
Second quintile 25 21 20 24 23 8 23 26 20 22
Third quintile 18 17 13 21 16 12 15 17 21 17
Fourth quintile 13 12 12 17 9 23 9 11 11 13
Top quintile 8 8 12 9 6 51 5 13 6 12
AROPE (eurostat methodology) 35 41 41 29 45 6 48 32 41 36
No material deptivation 63 59 72 66 51 89 52 67 59 64
Deprived 18 22 17 19 21 7 27 17 25 19
Severe 19 20 11 15 28 4 21 16 17 17
Sickness and disability recipients (%), 23 3 8 17 4 17 18 2 3 12
they receive, in average†
4250 .. 4372 4833 .. 9737 3340 .. .. 4872
Unemployment benefits recipients (%), 5 45 10 16 4 7 8 12 13 16
they receive, in average†
4564 6204 5529 5163 .. .. .. .. .. 5773
Social Assistance recipients (%), 6 9 3 3 14 1 13 5 11 7
they receive, in average†
2198 2397 .. .. 3124 .. .. .. .. 2552
Housing Benefits recipients (%), 5 7 9 4 7 7 4 6 12 6
they receive, in average†
154 157 194 .. .. .. .. .. .. 174
Family-related benefits recipients (%), 17 31 23 8 31 3 30 22 54 22
they receive, in average†
928 906 1074 .. 1174 .. 944 837 1115 982
Old-age Benefits recipients (%), 21 1 3 40 0 75 1 0 0 16
they receive, in average†
5465 .. .. 6288 .. 19271 .. .. .. 11227
Single 6 7 3 10 1 10 3 1 1 6
Couple without children 34 20 22 45 12 46 25 15 10 28
Couple with children 16 33 33 5 12 8 20 13 57 21
2+ adults without children 29 21 23 31 38 28 29 46 11 28
2+ adults with children 13 14 16 8 36 7 22 22 18 16
Lone parents 2 4 2 1 1 2 2 1 4 2
Have children* 15 36 29 8 30 5 23 21 66 23
Number of children†
1.7 1.4 1.5 .. 1.8 .. 1.7 1.4 1.6 1.5
Age of the youngest child†
6 6 5 .. 4 .. 5 5 4 5
Live in rural area* 32 25 27 31 23 20 38 27 26 28
Household with other working household members 51 55 68 47 68 42 54 77 77 57
Number of simultaneous barriers 2.6 2.4 1.3 2.1 3.0 2.1 3.8 2.0 2.7 2.4
Position in
the income
distribution
Material
deprivation
(Eurostat)
Benefits -
Recipiens
and
average
amounts
(€/year)
Household
type
Level of
education
(ISCED)
Work-
related
skills
(ISCO)
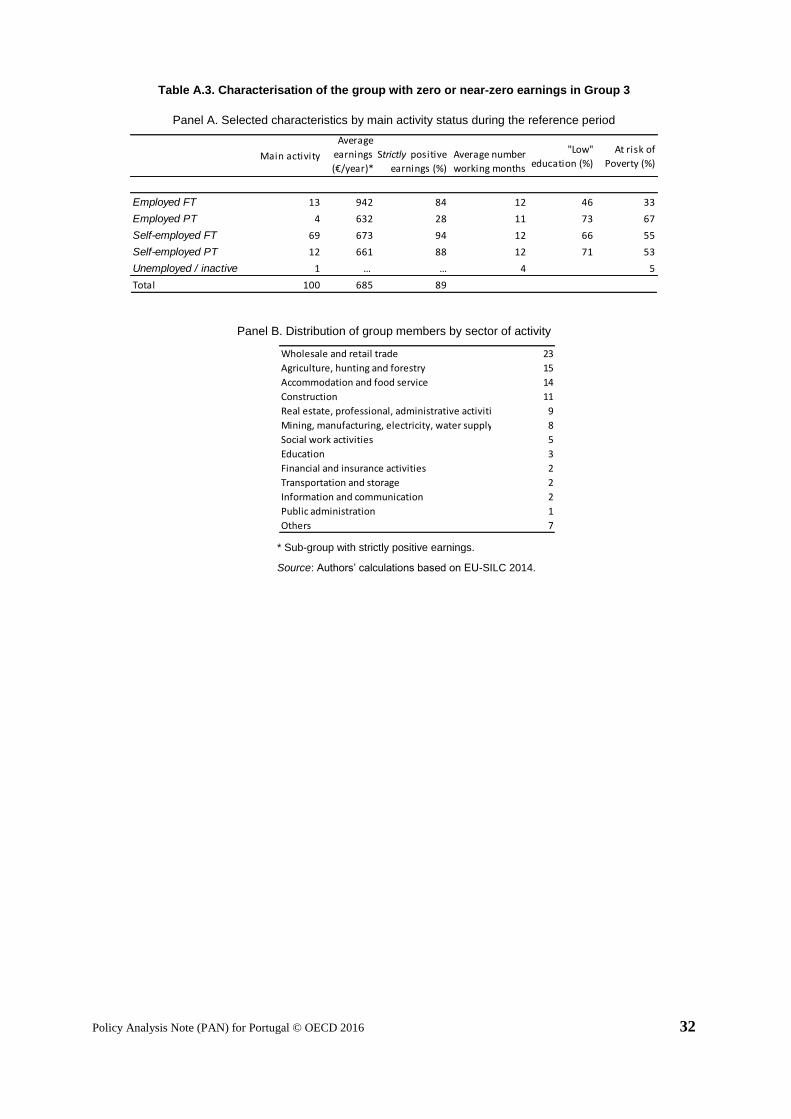
Policy Analysis Note (PAN) for Portugal © OECD 2016 32
Table A.3. Characterisation of the group with zero or near-zero earnings in Group 3
Panel A. Selected characteristics by main activity status during the reference period
Panel B. Distribution of group members by sector of activity
* Sub-group with strictly positive earnings.
Source: Authors’ calculations based on EU-SILC 2014.
Main activity
Average
earnings
(€/year)*
Strictly positive
earnings (%)
Average number
working months
"Low"
education (%)
At risk of
Poverty (%)
Employed FT 13 942 84 12 46 33
Employed PT 4 632 28 11 73 67
Self-employed FT 69 673 94 12 66 55
Self-employed PT 12 661 88 12 71 53
Unemployed / inactive 1 … … 4 5
Total 100 685 89
Wholesale and retail trade 23
Agriculture, hunting and forestry 15
Accommodation and food service 14
Construction 11
Real estate, professional, administrative activities 9
Mining, manufacturing, electricity, water supply 8
Social work activities 5
Education 3
Financial and insurance activities 2
Transportation and storage 2
Information and communication 2
Public administration 1
Others 7
Policy Analysis Note (PAN) for Portugal © OECD 2016 33
ANNEX B
LATENT CLASS ANALYSIS AND MODEL SELECTION
The segmentation method used in this note is Latent Class Analysis (LCA). This method exploits the
interrelations of an array of indicators through a fully-specified (i.e. parametric) statistical model for
organising the target population into homogeneous groups. In the present framework, the indicators
represent employment barriers and the statistical algorithm therefore identifies population sub-groups
sharing similar barriers to employment, e.g. “low skills and scarce job opportunities” for Group 1; “limited
work experience and low financial work incentives” for Group 2, etc.
LCA has three main advantages relative to other common segmentation (or “clustering”) methods:
1) Formal statistical tests guide the selection of the optimal number of groups and other model’s features;
2) LCA does not allocate individuals into specific groups in a deterministic way but, instead, provides
probabilities of group membership, thus reducing possible classification errors in any post-estimation
analysis; 3) LCA deals easily with common data-related issues such as missing data and complex survey
designs.
Latent Class Analysis does not automatically provide an estimate of the optimal number of latent
classes. Instead, models with different number of classes are estimated sequentially and the optimal model
is chosen based on a series of statistical criteria. To summarise, the model selection process starts with the
definition of a standard latent-class model that is repeatedly estimated for an increasing number of latent
classes (Step 1).14
The choice of the optimal number of classes is primarily based on goodness-of-fit and
error-classification statistics (Step 2, see also Figure B.1), and then on the analysis of potential
misspecification issues (Step 3). Fernandez et al. (2016) describes these steps in details and provides
guidelines for practitioners interested in adapting the approach to specific analytical needs or data.
Figure B.1 summarises graphically Step 2 outlined above for the Portugal SILC 2014; The blue bars
show the percentage variations of the Bayesian Information Criterion (BIC, Schwartz 1978)15
for
increasing numbers of latent groups, whereas the black line shows, for the same groups, the classification
error statistics (Vermunt and Magdison, 2016).16
In general, a smaller value of the BIC indicates a more
optimal balance between model fit and parsimony, whereas a smaller value of the classification error
statistics means that individuals are well-classified into one (and only one) group. In Figure B.1 the BIC is
minimised for a model with 9 classes and the classification error of 22% indicates that the model provides
a relatively good representation of the heterogeneity in the underlying data.
14. A standard latent class model means that the likelihood function is derived under the so-called Local
Independence Assumption (LIA). See Fernandez et al. (2016) for details.
15. The BIC summarises into a single index the trade-off between the model’s ability to fit the data and the
model’s parametrisation: a model with a higher number of latent classes always provide a better fitting of
the underlying data but at the cost of complicating the model’s structure.
16. The classification error shows how-well the model is able to classify individuals into specific groups. To
understand the meaning of the classification error index it is important to keep in mind that LCA does not
assign individuals to specific classes but, instead, estimates probabilities of class membership. One has
therefore two options to analyses the results: allocate individuals into a given cluster based on the highest
probability of class-membership (modal assignment) or weighting each person with the related class-
membership probability in the analysis of each class (proportional assignment). The classification error
statistics is based on the share of individuals that are miss-classified according to the modal assignment.
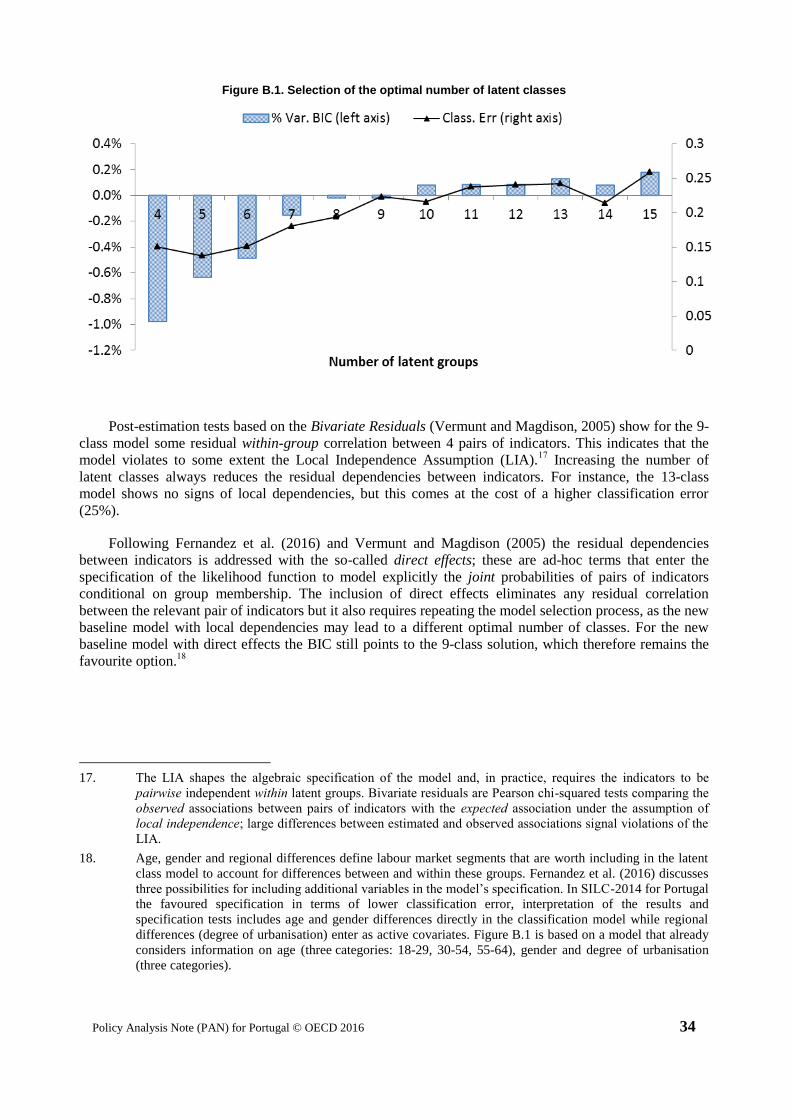
Policy Analysis Note (PAN) for Portugal © OECD 2016 34
Figure B.1. Selection of the optimal number of latent classes
Post-estimation tests based on the Bivariate Residuals (Vermunt and Magdison, 2005) show for the 9-
class model some residual within-group correlation between 4 pairs of indicators. This indicates that the
model violates to some extent the Local Independence Assumption (LIA).17
Increasing the number of
latent classes always reduces the residual dependencies between indicators. For instance, the 13-class
model shows no signs of local dependencies, but this comes at the cost of a higher classification error
(25%).
Following Fernandez et al. (2016) and Vermunt and Magdison (2005) the residual dependencies
between indicators is addressed with the so-called direct effects; these are ad-hoc terms that enter the
specification of the likelihood function to model explicitly the joint probabilities of pairs of indicators
conditional on group membership. The inclusion of direct effects eliminates any residual correlation
between the relevant pair of indicators but it also requires repeating the model selection process, as the new
baseline model with local dependencies may lead to a different optimal number of classes. For the new
baseline model with direct effects the BIC still points to the 9-class solution, which therefore remains the
favourite option.18
17. The LIA shapes the algebraic specification of the model and, in practice, requires the indicators to be
pairwise independent within latent groups. Bivariate residuals are Pearson chi-squared tests comparing the
observed associations between pairs of indicators with the expected association under the assumption of
local independence; large differences between estimated and observed associations signal violations of the
LIA.
18. Age, gender and regional differences define labour market segments that are worth including in the latent
class model to account for differences between and within these groups. Fernandez et al. (2016) discusses
three possibilities for including additional variables in the model’s specification. In SILC-2014 for Portugal
the favoured specification in terms of lower classification error, interpretation of the results and
specification tests includes age and gender differences directly in the classification model while regional
differences (degree of urbanisation) enter as active covariates. Figure B.1 is based on a model that already
considers information on age (three categories: 18-29, 30-54, 55-64), gender and degree of urbanisation
(three categories).