Embed Size (px)
Citation preview

Dangers of Frequentist Estimates of the “False Alarm Probability”
and Other Pretenders
Eric B. Ford Penn State Astronomy & Astrophysics Dept.
Center for Astrostatistics Center for Exoplanets & Habitable Worlds
Institute for CyberScience
July 19, 2016 2016 Sagan Workshop
Dangers of Frequentist Estimates of the “False Alarm Probability”
and Other Pretenders
Eric B. Ford
drawing extensively from Tom Loredo http://astrostatistics.psu.edu/RLectures/cast16-PValueNote.pdf
http://www2.stat.duke.edu/~berger/p-values.html
July 19, 2016 2016 Sagan Workshop
Goals: Improve Quality of Your Science
• Recognize ad hoc and/or unjustified statistical methodology
• Recognize misleading language • Increase awareness of better methods for
model comparison • Increase reliability of scientific conclusions
Why Astronomy? Exoplanets?
• Learn about nature
• Train future generation of scientists, engineers, entrepreneurs,…, policy makers.
• Engage public with the power of science
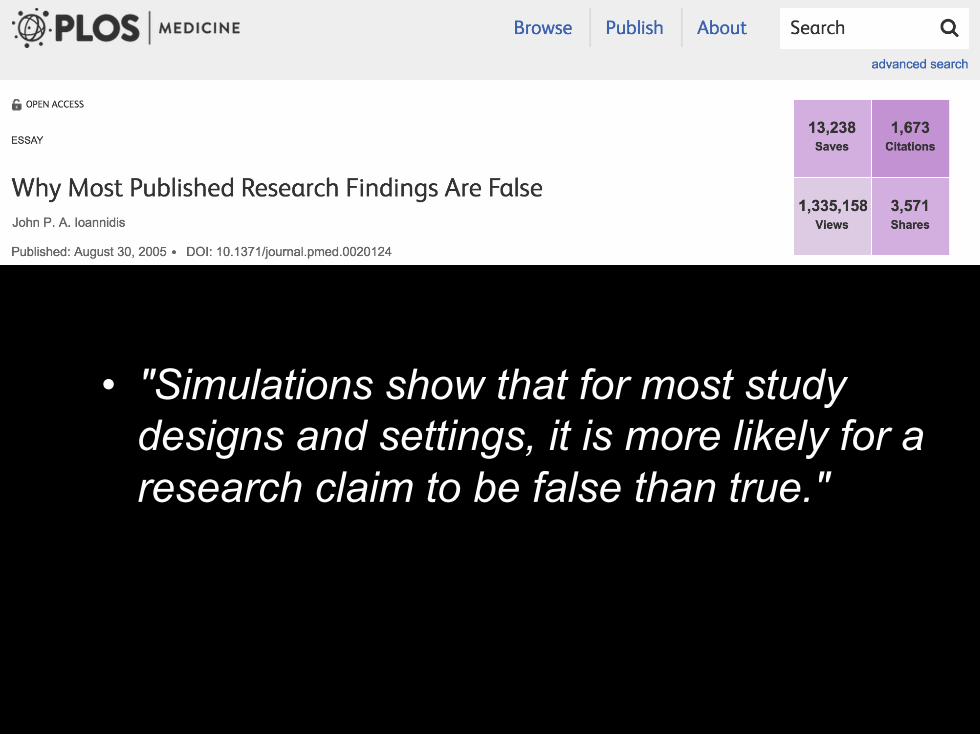
• "Simulations show that for most study designs and settings, it is more likely for a research claim to be false than true."
• "Simulations show that for most study designs and settings, it is more
• likely for a research claim to be false than true."
Aim for Reproducible Research
• Reproducibility is fundamental tenet of the scientific process
• Reproducible Research has several aspects – Precise & accurate descriptions on methods – Inadequate attention to experimental design – Availability of data, materials, instruments,
algorithms, codes, etc. – Validity of statistical inference
• Credibility of science depends on it
Reproducibility & Exoplanets
Would the field of exoplanet emerge unscathed if subject to a similar level of scrutiny as devoted to life sciences?

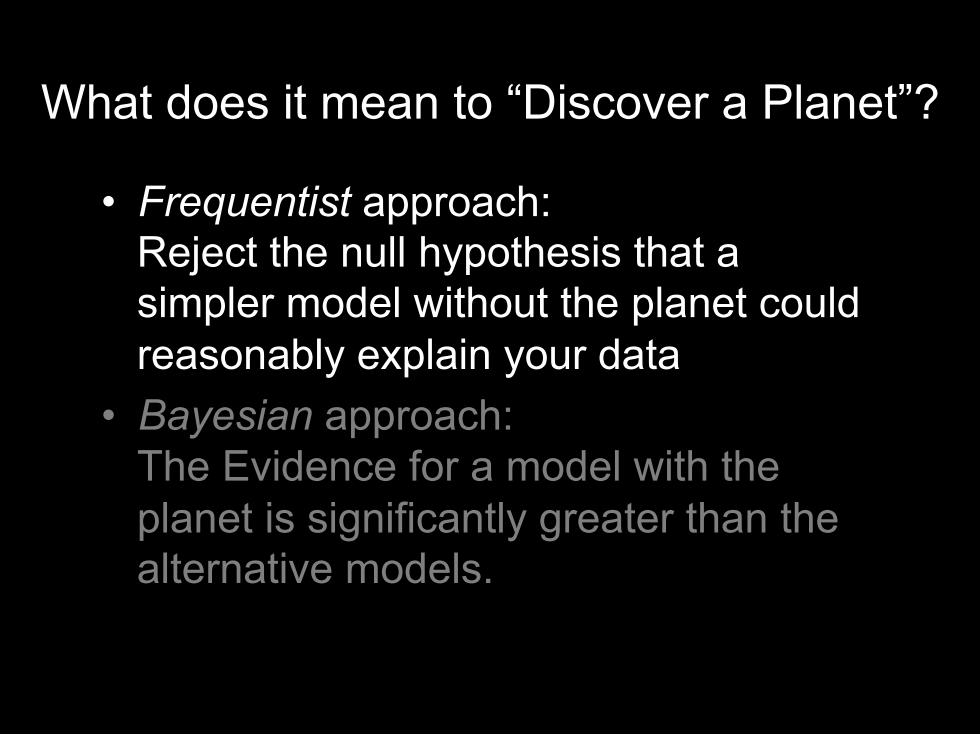
What does it mean to “Discover a Planet”?
• Frequentist approach: Reject the null hypothesis that a simpler model without the planet could reasonably explain your data
• Bayesian approach: The Evidence for a model with the planet is significantly greater than the alternative models.
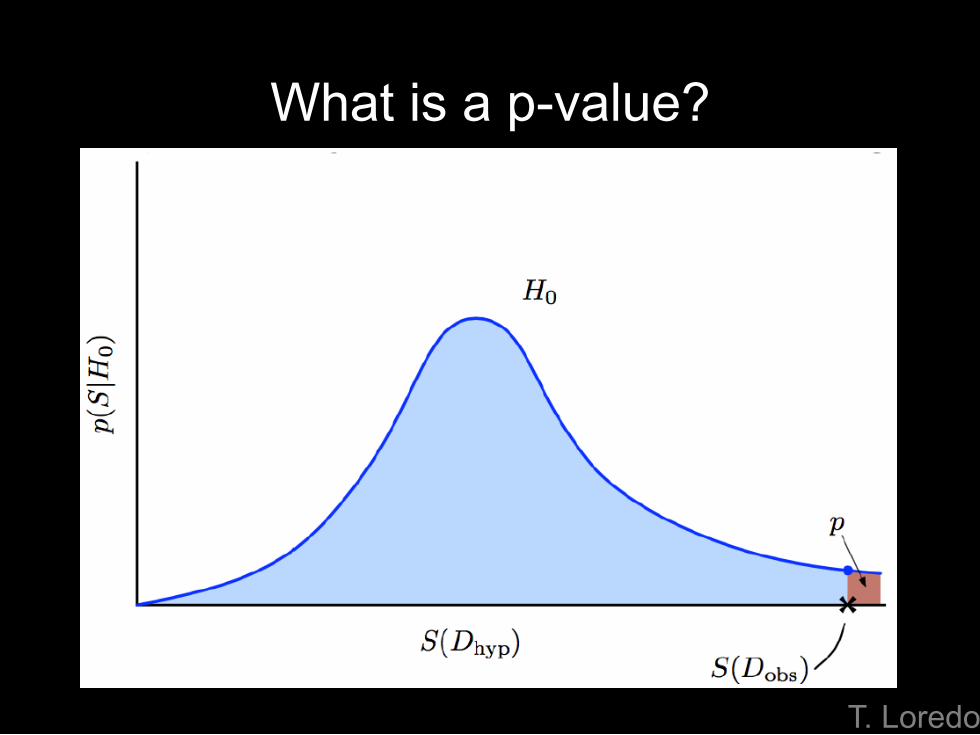
What is a p-value?
T. Loredo
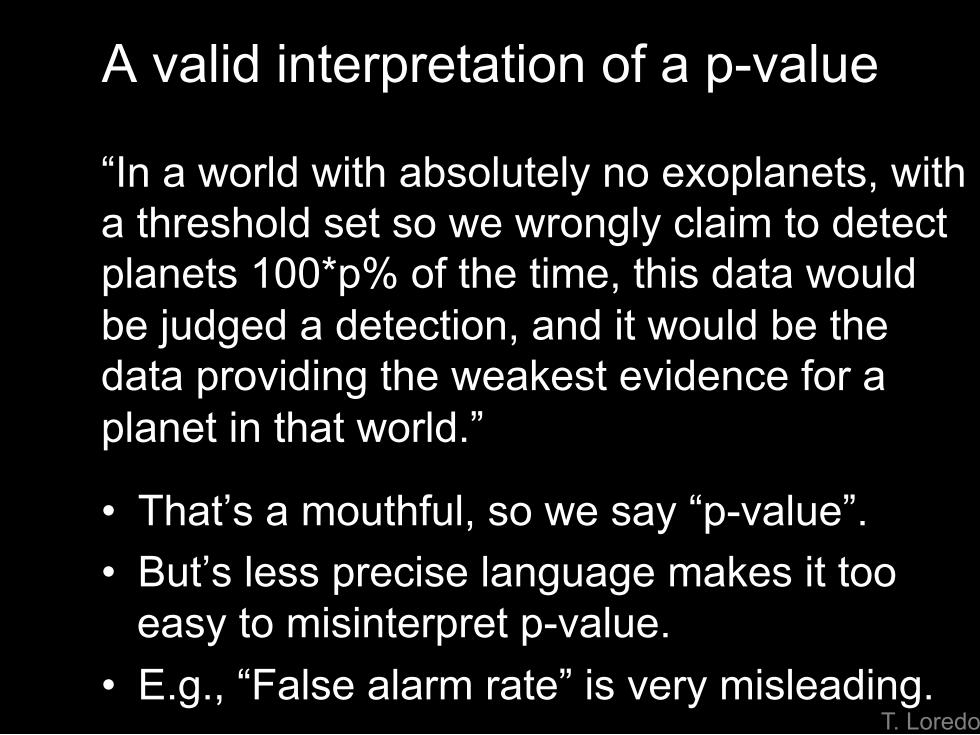
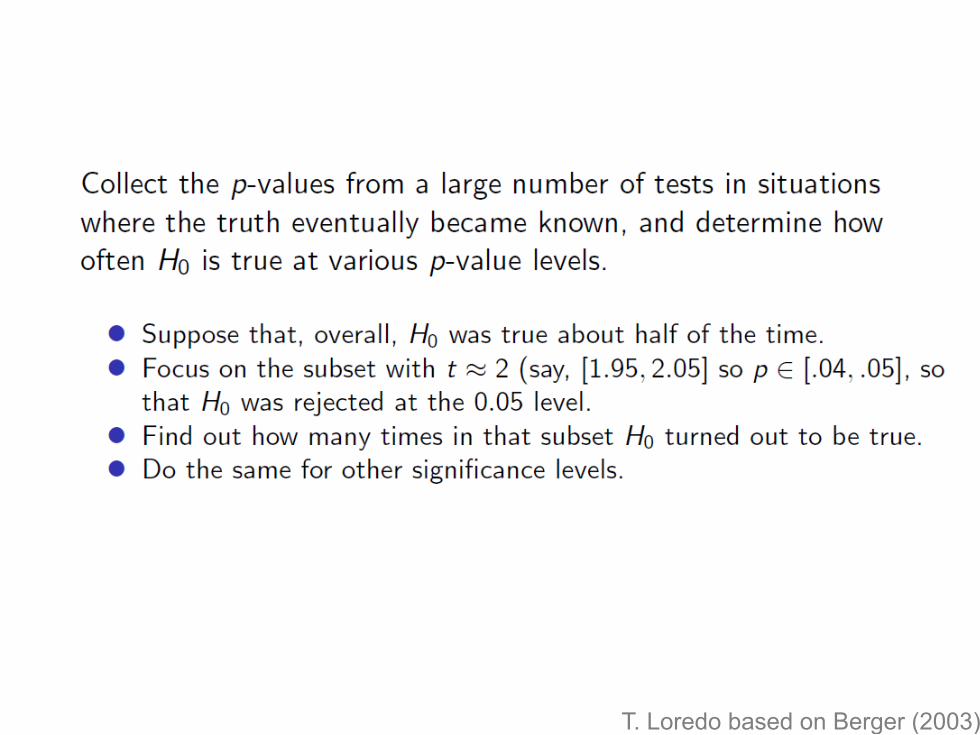
A valid interpretation of a p-value
“In a world with absolutely no exoplanets, with a threshold set so we wrongly claim to detect planets 100*p% of the time, this data would be judged a detection, and it would be the data providing the weakest evidence for a planet in that world.”
• That’s a mouthful, so we say “p-value”. • But’s less precise language makes it too
easy to misinterpret p-value. • E.g., “False alarm rate” is very misleading.
T. Loredo
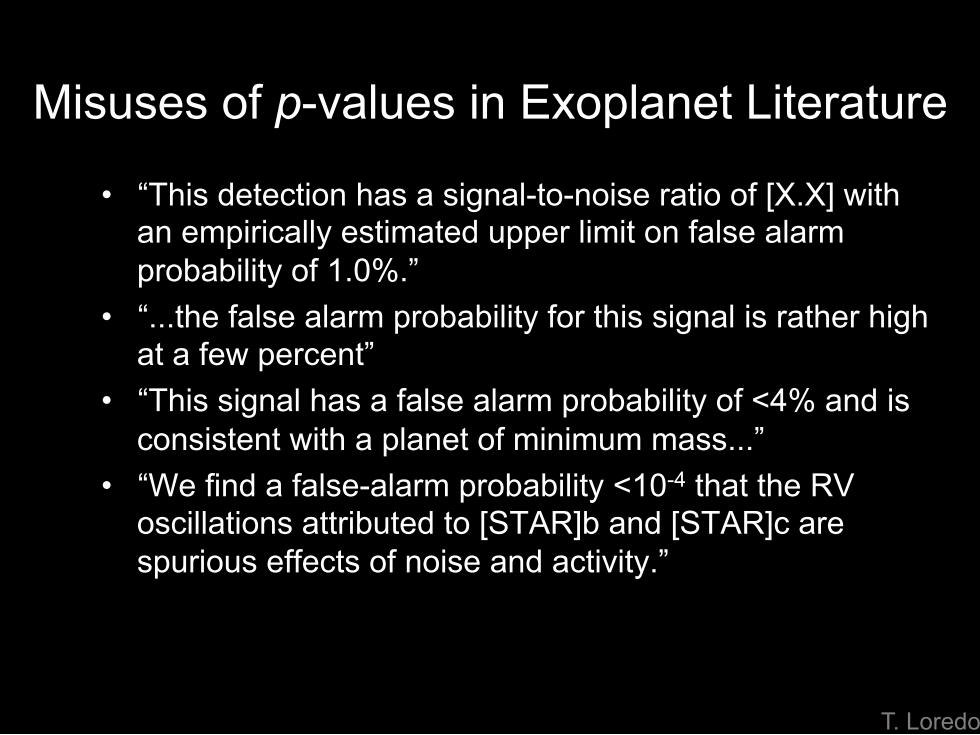
Misuses of p-values in Exoplanet Literature
• “This detection has a signal-to-noise ratio of [X.X] with an empirically estimated upper limit on false alarm probability of 1.0%.”
• “...the false alarm probability for this signal is rather high at a few percent”
• “This signal has a false alarm probability of <4% and is consistent with a planet of minimum mass...”
• “We find a false-alarm probability <10-4 that the RV oscillations attributed to [STAR]b and [STAR]c are spurious effects of noise and activity.”
T. Loredo
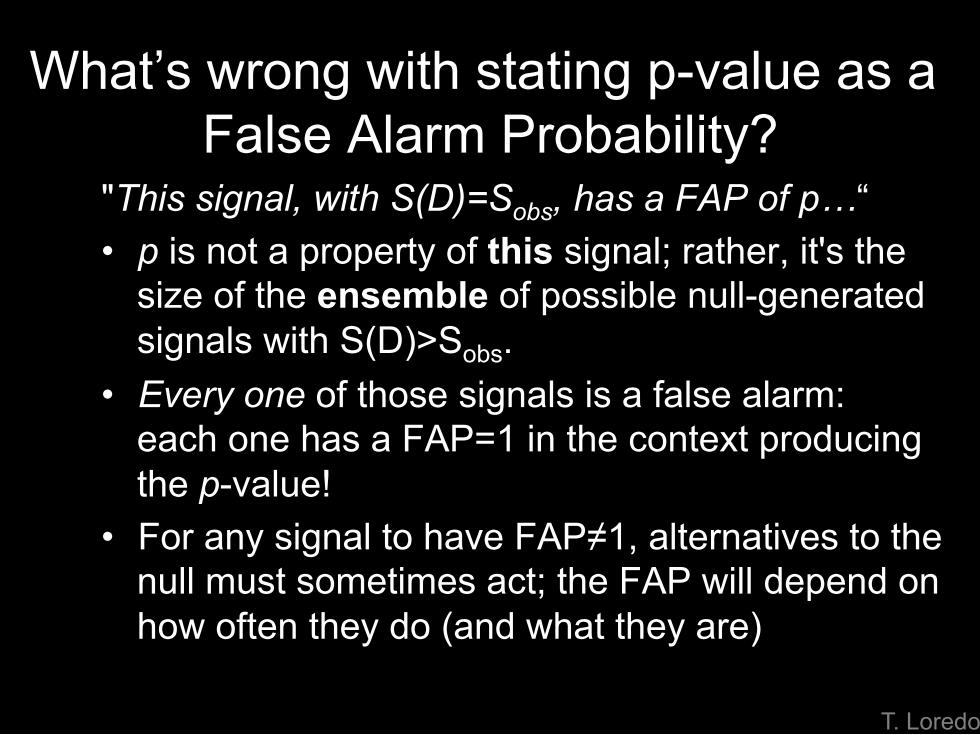
What’s wrong with stating p-value as a False Alarm Probability?
"This signal, with S(D)=Sobs, has a FAP of p…“ • p is not a property of this signal; rather, it's the
size of the ensemble of possible null-generated signals with S(D)>Sobs.
• Every one of those signals is a false alarm: each one has a FAP=1 in the context producing the p-value!
• For any signal to have FAP≠1, alternatives to the null must sometimes act; the FAP will depend on how often they do (and what they are)
T. Loredo
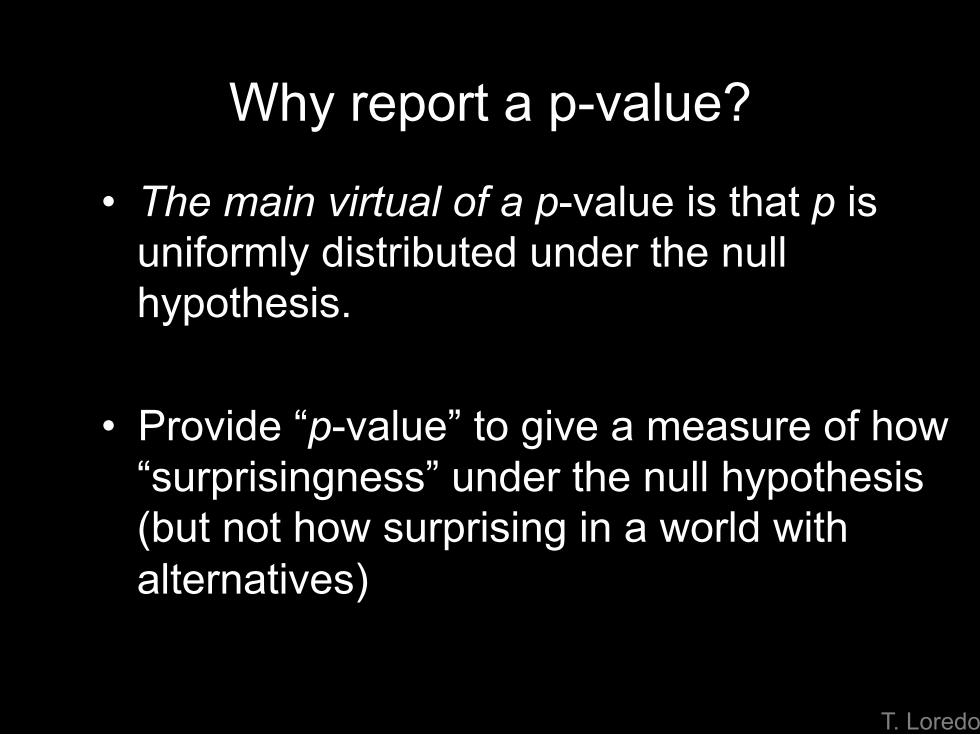
Why report a p-value?
• The main virtual of a p-value is that p is uniformly distributed under the null hypothesis.
• Provide “p-value” to give a measure of how “surprisingness” under the null hypothesis (but not how surprising in a world with alternatives)
T. Loredo
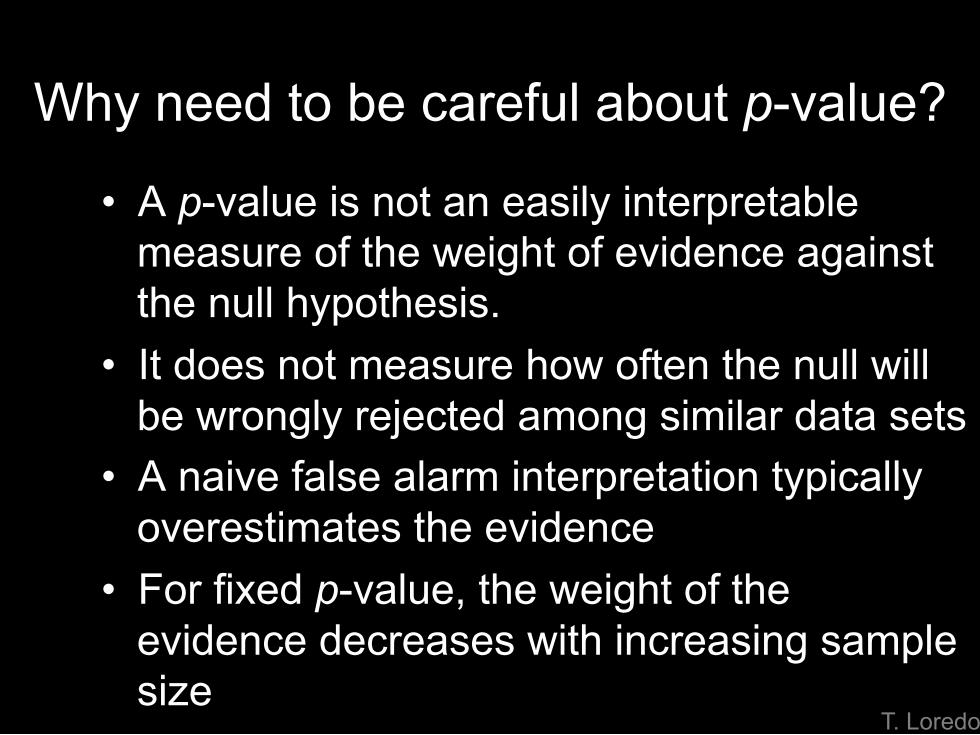
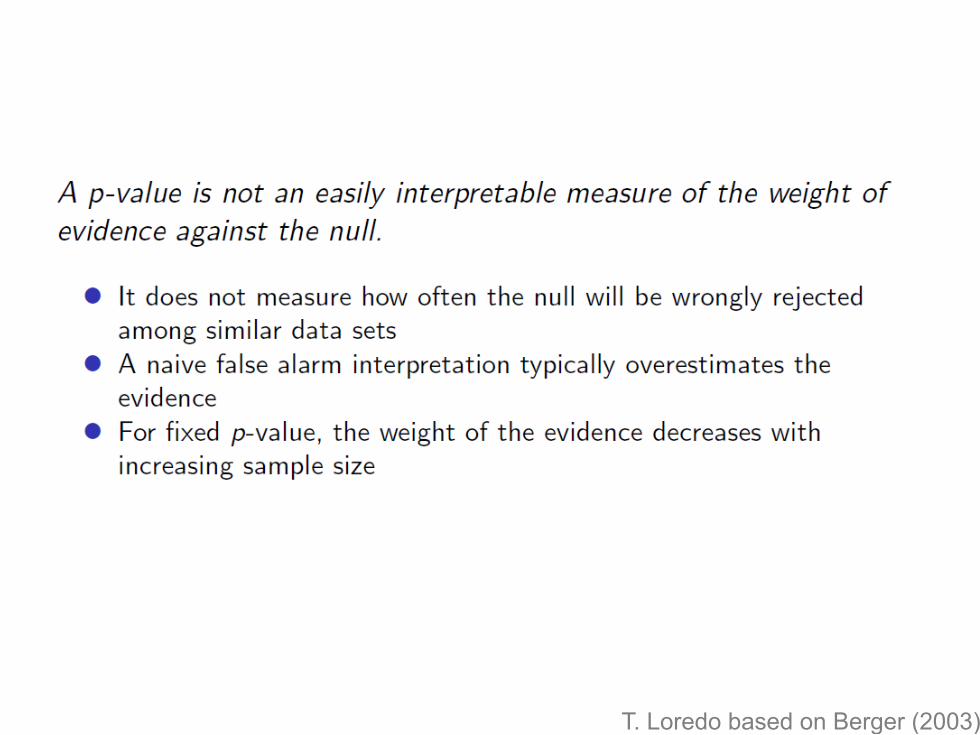
Why need to be careful about p-value?
• A p-value is not an easily interpretable measure of the weight of evidence against the null hypothesis.
• It does not measure how often the null will be wrongly rejected among similar data sets
• A naive false alarm interpretation typically overestimates the evidence
• For fixed p-value, the weight of the evidence decreases with increasing sample size
T. Loredo
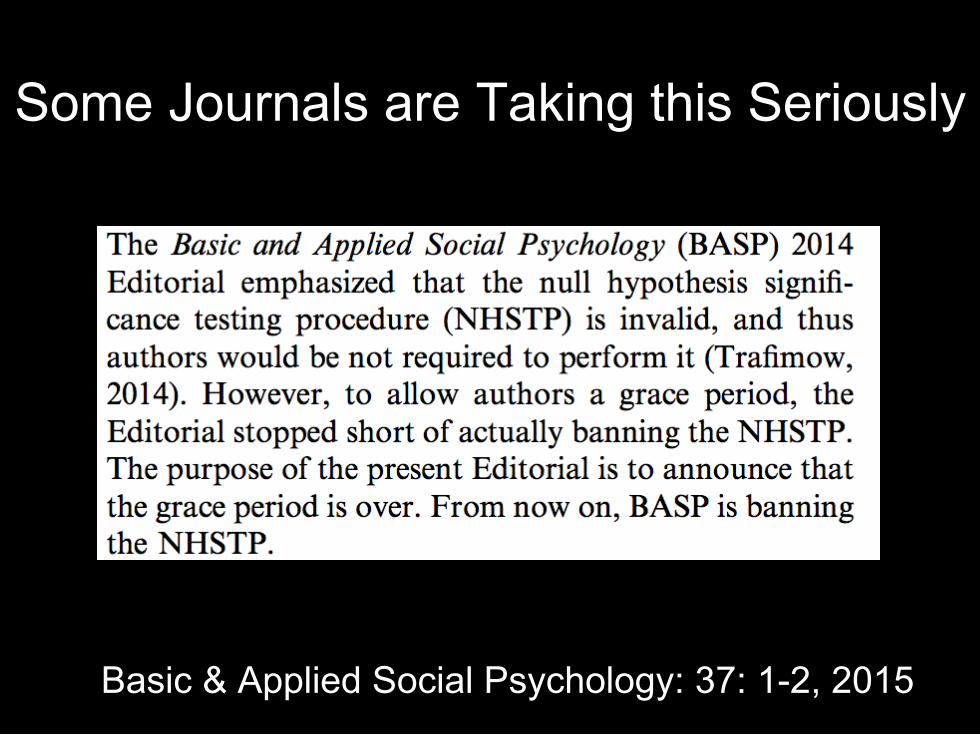
Some Journals are Taking this Seriously
Basic & Applied Social Psychology: 37: 1-2, 2015
T. Loredo
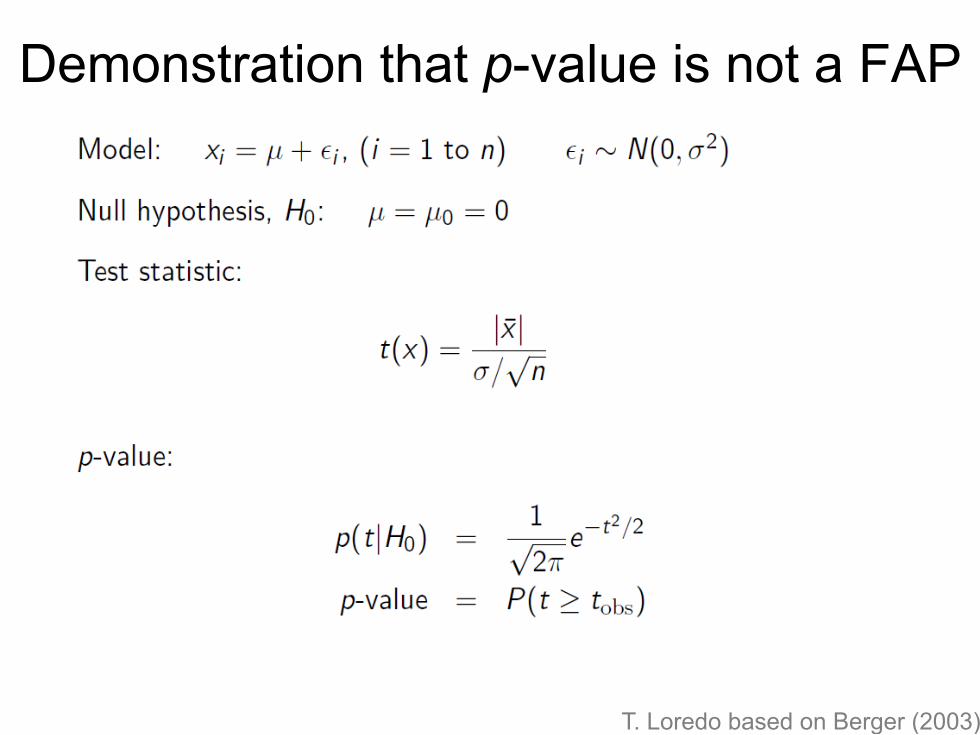
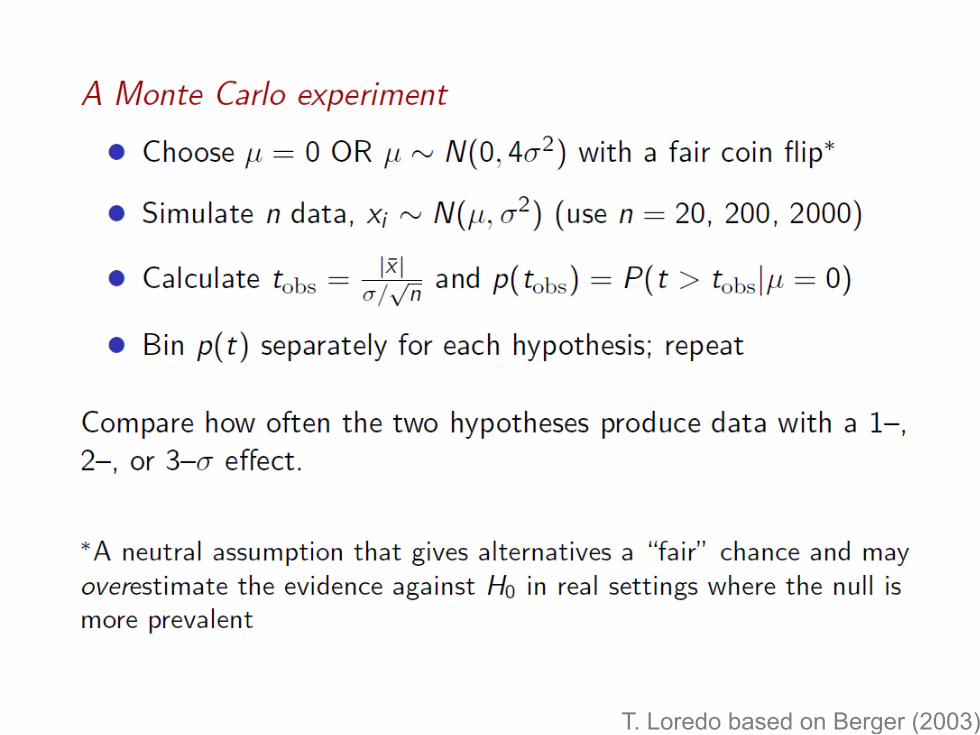
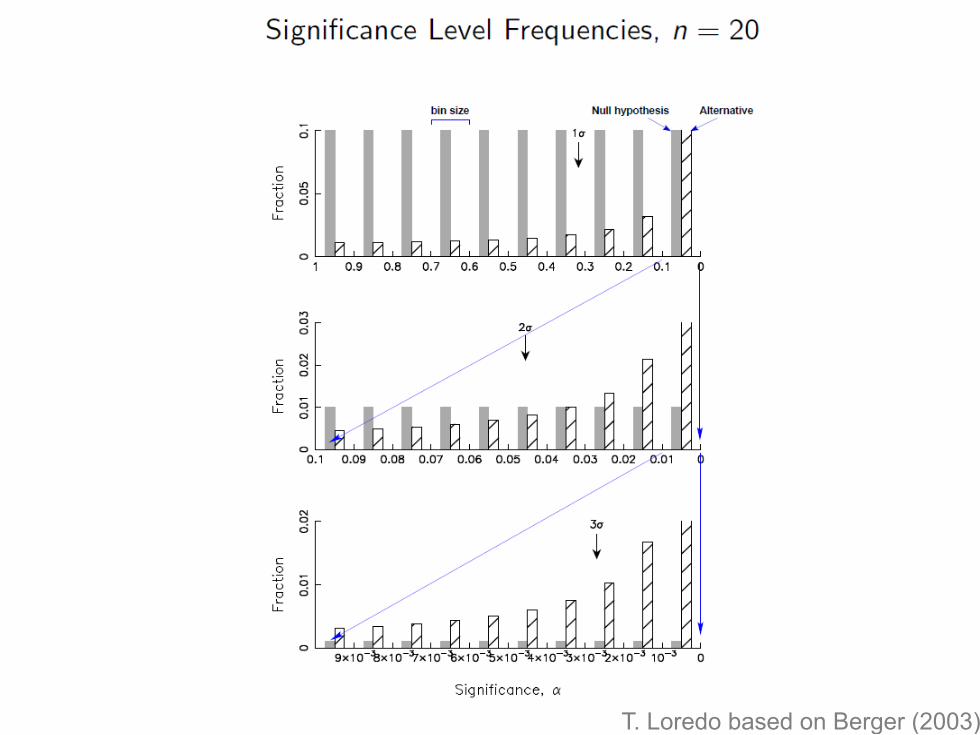
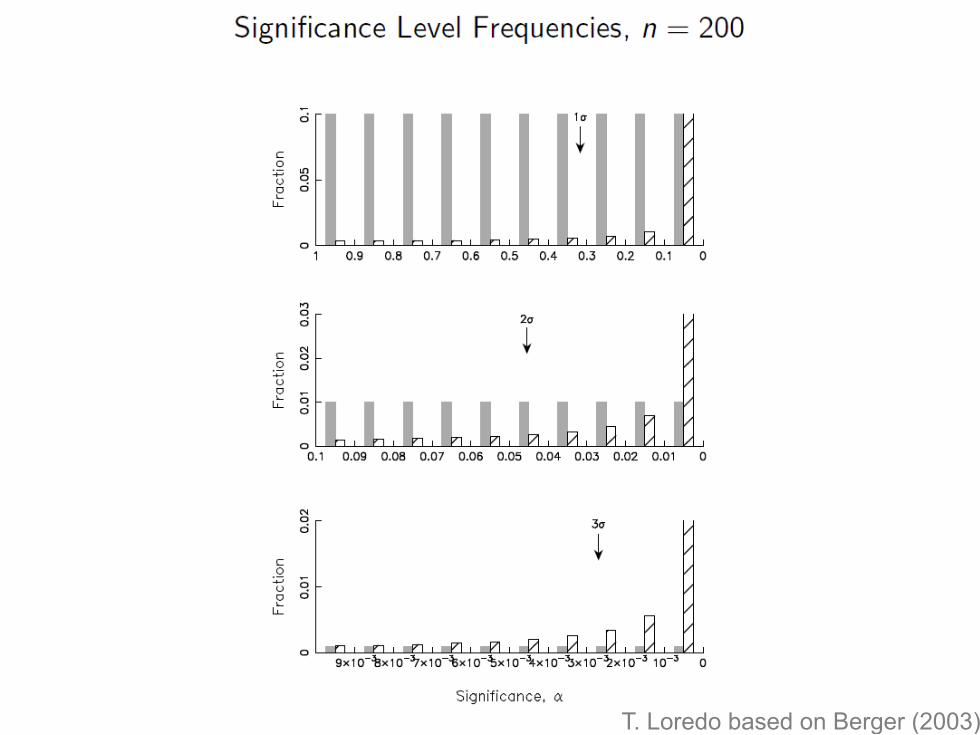
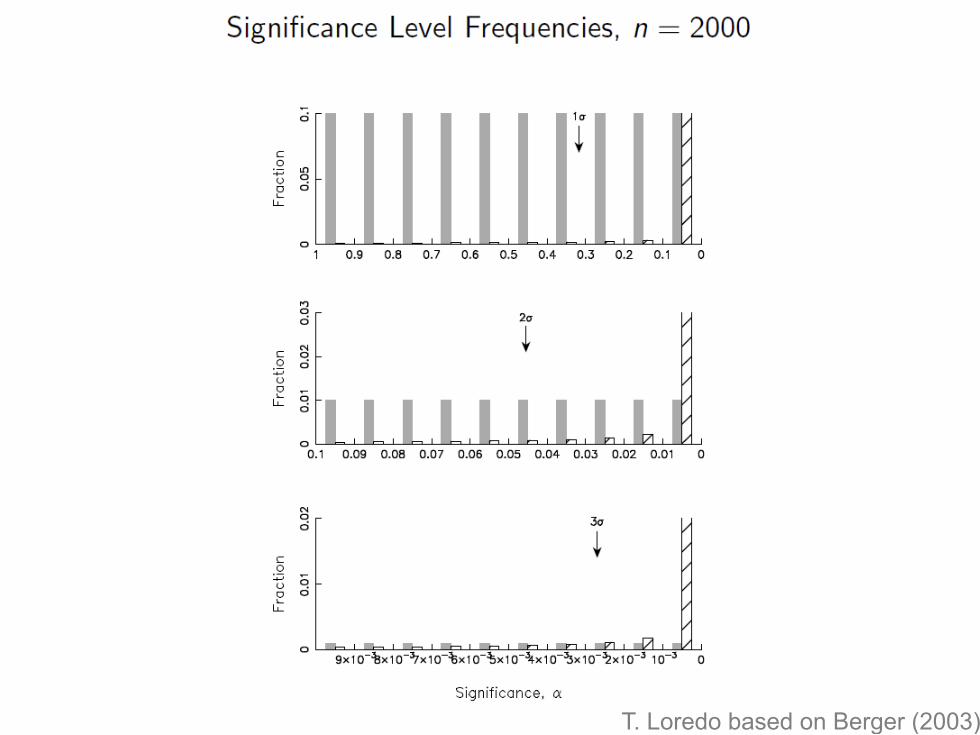
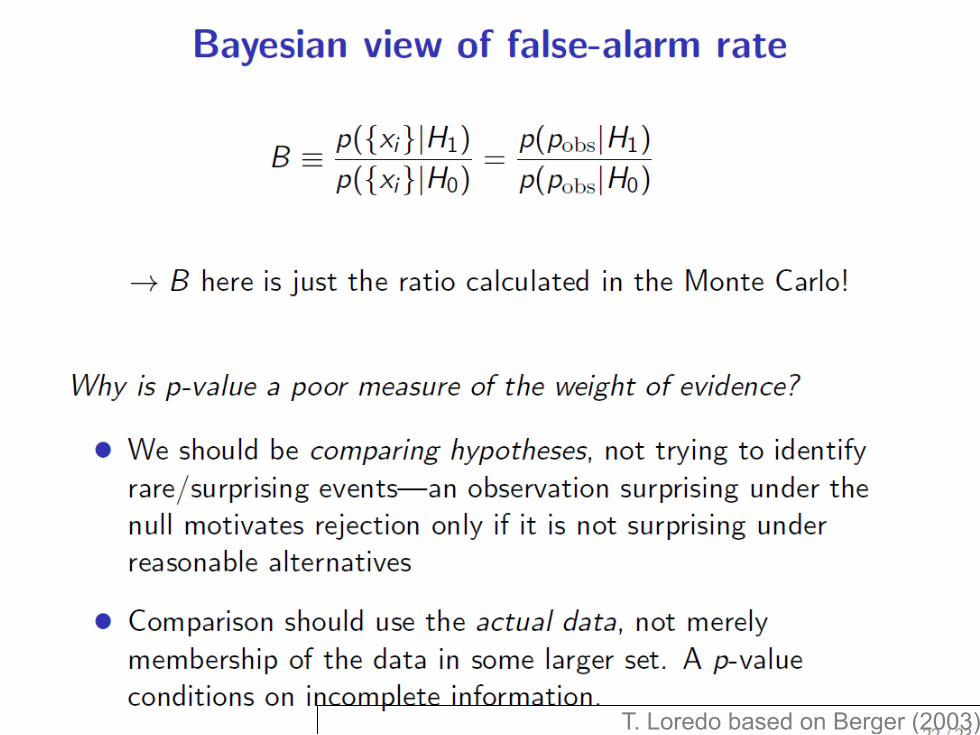
Demonstration that p-value is not a FAP
T. Loredo based on Berger (2003)
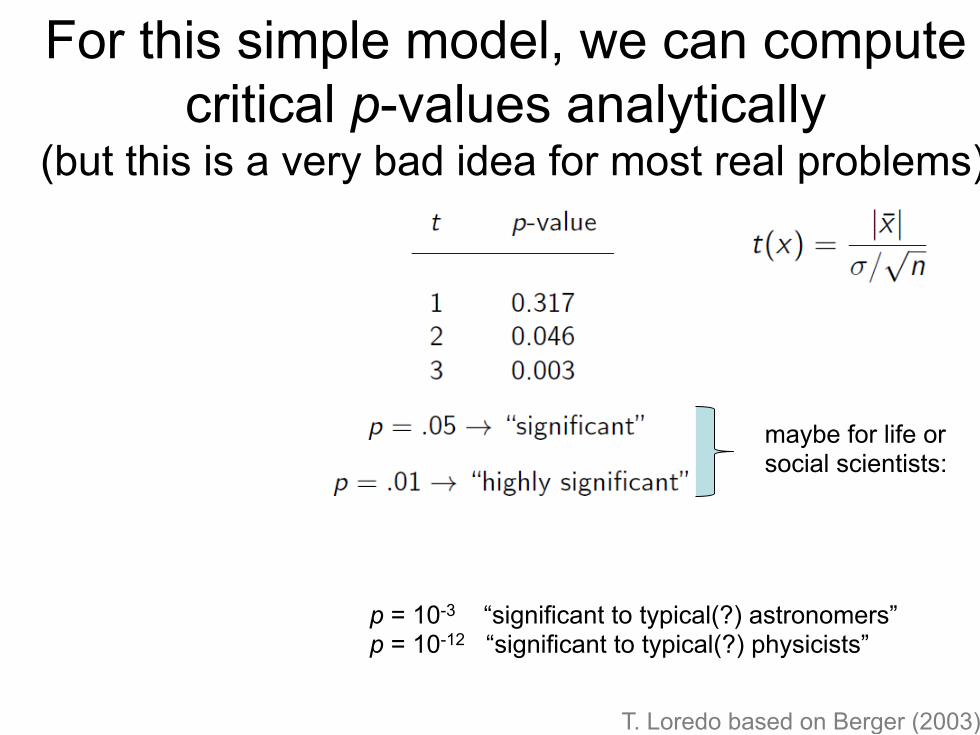
For this simple model, we can compute critical p-values analytically
(but this is a very bad idea for most real problems)
maybe for life or social scientists:
p = 10-3 “significant to typical(?) astronomers” p = 10-12 “significant to typical(?) physicists”
T. Loredo based on Berger (2003)
T. Loredo based on Berger (2003)
T. Loredo based on Berger (2003)
T. Loredo based on Berger (2003)
T. Loredo based on Berger (2003)
T. Loredo based on Berger (2003)
T. Loredo based on Berger (2003)
T. Loredo based on Berger (2003)
What does it mean to “Discover a Planet”?
• Frequentist approach: Reject the null hypothesis that a simpler model without the planet could reasonably explain your data
• Bayesian approach: The Evidence for a model with the planet is significantly greater than the alternative models.
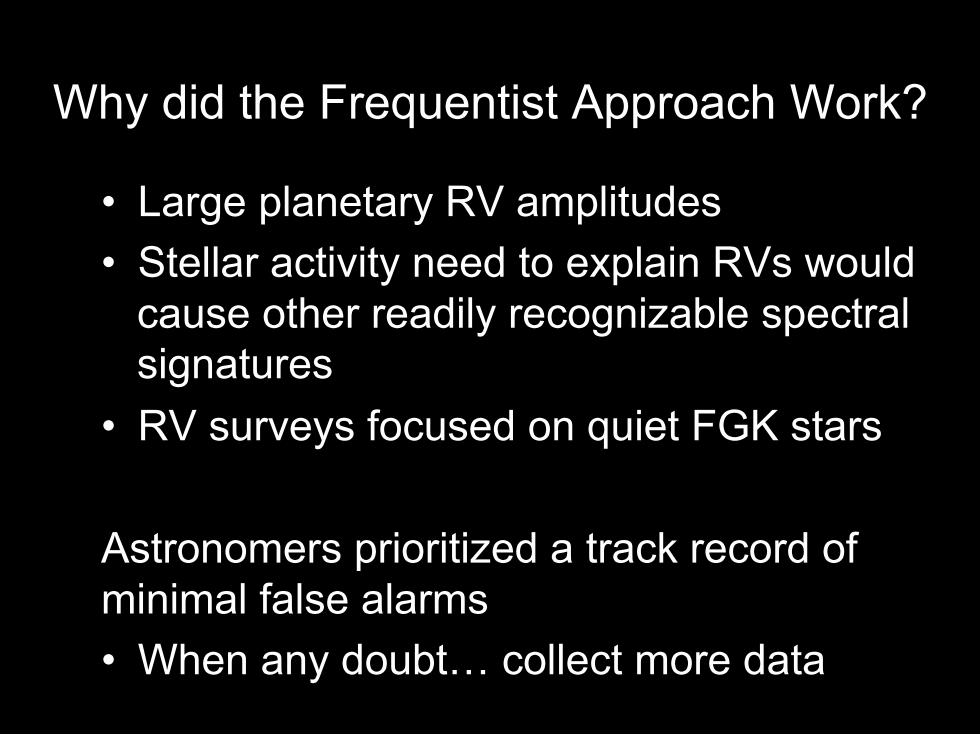
Why did the Frequentist Approach Work?
• Large planetary RV amplitudes • Stellar activity need to explain RVs would
cause other readily recognizable spectral signatures
• RV surveys focused on quiet FGK stars Astronomers prioritized a track record of minimal false alarms • When any doubt… collect more data
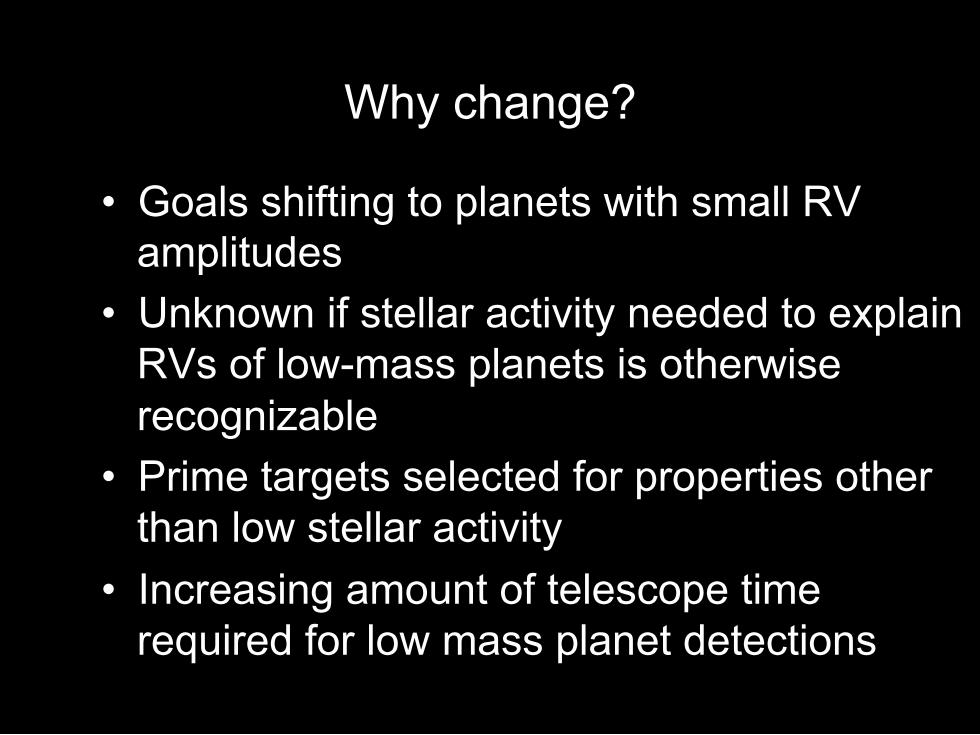
Why change?
• Goals shifting to planets with small RV amplitudes
• Unknown if stellar activity needed to explain RVs of low-mass planets is otherwise recognizable
• Prime targets selected for properties other than low stellar activity
• Increasing amount of telescope time required for low mass planet detections
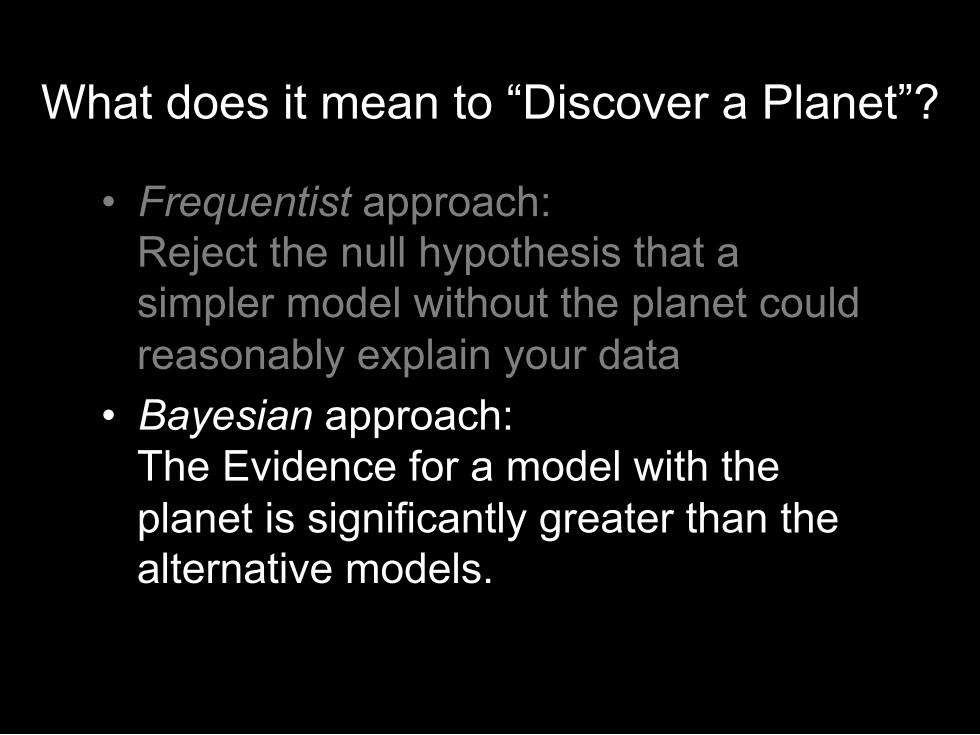
What does it mean to “Discover a Planet”?
• Frequentist approach: Reject the null hypothesis that a simpler model without the planet could reasonably explain your data
• Bayesian approach: The Evidence for a model with the planet is significantly greater than the alternative models.
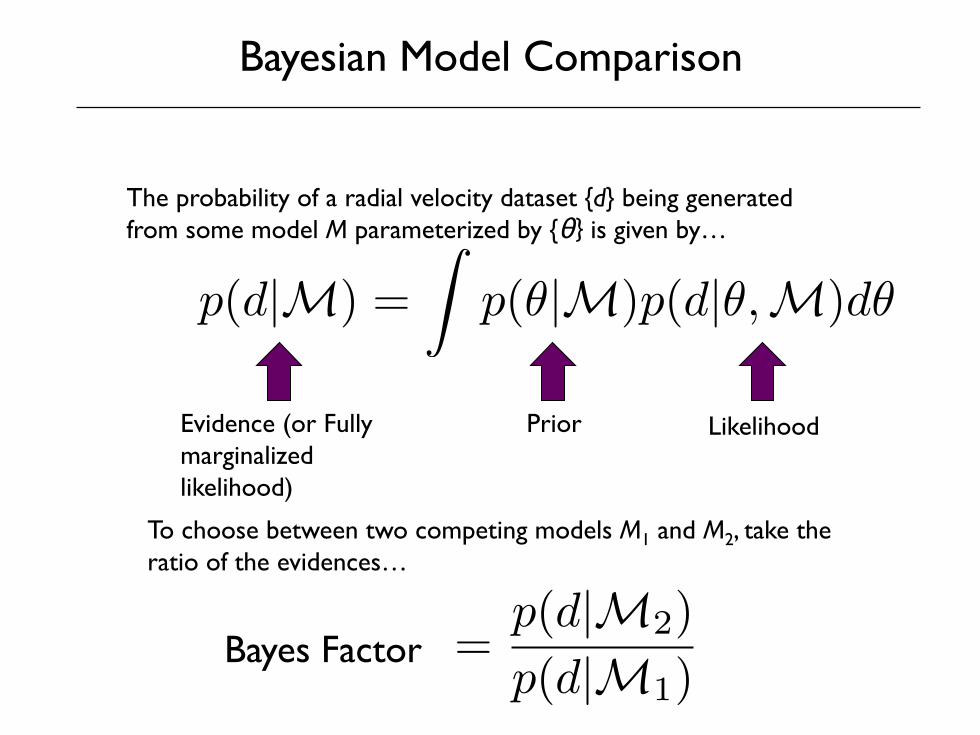
Bayesian Model Comparison
p(d|M) =
Zp(✓|M)p(d|✓,M)d✓
Evidence (or Fully marginalized likelihood)
Prior Likelihood
The probability of a radial velocity dataset {d} being generated from some model M parameterized by {θ} is given by…
To choose between two competing models M1 and M2, take the ratio of the evidences…
Bayes Factor =p(d|M2)
p(d|M1)
T. Loredo based on Berger (2003)
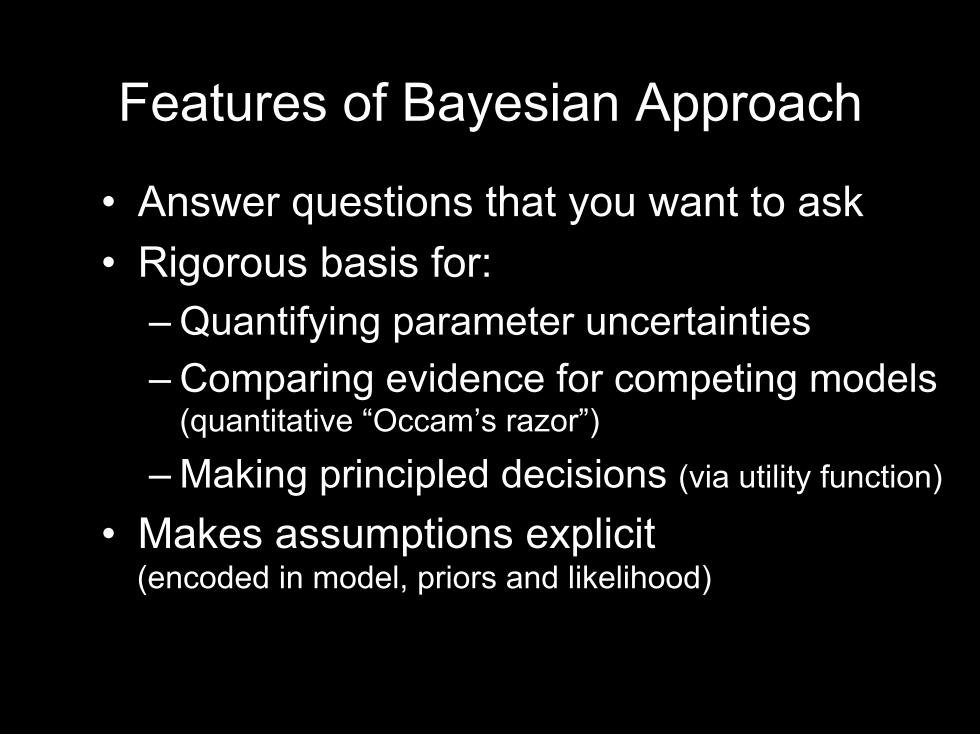
Features of Bayesian Approach
• Answer questions that you want to ask • Rigorous basis for:
– Quantifying parameter uncertainties – Comparing evidence for competing models
(quantitative “Occam’s razor”) – Making principled decisions (via utility function)
• Makes assumptions explicit (encoded in model, priors and likelihood)
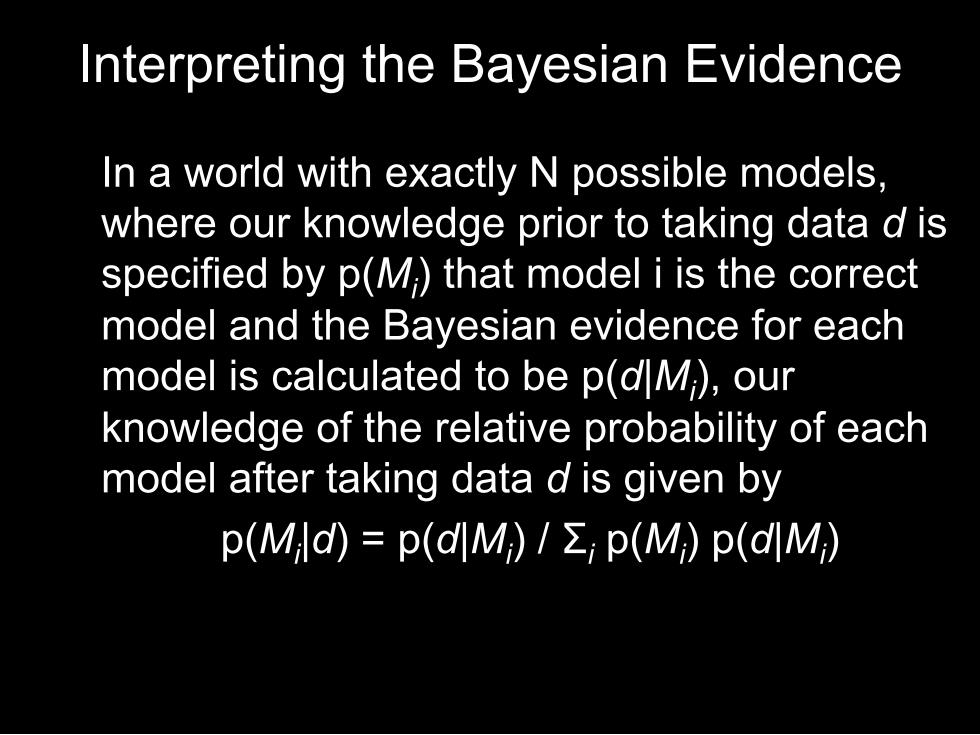
Interpreting the Bayesian Evidence
In a world with exactly N possible models, where our knowledge prior to taking data d is specified by p(Mi) that model i is the correct model and the Bayesian evidence for each model is calculated to be p(d|Mi), our knowledge of the relative probability of each model after taking data d is given by
p(Mi|d) = p(d|Mi) / Σi p(Mi) p(d|Mi)
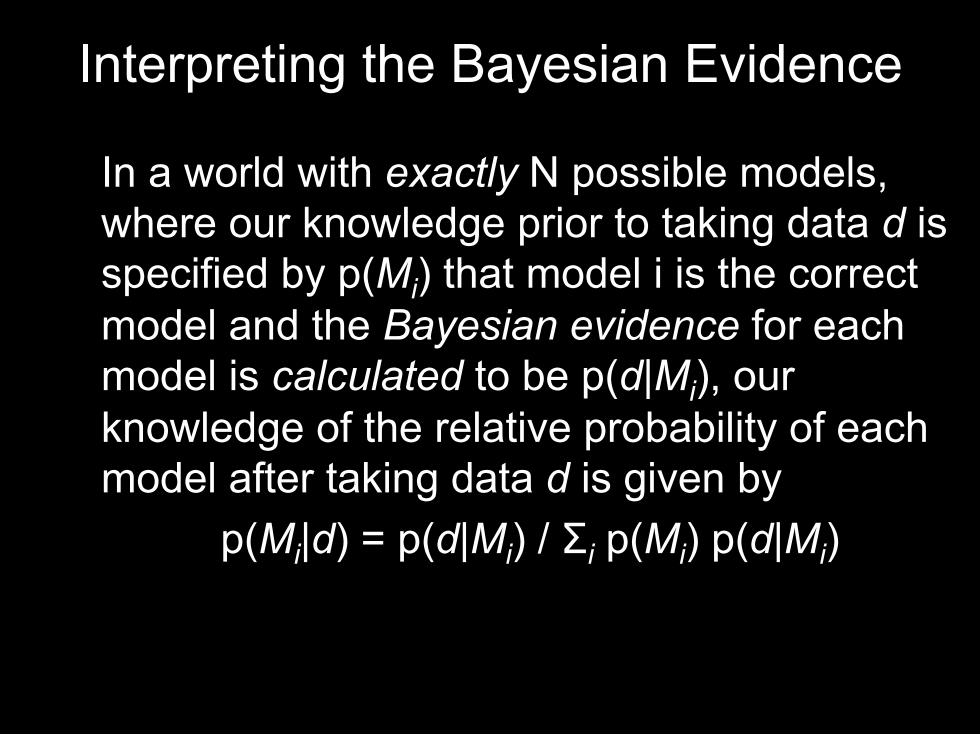
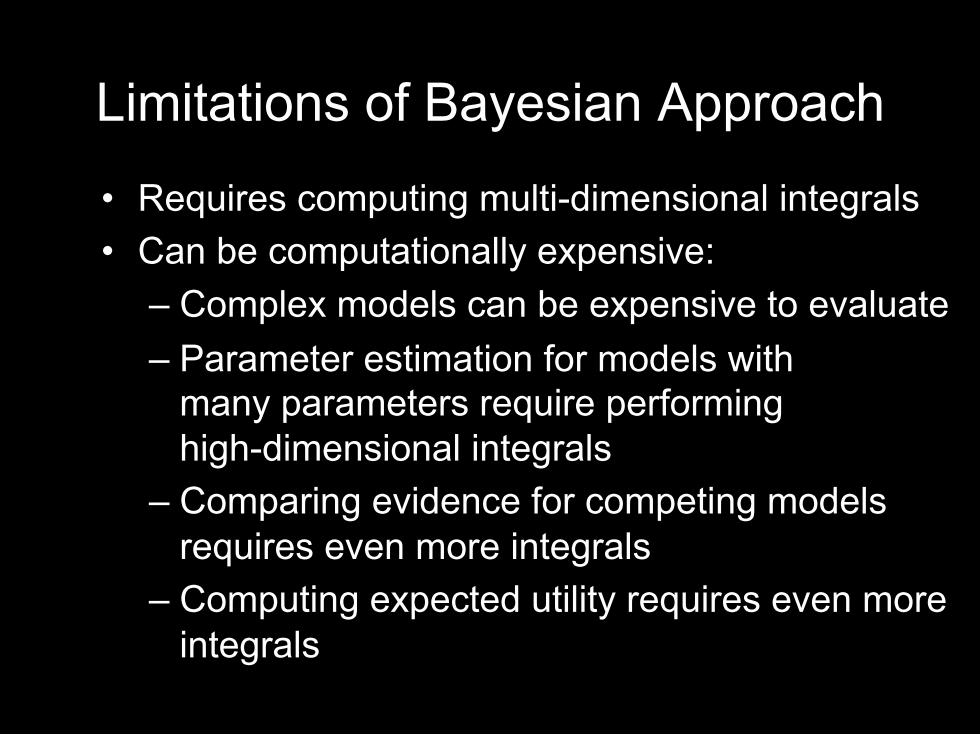
Limitations of Bayesian Approach
• Requires computing multi-dimensional integrals • Can be computationally expensive:
– Complex models can be expensive to evaluate – Parameter estimation for models with
many parameters require performing high-dimensional integrals
– Comparing evidence for competing models requires even more integrals
– Computing expected utility requires even more integrals
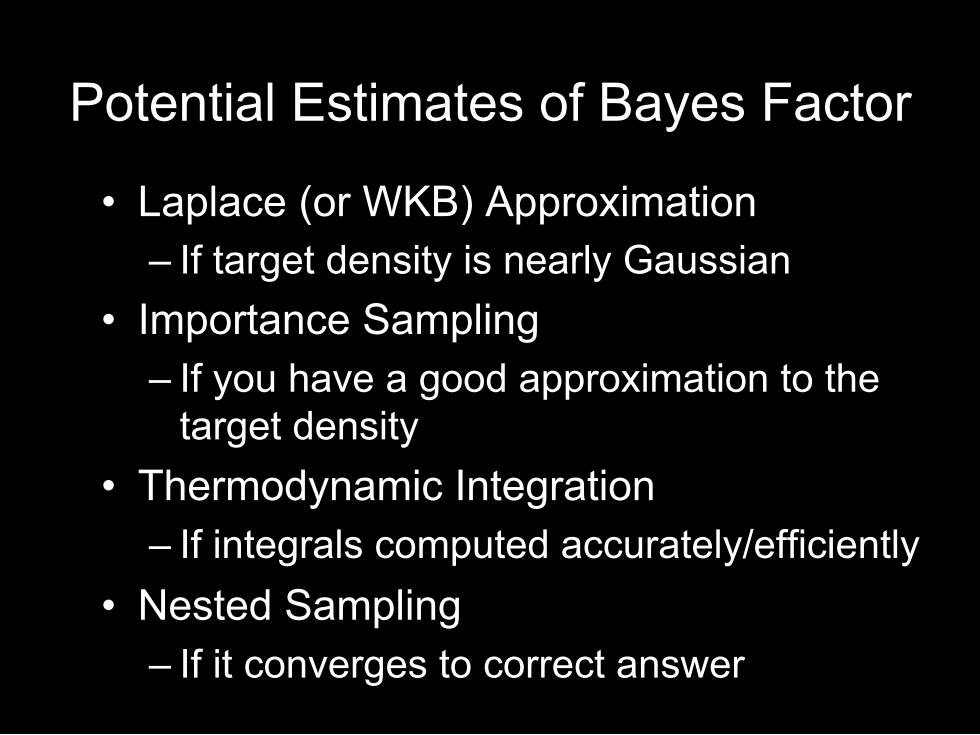
Potential Estimates of Bayes Factor
• Laplace (or WKB) Approximation – If target density is nearly Gaussian
• Importance Sampling – If you have a good approximation to the
target density • Thermodynamic Integration
– If integrals computed accurately/efficiently • Nested Sampling
– If it converges to correct answer
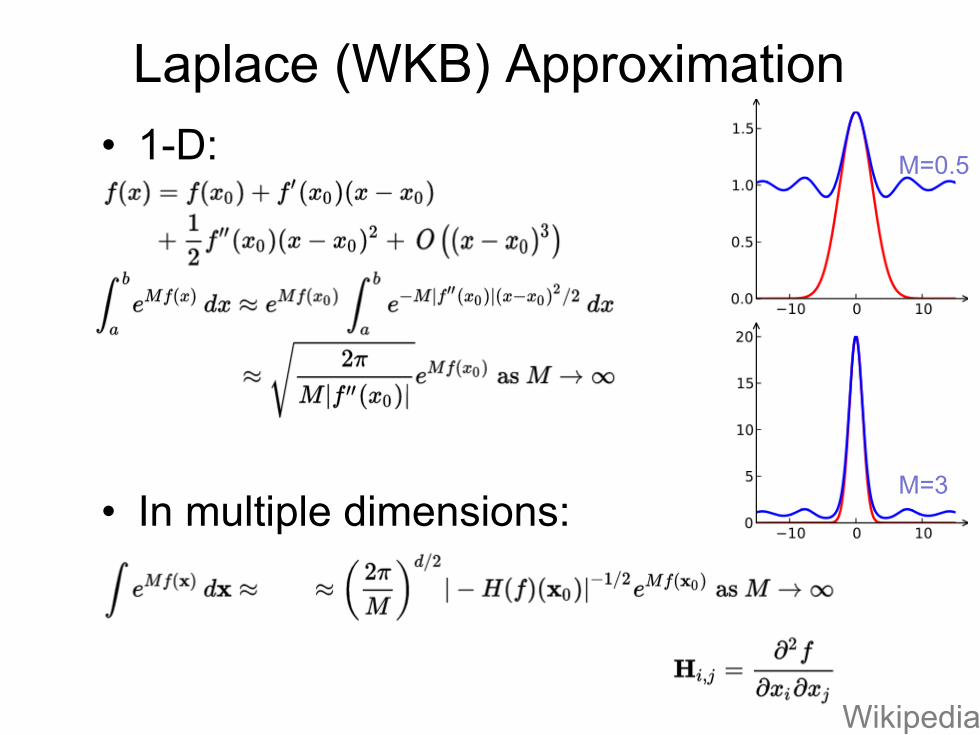
Laplace (WKB) Approximation • 1-D:
• In multiple dimensions:
Wikipedia
• -2 ln( maxθ L(θ) ) - d ln(2π) + ln(H(θmax) )
• BIC = k (ln(n) –ln(2π)) - 2 ln( maxθ L(θ) ) k = number of parameters to be estimated n = number of data points
• AIC “Corrected” for finite sample size • If univariate, linear, normal residuals:
AICc = AIC + 2k(k+1)/(n-k-1)
M=0.5
M=3
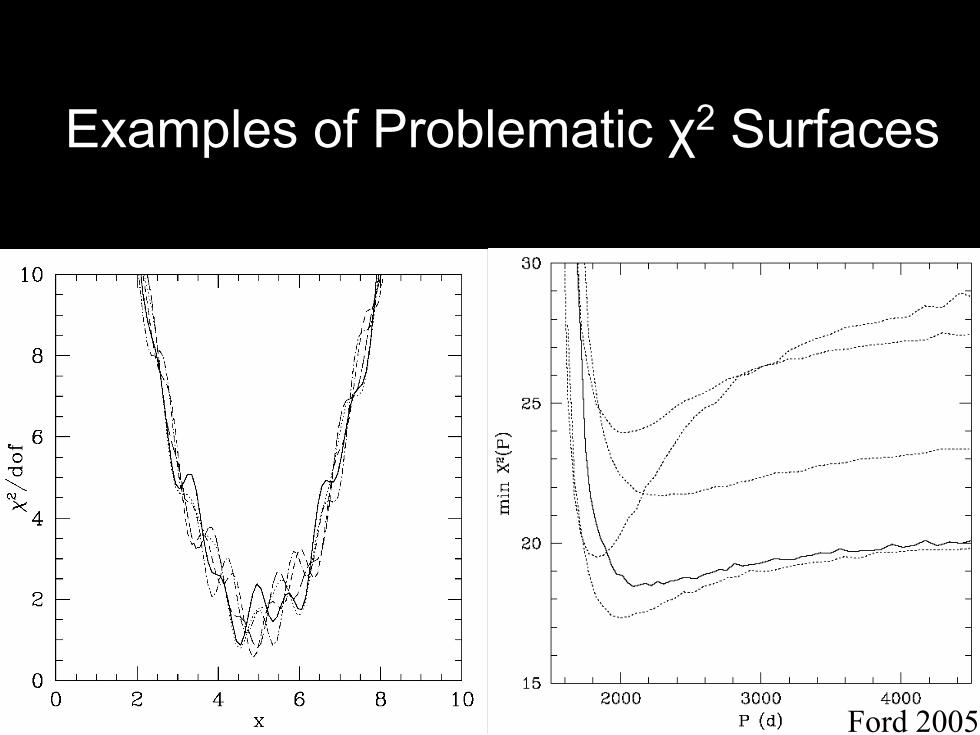
Examples of Problematic χ2 Surfaces
Ford 2005
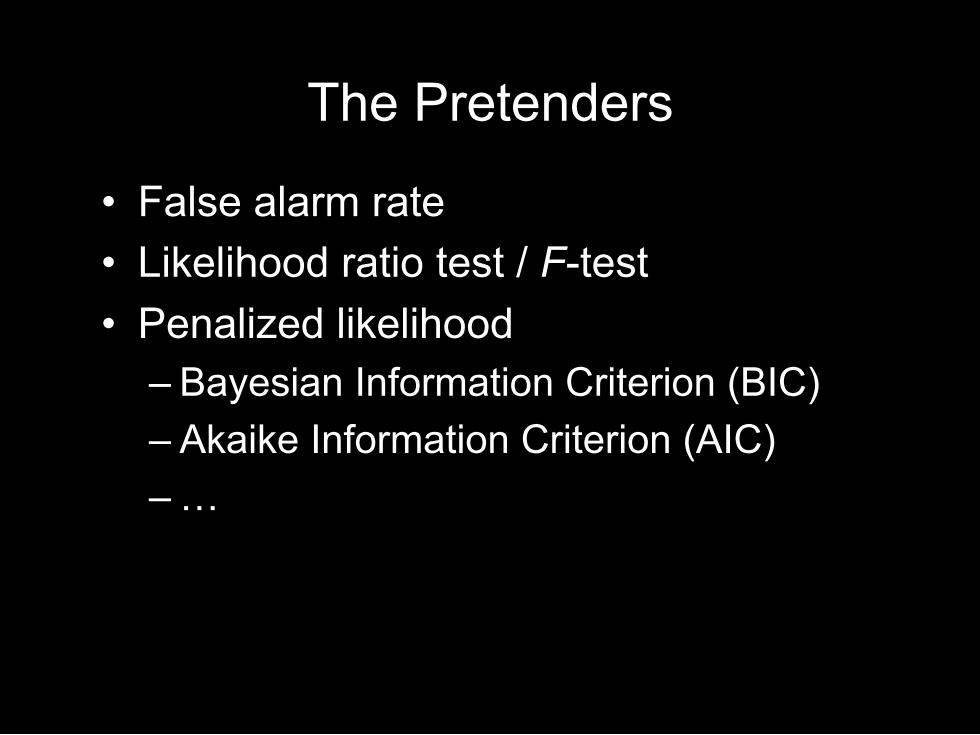
The Pretenders
• False alarm rate • Likelihood ratio test / F-test • Penalized likelihood
– Bayesian Information Criterion (BIC) – Akaike Information Criterion (AIC) – …
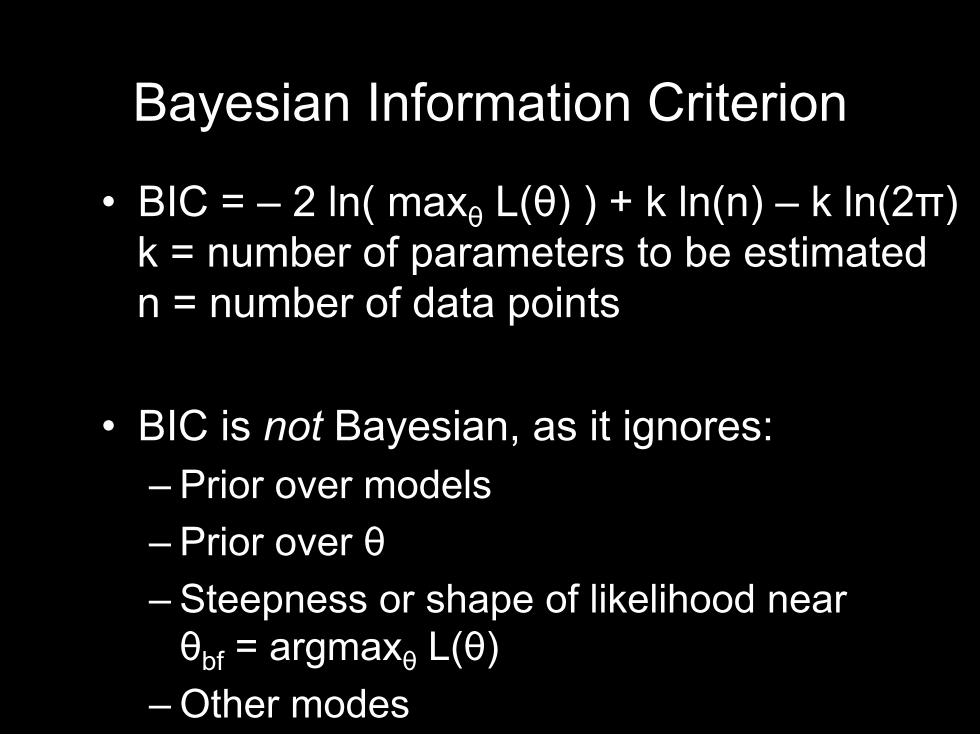
Bayesian Information Criterion
• BIC = – 2 ln( maxθ L(θ) ) + k ln(n) – k ln(2π) k = number of parameters to be estimated n = number of data points
• BIC is not Bayesian, as it ignores: – Prior over models – Prior over θ – Steepness or shape of likelihood near θbf = argmaxθ L(θ)
– Other modes
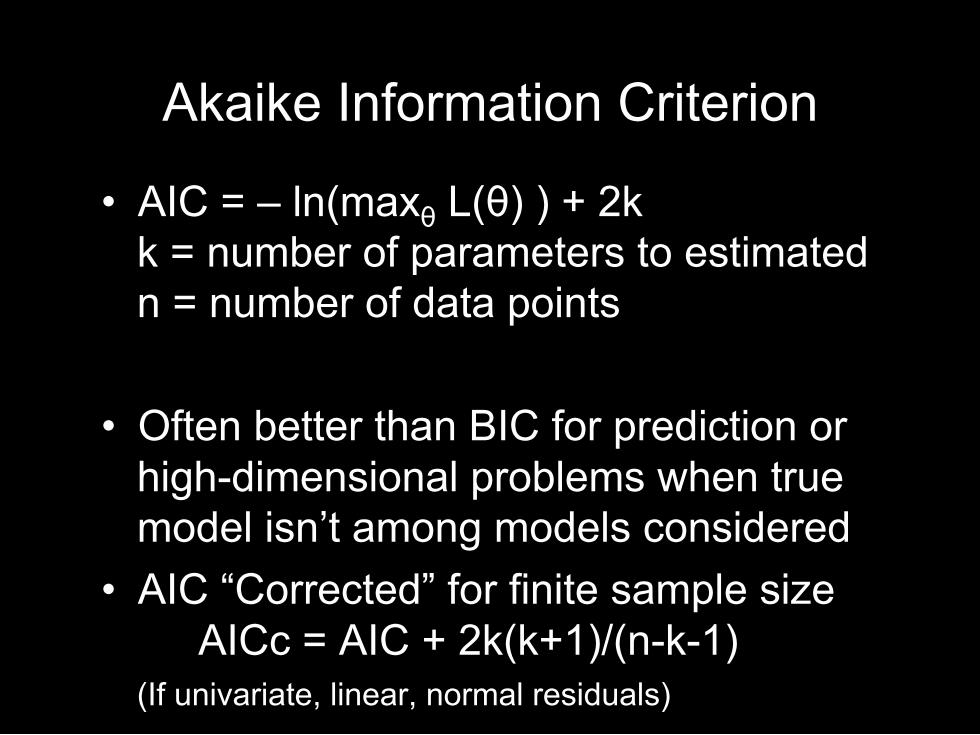
Akaike Information Criterion
• AIC = – ln(maxθ L(θ) ) + 2k k = number of parameters to estimated n = number of data points
• Often better than BIC for prediction or high-dimensional problems when true model isn’t among models considered
• AIC “Corrected” for finite sample size AICc = AIC + 2k(k+1)/(n-k-1)
(If univariate, linear, normal residuals)
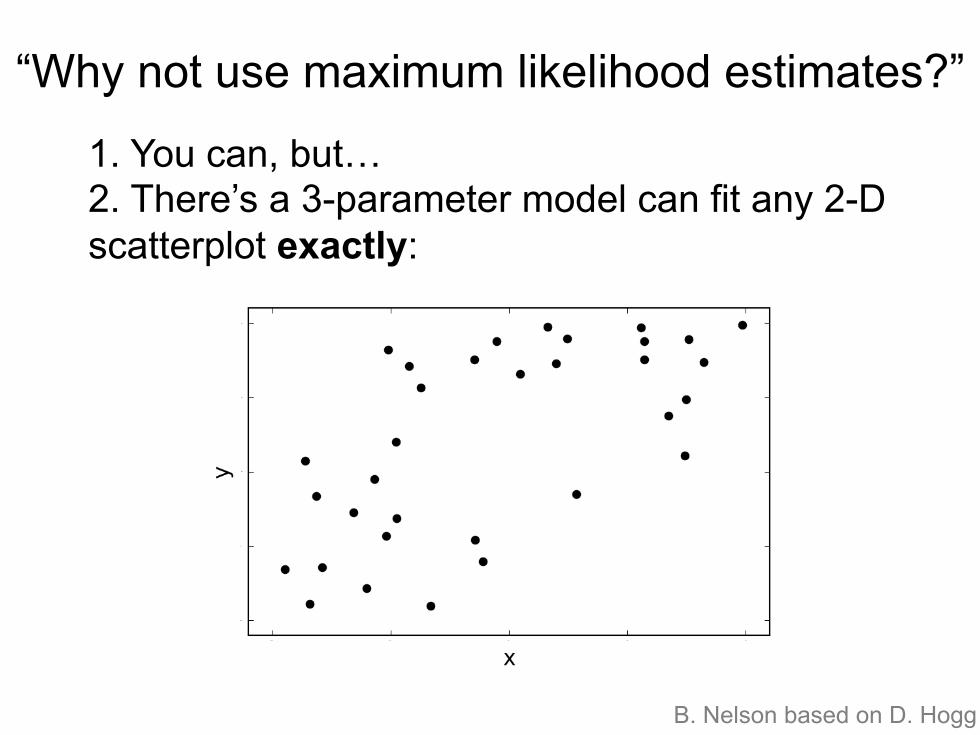
B. Nelson based on D. Hogg
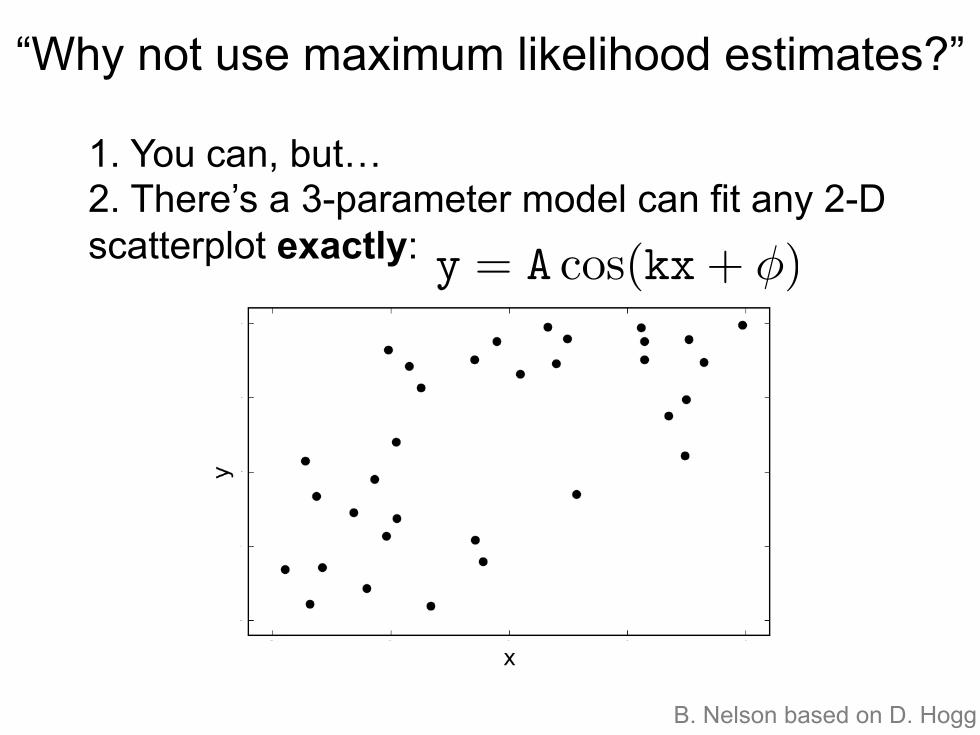
“Why not use maximum likelihood estimates?”
1. You can, but… 2. There’s a 3-parameter model can fit any 2-D scatterplot exactly:
1. You can, but… 2. There’s a 3-parameter model can fit any 2-D scatterplot exactly:
y = A cos(kx+ �)
“Why not use maximum likelihood estimates?”
B. Nelson based on D. Hogg
1. You can, but… 2. There’s a 3-parameter model can fit any 2-D scatterplot exactly:
y = A cos(kx+ �)
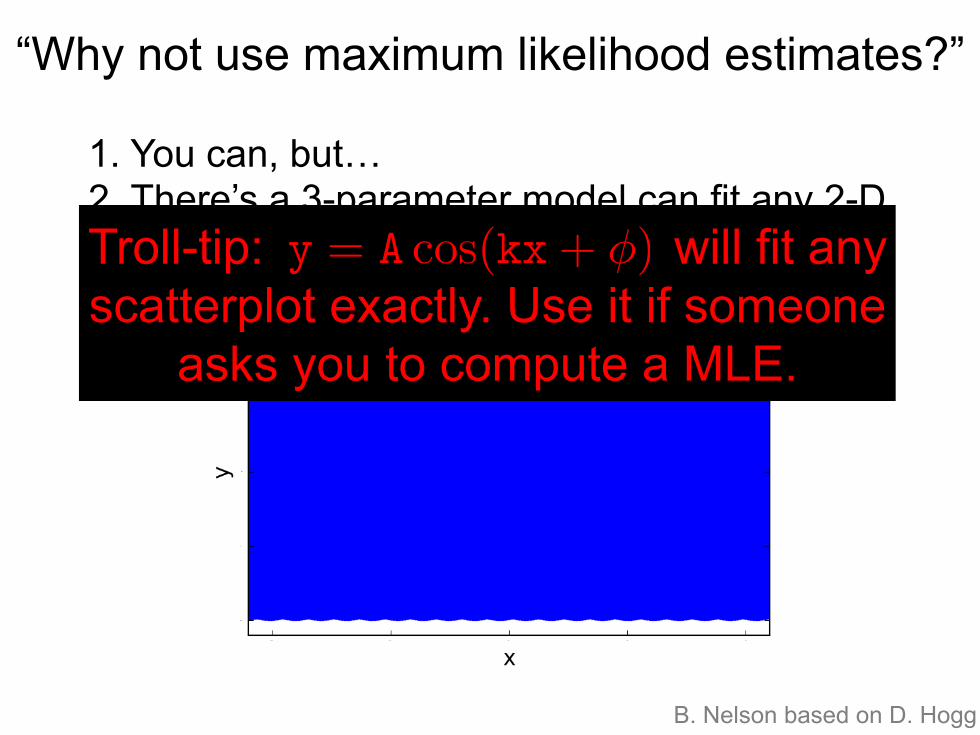
“Why not use maximum likelihood estimates?”
Troll-tip: will fit any scatterplot exactly. Use it if someone
asks you to compute a MLE.
y = A cos(kx+ �)
B. Nelson based on D. Hogg
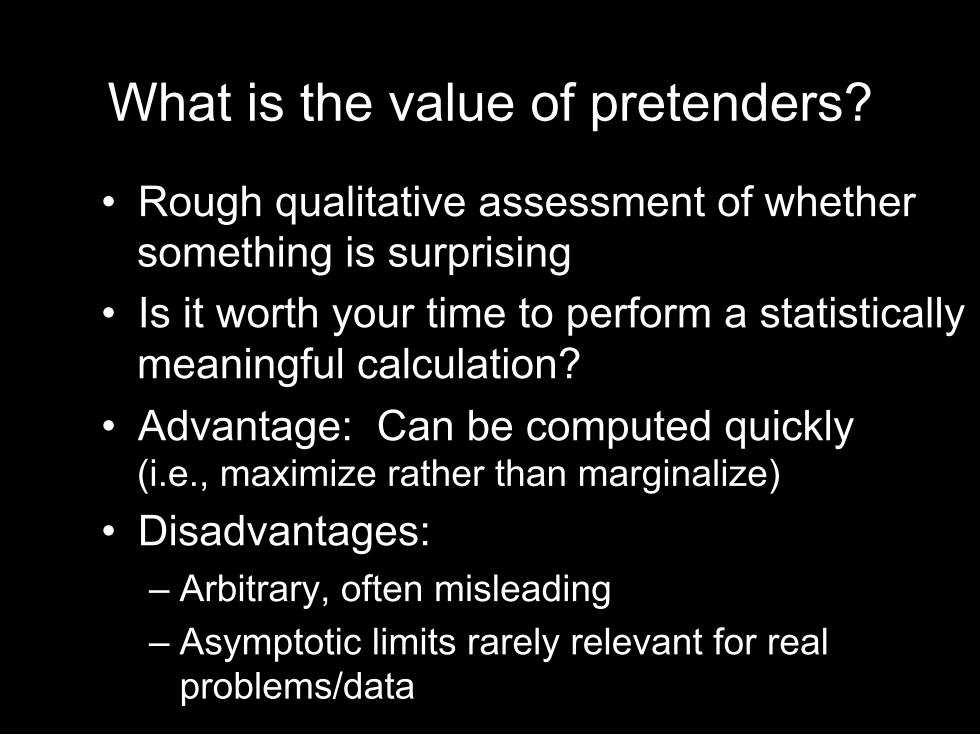
What is the value of pretenders?
• Rough qualitative assessment of whether something is surprising
• Is it worth your time to perform a statistically meaningful calculation?
• Advantage: Can be computed quickly (i.e., maximize rather than marginalize)
• Disadvantages: – Arbitrary, often misleading – Asymptotic limits rarely relevant for real
problems/data

• Search for extraordinary evidence
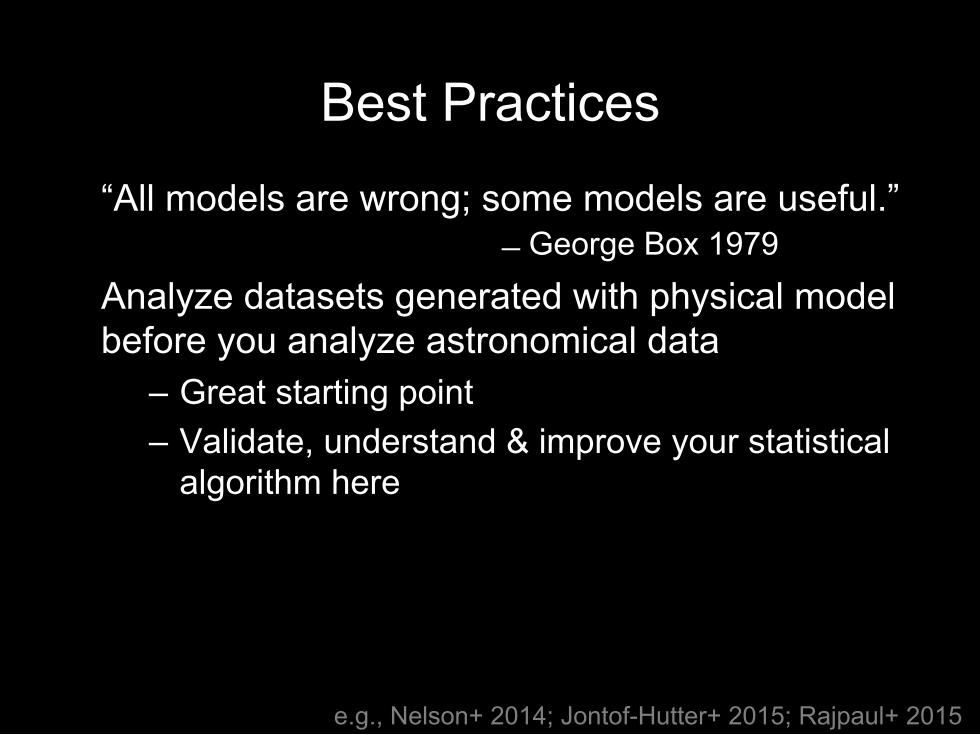
Best Practices
“All models are wrong; some models are useful.” ̶ George Box 1979
Analyze datasets generated with physical model before you analyze astronomical data
– Great starting point – Validate, understand & improve your statistical
algorithm here
e.g., Nelson+ 2014; Jontof-Hutter+ 2015; Rajpaul+ 2015
Best Practices
“All models are wrong; some models are useful.” ̶ George Box 1979
When planning and analyzing astronomical observations, keep in mind that:
– Characterizing stellar activity requires large, well-sampled datasets
– Quantifying rare events requires large survey size – Avoid ad-hoc revisions to model based on data
for the target in question.
Best Practices
• Apply principled & tested algorithms – Validate stellar activity & statistical models with
simulated data – Verify stellar activity & statistical models
with astronomical observations • Test for non-convergence of iterative
algorithms • Test sensitivity of results/conclusions to
choice of priors & likelihoods (e.g., stellar activity model)
Conclusions • Strive to perform statistically valid and
reproducible research • Be skeptical of any claim based on inappropriate
statistical methodology – Don’t use p-values to claim detections of planets,
atmospheric features, … – Never pretend a p-value is a false alarm probability
• Learn fundamentals of how to perform Bayesian model comparison
• Use practical approximations to Bayesian evidence when appropriate for your problem
SAMSI Program on Statistical, Mathematical and Computational Methods for Astronomy
• Opening workshop Aug 22-26, 2016 • Planned working groups (Fall 2016/Spring 2017):
– Uncertainty Quantification and Reduced Order Modeling in Gravitation, Astrophysics, and Cosmology
– Synoptic Time Domain Surveys – Time Series Analysis for Exoplanets & Gravitational Waves:
Beyond Stationary Gaussian Processes – Population Modeling & Signal Separation for Exoplanets &
Gravitational Waves – Statistics, computation, and modeling in cosmology

Questions?
Illustration: Lynette Cook
2nd Workshop on Extreme Precision Radial Velocities
July 7, 2015