Embed Size (px)
Citation preview
DANGER DETECTORFINAL VIP PRESENTATION
Krithika ChandrasekarDevang ParekhShruthi S Reddy
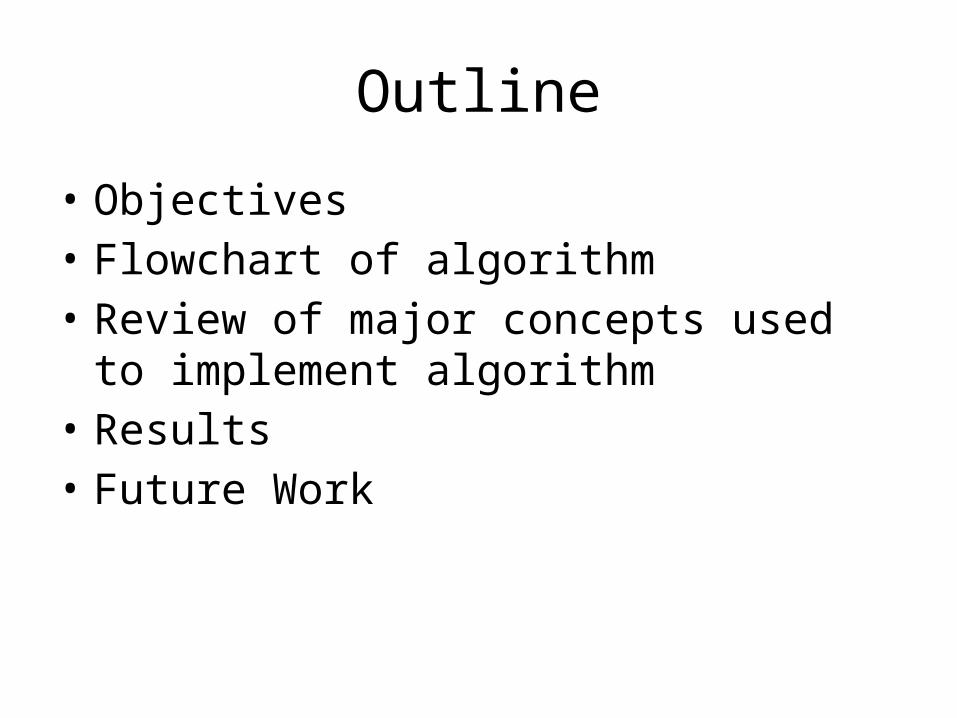
Outline
• Objectives• Flowchart of algorithm• Review of major concepts used to implement
algorithm• Results• Future Work
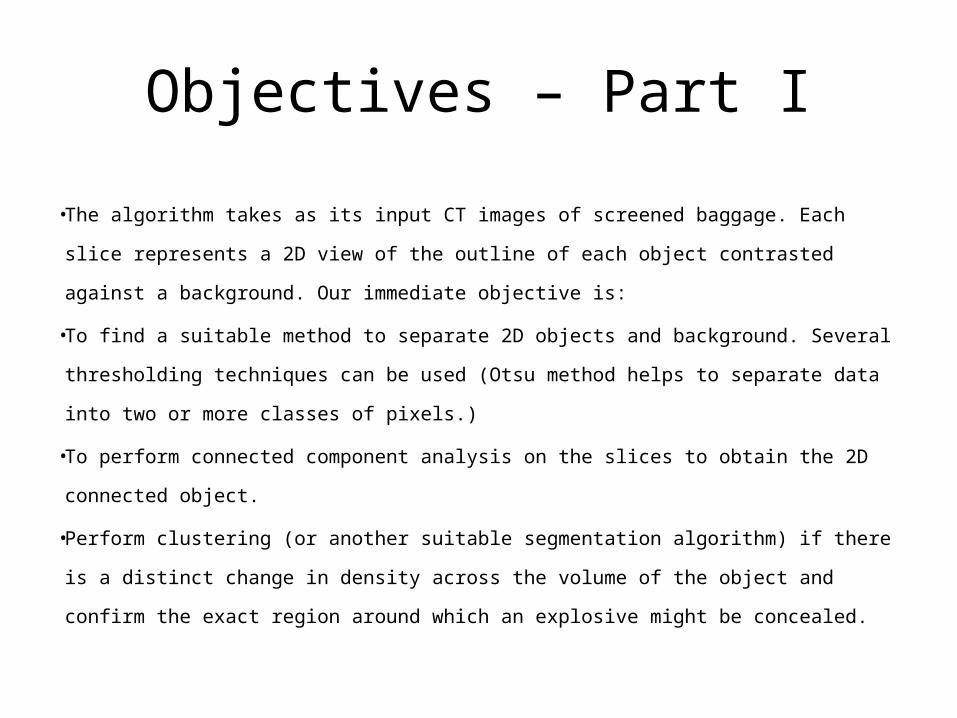
Objectives – Part I
• The algorithm takes as its input CT images of screened baggage. Each slice represents a 2D
view of the outline of each object contrasted against a background. Our immediate objective
is:
• To find a suitable method to separate 2D objects and background. Several thresholding
techniques can be used (Otsu method helps to separate data into two or more classes of
pixels.)
• To perform connected component analysis on the slices to obtain the 2D connected object.
• Perform clustering (or another suitable segmentation algorithm) if there is a distinct change
in density across the volume of the object and confirm the exact region around which an
explosive might be concealed.
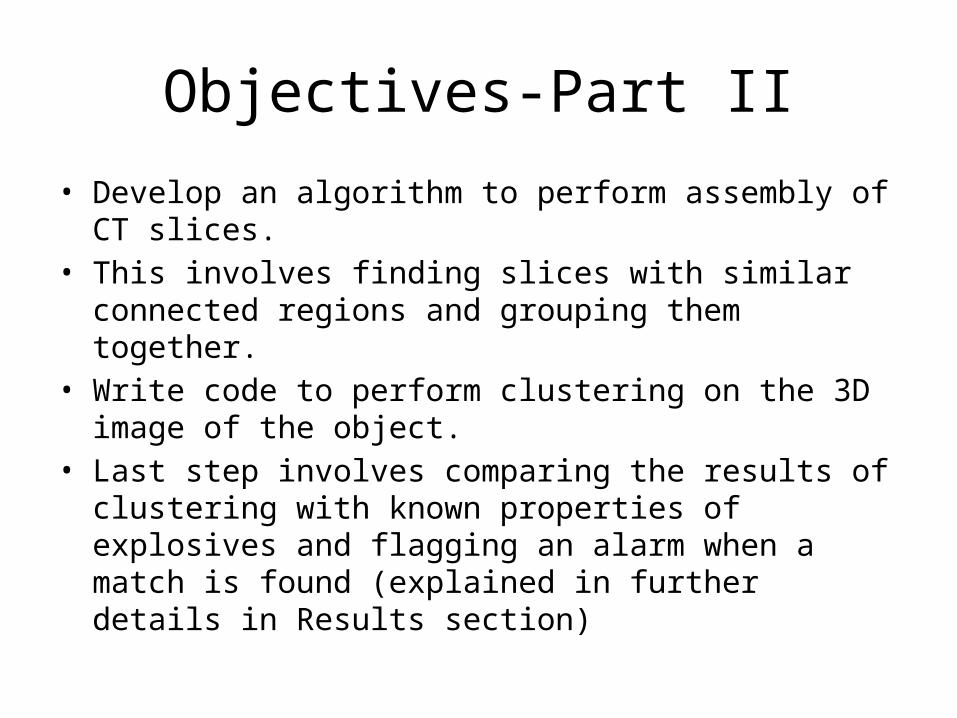
Objectives-Part II
• Develop an algorithm to perform assembly of CT slices.• This involves finding slices with similar connected regions and
grouping them together. • Write code to perform clustering on the 3D image of the
object.• Last step involves comparing the results of clustering with
known properties of explosives and flagging an alarm when a match is found (explained in further details in Results section)
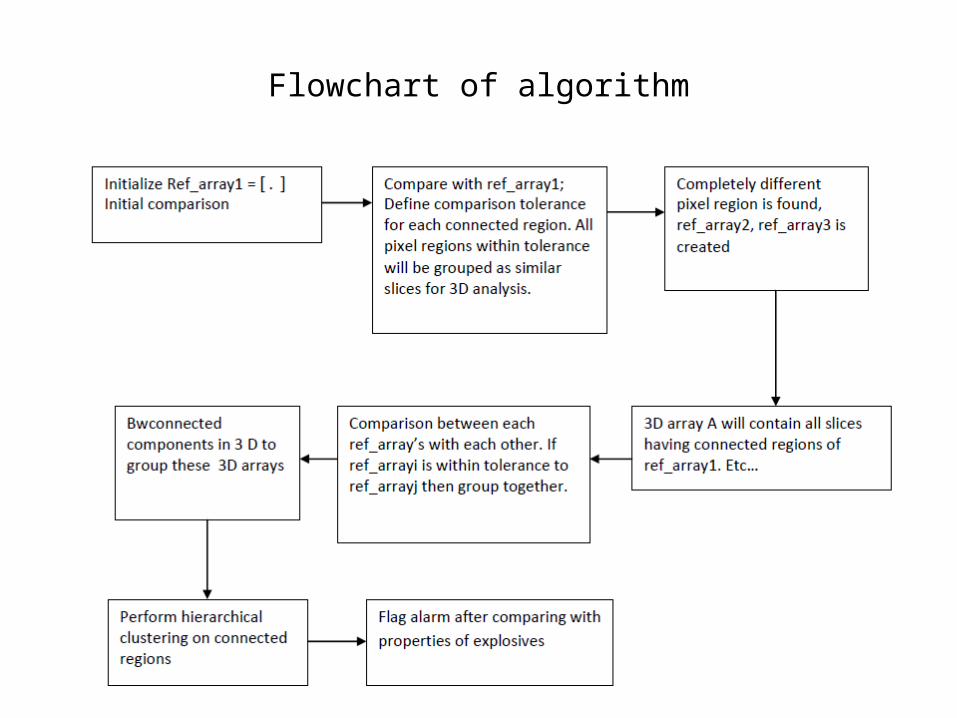
Flowchart of algorithm
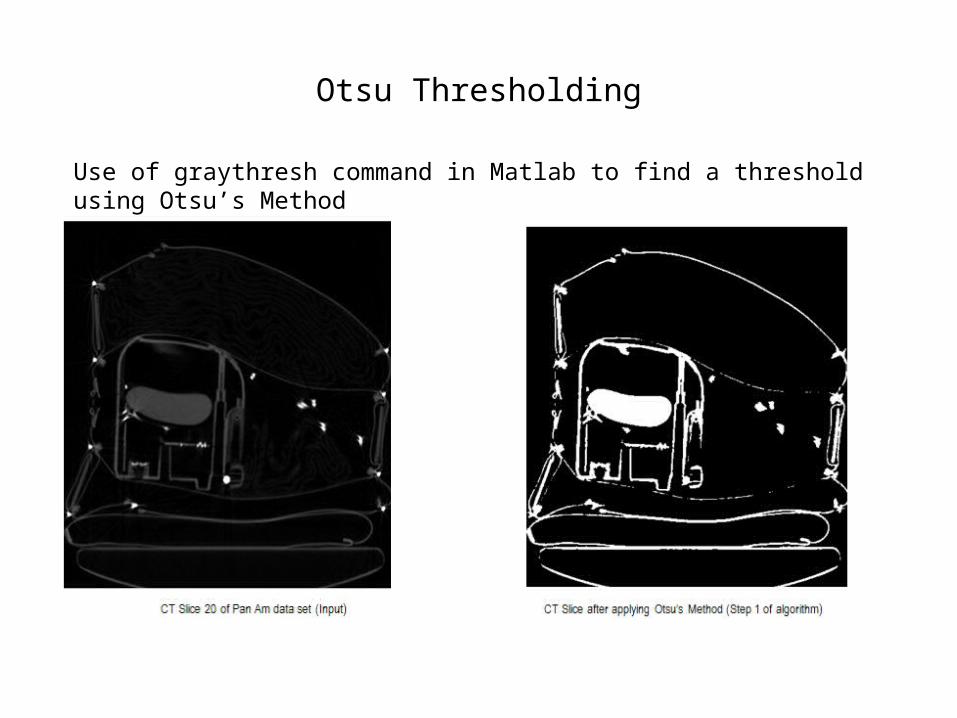
Otsu Thresholding
Use of graythresh command in Matlab to find a threshold using Otsu’s Method
7
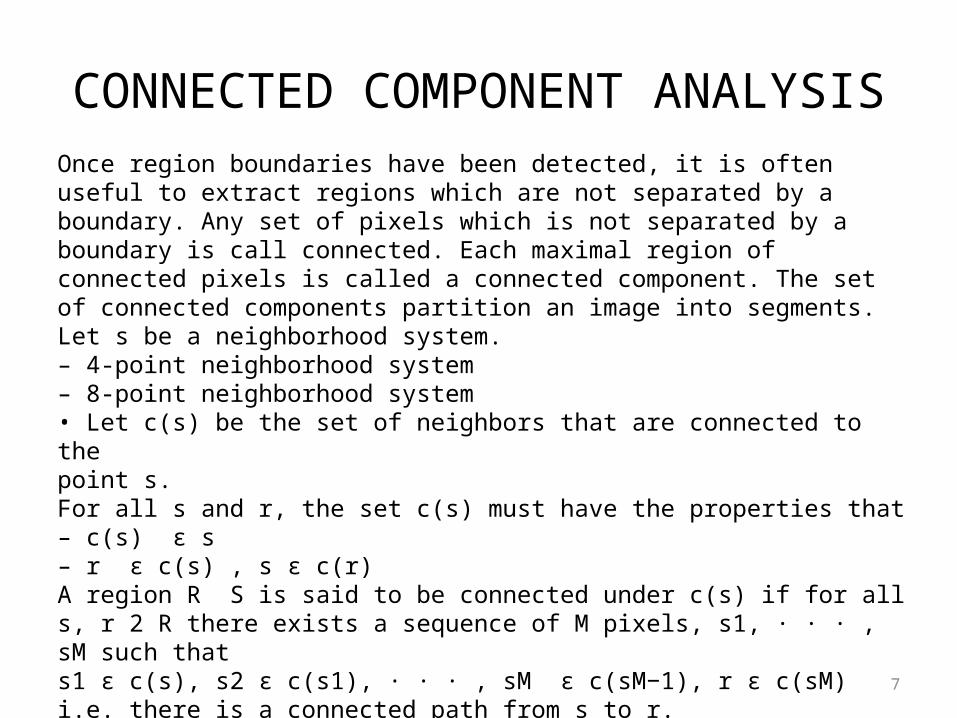
CONNECTED COMPONENT ANALYSISOnce region boundaries have been detected, it is often useful to extract regions which are not separated by a boundary. Any set of pixels which is not separated by a boundary is call connected. Each maximal region of connected pixels is called a connected component. The set of connected components partition an image into segments.Let s be a neighborhood system.– 4-point neighborhood system– 8-point neighborhood system• Let c(s) be the set of neighbors that are connected to thepoint s.For all s and r, the set c(s) must have the properties that– c(s) ε s– r ε c(s) , s ε c(r)A region R S is said to be connected under c(s) if for all s, r 2 R there exists a sequence of M pixels, s1, · · · , sM such thats1 ε c(s), s2 ε c(s1), · · · , sM ε c(sM−1), r ε c(sM)i.e. there is a connected path from s to r.
*www.ee.mit.edu/ece590/lecture_notes/ece590H
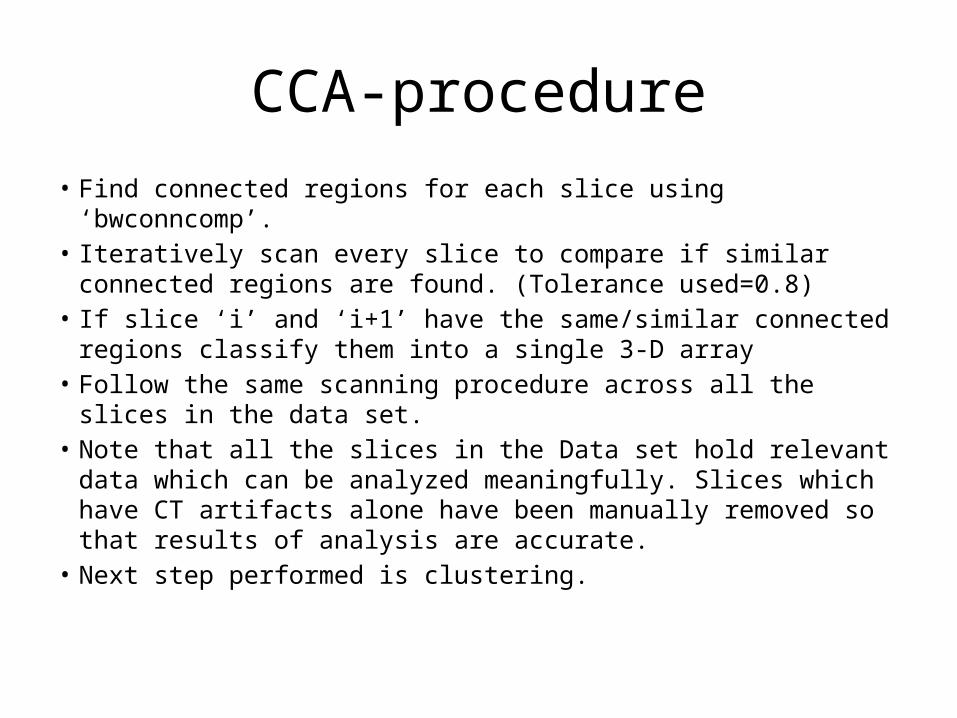
CCA-procedure
• Find connected regions for each slice using ‘bwconncomp’.• Iteratively scan every slice to compare if similar connected
regions are found. (Tolerance used=0.8)• If slice ‘i’ and ‘i+1’ have the same/similar connected regions
classify them into a single 3-D array• Follow the same scanning procedure across all the slices in the
data set.• Note that all the slices in the Data set hold relevant data which
can be analyzed meaningfully. Slices which have CT artifacts alone have been manually removed so that results of analysis are accurate.
• Next step performed is clustering.
Feature Vector analysis
Mean and Variance are the numerical features that are used to represent our object
str1 = 'mean'; str2 = 'var'; eval([featvector '= struct( str1,mean(mean((A))), str2, var(var((A))));']); eval([featvectorOriginal '= struct( str1,mean(mean((C))), str2, var(var((C))));']); x = mean(mean((A))); y = var(var((A))); xOriginal = mean(mean((C))); yOriginal = var(var((C) ) );
meanGray(i) = x; varGray(i) = y; meanOrig(i) = xOriginal; varOrig(i) = yOriginal;

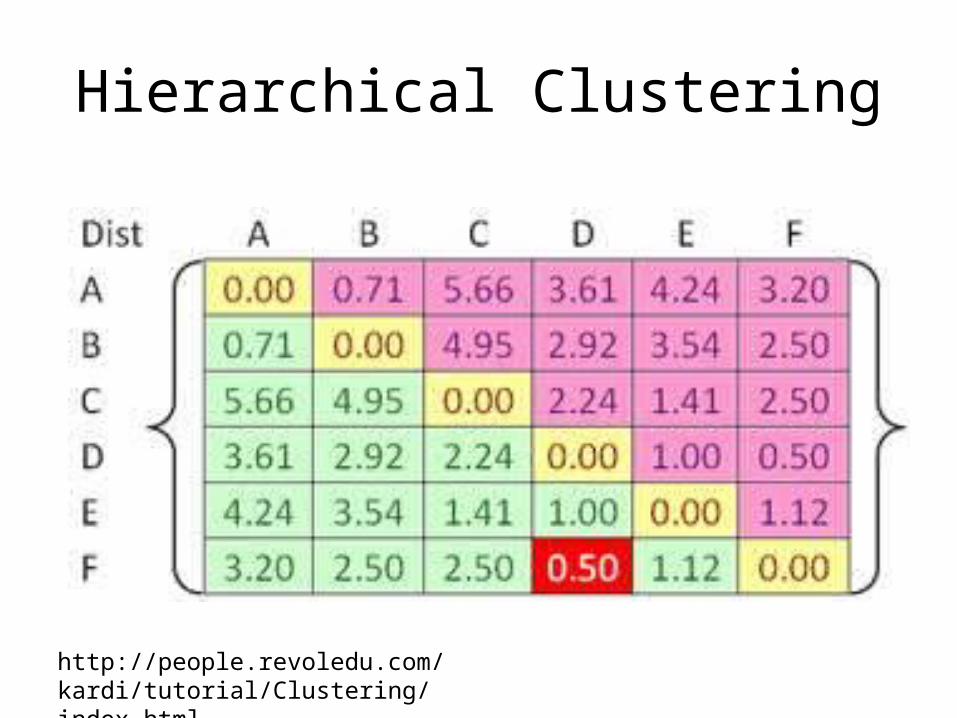
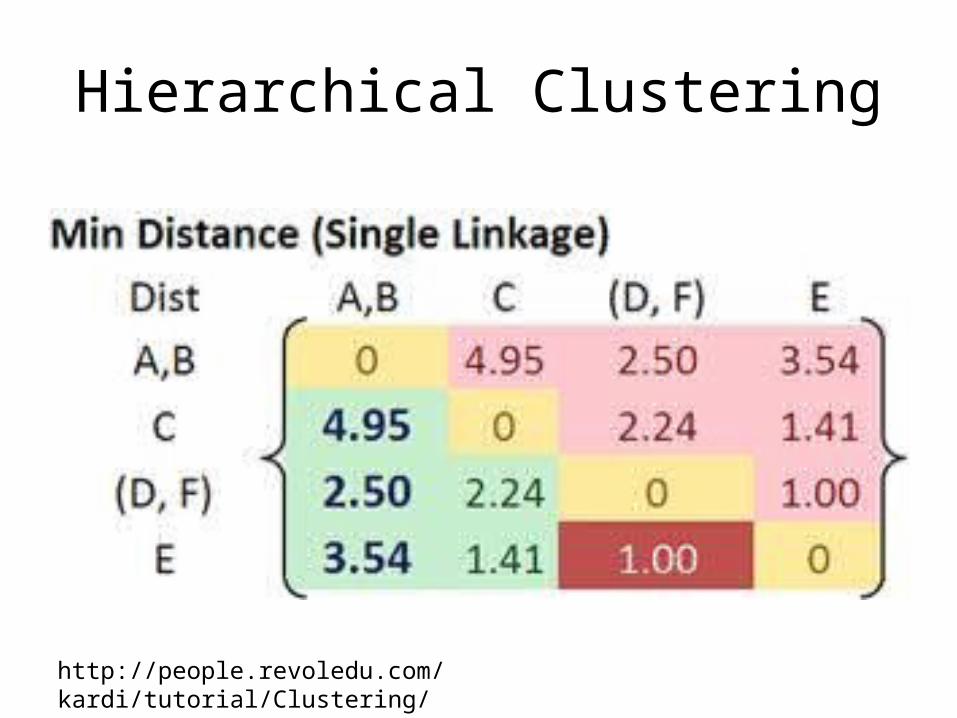
Hierarchical Clustering
http://people.revoledu.com/kardi/tutorial/Clustering/index.html
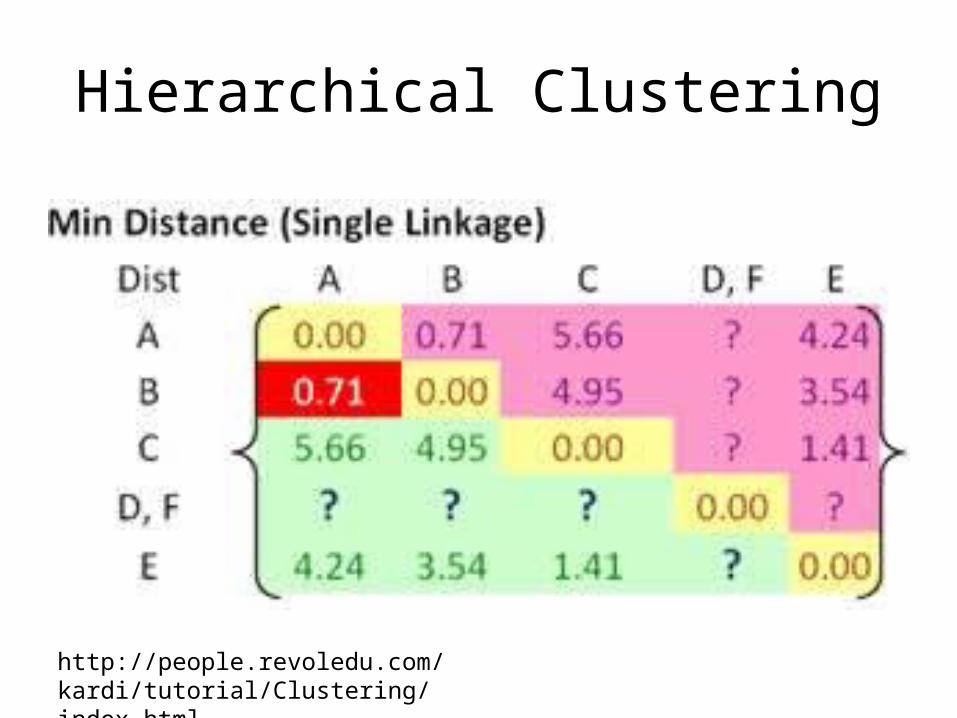
Hierarchical Clustering
http://people.revoledu.com/kardi/tutorial/Clustering/index.html
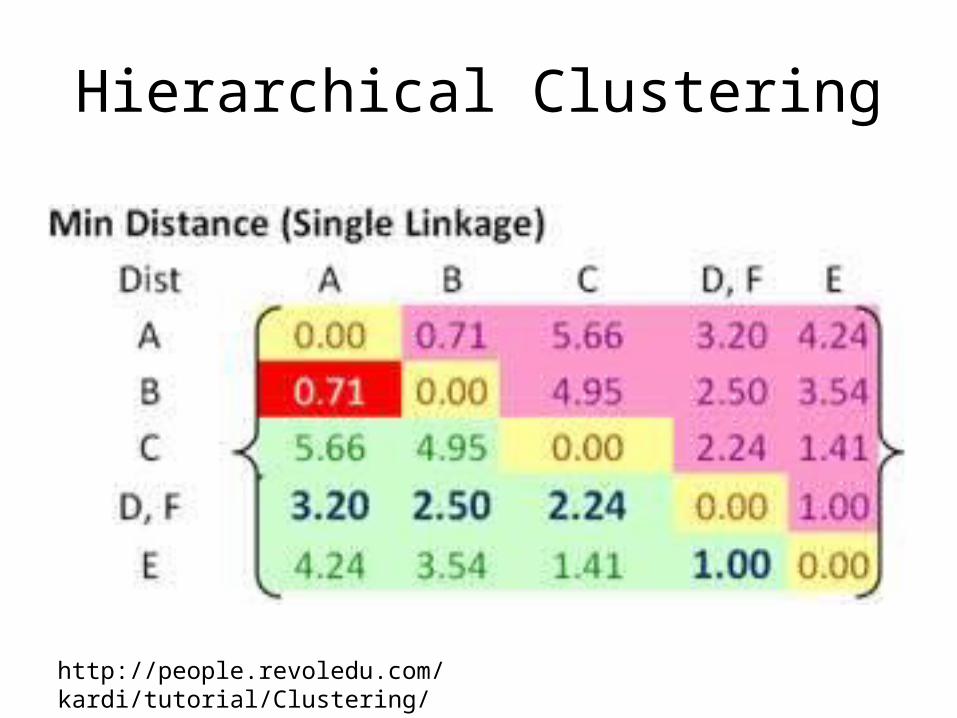
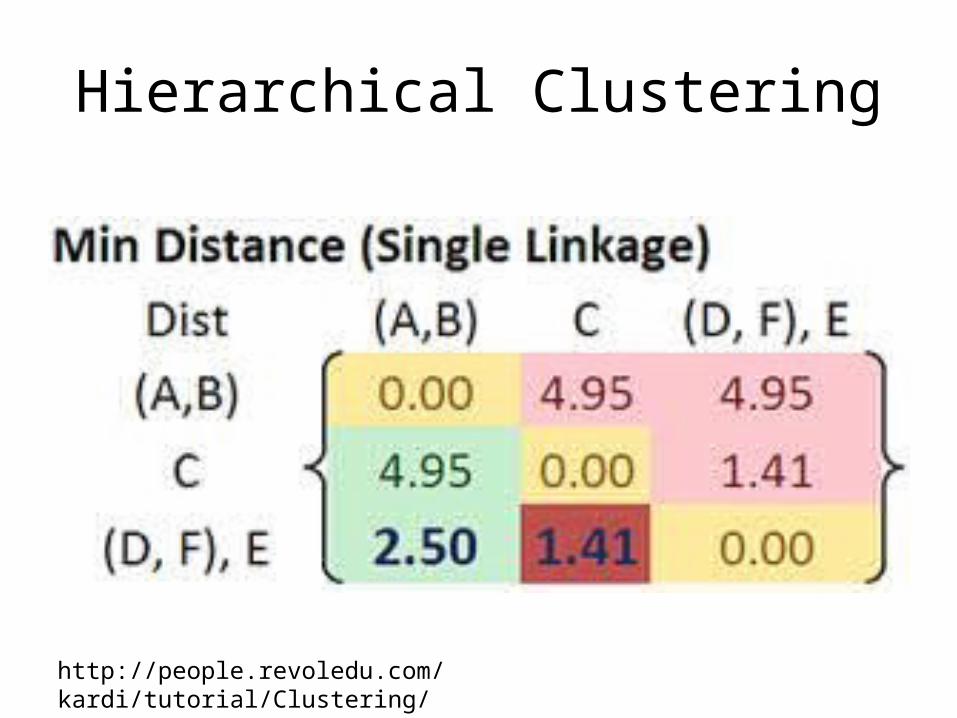
Hierarchical Clustering
http://people.revoledu.com/kardi/tutorial/Clustering/index.html
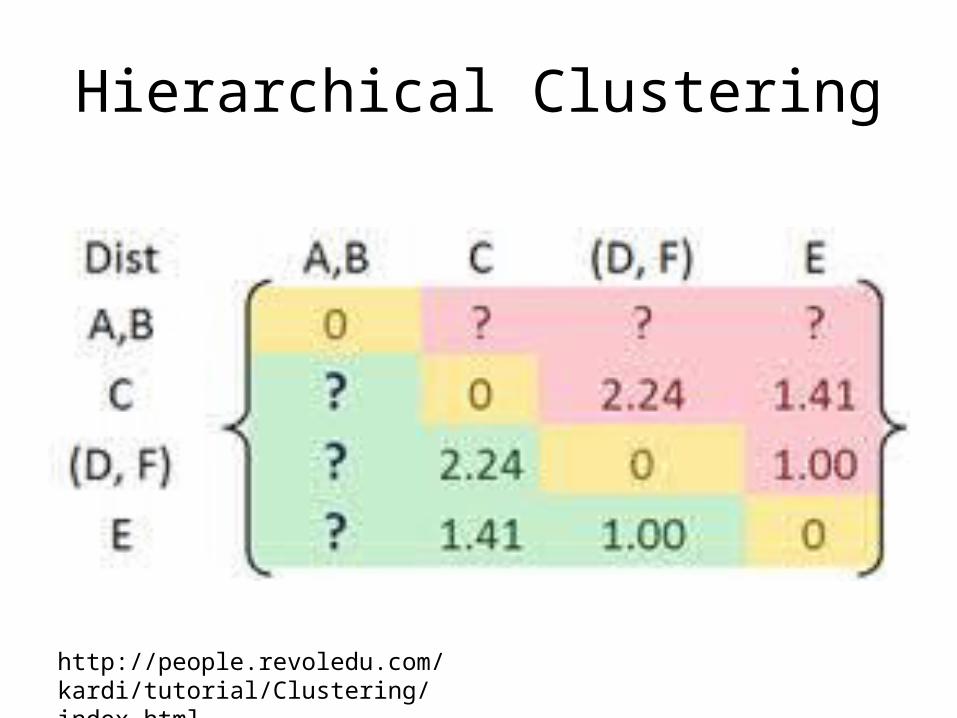
Hierarchical Clustering
http://people.revoledu.com/kardi/tutorial/Clustering/index.html
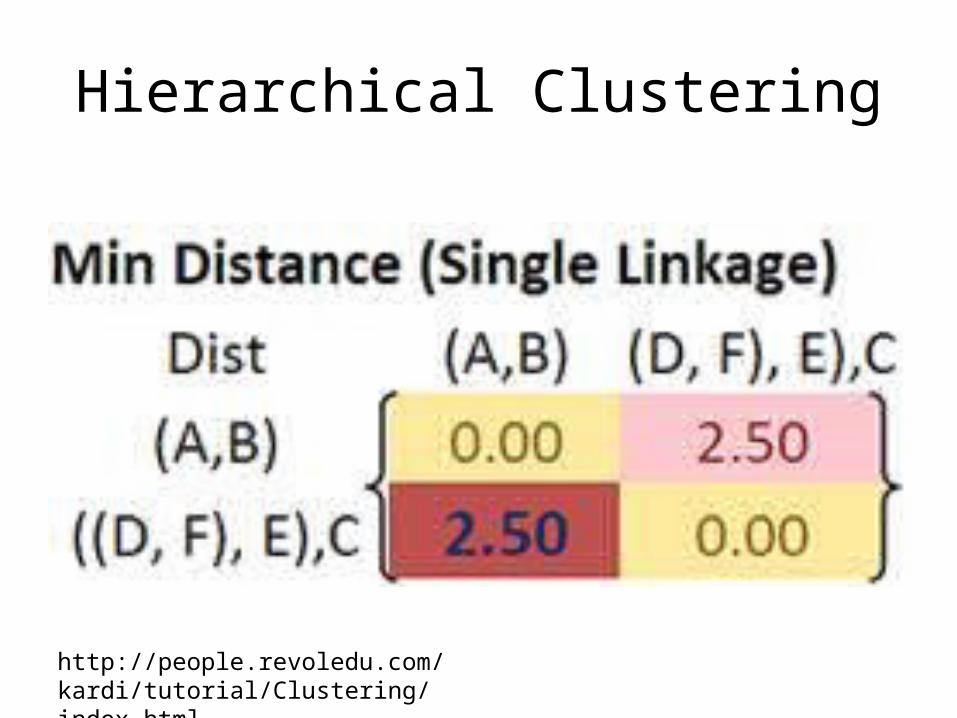
Hierarchical Clustering
http://people.revoledu.com/kardi/tutorial/Clustering/index.html
Hierarchical Clustering
http://people.revoledu.com/kardi/tutorial/Clustering/index.html
Hierarchical Clustering
http://people.revoledu.com/kardi/tutorial/Clustering/index.html
Hierarchical Clustering
http://people.revoledu.com/kardi/tutorial/Clustering/index.html
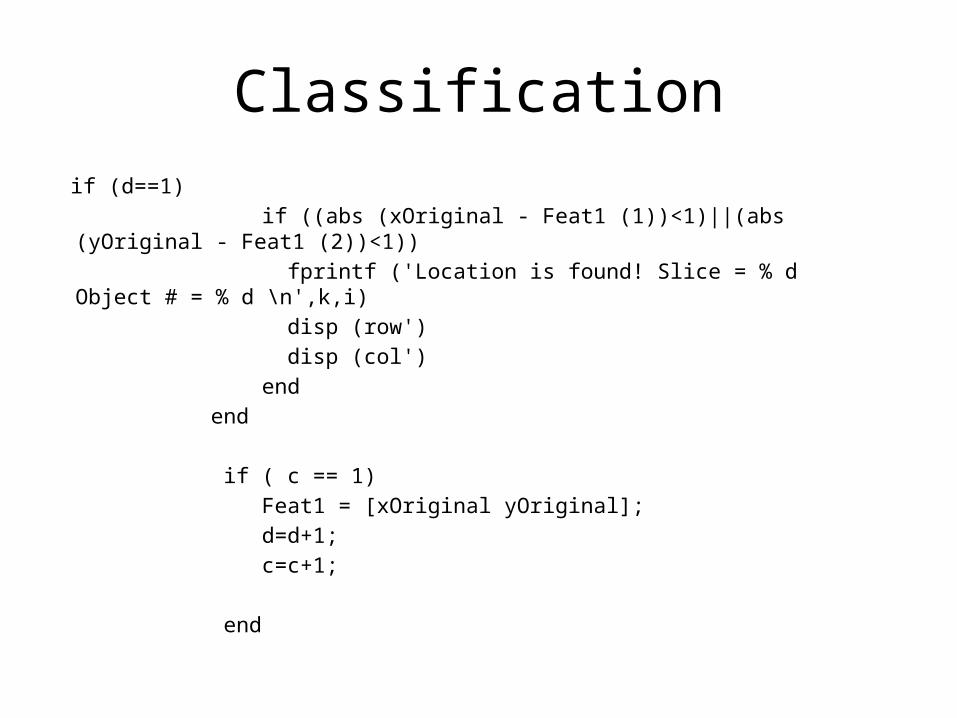
Classification if (d==1) if ((abs (xOriginal - Feat1 (1))<1)||(abs (yOriginal - Feat1 (2))<1)) fprintf ('Location is found! Slice = % d Object # = % d \n',k,i) disp (row') disp (col') end end if ( c == 1) Feat1 = [xOriginal yOriginal]; d=d+1; c=c+1; end
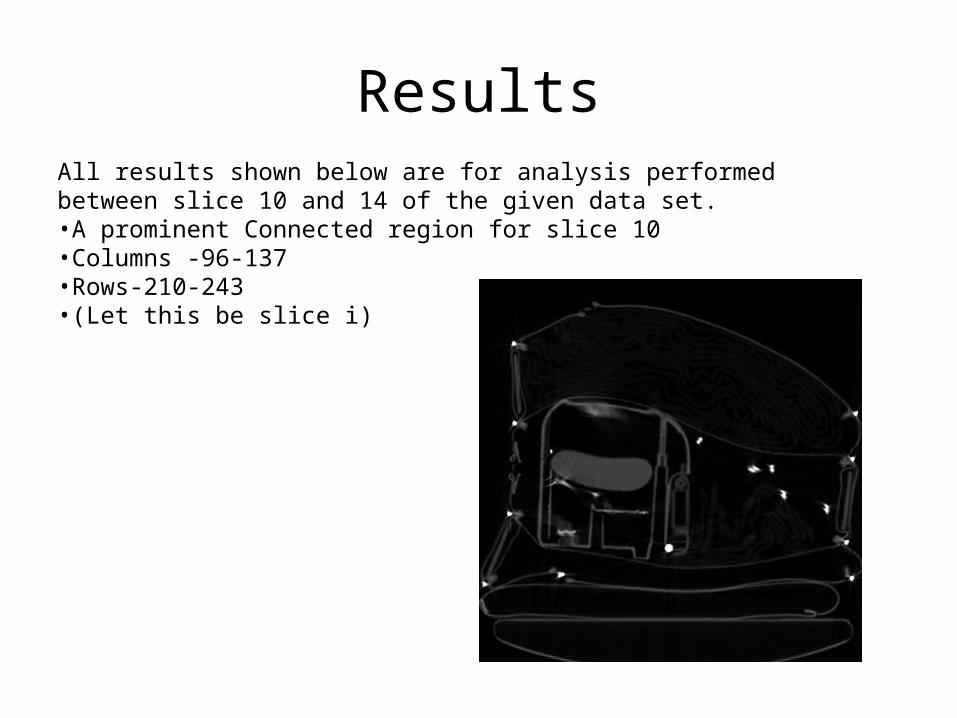
ResultsAll results shown below are for analysis performed between slice 10 and 14 of the given data set.•A prominent Connected region for slice 10•Columns -96-137•Rows-210-243•(Let this be slice i)
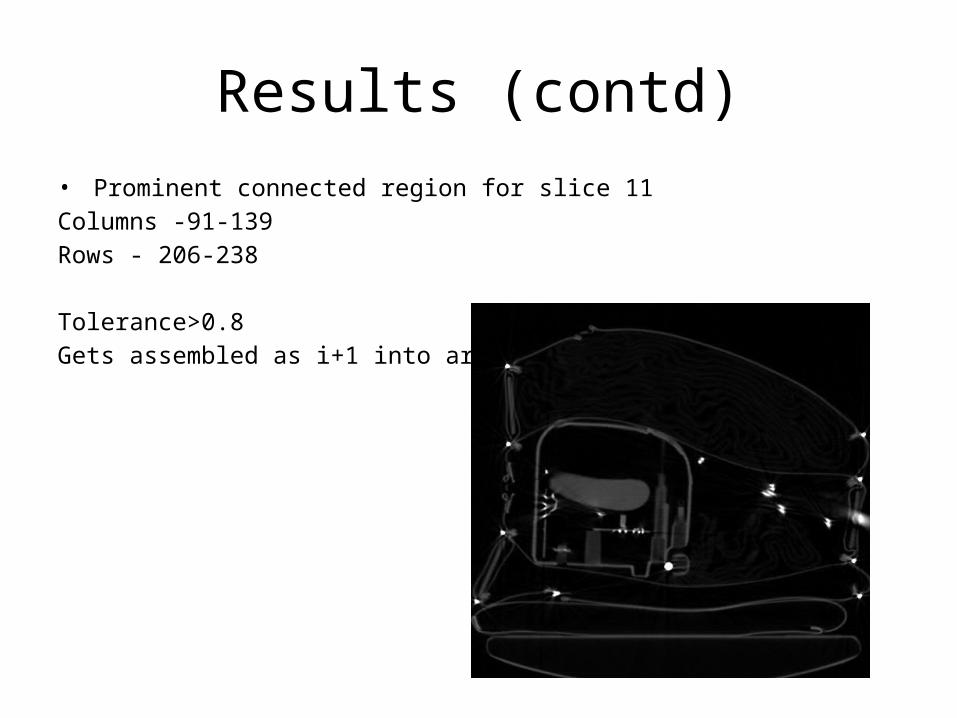
Results (contd)• Prominent connected region for slice 11Columns -91-139Rows - 206-238
Tolerance>0.8 Gets assembled as i+1 into array A
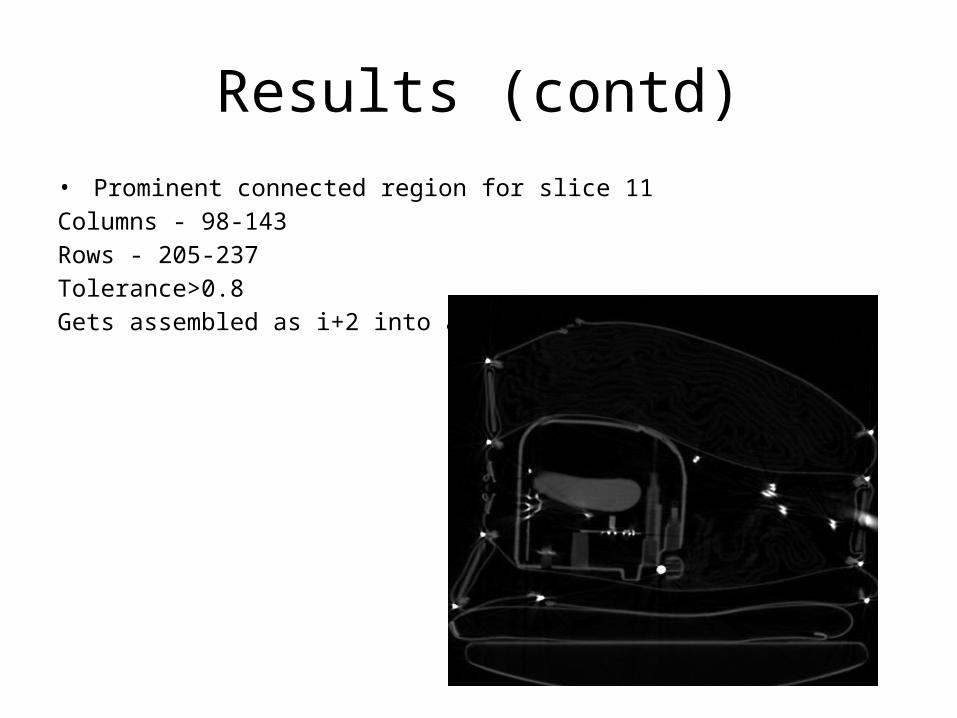
Results (contd)• Prominent connected region for slice 11Columns - 98-143Rows - 205-237Tolerance>0.8 Gets assembled as i+2 into array A
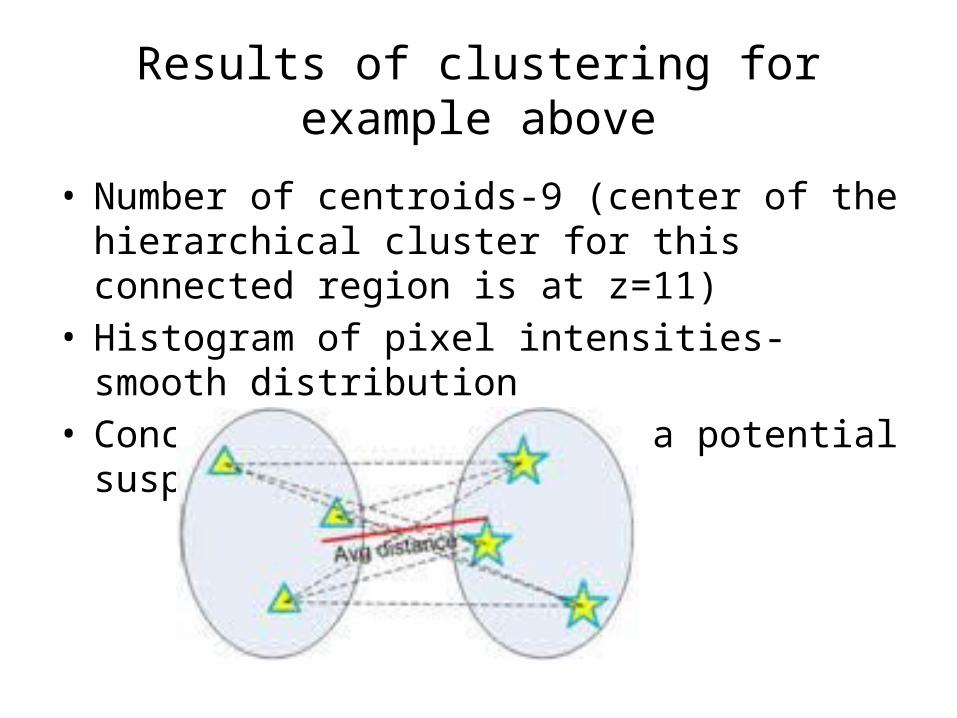
Results of clustering for example above
• Number of centroids-9 (center of the hierarchical cluster for this connected region is at z=11)
• Histogram of pixel intensities-smooth distribution• Conclusion-object is not a potential suspect
Future work• Integrate with simulator group and check validity of algorithm by using the visualization tool.•Detect False alarms using MAP estimation and accurately find co-ordinates of the explosive, given the 2D CT slices of scanned baggage