Embed Size (px)
Citation preview
Citizens
Budget
Commission
June 2006
Danger Ahead!How to Balancethe MTA’s Budget
How to Balance the MTA’s Budget
2
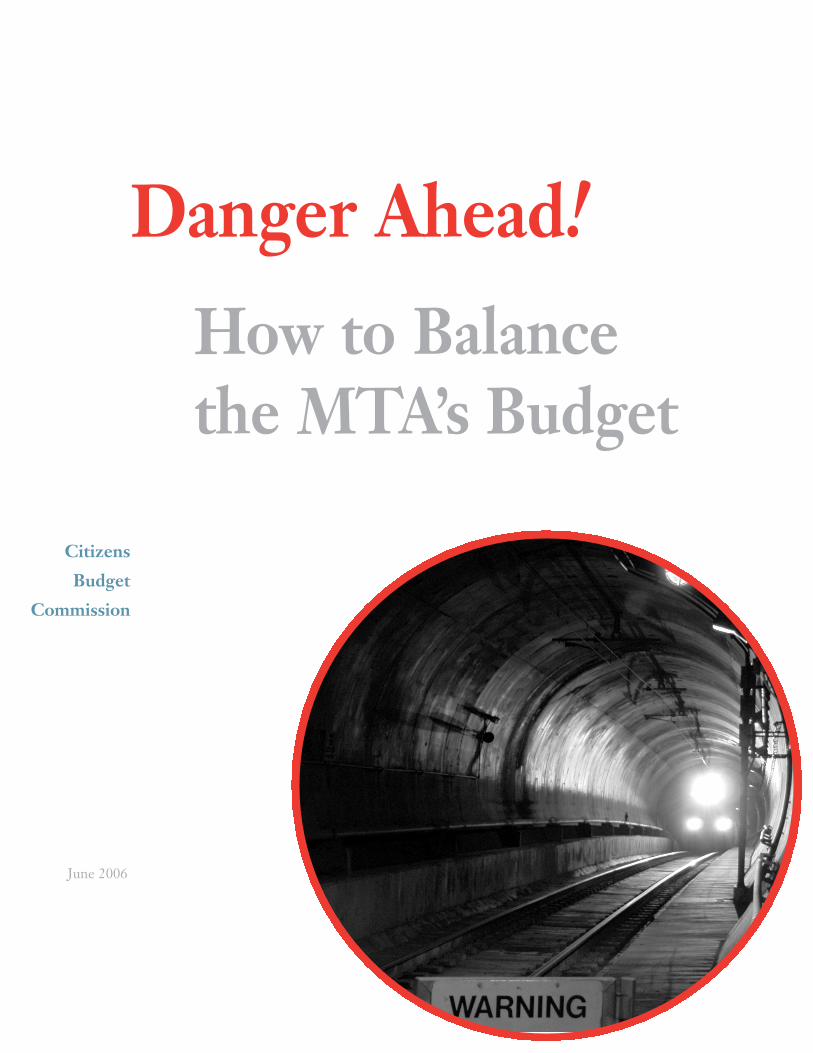
Introduction
New York’s central business district, the 8.5 square miles below 60th Street inManhattan, is one of the largest and densest clusters of economic activity in theworld. This area is critically dependent on an extensive and efficient transportationsystem. The Metropolitan Transportation Authority (MTA) is by far the largestprovider of transportation services in the region. Despite its essential role in sus-taining the New York economy, the MTA is not financed in a consistent or sensi-ble manner.
Specifically, the financing arrangements for the MTA result in:
� Problem 1: Repeated operating deficits
� Problem 2: Capital investments insufficient to bring its facilities to a state of good repair
In order for New York to maintain a strong and vibrant economy, its transporta-tion system has to be kept up to par and expanded to meet future needs. This reportexamines the two problems and suggests alternative financing policies for the MTAthat would balance its operating budget and provide sufficient capital to acceleratethe pace at which its facilities are brought to a state of good repair.
The next section describes the vital role of the MTA in transporting people to theirjobs in New York’s central business district. The following sections explain theMTA’s problems identified above, present the CBC’s guidelines for funding theMTA services in the future, and estimate the agency’s expenditure and revenuerequirements under those guidelines. The final section deals with options for meet-ing revenue requirements by increasing cross subsides from auto users.
How to Balance the MTA’s Budget
3
The Vital Role of the MTA
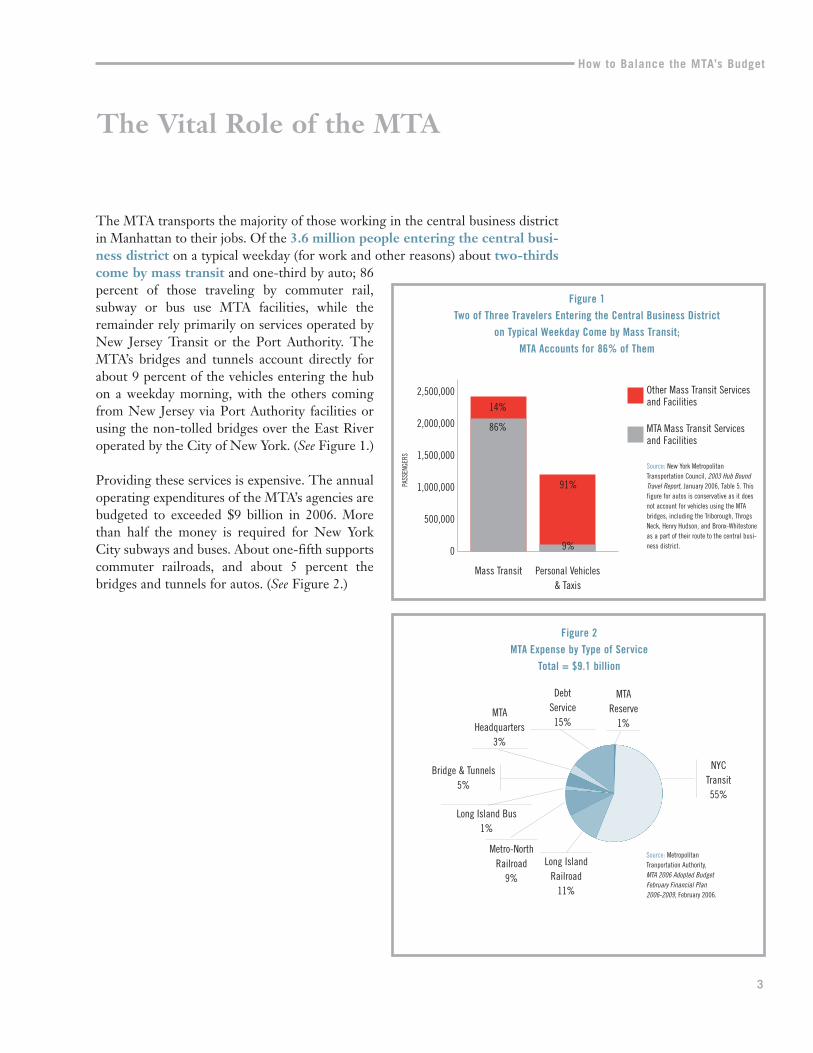
The MTA transports the majority of those working in the central business districtin Manhattan to their jobs. Of the 3.6 million people entering the central busi-ness district on a typical weekday (for work and other reasons) about two-thirdscome by mass transit and one-third by auto; 86percent of those traveling by commuter rail, subway or bus use MTA facilities, while theremainder rely primarily on services operated byNew Jersey Transit or the Port Authority. TheMTA’s bridges and tunnels account directly forabout 9 percent of the vehicles entering the hubon a weekday morning, with the others comingfrom New Jersey via Port Authority facilities orusing the non-tolled bridges over the East Riveroperated by the City of New York. (See Figure 1.)
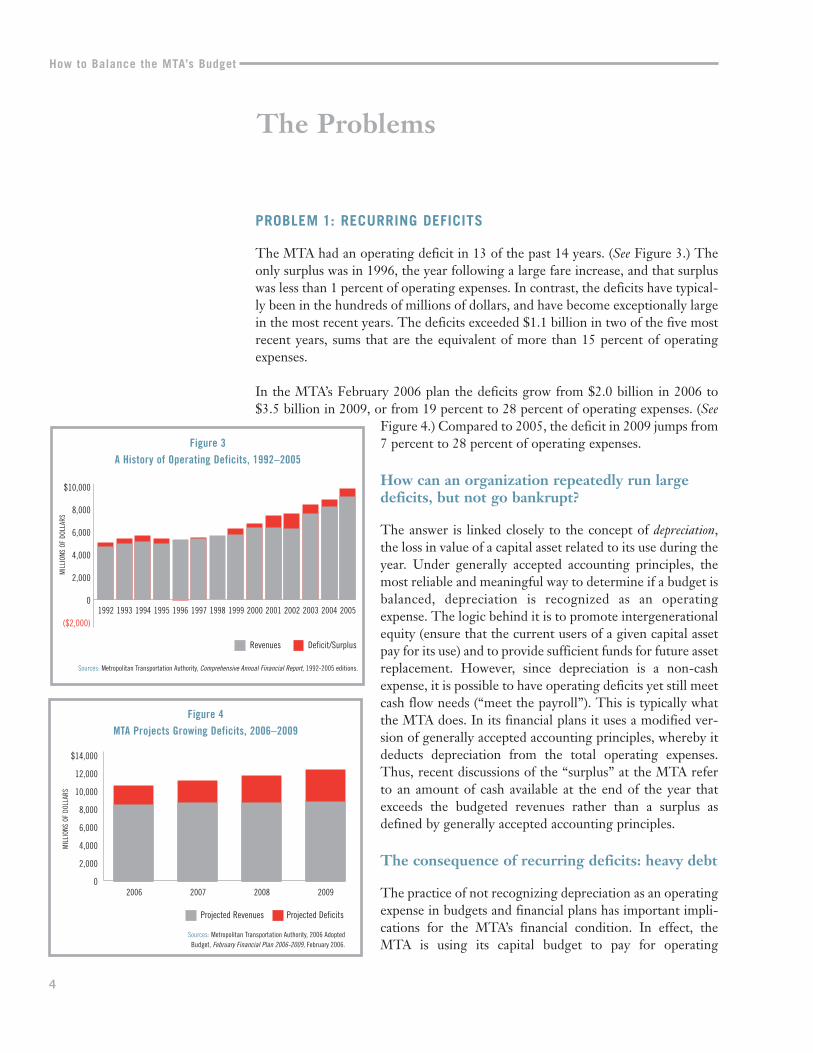
Providing these services is expensive. The annualoperating expenditures of the MTA’s agencies arebudgeted to exceeded $9 billion in 2006. Morethan half the money is required for New YorkCity subways and buses. About one-fifth supportscommuter railroads, and about 5 percent thebridges and tunnels for autos. (See Figure 2.)
2,500,000
2,000,000
1,500,000
1,000,000
500,000
0
14%
86%
91%
9%
Mass Transit Personal Vehicles& Taxis
Other Mass Transit Services and Facilities
MTA Mass Transit Services and Facilities
Source: New York MetropolitanTransportation Council, 2003 Hub BoundTravel Report, January 2006, Table 5. Thisfigure for autos is conservative as it doesnot account for vehicles using the MTAbridges, including the Triborough, ThrogsNeck, Henry Hudson, and Bronx-Whitestoneas a part of their route to the central busi-ness district.
Figure 1Two of Three Travelers Entering the Central Business District
on Typical Weekday Come by Mass Transit;MTA Accounts for 86% of Them
PASS
ENGE
RS
Figure 2MTA Expense by Type of Service
Total = $9.1 billion
MTAReserve
1%
NYCTransit55%
DebtService15%
MTAHeadquarters
3%
Metro-NorthRailroad
9%
Long Island Bus1%
Bridge & Tunnels5%
Long IslandRailroad
11%
Source: MetropolitanTranportation Authority,MTA 2006 Adopted BudgetFebruary Financial Plan2006-2009, February 2006.
How to Balance the MTA’s Budget
4
The Problems
PROBLEM 1: RECURRING DEFICITS
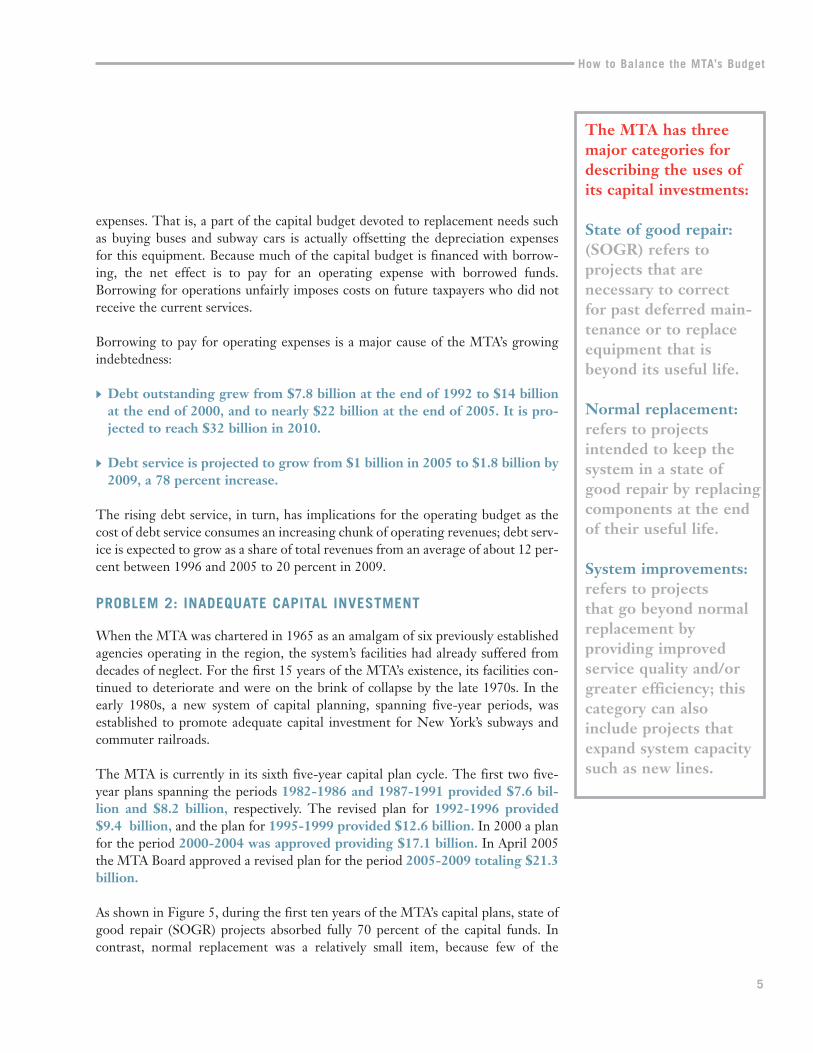
The MTA had an operating deficit in 13 of the past 14 years. (See Figure 3.) Theonly surplus was in 1996, the year following a large fare increase, and that surpluswas less than 1 percent of operating expenses. In contrast, the deficits have typical-ly been in the hundreds of millions of dollars, and have become exceptionally largein the most recent years. The deficits exceeded $1.1 billion in two of the five mostrecent years, sums that are the equivalent of more than 15 percent of operatingexpenses.
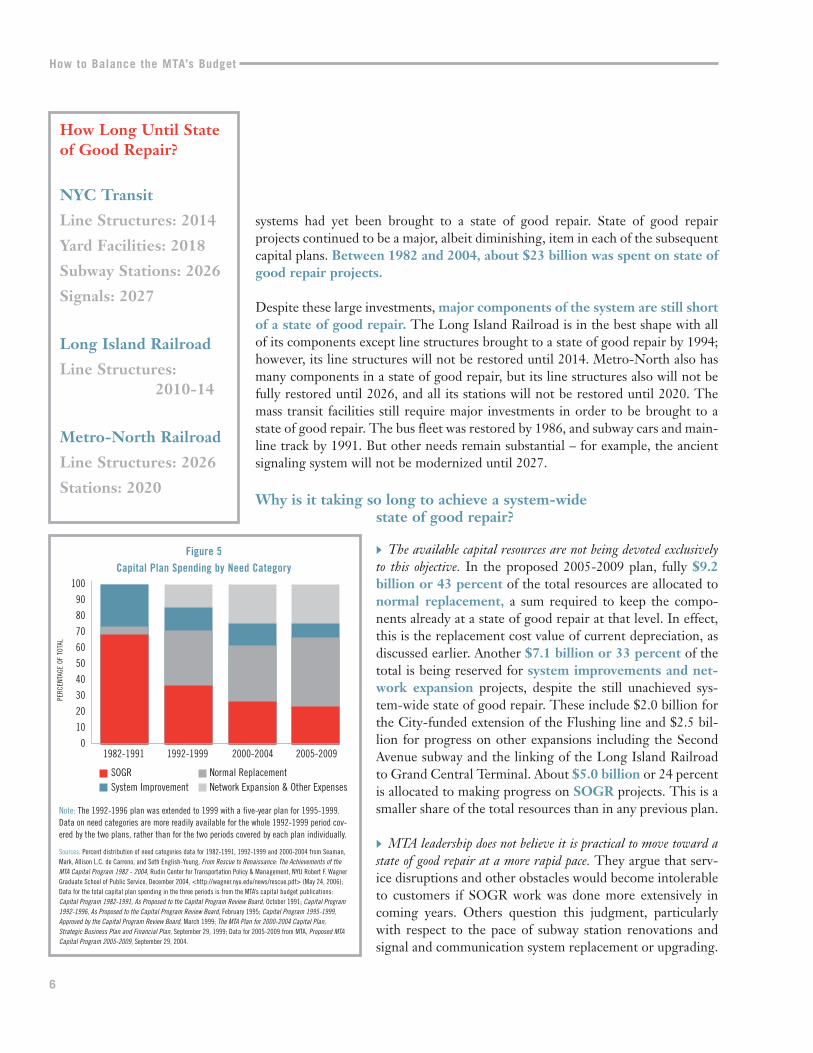
In the MTA’s February 2006 plan the deficits grow from $2.0 billion in 2006 to$3.5 billion in 2009, or from 19 percent to 28 percent of operating expenses. (See
Figure 4.) Compared to 2005, the deficit in 2009 jumps from7 percent to 28 percent of operating expenses.
How can an organization repeatedly run largedeficits, but not go bankrupt?
The answer is linked closely to the concept of depreciation,the loss in value of a capital asset related to its use during theyear. Under generally accepted accounting principles, themost reliable and meaningful way to determine if a budget isbalanced, depreciation is recognized as an operatingexpense. The logic behind it is to promote intergenerationalequity (ensure that the current users of a given capital assetpay for its use) and to provide sufficient funds for future assetreplacement. However, since depreciation is a non-cashexpense, it is possible to have operating deficits yet still meetcash flow needs (“meet the payroll”). This is typically whatthe MTA does. In its financial plans it uses a modified ver-sion of generally accepted accounting principles, whereby itdeducts depreciation from the total operating expenses.Thus, recent discussions of the “surplus” at the MTA referto an amount of cash available at the end of the year thatexceeds the budgeted revenues rather than a surplus asdefined by generally accepted accounting principles.
The consequence of recurring deficits: heavy debt
The practice of not recognizing depreciation as an operatingexpense in budgets and financial plans has important impli-cations for the MTA’s financial condition. In effect, theMTA is using its capital budget to pay for operating
Figure 3A History of Operating Deficits, 1992–2005
$10,000
8,000
6,000
4,000
2,000
0
($2,000)1992 1993 1994 1995 1996 1997 1998 1999 2000 2001 2002 2003 2004 2005
Sources: Metropolitan Transportation Authority, Comprehensive Annual Financial Report, 1992-2005 editions.
Revenues Deficit/Surplus
Figure 4MTA Projects Growing Deficits, 2006–2009
$14,000
12,000
10,000
8,000
6,000
4,000
2,000
02006 2007 2008 2009
Sources: Metropolitan Transportation Authority, 2006 AdoptedBudget, February Financial Plan 2006-2009, February 2006.
Projected Revenues Projected Deficits
MIL
LION
S OF
DOL
LARS
MIL
LION
S OF
DOL
LARS
How to Balance the MTA’s Budget
5
expenses. That is, a part of the capital budget devoted to replacement needs suchas buying buses and subway cars is actually offsetting the depreciation expenses for this equipment. Because much of the capital budget is financed with borrow-ing, the net effect is to pay for an operating expense with borrowed funds.Borrowing for operations unfairly imposes costs on future taxpayers who did notreceive the current services.
Borrowing to pay for operating expenses is a major cause of the MTA’s growingindebtedness:
� Debt outstanding grew from $7.8 billion at the end of 1992 to $14 billionat the end of 2000, and to nearly $22 billion at the end of 2005. It is pro-jected to reach $32 billion in 2010.
� Debt service is projected to grow from $1 billion in 2005 to $1.8 billion by2009, a 78 percent increase.
The rising debt service, in turn, has implications for the operating budget as thecost of debt service consumes an increasing chunk of operating revenues; debt serv-ice is expected to grow as a share of total revenues from an average of about 12 per-cent between 1996 and 2005 to 20 percent in 2009.
PROBLEM 2: INADEQUATE CAPITAL INVESTMENT
When the MTA was chartered in 1965 as an amalgam of six previously establishedagencies operating in the region, the system’s facilities had already suffered fromdecades of neglect. For the first 15 years of the MTA’s existence, its facilities con-tinued to deteriorate and were on the brink of collapse by the late 1970s. In theearly 1980s, a new system of capital planning, spanning five-year periods, wasestablished to promote adequate capital investment for New York’s subways andcommuter railroads.
The MTA is currently in its sixth five-year capital plan cycle. The first two five-year plans spanning the periods 1982-1986 and 1987-1991 provided $7.6 bil-lion and $8.2 billion, respectively. The revised plan for 1992-1996 provided$9.4 billion, and the plan for 1995-1999 provided $12.6 billion. In 2000 a planfor the period 2000-2004 was approved providing $17.1 billion. In April 2005the MTA Board approved a revised plan for the period 2005-2009 totaling $21.3billion.
As shown in Figure 5, during the first ten years of the MTA’s capital plans, state ofgood repair (SOGR) projects absorbed fully 70 percent of the capital funds. In contrast, normal replacement was a relatively small item, because few of the
The MTA has threemajor categories fordescribing the uses ofits capital investments:
State of good repair:(SOGR) refers to projects that are necessary to correct for past deferred main-tenance or to replaceequipment that isbeyond its useful life.
Normal replacement:refers to projectsintended to keep thesystem in a state of good repair by replacingcomponents at the endof their useful life.
System improvements:refers to projects that go beyond normalreplacement by providing improvedservice quality and/orgreater efficiency; thiscategory can alsoinclude projects thatexpand system capacitysuch as new lines.
How to Balance the MTA’s Budget
6
systems had yet been brought to a state of good repair. State of good repair projects continued to be a major, albeit diminishing, item in each of the subsequentcapital plans. Between 1982 and 2004, about $23 billion was spent on state ofgood repair projects.
Despite these large investments, major components of the system are still shortof a state of good repair. The Long Island Railroad is in the best shape with allof its components except line structures brought to a state of good repair by 1994;however, its line structures will not be restored until 2014. Metro-North also hasmany components in a state of good repair, but its line structures also will not befully restored until 2026, and all its stations will not be restored until 2020. Themass transit facilities still require major investments in order to be brought to astate of good repair. The bus fleet was restored by 1986, and subway cars and main-line track by 1991. But other needs remain substantial – for example, the ancientsignaling system will not be modernized until 2027.
Why is it taking so long to achieve a system-wide state of good repair?
� The available capital resources are not being devoted exclusivelyto this objective. In the proposed 2005-2009 plan, fully $9.2billion or 43 percent of the total resources are allocated tonormal replacement, a sum required to keep the compo-nents already at a state of good repair at that level. In effect,this is the replacement cost value of current depreciation, asdiscussed earlier. Another $7.1 billion or 33 percent of thetotal is being reserved for system improvements and net-work expansion projects, despite the still unachieved sys-tem-wide state of good repair. These include $2.0 billion forthe City-funded extension of the Flushing line and $2.5 bil-lion for progress on other expansions including the SecondAvenue subway and the linking of the Long Island Railroadto Grand Central Terminal. About $5.0 billion or 24 percentis allocated to making progress on SOGR projects. This is asmaller share of the total resources than in any previous plan.
� MTA leadership does not believe it is practical to move toward astate of good repair at a more rapid pace. They argue that serv-ice disruptions and other obstacles would become intolerableto customers if SOGR work was done more extensively incoming years. Others question this judgment, particularlywith respect to the pace of subway station renovations andsignal and communication system replacement or upgrading.
How Long Until Stateof Good Repair?
NYC Transit
Line Structures: 2014
Yard Facilities: 2018
Subway Stations: 2026
Signals: 2027
Long Island Railroad
Line Structures: 2010-14
Metro-North Railroad
Line Structures: 2026
Stations: 2020
PERC
ENTA
GE O
F TO
TAL
100
90
80
70
60
50
40
30
20
10
01982-1991 1992-1999 2000-2004 2005-2009
Note: The 1992-1996 plan was extended to 1999 with a five-year plan for 1995-1999.Data on need categories are more readily available for the whole 1992-1999 period cov-ered by the two plans, rather than for the two periods covered by each plan individually.
Sources: Percent distribution of need categories data for 1982-1991, 1992-1999 and 2000-2004 from Seaman,Mark, Allison L.C. de Carreno, and Seth English-Young, From Rescue to Renaissance: The Achievements of theMTA Capital Program 1982 - 2004, Rudin Center for Transportation Policy & Management, NYU Robert F. WagnerGraduate School of Public Service, December 2004, <http://wagner.nyu.edu/news/rescue.pdf> (May 24, 2006);Data for the total capital plan spending in the three periods is from the MTA’s capital budget publications:Capital Program 1982-1991, As Proposed to the Capital Program Review Board, October 1991; Capital Program1992-1996, As Proposed to the Capital Program Review Board, February 1995; Capital Program 1995-1999,Approved by the Capital Program Review Board, March 1999; The MTA Plan for 2000-2004 Capital Plan,Strategic Business Plan and Financial Plan, September 29, 1999; Data for 2005-2009 from MTA, Proposed MTACapital Program 2005-2009, September 29, 2004.
SOGRSystem Improvement
Normal ReplacementNetwork Expansion & Other Expenses
Figure 5Capital Plan Spending by Need Category
How to Balance the MTA’s Budget
7
Guidelines for a Better System
The CBC recommends that all operating expenses including depreciation be cov-ered with operating revenues, and that operating revenues be raised by followingthese four guidelines:
1. The cost of bridge and tunnel facilities should be paid for entirely through user fees paidby motorists. These private goods should be covered in their price, usually in theform of tolls.
2. User fees paid by motorists should also generate a surplus large enough to cover one-quarter of the cost of providing mass transit services. The price for using highways,bridges and tunnels should exceed their cost in order to help compensate for thenegative externalities of auto use. This additional price can be paid directlythrough tolls that more than cover costs and through indirect user charges suchas fuel taxes and motor vehicle fees collected by the state and dedicated to theMTA.
3. Mass transit users should pay fares sufficient to cover one-half the operating cost of thoseservices. Since mass transit provides a combination of private goods and publicgoods, its cost should be divided between user fees (fares) and government subsides. Setting fares at one-half the cost has an inherent appeal of fairness insetting the shares borne by each beneficiary.
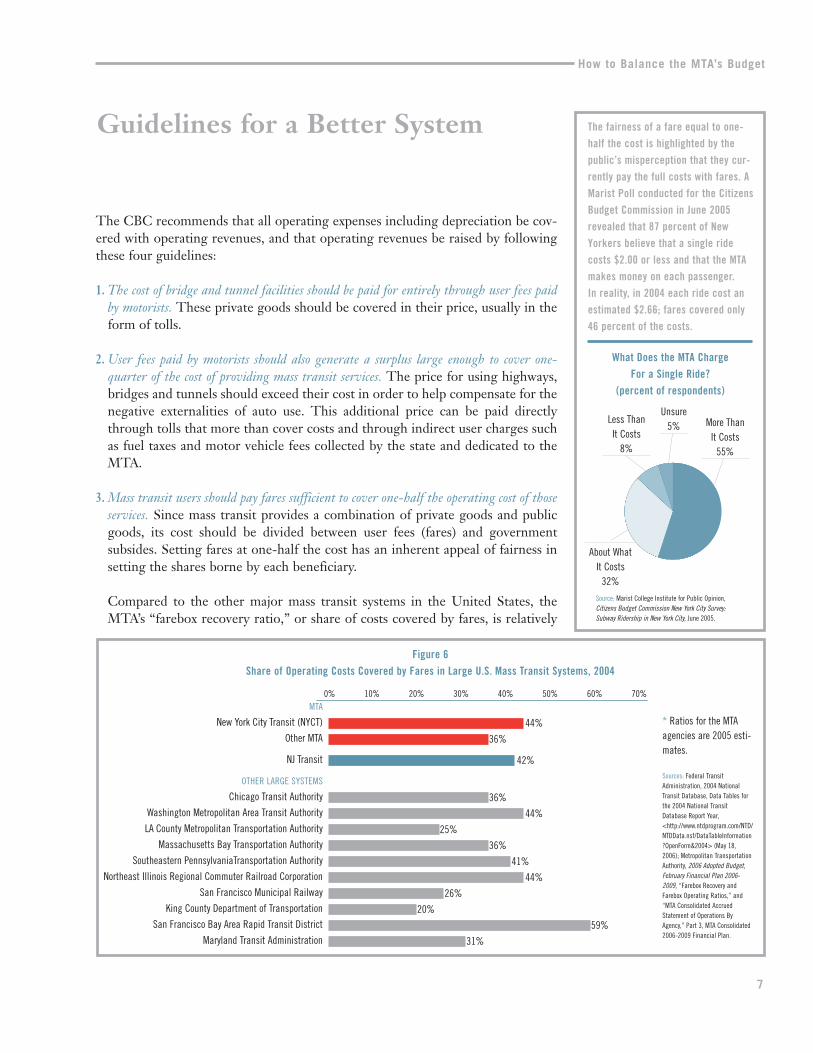
Compared to the other major mass transit systems in the United States, theMTA’s “farebox recovery ratio,” or share of costs covered by fares, is relatively
What Does the MTA ChargeFor a Single Ride?
(percent of respondents)
More ThanIt Costs
55%
Unsure5%
About WhatIt Costs
32%
Less ThanIt Costs
8%
Source: Marist College Institute for Public Opinion,Citizens Budget Commission New York City Survey:Subway Ridership in New York City, June 2005.
The fairness of a fare equal to one-half the cost is highlighted by thepublic’s misperception that they cur-rently pay the full costs with fares. AMarist Poll conducted for the CitizensBudget Commission in June 2005revealed that 87 percent of NewYorkers believe that a single ridecosts $2.00 or less and that the MTAmakes money on each passenger. In reality, in 2004 each ride cost anestimated $2.66; fares covered only46 percent of the costs.
* Ratios for the MTAagencies are 2005 esti-mates.
Sources: Federal TransitAdministration, 2004 NationalTransit Database, Data Tables forthe 2004 National TransitDatabase Report Year,<http://www.ntdprogram.com/NTD/NTDData.nsf/DataTableInformation?OpenForm&2004> (May 18,2006); Metropolitan TransportationAuthority, 2006 Adopted Budget,February Financial Plan 2006-2009, “Farebox Recovery andFarebox Operating Ratios,” and“MTA Consolidated AccruedStatement of Operations ByAgency,” Part 3, MTA Consolidated2006-2009 Financial Plan.
Figure 6Share of Operating Costs Covered by Fares in Large U.S. Mass Transit Systems, 2004
MTA
New York City Transit (NYCT)
Other MTA
NJ Transit
OTHER LARGE SYSTEMS
Chicago Transit Authority
Washington Metropolitan Area Transit Authority
LA County Metropolitan Transportation Authority
Massachusetts Bay Transportation Authority
Southeastern PennsylvaniaTransportation Authority
Northeast Illinois Regional Commuter Railroad Corporation
San Francisco Municipal Railway
King County Department of Transportation
San Francisco Bay Area Rapid Transit District
Maryland Transit Administration
0% 10% 20% 30% 40% 50% 60% 70%
44%
36%
42%
36%
44%
25%
36%
41%
44%
26%
20%
59%
31%
high. As shown in Figure 6, in 2005 it was estimated at 42 percent system-wide,with the figure for the subway and bus lines at 44 percent and the commuter linesand Staten Island service considerably lower. The NJ Transit ratio is also 42 per-cent. The major systems in the United States with a higher ratio are the BARTin San Francisco (59 percent), Washington D.C. Transit Authority (44 percent),and Metra in Chicago (44 percent). However, all other systems combined havean average ratio of 35 percent. Rather than use this statistic to argue against fareincreases in New York, it is best to view New York and other systems with highrecovery ratios as heading in the right direction. The 50 percent target wouldrequire a modest increase in New York and would put the system on a sounderfinancial and managerial footing.
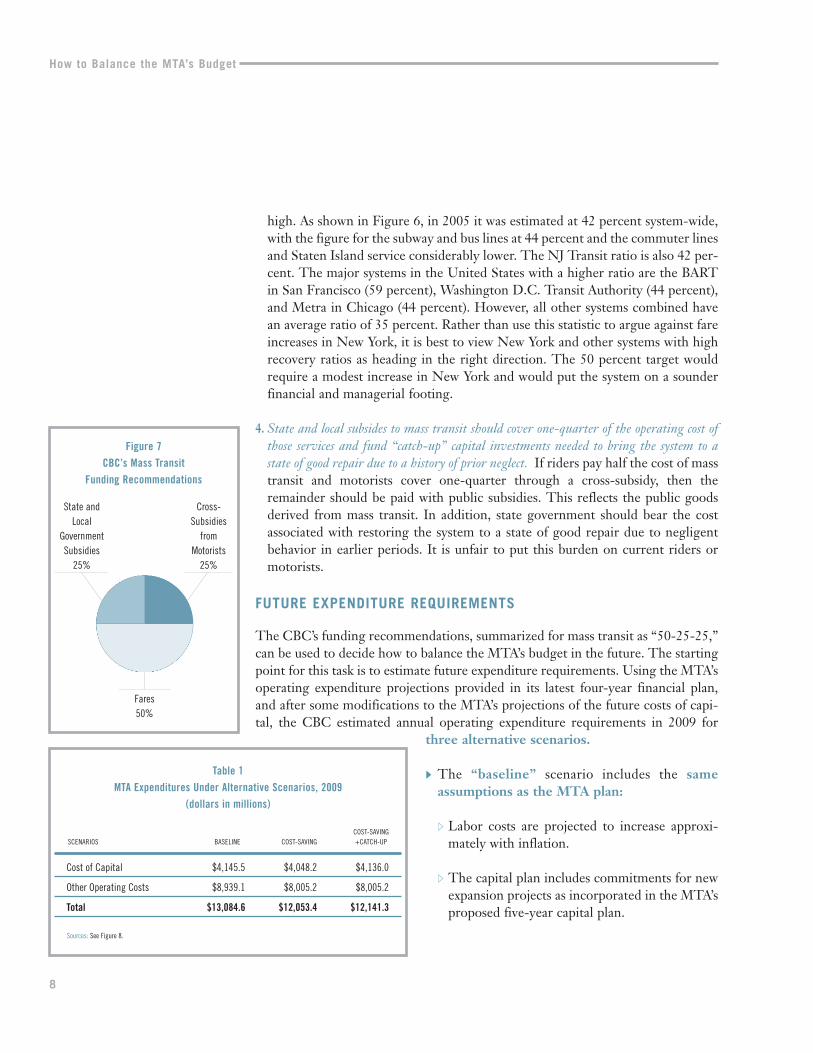
4. State and local subsides to mass transit should cover one-quarter of the operating cost ofthose services and fund “catch-up” capital investments needed to bring the system to astate of good repair due to a history of prior neglect. If riders pay half the cost of masstransit and motorists cover one-quarter through a cross-subsidy, then theremainder should be paid with public subsidies. This reflects the public goodsderived from mass transit. In addition, state government should bear the costassociated with restoring the system to a state of good repair due to negligentbehavior in earlier periods. It is unfair to put this burden on current riders ormotorists.
FUTURE EXPENDITURE REQUIREMENTS
The CBC’s funding recommendations, summarized for mass transit as “50-25-25,”can be used to decide how to balance the MTA’s budget in the future. The startingpoint for this task is to estimate future expenditure requirements. Using the MTA’soperating expenditure projections provided in its latest four-year financial plan,and after some modifications to the MTA’s projections of the future costs of capi-tal, the CBC estimated annual operating expenditure requirements in 2009 for
three alternative scenarios.
� The “baseline” scenario includes the sameassumptions as the MTA plan:
� Labor costs are projected to increase approxi-mately with inflation.
� The capital plan includes commitments for new expansion projects as incorporated in the MTA’sproposed five-year capital plan.
How to Balance the MTA’s Budget
8
Figure 7CBC’s Mass Transit
Funding Recommendations
Cross-Subsidies
fromMotorists
25%
Fares50%
State andLocal
GovernmentSubsidies
25%
Table 1MTA Expenditures Under Alternative Scenarios, 2009
(dollars in millions)
COST-SAVINGSCENARIOS BASELINE COST-SAVING +CATCH-UP
Cost of Capital $4,145.5 $4,048.2 $4,136.0
Other Operating Costs $8,939.1 $8,005.2 $8,005.2
Total $13,084.6 $12,053.4 $12,141.3
Sources: See Figure 8.
How to Balance the MTA’s Budget
9
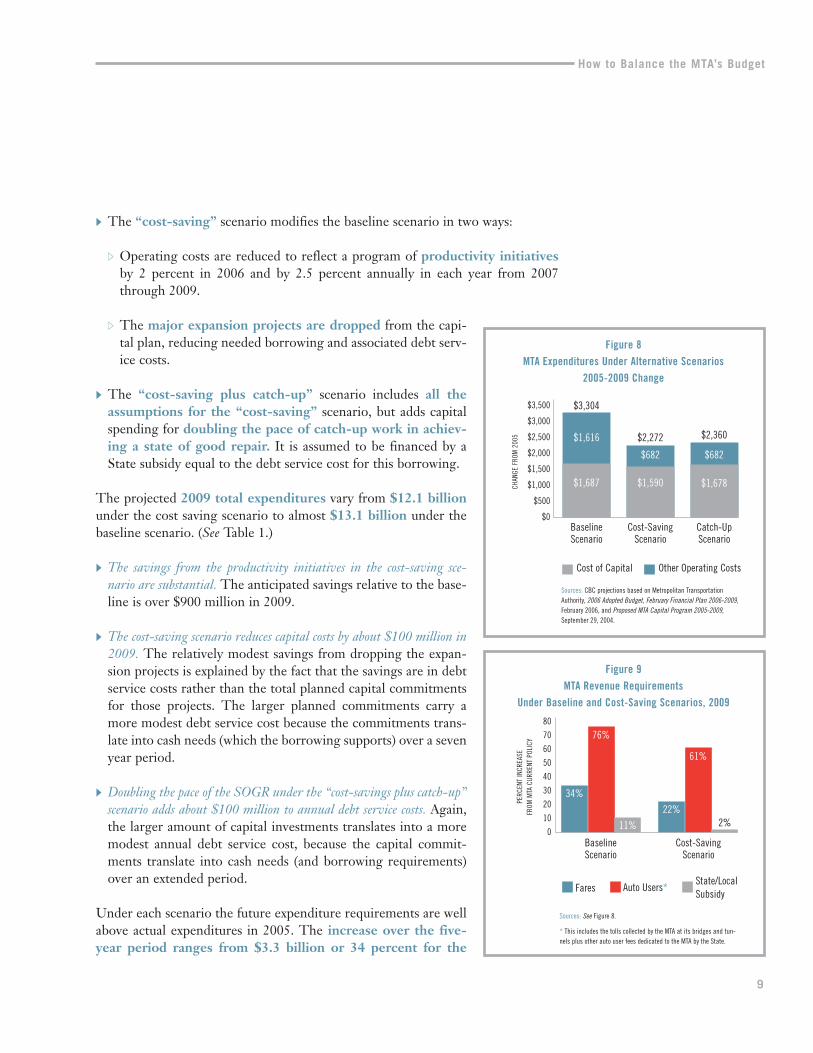
� The “cost-saving” scenario modifies the baseline scenario in two ways:
� Operating costs are reduced to reflect a program of productivity initiativesby 2 percent in 2006 and by 2.5 percent annually in each year from 2007through 2009.
� The major expansion projects are dropped from the capi-tal plan, reducing needed borrowing and associated debt serv-ice costs.
� The “cost-saving plus catch-up” scenario includes all theassumptions for the “cost-saving” scenario, but adds capitalspending for doubling the pace of catch-up work in achiev-ing a state of good repair. It is assumed to be financed by aState subsidy equal to the debt service cost for this borrowing.
The projected 2009 total expenditures vary from $12.1 billionunder the cost saving scenario to almost $13.1 billion under thebaseline scenario. (See Table 1.)
� The savings from the productivity initiatives in the cost-saving sce-nario are substantial. The anticipated savings relative to the base-line is over $900 million in 2009.
� The cost-saving scenario reduces capital costs by about $100 million in2009. The relatively modest savings from dropping the expan-sion projects is explained by the fact that the savings are in debtservice costs rather than the total planned capital commitmentsfor those projects. The larger planned commitments carry amore modest debt service cost because the commitments trans-late into cash needs (which the borrowing supports) over a sevenyear period.
� Doubling the pace of the SOGR under the “cost-savings plus catch-up”scenario adds about $100 million to annual debt service costs. Again,the larger amount of capital investments translates into a moremodest annual debt service cost, because the capital commit-ments translate into cash needs (and borrowing requirements)over an extended period.
Under each scenario the future expenditure requirements are wellabove actual expenditures in 2005. The increase over the five-year period ranges from $3.3 billion or 34 percent for the
Cost of Capital Other Operating Costs
Sources: CBC projections based on Metropolitan TransportationAuthority, 2006 Adopted Budget, February Financial Plan 2006-2009,February 2006, and Proposed MTA Capital Program 2005-2009,September 29, 2004.
Figure 8MTA Expenditures Under Alternative Scenarios
2005-2009 Change
$3,500
$3,000
$2,500
$2,000
$1,500
$1,000
$500
$0CH
ANGE
FRO
M 2
005
Baseline Cost-Saving Catch-UpScenario Scenario Scenario
$3,304
$1,616
$1,687
$2,272
$682
$1,590
$2,360
$682
$1,678
Fares Auto Users*State/LocalSubsidy
Sources: See Figure 8.
* This includes the tolls collected by the MTA at its bridges and tun-nels plus other auto user fees dedicated to the MTA by the State.
Figure 9MTA Revenue Requirements
Under Baseline and Cost-Saving Scenarios, 2009
PERC
ENT
INCR
EASE
FR
OM M
TA C
URRE
NT P
OLIC
Y
Baseline Cost-SavingScenario Scenario
80
70
60
50
40
30
20
10
0
34%
76%
11%
22%
61%
2%
How to Balance the MTA’s Budget
10
baseline scenario to $2.3 billion or 23 percent for the cost-saving scenario.(See Figure 8.) These growing expenditure requirements should be considered rel-ative to likely growth in revenues.
These three scenarios are not recommended policies; rather they are intended toillustrate the fiscal consequences of alternative decisions about operations and cap-ital investments. Moreover, the time frame is also primarily illustrative and not nec-essarily the period in which new financing policies need be implemented. Theguidelines could be phased-in over a longer period in order to ease the transitionfor the multiple stakeholders.
FUTURE REVENUE REQUIREMENTS
Following the CBC’s guidelines would require fare increases of at least 22 percentby 2009, and a small increase in the tax subsidies to the MTA. However, a far larg-er increase, both in absolute amounts and proportionally, would be required in thecross subsidy from auto users.
In the baseline scenario, available revenues fall short of expenditure require-ments by $3.2 billion or nearly a quarter of total projected expenditures. Toclose this gap following the CBC’s guidelines, three basic changes would berequired:
� Fares would have to be increased by about 34 percent. (See Figure 9.) This is anaverage annual increase over the five-year period of about 7.6 percent. If appliedto the monthly Metrocard price, the increase would be from the current $76 toover $102.
� Government tax subsidies would have to increase by $287 million or 11 percent.
� The cross subsidy from auto users would have to more than double; the requiredincrease is nearly $1.5 billion.
Implementing the steps in the cost-saving scenario would reduce the 2009gap by about $1.0 billion, bringing the shortfall to about $2.2 billion. Closingthat gap with the CBC’s recommendations would require:
� Fare increases of about 22 percent, or a monthly Metrocard price of $93.
� Increasing state and local tax subsidies by about 1.5 percent or about $19 millionannually.
� Increasing the cross-subsidy from auto users by 95 percent or $1.3 billion.
How to Balance the MTA’s Budget
11
Options for Increasing The Cross Subsidy from Auto Users
Raising an additional $1.3 billon annually from auto users would not be easy.Currently such a cross-subsidy is provided in four ways:
� “Surplus” revenue from tolls on the MTA’s bridges and tunnels;
� The dedication of a portion of state registration and license fees for motorvehicles to mass transit;
� The dedication of a portion of the state’s motor fueltax to mass transit;
� The dedication of petroleum business taxes tomass transit.
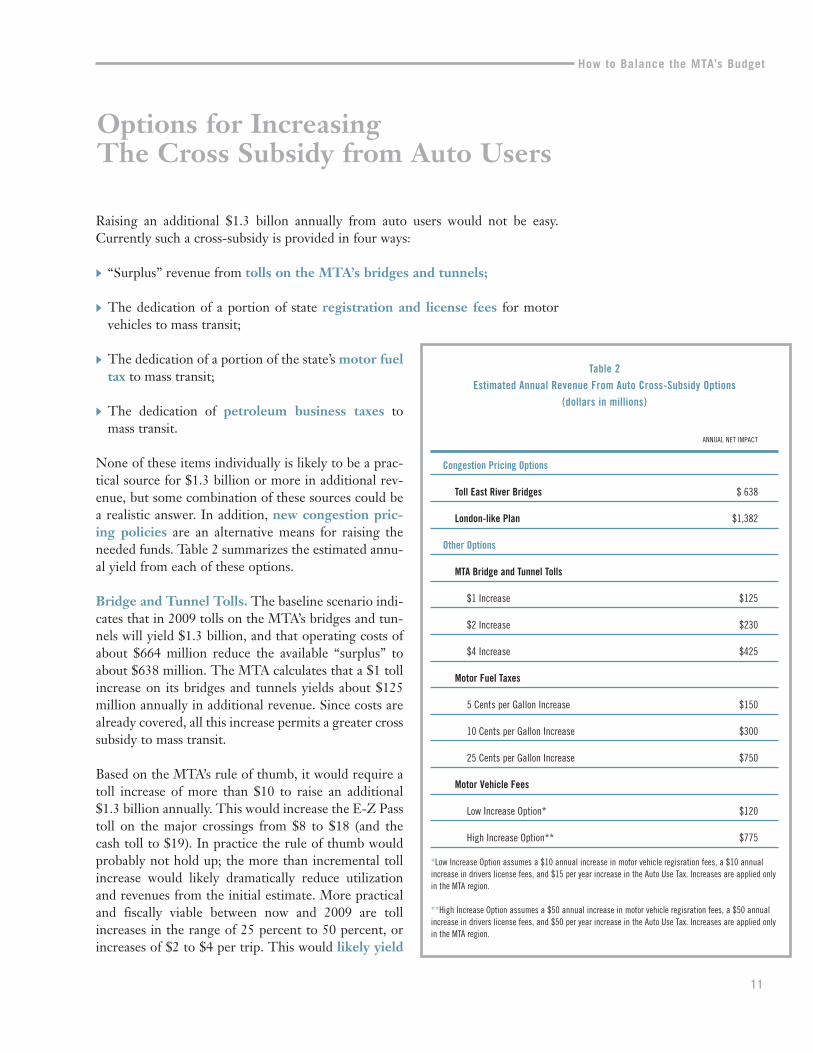
None of these items individually is likely to be a prac-tical source for $1.3 billion or more in additional rev-enue, but some combination of these sources could bea realistic answer. In addition, new congestion pric-ing policies are an alternative means for raising theneeded funds. Table 2 summarizes the estimated annu-al yield from each of these options.
Bridge and Tunnel Tolls. The baseline scenario indi-cates that in 2009 tolls on the MTA’s bridges and tun-nels will yield $1.3 billion, and that operating costs ofabout $664 million reduce the available “surplus” toabout $638 million. The MTA calculates that a $1 tollincrease on its bridges and tunnels yields about $125million annually in additional revenue. Since costs arealready covered, all this increase permits a greater crosssubsidy to mass transit.
Based on the MTA’s rule of thumb, it would require atoll increase of more than $10 to raise an additional$1.3 billion annually. This would increase the E-Z Passtoll on the major crossings from $8 to $18 (and thecash toll to $19). In practice the rule of thumb wouldprobably not hold up; the more than incremental tollincrease would likely dramatically reduce utilizationand revenues from the initial estimate. More practicaland fiscally viable between now and 2009 are tollincreases in the range of 25 percent to 50 percent, orincreases of $2 to $4 per trip. This would likely yield
Table 2Estimated Annual Revenue From Auto Cross-Subsidy Options
(dollars in millions)
ANNUAL NET IMPACT
Congestion Pricing Options
Toll East River Bridges $ 638
London-like Plan $1,382
Other Options
MTA Bridge and Tunnel Tolls
$1 Increase $125
$2 Increase $230
$4 Increase $425
Motor Fuel Taxes
5 Cents per Gallon Increase $150
10 Cents per Gallon Increase $300
25 Cents per Gallon Increase $750
Motor Vehicle Fees
Low Increase Option* $120
High Increase Option** $775
*Low Increase Option assumes a $10 annual increase in motor vehicle regisration fees, a $10 annualincrease in drivers license fees, and $15 per year increase in the Auto Use Tax. Increases are applied onlyin the MTA region.
**High Increase Option assumes a $50 annual increase in motor vehicle regisration fees, a $50 annualincrease in drivers license fees, and $50 per year increase in the Auto Use Tax. Increases are applied onlyin the MTA region.
How to Balance the MTA’s Budget
12
increased annual revenues of about $230 million to $425 million, allowing forsome reduction in volume due to the higher prices.
Motor Vehicle Fees. Owners and drivers of motor vehicles currently pay threedifferent types of fees. State drivers license fees average about $5.40 annually forregular licenses. State vehicle registration fees are based on weight and range from$10 to $56 annually. New York City levies a $15 annual auto use fee, and Nassau,Suffolk, and Westchester counties impose a similar fee of $5.
The Regional Plan Association, based on data relating to licenses and registrationsin 2002, estimated the revenue gains from substantially increasing each of thesefees for owners or drivers in the MTA region. Specifically, they estimated that anauto use tax of $50 annually applied in the region would add $235 million; that anaverage increase of $50 annually in registration fees would raise an additional $260million; and that hiking the average license fee from under $6 annually to $50annually would raise an additional $294 million. The combined yield of thesemeasures, $789 million annually, suggest a maximum revenue figure for higherauto use fees in the coming years. Increases in all three fees of this magnitude arepolitically unlikely and might fall short of the estimate due to resulting changes inownership patterns.
Motor Vehicle Fuel Taxes. The State currently imposes an eight cent per gallontax on motor vehicle fuels. The Regional Plan Association reports that about 3 bil-lion gallons of fuel are sold in the MTA region annually, and they use simple arith-metic to estimate that each one cent increase in that tax region-wide would yield$30 million annually. The Association suggests that an increase of as much as 10cents per gallon might be practical and would yield an estimated $300 millionannually.
The State’s petroleum business tax is applied to a similar, but somewhat broader,base as the motor vehicle fuel tax. Proportionally lower increases in the petroleumbusiness tax rate could, therefore, yield similar amounts. However, the taxing of thebroader base (including certain household and commercial uses of fuel other thanfor motor vehicles) would deviate more from the principle of raising revenue frommotor vehicle use. Thus, if fuel taxes are to be used to help pay for the cross sub-sidy, the motor vehicle tax is the preferable mechanism.
New Congestion Pricing Policies. “Congestion pricing” arrangements imposecharges for access to the central business district by motor vehicles. The primaryintention is to encourage a shift from autos to mass transit for hub-bound trips, butthey can also have the impact of raising new revenue from the auto users who donot shift.
How to Balance the MTA’s Budget
13
In the context of New York City, congestion pricing schemes have two basic vari-ations – East River bridge (ERB) tolls and a London-like arrangement under whicha fee is collected electronically from autos using any of multiple access points (notlimited to bridges and tunnels) to the central business district. Estimating the fis-cal impacts of each plan is difficult, but each has the potential to yield significantnew revenue.
� East River Bridge Tolls. On a typical weekday morning about 213,000 vehiclesenter the central business district via one of four bridges connecting the area toBrooklyn or Queens. These bridges are owned by the City of New York, and notolls are collected on them. One policy option is to begin collecting tolls on thesebridges, presumably at a price equal to that charged for the MTA bridges andtunnels connecting central Manhattan to the other boroughs.
A study by the Regional Plan Association estimates that the new tolling policywould generate $547 million annually from users of the East River bridgesowned by the City and would increase tolls collected at the MTA’s tunnels by$159 million, for a combined increase of $706 million annually. Given the tollincreases of approximately 14 percent (from $7 to $8) in 2005, the future grossrevenue impact is about $805 million annually. After taking into account themaintenance expenses that the MTA would have to assume and the added masstransit expenses resulting from increased ridership, one is left with a more real-istic net revenue gain to the MTA of about $645 million annually.
� London-like Congestion Fees. In 2003 local government in London implemented aprogram of motor vehicle charges (initially of approximately $9, raising it toabout $15 in 2005) for entering the central business district. It has proven to besuccessful at diverting motorists to mass transit (mostly buses) and reducing traf-fic and thereby speeding the route times for buses. It has yielded substantial grossrevenues, but these have been offset by added expenses for the additional busservice and the new collection system.
The Regional Plan association has explored the impacts of establishing aLondon-like system for the New York central business district. The most expan-sive of the congestion pricing options simulated by the Association included tollsat each entry point that were equal to the 2003 MTA tolls (that is, $7) duringdaytime hours but were reduced in the night to $4 and raised during the rushhours to $10. This plan was estimated to produce gross additional revenues ofmore than $1.7 billion annually with about $258 million additional collected atMTA tunnels, $76 million additional at Port Authority tunnels, and nearly $1.4billion in new revenue generated at the new tolled entry points including theEast River bridges.
How to Balance the MTA’s Budget
14
The Association did not estimate the added expenses that would be needed forthis option. The plan is estimated to shift about 60 million trips annually fromautos to mass transit; this can be estimated to generate added costs for these serv-ices of about $110 million annually. The plan also would require investments(which could be amortized) to establish the electronic enforcement system andongoing administrative costs for collecting the fees; based on the London expe-rience these costs can be estimated at about $120 million annually. Finally,because the plan includes tolling the East River bridge entry points, it is reason-able to assume that the previously noted maintenance costs for these bridges(totaling $120 million annually) would have to be covered by the new revenues.After these expenses are taken into account, the net gain from the plan is anestimated $1,382 million annually.
Summary of Options. Of the options, a London-like pricing plan has the great-est appeal. It would have the largest impact in shifting use from motor vehicles tomass transit, and it has the greatest potential for raising new revenue. Sucharrangements require further consideration, but they should be explored seriouslyand, if warranted, pursed promptly. If a congestion pricing plan proves impracticalor requires an extensive period for implementation, other options for raising therecommended revenue are available. A package of measures involving some com-bination toll increases, fuel taxes and higher vehicle fees can be constructed toachieve the revenue targets.
15
CITIZENS
BUDGET
COMMISSION
Founded in 1932, the Citizens Budget Commission (CBC) is a nonpartisan, non-profit civic organization committed to influencing constructive change in thefinances and services of New York State and New York City governments.
This document is a summary of a CBC report, How to Balance the MTA’s Budget,released in June 2006. The report was prepared under the auspices of CBC’sCompetitiveness Committee, co-chaired by Fred Hochberg and David Tanner.The report was prepared under the direction of Charles Brecher, Executive VicePresident and Director of Research at the CBC and a Professor at New YorkUniversity’s Wagner School. Selma Mustovic, Senior Research Associate at theCBC, provided critical research support and helped draft the report. AlexandraSimon, a graduate student at the Wagner School, served as a research assistant forthe project. Eric Rothman and Jean Shia of Hamilton, Rabinovitz & Altschuler,Inc. provided consulting services in the early stages of the project and developedthe model for projecting future revenue requirements. Eric also provided helpfulcomments on preliminary drafts of the report. Selma Mustovic prepared this sum-mary. The full report is available on the Commission’s website, www.cbcny.org.
H. Dale Hemmerdinger, Chairman
Diana Fortuna, President
Charles Brecher, Executive Vice President
Design: Linda Josefowicz
Citizens Budget Commission
One Penn Plaza, Suite 640
New York NY 10119
tel 212.279.2605 fax 212.868.4745
web www.cbcny.org email [email protected]


![Romanism, The Danger Ahead [1887] - By Alonzo J. Grover](https://img.pdfslide.us/doc/110x75/577cd0d51a28ab9e78932837/romanism-the-danger-ahead-1887-by-alonzo-j-grover.jpg)