Embed Size (px)
Citation preview

Danaher Business SystemElliott Major: VP Operations Kollmorgen

2009 Revenue: $11.2B
Employees: 45,000
Sales by Region:
• North America: 51%
• Europe: 23%
• APAC: 17%
• ROW: 9%
Stock Symbol NYSE: DHR
Fast Facts
Danaher Overview
A global, diversified manufacturing corporation dedicated to continuous improvement and customer satisfaction
• Revenue 16% CAGR, four fold growth 1999-2009
• Operating Profit 18% CAGR
• EPS 20% CAGR
• $1.8bn cash flow
• NYSE $25B market cap. 22 p/e
• 18 consecutive years of Free Cash Flow greater than Net income

Danaher Strategic Platforms
A large portfolio of operationally efficient businesses, with industry leading brands, strong growth and high margins.
Medical Technologies
Professional Instrumentation
Industrial Technologies
Tools & Components
Environmental
Medical Technologies
Mechanics Hand Tools
Focused Niche Businesses
Motion
Product Identification
Electronic Testing

DANAHER BUSINESS SYSTEM
ManufacturingManufacturing
PurchasingPurchasing
SalesSales
AdministrationAdministration
Customer Customer
ServiceService
DesignDesign
MarketingMarketing
��������������
The foundation of all Danaher businesses

Kaizen
Kaizen \ki-zen\
• A continuous improvement mindset. Everything that we do today can be improved. Kaizen has no end.
• A team-based continuous improvement process. Utilizes DBS tools to quickly eliminate waste and standardize the resulting sequence of operations.
• Typical Kaizen event is an improvement opportunity identified by policy deployment
• Day 1: 1 to 2 hours of training
• Day 2: Study current situation, brainstorm
• Days 3 & 4: Implement improvement ideas
• Day 5: Standardize new process, report-out
TIME
IMP
RO
VE
ME
NT
K
KK
K
K
K
K
K
K
S
S
S
S
Kaizen… then Standardize!

STRATEGICSTRATEGIC
PLANPLAN
What game areWhat game are
we playing?we playing?
How do we win?How do we win?
POLICYPOLICY
DEPLOYMENTDEPLOYMENT
VALUEVALUE
STREAMSTREAMMAPPINGMAPPING
FOCUS FORFOCUS FOR
OUR KAIZENOUR KAIZEN
EVENTSEVENTS
DAILYDAILY
MANAGEMENTMANAGEMENTKPIKPI’’ss
Where Do We Begin?How To Get Started?

What is Policy Deployment?
A process that facilitates the creation of :
ResultsResults--Oriented Business ProcessesOriented Business Processes
Sustained ImprovementSustained Improvement
Sustained Competitive Advantage in Sustained Competitive Advantage in
Quality, Delivery, Cost and InnovationQuality, Delivery, Cost and Innovation
With
That Result In
Policy deployment is how we execute our strategic plan

Imp
rovem
en
t
DailyMgmt
DailyMgmt
KAIZEN
Year 0 Year 1 Year 2 Year 3 Year 4
DailyMgmt
DailyMgmt
DailyMgmt
KAIZEN
KAIZEN
Strategic Objective is Achieved!
Strategic Objective is Achieved!
To Build Sustainable Competitive AdvantageTo Build Sustainable Competitive Advantage
Policy
Deployment
Policy
Deployment
Policy
Deployment
Why Use Policy Deployment?

KeyLeaders
Front LineAssociates
Breakthrough(PD)
Daily
Management(KPIs)
Kaizen
How Should You Spend Your Time?
What Does Policy DeploymentMean To Leaders?
% of time spent

PD Matrix
� � Implement a two bin kanban process � � � �
� Implement a forecasting process � � � �
� Develop low cost region sourcing capability � � �
� Develop rapid prototype process � � � �
� Implement sales funnel process � � � � �
Working captital from
$12M to $8M
OTD from
75%
to 89%
Operating profit from
6% to 9%
Grow revenue from
$12M to $28M
Increase avg # of sales calls per month per FSE from
15 to 30
Increase # of prototypes orders from
40 to 90
Increase new
production orders from
$3M
to $7M
Avg # of days to quote from
27 to 7
Avg # of days to deliver prototype from
39 to 5
% of m
aterial cost from LCR supplier from
0 - 18%
# of lines shipped to customer request from
75%
to 88%
% of A
& B parts on kanban from
0 - 30%
Tom
- Sales Manager
Karen - Customer Service Manager
Cory - VP Engineering
Kelly - Purchasing Manager
Ted - VP HR
Robin - VP Operations
� Grow revenue from $12M to $80M
� Expand operating profit from 6% to 15% � Primary Responsibility
� Improve OTD from 75% to 93% � Secondary Responsibility
� Working capital from $12M to $9M
Resources
Andrew - President
Top Level Improvement
Priorities
3-5 Year
Breakthrough Objectives
Annual Policy
Breakthrough
Objectives
Target to
Improve
What How Much Who
HowFar
How

What Is A 3-5 Year Breakthrough?
� Represents SIGNIFICANT change in PROCESS improvement, as seen through the eyes of the customer
� Requires the organization to stretch itself
� Usually, no standard or system exists for this level of breakthrough
� Can be characterized as a “Big Win”
Q Improve grade of service for call center from 72% to 99% in 3 years
D Improve OTD to customer request date from 80% to 98% in 3 years
C Increase operating profit 25% in 3 years
I Grow product line A sales +300% in 3 years
Aim High Because …� Customers demand it (continually rising expectations)
� Competitors aren’t standing still
� Requires you to change paradigms
Less is more: focus on critical few
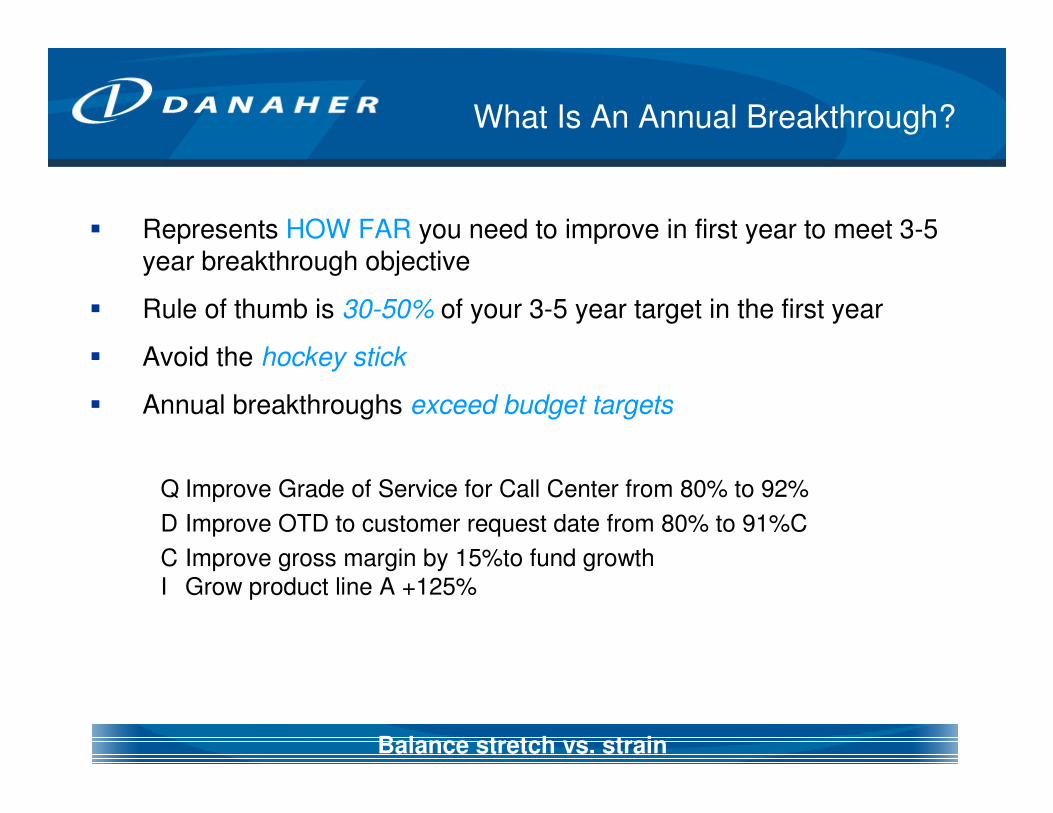
What Is An Annual Breakthrough?
� Represents HOW FAR you need to improve in first year to meet 3-5 year breakthrough objective
� Rule of thumb is 30-50% of your 3-5 year target in the first year
� Avoid the hockey stick
� Annual breakthroughs exceed budget targets
Q Improve Grade of Service for Call Center from 80% to 92%
D Improve OTD to customer request date from 80% to 91%C
C Improve gross margin by 15%to fund growthI Grow product line A +125%
Balance stretch vs. strain

What Is A Top Level Improvement Priority?
� Process oriented
� Should lead to the creation of sustainable, results-oriented processes… not short-term tasks
� Focused
� Meets Current or Emerging Customer Needs
� Limited to the Critical Few
� Measurable� Process must be something that can be measured� But not a Measure itself
Q Implement Standard Work and Daily Management in Call Center
D Lean Conversion of Targeted Global Sites
C Implement material sourcing process to drive gross marginI Drive Accelerated Product Development Process for Co-Developed Products
Answers the question “How do we accomplish our annual breakthrough objective?”

What Is A Target To Improve?
� Can be broken down into monthly progress increments
� Exceeds budget targets
� Measures results, rather than action plan milestones
� Is easy to calculate and communicate
Q Improve phone answer speed from 45sec to 20sec by 12/31
D Past Due from 4 days to 0.5 day by 06/30
C GM from 23.5% to 32.3% by 12/31
I Drive product line A sales of $8M by EOY
Measures of effectiveness of the process: how much & by when

PD Reminders
1. PD drives implementation of the strategy
2. PD is not the same as Daily Management
3. PD is for breakthroughs you won’t know how to achieve
4. PD targets should always exceed budgets, maintain that stretch
5. Today’s breakthrough is tomorrow’s KPI
6. PD drives processes, not project management
7. Quality, not Quantity. You are asking an organization to do difficult and important work. Calibration is key. Have to focus on the critical few. Don’t bite off too much.

Mar-
90
Mar-
91
Mar-
92
Mar-
93
Mar-
94
Mar-
95
Mar-
96
Mar-
97
Mar-
98
Mar-
99
Mar-
00
Mar-
01
Mar-
02
Mar-
03
Mar-
04
Mar-
05
Mar-
06
Mar-
07
Mar-
08
Mar-
09
Mar-
10
DHR
S&P 500
Mar-
90
Mar-
91
Mar-
92
Mar-
93
Mar-
94
Mar-
95
Mar-
96
Mar-
97
Mar-
98
Mar-
99
Mar-
00
Mar-
01
Mar-
02
Mar-
03
Mar-
04
Mar-
05
Mar-
06
Mar-
07
Mar-
08
Mar-
09
Mar-
10
DHR
S&P 500
20 YEAR TSRDHR vs. S&P 500
DHR +4,295%S&P 500 +425%Difference +3,870%
CNBC’s highest performing stock in past 20 years (1989-2009) with 2,500% growth
Further reading on PD: Hoshin Kanri•Industry Week (October 2007): Strategic Deployment: How To Think Like Toyota
•Manufacturing Engineering (Mar 2006) Strategy Deployment: Linking Lean to Business Strategy
•Quality Digest (May 1997): Strategic Planning With the Hoshin Process
•Hoshin Kanri - The Strategic Approach to Continuous Improvement by David Hutchins, Gower publishing, 2008
•Hoshin Kanri for the Lean Enterprise: Developing Competitive Capabilities and Managing Profit by Thomas L. Jackson, Productivity Press, 2006


![ROBERT JAMES ELLIOTT CURRICULUM VITAE CITIZENSHIP ...haskayne.ucalgary.ca/.../robert-elliott-cv.pdf · R.J. Elliott – CV [September, 2006 - Page 1] ROBERT JAMES ELLIOTT CURRICULUM](https://img.pdfslide.us/doc/110x75/5fdc51cfa239fb15507e657b/robert-james-elliott-curriculum-vitae-citizenship-rj-elliott-a-cv-september.jpg)