Embed Size (px)
Citation preview
Dan Spratt, MDDepartment of Radiation Oncology
Neuroendocrine Prostate Cancer: FDG-PET and Targeted Molecular Imaging

Purpose
• Fluorodeoxyglucose (FDG) positron emission tomography (PET) has well-characterized limitations in prostate adenocarcinoma (PCA).
• However, data assessing the utility of PET in NEPC is limited to isolated case reports. Herein, we describe the first case series to assess the utility of FDG-PET in NEPC.
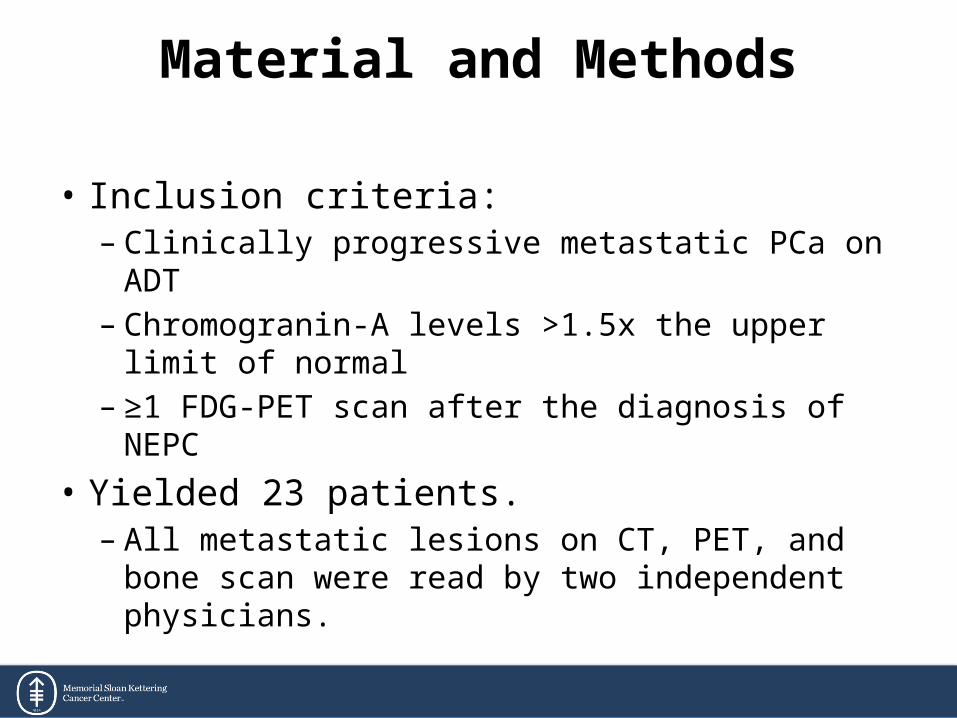
Material and Methods
• Inclusion criteria:– Clinically progressive metastatic PCa on ADT– Chromogranin-A levels >1.5x the upper limit of
normal– ≥1 FDG-PET scan after the diagnosis of NEPC
• Yielded 23 patients. – All metastatic lesions on CT, PET, and bone scan
were read by two independent physicians.

Prostate Adenocarcinoma DetailsBaseline Characteristics
Variable N %Clinical T-stage T1 8 34.8 T2 7 30.4 T3 5 21.7 T4 2 8.7 NA 1 4.3Biopsy Gleason Score
≤6 1 4.37.0 4 17.4
8-10 17 73.9NA 1 4.3
Pre-treatment PSA (ng/mL)Median 11.7Range 1.1-100.0
Metastases at diagnosis 11.0 47.8Treatment of adenocarcinoma Radiotherapy 7 30.4 Prostatectomy 6 26.1 Primary ADT 10 43.5Radiotherapy details* EBRT alone 5 21.7 EBRT + brachytherapy 2 8.7 NeoADT 5 21.7Surgery details (n=6)
pathologic t-stage T3 6 26.1pathologic n-stage N0 2 8.7
N1 4 17.4Salvage EBRT 2 8.7

Variable N %Method of initial diagnosis
Biopsy 2 8.7Elevated CrA 21 91.3
Initial CrA levelMedian 110.0Mean 130.5Range 30.0-442.0
Highest CrA levelMedian 142.0Mean 170.9Range 88.0-444.0
Number of FDG-PET scans after NEPC diagnosis
Median 2Range 1-9
Extent of disease 0-5 sites 6 26.1 6-25 sites 8 34.8 26-50 sites 6 26.1 50-110 sites 3 13.0
Neuroendocrine Prostate Cancer DetailsCharacteristics

Results
• Results: – 592 unique lesions were identified across all imaging
modalities• 510 were bone metastases• 82 were soft tissue metastases.
– Of bone lesions, 22.2%, 92.7%, and 77.6% were detected by PET, CT, and bone scan, respectively.
– Of soft tissue lesions, 95.1% and 97.5% were detected by PET and CT, respectively.
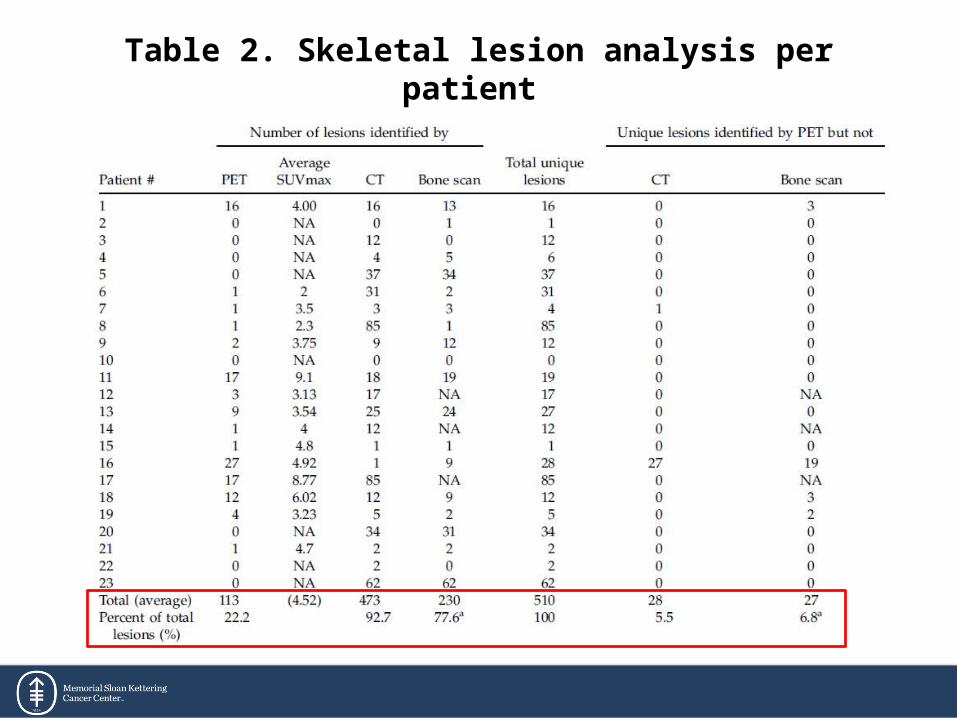
Table 2. Skeletal lesion analysis per patient
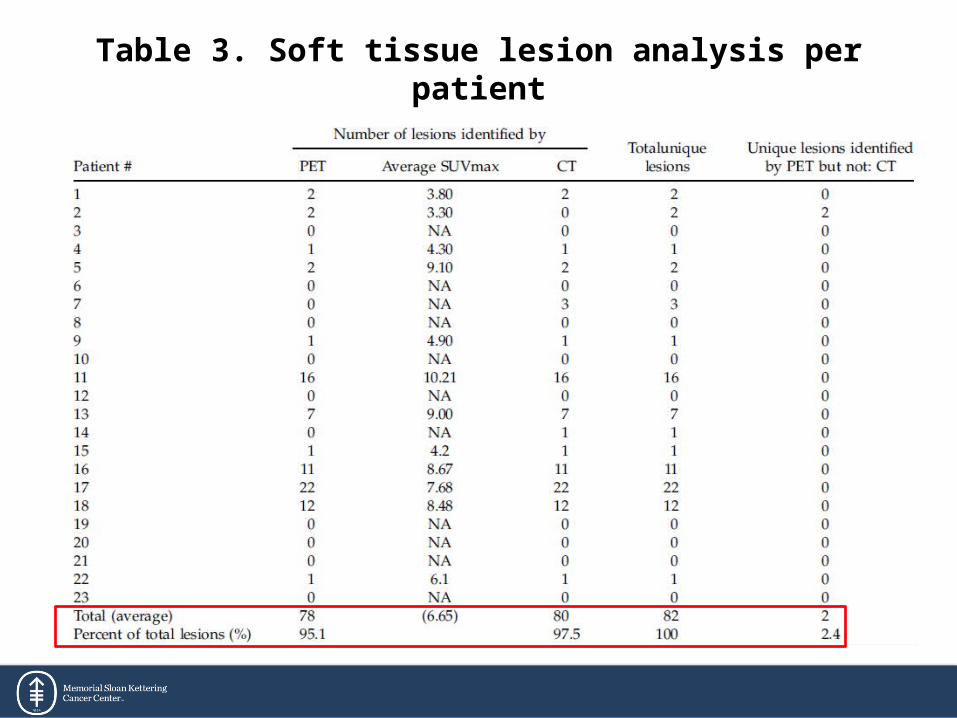
Table 3. Soft tissue lesion analysis per patient

Results
• Results: – Stratified by the median survival from NEPC
diagnosis (2.2 years):• Patients who survived <2.2 vs. ≥2.2 years had more PET
avid bone (8 vs. 2) and soft tissue lesions (7 vs. 1, p=0.01)• Also had higher average SUVmax of bone (5.49 vs. 3.40,
p=0.04) and soft tissue lesions (8.02 vs. 3.90, p=0.0002).
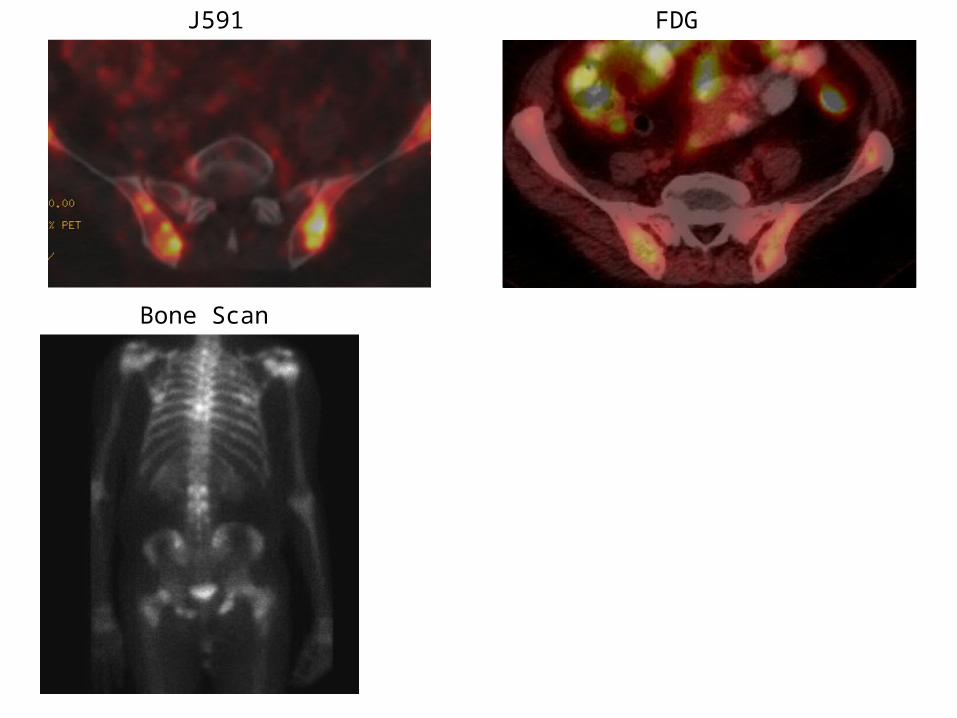
J591 FDG
Bone Scan
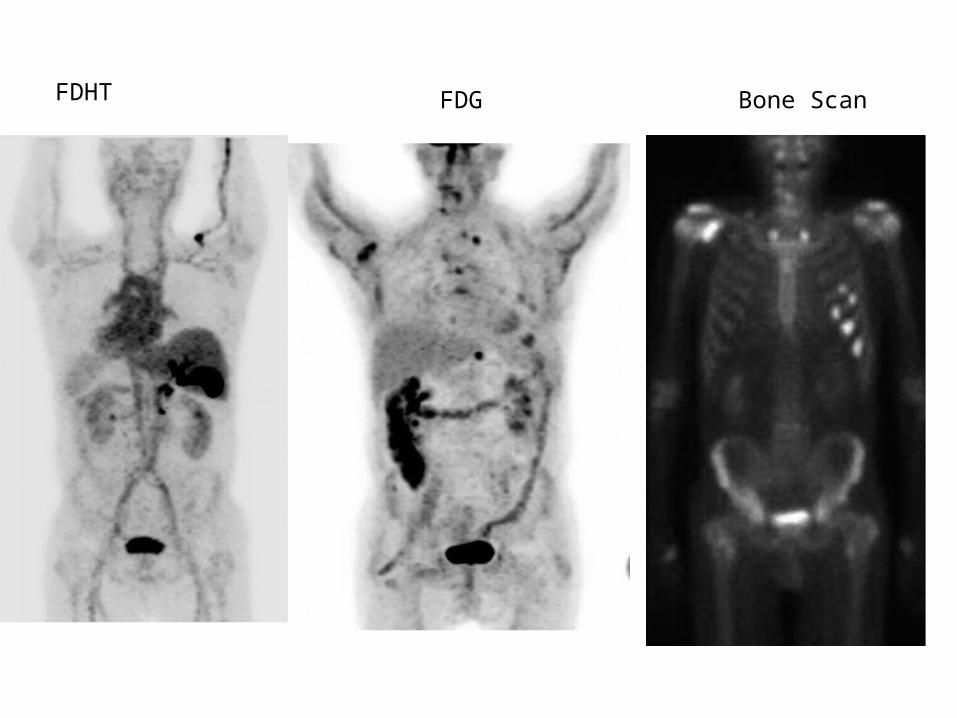
FDHT FDG Bone Scan
• In patients with clinical NEPC, we demonstrate that FDG-PET has clinical utility in the detection of metastatic disease, primary soft tissue disease.
• 89Zr-J591 and 18F-DHT may have clinical utility in characterizing NEPC vs adenoCa
• With novel therapies on the horizon to treat NEPC, consideration to investigate the use of FDG-PET to monitor response is warranted.
Conclusions

![FDG-PET in Large Vessel Vasculitis...FDG-PET in Large Vessel Vasculitis 61 5. [18 F]FDG-PET and [18 F]FDG-PET/CT [18 F]FDG-PET is an operator-independent, non- invasive imaging modality](https://img.pdfslide.us/doc/110x75/5f6c13132f0609183b646bce/fdg-pet-in-large-vessel-vasculitis-fdg-pet-in-large-vessel-vasculitis-61-5.jpg)