Embed Size (px)
Citation preview
XXVIIKonferencja
Naukowo-Technicznaawarie budowlane 2015
DAMAGE OF CONCRETE STRUCTURES DUE TO AGING
Joost Walraven
Delft University of Technology, The Netherlands
Keywords: aging infrastructure, corrosion of concrete, alkali aggregate reaction, carbonation, chloride
penetration, life prediction of structures.
1. Introduction
For many decades concrete structures have been designed for predominantly two criteria:
structural safety and serviceability. There was no doubt about the service life of structures. The
observation of substantial damage to concrete structures developing in time due to deterioration
processes became however gradually a point of large concern, predominantly because structural
safety of structures turned out to be endangered. In the new fib-Model Code for Concrete
Structures 2010 design for service life is a central issue. According to this principle structures
are designed to satisfy the demands for safety and serviceability for a specified period of time.
Structures serving the infrastructure of a country, like tunnels and bridges, are mostly designed
for a low maintenance service life of 100 years. In structures like buildings and offices the
functional service life is often the governing criterion, so that a physical service life of 50 years
is most often required. Nowadays we dispose about considerable knowledge with regard to
deterioration processes, and we are able to design our new structures for service life by making
sure that we use the right materials, that the concrete cover is sufficient and that the cracks are
well controlled. We dispose of adequate quality control procedures for the material concrete
and its constituents to avoid unforeseen problems like alkali aggregate reaction.
A problem which is left, however, is that most of the existing structures have not been
designed based on service life considerations. The actual structural safety of those structures
is a point of concern. If the actual safety turns out to be sufficient, the question is for how long
this is guaranteed. That this uncertainty is justified is often illustrated by unexpected and
unwanted surprises, like the collapse of gallery slabs in an apartment building in Leeuwarden,
the Netherlands, 2012, Fig. 1
Fig. 1. Unannounced collapse of gallery plates in an apartment building in Leeuwarden,
The Netherlands, 2013
132 Damage of concrete structures due to aging
The collapse turned out to be caused by corroded reinforcement. A remarkable observation
was that the structure fulfilled the code criteria of today. There were no cracks and no signs of
upcoming problems due to for instance spalling of the concrete cover. That illustrates that
obviously our knowledge about deterioration processes is not yet good enough. In this paper
it is argued that we meanwhile know a lot about deterioration, but as well that crucial
knowledge is missing.
2. Important deterioration mechanisms endangering structural safety in time
2.1. Alkali aggregate reaction
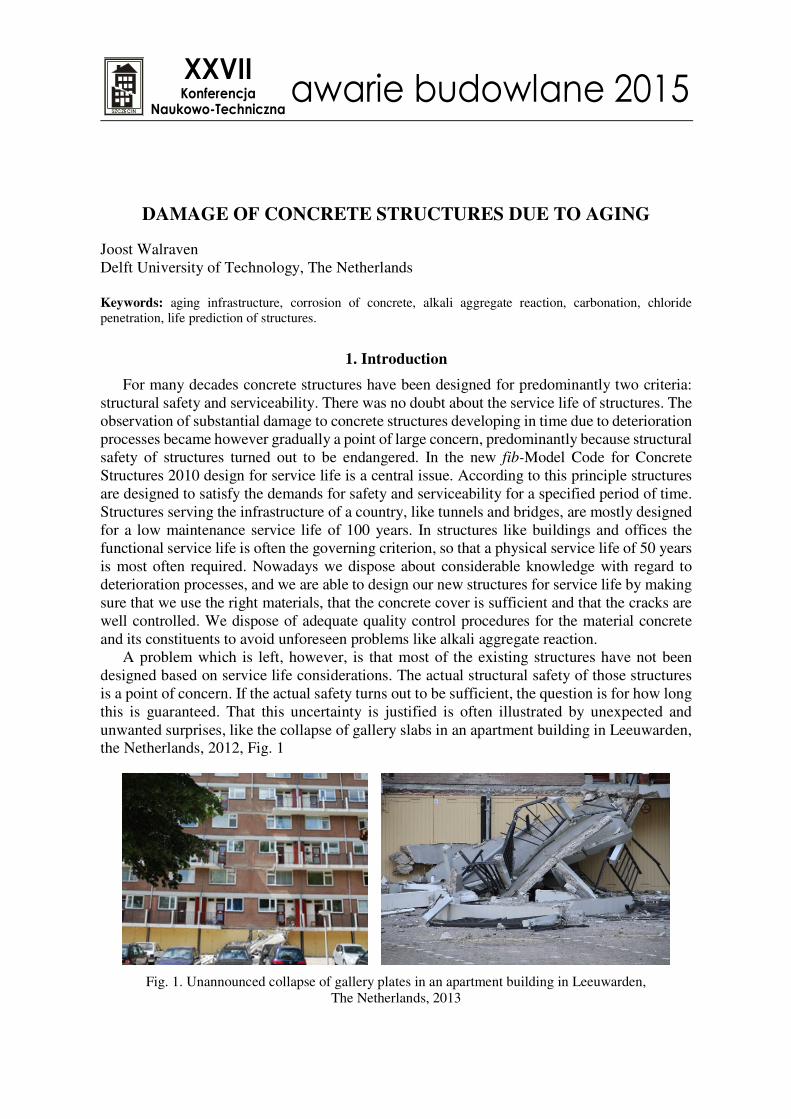
Fig. 2 a. Part of a bridge structure attacked by alkali aggregate reaction, b. Physical reaction leading to
expansion of the concrete
Alkali aggregate reaction (AAR) is an internal chemical reaction between the alkaline compo-
nents in the cement and certain active mineral constituents in some aggregates. AAR reactions are
subdivided into alkali silica (ASR) and the alkali-carbonate (ACR) reactions. However, ASR is
more widespread, and is more harmful to the mechanical properties of concrete. ASR is an internal
chemical reaction between the alkaline components in the cement and active silica-based
constituents of some aggregates. The reaction results in the formation of a gel that absorbs water,
and therefore exerts internal pressure which sometimes can be far in excess of what concrete can
sustain, thereby causing the formation of microcracks. There are three main components necessary
to facilitate ASR, namely: sufficient alkalis in the pore solution, a critical amount of reactive
material phases in the aggregate particles, and sufficient moisture.
An important phenomenon is the effect of restraint of the concrete swelling by reinfor-
cement. Fig. 2a shows that the cracks in the beam tend to develop in the horizontal direction.
The reason is that that in the axial direction the longitudinal reinforcement counteracts the
swelling and in this way generates a type of prestressing. In the vertical direction often no or
limited reinforcement is present, so that the expansion can develop freely, resulting in horizontal
crack formation. These cracks may reduce the shear capacity of the bridge [1].
2.2. Carbonation
Due to carbonation the protective function of the depassivation layer on the reinforcing
steel is destroyed due to the penetration of CO2 which increases the probability of rusting of
the reinforcing steel. The three stages in the carbonation process are:
– Diffusion of CO2 through the capillary pores,
Referaty plenarne 133
– Dissolution of CO2 in the water film at the pore wall: CO2 +H2O →H2CO3.
– Neutralization of Ca(OH)2 +H2CO3 → CaCO3 + H2O,
Due to the carbonation process the pH of the concrete reduces from about 13 to a value of
8–9. If there is sufficient oxygen and moisture the corrosion process can start.
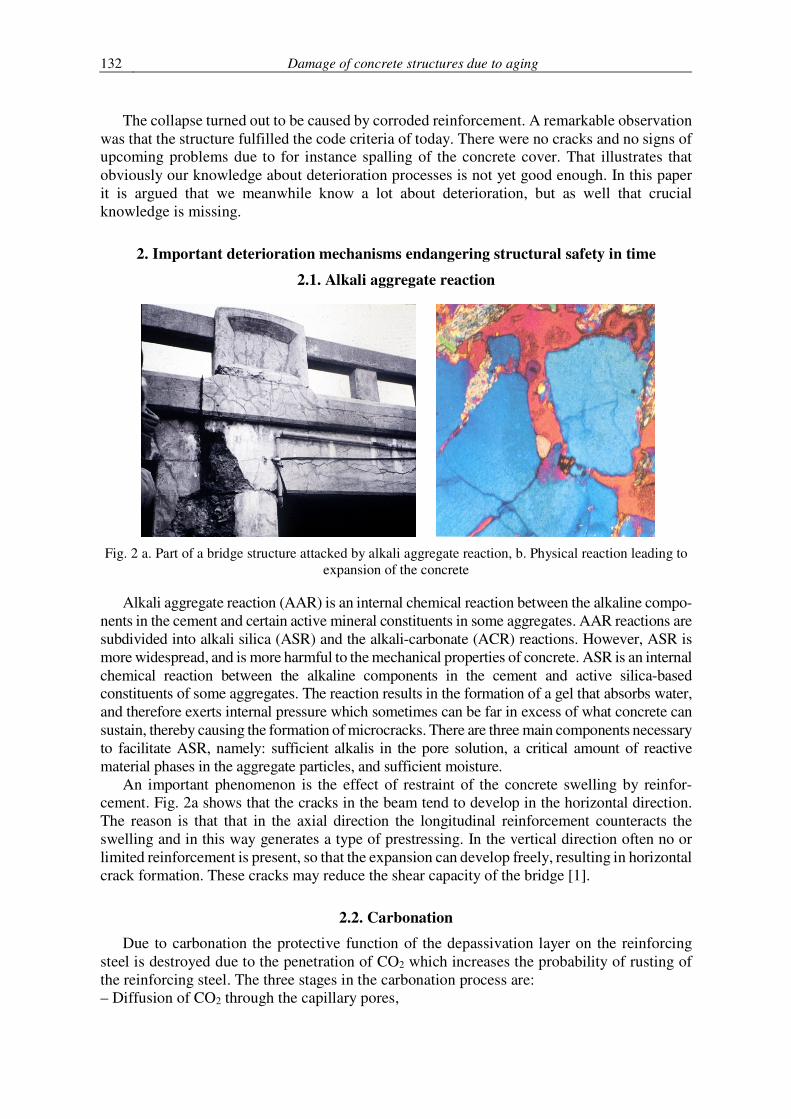
The largest probability that corrosion occurs is in areas which are outside but shut, with
limited moisture variations. In that case there is fast CO2 penetration, but as well supply of
water. This situation occurs in the area A in Fig. 3b.
Fig. 3. a) Reinforcement corrosion due to carbonation of concrete in a column, b) Carbonation process
leading to corrosion of reinforcing bars
2.3. Chloride penetration
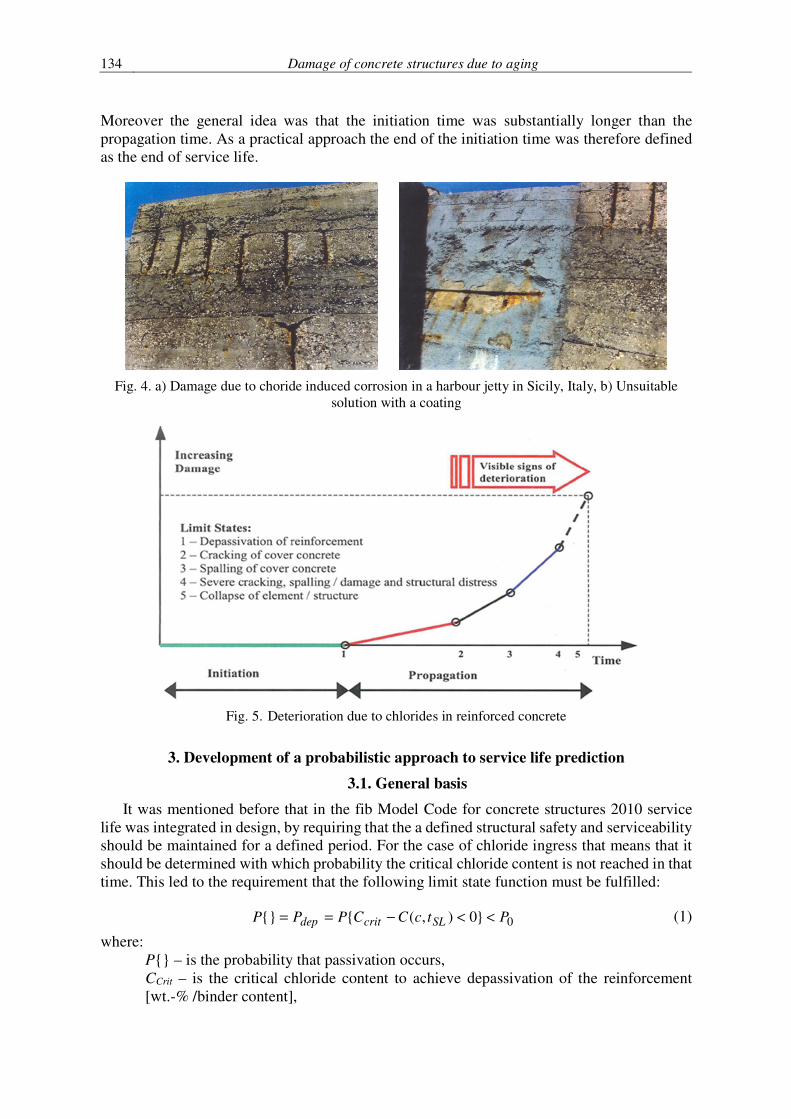
Chloride induced corrosion is by far the most important cause for deterioration and as such
reduction of structural safety in time. If the concrete cover is too small and the concrete quality
too low, chlorides penetrate until the reinforcement. Corrosion starts as the chloride
concentration at the reinforcement has reached a limit value. Fig. 4 shows the result of such a
process and a desperate attempt to stop it by applying a coating (Fig. 4 right), which was
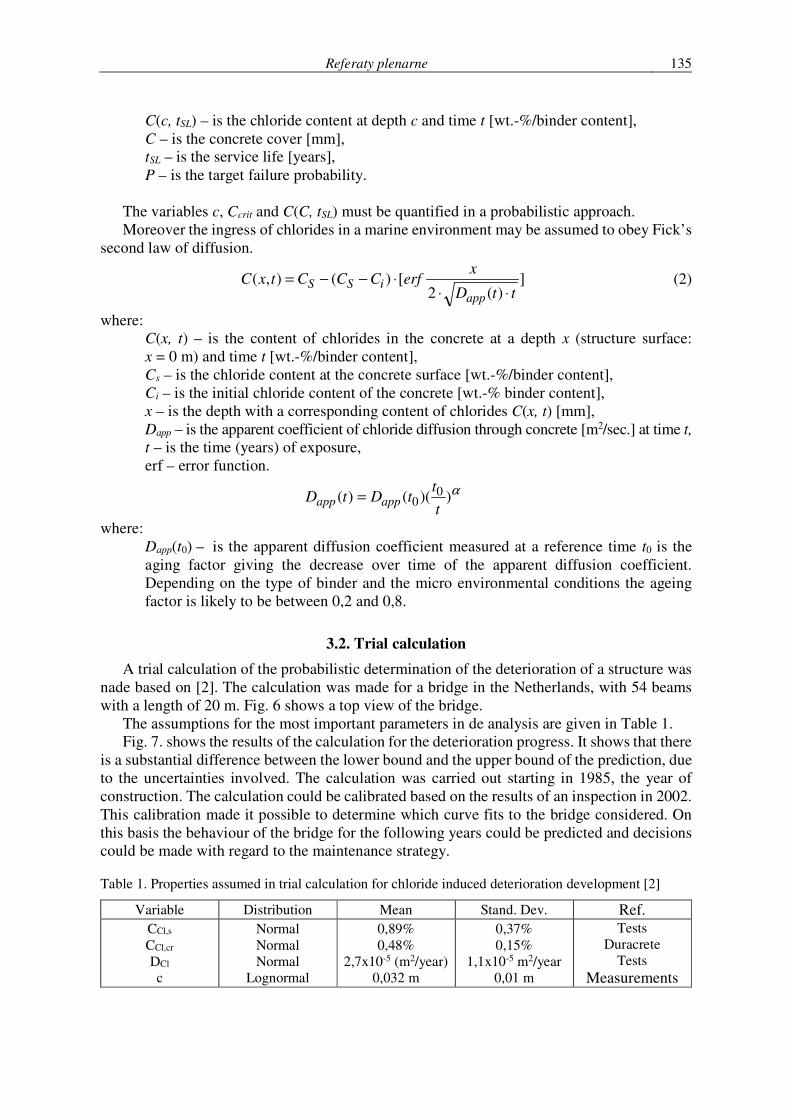
deemed to fail. A well known representation of the deterioration process as a function of time
is shown in Fig. 5. Until the end of the initiation time no damage is assumed to occur, since
the corrosion process starts only after the chloride content at the reinforcement has reached a
critical value. The events after the start of corrosion (so after reaching point 1 in the diagram
in Fig. 5) were considered to be quite uncertain with regard to their timely development.
134 Damage of concrete structures due to aging
Moreover the general idea was that the initiation time was substantially longer than the
propagation time. As a practical approach the end of the initiation time was therefore defined
as the end of service life.
Fig. 4. a) Damage due to choride induced corrosion in a harbour jetty in Sicily, Italy, b) Unsuitable
solution with a coating
Fig. 5. Deterioration due to chlorides in reinforced concrete
3. Development of a probabilistic approach to service life prediction
3.1. General basis
It was mentioned before that in the fib Model Code for concrete structures 2010 service
life was integrated in design, by requiring that the a defined structural safety and serviceability
should be maintained for a defined period. For the case of chloride ingress that means that it
should be determined with which probability the critical chloride content is not reached in that
time. This led to the requirement that the following limit state function must be fulfilled:
0}0),({{} PtcCCPPP SLcritdep <<−== (1)
where:
P{} – is the probability that passivation occurs,
CCrit – is the critical chloride content to achieve depassivation of the reinforcement
[wt.-% /binder content],
Referaty plenarne 135
C(c, tSL) – is the chloride content at depth c and time t [wt.-%/binder content],
C – is the concrete cover [mm],
tSL – is the service life [years],
P – is the target failure probability.
The variables c, Ccrit and C(C, tSL) must be quantified in a probabilistic approach.
Moreover the ingress of chlorides in a marine environment may be assumed to obey Fick’s
second law of diffusion.
])(2
[)(),(ttD
xerfCCCtxC
appiSS
⋅⋅
⋅−−= (2)
where:
C(x, t) – is the content of chlorides in the concrete at a depth x (structure surface:
x = 0 m) and time t [wt.-%/binder content],
Cs – is the chloride content at the concrete surface [wt.-%/binder content],
Ci – is the initial chloride content of the concrete [wt.-% binder content],
x – is the depth with a corresponding content of chlorides C(x, t) [mm],
Dapp – is the apparent coefficient of chloride diffusion through concrete [m2/sec.] at time t,
t – is the time (years) of exposure,
erf – error function.
α))(()( 0
0t
ttDtD appapp =
where:
Dapp(t0) – is the apparent diffusion coefficient measured at a reference time t0 is the
aging factor giving the decrease over time of the apparent diffusion coefficient.
Depending on the type of binder and the micro environmental conditions the ageing
factor is likely to be between 0,2 and 0,8.
3.2. Trial calculation
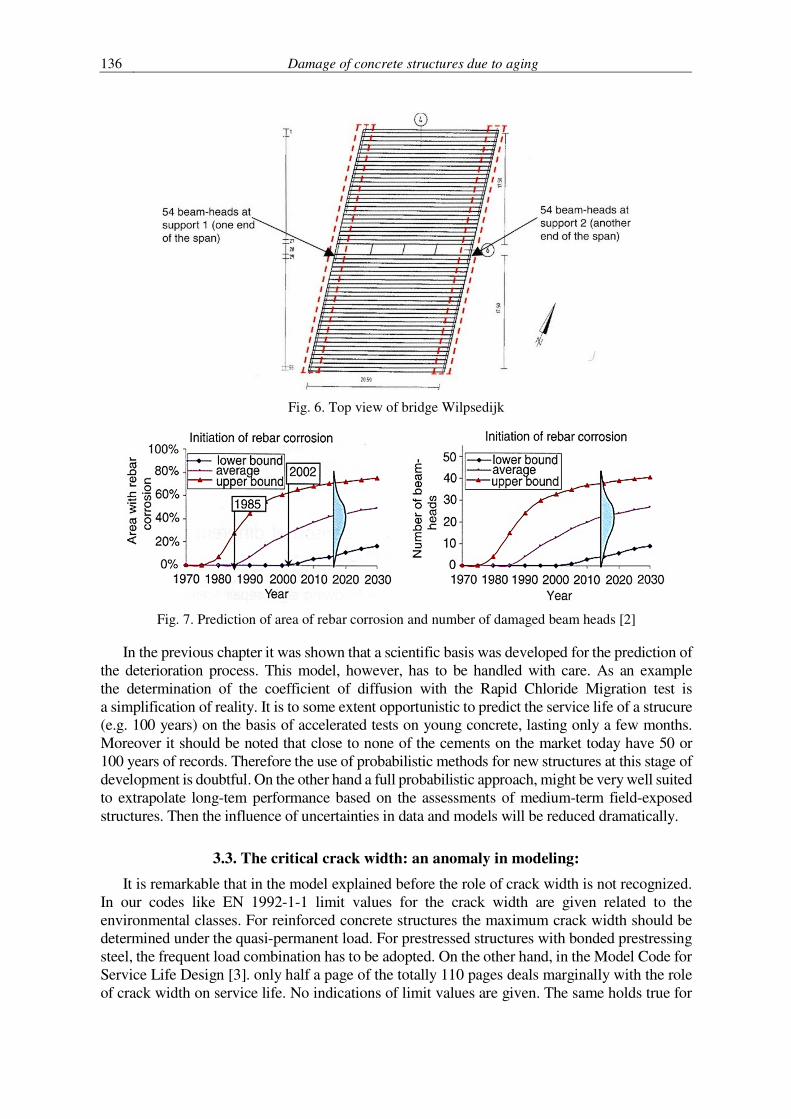
A trial calculation of the probabilistic determination of the deterioration of a structure was
nade based on [2]. The calculation was made for a bridge in the Netherlands, with 54 beams
with a length of 20 m. Fig. 6 shows a top view of the bridge.
The assumptions for the most important parameters in de analysis are given in Table 1.
Fig. 7. shows the results of the calculation for the deterioration progress. It shows that there
is a substantial difference between the lower bound and the upper bound of the prediction, due
to the uncertainties involved. The calculation was carried out starting in 1985, the year of
construction. The calculation could be calibrated based on the results of an inspection in 2002.
This calibration made it possible to determine which curve fits to the bridge considered. On
this basis the behaviour of the bridge for the following years could be predicted and decisions
could be made with regard to the maintenance strategy.
Table 1. Properties assumed in trial calculation for chloride induced deterioration development [2]
Variable Distribution Mean Stand. Dev. Ref.
CCl,s
CCl,cr
DCl
c
Normal
Normal
Normal
Lognormal
0,89%
0,48%
2,7x10⁻⁵ (m2/year)
0,032 m
0,37%
0,15%
1,1x10⁻⁵ m2/year
0,01 m
Tests
Duracrete
Tests
Measurements
136 Damage of concrete structures due to aging
Fig. 6. Top view of bridge Wilpsedijk
Fig. 7. Prediction of area of rebar corrosion and number of damaged beam heads [2]
In the previous chapter it was shown that a scientific basis was developed for the prediction of
the deterioration process. This model, however, has to be handled with care. As an example
the determination of the coefficient of diffusion with the Rapid Chloride Migration test is
a simplification of reality. It is to some extent opportunistic to predict the service life of a strucure
(e.g. 100 years) on the basis of accelerated tests on young concrete, lasting only a few months.
Moreover it should be noted that close to none of the cements on the market today have 50 or
100 years of records. Therefore the use of probabilistic methods for new structures at this stage of
development is doubtful. On the other hand a full probabilistic approach, might be very well suited
to extrapolate long-tem performance based on the assessments of medium-term field-exposed
structures. Then the influence of uncertainties in data and models will be reduced dramatically.
3.3. The critical crack width: an anomaly in modeling:
It is remarkable that in the model explained before the role of crack width is not recognized.
In our codes like EN 1992-1-1 limit values for the crack width are given related to the
environmental classes. For reinforced concrete structures the maximum crack width should be
determined under the quasi-permanent load. For prestressed structures with bonded prestressing
steel, the frequent load combination has to be adopted. On the other hand, in the Model Code for
Service Life Design [3]. only half a page of the totally 110 pages deals marginally with the role
of crack width on service life. No indications of limit values are given. The same holds true for
Referaty plenarne 137
the fib Model Code 2010. In CEB Bulletin 182 the following sentence about the role of crack
width is found: “The influence of crack width on the corrosion rate at the reinforcement has
turned out to be relatively small within the common range of crack width (up to 0.4 mm). Self-
healing as a result of calcium-, dirt- and rust-deposits within the cracks, can be frequently
observed. In this case, any ongoing corrosion at the reinforcement is likely to come to a halt”.
It is remarkable that the role of crack with on service life it not better clearified. In order to get
a better understanding of the role of crack width for the service life of reinforced concrete
structures, at TU Delft a series of tests was carried out, concentrating on the role of crack width
on the development of corrosion. Altogether 32 concrete beams (1500×100×150 mm) were
tested, see fig. 8 and 9. Parameters were the mean crack width, the number of cracks, the concrete
cover and the type of loading (static versus variable). The cracked reinforced beams were
exposed to alternately wetting and drying cycles once a week for 2 days ponding using a 3,5%
NaCl solution and a 5 days drying phase to simulate an aggressive environment. The half-cell
potential and linear polarization resistance method were applied for assessing the corrosion
of the steel reinforcement.
Fig. 8. Test specimens for the determination of the role of crack width on durability carried out at TU Delft
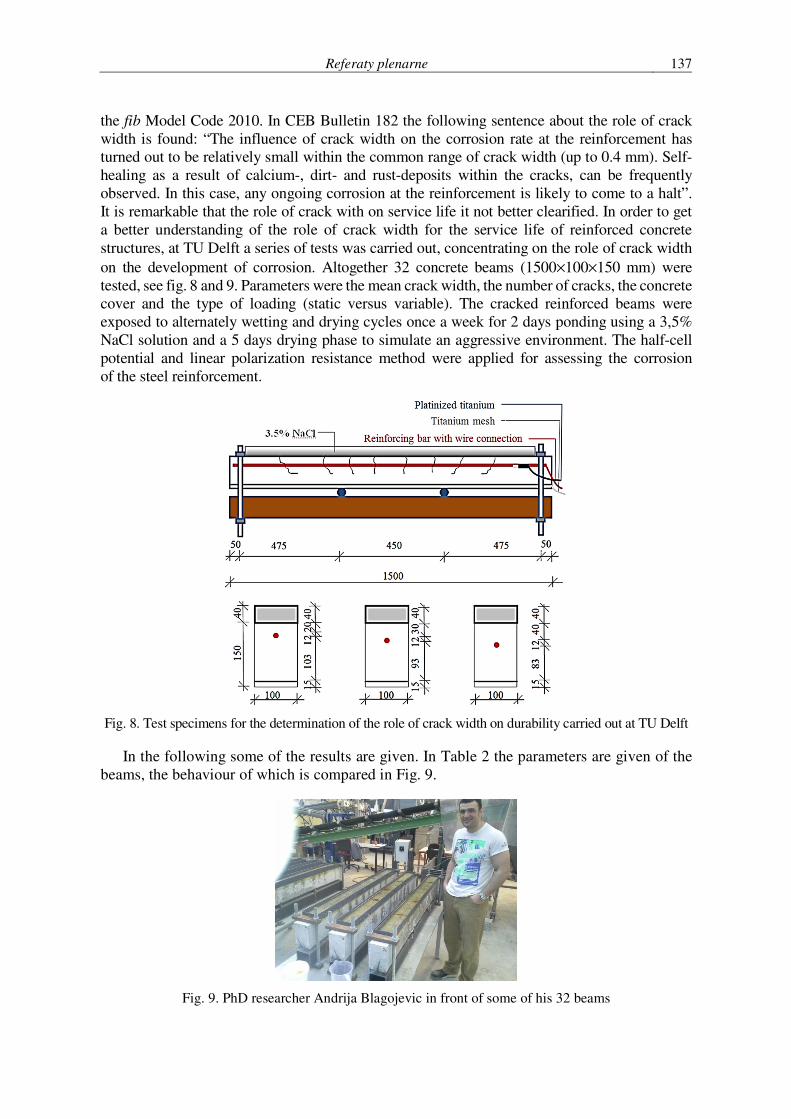
In the following some of the results are given. In Table 2 the parameters are given of the
beams, the behaviour of which is compared in Fig. 9.
Fig. 9. PhD researcher Andrija Blagojevic in front of some of his 32 beams
138 Damage of concrete structures due to aging
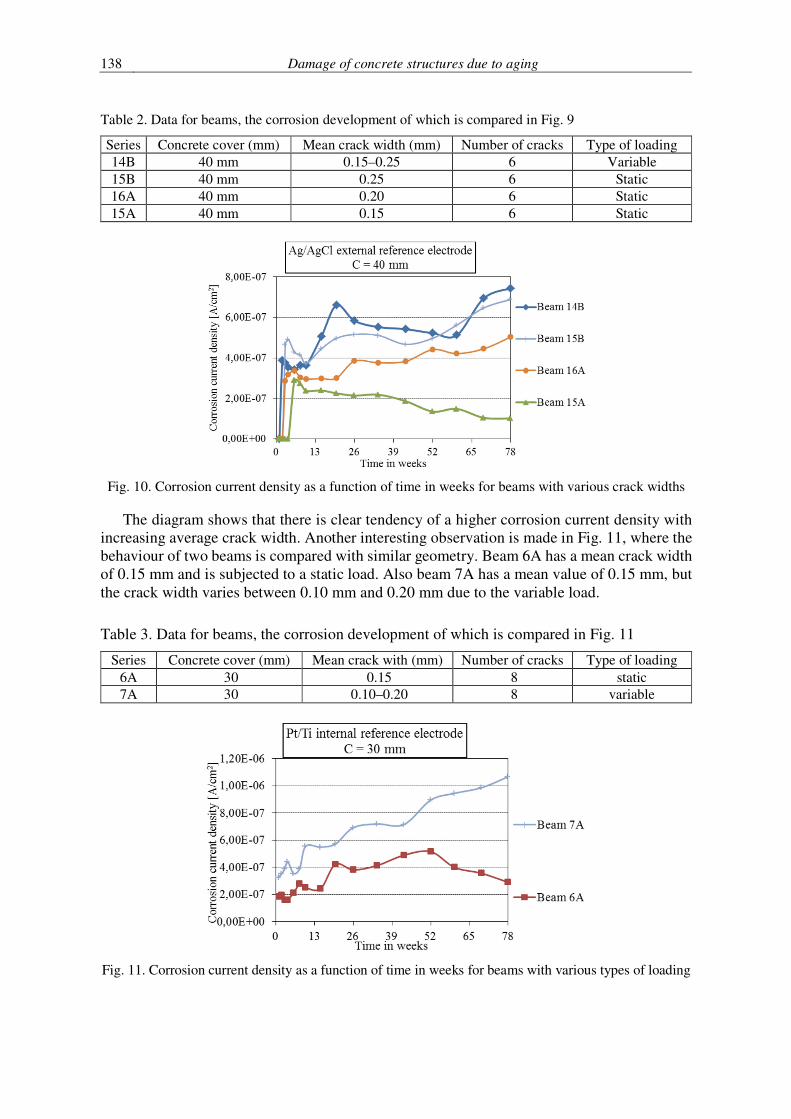
Table 2. Data for beams, the corrosion development of which is compared in Fig. 9
Series Concrete cover (mm) Mean crack width (mm) Number of cracks Type of loading
14B 40 mm 0.15–0.25 6 Variable
15B 40 mm 0.25 6 Static
16A 40 mm 0.20 6 Static
15A 40 mm 0.15 6 Static
Fig. 10. Corrosion current density as a function of time in weeks for beams with various crack widths
The diagram shows that there is clear tendency of a higher corrosion current density with
increasing average crack width. Another interesting observation is made in Fig. 11, where the
behaviour of two beams is compared with similar geometry. Beam 6A has a mean crack width
of 0.15 mm and is subjected to a static load. Also beam 7A has a mean value of 0.15 mm, but
the crack width varies between 0.10 mm and 0.20 mm due to the variable load.
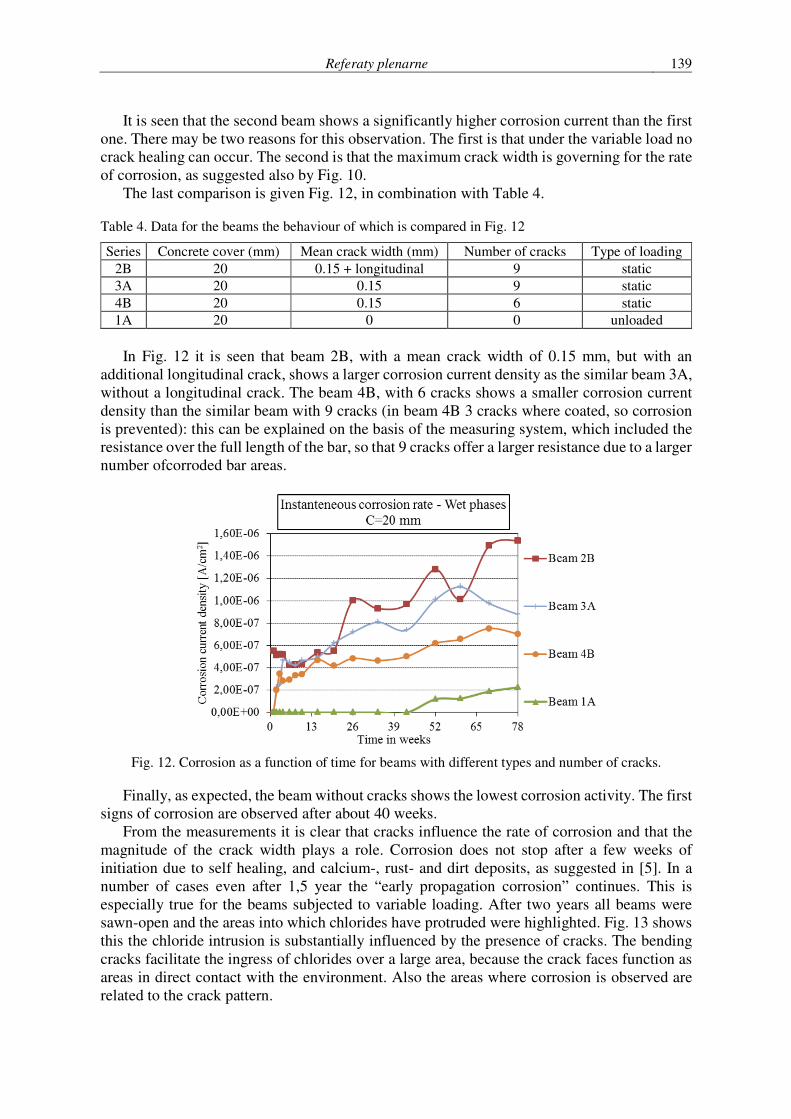
Table 3. Data for beams, the corrosion development of which is compared in Fig. 11
Series Concrete cover (mm) Mean crack with (mm) Number of cracks Type of loading
6A 30 0.15 8 static
7A 30 0.10–0.20 8 variable
Fig. 11. Corrosion current density as a function of time in weeks for beams with various types of loading
Referaty plenarne 139
It is seen that the second beam shows a significantly higher corrosion current than the first
one. There may be two reasons for this observation. The first is that under the variable load no
crack healing can occur. The second is that the maximum crack width is governing for the rate
of corrosion, as suggested also by Fig. 10.
The last comparison is given Fig. 12, in combination with Table 4.
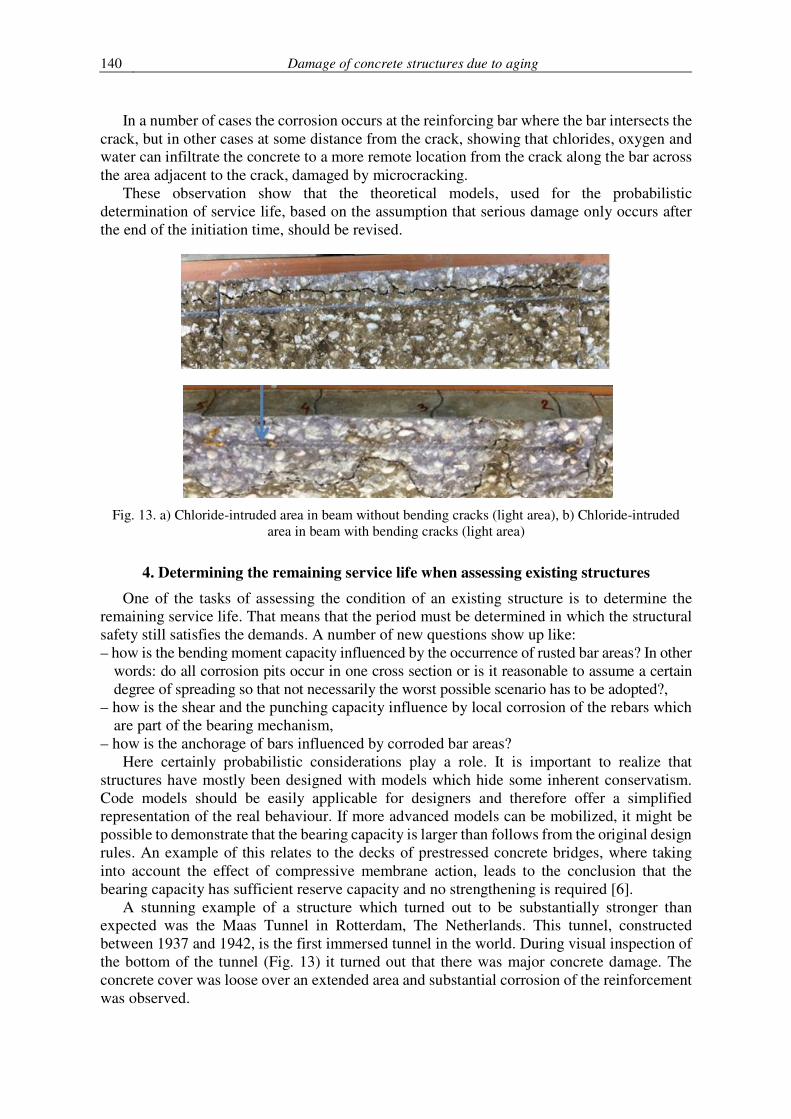
Table 4. Data for the beams the behaviour of which is compared in Fig. 12
Series Concrete cover (mm) Mean crack width (mm) Number of cracks Type of loading
2B 20 0.15 + longitudinal 9 static
3A 20 0.15 9 static
4B 20 0.15 6 static
1A 20 0 0 unloaded
In Fig. 12 it is seen that beam 2B, with a mean crack width of 0.15 mm, but with an
additional longitudinal crack, shows a larger corrosion current density as the similar beam 3A,
without a longitudinal crack. The beam 4B, with 6 cracks shows a smaller corrosion current
density than the similar beam with 9 cracks (in beam 4B 3 cracks where coated, so corrosion
is prevented): this can be explained on the basis of the measuring system, which included the
resistance over the full length of the bar, so that 9 cracks offer a larger resistance due to a larger
number ofcorroded bar areas.
Fig. 12. Corrosion as a function of time for beams with different types and number of cracks.
Finally, as expected, the beam without cracks shows the lowest corrosion activity. The first
signs of corrosion are observed after about 40 weeks.
From the measurements it is clear that cracks influence the rate of corrosion and that the
magnitude of the crack width plays a role. Corrosion does not stop after a few weeks of
initiation due to self healing, and calcium-, rust- and dirt deposits, as suggested in [5]. In a
number of cases even after 1,5 year the “early propagation corrosion” continues. This is
especially true for the beams subjected to variable loading. After two years all beams were
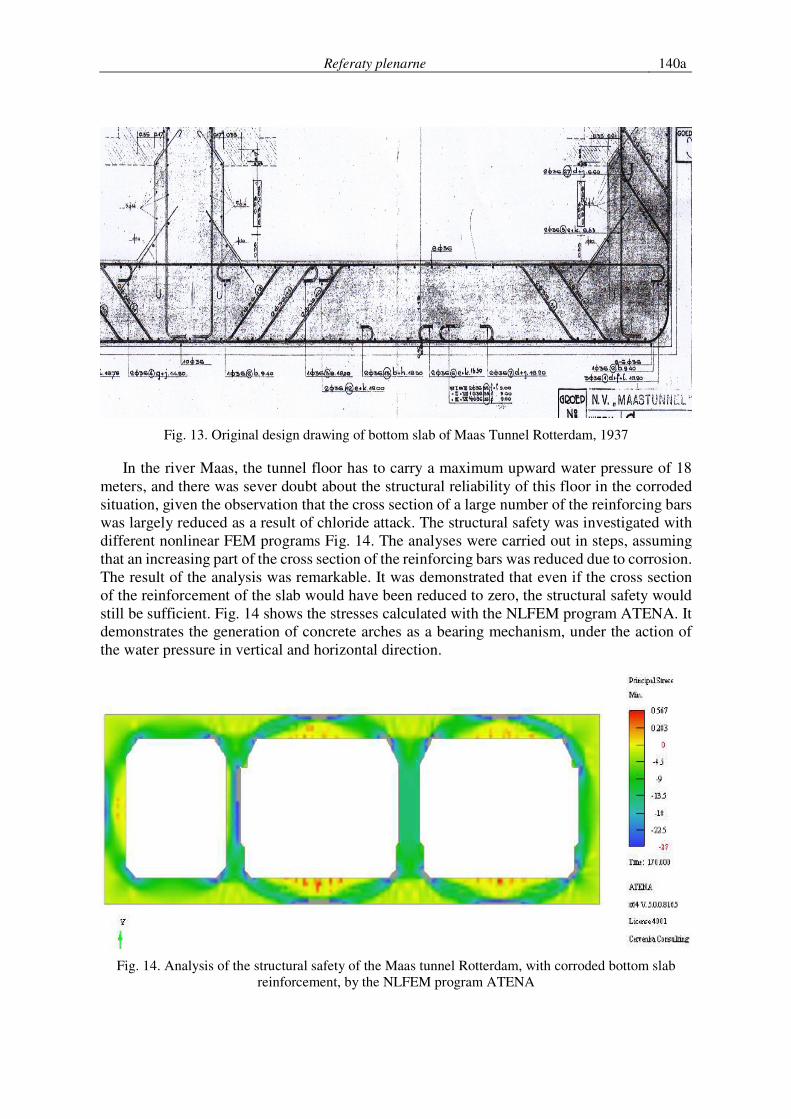
sawn-open and the areas into which chlorides have protruded were highlighted. Fig. 13 shows
this the chloride intrusion is substantially influenced by the presence of cracks. The bending
cracks facilitate the ingress of chlorides over a large area, because the crack faces function as
areas in direct contact with the environment. Also the areas where corrosion is observed are
related to the crack pattern.
140 Damage of concrete structures due to aging
In a number of cases the corrosion occurs at the reinforcing bar where the bar intersects the
crack, but in other cases at some distance from the crack, showing that chlorides, oxygen and
water can infiltrate the concrete to a more remote location from the crack along the bar across
the area adjacent to the crack, damaged by microcracking.
These observation show that the theoretical models, used for the probabilistic
determination of service life, based on the assumption that serious damage only occurs after
the end of the initiation time, should be revised.
Fig. 13. a) Chloride-intruded area in beam without bending cracks (light area), b) Chloride-intruded
area in beam with bending cracks (light area)
4. Determining the remaining service life when assessing existing structures
One of the tasks of assessing the condition of an existing structure is to determine the
remaining service life. That means that the period must be determined in which the structural
safety still satisfies the demands. A number of new questions show up like:
– how is the bending moment capacity influenced by the occurrence of rusted bar areas? In other
words: do all corrosion pits occur in one cross section or is it reasonable to assume a certain
degree of spreading so that not necessarily the worst possible scenario has to be adopted?,
– how is the shear and the punching capacity influence by local corrosion of the rebars which
are part of the bearing mechanism,
– how is the anchorage of bars influenced by corroded bar areas?
Here certainly probabilistic considerations play a role. It is important to realize that
structures have mostly been designed with models which hide some inherent conservatism.
Code models should be easily applicable for designers and therefore offer a simplified
representation of the real behaviour. If more advanced models can be mobilized, it might be
possible to demonstrate that the bearing capacity is larger than follows from the original design
rules. An example of this relates to the decks of prestressed concrete bridges, where taking
into account the effect of compressive membrane action, leads to the conclusion that the
bearing capacity has sufficient reserve capacity and no strengthening is required [6].
A stunning example of a structure which turned out to be substantially stronger than
expected was the Maas Tunnel in Rotterdam, The Netherlands. This tunnel, constructed
between 1937 and 1942, is the first immersed tunnel in the world. During visual inspection of
the bottom of the tunnel (Fig. 13) it turned out that there was major concrete damage. The
concrete cover was loose over an extended area and substantial corrosion of the reinforcement
was observed.
Referaty plenarne 140a
Fig. 13. Original design drawing of bottom slab of Maas Tunnel Rotterdam, 1937
In the river Maas, the tunnel floor has to carry a maximum upward water pressure of 18
meters, and there was sever doubt about the structural reliability of this floor in the corroded
situation, given the observation that the cross section of a large number of the reinforcing bars
was largely reduced as a result of chloride attack. The structural safety was investigated with
different nonlinear FEM programs Fig. 14. The analyses were carried out in steps, assuming
that an increasing part of the cross section of the reinforcing bars was reduced due to corrosion.
The result of the analysis was remarkable. It was demonstrated that even if the cross section
of the reinforcement of the slab would have been reduced to zero, the structural safety would
still be sufficient. Fig. 14 shows the stresses calculated with the NLFEM program ATENA. It
demonstrates the generation of concrete arches as a bearing mechanism, under the action of
the water pressure in vertical and horizontal direction.
Fig. 14. Analysis of the structural safety of the Maas tunnel Rotterdam, with corroded bottom slab
reinforcement, by the NLFEM program ATENA
140b Damage of concrete structures due to aging
5. Conclusions
Aging of concrete structures is developing to a major cause of damage in concrete
structures.
Although with regard to knowledge of the aging effect of concrete structures substantial
steps have been made, there are still essential questions waiting for an answer.
Contrary to many references in literature, which claim that the end of the initiation time of
an uncracked structure determines the (beginning) of the end of service life, it could be
demonstrated that the role of cracking should not be ignored.
The assessment of the residual capacity of structures built decades ago is an area which
deserves major attention.
References
1. Den Uijl, J.A., Kaptijn,N.& Walraven, J.C., 2000. "Shear resistance of flat slab bridges affected by
ASR". Proceedings of the 11th International Conference on AAR in Concrete, Quebeck City,Canada
1129–1138.
2. Li Ying, “Effect of Spatial Variability on Maintenance and Repair Decisions for Concrete Structures”,
PhD thesis, Delft University of Technology, The Netherlands, June 2004.
3. Fib-Task Group 5.6 “Model Code for Service Life Design”, fib-Bulleting 34, February 2006.
4. Blagojevic, A, Walraven, J.C., “XIII International Conference on Durability of Building Materials”,
Proceedings, Sao Paulo, 2–5 September 2014.
5. CEB Bulletin 182, “Durable concrete structures CEB Design Guide”, 1989.
6. Amir, S., “Compressive membrane action in prestressed concrete deck slabs”, PhD thesis, June 4th
2014, Delft University of Technology.