Embed Size (px)
Citation preview
DAM SAFETY GUIDELINES
TECHNICAL NOTE 1
DAM BREAK INUNDATION ANALYSIS AND
DOWNSTREAM HAZARD CLASSIFICATION
MGS Engineering Consultants, Inc. for
Water Resources Program Dam Safety Office
P.O. Box 47600 Olympia, WA 98504-7600
(360) 407-6872
October 2007 (Revised) 92-55E

This report is available on the Department of Ecology Web site at: http://www.ecy.wa.gov/biblio/9255e.html
For a printed copy of this report, contact:
Name: Water Resources Program Publications Address: PO Box 47600, Olympia WA 98504-7600 E-mail: [email protected] Phone: (360) 407-6872
Refer to Publication Number 92-55E
If you need this publication in an alternate format, please call the Water Resources Program at (360) 407-6872. Persons with hearing loss can call 711 for Washington Relay Service. Persons with a speech disability can call (877) 833-6341.
Page i
DAM SAFETY GUIDELINES TECHNICAL NOTE 1:
Dam Break Inundation Analysis and Downstream Hazard Classification
Table of Contents
OVERVIEW ................................................................................................................................................................. 1
DAM BREAK INUNDATION ANALYSIS .............................................................................................................. 2
1. INTRODUCTION .................................................................................................................................................. 2 1.1 CAUSES OF DAM FAILURE .................................................................................................................... 2
2. ESTIMATION OF DAM BREACH CHARACTERISTICS .............................................................................. 5 2.1 ESTIMATION OF DAM BREACH DIMENSIONS................................................................................... 5 2.2 ESTIMATION OF DAM BREACH PEAK DISCHARGE ......................................................................... 9
3. DOWNSTREAM ROUTING OF DAM BREAK FLOOD ............................................................................... 13 3.1 COMPUTATIONAL METHODS FOR ROUTING OF DAM BREAK FLOOD ..................................... 13
4. INUNDATION MAPPING .................................................................................................................................. 17 4.1 SIMPLIFIED INUNDATION MAPPING APPROACH .......................................................................... 17 4.2 FACTOR OF SAFETY FOR INUNDATION MAPPING ........................................................................ 18
5. RECOMMENDED PROCEDURES FOR CONDUCTING DAM BREAK INUNDATION ANALYSIS ... 19 5.1 RESERVOIR CONDITIONS AT TIME OF DAM FAILURE .................................................................. 20
5.1.1 Dam Failure at Normal Pool Condition ................................................................................................. 20 5.1.2 Dam Failure at Maximum Storage Elevation - Flood Condition .......................................................... 20 5.1.3 Dam Failure at Maximum Storage Elevation - Off-Channel Storage Reservoirs ................................ 23
5.2 SENSITIVITY ANALYSES ..................................................................................................................... 23 5.3 MULTIPLE DAMS – SEQUENTIAL FAILURE OF DOWNSTREAM DAM ........................................ 24
5.3.1 Multiple Dam Break Estimation, Simple Approach ............................................................................... 24 5.3.2 Multiple Dam Break Estimation, Detailed Approach ............................................................................ 25
6. DOWNSTREAM HAZARD CLASSIFICATION ............................................................................................. 27
7. DOWNSTREAM HAZARD CLASSIFICATION SYSTEM ............................................................................ 28 7.1 POPULATION AT RISK .......................................................................................................................... 28 7.2 PROPERTY DAMAGE AND ECONOMIC LOSSES .............................................................................. 29 7.3 ENVIRONMENTAL DAMAGES ............................................................................................................ 30 7.4 CURRENT/FUTURE DEVELOPMENT .................................................................................................. 30 7.5 MULTIPLE DAMS ................................................................................................................................... 30 7.6 MINE TAILINGS DAMS ......................................................................................................................... 31 7.7 SOPHISTICATION OF APPROACH IN DETERMINING DOWNSTREAM HAZARD
CLASSIFICATION ................................................................................................................................... 31 8. ENGINEERING REPORTS FOR DAM BREAK INUNDATION ANALYSES AND DOWNSTREAM
HAZARD CLASSIFICATION ............................................................................................................................ 32
REFERENCES .......................................................................................................................................................... 33

Page ii
Acknowledgements The revisions and updates to Technical Note 1 were accomplished under the authorship of Bruce Barker, P.E., and Melvin Schaefer, Ph.D., P.E., of MGS Engineering Consultants, Inc., Olympia, Washington. The original Technical Note 1 was compiled in 1992 under the leadership and principal author-ship of Dr. Schaefer, supervisor of the Department of Ecology’s Dam Safety Section at that time.
Page 1
Dam Break Inundation Analysis and
Downstream Hazard Classification
OVERVIEW This technical note is intended to provide assistance in conducting a Dam Break Inundation Analysis and in assessing the Downstream Hazard posed by a dam failure. The primary focus will be on earthen dams, however, information will also be provided for use with concrete dams. It is not intended to be a comprehensive summary of all available information, but rather highlight noteworthy methodologies and alert the reader to more detailed discussions and technical references. This technical note was originally prepared in 1992 based on work by Dr. Melvin G. Schaefer. It has now been updated in 2007 to reflect research on dam failures that has been performed since the original report was completed. Dam Break Inundation Analysis is used for a variety of purposes in planning and design for proposed dams and for planning and upgrade for existing dams. Typical applications include: • Downstream Hazard Classification. • Inundation mapping for use in developing Emergency Action Plans. • Aid in the selection of Design/Performance Levels for Critical Project Elements. • Incremental Damage Analysis - an alternative procedure for sizing emergency spillways. Guidance is provided in selection of an appropriate level of sophistication in conducting dam break inundation analyses for use in the various applications. Information is also provided for determining the Downstream Hazard Classification for use with the Dam Safety Regulations, Chapter 173-175 WAC.
Page 2
DAM BREAK INUNDATION ANALYSIS
1. INTRODUCTION
Dam break inundation analyses include three distinct analysis parts:
• Estimation of the dam-break outflow hydrograph. • Routing of the dam-break hydrograph through the downstream valley. • Estimation of inundation levels and damages to downstream structures.
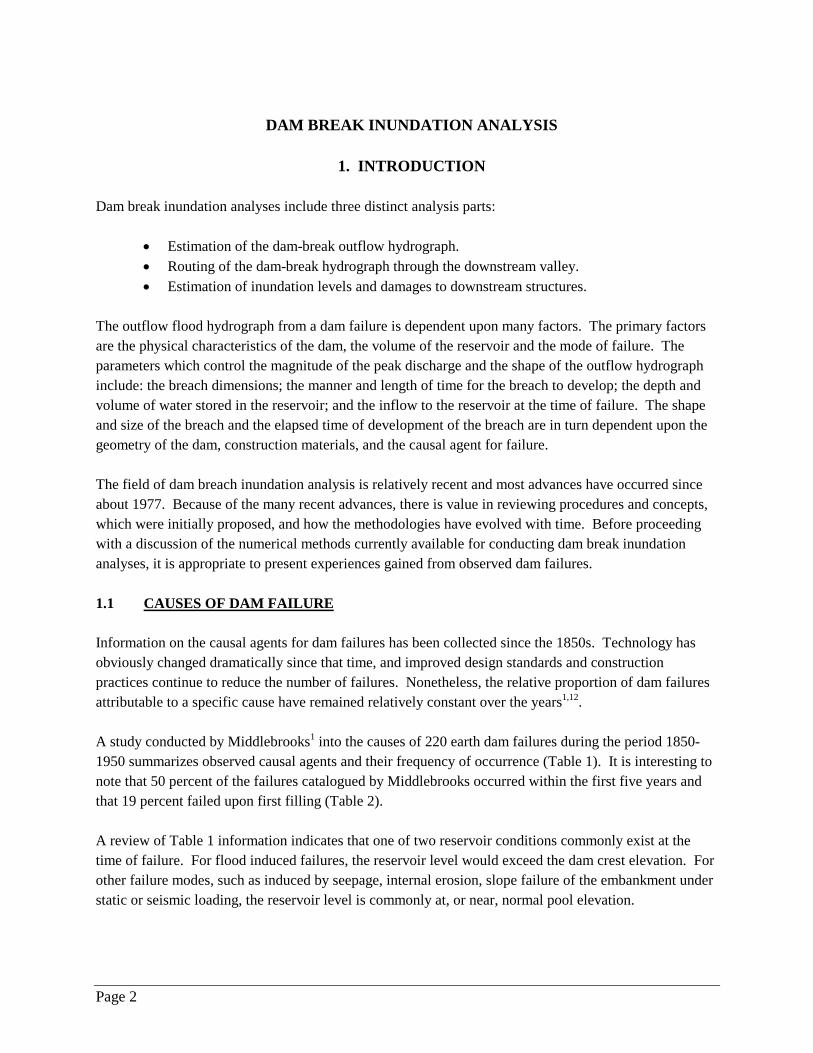
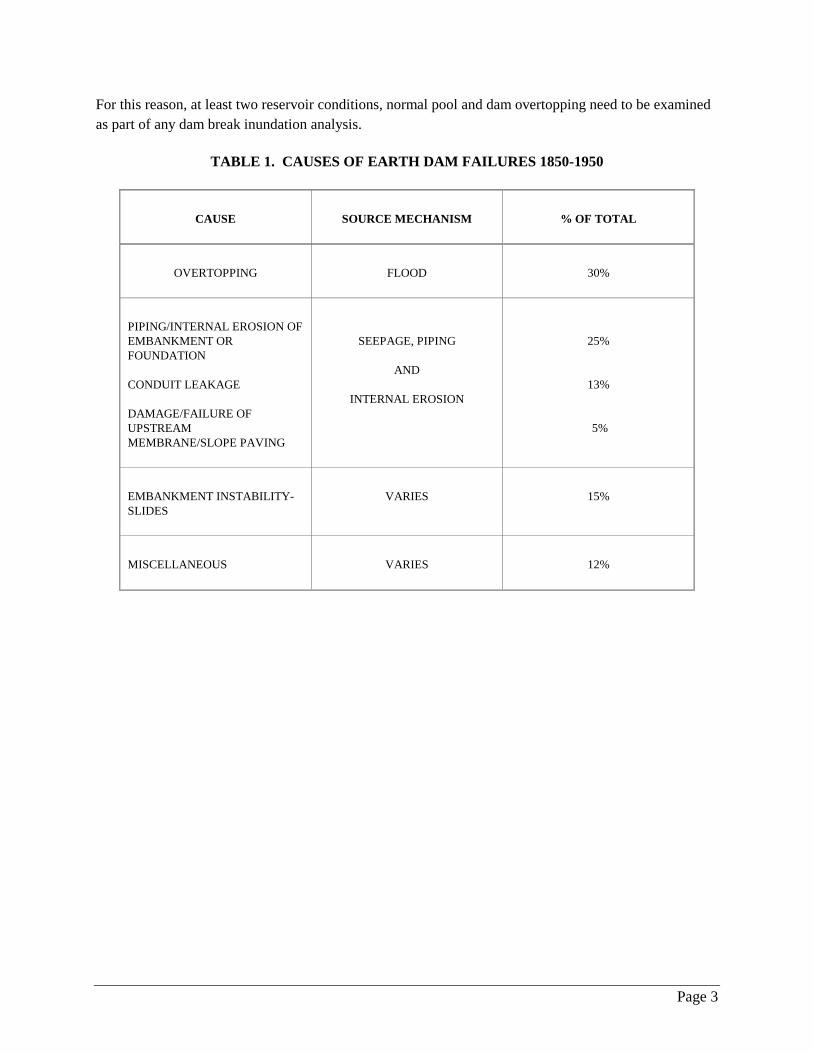
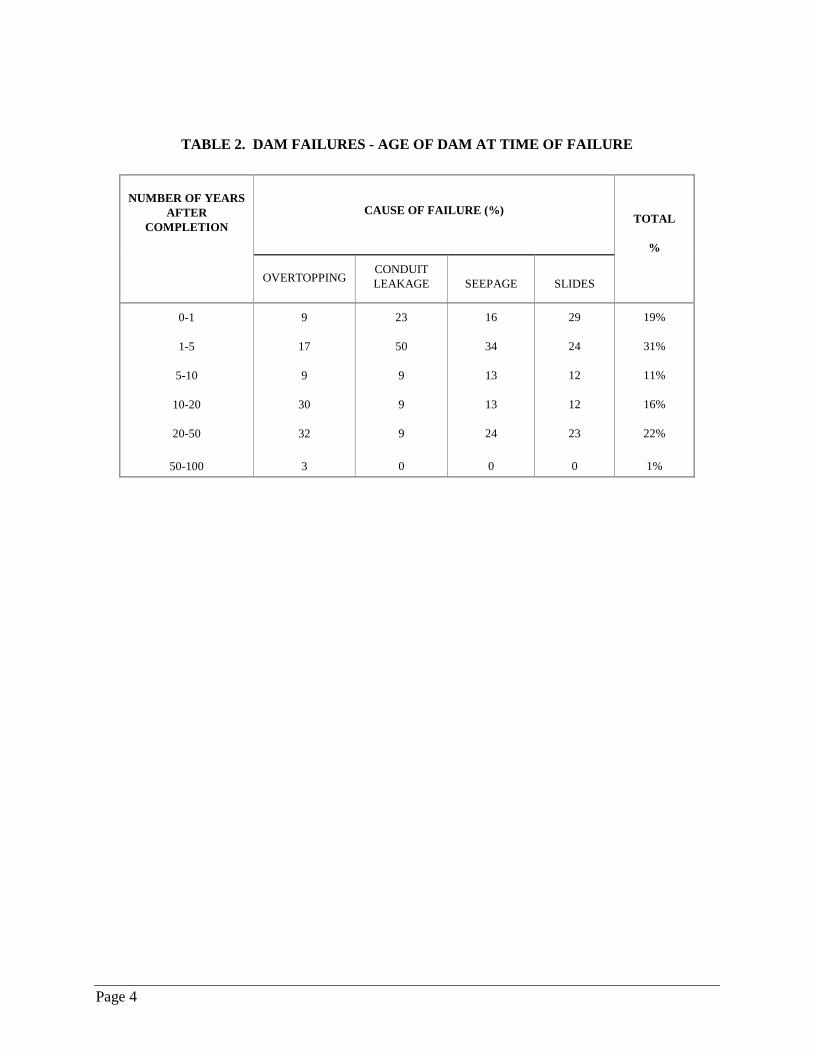
The outflow flood hydrograph from a dam failure is dependent upon many factors. The primary factors are the physical characteristics of the dam, the volume of the reservoir and the mode of failure. The parameters which control the magnitude of the peak discharge and the shape of the outflow hydrograph include: the breach dimensions; the manner and length of time for the breach to develop; the depth and volume of water stored in the reservoir; and the inflow to the reservoir at the time of failure. The shape and size of the breach and the elapsed time of development of the breach are in turn dependent upon the geometry of the dam, construction materials, and the causal agent for failure. The field of dam breach inundation analysis is relatively recent and most advances have occurred since about 1977. Because of the many recent advances, there is value in reviewing procedures and concepts, which were initially proposed, and how the methodologies have evolved with time. Before proceeding with a discussion of the numerical methods currently available for conducting dam break inundation analyses, it is appropriate to present experiences gained from observed dam failures. 1.1 CAUSES OF DAM FAILURE Information on the causal agents for dam failures has been collected since the 1850s. Technology has obviously changed dramatically since that time, and improved design standards and construction practices continue to reduce the number of failures. Nonetheless, the relative proportion of dam failures attributable to a specific cause have remained relatively constant over the years1,12. A study conducted by Middlebrooks1 into the causes of 220 earth dam failures during the period 1850-1950 summarizes observed causal agents and their frequency of occurrence (Table 1). It is interesting to note that 50 percent of the failures catalogued by Middlebrooks occurred within the first five years and that 19 percent failed upon first filling (Table 2). A review of Table 1 information indicates that one of two reservoir conditions commonly exist at the time of failure. For flood induced failures, the reservoir level would exceed the dam crest elevation. For other failure modes, such as induced by seepage, internal erosion, slope failure of the embankment under static or seismic loading, the reservoir level is commonly at, or near, normal pool elevation.
Page 3
For this reason, at least two reservoir conditions, normal pool and dam overtopping need to be examined as part of any dam break inundation analysis.
TABLE 1. CAUSES OF EARTH DAM FAILURES 1850-1950
CAUSE
SOURCE MECHANISM
% OF TOTAL
OVERTOPPING
FLOOD
30%
PIPING/INTERNAL EROSION OF EMBANKMENT OR FOUNDATION CONDUIT LEAKAGE DAMAGE/FAILURE OF UPSTREAM MEMBRANE/SLOPE PAVING
SEEPAGE, PIPING
AND
INTERNAL EROSION
25%
13%
5%
EMBANKMENT INSTABILITY- SLIDES
VARIES
15%
MISCELLANEOUS
VARIES
12%
Page 4
TABLE 2. DAM FAILURES - AGE OF DAM AT TIME OF FAILURE
NUMBER OF YEARS
AFTER COMPLETION
CAUSE OF FAILURE (%)
TOTAL
%
OVERTOPPING
CONDUIT LEAKAGE
SEEPAGE
SLIDES
0-1
1-5
5-10
10-20
20-50
50-100
9
17
9
30
32
3
23
50
9
9
9
0
16
34
13
13
24
0
29
24
12
12
23
0
19%
31%
11%
16%
22%
1%
Page 5
2. ESTIMATION OF DAM BREACH CHARACTERISTICS
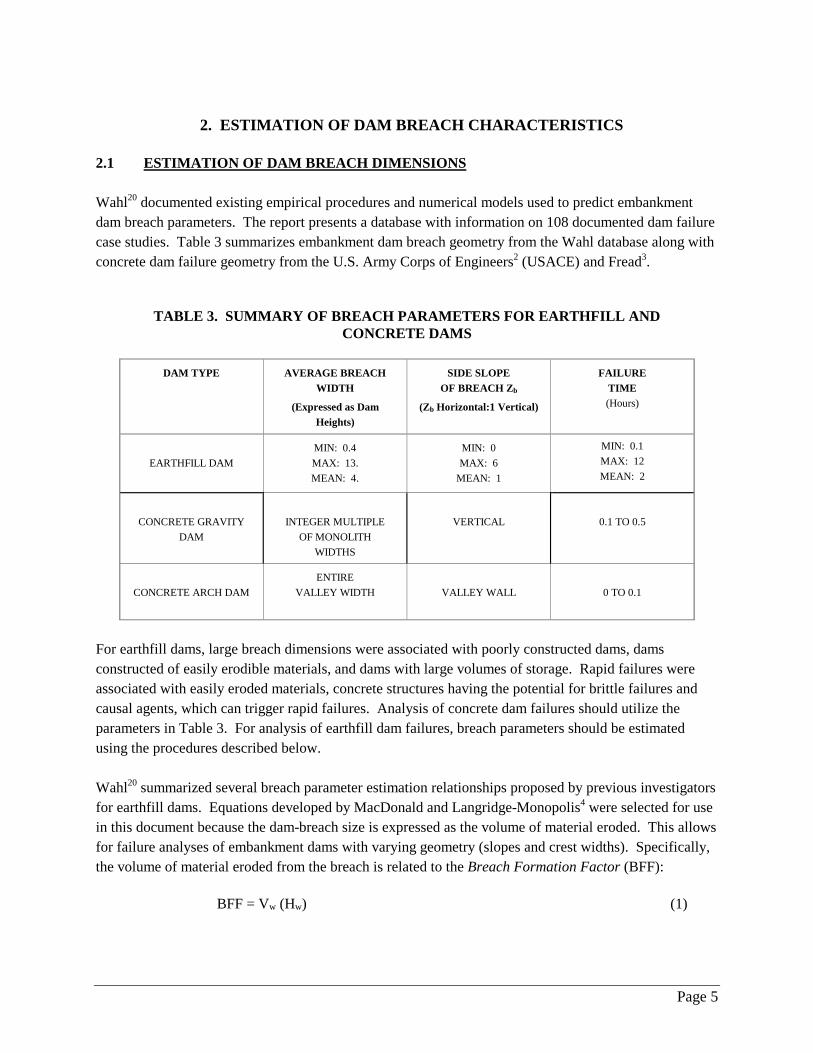
2.1 ESTIMATION OF DAM BREACH DIMENSIONS Wahl20 documented existing empirical procedures and numerical models used to predict embankment dam breach parameters. The report presents a database with information on 108 documented dam failure case studies. Table 3 summarizes embankment dam breach geometry from the Wahl database along with concrete dam failure geometry from the U.S. Army Corps of Engineers2 (USACE) and Fread3.
TABLE 3. SUMMARY OF BREACH PARAMETERS FOR EARTHFILL AND CONCRETE DAMS
DAM TYPE AVERAGE BREACH
WIDTH
(Expressed as Dam Heights)
SIDE SLOPE OF BREACH Zb
(Zb Horizontal:1 Vertical)
FAILURE TIME (Hours)
EARTHFILL DAM
MIN: 0.4 MAX: 13. MEAN: 4.
MIN: 0 MAX: 6
MEAN: 1
MIN: 0.1 MAX: 12 MEAN: 2
CONCRETE GRAVITY
DAM
INTEGER MULTIPLE
OF MONOLITH WIDTHS
VERTICAL
0.1 TO 0.5
CONCRETE ARCH DAM
ENTIRE VALLEY WIDTH
VALLEY WALL
0 TO 0.1
For earthfill dams, large breach dimensions were associated with poorly constructed dams, dams constructed of easily erodible materials, and dams with large volumes of storage. Rapid failures were associated with easily eroded materials, concrete structures having the potential for brittle failures and causal agents, which can trigger rapid failures. Analysis of concrete dam failures should utilize the parameters in Table 3. For analysis of earthfill dam failures, breach parameters should be estimated using the procedures described below. Wahl20 summarized several breach parameter estimation relationships proposed by previous investigators for earthfill dams. Equations developed by MacDonald and Langridge-Monopolis4 were selected for use in this document because the dam-breach size is expressed as the volume of material eroded. This allows for failure analyses of embankment dams with varying geometry (slopes and crest widths). Specifically, the volume of material eroded from the breach is related to the Breach Formation Factor (BFF): BFF = Vw (Hw) (1)
Page 6
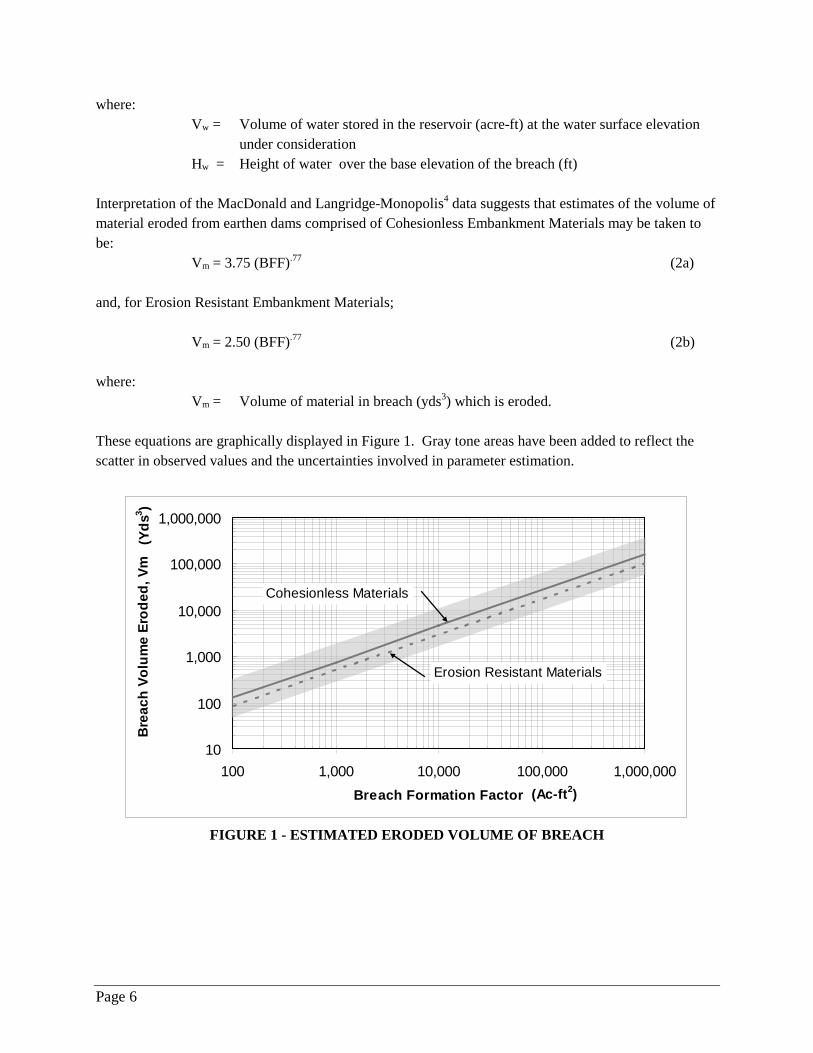
where: Vw = Volume of water stored in the reservoir (acre-ft) at the water surface elevation
under consideration Hw = Height of water over the base elevation of the breach (ft) Interpretation of the MacDonald and Langridge-Monopolis4 data suggests that estimates of the volume of material eroded from earthen dams comprised of Cohesionless Embankment Materials may be taken to be: Vm = 3.75 (BFF).77 (2a) and, for Erosion Resistant Embankment Materials; Vm = 2.50 (BFF).77 (2b) where: Vm = Volume of material in breach (yds3) which is eroded. These equations are graphically displayed in Figure 1. Gray tone areas have been added to reflect the scatter in observed values and the uncertainties involved in parameter estimation.
10
100
1,000
10,000
100,000
1,000,000
100 1,000 10,000 100,000 1,000,000Breach Formation Factor
Bre
ach
Volu
me
Erod
ed, V
m
(Ac-ft2)
(Yds
3 )
Cohesionless Materials
Erosion Resistant Materials
FIGURE 1 - ESTIMATED ERODED VOLUME OF BREACH
Page 7
∇
HwHb
Dam Crest
Wb
Zb
1
Breach Cross Section (NTS)
∇C
Dam Cross Section (NTS)
Z1
1Z2
1
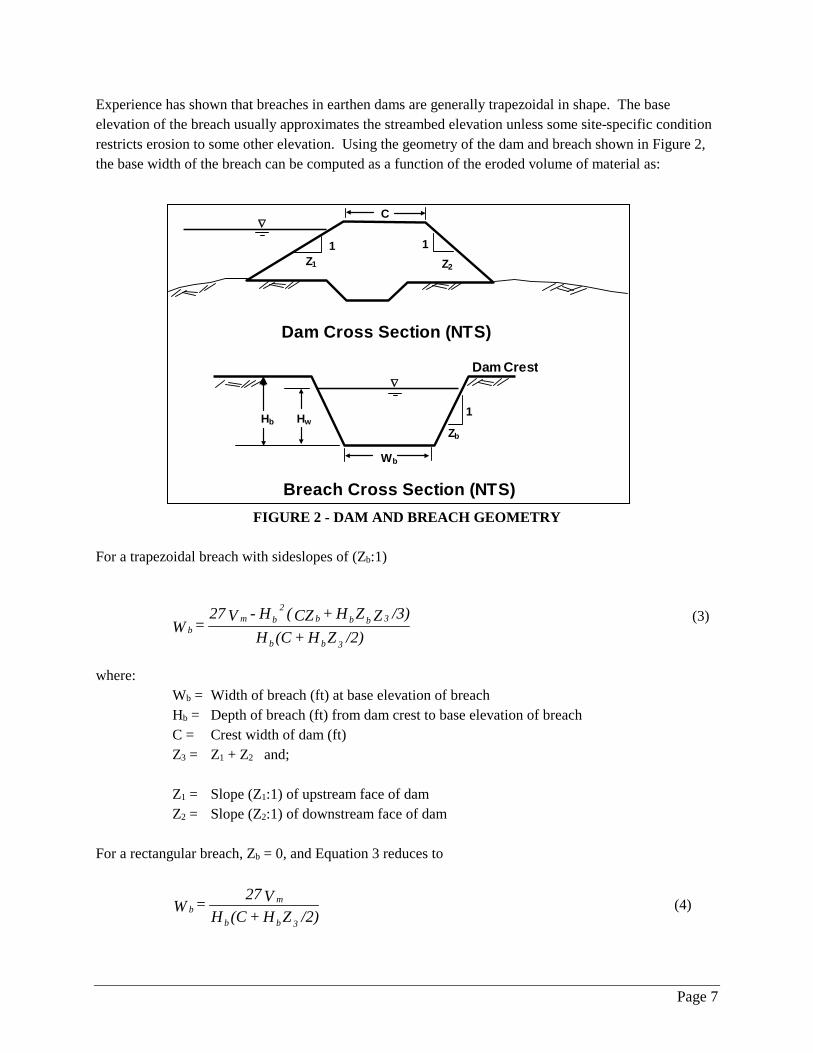
Experience has shown that breaches in earthen dams are generally trapezoidal in shape. The base elevation of the breach usually approximates the streambed elevation unless some site-specific condition restricts erosion to some other elevation. Using the geometry of the dam and breach shown in Figure 2, the base width of the breach can be computed as a function of the eroded volume of material as:
▲
FIGURE 2 - DAM AND BREACH GEOMETRY For a trapezoidal breach with sideslopes of (Zb:1)
(3)
where: Wb = Width of breach (ft) at base elevation of breach Hb = Depth of breach (ft) from dam crest to base elevation of breach C = Crest width of dam (ft) Z3 = Z1 + Z2 and; Z1 = Slope (Z1:1) of upstream face of dam Z2 = Slope (Z2:1) of downstream face of dam For a rectangular breach, Zb = 0, and Equation 3 reduces to
/2)ZH + (CH
V 27 = Wb 3b
mb (4)
/2)ZH + (CH
/3)ZZH + CZ( H - V 27 = W
b 3b
3b bbb2
mb
Page 8
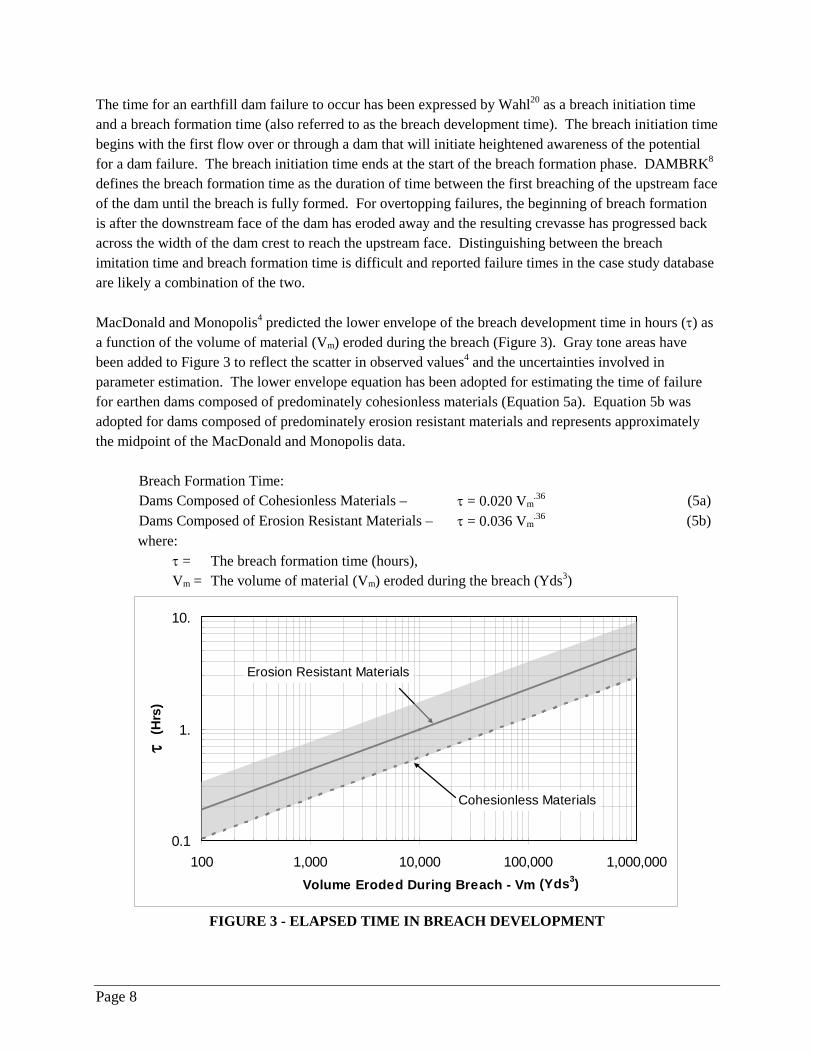
The time for an earthfill dam failure to occur has been expressed by Wahl20 as a breach initiation time and a breach formation time (also referred to as the breach development time). The breach initiation time begins with the first flow over or through a dam that will initiate heightened awareness of the potential for a dam failure. The breach initiation time ends at the start of the breach formation phase. DAMBRK8 defines the breach formation time as the duration of time between the first breaching of the upstream face of the dam until the breach is fully formed. For overtopping failures, the beginning of breach formation is after the downstream face of the dam has eroded away and the resulting crevasse has progressed back across the width of the dam crest to reach the upstream face. Distinguishing between the breach imitation time and breach formation time is difficult and reported failure times in the case study database are likely a combination of the two. MacDonald and Monopolis4 predicted the lower envelope of the breach development time in hours (τ) as a function of the volume of material (Vm) eroded during the breach (Figure 3). Gray tone areas have been added to Figure 3 to reflect the scatter in observed values4 and the uncertainties involved in parameter estimation. The lower envelope equation has been adopted for estimating the time of failure for earthen dams composed of predominately cohesionless materials (Equation 5a). Equation 5b was adopted for dams composed of predominately erosion resistant materials and represents approximately the midpoint of the MacDonald and Monopolis data.
Breach Formation Time: Dams Composed of Cohesionless Materials – τ = 0.020 Vm
.36 (5a) Dams Composed of Erosion Resistant Materials – τ = 0.036 Vm
.36 (5b) where: τ = The breach formation time (hours), Vm = The volume of material (Vm) eroded during the breach (Yds3)
0.1
1.
10.
100 1,000 10,000 100,000 1,000,000Volume Eroded During Breach - Vm
τ (H
rs)
(Yds3)
Cohesionless Materials
Erosion Resistant Materials
FIGURE 3 - ELAPSED TIME IN BREACH DEVELOPMENT
Page 9
Because of the uncertainties associated with the selection of the time for breach development, engineers should use a range of values to assess the sensitivity of the computed dam break flood peak discharge. The scope of sensitivity analyses is discussed in more detail in section 5.2. The first alternative procedure for estimating breach development time and the breach outflow hydrograph was developed by Fread6. In 1987, he completed the development of computer program BREACH for the numerical simulation of breach formation. This program simulates the breach initiation phase as a tractive-force erosion problem. However, more recent studies have found this procedure is not consistent with the erosion mechanics observed in laboratory testing and documented in case studies20. The Agricultural Research Service and the Natural Resources Conservation Service have recently developed effective procedures for modeling headcut erosion in natural earth spillways using the SITES22 model. This approach appears suitable for application to dam breach simulation and may be incorporated into breach models in the future. For purposes of use with the Dam Safety Regulations, Chapter 173-175 WAC, Equations 1 through 5b are recommended for use in estimating dam breach parameters for earthfill dams and values in Table 3 should be used for concrete dams. 2.2 ESTIMATION OF DAM BREACH PEAK DISCHARGE Wahl20 evaluated several procedures that relate dam break peak outflow with various dam dimensions (e.g. dam height, breach height, depth of water above breach, etc). The equations were evaluated by comparing predicted and observed peak discharge for the projects in the dam failure database. An equation developed by Froehlich22 (Equation 6) was found to be one of the better available methods for direct calculation of dam break peak discharge. 24.1295.01.40 wwp HVQ = (6)
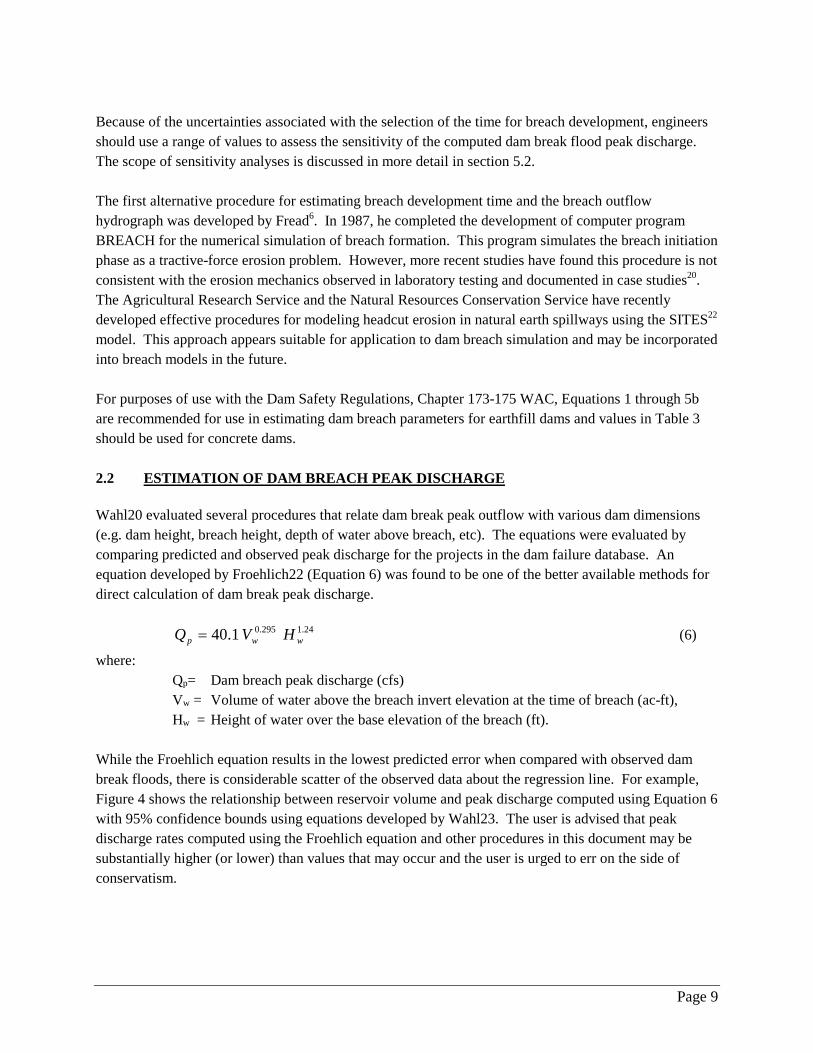
where: Qp= Dam breach peak discharge (cfs) Vw = Volume of water above the breach invert elevation at the time of breach (ac-ft), Hw = Height of water over the base elevation of the breach (ft). While the Froehlich equation results in the lowest predicted error when compared with observed dam break floods, there is considerable scatter of the observed data about the regression line. For example, Figure 4 shows the relationship between reservoir volume and peak discharge computed using Equation 6 with 95% confidence bounds using equations developed by Wahl23. The user is advised that peak discharge rates computed using the Froehlich equation and other procedures in this document may be substantially higher (or lower) than values that may occur and the user is urged to err on the side of conservatism.
Page 10
FIGURE 4 – FROEHLICH RELATIONSHIP WITH 95% CONFIDENCE BOUNDS (COMPUTED FOR RANGE OF HYPOTHETICAL PROJECTS)
An alternative approach, suitable for many planning purposes, is given by Fread3. He developed an empirical equation based on numerous simulations with the DAMBRK model and is used in the NWS Simplified Dam Break Model24. The principal advantage of this equation over the Froehlich equation is that the breach development time and width are used and allow the user to compute peak discharge rates for erosion resistant or cohesionless earthfill dams. Estimation of the peak discharge from a dam breach is computed as:
w
3
w1.5
p H + AA WH 3.1 = Qτ
(7)
where: Qp = Dam breach peak discharge (cfs) W = Average breach width (ft), W = Wb + ZbHw (8) Hw = Initial height of water (ft) over the base elevation of the breach τ = Elapsed time for breach development (hrs) A = 23.4 Sa/W (9) and: Sa = Surface area of reservoir (acres) at reservoir level corresponding to depth Hw The first component of Equation 7 is seen as the standard weir equation with the width of the weir crest corresponding to the average breach width (W) and the head on the weir corresponding to the reservoir depth (Hw). This first component of Equation 7 represents the peak discharge for an infinitely large reservoir where there would be no reduction of the reservoir level during erosion of the breach. The
-
20,000
40,000
60,000
80,000
100,000
120,000
140,000
- 500 1,000 1,500 2,000 2,500 3,000
Reservoir Volume (ac-ft)
Peak
Dis
char
ge (c
fs) .
95% Lower Confidence Bound
95% Upper Confidence Bound
Equation 6 Estimate
Page 11
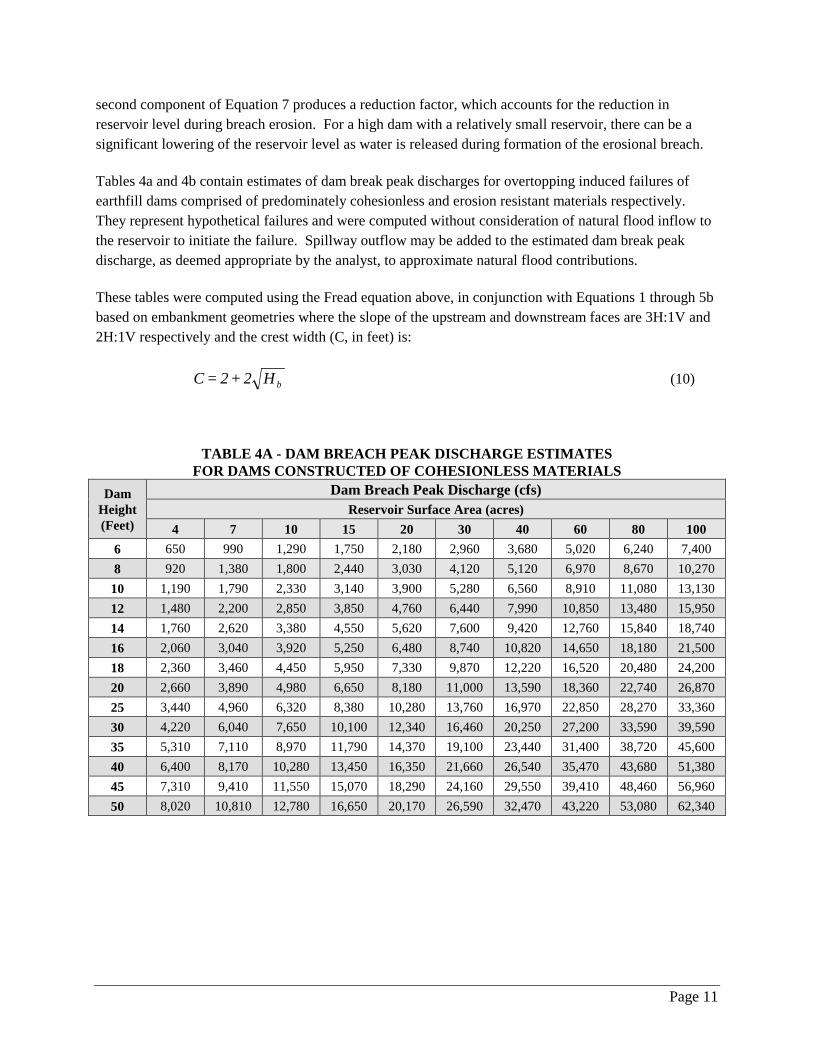
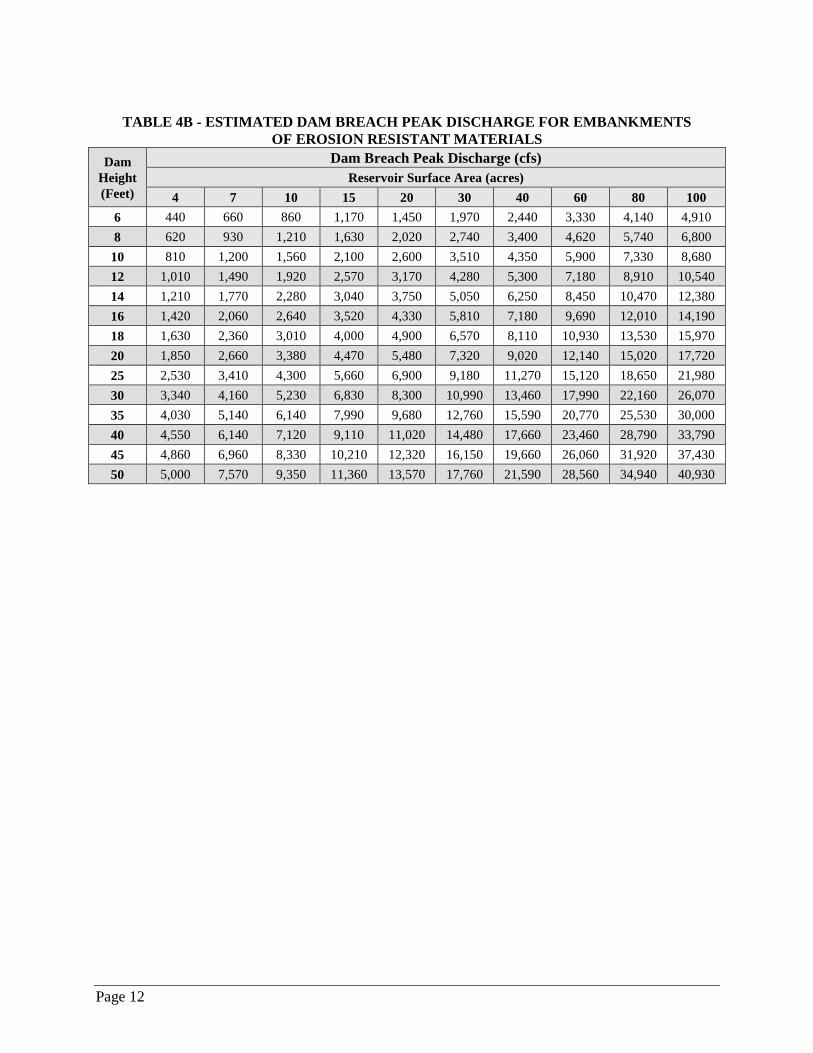
second component of Equation 7 produces a reduction factor, which accounts for the reduction in reservoir level during breach erosion. For a high dam with a relatively small reservoir, there can be a significant lowering of the reservoir level as water is released during formation of the erosional breach. Tables 4a and 4b contain estimates of dam break peak discharges for overtopping induced failures of earthfill dams comprised of predominately cohesionless and erosion resistant materials respectively. They represent hypothetical failures and were computed without consideration of natural flood inflow to the reservoir to initiate the failure. Spillway outflow may be added to the estimated dam break peak discharge, as deemed appropriate by the analyst, to approximate natural flood contributions. These tables were computed using the Fread equation above, in conjunction with Equations 1 through 5b based on embankment geometries where the slope of the upstream and downstream faces are 3H:1V and 2H:1V respectively and the crest width (C, in feet) is: bH2 + 2 = C (10)
TABLE 4A - DAM BREACH PEAK DISCHARGE ESTIMATES
FOR DAMS CONSTRUCTED OF COHESIONLESS MATERIALS Dam
Height (Feet)
Dam Breach Peak Discharge (cfs) Reservoir Surface Area (acres)
4 7 10 15 20 30 40 60 80 100 6 650 990 1,290 1,750 2,180 2,960 3,680 5,020 6,240 7,400 8 920 1,380 1,800 2,440 3,030 4,120 5,120 6,970 8,670 10,270
10 1,190 1,790 2,330 3,140 3,900 5,280 6,560 8,910 11,080 13,130 12 1,480 2,200 2,850 3,850 4,760 6,440 7,990 10,850 13,480 15,950 14 1,760 2,620 3,380 4,550 5,620 7,600 9,420 12,760 15,840 18,740 16 2,060 3,040 3,920 5,250 6,480 8,740 10,820 14,650 18,180 21,500 18 2,360 3,460 4,450 5,950 7,330 9,870 12,220 16,520 20,480 24,200 20 2,660 3,890 4,980 6,650 8,180 11,000 13,590 18,360 22,740 26,870 25 3,440 4,960 6,320 8,380 10,280 13,760 16,970 22,850 28,270 33,360 30 4,220 6,040 7,650 10,100 12,340 16,460 20,250 27,200 33,590 39,590 35 5,310 7,110 8,970 11,790 14,370 19,100 23,440 31,400 38,720 45,600 40 6,400 8,170 10,280 13,450 16,350 21,660 26,540 35,470 43,680 51,380 45 7,310 9,410 11,550 15,070 18,290 24,160 29,550 39,410 48,460 56,960 50 8,020 10,810 12,780 16,650 20,170 26,590 32,470 43,220 53,080 62,340
Page 12
TABLE 4B - ESTIMATED DAM BREACH PEAK DISCHARGE FOR EMBANKMENTS
OF EROSION RESISTANT MATERIALS Dam
Height (Feet)
Dam Breach Peak Discharge (cfs) Reservoir Surface Area (acres)
4 7 10 15 20 30 40 60 80 100 6 440 660 860 1,170 1,450 1,970 2,440 3,330 4,140 4,910 8 620 930 1,210 1,630 2,020 2,740 3,400 4,620 5,740 6,800
10 810 1,200 1,560 2,100 2,600 3,510 4,350 5,900 7,330 8,680 12 1,010 1,490 1,920 2,570 3,170 4,280 5,300 7,180 8,910 10,540 14 1,210 1,770 2,280 3,040 3,750 5,050 6,250 8,450 10,470 12,380 16 1,420 2,060 2,640 3,520 4,330 5,810 7,180 9,690 12,010 14,190 18 1,630 2,360 3,010 4,000 4,900 6,570 8,110 10,930 13,530 15,970 20 1,850 2,660 3,380 4,470 5,480 7,320 9,020 12,140 15,020 17,720 25 2,530 3,410 4,300 5,660 6,900 9,180 11,270 15,120 18,650 21,980 30 3,340 4,160 5,230 6,830 8,300 10,990 13,460 17,990 22,160 26,070 35 4,030 5,140 6,140 7,990 9,680 12,760 15,590 20,770 25,530 30,000 40 4,550 6,140 7,120 9,110 11,020 14,480 17,660 23,460 28,790 33,790 45 4,860 6,960 8,330 10,210 12,320 16,150 19,660 26,060 31,920 37,430 50 5,000 7,570 9,350 11,360 13,570 17,760 21,590 28,560 34,940 40,930
Page 13
3. DOWNSTREAM ROUTING OF DAM BREAK FLOOD Flood routing is the term used to describe the movement of a flood wave as it traverses a reach of channel. Of particular interest in flood routing are: the reduction of the peak discharge as it moves downstream (attenuation); the travel time of the flood peak between points of interest; the maximum water stage at points of interest; and the change in shape of the flood hydrograph as it moves downstream. These effects are governed by factors such as: the channel bedslope; the cross-sectional area and geometry of the main channel and overbank areas; the roughness of the main channel and overbank; the existence of storage of floodwaters in off-channel areas offset from active water conveyance areas; and the shape of the flood hydrograph as it enters the channel reach. These factors may be grouped as follows (Table 5) to indicate the relative amount of attenuation that may be expected.
TABLE 5 - FLOOD ROUTING ATTENUATION CHARACTERISTICS
SMALL ATTENUATION
LARGE ATTENUATION
CONSIDERATIONS
LARGE RESERVOIR VOLUME
SMALL RESERVOIR VOLUME
RELATIVE COMPARISON BETWEEN RESERVOIR STORAGE VOLUME AND
STORAGE CAPACITY OF DOWNSTREAM CHANNEL AND
FLOODPLAIN
SMALL CONFINING CHANNEL AND STEEP CHANNEL SLOPES
BROAD FLOODPLAIN AND/OR
OFF-CHANNEL STORAGE AREAS AND MILD CHANNEL SLOPES
GENERALLY, SLOPES GREATER
THAN ABOUT 1% ARE CONSIDERED STEEP
LITTLE FRICTIONAL RESISTANCE IN CHANNEL AND OVERBANK AREAS
LARGE FRICTIONAL RESISTANCE IN CHANNEL AND OVERBANK AREAS
PRESENCE OF SCRUBS, TREES, CROPS
IN OVERBANK AREAS
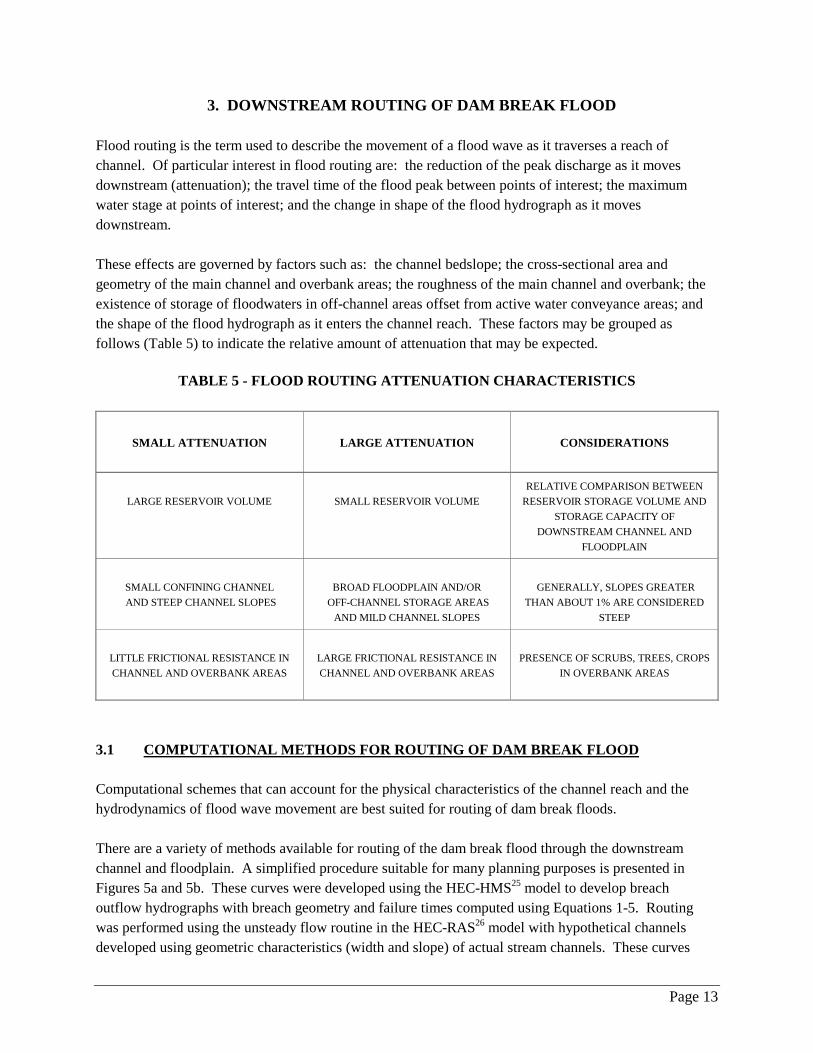
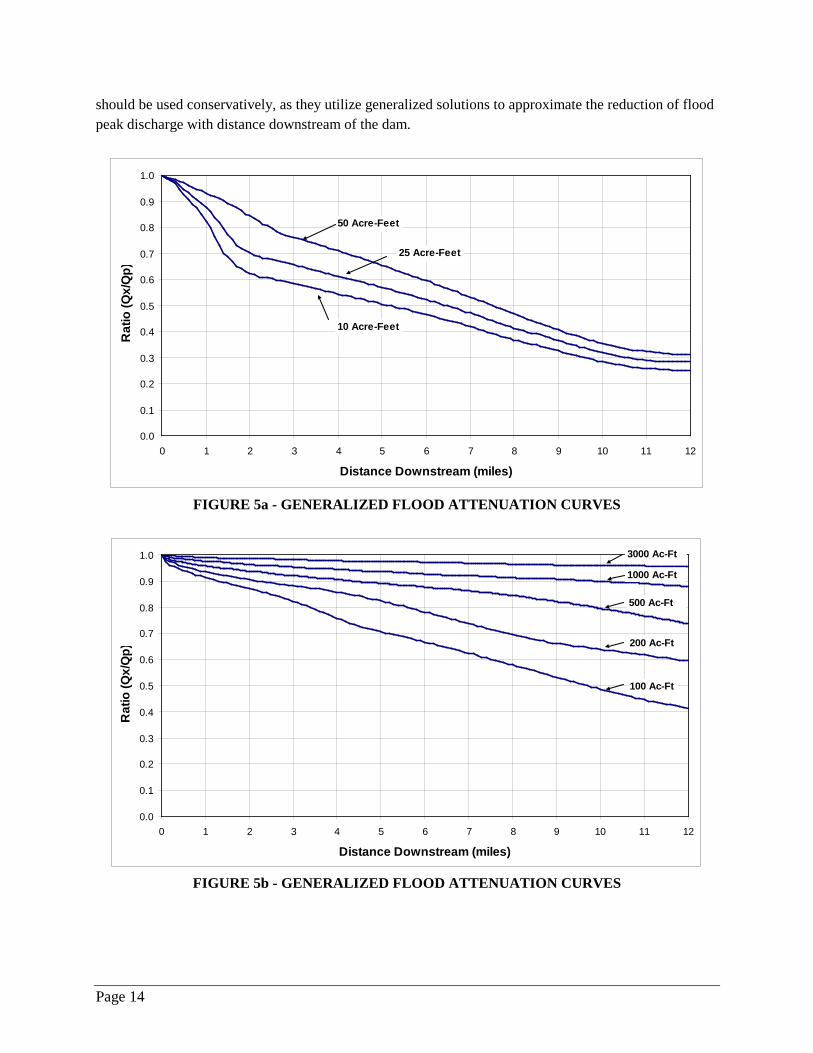
3.1 COMPUTATIONAL METHODS FOR ROUTING OF DAM BREAK FLOOD Computational schemes that can account for the physical characteristics of the channel reach and the hydrodynamics of flood wave movement are best suited for routing of dam break floods. There are a variety of methods available for routing of the dam break flood through the downstream channel and floodplain. A simplified procedure suitable for many planning purposes is presented in Figures 5a and 5b. These curves were developed using the HEC-HMS25 model to develop breach outflow hydrographs with breach geometry and failure times computed using Equations 1-5. Routing was performed using the unsteady flow routine in the HEC-RAS26 model with hypothetical channels developed using geometric characteristics (width and slope) of actual stream channels. These curves
Page 14
should be used conservatively, as they utilize generalized solutions to approximate the reduction of flood peak discharge with distance downstream of the dam.
0.0
0.1
0.2
0.3
0.4
0.5
0.6
0.7
0.8
0.9
1.0
0 1 2 3 4 5 6 7 8 9 10 11 12
Distance Downstream (miles)
Rat
io (Q
x/Q
p)
10 Acre-Feet
25 Acre-Feet
50 Acre-Feet
FIGURE 5a - GENERALIZED FLOOD ATTENUATION CURVES
0.0
0.1
0.2
0.3
0.4
0.5
0.6
0.7
0.8
0.9
1.0
0 1 2 3 4 5 6 7 8 9 10 11 12
Distance Downstream (miles)
Rat
io (Q
x/Q
p)
3000 Ac-Ft
100 Ac-Ft
200 Ac-Ft
500 Ac-Ft
1000 Ac-Ft
FIGURE 5b - GENERALIZED FLOOD ATTENUATION CURVES

Page 15
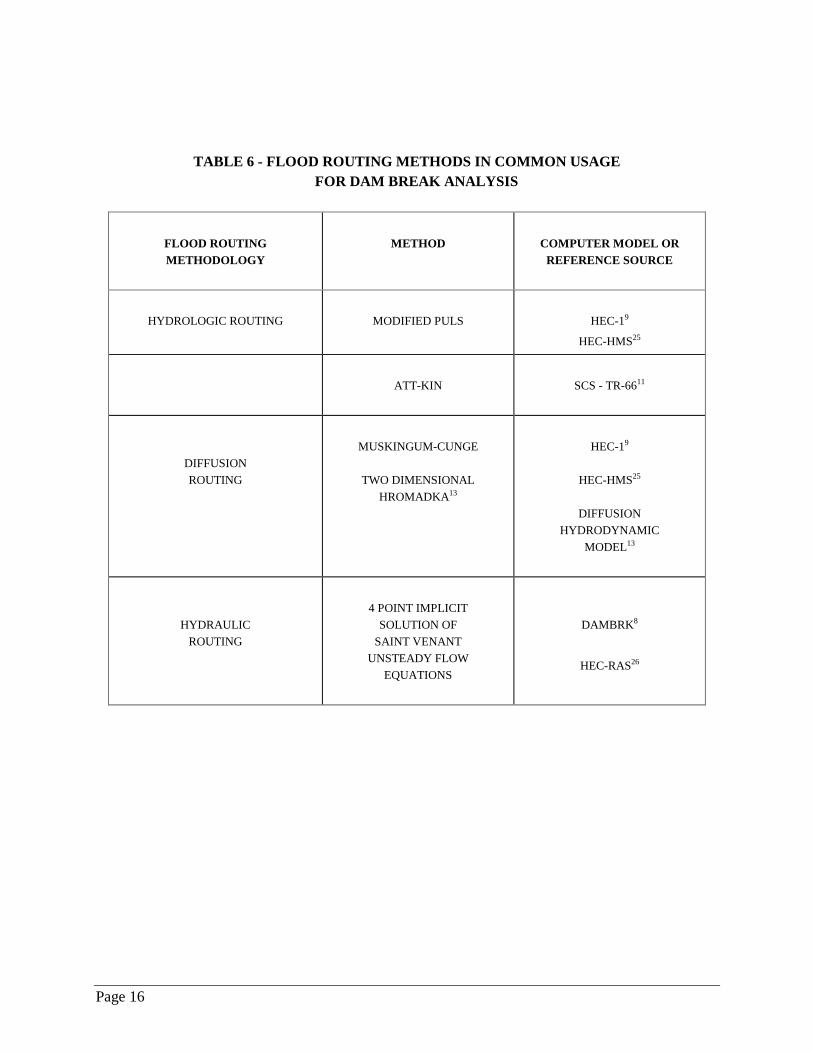
The family of attenuation curves contained in Figures 5a and 5b are arranged according to reservoir storage volume (acre-feet). The attenuation is described in terms of the dam break peak discharge (Qp) at the dam site and the peak discharge (Qx) at some distance downstream. More sophisticated routing methods, in increasing order of sophistication, include: hydrologic; diffusion; and hydraulic routing. Examples of these methods are listed in Table 6. Flood routing should be continued to a point downstream where the dam break flood no longer poses a risk to life and there is limited potential for further property damage. Flood routing is often terminated when the dam break flood enters a large body of water that could accommodate the floodwaters without a significant increase in water level or when the flood has attenuated to a level that is within the 100-year floodplain for the receiving stream. In the latter case, flood plain inundation maps may be available (through the Federal Emergency Management Agency (FEMA)) for use in inundation mapping in these areas. When routing dam break floods in steep channels, care should be exercised to realistically account for the large magnitude energy losses produced by abrupt changes in channel geometry and alignment. Investigations by Jarrett14,15,16 have shown that supercritical flow is uncommon in steep natural channels, particularly mountain streams. The irregularity of the channel geometry, presence of boulders and frequent changes in channel alignment cause large energy losses that generally restrict flow to the subcritical range. Artificially large Manning's n values are often needed to account for the increased roughness and energy losses posed by the above conditions and maintain subcritical (Froude Number less than 1) conditions in the model.
Page 16
TABLE 6 - FLOOD ROUTING METHODS IN COMMON USAGE FOR DAM BREAK ANALYSIS
FLOOD ROUTING METHODOLOGY
METHOD
COMPUTER MODEL OR
REFERENCE SOURCE
HYDROLOGIC ROUTING
MODIFIED PULS
HEC-19
HEC-HMS25
ATT-KIN
SCS - TR-6611
DIFFUSION ROUTING
MUSKINGUM-CUNGE
TWO DIMENSIONAL
HROMADKA13
HEC-19
HEC-HMS25
DIFFUSION
HYDRODYNAMIC MODEL13
HYDRAULIC ROUTING
4 POINT IMPLICIT
SOLUTION OF SAINT VENANT
UNSTEADY FLOW EQUATIONS
DAMBRK8
HEC-RAS26
Page 17
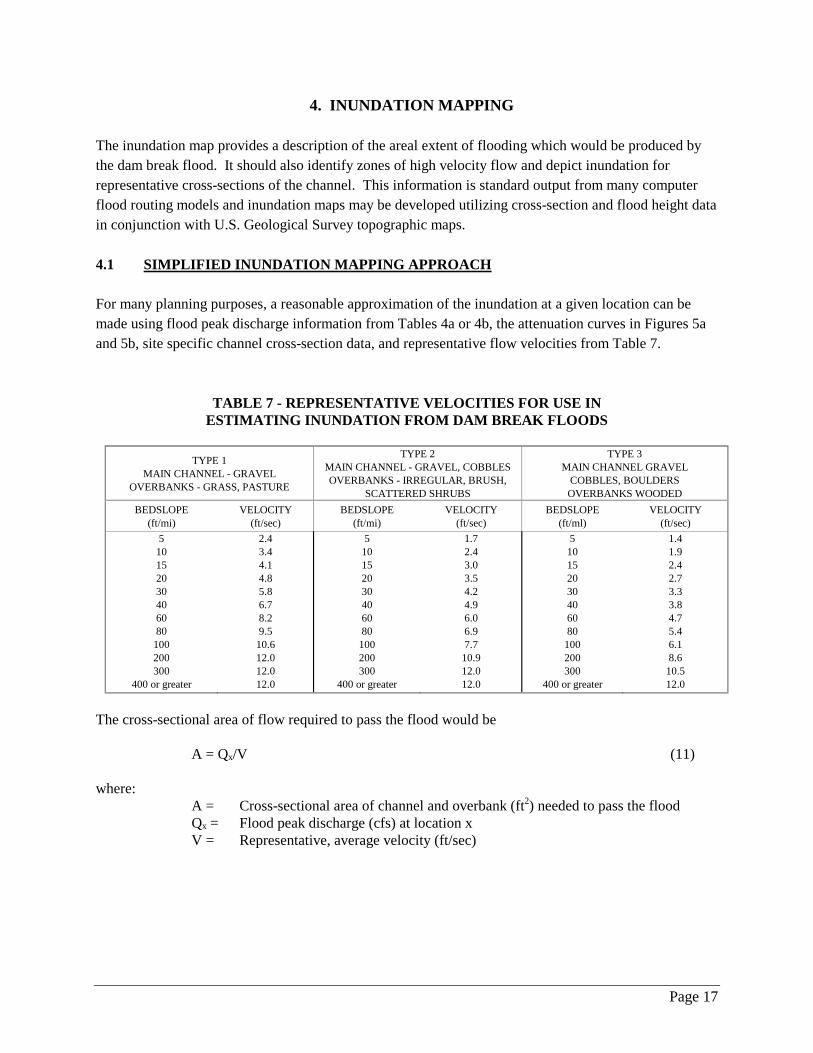
4. INUNDATION MAPPING The inundation map provides a description of the areal extent of flooding which would be produced by the dam break flood. It should also identify zones of high velocity flow and depict inundation for representative cross-sections of the channel. This information is standard output from many computer flood routing models and inundation maps may be developed utilizing cross-section and flood height data in conjunction with U.S. Geological Survey topographic maps. 4.1 SIMPLIFIED INUNDATION MAPPING APPROACH For many planning purposes, a reasonable approximation of the inundation at a given location can be made using flood peak discharge information from Tables 4a or 4b, the attenuation curves in Figures 5a and 5b, site specific channel cross-section data, and representative flow velocities from Table 7.
TABLE 7 - REPRESENTATIVE VELOCITIES FOR USE IN ESTIMATING INUNDATION FROM DAM BREAK FLOODS
TYPE 1
MAIN CHANNEL - GRAVEL OVERBANKS - GRASS, PASTURE
TYPE 2 MAIN CHANNEL - GRAVEL, COBBLES OVERBANKS - IRREGULAR, BRUSH,
SCATTERED SHRUBS
TYPE 3 MAIN CHANNEL GRAVEL
COBBLES, BOULDERS OVERBANKS WOODED
BEDSLOPE (ft/mi)
VELOCITY (ft/sec)
BEDSLOPE (ft/mi)
VELOCITY (ft/sec)
BEDSLOPE (ft/ml)
VELOCITY (ft/sec)
5 10 15 20 30 40 60 80
100 200 300
400 or greater
2.4 3.4 4.1 4.8 5.8 6.7 8.2 9.5
10.6 12.0 12.0 12.0
5 10 15 20 30 40 60 80
100 200 300
400 or greater
1.7 2.4 3.0 3.5 4.2 4.9 6.0 6.9 7.7
10.9 12.0 12.0
5 10 15 20 30 40 60 80
100 200 300
400 or greater
1.4 1.9 2.4 2.7 3.3 3.8 4.7 5.4 6.1 8.6
10.5 12.0
The cross-sectional area of flow required to pass the flood would be A = Qx/V (11) where: A = Cross-sectional area of channel and overbank (ft2) needed to pass the flood Qx = Flood peak discharge (cfs) at location x V = Representative, average velocity (ft/sec)
Page 18
4.2 FACTOR OF SAFETY FOR INUNDATION MAPPING Whether using the results of the simplified method above, or data from computer modeling, one should consider the potential effects of debris buildup and sediment transport. The inundation map should represent a conservative estimate of the consequences of a dam failure. To account for uncertainties in the analysis methods and site-specific conditions, a safety factor should be added to the computed dam break flood elevations. Common practice is to add 0.5 to 2.0 feet to the computed dam break flood elevations to account for uncertainty in the analysis methods. Lesser amounts may be warranted where shallow sheet flooding occurs and larger amounts would be appropriate where there is the potential for higher levels of debris build-up and sediment deposition.
Page 19
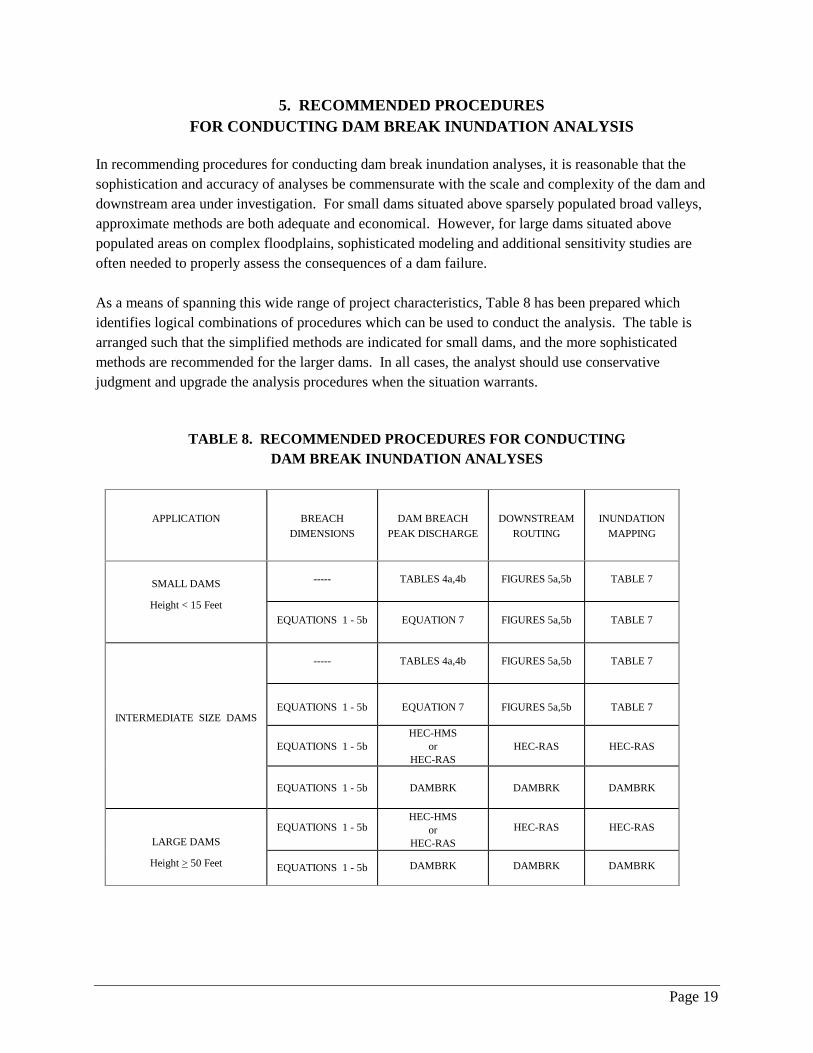
5. RECOMMENDED PROCEDURES FOR CONDUCTING DAM BREAK INUNDATION ANALYSIS
In recommending procedures for conducting dam break inundation analyses, it is reasonable that the sophistication and accuracy of analyses be commensurate with the scale and complexity of the dam and downstream area under investigation. For small dams situated above sparsely populated broad valleys, approximate methods are both adequate and economical. However, for large dams situated above populated areas on complex floodplains, sophisticated modeling and additional sensitivity studies are often needed to properly assess the consequences of a dam failure. As a means of spanning this wide range of project characteristics, Table 8 has been prepared which identifies logical combinations of procedures which can be used to conduct the analysis. The table is arranged such that the simplified methods are indicated for small dams, and the more sophisticated methods are recommended for the larger dams. In all cases, the analyst should use conservative judgment and upgrade the analysis procedures when the situation warrants.
TABLE 8. RECOMMENDED PROCEDURES FOR CONDUCTING DAM BREAK INUNDATION ANALYSES
APPLICATION
BREACH DIMENSIONS
DAM BREACH
PEAK DISCHARGE
DOWNSTREAM
ROUTING
INUNDATION
MAPPING
SMALL DAMS
Height < 15 Feet
----- TABLES 4a,4b FIGURES 5a,5b TABLE 7
EQUATIONS 1 - 5b EQUATION 7 FIGURES 5a,5b TABLE 7
INTERMEDIATE SIZE DAMS
----- TABLES 4a,4b FIGURES 5a,5b TABLE 7
EQUATIONS 1 - 5b EQUATION 7 FIGURES 5a,5b TABLE 7
EQUATIONS 1 - 5b HEC-HMS
or HEC-RAS
HEC-RAS HEC-RAS
EQUATIONS 1 - 5b DAMBRK DAMBRK DAMBRK
LARGE DAMS
Height > 50 Feet
EQUATIONS 1 - 5b HEC-HMS
or HEC-RAS
HEC-RAS HEC-RAS
EQUATIONS 1 - 5b DAMBRK DAMBRK DAMBRK
Page 20
5.1 RESERVOIR CONDITIONS AT TIME OF DAM FAILURE While there are various applications for dam break inundation analysis, the common purpose is to assess the consequences posed by dam failure and release of the reservoir contents. Thus, the magnitude of reservoir storage is an important consideration in the analysis. Two reservoir conditions, normal pool and maximum storage elevation, are usually examined in assessing the downstream consequences. Dam failure with the reservoir level at normal pool is often termed a "sunny day" failure and there may be little or no advance indication of the onset of failure. Conversely, a dam failure with the reservoir level at, or near, the dam crest is usually associated with an extreme flood event. In this case, several hours of advance warning may be available due to the obvious extreme meteorological conditions which produce the flooding. Therefore, these two reservoir conditions are important because they represent the potential for two different dam break flood magnitudes and because the circumstances surrounding these two types of failure events may pose significantly different situations for consequences to life and property and warning of downstream inhabitants. Another consideration associated with reservoir operation is the magnitude of the natural inflow and concurrent spillway releases at the assumed time of dam failure. These can also be important elements of the analysis and the values selected should be consistent with the hypothesized conditions at failure and the intended purpose of the analysis. The various applications and recommended procedures are discussed below.
5.1.1 Dam Failure at Normal Pool Condition For a hypothesized failure at normal pool, it is reasonable to use quantities of reservoir inflow and outflow which are representative of the conditions or season(s) of the year at which normal pool occurs. If the HEC-HMS25 or DAMBRK8 computer model is used for the analysis, this is accomplished by including the natural inflow and outlet works/spillway outflow quantities as input parameters to the model. As a practical matter, the resultant dam break flood for the normal pool condition is relatively insensitive to the magnitude of reservoir inflow and outflow because the inflow/outflow are typically very small by comparison to the dam break flood. If Table 4a or 4b, or if equations 1 through 7 are used to estimate the dam break flood peak discharge, the natural outflow from outlet works or spillways may either be added to the dam break flood peak or discarded based on the judgment of the analyst as to the magnitude of outflow and the site specific considerations.
5.1.2 Dam Failure at Maximum Storage Elevation - Flood Condition Dam failure during a flood generally produces a larger dam break flood than a failure at normal pool because of the larger quantity of stored water. Guidance for conducting dam break inundation analyses for flood conditions is more complicated than analyses for the normal pool condition because of the need to account for the magnitude of flood inflow and spillway outflow at the
Page 21
assumed time of failure. Issues related to dam failure analysis during flood conditions are discussed below. Maximum Storage Elevation - WAC 173-175-030 defines maximum storage elevation to be "the maximum attainable water surface elevation of the reservoir pool that could occur during extreme operating conditions. This elevation normally corresponds to the crest elevation of the dam." Dam failure analysis for the flood condition is normally taken to be an analysis for failure due to dam overtopping. Thus, the reservoir level at the assumed time of failure would be at, or above, the dam crest elevation. The exception is when the project can accommodate the Probable Maximum Flood (PMF) and freeboard would exist at the time the maximum reservoir level is attained. For this case, failure is assumed to occur at the time the maximum storage elevation is reached. Reservoir Inflow/Outflow - There is some discretion allowed in the selection of an appropriate reservoir inflow and concurrent spillway outflow for dam failure analysis during flood conditions. As a strict academic interpretation, in order to initiate dam overtopping, the reservoir inflow should correspond to a flood larger than that used in the design of the project. The exception would be if the project is capable of accommodating the PMF, then the PMF would be used as the inflow flood. Adherence to this strict interpretation may, however, result in unnecessary time and expense in modeling the inflow flood and spillway releases - and not necessarily produce results which are superior to those produced by approximate methods. Alternative methods for accounting for the reservoir inflow/outflow are proposed in the following sections for use in the various applications. These methods have generally been found to produce acceptable results, particularly for small and intermediate size dams, while avoiding the time and expense of more sophisticated computer model analyses. Applications of dam break inundation analysis for the case of failure during a flood are briefly discussed in the following sections. Guidance in selecting methods of analysis and appropriate procedures are also given.
5.1.2.1 Use in Downstream Hazard Classification Analysis The determination of the appropriate downstream hazard class (see section 6) is not overly sensitive to the selection of the magnitude of the natural flood inflow at the time of failure. While the magnitude of inflow is a contributing factor, the release of the reservoir waters is usually a dominant consideration (all other considerations being equal) in determining the magnitude of the dam break flood and the downstream consequences. In addition, the downstream hazard classes represent a broad range of consequences and oftentimes, even crude methods of analysis are sufficient to indicate the appropriate classification. Thus, the use of simplified dam break methodologies usually results in the same downstream
Page 22
hazard class as that determined by more sophisticated methods. Accordingly, approximate methods for incorporating the natural inflow/outflow into the dam break analysis are acceptable for use at small and intermediate size dams. Experience in the Dam Safety Office indicates that the use of the 100 year flood peak discharge as the inflow quantity and concurrent spillway outflow generally yields results which are representative of a dam failure by overtopping and produces results that are within the range of accuracy of available methods of analyses. When using Tables 4a or 4b, or equations 1 through 7, the dam break flood can be computed by simply adding the natural spillway outflow quantity to the estimated dam break flood peak discharge. The reader should be advised that situations will occur where more detailed accounting of reservoir inflow and outflow will be needed in conjunction with the HEC-HMS25, HEC-RAS,26 or DAMBRK8 computer models to determine the appropriate downstream hazard class. In these instances, sensitivity analyses are often warranted (see section 5.2) in addition to more sophisticated analyses. The appropriate downstream hazard class is ultimately determined based on the more severe consequences of failure for the two reservoir conditions, normal pool and maximum storage elevation.
5.1.2.2 Use in Selecting Design/Performance Levels for Critical Project Elements An important application of dam break inundation analyses is in the selection of design/performance levels for the design of critical project elements. In this usage, the dam break inundation analysis is used to assess the potential consequences of dam failure on life and property in downstream areas. The underlying philosophy is that the greater the hazard posed by a failure - the more stringent is the design criteria needed to provide an acceptable level of protection for public safety. Detailed procedures for utilizing dam break inundation analysis in the selection of design/performance levels is presented in Technical Note 2 of the Dam Safety Guidelines. With regard to the selection of the magnitude of inflow to the reservoir and spillway outflow, the procedures outlined above for use in downstream hazard classification are generally acceptable for use in this application. In addition, the hierarchy of recommended procedures for conducting dam break inundation analysis displayed in Table 8 are compatible with procedures in Technical Note 2.
5.1.2.3 Use in Incremental Damage Analysis Another important application of dam break inundation analyses is in conducting Incremental Damage Analyses. In these analyses, an assessment is made of the impacts of the dam break
Page 23
flood relative to the damage caused by the natural flooding which precedes it. This procedure can sometimes be used for determining the magnitude of an acceptable Inflow Design Flood (IDF) and sizing the emergency spillway. In general, it has application where a dam and reservoir are "small" relative to the watershed it occupies. In such "run of the river projects”, the potential damages from a dam failure may be small relative to the magnitude of damages from natural flooding which can be produced in the tributary watershed. This methodology is discussed in detail in Part IV of the Dam Safety Guidelines, Dam Design and Construction. For this application, the magnitude of inflow to the reservoir and spillway outflow are critical considerations. The reservoir inflow is usually based on rainfall-runoff modeling of the watershed and the spillway releases are based upon the proposed configuration and operation of the project's spillways. Because the objective of this type of analysis is to examine incremental increases in flooding and damages caused directly by the dam failure, only hydraulic routing methods, such as contained in the HEC-RAS25 and DAMBRK8 computer models, are sufficiently sophisticated to be used in the analysis.
5.1.3 Dam Failure at Maximum Storage Elevation - Off-Channel Storage Reservoirs Inflow to off-channel storage reservoirs is usually regulated by man-made controls, such as diversion channels, pumps, gates, etc. For purposes of conducting a hypothetical dam failure analysis at the maximum storage elevation, it is usually assumed that failure or misoperation of the inflow regulating mechanism(s) causes the reservoir level to reach the dam crest elevation. In this particular case, the magnitude of the dam break flood is relatively insensitive to the regulated reservoir inflow and outflow because the inflow/outflow quantities are usually very small compared to the dam break flood. If computer modeling is used, the analysis is accomplished by including the natural inflow and spillway outflow quantities as input parameters to the model. If Table 4a or 4b, or if equations 1 through 7 are used to estimate the dam break flood, the natural outflow from spillways may either be added to the dam break flood peak discharge or discarded based on the judgment of the analyst as to the magnitude of outflow and the site specific considerations.
5.2 SENSITIVITY ANALYSES In conducting a dam break inundation analysis, there are numerous sources of uncertainty. In hypothesizing a mode of failure, estimating breach dimensions and the time for breach development, assumptions must be made and parameters selected which directly affect the magnitude of the resultant dam break flood. In addition, dam break floods usually produce flooding at a scale unprecedented in the downstream valley. The great magnitude of the flood and the complexity in attempting to model the three dimensional flow results in uncertainties about the computed levels of inundation.
Page 24
Fortunately, studies by Fread3 have shown that "errors associated with the breach characteristics dampen as the flood propagates downstream. Also, the percent error in the computed flow depth is less than that for routed discharge, cross-sectional area and/or flow resistance". These error properties tend to mitigate the uncertainties involved in the many computational steps of the analysis. Nonetheless, where minor differences in the estimated flow depth and inundation area significantly alter the potential consequences to life or property, then sensitivity studies should be included in the analysis. The sensitivity studies should address how alternative parameters for breach size, time of breach development, initial reservoir conditions, downstream channel and overbank roughness, etc., affect the computed flow depth in downstream areas. In the final analysis, the parameters should be conservatively chosen after due consideration of the likely best estimates and how sensitive the final solution is to the parameters selected. To account for uncertainties in the analysis methods and site-specific conditions, 0.5 to 2.0 feet should be added to the computed dam break flood inundation elevations as a factor of safety. Lesser amounts may be warranted where shallow sheet flooding occurs and larger amounts would be appropriate where there is the potential for higher levels of debris build-up and sediment deposition. 5.3 MULTIPLE DAMS – SEQUENTIAL FAILURE OF DOWNSTREAM DAM It sometimes occurs that two or more dams are constructed on a watercourse, and the failure of an upstream dam may cause a sequential failure of a downstream dam. In this situation, there is a sudden influx of water into the downstream reservoir which may overtop the dam and result in a failure of the downstream dam. When analyzing the effects of a dam failure, the potential for failure of downstream dams and their contribution to the flood discharge should be included in the analysis. Two approaches are presented in this section for analyzing the flooding effects of multiple dam failures. The first approach is simple to apply and provides a conservative estimate of the peak discharge at downstream dams. The second approach provides discharge, breach dimensions, and breach formation time at each downstream dam, which is useful for hydrograph computation and routing.
5.3.1 Multiple Dam Break Estimation, Simple Approach
This is a simple approach for estimating the peak discharge below one or more dams subjected to failure from an upstream dam. This approach provides the peak discharge below each dam but does not provide the failure time or breach dimensions for each downstream dam. With this method, it is assumed that each dam on the water course fails independently of each other. Equations 1-9 are used to compute the peak discharge for each dam. Values contained in Tables 4a and 4b may also be used to estimate the discharge at each dam. The final dam break peak discharge below each dam is then computed as the sum of the peak discharges from all upstream dams. If a hydrograph is required below one or more downstream dams, then the approach described in Section 5.3.2 should be used.
Page 25
The procedures in Section 3 may be used to route the dam breach flood down a water course with a series of cascading dam failures. The peak discharge Qp is first computed for each dam using the methods described above. The flood peak attenuation curves (Figures 5a and 5b) may then be used with the reservoir volume corresponding to the total volume of all upstream reservoirs. If the failure of the upstream dam would cause failure of the downstream dam, then the downstream hazard classification for the upstream dam must be as high or higher than the downstream dam(s).
5.3.2 Multiple Dam Break Estimation, Detailed Approach
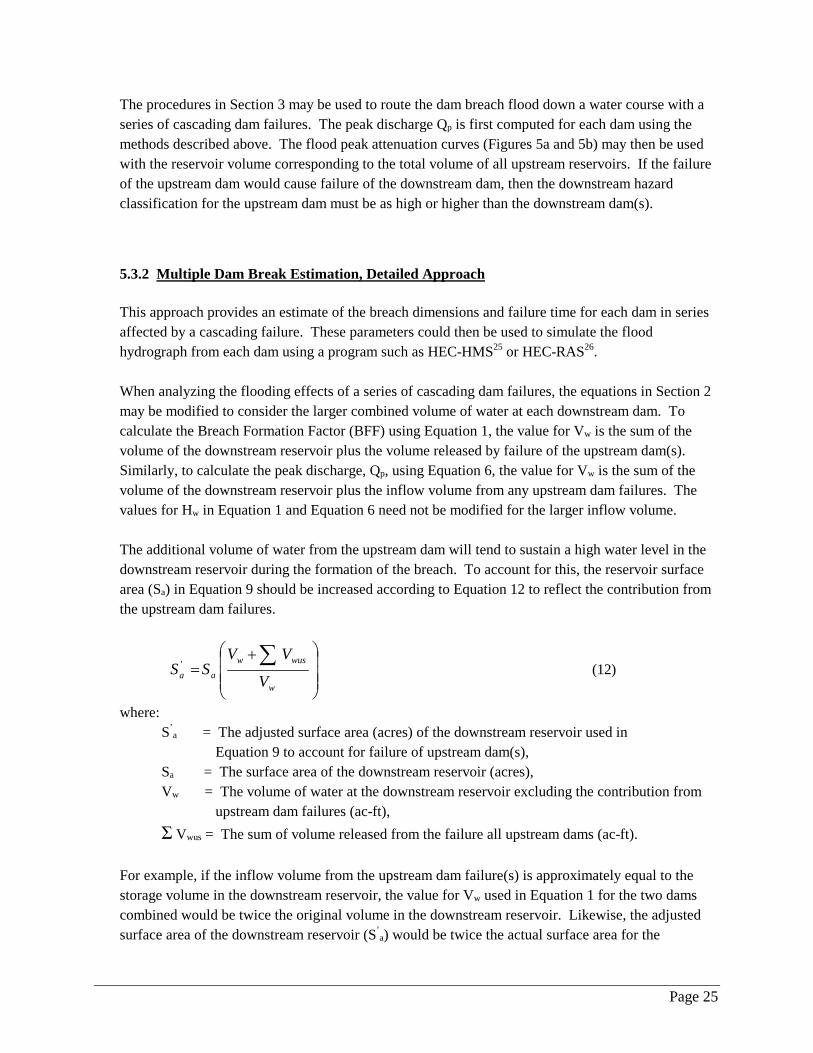
This approach provides an estimate of the breach dimensions and failure time for each dam in series affected by a cascading failure. These parameters could then be used to simulate the flood hydrograph from each dam using a program such as HEC-HMS25 or HEC-RAS26. When analyzing the flooding effects of a series of cascading dam failures, the equations in Section 2 may be modified to consider the larger combined volume of water at each downstream dam. To calculate the Breach Formation Factor (BFF) using Equation 1, the value for Vw is the sum of the volume of the downstream reservoir plus the volume released by failure of the upstream dam(s). Similarly, to calculate the peak discharge, Qp, using Equation 6, the value for Vw is the sum of the volume of the downstream reservoir plus the inflow volume from any upstream dam failures. The values for Hw in Equation 1 and Equation 6 need not be modified for the larger inflow volume. The additional volume of water from the upstream dam will tend to sustain a high water level in the downstream reservoir during the formation of the breach. To account for this, the reservoir surface area (Sa) in Equation 9 should be increased according to Equation 12 to reflect the contribution from the upstream dam failures.
+=
∑w
wuswaa V
VVSS ' (12)
where: S’
a = The adjusted surface area (acres) of the downstream reservoir used in Equation 9 to account for failure of upstream dam(s),
Sa = The surface area of the downstream reservoir (acres), Vw = The volume of water at the downstream reservoir excluding the contribution from
upstream dam failures (ac-ft), Σ Vwus = The sum of volume released from the failure all upstream dams (ac-ft).
For example, if the inflow volume from the upstream dam failure(s) is approximately equal to the storage volume in the downstream reservoir, the value for Vw used in Equation 1 for the two dams combined would be twice the original volume in the downstream reservoir. Likewise, the adjusted surface area of the downstream reservoir (S’
a) would be twice the actual surface area for the
Page 26
downstream reservoir (Sa) per Equation 12. If the inflow volume from the upstream dam failure(s) is twice the volume in the downstream reservoir, the value for Vw for the downstream dam would be three times the original volume of the downstream reservoir and the adjusted surface area S’
a would be three times the actual surface area for the downstream reservoir. The procedures in Section 3 may be used to route the dam breach flood down a water course with a series of cascading dam failures. The peak discharge Qp is first computed for each dam using the methods described above. The flood peak attenuation curves (Figures 5a and 5b) may then be used with the combined reservoir volume Vw as calculated per this section. If the failure of the upstream dam would cause failure of the downstream dam, then the downstream hazard classification for the upstream dam must be as high or higher than the downstream dam(s). Downstream hazard classification is described in Sections 6 and 7.
Page 27
6. DOWNSTREAM HAZARD CLASSIFICATION
Downstream hazard is defined as "the potential loss of life or property damage downstream of a dam from floodwaters released at the dam or waters released by partial or complete failure of the dam"18 . Downstream Hazard Classification does not correspond to the condition of the dam or appurtenant works, nor the anticipated performance or operation of the dam. Rather, it is descriptive of the setting in areas downstream of the dam and is an index of the relative magnitude of the potential consequences to human life and development should a particular dam fail. The Downstream Hazard Classification is used for a variety of purposes in the Dam Safety Regulations Chapter 173-175 WAC, in the Dam Safety Guidelines, and in the internal operations of the State Dam Safety Program. Uses include: • A reasonably concise indicator of the relative magnitude of the downstream consequences from
failure of a given dam. • An index for establishing general design requirements and criteria. • An index for identifying those dams where an emergency action plan is required. • A management tool for allocating time and prioritizing the State Dam Safety Program activities for:
construction inspection; periodic inspection; and compliance and enforcement. • A classification system compatible with national criteria for Downstream Hazard Classification and
incorporation into national databases on dam characteristics.
Page 28
7. DOWNSTREAM HAZARD CLASSIFICATION SYSTEM
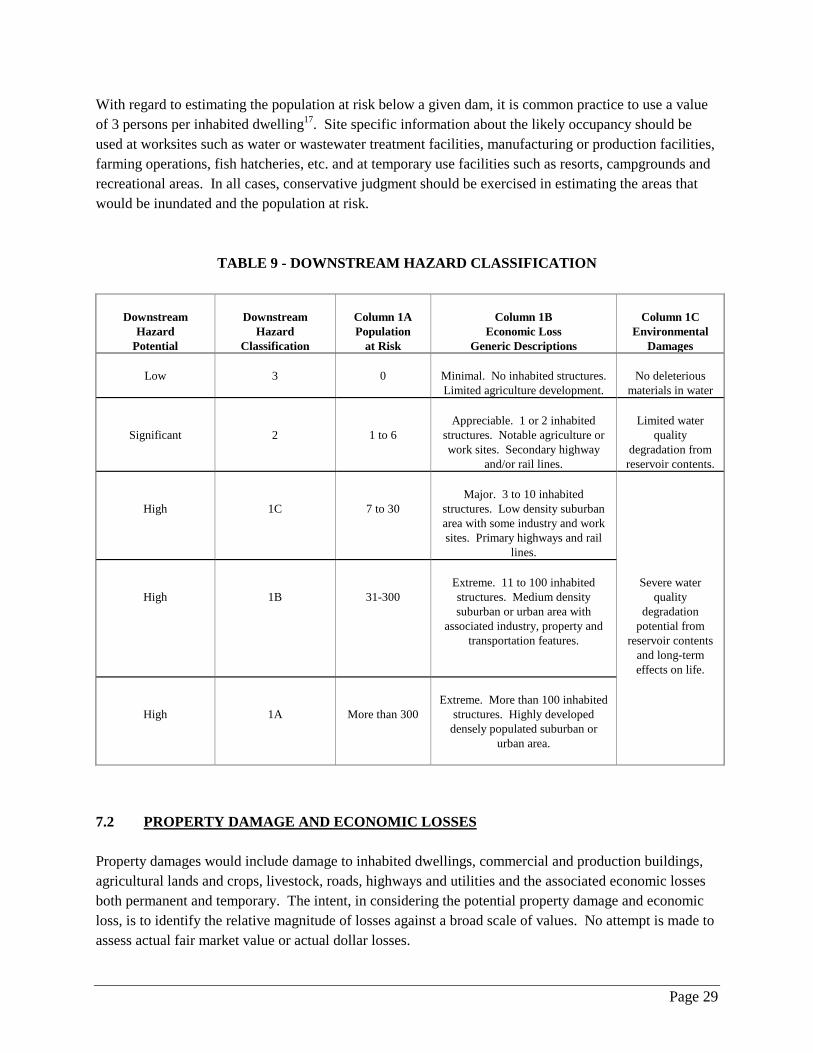
The downstream hazard classification system adopted for use in Washington State is shown in Table 9. It is similar to systems in common usage in other State Dam Safety programs and has similarities to national hazard classification systems described in the Recommended Guidelines for Safety Inspection of Dams19 developed by the Army Corps of Engineers and the Downstream Hazard Classification Guidelines17 developed by the Bureau of Reclamation. In determining the downstream hazard classification of a given project, hypothetical dam failures should be evaluated for two reservoir conditions - normal pool level, and maximum storage elevation during flood conditions. The more severe consequences of failure for the two conditions should be used to establish the classification. In most cases, failure at the maximum storage elevation will produce the greater consequences. However, there are situations, such as where temporary use or recreational areas are located downstream of dams, where a sunny day failure at normal pool condition could pose the more severe consequences. As outlined in Table 9, there are three principal considerations: the potential for loss of human life; the potential magnitude of property damage and corresponding economic losses; and the potential environmental damages. When comparing the relative consequences as listed in Columns 9A, 9B and 9C of Table 9, the most severe consequence will govern the selection of the hazard class. As a final consideration, the potential for future downstream development should be investigated to determine if the classification might increase in the future. Each of these considerations is discussed below. 7.1 POPULATION AT RISK The potential for loss of life is the primary factor in determining the downstream hazard classification. For purposes of classification, the Population at Risk (PAR) is used to represent the potential for loss of life. This essentially corresponds to the number of people who would have to be evacuated from downstream areas in the event of a dam failure. Population at risk is defined in WAC 173-175-030 as - "the number of people who may be present in areas downstream of a dam and could be in danger in the event of a dam failure". This definition includes persons at permanent dwellings, worksites and at temporary use areas. As general guidance, an inundation depth of 1 foot or more at a given dwelling, worksite or temporary use area can be used to indicate a hazard to life. Alternatively, the Bureau of Reclamation has published more detailed information on the hazards posed by various combinations of floodwater depth and velocity and has extensive commentary on classifying the downstream hazard in their publication Downstream Hazard Classification Guidelines17.
Page 29
With regard to estimating the population at risk below a given dam, it is common practice to use a value of 3 persons per inhabited dwelling17. Site specific information about the likely occupancy should be used at worksites such as water or wastewater treatment facilities, manufacturing or production facilities, farming operations, fish hatcheries, etc. and at temporary use facilities such as resorts, campgrounds and recreational areas. In all cases, conservative judgment should be exercised in estimating the areas that would be inundated and the population at risk.
TABLE 9 - DOWNSTREAM HAZARD CLASSIFICATION
Downstream
Hazard Potential
Downstream
Hazard Classification
Column 1A Population
at Risk
Column 1B
Economic Loss Generic Descriptions
Column 1C
Environmental Damages
Low
3
0
Minimal. No inhabited structures. Limited agriculture development.
No deleterious
materials in water
Significant
2
1 to 6
Appreciable. 1 or 2 inhabited
structures. Notable agriculture or work sites. Secondary highway
and/or rail lines.
Limited water
quality degradation from reservoir contents.
High
1C
7 to 30
Major. 3 to 10 inhabited
structures. Low density suburban area with some industry and work sites. Primary highways and rail
lines.
High
1B
31-300
Extreme. 11 to 100 inhabited structures. Medium density suburban or urban area with
associated industry, property and transportation features.
Severe water
quality degradation
potential from reservoir contents
and long-term effects on life.
High
1A
More than 300
Extreme. More than 100 inhabited
structures. Highly developed densely populated suburban or
urban area.
7.2 PROPERTY DAMAGE AND ECONOMIC LOSSES Property damages would include damage to inhabited dwellings, commercial and production buildings, agricultural lands and crops, livestock, roads, highways and utilities and the associated economic losses both permanent and temporary. The intent, in considering the potential property damage and economic loss, is to identify the relative magnitude of losses against a broad scale of values. No attempt is made to assess actual fair market value or actual dollar losses.
Page 30
Guidance is contained in Column 9B of Table 9 on how the relative amount of property damage and economic loss varies by hazard classification. 7.3 ENVIRONMENTAL DAMAGES Consideration of environmental damages would address situations where the reservoir contains materials which may be deleterious to human or aquatic life or stream habitat. This applies to projects such as: domestic and agricultural waste lagoons; industrial waste lagoons; and mine tailings dams where the reservoir may contain trace amounts of heavy metals, chemical residues from ore processing, or large volumes of sediment in a loose or slurry condition. Temporary damages to stream habitat are also to be considered. This would apply to streams with fisheries of regional significance where large scale channel scour and sediment deposition are likely to result from a dam break flood. A review of Column 9C of Table 9 indicates the classification changes with the relative magnitude of the environmental damages. The most significant factors being the deleterious character of the reservoir contents and the duration of the affects - temporary or permanent. 7.4 CURRENT/FUTURE DEVELOPMENT The downstream hazard classification should reflect the current downstream development and the associated consequences of dam failure. However, it should be recognized that the future downstream development might increase the classification. This is important because the classification is used in Part IV of the Dam Safety Guidelines as an index for setting some of the engineering criteria for design and construction. When using the classification in conjunction with Part IV of the Dam Safety Guidelines, it is advisable to investigate the effect that future downstream development may have in increasing the classification and increasing the minimum design standards/criteria at a given dam. 7.5 MULTIPLE DAMS It sometimes occurs that two or more dams are constructed on a watercourse and the failure of the upstream dam may affect the downstream dam. If the failure of the upstream dam would not cause failure of the downstream dam, then the classification of the upstream dam is determined independently.
Page 31
If the failure of the upstream dam would cause failure of the downstream dam, then the classification for the upstream dam must be as high or higher than the downstream dam(s). 7.6 MINE TAILINGS DAMS The analysis of failure of mine tailings dams and the release of impounded slimes/tailings poses very difficult technical problems. Issues regarding the water content, soil grain size distribution, fluid properties and motility of the slimes/tailings further compound the already difficult technological problems associated with conducting the dam break inundation analysis. Features are available in the DAMBRK8 computer model to approximate this phenomenon. However, the degree of success with this approach or any other method appears to be dependent upon the skill of the analyst and upon the similarity between the assumed properties of the slimes/tailings and the actual field conditions. The Dam Safety Office will be open to methodologies and resultant Downstream Hazard Classifications that can be supported by reasonable analyses. 7.7 SOPHISTICATION OF APPROACH IN DETERMINING DOWNSTREAM HAZARD
CLASSIFICATION A review of Table 9 reveals that the five Downstream Hazard Classes (DHCs) span the entire range of potential consequences. Similarly, each downstream hazard class from DHC 3 to DHC 1A represents a range of consequences. Because of the broad nature of the classifications, the appropriate DHC can often be determined by windshield surveys and limited fieldwork after the dam break flood and its attenuation have been determined. In some cases, more extensive analysis of the dam break flood, inundation mapping and detailed fieldwork will be needed to make a proper determination between two DHCs. Additional discussion on this issue is contained in section 5.1.2.1.

Page 32
8. ENGINEERING REPORTS FOR DAM BREAK INUNDATION ANALYSES
AND DOWNSTREAM HAZARD CLASSIFICATION The computation/estimation of a dam break flood is dependent upon numerous characteristics of the dam, the mode of failure and the volume of storage at the time of failure. Reports that discuss the findings from a Dam Break Inundation Analysis should address the following issues and list the pertinent parameters selected. DAM BREAK FLOOD • The reservoir level and assumed inflow at the time of the hypothetical failure, • The method of estimating/selecting the breaching dimensions and characteristics for the assumed
mode of failure, • The magnitude of the estimated dam break peak discharge at the dam site and the attenuation of the
flood peak discharge as it propagates through the downstream valley. INUNDATION ANALYSIS • The travel time of the flood wave to various locations in the downstream valley, • An inundation map depicting the areal extent of flooding, • Representative channel/valley cross-sections depicting flow depth and typical flow velocities. DOWNSTREAM HAZARD CLASSIFICATION • A general description of the valley and level of development downstream of the dam, • The method used to determine the Downstream Hazard Class.
Page 33
REFERENCES 1. Middlebrooks, T.A., Earth Dam Practice in the United States, ASCE Centennial Transactions
Paper 2620, 1952, pp. 697-722. 2. USACE, Flood Emergency Plans, Guidelines for Corps Dams, Hydrologic Engineering Center,
June 1980. 3. Fread, D.L., Some Limitations of Dam-Breach Flood Routing Models, ASCE Fall Convention,
St. Louis, MO, October 26-30, 1981. 4. MacDonald, Thomas C., and Langridge-Monopolis, Jennifer, Breaching Characteristics of Dam
Failures, ASCE Journal of Hydraulic Engineering, Vol. 110, No. 5, May 1984. 5. Froelich, D.C., Embankment Dam Breach Parameters, Proceedings of the 1987 National
Conference in Hydraulic Engineering, ASCE, New York, August, 1987, pp. 570-575. 6. Fread, D.L., BREACH: An Erosion Model for Earthen Dam Failures, Hydrologic Research
Laboratory, NOAA, NWS, June, 1987. 7. ICODS, Dam Safety Emergency Action Planning Guidelines, Subcommittee on Emergency
Action Planning of ICODS (Interagency Committee on Dam Safety), January, 1983. 8. Fread, D.L., DAMBRK: The NWS-Dam Break Flood Forecasting Model, Office of Hydrology,
National Weather Service, Silver Spring, MD, June 20, 1988. 9. USACE, HEC-1, Flood Hydrograph Package, USER's Manual, Hydrologic Engineering Center,
U.S. Army Corps of Engineers, Davis, CA, September, 1981. 10. USBR, Guidelines for Defining Inundated Areas Downstream from Bureau of Reclamation
Dams, Bureau of Reclamation, Denver, CO June, 1982. 11. SCS, Simplified Dam Breach Routing Procedure, Technical Release 66, U.S. Department of
Agriculture, Soil Conservation Service, 1979. 12. Costa, J.E., Floods from Dam Failures, U.S. Geological Survey Open File Report 85-560, 1985. 13. Hromadka, T.V., Durbin, T.J., Two Dimensional Dam Break Flood-Flow Analysis for Orange
County Reservoir, American Water Resources Association, Vol. 22, No. 2, April, 1986, pp. 249-255.
14. Jarrett, R.D., Hydraulics of High Gradient Streams, ASCE Journal of Hydraulic Engineering,
Vol. 110, November, 1984, pp 1519-1539 15. Trieste, D.J., Jarrett, R.D., Roughness Coefficients of Large Floods, Irrigation and Drainage
Specialty Conference, 1987, ASCE, Proceedings, Portland Oregon, pp 32-40
Page 34
16. Jarrett, R.D., Hydrologic and Hydraulic Research in Mountain Streams, Water Resources Bulletin 26, June, 1990, pp 419-429
17. USBR, Downstream Hazard Classification Guidelines, ACER Technical Memorandum No. 11,
Bureau of Reclamation, Denver, CO, December, 1988. 18. Ad Hoc Committee on Dam Safety of the Federal Coordinating Council for Science, Engineering
and Technology, Federal Guidelines for Dam Safety, Washington DC., June, 1979 19. Department of the Army, Recommended Guidelines for the Safety Inspection of Dams, Office of
the Chief of Engineers, Washington D.C. 20. Wahl, T. L., Prediction of Embankment Dam Breach Parameters- A Literature Review and Needs
Assessment, Dam Safety Report No. DSO-98-004, US Dept of the Interior, Bureau of Reclamation, Denver, 1998.
21. Lobrecht, M.M., Goertz, L.A., Temple, D.M., Neilsen, M.L. SITES - Water Resource Site
Analysis Computer Program, Version 2005. In: ASABE Annual International Meeting, July 9-12, 2006, Portland, Oregon. Paper No. 06-2101. 2006 CDROM.
22. Froehlich, David C., Peak Outflow from Breached Embankment Dam, ASCE Journal of Water
Resources Planning and Management, vol. 121 no.1, p. 90-97, 1995. 23. Wahl, T. L., Uncertainty of Predictions of Embankment Dam Breach Parameters, ASCE Journal
of Hydraulic Engineering, pp 389-397, May 2004. 24. Wetmore, J. N. and D. L. Fread, The NWS Simplified Dam Break Flood Forecasting Model for
Desk-Top and Hand-Held Microcomputers, Printed and Distributed by the Federal Emergency Management Agency (FEMA), 122 pp., 1984.
25. US Army Corps of Engineers, Hydrologic Modeling System HEC-HMS, Hydrologic Modeling
System, User’s Manual Version 3.1.0, Hydrologic Engineering Center, U.S. Army Corps of Engineers, Davis, CA, November, 2006.
26. US Army Corps of Engineers, Hydrologic Modeling System HEC-RAS, River Analysis System,
User’s Manual Version 4.0 Beta, Hydrologic Engineering Center, U.S. Army Corps of Engineers, Davis, CA, November, 2006.