Embed Size (px)
Citation preview

22/03/2018 © IFCN 2017 | 1
Dairy World & Recent Market Trends
Amit Saha
IFCN Senior Researcher; Dairy economist
Competitiveness and internationalization of livestock sectors. Ministry of Agriculture and Fisheries, Food and Environment, Spain – 20.3.18

22/03/2018 © IFCN 2017 | 2
World milk price is still very volatile
IFCN Combined World Milk Price Indicator
?

22/03/2018 © IFCN 2017 | 3
Agenda
1. The IFCN Network Concept
2. Globalization of dairy sector
3. Dairy markets & its drivers
4. Farm competitiveness
5. Sum up

22/03/2018 © IFCN 2017 | 4
Mission:
We create a better understanding of the dairy world by providing
comparable data, knowledge and inspiration.
IFCN - The Dairy Research Network
The IFCN Network approach – consisting of three pillars
- the IFCN Research Network of researchers
- the IFCN Supporter Partner Network of companies/institutions
- the IFCN Research Center with > 15 dairy economists

22/03/2018 © IFCN 2017 | 5
IFCN Network 2018
IFCN Country Data Partners 110 Countries, 98% of world milk production covered
IFCN Supporter Partners >120
New companies in 2017/18:
Milcobel, DZ Bank, AGCO, Cobank, KDD, Kalleh, Leiber,
Etex, TopCon, Novozyme, Nordic dry, Kemin, Aavin,
Randox, smaXtec
New institutions 2017: GASL, WWF, NDDB
IFCN Institutional Partners

22/03/2018 © IFCN 2017 | 6
Agenda
1. The IFCN Network Concept
2. Globalization of dairy sector
3. Dairy markets & its drivers
4. Farm competitiveness
5. Sum up

22/03/2018 © IFCN 2017 | 7
Who is importing what?Dairy imports by product groups in 2015
Source: IFCN Dairy Report 2016, page 81

22/03/2018 © IFCN 2017 | 8
Key driver: Milk surplus & deficit by region
ME = Milk equivalents, based on fat and protein only
ME = milk equivalents
22/03/2018 © IFCN 2017 | 9
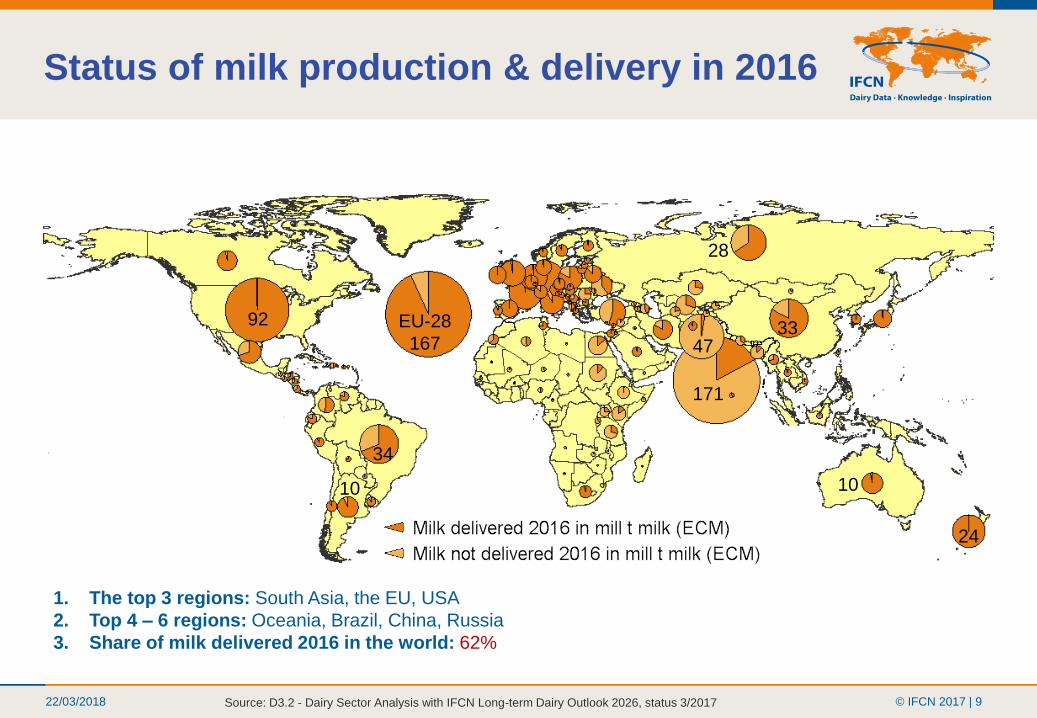
1. The top 3 regions: South Asia, the EU, USA
2. Top 4 – 6 regions: Oceania, Brazil, China, Russia
3. Share of milk delivered 2016 in the world: 62%
Status of milk production & delivery in 2016
EU-28
167
10
34
92
10
24
33
171
47
28
Source: D3.2 - Dairy Sector Analysis with IFCN Long-term Dairy Outlook 2026, status 3/2017

22/03/2018 © IFCN 2017 | 10
Rank 2016 Company nameOrigin & main operation
countries
Milk intake,
in mill. t ME
Estimated
turnover per kg
milk, in USD
Market share in
% of world milk
production
1 Dairy Farmers of America USA 28.1 0.5 3.6%
2 Fonterra New Zealand/ others 22.1 0.6 2.8%
3 Groupe Lactalis France/others 15.1 1.3 1.9%
4 Arla Foods Denmark/Sweden/UK 14.2 0.8 1.8%
5 Nestlé Switzerland/others 14.0* 1.9* 1.8%
6 FrieslandCampina Netherlands/others 12.6* 1.0* 1.6%
7 Dean Foods USA 10.3 0.8 1.3%
8 DMK (incl.DOC Kaas) Germany/Netherlands 7.8 0.9 1.0%
9 Saputo Canada/USA/others 7.7 1.1 1.0%
10 California Dairies USA 7.7 0.5 1.0%
11 Danone France/others 7.5 2.4 1.0%
12 Yili Group China 6.8* 1.4* 0.9%
13 Amul (GCMMF) India 6.5 0.8 0.8%
14 Müller Germany/UK/others 6.3 1.2 0.8%
15 Glanbia Group Ireland/USA/others 6.1 0.7 0.8%
16 Agropur Canada/USA 5.8 1.0 0.7%
17 Land O' Lakes USA 5.8* 0.7* 0.7%
18 Mengniu China 5.8 1.4 0.7%
19 Groupe Sodiaal France 5.2 1.1 0.7%
20 Schreiber foods USA 4.5* 1.1* 0.6%
Sum of Top 20 200 1.0 25.4%
IFCN Top 20 milk processors list 2016
Data related to the mainly 2015
* IFCN estimation

22/03/2018 © IFCN 2017 | 11
USA
Source: IFCN Monthly Real Time Data
Spain
1. The world milk price
influences national milk
prices
2. Each country follow the
red line -
3. But we have special
patterns like e.g.
USA: 2014 + 2015
EU/Spain: 2007;2017/18
USD
/10
0kg
EC
M
Transmission from world to national milk price

22/03/2018 © IFCN 2017 | 12
Rotterdam declaration: 1 billion peopleFAO: It is likely that the dairy sector supports the livelihoods of up to one billion people worldwide.
3.09
mill
2009 IDF summit – 0,7- 1 bill people on farmMathematics on dairy farms
1. 120-130 mill dairy farms
2. 5 people/ farming family
=> > 600 million people
Mathematics supply chain
1. 71 mill Jobs in the dairy chain
(Range = 36- 258 mill)
2. 5 people/ family
=> >355 million people
2010 FAO/IFCN –>750 mill on farm
One Billion people =
> 600 mill farm + >355 mill chain +
XXX induced jobs / spin offs
2015 IFCN work for GDP > 950 mill

22/03/2018 © IFCN 2017 | 13
Agenda
1. The IFCN Network Concept
2. Globalization of dairy sector
3. Dairy markets & its drivers
4. Farm competitiveness
5. Sum up
22/03/2018 © IFCN 2017 | 14
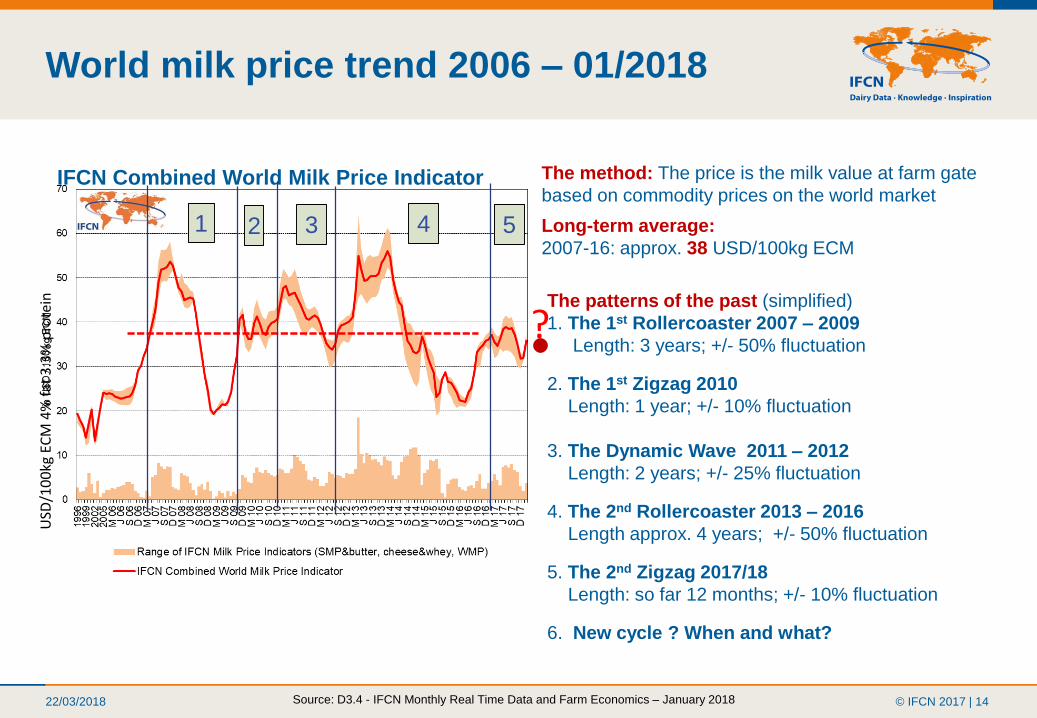
World milk price trend 2006 – 01/2018
IFCN Combined World Milk Price Indicator
The patterns of the past (simplified)
1. The 1st Rollercoaster 2007 – 2009
Length: 3 years; +/- 50% fluctuation
2. The 1st Zigzag 2010
Length: 1 year; +/- 10% fluctuation
3. The Dynamic Wave 2011 – 2012
Length: 2 years; +/- 25% fluctuation
4. The 2nd Rollercoaster 2013 – 2016
Length approx. 4 years; +/- 50% fluctuation
5. The 2nd Zigzag 2017/18
Length: so far 12 months; +/- 10% fluctuation
6. New cycle ? When and what?
Source: D3.4 - IFCN Monthly Real Time Data and Farm Economics – January 2018
1 2 3 4
The method: The price is the milk value at farm gate
based on commodity prices on the world market
Long-term average:
2007-16: approx. 38 USD/100kg ECM 5
USD
/10
0kg
EC
M 4
% f
at 3
.3%
pro
tein
?

22/03/2018 © IFCN 2017 | 15
What drives dairy economics?
Why short term outlook
How IFCN can support you with real time data

22/03/2018 © IFCN 2017 | 16
World milk production change 1997-2016
The indicator used:
All milk = milk from all types of animal,
standardised to 4% fat, 3.3% protein
The trends for the last 10 years:
17 mill t / 2.3%/year Ø growth
3 crisis years: 2009; 2012; 2016
2014 record production year: + 25 mill t
Situation 2016:
846 mill t milk production
+ 9.9 mill t growth (+ 1.2%)
= lowest growth since 1998
2017e
?

22/03/2018 © IFCN 2017 | 17
Current dairy world situationDecember 2017 – February 2018 IFCN Estimates
Source: Data product – 3.4 IFCN Monthly Real Time Data, 15.02.2018
World milk and feed prices in USD / 100 kg ECM

22/03/2018 © IFCN 2017 | 18
Milk demand per capita 2016
Source: D3.2 - Dairy Sector Analysis with IFCN Long-term Dairy Outlook 2026
The indicator: There is a comparable milk demand indicator
Milk demand ranges from 13 kg in Indonesia to over 300 kg per capita in EU countries

22/03/2018 © IFCN 2017 | 19
China: Imports are recovering
Russia: Imports still not back on
pre-ban level
Algeria/ Egypt: Imports show
downward trend with current
devaluation against USD
Dairy import changes in 2017 vs 2016
0.7
Source: D3.2 - Dairy Sector Analysis with IFCN Long-term Dairy Outlook 2026, status 8/2017
-0.3
0.7
-0.3
-0.50.5
Monthly total dairy commodities imports volume
by top dairy net importers in milk equivalents
% change to previous year
2014 +6%
2015 -1%
2016 4%
Jan-Sep 2017 +2.4%
Total world dairy imports
1000 t M
E

22/03/2018 © IFCN 2017 | 20
Agenda
1. The IFCN Network Concept
2. Globalization of dairy sector
3. Dairy markets & its drivers
4. Farm competitiveness
5. Sum up

22/03/2018 © IFCN 2017 | 21
Farm comparison analysis in 2017
Participating countries 2017
Coverage: 52 countries; 89% of world
production, 159 typical farm types
A typical farm type represents in each
country a certain production system and
x% farm and y% cows
Time period: data for calendar year 2016** Seasonal data for New Zealand
Why? Better understand and predict a
specific segmentation of farm classes, we
define the typical farm class.
Method concept
a) Typical farm concept
b) Model TIPI-CAL
c) Validation loops & quality check
d) The cooperation between researchers

22/03/2018 © IFCN 2017 | 22
Countries where IFCN Typical farms are analyzedLegend:
Examples of typical farm types
ES-65NW: Typical Average size family dairy farm in Galicia region, North West Spain- herd size of 65 cows
NZ-369
NZ-1052
Source: D3.2 - Dairy Sector Analysis with Long-term Outlook 2026
ID
US-80WI
US-500WI
PL-16E
PL-65S
CN-200
CN-1450
IN-2N
IN-20N
BR-23S
BR-60S
DE-30SDE-139N
KE-2
KE-10
UA-200
UA-550
ES-65NWES-93S
22/03/2018 © IFCN 2017 | 23
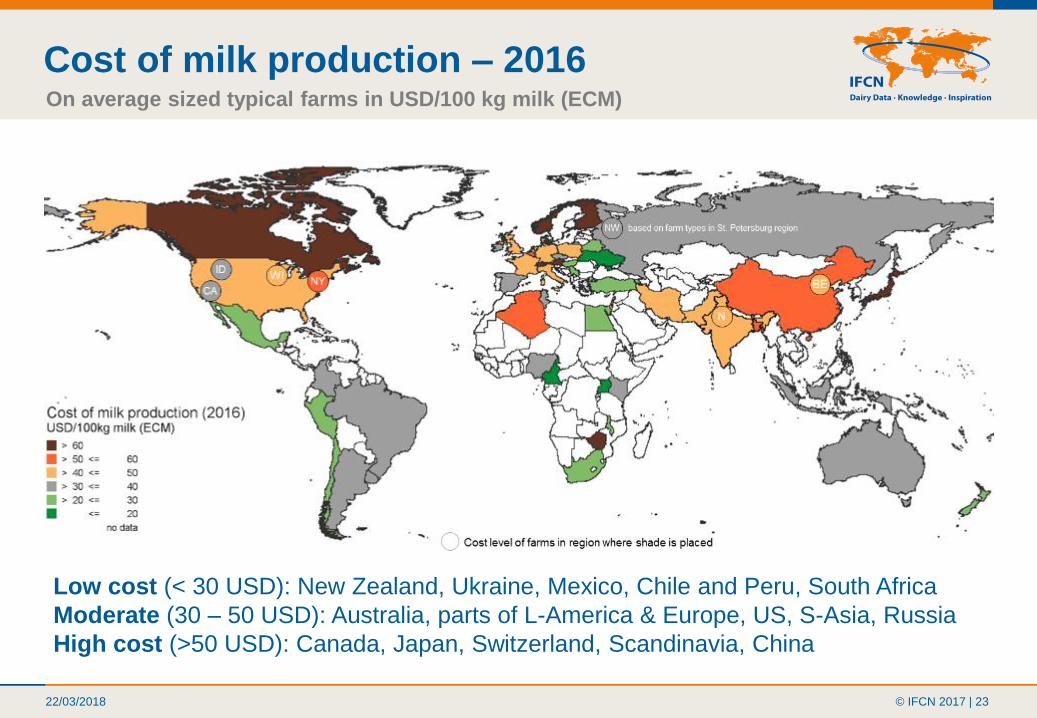
Cost of milk production – 2016 On average sized typical farms in USD/100 kg milk (ECM)
Low cost (< 30 USD): New Zealand, Ukraine, Mexico, Chile and Peru, South Africa
Moderate (30 – 50 USD): Australia, parts of L-America & Europe, US, S-Asia, Russia
High cost (>50 USD): Canada, Japan, Switzerland, Scandinavia, China

22/03/2018 © IFCN 2017 | 24
Cost and labour competitiveness 2016
• Sustainable farming
systems needed
• Economic Drivers: Milk
price, cost of production,
labour returns
• Policy drivers: Farm
support
• Larger sized farms are
more sustainable but
need policy support in EU
USD
/ 1
00
Kg
Milk
(EC
M)
USD
/ H
ou
r

22/03/2018 © IFCN 2017 | 25
Cost trend analysis of typical farmsFor 6 countries 2000 - 2017
Spain, USA, New Zealand China, India, Brazil • Costs in the ES, DE and NZ
decreased from 2014
onwards
• Drivers for cost ( ) in ES:
low feed price, euro devaln
• Costs are stabilizing in the
range of 30-40 USD per 100
kg milk (ECM)
• Exception: NZ:below 30 USD
CN: 60 to 50 USD
• Cost estimations in 2017
similar to 2016 except IN, BR
• Precursor for increased
production in 2017 ->better
milk price at 36 USD
2017e: estimated for 2017
Source: IFCN Farm Economic Data D5.1
22/03/2018 © IFCN 2017 | 26
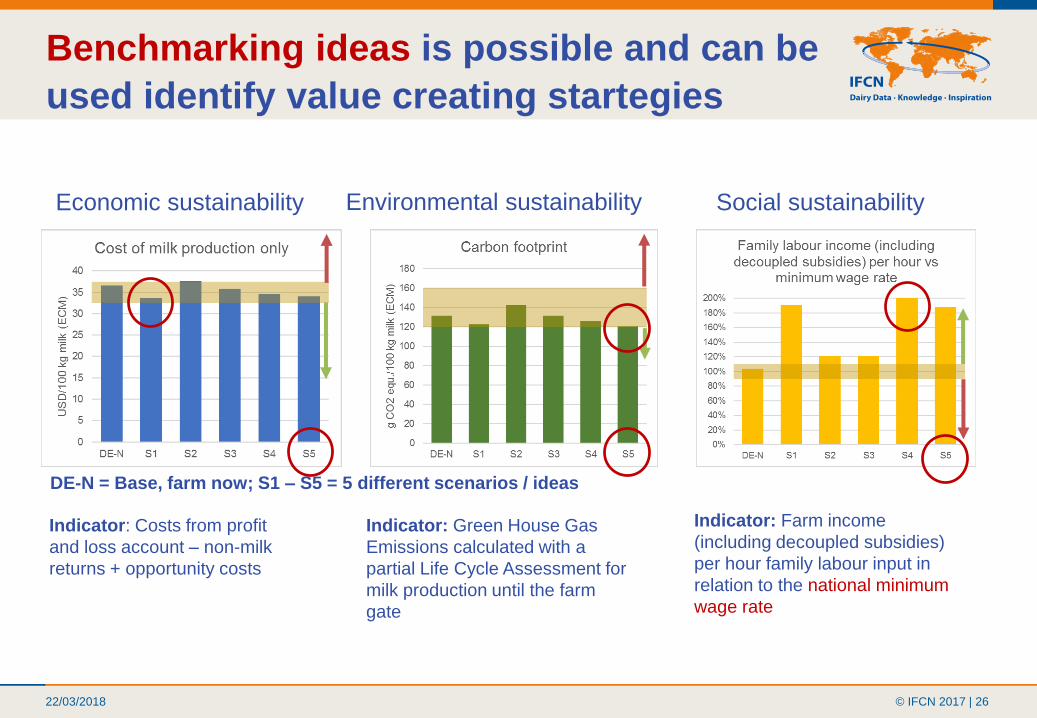
Benchmarking ideas is possible and can be
used identify value creating startegies
Environmental sustainabilityEconomic sustainability Social sustainability
Indicator: Costs from profit
and loss account – non-milk
returns + opportunity costs
Indicator: Green House Gas
Emissions calculated with a
partial Life Cycle Assessment for
milk production until the farm
gate
Indicator: Farm income
(including decoupled subsidies)
per hour family labour input in
relation to the national minimum
wage rate
DE-N = Base, farm now; S1 – S5 = 5 different scenarios / ideas

22/03/2018 © IFCN 2017 | 27
Agenda
1. The IFCN Network Concept
2. Globalization of dairy sector
3. Dairy markets & its drivers
4. Farm competitiveness
5. Sum up

22/03/2018 © IFCN 2017 | 28
Our key messages today
1. Dairy Globalization: Most likely to continue at a much
faster pace, new local and global markets and growth on
the anvil
2. Dairy Story: 1 Billion+ people livelihood relate to dairy
3. Dairy markets: Price volatility is a reality-real time
information is the key; Demand driven markets likely to
remain bearish in 2018
4. Farm economics: Stable margin in 2017 estimated leading
to increased milk supplies. Milk production costs stabilizing
at 35-40 USD per 100 kg ECM.
22/03/2018 © IFCN 2017 | 29
Thank you for your attention
IFCN Dairy Research CenterNetwork of IFCN Researchers Network of IFCN Supporters
A great number of people have collaborated since the year 2000
to make this presentation possible.