Embed Size (px)
Citation preview
DAIRY PRODUCTION AND ITS IMPLICATION INHOUSEHOLD INCOME IN THE TARAI REGION OFNEPAL: A CASE STUDY OF CHITWAN DISTRICT
Manjeshwori SinghKeshav Lall Maharjan
IntroductionNepal is a mountainous country with agriculture as its economic mainstay.The percentage of people dependent on agriculture has declined graduallyfrom 81 % in 1991 to 76 % in 2002 (CBS, 2002). Only about 20% of the totalland area can be cultivated in a mountainous country like Nepal. With thetypical geographical condition and other natural reasons, the government ofNepal has to face many challenges in providing basic infrastructure facilitiesand services in most part of the country. Due to the lack of agriculturalinfrastructures such as roads, irrigation and so on, agriculture has remainedalmost stagnant. Its share in the gross domestic products has been constantlydecreasing. Althou~h the nature and the form of the problem of farmingsystem in the Tarai are different from those in the hills and the mountain,they are no less severe. The Tarai is highly influenced by migration from themountains, the hills and neighbouring country India. The phenomenon ofmigration has been the most striking reason for the rapid population growthin the Tarai region. The National Census 1991 reports that the population inthe Tarai is increasing at a rate of 4.2% per annum contrasting with that of1.6% in the hills and a national average of 2.2%. Such a rapid increase inpopulation density in the Tarai has considerably increased populationpressure on the existing land and forest resources; consequently the surplusesof food grains have been rapidly declined. Thus, the production of foodgrains alone has not been able to meet the ever-increasing food needs for thepeople. Hence, people have been practicing different economic activities tomaintain their livelihood.
Livestock farming being a major component of Nepalese farming systemis becoming one of the important occupations in the rural area of Nepal. Itcontributes 31 % of agriculture gross domestic product (GOP), among this,53% derived from the hills, 38% from the Tarai and 9% from the mountains(APP, 1995). Livestock farming, especially, dairy farming alone contributes78% in total AGDP. It is presently undergoing a transition phase fromsubsistence to commercial dairy farming in the various places of the Tarairegion due to the increase of milk marketing facilities in the area. Dairyfarming has been helping the farmers to earn cash income to fulfill their basicneeds, at the same time they can get manure as by-product and draft power
Contributions to Nepalese Studies, Vol. 32, NO.2 (July 2005),213-241Copyright © 2005 CNASITU

214 CNA$ Journal, Vol. 32, NO.2 (July 2005)
for agricultural production. One of the other important aspects of dairyfanning is to generate energy in household level for cooking and heating interms of biogas, which is produced by decomposition of animal dung inlO anairtight digester. Biogas technology is one of the technologies that isrenewable and is regarded as directly contributing in minimizing the over useof traditional energy sources2 in the rural area where only 1% of the peoplehave access to the commercial energy sources. In the other hand, numerouspeople are involved in the production, processing and trading of dairy anddairy products. This provides the employment opportunities for the ruralpeople. Sales of dairy animals, milk and milk products make up aconsiderable proportion of the average fanner's income. Dairy is also asource of supply of animal protein (cows for milk, and buffalo for milk andmeat) through the consumption of milk and milk products and meat, whichcan positively effect in improvement of the health of people. Hence, theanalysis of contribution of dairy production and its implication to thehousehold income in the rural setting is a research issue. Further, the analysisof occupational structure and their contribution in household income is alsobecoming important. Consequently, the main objective of this study is toanalyze contribution of dairy production to household income and examinethe occupational structure of the rural households. This will further examinesocio-economic characteristics of dairy fanners, dairy production costs andnet return to fann from dairy production and examining the share of differenteconomic activitil"s among the dairy farmers.
MethodologyMultistage sampling techiniques were used to select district, VillageDevelopment Committee (VDq and household for the emperical study.District and VDC were selected with purposive sampling process amongdairy pocket areas, having relatively high numbers of dairy animal holdingsand high milk production. Households Wefe selected randomly among thedairy fanners. In order to collect primary data in household level, detailsurvey was conducted within 104 households from two VDCs (dairy pocketareas) in Chitwan district. It comprises 4% of the total households ofsurveyed villages. A semi-structured interview approach was also conductedto collect additional data. The collected data will be divided into threefarmer's group according to farm size; large, medium and small farmer.Information on socia-economic characteristics of those dairy farmers,agriultural land distribution, dairy animal holdings, income from dairyproduction were compiled and analyzed according to three farmers groups byusing statictical tools; Excel and SPSS. Information on income andpercentage share from differenl economic activities other than dairyproduction wert also analysed to evaluate their signilicancy to the tOlalhousehold economy.
Dairy Production and its Implication 215
Dairy Fuming in NepalDairy animals that include cow and buffalo evenly distributed throughout thecountry, with some predominance of cow on the Tarai and lower hills. About75% of Nepalese household keep cow and 47.8% Keep buffalo mainly formilk, draught power and manure for their farmland. There is about 7.0 millionheads cow with the annual increment of 0.05% and 3.4 million heads ofbuffalo, growing at a rate ofabaut 1.6 % per annum in the year 2001 (TableI). The raising of buffalo occurs mainly in the Hills (56.7%) and the Tarai(34%). Share of both cow and buffalo is comparatively higher in the hillsfollowed by the Tarai and the mountain.
Table I: Number of Caules in Nepa' according to GeograpbicalR..... ioDs
Region Animals Avenge Growth Rate Sbare in Total(e/.)Animal
Mountain Cow 819,243 -0.43 11.66Buffalo 313,500 1.17 9.18
Hill Cow 3.447,598 0.12 49.06Buffalo 1,939,134 1.17 56.77
Tarai Cow 2760,302 0.11 39.28Buffalo 1,163,435 2.56 34.06
Nepal Cow 7,027,143 0.05 100.00Buffalo 3,416,069 1.64 100.00
Source. CBS. 1001.
Cow and buffalo are the main grazing dairy animals for a fann householdin the Tarai region. The main cow breeds found in the region are Bos taurusJersey, Holstein, 80s indicus Haryana and Sahiwal. Buffalo breeds arecrossbred Murrah from India as a result of direct importation from India. It isalso supported by the upgrading programme implemented by the Departmentof Agriculture Development (DAD) using both natural services and artificialinsemination. Murrah crossbred are more common in the mid-hills and theTarai particularly where access to milk market is good. Dairy animals arcreared in the region mostly lo gel manure for their farmland and the draughtpower used in cultivation. Female calves are reared as herd replacementswhile mule calves are either reared for replacement of draught oxen forploughing and for pulling CarIS, or they are neglected, killed, or sold to buyersfrom India and local people. Buffalo is also used for ploughing in the Tarairegion. Female buffalo calves receive more care than males due to the milk.Male buffalo calves are neglected and die, or are weaned. very early andslaughtered for meat or sold to buyers from India and the local market.Buffalo milk, which contains high amount of milk fats, is preferred by both
216 CNAS Journal, Vol. 32, NO.2 (July 2005) Dairy Production and lis Implication 217
farm. Ghee, a milk product, is sold mostly to India. Buffaloes are sold forslaughter in the district urban centres and Kathmandu. Male buffalo and malecow for draught purposes are sold in the locality where they are raised. Latepregnancy or early calving female buffaloes have wider market in the region.
Chronological Development and Preseot Situation of Oail")' Farming inNepalIn Nepal, dairy de\elopmenl activities began in 1952 with the establishmentof a small-scak milk pr..x:essing plant on an experimental basis in Tusal, avillage in lhe Kavreplanchok district, under the Depanment of Agriculture(OoA). After that few yak cheese faclories were started with an assistance ofFood and Agriculture Organizalion (FAO) of the United Nations in 1952/53.With the growing prospca of expanding the dairy sector, the Firsl Five-YearPlan (1952·57) emphasized the need for developing a modem dairy industry.It had programmes to establish milk collecting centres and central milkprocessing plant in Kathmandu valley, cheese making plants, using yak milk,in high hills and ghee purification centre at the exporting points in the Tarai.In order to streamline the dail) de\elopment activities, Dairy Dc\e1opmentCommission was fonned in 1955, and it was thcn converted into the DairyDevelopment Board in 1962. In accordance with the Corporation Act of 1964,the board was again converted into the Dairy Development Corporation(DOC) in 1969 in order to meet the growing milk demand in the Kathmanduvalley. The main objectives of DOC are to provide guaranteed market, fairprice to the rural milk producers, supply pasteurized milk and other standarddairy products to the urban consumers. When DOC started its operation it hadonly Kathmandu Milk Supply Scheme (KMSS) and one Cheese Productionand Supply Scheme with four Cheese Production Centres. Over the years,DOC gradually extended its activity area outside Kathmandu Valley, andestablished various milk supply schemcs in different parts of the country tomeet the growing demand for processed milk and milk products. There arc sixmilk supply schemes and one Milk Production and Distribution Schemeshown in Table 3.
h' I RGd·d Y' Id
producers and consumers over cow milk. This results in the lactating buffaloesin the farm household herd being fed better than the lactating cows. Buffalomilk is a more valuable product than cow milk and so lactating buffalo are thefirst animal to be stall fed when grazing is insufficient. As a result of havingless grazing land and forest, more crop residues (paddy, wheal, maize, cotton,sugar cane tops, lentils) are fed. It is generally supplemented with someconcentrates. Concentrate feeding, locally known as '!wOOo J is given to thelactating animals, which is common to most fanners in Nepal. The amount ofstall feeding relative to grazing is more in the Tarai than the mid-hills. Theforage utilized in the region generally includes; grazing on roadsides,uncultivated land, forest (near the Siwalik). on cultivated land after harvest.and on fallow land.
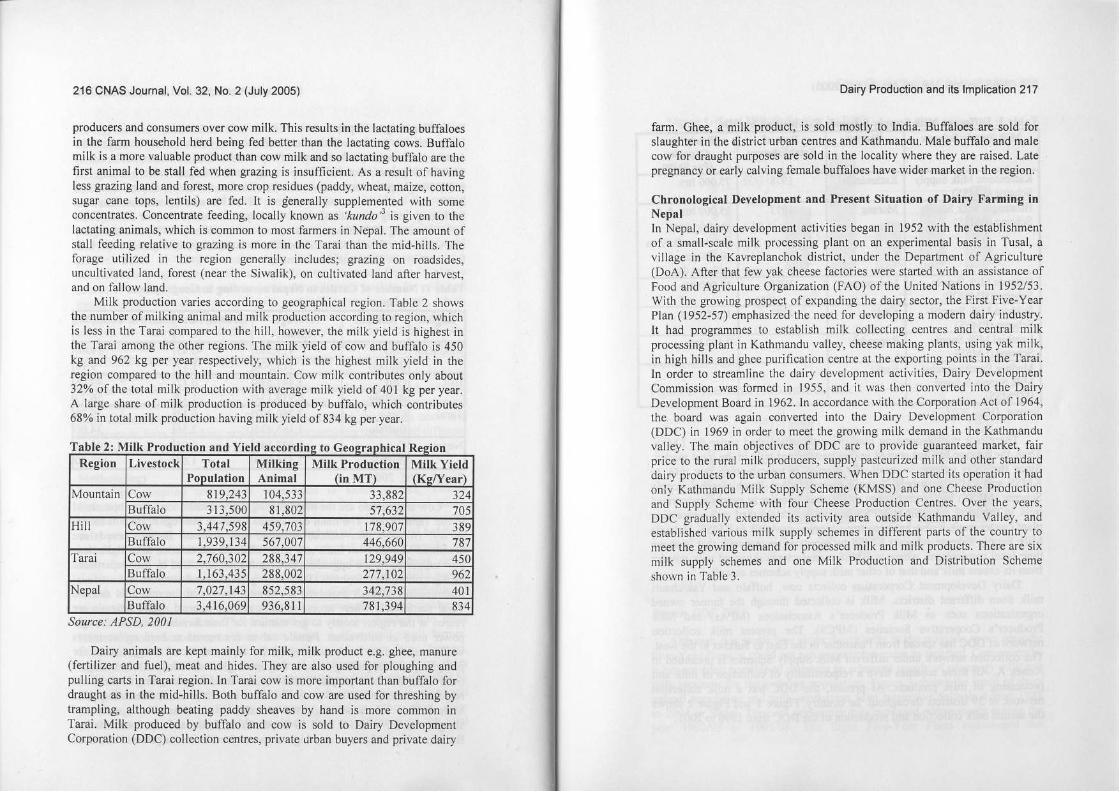
Milk production varies according to geographical region. Table 2 showsthe number of milking animal and milk production according to region, whichis less in the Tarai compared to the hill. however, the milk yield is highest inthe Tarai among the other regions. The milk yield of co\\ and buffalo is 450kg and 962 kg per year respecth..ely, \\hich is the highest milk yield in theregion compared to the hill and mountain. Cow milk contributes only about32% of the total milk production with average milk yield of 401 kg per year.A large share of milk production is produced by buffalo, which contributes68% in total milk production having milk yield of834 kg per year.
T bl 2 1\1'lk P od t'• • , , , uc Ion an " accor 1Dl! to eOl!raDllca :el"lOnRegion Livestock Total Milking Milk Production Milk Yield
Population Animal (inMn (KI"!Year)Mountain Cow 819.243 104,533 33,882 324
Buffalo 313,500 81,802 57,632 705Hill Cow 3,441,598 459,703 178,907 389
Buffalo 1.939,134 567,007 446,660 787Tarai Cow 2,760,302 288,347 129,949 450
Buffalo 1,163,435 288,002 277,102 962Nepal Cow 7,027,143 852.583 342,738 40J
Buffalo 3,416,069 936,81 I 781,394 834Source. APSD, 200/
Dairy animals arc kept mainly for milk, milk product e.g. ghee, manure(fertilizer and fuel), meat and hides. Thcy arc also used for ploughing andpulling carts in Tarai region. In Tarai cow is more important than buffalo fordraught as in the mid-hills. Both buffalo and cow arc used for threshing bytrampling, although beating paddy sheaves by hand is more common inrarai. Milk produced by buffalo and cow is sold to Dairy DevelopmentCorporation (DOC) collcction centres, private urban buyers and private dairy

218 CNAS Journal, Vol. 32, NO.2 (July 2005)Dairy Production and its Implication 219
Figure I: Total Milk Collection by DOC
Although this sector was given due priority in the previous seven periodicFive-Year Plans, it could not achieve much success as targcted. Consequently,it has not becn possible to maintain an adequate supply of necessary milk a~dmilk products for the growing population. Figure 3 shows the trend of dairyanimal population and milk production from respective animals during 1988to 2001 in Nepal. The cow population has increased contit'lJOusly during theyear 1992/93 to 1995/96. The Eight Five-Year Plans encouraged the
730 ,/lr-.720710
"lO69068067066065O L ='--:-==-----':-=--:='----:==.J
#" ,l' <f'# r-# ,so'" " .... ....~ ,,;#"
610
600
590
580
570
560f>',<#
Source' DOC. 2M3
Figure 2: Totall\1ilk Production by DDC,,---'-----
Source: DOC, 2003
DOCT.ble 3: Different Milk Supply ~bemesEsbblisbcd b" .Milk Supply Sthenic District Dale or Production
Establishment CapaeityW~r Shifll
Kathmandu Milk Supply Kathmandu 1978 75,000 hI'S.Scheme (KMSS)Biratnagar Milk Supply Morang 1973 25,000 ItT'S. & 3Scheme (BMSS) metric ton
powder milk from40,000 hI'S. ofmilk oer da"
Hetauda Milk Supply Makawanpur 1974 15,000 itT'S.Scheme fHMSS\'
Pokhar:::~Ik ;~~PPlY Kaski 1980 10,000 Itrs.Scheme MSS
Lumbi~i(~1ilk ;~PPIY Rupandchi - 2,500 ltrs.Scheme LMSSMadhay Pa.schimanchal Banke - -Milk Supply Scheme(MPMS')
There is a mini processing plant recently established under the LMSS.Thus, the scheme has just started selling pasteurized milk in the local market.Since the sales volume is small, the scheme is transshipping raw milk toKMSS and PMSS to supply in those areas. Madhay Paschimanehal SupplyScheme (MPSS) has recently been established in artier to supply pasteurizedmilk in the local area. Since MPSS has not yet established milk-processingplant (under way), it also has been transshipping raw milk to KJ\1SS. HetaudaMilk Supply Scheme supports KMSS b) supplying excess milk that is abo\oetheir local requirement, where as BMSS manufactures skimmed milk powderfrom its excess milk and that of other milk supply schemes as well.
Dairy Development Corporation collects cow, buffalo and Yaklchaurimilk from different districts. Milk is collected through the farmer ownedorganizations such as Milk Producer's Associations (MilAs) and MilkProducer's Cooperative Societies (MPCS). The present milk collectionnetwork ofDDC has spread from Panchthar in the East to Surkhet in the west.The collection network under different Milk Supply Schemes is presented inAnnex A. All these schemes have a responsibility of collection of milk andprocessing of milk products. At present, the DOC has a milk collectionnetwc.rk in 39 districts throughout jje country. Figure I and Figure 2 showsthe annual milk collection and production of the DOC from 1996 to 2001.
SQurce. DOC, 2003

220 CNAS Journal, Vol. 32, NO.2 (July 2005)
participation of private sector to establish animal hospitals. It also launchedvarious programmes such as introduction of improved breed, vaccineprogrammes in order to maintain animal health and animal feed programme.The eiglu plans, however, could not achieve its targets in livestock sector. Thenumber of liv.estock units was increased but the milk production has notsignificantly changed. The high numbers of animals were found to beunproductive and low productivity of productive animals. The number ofbuffalo is low compared to cattle but the milk production is higher than that ofcattle. J-Wwever, the over all milk production has not increased significantly inboth the ease cattle and buffalo during these years.
Figur~ J. Population Trend of Dairy Animal and Milk Production in Nepal
800000O 900000
100000o
~!OOOOO
: :: 100000600000O
c
6000008
lOOOOOO 5
i•,
500000 ,.00000o c
" ~ - 400000 -~•~
300000o £-300000 ~,
200000O200000
100000o 100000
0 0
r+:,of ~(f'~' ,fl"'~"" "'~ ,jI"l ~{f>#.'\ ~fl'+> ~ ~~',"I ,~" ,<f' ,cfl ,<f' ~eilt<fi, ,<fi ,<fi ,# ....
-+-NoofCows _NoofBuffaloes -'-Cow mJlk in Metric ton -M- 8uITalo mIlk In M I
Source: APSD, 2002
Gener.1 Futures ofChltwan DistrictChitwan dislrict lies in the Tarai (Plain) region, which is often called "GrainBasket" as it has more capacity to grow crops and orner farming products.The dislrict is agriculturally significant as it is endowed with very fertile
DaIry Production and its Implication 221
alluvial soil from the Rapti River. The district is one of the biggest districts inthe Central Inner Tarai4
, which is an important part of the country both fromthe settlement and economic point of view. The economy of the districtmostly depends upon the agriculture, and about 73% of the workforces derivetheir income from this activity.
The district is located 146 kilometers south of Kathmandu, the capital ofNepal. covering an area of 2218 sq. km in the central development region.The district elevation ranges from about 200 meters in the south to 2000meters in Ihe north. The average temperature of this district ranges from 18degrees Celsius 10 31 degree Celsius. According to the record prepared byRampur Station in 1994 the minimum temperature of the district recorded is2 degree Celsius in December and maximum temperature recorded is 38.2degree Celsius in May. The a\erage annual rainfall is 2,133 milliliters. Theclimatic condition of the district is subtropical and temperate type dependingupon the topography of the district.
From geographical point of \iew. the district consists of three majortopographic divisions; Mahabharat Hills in the north. Siwalik Hills in thesouth and inner Tarai region in the ccntre and the west. The northernmountainous parts of the district, about 2000m in height arc inaccessible dueto the steep elevation and dense forest. The southcrn purt of the district is inthe foothills of Siwalik (600 m), bordering India. Thc central and southernpart of the district is the basin along the Rapti River known as Chilwanvalley. Between the plains and Siwalik lies lhe dense subtropical furesl. richwith flora and fauna. Administratively. the district is divided into 36 VDCsand two municipalities (Ratnanagar and Bharatpur). Ilharatpur. headquarterof district, located in the Central Western part of the district.
Before 1950, Chitwan district was covered with dense subtropical forestprone to Malaria and was known as Ka/apon; i. e. the Death Valley. Duringthe Rana period (1855-1951), when the Rana go\emment had to punish anindividual, they would send himlher to the Death Valley. This implies thatwhen a person enters the Chit\l.'8n district he/she would surely not return. Therulers also used this area for hunting tigers, and other wild animals, often as astate event with foreign dignitaries. At that time people did not like to gothere for settlement. However. after launching of simultaneous programme ofplanned settlement lind malaria eradication in late 1950s, people started goingthere for settlement. To encourage the Pahadis (hilly people) to permanentlysettle in Chitwan, government offered land and free tractor service asincentives. Chitwan then became an attractive place for the pahadisGradually people from all over the country composing of difTerent ethnicgroups, culture and religions started migrating to the district. Not only overall the country bUI also from the neighboring country especially India stanedmigrating to the district because of no restrictions whatsoever in crossing theinter-national boundary between India and Nepal. During the harvest season,

222 CNAS Journal, Vol. 32, NO.2 (July 2005)
many Indian labours would come to work and finally settled in the district inmost cases. However, stilt some forests are secured along Char koshe Jhadi(8-mile long dense subtropical forest between the plains and Siwalik Hills)and most of the Chitwan National Park.
Due to the high influence of migration, the population of the districtincreased sharply after 1950s. Table 4 shows the number of population andpopulation growth within the given time. The maximum percentage ofgrowth is after eradication of malaria in 1954,250% during 1954·1961. Thenafter the percentage growth during ellch decade has decreased graduallycompared to 1950s. However, the average growth rate is about 3.5% annuallyin each decade, greater than the regional average growth of2.9% and nationalaverage gro\\1h of2.7%.
Table 4; Population and Percentage Growtb in Cbilwan District
y,,,, TOIlI Po ulation Total Percental!:e Po ulation Growth1954 42,822 . .1%1 107,394 1954-1961 2101971 183,644 1961-1971 1711981 259,571 1971·1981 1411991 354,488 1981-1991 1372001 470,71] 1991·2001 J32
Source: Based on Pradhan & Routray, 1991
Compared to other parts of the Tarai region, Chitwan District isrelatively more accessible. Markets, hospitals, and educational centres arewithin accessible distance and the transportation facilities are easilyavailable. It has two airports and two highways connected to the district withall other districts of the Tarai and some districts of the central and westernHills. The Institute of Agriculture and Animal Science at Rampur plays a keyrole in development of dairy fanning in the district. Other institutions such ashorticulture fann, cooperative, division of women development and financialinstitutions directly related to agricultural development in the district.
The total arable land area of Chitwan district is 46,894 ha, of which44,391 ha of land are cultivated. There are 142,422 ha of forestland, 18,882ha of pastureland, and 13,602 ha of land arc covered by rivers, mountains andSO on. Among cultivated land only 28% is irrigated throughout the year whilerest of the cultivated land is irrigated only partially. Since the district hasmore capacity to grow crops, it exports food grains to India and other parts ofNepal. Table 5 shows the cultivated area, production, and yield of majorcrops in Chitwan comparing to the country as a whole.
Dairy Production and its Implication 223
Table 5: Cultivated Area, Production and Yield of different Crops inCbitwan District for 1999nooo
Nen.al Chilwan DistrictCrops Cultivated pr~.du,~tlion Yield Cultivated PrOd~~~ion Yield
Area (h~\ Too Ton/ha. Area {hal {Ton I (To n/b-a I
Paddv 1,550,990 4,030,100 2.60 33,685 92,500 2.75Maize 819,010 1,414,850 1.73 28,742 61,083 2.13Wheal 660.040 1,183,530 1.79 8,500 13,770 1.62Milk! 263.450 295,380 1.12 1,500 1.375 0.92Baric 28.196 30.817 1.09 400 ]60 0.9<>PotalO 122.619 1.182.500 9.64 1.600 17.750 11.09Oilseeds 189.628 122,751 0.65 18,000 70.200 ].9<>SUl!arcane 58.126 2.103,426 36.19 10 320 32.00
Source CBS. 100/
. Th~s data ~o.ws the yield ~r hectare of oilseed, maize and potato ishigher m the dIstrict than the national yield. The yield of major cereal cropssuch as paddy, wheat, and barley are not significantly different with nationalyield. The. soil In. the other hand is also equally favorable ror agriculturalproducts. rhe major crops grown in the district are paddy, maize. oils{.'Cd,potato and wheat. Besides, millet, barley and sugarcane are also grown. Thet~en~ o~ major c~real crop cultivated area and respective croo yield of thedIstrict IS shown m the Figure 4 and S.
In the district level, area under paddy is almost similar in different yearswhere as area under wheat and maize has been slightly increasing. This is dueto the construction of irrigation channel in the Chitwan district in the latterperiod. In the other hand, yields of three crops have been increasing but inslow rate. Among three crops, yield of paddy snows higher growth trend. Inth.e )ear.1985 t~ 1992 maize yield is decreasing and after that period yield isslightly mcreasmg. In case of cash crops, area under potato is almost constanto~er 25 )ears where as under mustard has increased until year 1984/85 andslightly ~p and .do:,n after t~at period. After construction of irrigation~hannels In the district potato Yield has increased rapidly but yield of mustardIS .very low as compared to potato. This is due to the severe pest problem inthIS crop. In the later stage potato yield has been decreasing because of lateblight (potato disease).

224 CNAS Journal, Vol. 32, No.2 (July 2005) Dairy Production and its Implication 225
.lIJ2>I PI~A
~ ~ ~ ~ ~ ~ ~ 0
•, ~
~~I 1/
I~~
'/"-~'
I.~ Iol~, 1)<)
~ f(
:tl J~
.~ PI~.A
§ § § ~ § § § §'" • N
~ ~ • N 0
/. ~
":'4, 'E~ I't>/. p •
",,"'~Q
I.~ ~c 'Ir""';-/•
ePq::.,~/ :l! .~ d'ot,~/ 2
<"~ ~
~
~~~Q:., ~/ U £.1
""-"q;., ~/ j j •• ~ ~~" 0
"1r;~ -:: ;..
.('4:; ~/ " 'E ~
++0 S'4:, (J'/
• M o 0
""'~~.. ......./ ."
r./ ~ ~~I'd: ~/
~ r.
~"~
~~/ Hrq::.,561'
~c i 4s/
/." Z
/It,;~/ ! .5 ~/~~a;.
~ ~ " '1Y. </ •• • ;;.. 1- :;: ~(J,p(J/
d"jI (J'/
I I>-
"" ~ "",eP.e.: 5/c ,pot: >:i"/•
<,
++U <,
~cf!., 6'"/ ~<"<t r./
-"cf!.,~tY/c ~.
"• J!J, r./~ " .o!~or, ,c ~ ~/
{P. 6'/ • -;;:=1
";:~tY/ ~u ;;'1J.5/ ~ ::~r, ! • '" jj~ ~:/~ 6'"/
~II .. 8i"', ;;: ~ • ~(J'/
Hret!- 6'"/ 0 '" 00
z,z,f f
~ • ~(J'/~
/cf!., 6'"/ l~ J "• §
~oePfY • 0.e" 11"/
++•
~ ~ ~ • ~~/~
""g: < ~
~
d(::., 6"/ - ~ < -'" • d'o::.:: 6"/
..; .. ..;~fY/ g: /<. ~
<<. • ~~6"/~-~<.-. 6'"/ - "'5; § ~ § § 0 0
~<. :;l '" 8 <~/ :;l~/
• ~ •
",;; N N "
~• 3JpeH "• ~•~ •• <:: <5l
<5l

226 CNAS Journal, Vol. 32, No.2 (July 2005)
The farming system is traditional and based on human labour and animalpower, and depends mostly upon the rain for irrigation. Since the landholdingis small, mechanized farming is not favorable. Farmers in the district mainlyuse compost manure i.e. mostly animal dung. This encourages them to raisedairy animals, which is the main source of manure. Livestock farming is alsoan important component of farming system in the district. Cattle, buffaloesand goats are the major livestock and they are raised mainly for milk. meatand draft power (transportation and land preparation). One pair of oxen canearn NRs. 210 per day for ploughing a field. Renting oxen for ploughing andpulling carts to transport fann goods is also an income-generating saurcc inthe district.
Gtntral Ftatures of Siudy AruAs mtntioned rarlier, two Village Development Committees (VDCs) (dail')pocket area), with about similar characteristics were chosen for the stud). Ascan be seen in Figure 6. the two VDCs (Gilanagar and Gunjnagar) are locatedin the central part of the Chitwan district. Both the villages are located in thesouthwest of Bharatpur Municipality, where Gitanagar is adjoining it.Gitanagar is surrounded with dense forest in Ihe East, Pathani VDC in thesollth, Shivnagar and Phulbari VDCs in the west. The lotal area of the VDCis 16 sq. km. Gunjnagar another study village is also located in the southwestof Bharatpur Municipality. It is about 162 km southwest from Kathmanduand 16 km from Bharatpur. It covers the area of 16 sq. km. Gunjnagar isdelineated by Dibyanagar VDC in the west, Nawalparasi district in the North.Saradanagar VDC in the cast and Sukranagar VDC in the south. Both thcvillages are located in the plain area in the average altitude of 200m. It can beconsidered as strong and dcveloped VDCs based on various attributes such aspresence of numbers of institutions (banks, NGOs, cooperatives facilities)and other infrastructure (communication, transportation) hcalth facility,electricity more than 80% and more than 50% of the total population hasfood self-suniciency. Both the VDCs have milk potentiality for incomegeneration. If the area is addressed and strengthened in terms of milkproduction with modem inputs, it will be accelerated towards the economicgrowth and milk production will be sustainablc.
Dairy Producation and its Implication 227
Figure 6: Map of Chitwin Distrkt showing Study ViIIlge:s
Vj/
According to the preliminary census 2001. the total population ofGitanagar is 10.244 living under 2,012 households making an avcrngehousehold size 5.1. This includes 4,905 malcs and 5,339 females. The male10 female sex ratio is 0.91, which is slightly less than national average of0.99. The total JXlpulation in Gunjnagar is 12.868 living under 2,499households with fmni Iy size 5.1. The male 10 female sex ratio is 0.93.
Table 6 shows the JXlpulation distribution according to the farm sizc andsex of the sampled household among the dairy farmers in the study arca(Gitanagar & Gunjanagar). The lotal population of sampled household is 650living under 104 households. The majority of sampled household belongs tomedium size, holding less than two hectare of land. The av.erage householdsize is 6 with male and female population is approxim3tely cquallydistributcd.

-
228 CNAS Journal, Vol. 32, No.2 (July 2005)Dairy Producalion and its ImplicalJon 229
Educational Level & Farm Small Medium Large Totalsize
Illiterate (No Schoolin ) Il '6 • 70Literate No Schoolin~) 8 II 6 6lPrimary (1-5) 33 90 I' 142Secondary (6-10) I' 90 12 121SLC (School Leaving 11 31 10 l2Certificate)Intermediate (10+2) 16 77 12 105Graduate 6 3~ 10 l2Total 108 421 78 607Literacv Rate (%) 86.1 89.0 88.5 88.5
Occupational Structure: The nature of local economies and variouscommercial and employment opportunities are reOected in the people'soccupation. In terms of occupational struClUre the study area is vcry agrarianin nalure with more than 90% of people engagcd in farming as a main job.Nevertheless, the study area has a more developed economy, which can beattributed to its location along the trade route to various market places withinand outside the district. Table 9 shows different trends in the diversity ofincome sources among small, medium and large farmers. All the three groupsof farmers have approximately similar range of income sources (4 economicactivities) for income generation. The most important occupation is farmingthat includes crop and livestock production. It provides income to about77 .3% of them, which is far greater figure than the second largest clerical job(13.1%), professional (7.1%), and business (2.5%). The given economicactivities arc the main livelihood strategies of the sampled household thulrepresent the whole district. If we sec the occupational structure according tofarm size, all the large farmers engaging in farming including dairy as theyendowed higher proportion of land with annual food sclf-sulliciency and alsosurplus. As the small and medium farmer, having small proportion of land,though they have annual food self·sufficiency, they have to depend on otheractivities to manage other non-food items. However, the majority of
(13%). This implies better-educated people are generally not involving indail)' fanning due to the fact that better education provides moreopportunities for the services in different sectors. However, the averageeducation status is not significantly different among the three groups.
Source FIeld VIS/I. 2002Note: Linder 6 (43) arc not included
Table 8: Educational Status or Sampled Household According to FarmSize
Farm Size Mile Female Tolll '/0 No of"" Av. HH SizeSmall " " 114 17.5 22 lMedium 23l 220 413 69.7 74 6Large 4l 38 83 12.8 8 10Total 33l 31l 610 100,0 104 6
Table 6: Population Distribution of the Sampled Household Ittordiog toFnmSiu
Source. FIeld V'SII, 2002Others: Tamang, Newar, Mahato, Kamali
Socio-economic Characteristics of Dairy FJormersCIslclEthnicity: The study villages are composed of various caste/ethnicgroups, including Brahmin, Chhetri, Tamang, Magar and other occupationalcaste groups such as Damai, Kami. However, the dairy fanners in the studyarea are highly dominated by Brahmins. The Brahmins (priest caste) are thehighest caste in the caste hierarchy in Nepal. II comprises 8W. of the totalsampled household. The ehhe!ri arc occupying 4'Y. of the samplednouseholds. Others include Magar, Tamang, ewar and occupational casteare very low as show" in Table 7. Castelethnicity is Ihe most important issuefor mOSI of the development programmes in Nepal. However, this study docsnot concern with the castelethnicity as sampled household dominated byBrahmins. Thus, casteslethnicity will not be considered in the study. All theanalysis was done according to their farm size. Farmers are divided into threefanner groups according to their farm size.
Table 7: Caste/Ethnic Distribution or the Sampled Household
Castelethnicitv Small Medium Lan"e Tolal %Brahmin 20 67 6 93 8.Chhetri 1 2 1 • •M,,,,, 3 3 3Othm 1 2 1 • •Total 22 74 8 104 100
..
Education Status: Education is onc of the important human capitals. whichplays important role in determining household status in the society. In theresearch area, there are ten primary, five secondaf)C.and (our higher secondarysepools in the various ward. Most of the schools are privately funded. Witht!l= presence of number of educational institution, the litcracy rate is as highas 88.5% among the sampled household members including those who arcjust literate with no schooling. The large percentage of the sampledhQllsehold members has education in the range of primary to intermediatelevel. The highest pcr~ntage of graduate people belongs to large farmer

230 CNAS Journal, Vol. 32, NO.2 (July 2005)Dairy Producation and its Implication 231
Table 10: Lalid Dislribution among Sampled Household by Farm Sized L dT
Tandi, a terrace land. homestead. forestland and fodder are nolsignificantly difference among the small, mcdium and large farmer. randi isa dry field. which usually docs not have irrigation facility and is used for thecultivalion of maize, millet and wheal. Other land is not suitable forcultivation but can produce fodder, grasses and trees.
Livestock lJolding: Livestock ownership is one of the other major financialassets that people have. The production of manure through livestock is amajor contributor 10 traditional soil management practices. And dairyprovides an imponant source of income. The main animal.s rearing in thestudy area are cow, buffalo, goat, ox and chicken. Table II shows theownership of dairy animals and its composition in the study area. The
Source FIeld Sun·ey. 1001Small: having 0.2 & under 0.5 hll land. medium: 0.5 & under 2 ha land.Large: above 2 ha landNote: Land Unit in lIa, Others include few cases of holding of fodder/forestland.
,. '" 'O'Total Land Totailn~~~
Land TVDC' Farm Size 1111 nord in!!: Holdin IU
Ghol (Paddy Irrigated mall 22 4.2 0.19
fUmd) Medium 74 44.8 0.61
l....< 8 8.33 1.04
IGhol (Paddy Non-irrigated mall 22 1.07 0.05
.ond) Medium 74 15.75 0.21,.,,, 8 7.79 0.97
Tandi (Terrace Irrigated mall 22 0051 0-02
,","d) '!edium 74 1.66 0.02
LM" 8 0 0.00
Tandi (Terrace Non- m~1 22 064 0.03
rrigau:d Land) ledium 74 6.72 0.09
LM" 8 234 0.29
Homestead, Animal Shed mall 22 113 0.05
and Other Land !Medium 74 4.72 0.06
Lo"" 8 1.1 0.14
0la1 Land mall 22 7.55 0.34
1edium 74 73.65 1.00
arf!C 8 1956 2.45
Occupation Caleeor-, Small Medium Larpe Tolal %
'armine 44 168 31 243 77.3
usiness 1 7 8 2.5
lerical Job 10 24 7 41 13.1rofessional Job 2 18 2 22 7.1
"'~ " 217 40 314 100,0
households has fann-based aClivities; crop and dairy farming as their mainoccupation for living.
Source Field Sune). 1001I'\ole: Abo...e 65 (14). under 6 (43), Student (279) is not includedClerical Job: Go\ernment/non go\ernment sen-ice, OfficerFanning: Crop & li\CSIOCk, Business: Shopkeeper, Trade; Clerical Job:Sef'\ice, Officer. computer operatorProfessional: Teacher, Politician. Writer, Driver. Nurse, Police. Arm}, andO\erseerSmall: 0.2 to under 0.5 ha; Medium: 0.5 and under 2 ha; Large: 2 ha andabo\e
Table 9: Occupational Slruclure of Sampled Household According 10Farm Size
Landholding: Land o\~nership ~\ ilhin the agrarian economy of the study areapro"ides II major source of income. which is an imponanl natural asset thatfarmers have. The inequity in land distribution translates to economicdisparily among the farmers. The land size of Ihe holding and type of landavailable in the stud)' area can ha\ e a large impact on the ability of farmers toearn a living. Table 10 sho\\~ the land distribution of the sampled householdaccording 10 land type and farm size. It shO\~s the average land holding ofsmall. medium and large fanners is 0.3. 1.0 and 2,4 Ha respectively. Thelarge farmers arc endowed with higher natural asset status than medium andsmall farmers. The hmd in the study area is categorized in Iwo types Gholand Talldi as district as II whole. Paddy is the main crop eultivate<t in theGhol or it can :llso understond as paddy land. Mainly maize and mustard aregrO\~n in Tandi [t can be seen that average Gho! (paddy irrigated land)owned by large farmers (I Ha.) is almost twice as large as that of mediumfarmers and 4 times larger than that of small farmers. Larger size of Gholowned by large farmer means that they have higher potential to grow cropssuch as modern variety rice and other crops. It is considered that they haveutilized thi~ in higher potential for commercial crop farming. It can also beproved from the income earning from various sources (section 8.3), in whichthe maximum income comes from crop farming in case of large farmers. 11seems they' nave higher tendency in engaging in crop farming.

232 CNAS Journal, Vol 32, No.2 (July 2005)
average number of dairy cow and buffalo in small, medium and large farmeris 4, 5 and 6 respectively. The highest number of average dairy animals isowned by large fanners. It implies that the large farmers have more potentialto produce dairy products for their own consumption and for the sale. Whenchecked with the income from dairy, it is interesting to note that it is one ofthe minimum compared to small and medium farmers. This shmvs dairyfarming for large farmer may be mainly for self-consumption and for thefannyard manure to maintain the soil productivity, which tends to be moreeasily degraded by pest, disease and nutrition deprivation. Another farmergroups owned less numbers of dairy animals compared to that of largefarmers. Similarly, number of milking cow holding per household in small,medium and large fanners is 1.1, 1.2 and 0.9 respectively and that of buffaloholding is less than one in all the cases.
Table 11: Dairy Animal Holdin~ of Samnled Household
DescriDtion Small 122\ Medium 174\ Laroe 18\ TotalMilking Cow 25 92 7 124Dry Cow 9 28 4 41Heifer 6 42 2 50Female Calf 10 29 3 42Male Calf 3 14 2 19Bull 5 37 4 46Milking Buffalo 14 46 4 64Dry Buffalo I 16 10 27Heifer 7 26 6 39Female Calf 2 17 2 21Male Calf 4 14 7 25Total Animals 86 361 51 498112Ldi~g!!i!:L____________________ 4 5 6 5
~;m:~~~~ff~o2~~i~~~H---------------------- -------~---------- _._------------..
1.1 1.2 0.9 1.2_._-_._-------- --------------------
0.6 0.6 0.5 06Source. Field Survey, 2002Small: having 0.2 & under 0.5 ha land, medium: 0.5 & under 2 ha land,Large: above 2 ha landMilking animal: cow, producing milkDry animal: a cow usually in the laff:st part of pregnancy, whose lactation hasbeen terminated and who is being prepared for the next lactation, or stopmilking
Heifer: young female bovine from birth up to the time she gives to a calfCalf: young male or female animalBull: adult male animal
I
1
II
Dairy Producation and its Implication 233
Survey Results and DiscussionDairy Animal Production Cost: In this study different variable costsS werecalculated for the net household income from dairy fanning. The variablecosts for individual households in dairy production were computed bysumming the expenditures on self and purchased feed. dairy animal health.electricity and cost for labour, which were reported by farmers. The averagepurchased feed value is very high due to the high market price oheady madefeed produced by industry. The labour used in dairy production \vashousehold labour and household labour productivity is very 10\,,'. This is dueto the lack of labour market in the study area. The household labour valuewas evaluated based on the value of agricultural labour found in agriculturallabour market. One man-day value varies for man, \voman, and child in thestudy area. One man-day labour cost for man, VolDman and child is NRs ]00,80 and 50 respectively.
Table 12: Annual Dairy Production Cost in US$ per Household by FarmSize
Descrintion Small Medium Larl!e
Self Feed (Concentrate/maize/oil cake) 123 655 2,100
Self Feed (Fodder/grass/straw) 741 1.682 3,480Purchased Feed Concentrate/maize/oilake) 22.395 22.884 10,463
Purchased Feed (Fodder/grass/straw) 3.691 2.869
rotal Feed Cost 26,950 28.091: 16.043
Health Cost 1,47 1,49 2,12
Eledricitv Cost 3' 61 100
ILabour Cost (Estimated) 27.748 30.252 27.318
'otal Dairv Production Cost 56,213 59,899 45.581
,)'ource. Field 5uney, 2002, Unff: ,'I/epalr Rupees (NRs), $ J '"""' ;"'iRs. 77. 00
fable 12 shows the types of variable costs included and respectiveaverage cost. The findings show that the mean value for self-feed is one ofthe lowest in small and medium farmer. These two groups of farmer usedmore than dnubled amount of purchased feed compared to self-feed. Whilelarge farmers used approximately equal amount for self and purchased feed.This coincides with the low landholding status of small farmers than largefanner. Mean value for electricity used and health is very minimal in all thecases. The total production cost is not significantly different in small andmedium farmer with NRs 56,213 and NRs. 59,899 respectively, whereas theproduction cost i.e. NRs 45,581 oflarge farmers is minimal. In the same tableit can be seen that large farmer uses less amount of intensive and less amountof labour compared to other two groups of farmer. It may be due to the

•
234 CNAS Journal, Vol. 32. NO.2 (July 2005)Dairy Producation and its Implication 235
Income EUDiDg from Dairy Farming: Milk selling is the major incomcsource for dairy farmers. Besides, selling of other items such as selling ofanimal itself in different stages; milking, heifer, calf and so on and selling offew dairy products also found in the study area.
Source. Field Survey, 2002
Unit Nepali Rupees, $1'" 'Rs 77.00Note: Net income = Gross Income-Total Production Co~t
'CI retum to farm :-.let Income + Self Inputs (fct:J + labour +manure)
Table I" sho\\s the highest income carnine comes from sellin1i!. of milk inall three groups of farmc~. The gros.:. incom-e is about 1.5 lim;s higher insmall and medium than turge farmer'> Ihough large farmers O\-Ined hi¥hermean animal. This means there is higher lcndenc} of sm,111 and mcJil.lmfarmers ill invoh jog in dair} tarming tor income gencration. Where,L~ in C<Jscof large farmer the} ha\c morc teotkncy in imohing in dail) i, I~)r ,clt~
consumption as Iheir consumption pattern is higher Ihan small and mediumfarmers. According 10 the large lanners. the main purpuse of rcarin J.lil)amm31s is tl} get manure lor their larmlanJ and for sdf-milk consumptionrather Ihan ...... Iling. rhey u~'\l to sell ~urpJus milk o.:casionally
• ldHO·rEIIT bl 14 A• • , DDua m::ome amlDll I rom aln ocr ouse 0
DucnDtion Small Medium LareeSetlinjt Milkinjt Cow 1,681.8 4756.7
eifer cowl 739.7ow Milk 43363JK 44980.3 17,793.7
Milkinll: Buffalo 2,122.9Orv Buffalo ]28.1 378.3
eifer Buffalol 216.21he calf 14.4
He calf 100.0 277.9ullock 56.7
uffalo Milk 19,045.CX 20,137.33 20,394.3
.~ 199.330ure 1,909.0IJ 113.51
anureSelfUse 3,415.00 S.I77J)( 10,581.
ross Income 69843.0 79,170.65 48,769.1
~~Production Cost .~~!~]~ ___~8J_8.6~ ._4S,5!.!:Q.N;;t Inco;;--- ___~.~!§~;.?8 ___..J~dZ_2.:QQ__}.~l~8.2.._._------
et Retum to Farm 42,242.08 51,860.65 36,086.0
Labour Utilization: Availability of labour in the household is anotherimportant human asset and one of the important inputs in dairy enterprises.Both quantity and quality of labour arc important human assets. Theknowledge of dairy animal management aod the requisite skills needed indairy farming dClcnnine the quality of labour, and input to enhance theproducti\ ity of dairy animal. But in a low productivity framework, nonprofessionals do the work maintaining and rearing of dairy animals., as theiropportunity cost is lo"cr. The dairy enterprise provides a gainfulemployment to the rural households. The number of household membersavailable in dairy farming is an important factor for adopting labour-intensivelivelihood strategies. Table 13 shows the annual labour use in various dairyactivities per household. In the study area almost labour all found is familylabour among the all three groups of farmers. The average number of daysspenl for dairy activities per year is calculated according to farm size. IIshows that the average number of days, which were spent by small andmedium farmer, is 310 and 332 respectivcly, higher than largc farmers, whichis 306 days per year. But in a\'crage, number of animal holding, is less insmall and medium farmcrs. This implies small and medium farmers havchighcr tendency in involving in dairy activities.
composition of animals. in which large farmers own less number of milkinganimals. Generally milking animal needs more care and quality feed.
Table 13: Annual Labour (AEU) Utilization in Dairy Activities perHousehold
Activitiu Small Medium LarfJeMale Female Tot.al Male Female Total Male- Female Total
odder Collection 3 6 9 3 5 9 33 5 8cedin!!: 3 3 7J 3 3 6 4 4 88leaning Animal 1 1 1 2 1 I'leaning Animalhod 1 3 5 2 2 4 1 2 4
i1kine. 2 I 4 • 3 2 5 2 I 4
ilk Dclivcrv 2 1 3 3 , 2 2
Ol'l 14 163 31 18 IS' 33 '" 163 30abour use/animal 3 41 78 3 31 6 2 30 51
Source' FIeld Survey, 2002Small: having 0.2 & under 0.5 ha land, Medium: 0.5 & under 2 ha, Large:above 2 haUnit: Manday = Working an adult 8 hrslday; AEU"'Adult Equivalent Unit. Aworking child counted as a half of an adult.

236 CNAS Journal, Vol. 32, NO.2 (JUly 2005) Dairy Producation and its Implication 237
~lilk Production and Consumption Pattern: Milk production is the majorIncome generating Source of the dairy farmers in the study area. Fresh m'ilkconsumption among household is common in the study area as other parts ofthe. country. Majority. of sampled household member drink milk regularly.C~Jl~ren. and old family member has given priority in drinking milk. The useof mtlk for tea is common practice in the study area.
Table 15 shows the annual milk production and consumption perhousehold according to farm size. The average amount of milk productiona~o.ng the small and medium farmer is more than double that of large farmer.Similarly small and medium farmer sell more than 80% of total milkproduction wh.ile. lar~e farmer sell only 58% of total milk production perhous~hold. ThiS Imph.es sm.all an~ medium farmers have high tendency toearn Income from seiling milk. Milk consumption is higher 42% among thelarge f~rmer where as small and medium farmer consume only 16% and 20%respectIvely from their total milk production. The consumption patternamong larger farmer is higher. However, per capita milk consumption is oneof the lowest among the large farmer with the maximum family size compareto other two fa:mer'~ group. Since the study area is dairy pocket area, theoverall per capita mIlk consumption is much higher than that of nationalaverage.
crop farming, livestock farming and other fann related activities. Nonfarming includes clerical job, business and professional job. The percentageof engaging in farming is as higher as 77% of the total economically activesampled population. It is followed by clerical job (13%), (7%) professionaland 3% business.
Table 16 shows the mean income earned from dairy production is one ofthe lowest in large farmers, i. e. NRs. 38,722 though they own higher numberof dairy animal compared to medium and small farmer. While nearly doubleand two-third income from the same source was earned by medium and smallfarmers respectively. One reason for this difference can be landholding size.Some of large farmers also reported that they did not have to be fullyengaged in commercial-scale dairy farming because they obtained a sufficientamount of income from crop farming as well as non-farm based activities.They are rearing dairy animal for the reason of self-consumption of milk andmanure for their farmland. The same Table shows income earning of largefarmer from crop farming and clerical job is one of the highest compared toother two groups about i. e. NRs. 63,000 and NRs. 96,000 thousandrespectively. Medium and small farmer earned very less income from nonfarm based activities, as their education level is also lower than that of largefarmers.
d
Source.' Field Survey, 2002, Unit. Nepah Rupees (NRs.), $1 NRs.77.00Farming: Crop & Livestock;Business: Shopkeeper, Trade.Clerical job: Service, Computer Operator, and Meter Reader.Professional Job: Teacher, Writer, Driver, Nurse, Police, Army, andTechnician.
Table 16: Annual Income from Different Income Sources ner Househol
Farm HH Farm Based Non-farm Based Total HHSize Crop Dairy Business Clerical Professional Income
Job Job
Small 22 9,239 42,242 2,273 23,045 4,364 81,163iI 1%) (52%) (3%) (29%) (5%) 1100%)
Medium 74 18,578 51,861 4,460 27,216 13,068 115,183116%) (45%) (4%) (24%) (11%) 1100%)
Large 8 44,499 36,086 80,250 19,500 180,335(25%) (20%) (44%) (11%) (100%)
No ofHH 77% 7% 13% 3% 100%memberengaging in
-
ce. field Survey, 2002
Table 15: Milk Production and Consumption per Household by FarmSize
Farm Milk Milk Sale (Kg) Milk Per Capita MilkSize Production Consumption Consumption
(K.l IK.i (Kolhead)Small 3117.5 2609.8 (840/;)- 507.7 il6%) 101.3Medium 3145.1 2521.4 (80%) 623.7120%) 106.5Laflze 1743.8 1004.6158%) 739.1142%) 76.2Total 3037.8 2423.4 (80%) 614.4 (20%) 103.1National Per Capita Milk Consumntion (Kp/head) 48.4Basic Need Level Recommended bv WHO (KplHeadl 57.8Sour
,.
Annual Income from Different Occupations: Household level incomeinforn~ation ~n income from different occupation is important for poli,cyan~lysls and Impr~vementof people's livelihood. Although agriculture is themainstay of the village economy, some people have shifted to trading andgovernment/private services as their main occupation to maintain livelihoodDuring the off-farm season, people migrate to towns and market centre in th~same di:trict such as Narayanghat, Bharatpur Bazar and so on for income.The main income generating activities found in the study area can becharacterized in two sectors; farming and non-farming. Farming includes

=
238 CNAS Journal, Vol. 32, No.2 (july 2005) Dairy Producatlon and its Implication 239
"',-------------~
Figure 7: Percentage Share of Different Income Sources According 10
Farm size
"~••
on this business. High population gro\\IIh causes declines in size of farmlandthat is leading to the decreasing trend of productivity of food grains. Dairyfanning is rcgarded as an imponant income generating activity for the ruralpeople whcre livestock is integral pan of farming system and majority ofpeoplc is living in subsistence level. Dairy farming is such an activity, whichdoes not require large resources, labour intensive and can generate incomewithin short period of time.
In this case study, the economy of households in the study area dependsupon the agriculture and related business. Most of thc farm households in thestud) area have small size of land holdings so Ihis has direct impact on cropyields. Besides tIIis, people 3rt also cngaiing ot.h~ different economicaetiviti~_y,:~ichinck1des.~farm ~scd, su~ ~¥~ profd,wftal ~.-tand dencal Job. The most "rable buSIness mat t5 closely rllsted 10 agricuhUTCin the study area is dairy farming. Most of the farmers are keeping cows andbuffaloes for milk as well as organic manure for crop cultivation in their oy,nfarmland. The finding shows that the contribution of the dairy farming to thetotal household income is found 10 be significant in houschold level. Thiscontribution is higher in small fanners and medium farmers as compared tolarge farmers .because large farmers have other economic opportunities ascompared to small farmers. Dairy farming is consuming houschold labourmore efficiently as almost all labour use in the dairy is family labour. Thisindicates that dail) seaor development has direct impact on the contributionof household income' in rural areas. The demand of livestock products likcmilk and milk product is increasing day by day as population increasing.Therefore, this sector can contribute for the betterment of the rurallivclihoodparticularly to the small household, which has less opportunity to engage inother economic altematives. Development of livestock sector such asprovision of extension senices; introduction of improved breed, good animalhealth service, and provision of cheap feed to the farmers, can enhance dairyproduction in the rural area.
NolesI. Geographically, Nepal is divided into three regions, Mountain, Hill and Tami.
The Tarai. being an extension of Ille Gangetic plains of India. forms a low flalland. ranging from 22m to 600m above. mean sea level. 11 stretches along thesouthern boundary of the country. It comprises only 23 % of the totlll land of theCOUlliry and accorlUllooatcs 47% of population. This region includes most of thefenile land and dense forest. About 40% of land is suitable for cultivation.
2. Traditional energy refers to fuelwood, agricultural residue and animal dung.Commercial energy refers to electricity, petroleum products. gasoline and so on.For funherdetails sec (Singh and Maharajan, 2003).
3. It is madc at home, predominatcly from maize flour, rice bran, salt and kitchenwaste in about 2-) liters of water and boiled. The amount per day varies from 0.5I kg/day/animal given during or after milking).
Profess'ormlJob
rr1rl IfJ
r
Clerical JobBUSinessDany
InconlC Earning Sourccs or Occupations
"'I------f=t------------!f-
SOl/rcl! Field SI/I'I'ey, 20(}2
ConclusionNepal is an agrarian country and its cconomy strongly depends on agricultureand related actiltities. The li ...elihood of large proportion of people depends
Share of Dirrerent Iiousehold Occupation in Total Household IncomeIn order to calculate the contribution of income from dail)' farming to thetotal houschold income. it is important to kno\\ thc share of other incomesources as well. The percenlage share of income from dillerent incomesources is presented in Figure 7. It shows the percentagc share of dail)farming is decreasing according to the farm sizc of the sampled houschold.Small farmers ha'>e maximum share of dail) income in thcir total household~ncome..It is follo\\ed b) medium and large farmcrs. Thc share of dair)mcome rs found to be significanl in small and medium farmer. \\hichcontributes 52% and 45'0 in small and medium farmers respecthel) to theirtotal houschold income. The rest of the share come from crop fanning andnon-farm acti\ ilies. The share of income from clerical job is higher in thecasc of large farmer compared to small and medium fanners. II ma\ bebecausc of their higher education le\el compared 10 other fanncr gr~ups.\\hleh pro\ides them better opponunities in non-fann 3Cti\it) like clericaljob. There is also liltle contribution to their total houschold income from nonfann Ixlscd acth ities such as clerical job and professional job in case of smalland medium fanners. These are, ho\\e\er. mostl) come from jobs abroad.
<0
e:." JO-"~ 20
10 r0
10S""'j ClOP
I []McdlumCLa'ge

240 CNAS Journal, Vol 32, NO.2 (July 2005) Dairy Producation and its Implication 241
Annex A: Milk Collection Network under Different Milk Supply SchemesI
National Planning Commission (NPC). 1981. The Sixth Plan (1980-1985). Kathmandu:NPC, Nepal.
NPC 1992. The Eighth Plan 11992-1997). Kathmandu: NPC, Nepal.NPC 1998. The Ninth Plan (1997-2002) Kathmandu: NPC, Nepal.Pande. R.S. 1997. Fodder and Pasture Development in Nepal. Kathmandu: Udaya
Research and Development Service (P) Ltd, Nepal.Pradhan P.K.& Routray J.K. 1992. Market Centres and Rural Development; A Study in
Chitwan District, lVepai. Bangkok: Human Settlements Development Division,Asian Institute of Technology.
Pradhan. Pushkar Kwnar and Jayant Kumar Routray. 1992. Market Centre and RuralDevelopment, A StuJ.v in Chitwan District, lV'epal. Bangkok: HumanSettlement Development Division. Asian Institute of Technology, Thailand.
Singh, Manjeshwori and Keshav Lall Maharjan. 2002. "Socio-economic Impacts ofPromotion of Renewable Energy Technology in Hill Areas of Nepal: APerspective of Biogas technology." Journal of Rural Problem. Volume 37,No, 4, pp. 300-305.
Singh, Manjeshwori and Keshav Lall Maharjan. 2003. Contribution of BiogasTechnology in Well-being of Rural Areas of Nepal: A Comparative Studybetween Biogas Users and Non-users". Journal of InternationalDevelopment and Cooperation. Vol. 9, NO.2. Japan: Graduate School forInternational Development and Cooperation, Hiroshima University, Japan.43-63.
Tulachan, P.M. & A. Neupane. 1999, Livestock in Mixed Farming System of theHindu-kush ffimala.vas: Trends and Sustainabili~v. Kathmandu: InternationalCentre for Integrated Mountain Development, Nepal.
Tulachan. P,M., M. Saleem. et al. 2000, Contribution of Livestock to MountainLivelihood. Research and Developmenl Issue, Kathmandu: InternationalCentre for Integrated Mountain Development Nepal.
Source DDC, 2003Note:MPAs: Milk Producer's AssociationMPCs: Milk Producer's Cooperativescc: Milk Collection Centre
ID Ne aScheme MPAs MPCs CC District Covered
KMSS 53 416 14 9
BMSS 4 126 9 7
HMSS - 200 8 5
PMSS 16 93 6 7
LMSS 1 42 3 5
MPMSS - 33 3 3
MP & DS - 21 - 7
Total 74 931 43 43
Rcrerscnce'\dhikan. J. and Bohle. Ci. 1999. Food ('!"isi.l· in ;Vepol' flow AIounlain Farmers ('ope
Delhi: Adroit PublishersAgricultural Statistics Division {AS D). 1998/9Y. Statistical Information 011 Sepolese
Agriculture, K<lthmanud: Ministry of Agriculture. Nepal.ASD 1999/2000. 5;tatislical II?formation on A'epalesc ,Igricullure. Kathmandu:
Ministry of Agriculture, Nep<ll.ASD. 2000/2001. Statistical Information un .Yepalese Agriculture K<lthmandu'
Ministry of Agriculture. Nepal.BasnyaL Birendra Bir. 1995, ,\'epal's Agriculrure Susrainabilitv and Intervention,
rookingfor new Directions. Netherlands: Wageningen Aiiculture University.Central Bureau of Statistics (CBS), 1993, Stalis/ieal Year Book ofl\'epar Kathmandu:
His Majesty's Government. National Planning Commission Secret<lriat.CBS 1997. Statistical lear Book o(Sepal Kathmandu: His Majesty's Government.
National Planning Commission SecretariatCnS.2001. Statistical Year Book ofi\'epal. Kathmandu' His Majesty's Government.
National Planning Commission Secretariat. KathmanduDairy Development Corporation. 2003. Progress Report ]OO/]O()], Kathmandu:
Dairy Development Corporation, Lainchaur, Nepal.District Development Committee. 200 I. DislriC( Profile of Chitwan District: Chitwan,
District Development Committee. District Information Centre. Nepal (inNepali).
(Jurung. R.M. 1980. Lives/Ock Development In \'epal wilh Special Reference toLanglang I'alley Kathmandu: I:conolllic Instruction Committee, TrivuwanUniversity, Kirtipur
Joshi D.O. and T.B. K.C. 2002. An Overview o/Small holder Dab)' Production and-"darketing in ,,,"-'epaI Kenya: lntcrnatioll<ll Llvestock Research institute.Nairobi.
Livestock Service Department. 1999. Annual Report 1998/99. Lalitpur: HariharBhawan, NepaL
\ilaharj'-lll. Kcshav Lall. 1997. Impact of Irrigalion and Drainage Schemes on RuralEconomic Activities in Bangladesh Research Centre for Regional Geography.Hiroshima University.
4. Tarai region in Nepal is divided into two parts Inner Tarai and Outer Tarai. Inner
T3rai is the river valley between Mahabharat Hills (Southern Hill-2000m) and
Siwalik Hills (Tarai Hills-600m). Inner Tarai is also divided into three regions.
Eastern Inner Tarai which includes Udaypur and Sindhuli Districts, Central Inner
Tarai, \vhich includes Chitwan and Maka\vanpur District and the western Inner
Tarai that includes Dang Duekhuri districts.5. Fixed cost such as depreciation cost for animaL animal shed and equipment used
were excluded in the study. It is difficult to evaluate animal depreciation costdue to the various matters such as animal type, size, age and calving stage. In theC<lse of <lnim<ll shed and equipment, it is also difficult to eV<llu<lte the depreciationcost. Bccause majority of larrners are using same anim<ll shed for dairy anim<llsuml other slmlll animals and using same equipment t()r dairy 'IS well as crorLlrming.