Embed Size (px)
Citation preview

7/27/2019 Daily Metals and Energy Report, July 30 2013
http://slidepdf.com/reader/full/daily-metals-and-energy-report-july-30-2013 1/6
International Commodities
Content Overview
Precious Metals
Energy
Base Metals
Important Events for today
Angel Commodities Broking Pvt. Ltd.
Registered Office: G-1, Ackruti Trade Centre, Rd. No. 7, MIDC, A
Corporate Office: 6th Floor, Ackruti Star, MIDC, Andheri (E), Mu
MCX Member ID: 12685 / FMC Regn No: MCX / TCM / CORP / 0
Disclaimer: The information and opinions contained in the document
correctness. The document is not, and should not be construed as an off
part, by any recipient hereof for any purpose without prior permission fr
Research Team
Reena Rohit
Chief Manager
Non-Agri Currencies and Commodities
(022) 2921 2000 Extn :6134
Anish Vyas
Research Analyst
(022) 2921 2000 Extn :6104
Commodities DailyTuesday| J
w
ndheri (E), Mumbai - 400 093.
mbai - 400 093. Tel: (022) 2921 2000
37 NCDEX: Member ID 00220 / FMC Regn No: NCDEX / TCM / CORP /
have been compiled from sources believed to be reliable. The company doe
er to sell or solicitation to buy any commodities. This document may not be repr
m “Angel Commodities Broking (P) Ltd”. Your feedback is appreciated on comm
Report ly 30, 2013
w.angelcommodities.com
302
s not warrant its accuracy, completen
oduced, distributed or published, in who
7/27/2019 Daily Metals and Energy Report, July 30 2013
http://slidepdf.com/reader/full/daily-metals-and-energy-report-july-30-2013 2/6
International Commodities
Overview
• US Pending Home Sales declined by 0.4 percent i
• UK’s CBI Realized Sales was at 17-mark in the curr
• Japan’s Unemployment Rate dropped to 3.9 perc
Asian markets are trading higher today on the bac
unemployment rate which showed signs of eco
country.
US Pending Home Sales declined by 0.4 percent in
of 5.8 percent a month ago.
The US Dollar Index (DX) traded on a flat note a
around 0.01 percent in the yesterday’s trade on t
aversion in the global market sentiments which led
he currency. Further, unfavorable pending home supported an upside in the currency.
However, sharp upside in the currency was capped
concerns that Fed will not pullback its stimulus me
DX touched an intra-day high of 81.94 and closed at
The Indian Rupee depreciated around 0.9 percent
ession. The currency depreciated on the back
domestic markets. Further, expectations of econo
arget of 6 percent exerted downside pressure on t
However, sharp downside in currency was cush
weakness in the DX. The currency touched an intra
closed at same levels on Monday.
For the month of July 2013, FII outflows totaled
$1017.77 million) as on 29th
July 2013. Year to d
nflows stood at Rs.66074.20 crores ($12,483.10
2013.
UK’s Net Lending to Individuals was at 1.5 billio
against a rise of 1.2 billion Pounds a month ago. Condustry (CBI) Realized Sales was at 17-mark in July
une. Mortgage Approvals remained unchanged at
of June.
apan’s Household Spending declined by 0.4 perce
previous fall of 1.6 percent in May. Unemploymen
percent in June from rise of 4.1 percent a month
Production declined by 3.3 percent in last month
1.9 percent in earlier month.
Commodities DailyTuesday| J
w
the last month.
ent month.
nt in month of June.
of decline in Japan’s
omic growth in the
June as against a rise
nd gained marginally
e back of rise in risk
to rise in demand for
ales data from the US
on account of ease in
asures very soon. The
81.76 on Monday.
in yesterday’s trading
of weak global and
ic growth below the
e currency.
ioned on account of
-day low of 59.54 and
at Rs.6104.20 crores
ate basis, net capital
million) till 29th
July
n Pounds in June as
nfederation of Britishfrom earlier 1-level in
58,000 in the month
t in June as against a
Rate dropped to 3.9
ago. Prelim Industrial
ith respect to rise of
Market Highlights (% change)
Last Prev da
INR/$
(Spot)
47.64 -0.1
$/Euro
(Spot)
1.3745 0.4
Dollar
Index
76.875 -0.1
NIFTY 5012.55 1.4
SENSEX 16709.6 1.4
DJIA 11246.73 1.2
S&P 1188.68 1.3
The Euro depreciated around
trading session on the back
weak global market sentiment
the currency.
The Euro touched an intra-da
1.326 against the dollar on Mo
.
Report ly 30, 2013
w.angelcommodities.com
as on 29 July, 2013
y w-o-w m-o-m
1 -3.21 -4.92
8 -2.50 -4.70
6 1.73 4.23
5 -2.19 -0.87
7 -2.08 -0.78
7 -1.47 -1.43
5 -0.83 -0.44
Source:
0.1 percent in the yesterd
f strength in the DX. Furt
s exerted downside pressur
y low of 1.3238 and close
day.
7/27/2019 Daily Metals and Energy Report, July 30 2013
http://slidepdf.com/reader/full/daily-metals-and-energy-report-july-30-2013 3/6
International Commodities
ullion
old
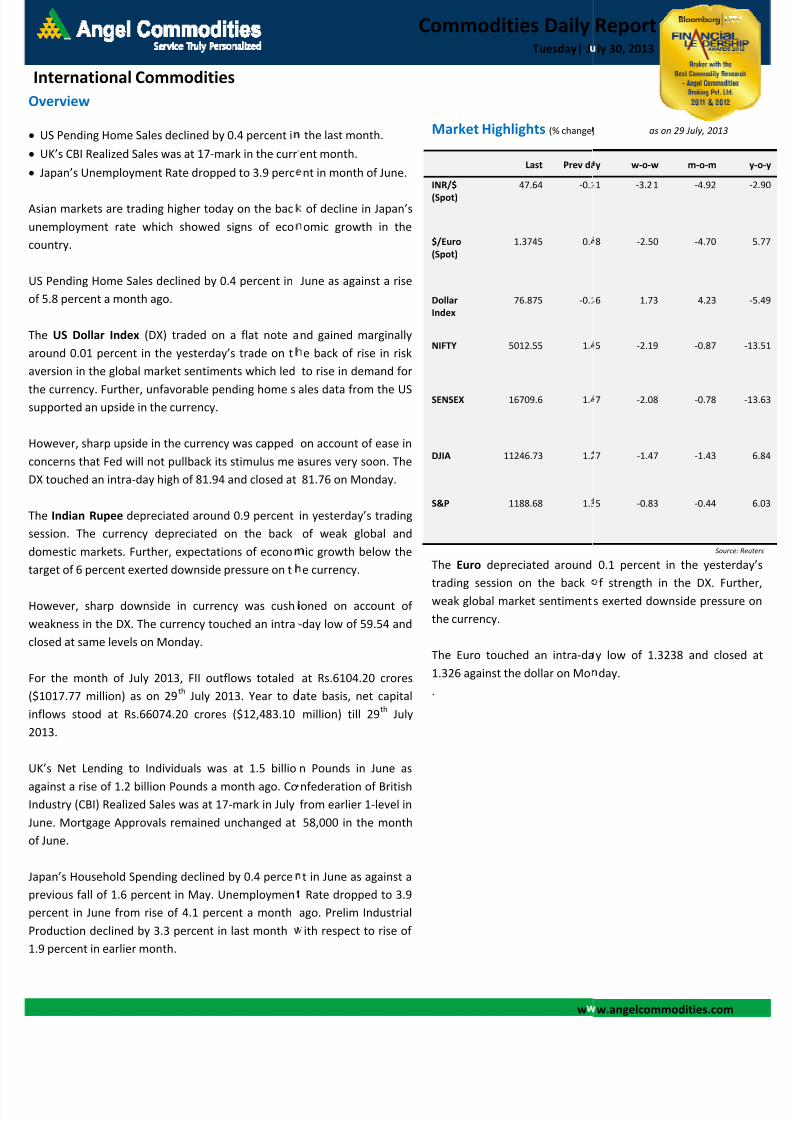
ot gold prices decreased around 0.5 percent i
ading session on the back of strength in the DX. Fu
arket sentiments acted as a negative factor for pric
dditionally, declining trend in SPDR gold holdings
7.35 tonnes lowest level since February 2009
essure on prices. The yellow metal touched an
324.69/oz and closed at $1327/oz in the yesterday
the Indian markets, prices gained by more th
count of depreciation in the Rupee and closed at
ter touching a high of Rs.27,833/10 gms on Monda
lverking cues from fall in gold prices along with downs
oup, Spot silver prices declined around 0.7 p
rther, strength in the DX exerted downside press
hite metal touched an intra-day low of $19.71/
9.75 in yesterday’s trade.
n the domestic front, prices rose around 0.9 perc
preciation in the Rupee and closed at Rs.41,146/k
gh of Rs.40,895/kg on Monday.
utlook
ecious metal prices are expected to trade on a high
ade, taking cues from weakness in the DX coupled
arkets. However, sharp upside in prices will be cap
clining trend in SPDR gold holdings. In the Indian
ade on a higher note on the back of rise in prices
ppreciation in the Rupee will cap sharp gains in pric
chnical Outlook valid for J
Unit Support
pot Gold $/oz 1319/1312
MCX Gold Aug’13 Rs/10 gms 28100/27950
pot Silver $/oz 19.70/19.40
MCX Silver Sept’13 Rs/kg 40800/40400
Commodities DailyTuesday| J
w
Market Highlights - Gold (% chang
Gold Unit Last
Gold (Spot) $/oz 1327.0
Gold (Spot -
Mumbai)
Rs/10
gms
27420.0
Gold
(LBMA-PM
Fix) $/oz 1329.8
Comex Gold
(August’13)
$/oz 1328.4
MCX Gold
(August’13)
Rs /10
gms
28277.0
Market Highlights - Silver (% chang
Silver Unit Last
Silver
(Spot)
$/oz 19.8
Silver
(Spot -
Mumbai) Rs/1 kg 42040.0
Silver
(LBMA) $/oz 2010.0
ComexSilver
(Sept’13)
$/ oz 19.9
MCX Silver
(Sept’13) Rs / kg 41146.0
Technical Chart – Spot Gold
the yesterday’s
ther, weak global
s.
which stands at
xerted downside
intraday low of
’s trading session.
an 3 percent on
Rs.28,277/10 gms
.
ide in base metals
rcent yesterday.
re on prices. The
oz and closed at
nt on account of
g after touching a
er note in today’s
ith upbeat global
ed on account of
arkets, prices will
in previous trade.
s on the MCX.
uly 30, 2013
Resistance
1333/1342
28400/28600
20.0/20.25
41500/41900
Report ly 30, 2013
w.angelcommodities.com
) as on 29 July, 2013
Prev.
dayWoW MoM
-0.5 -0.6 10.6
-0.3 0.9 5.7
-0.1 0.2 7.9
0.5 -0.5 6.8
3.2 2.6 11.4
Source
e) as on 29 July, 2013
Prev day WoW MoM
-0.7 -3.5 7.4
0.9 0.5 4.1
0.4 0.8 8.0
0.5 -1.9 2.9
0.9 -2.6 6.1
Source
Source: T
7/27/2019 Daily Metals and Energy Report, July 30 2013
http://slidepdf.com/reader/full/daily-metals-and-energy-report-july-30-2013 4/6
International Commoditiesnergy
rude Oil
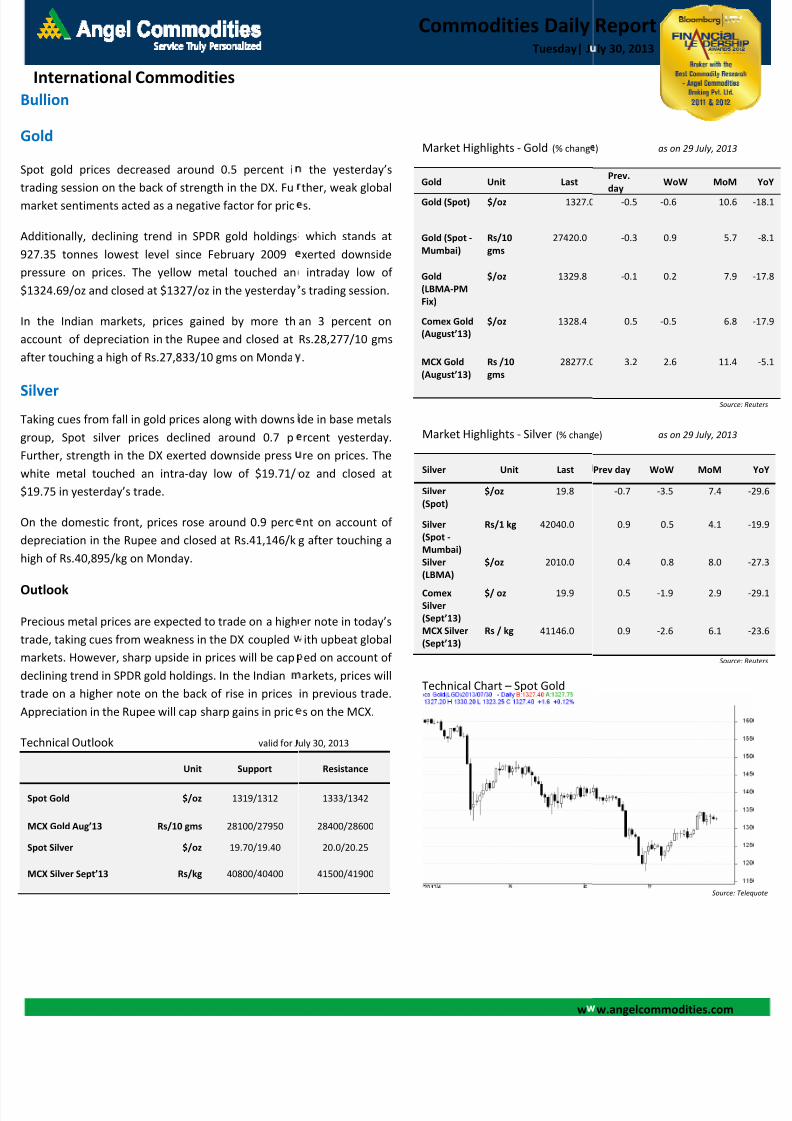
ymex crude oil prices declined around 0.1 percent
ade taking cues from decline in US pending homerength in the DX coupled with weak global market
essure on prices.
dditionally, expectations of slow economic growth i
estimates of decline in demand for the fuel t
egative factor. Crude oil prices touched an
103.87/bbl and closed at $104.60/oz in last trading
n the domestic bourses, MCX crude August contrac
ercent on account of depreciation in the Rupee a
uched a high of Rs.6,174/bbl and closed at Rs.6,251
PI Inventories Forecast
e American Petroleum Institute (API) is sched
eekly inventories today and US crude oil inventori
ecline by 2.3 million barrels for the week ending on
asoline stocks are expected to drop by 0.3 million b
ventories are expected to shoot up by 0.8 million b
eek.
utlook
om the intra-day perspective, we expect crude oil
gher note on the back of expectations of fall
ventories. Further, upbeat global markets and wea
pport an upside in prices. Additionally, unrest in
ositive factor for prices. However, sharp upside
sult of forecast for slow economic growth in US an
timates of fall in US consumer confidence data in
event sharp upside in prices. Appreciation in the R
ins in prices on the MCX.
chnical Outlook valid
Unit Suppo
NYMEX Crude Oil $/bbl 103.40/102.4
MCX Crude Aug’13 Rs/bbl 6200/614
Commodities DailyTuesday| J
w
Market Highlights - Crude Oil (% c
Crude Oil Unit Last
Brent
(Spot) $/bbl 109.2
Nymex
Crude (Sep
’13)
$/bbl 104.6
ICE Brent
Crude
(Sep’13)
$/bbl 107.5
MCX Crude
(Aug ’13) Rs/bbl 6251.0
Market Highlights - Natural Gas
Natural
Gas (NG)Unit Last Pre
Nymex
NG
$/mmbtu 3.473
MCX NG
(Aug ’13)
Rs/
mmbtu
208.2
Technical Chart – NYMEX Crude
Technical Chart – NYMEX Natural
in the yesterday’s
sales data. Further,exerted downside
in China and US led
ereby acting as a
intra-day low of
ession.
gained around 0.6
nd crude oil prices
/bbl on Monday.
led to release its
es are expected to
26th July 2013.
arrels and distillate
arrels for the same
rices to trade on a
in API crude oil
kness in the DX will
Egypt will act as a
ill be capped as a
Chinese economy.
vening session will
upee will cap sharp
for July 30, 2013
t Resistance
0 104.90/105.70
0 6290/6340
Report ly 30, 2013
w.angelcommodities.com
ange) as on 29 July, 2013
Prev.
dayWoW MoM
0.5 -0.7 6.0
-0.1 -2.2 6.7
0.3 -0.6 4.5
0.6 -1.8 6.9
Source
(% change) as on 29 July, 2
. day WoW MoM
-2.4 -6.26 -2.61
-1.0 -4.93 -3.30
Source
il
Source: T
Gas
Source: T
7/27/2019 Daily Metals and Energy Report, July 30 2013
http://slidepdf.com/reader/full/daily-metals-and-energy-report-july-30-2013 5/6
International Commoditiesase Metals
e base metals complex traded on a mixed note in
ade as a result of decline in US pending home sal
xed LME inventories scenario also exerted downs
ices.
dditionally, strength in the DX along with wea
ntiments acted as a negative factor.
the Indian markets, depreciation in the Rupee sup
prices on the MCX.
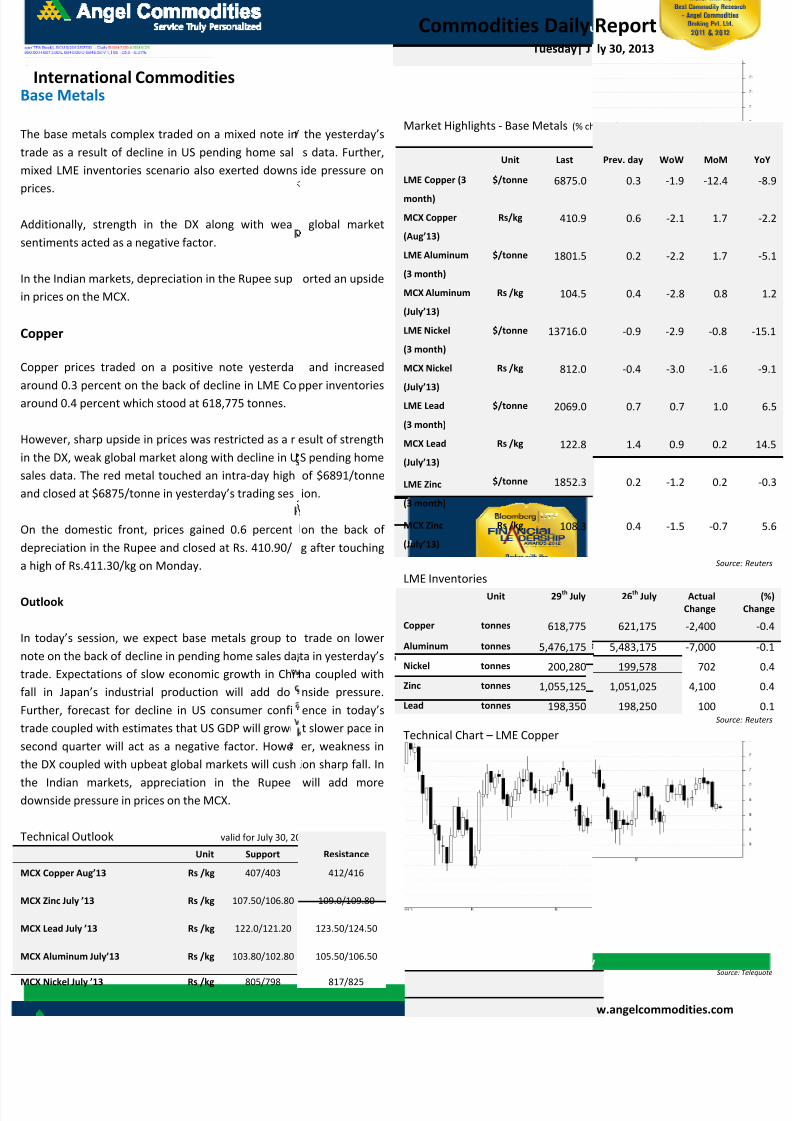
opper
pper prices traded on a positive note yesterda
ound 0.3 percent on the back of decline in LME Co
ound 0.4 percent which stood at 618,775 tonnes.
owever, sharp upside in prices was restricted as a r
the DX, weak global market along with decline in U
les data. The red metal touched an intra-day high
d closed at $6875/tonne in yesterday’s trading ses
n the domestic front, prices gained 0.6 percent
preciation in the Rupee and closed at Rs. 410.90/
high of Rs.411.30/kg on Monday.
utlook
today’s session, we expect base metals group to
te on the back of decline in pending home sales da
ade. Expectations of slow economic growth in Chi
l in Japan’s industrial production will add do
rther, forecast for decline in US consumer confi
ade coupled with estimates that US GDP will grow
cond quarter will act as a negative factor. Howe
e DX coupled with upbeat global markets will cush
e Indian markets, appreciation in the Rupeewnside pressure in prices on the MCX.
chnical Outlook valid for July 30, 20
Unit Support
CX Copper Aug’13 Rs /kg 407/403
CX Zinc July ’13 Rs /kg 107.50/106.80
CX Lead July ’13 Rs /kg 122.0/121.20
CX Aluminum July’13 Rs /kg 103.80/102.80
CX Nickel July ’13 Rs /kg 805/798
Commodities DailyTuesday| J
w
the yesterday’s
s data. Further,
ide pressure on
global market
orted an upside
and increased
pper inventories
esult of strength
S pending home
of $6891/tonne
ion.
on the back of
g after touching
trade on lower
ta in yesterday’s
na coupled with
nside pressure.
ence in today’s
t slower pace in
er, weakness in
ion sharp fall. In
will add more
13
Resistance
412/416
109.0/109.80
123.50/124.50
105.50/106.50
817/825
Market Highlights - Base Metals (% ch
Unit Last
LME Copper (3
month)
$/tonne 6875.0
MCX Copper
(Aug’13)
Rs/kg 410.9
LME Aluminum
(3 month)
$/tonne 1801.5
MCX Aluminum
(July’13)
Rs /kg 104.5
LME Nickel
(3 month)
$/tonne 13716.0
MCX Nickel
(July’13)
Rs /kg 812.0
LME Lead
(3 month)
$/tonne 2069.0
MCX Lead
(July’13)
Rs /kg 122.8
LME Zinc
(3 month)
$/tonne 1852.3
MCX Zinc
(July’13)
Rs /kg 108.3
LME Inventories
Unit 29th
July
Copper tonnes 618,775
Aluminum tonnes 5,476,175
Nickel tonnes 200,280
Zinc tonnes 1,055,125
Lead tonnes 198,350
Technical Chart – LME Copper
Report ly 30, 2013
w.angelcommodities.com
ange) as on 29 July, 2013
Prev. day WoW MoM
0.3 -1.9 -12.4
0.6 -2.1 1.7
0.2 -2.2 1.7
0.4 -2.8 0.8
-0.9 -2.9 -0.8
-0.4 -3.0 -1.6
0.7 0.7 1.0
1.4 0.9 0.2
0.2 -1.2 0.2
0.4 -1.5 -0.7
Source
26th
July Actual
Change
621,175 -2,400
5,483,175 -7,000
199,578 702
1,051,025 4,100
198,250 100 Source
Source:

7/27/2019 Daily Metals and Energy Report, July 30 2013
http://slidepdf.com/reader/full/daily-metals-and-energy-report-july-30-2013 6/6
International Commodities
Important Events for Today
Indicator Country
Household Spending y/y Japan
Prelim Industrial Production m/m Japan
GfK German Consumer Climate Euro
German Prelim CPI m/m Euro
Spanish Flash GDP q/q Euro
Italian 10-y Bond Auction Euro
S&P/CS Composite-20 HPI y/y US
CB Consumer Confidence US
Commodities DailyTuesday| J
Time (IST) Actual Forecast Pre
5:00am -0.4% 1.2% -1
5:20am -3.3% -1.4% 1.
11:30am - 6.9
All day - 0.3% 0.
12:30pm - -0.1% -0
Tentative - - 4.5
6:30pm - 12.4% 12
7:30pm - 81.1 8
Report ly 30, 2013
ious Impact
.6% Medium
.9% Medium
.8 Medium
.1% Medium
.5% Medium
5/1.5 Medium
.1% Medium
1.4 High