Embed Size (px)
Citation preview
DAFTAR PUSTAKA
1. Ardiansyah, F. (2007), Pemanasan Global dan Respon Indonesia, WWF-Indonesia.
2. Bruno, J.F., Selig, E.R., Casey, K.S., Cathie A., Willis, B.L., Harvell, C.D.,
Sweatman, H., Melendy, A.M. (2007), Thermal Stress and Coral Cover as Drivers of Coral Disease Outbreaks.
3. O’Farrel, S., Korda, R., Rose, H., Williams, C., Comley, J. Lovelace, B., Armstrong, H., Guilland, R., Benjamin, J., Day, O. (2007), Mass Coral Bleaching event in Tobbago, Report on the 2005 Part I, Result from phase 1 survey.Buccoo reef trust, coral cay conservation dan jointpatner tobago House of Assembly, dan the Travel foundation.
4. Buchheim, J. (1998), Coral Reef Bleaching, Oddysey Expedition, Tropical Marine Biology Voyages.
5. Buddemeier, Robert, W., Kleypas, Joan A., Aronson, Richard B. (2004), Coral Reefs and Global Climate Change, Potential Contributions of Climate Change to Stresses on Coral Reef Ecosystem, PEW Climate Centre.
6. Burke, L., Selig, E., Spalding, M. (2002), Terumbu karang yang terancam di Asia tenggara. World Resources Institute.
7. Done, T., Whetton, P., Jonnes, R., Berkelmans, R., Lough, J., Skirving, W., Wooldrige, S. (2003), Global Climate Change and Coral Bleaching on the Great Barrier Reef. Final Report to the state of Queensland Taskforce through the Department of Natural Resources and Mines. CSIRO-Australian Institute of Marine Science-CRC.
8. Douglas, Bruce C. (2004), Global Sea Level Change: Determination and Interpretation, U.S. National Report to IUGG, 1991-1994. Rev Geophys. Vol. 33 Suppl, American Geophysical Union.
9. Gammon, R. (2007), Transition to Sustainability Synergy: Sustainable Living Conference, Chemistry-Oceanography, Atm. Science University of whasington
10. Geophysical Fluid Dynamics Laboratory (GFDL). (2004), Climate Impact of Quadrupling Atmospheric CO2, An Overview of GFDL Climate Model Results, Princeton University Forrestal Campus. Princeton.
11. Hansen, J.,Ruedy, R., Sato, M., Lo, K. (2005), GISS Surface Temperature Analysis. Global Temperature Trends: 2005 Summation.,NASA Goddard Institute for Space Studies and Columbia University Earth Institute, New York.
12. Hoegh-Guldberg, O. (2004), Climate Change, Coral Bleaching, and the Future of the World’s Coral Reefs. The Coral Reef Research Institute, University of Sydney.
13. http://orbit-net.nesdis.noaa.gov/orad/coral_bleaching_index.html
14. IPCC. (2001), Summary for Policymakers. Climate Change 2001: Impacts, Adaptation, and Vulnerability. A Report Working Group II.
15. Lindsey. (2004), A Dangerous Intersection: Humans and Climate Destroy Reef Ecosystem. Earth observatory, NASA.
16. Marine Reef International (MRI). (2007), Mass bleaching around the world
17. Marshall, P., Schuttenberg, H., West, J. (2006), A Reef Manager’s Guide to Coral Bleaching, GBRMPA, NOAA, IUCN, Great Barrier Reef Marine Park Authority, Townsville, Australia.
18. NOAA Coral Reef Watch. (2000), Davies Reef Sea Surface Temperature and Degree Heating Week Time Series Charts NOAA Twice Weekly Near Real Time 50 km Sattelite Nighttime AVHRR.
http://coralreefwatch.noaa.gov/satellite/current/key_sst_50km_field.html.
19. NMRGOV. (2007), Coral Bleaching, Indicator Status. Estuarine, coastal, and marine habitat integrity.
20. NOAA Satellites and Information. (2006), Operational Satelitte Coral Bleaching Monitoring Products Methodology, Information processing Division. Office of Sattelite Data.
21. ReefBase. (2007), ReefBase Dataset: Coral Bleaching.UNEP-WCMC. http://www.reefbase.org/contribute/bleachingreport.aspx.
22. Rogers, C.S., Garrison, G., Grober, R., Marie hillis, Z., Franke, M. A. (1994), Field survey methods coral reef Monitoring Manual for carribbean and western atlantic, National park service Virgin Island national park.
23. Setiasih, N., Ismunarto, Dwi H. (2006), Bali Barat National Park. Coral Monitoring Report, Reports for Friends of the Reef Project WWF Indonesia. Denpasar.
24. Strong, A.E., Liu, G., Kimura, T., Yamano, H., Tsuchiya, M., Kakuma, S., Woesik, R. (2001). Detecting and monitoring 2001 Coral Reef Bleaching Events in Ryukyu Islands Japan Using Satelitte Bleaching Hotspot Remote Sensing Technique.
25. Sukmara, A., Siahainenia A. J., Rotinsulu, C. (2001). Panduan Pemanatauan Terumbu Karang berbasis Masyarakat dengan Metode Manta Taw.Proyek Pesisir-CRMP Indonesia.
26. Susandi, A., Radjawane, Ivonne M., Subki, A. (2006), Kajian Potensi Kelautan Indonesia Dalam Menyerap CO2, Penelitian Hibah Bersaing XIV/1.
27. Terry D., Peter W., Roger J., Ray B., Janice L., William S., Scott W. (2003), Final report to state of Queensland greenhouse taskforce, Department of natural resources and mines, AIMS, CSIRO, and CRC Reef Research Centre.
28. TNC. (2007), Coral Triangle. www.tnc.org/coral-triangle/
29. UCLA. (2004), Reef Check Instruction Manual, A guide to Reef Check Coral Reef Monitoring, Institute of the Environment. University of California.
30. UNEP. (2006), Sea Level Rise due to Global Warming, Potential Climate Change Impacts. Observed Climate Trends.
31. Wilkinson, C. (2000), Status of Coral Reefs of The World: 2000, Global Coral Reef Monitoring Network. Australian Institue of Marine Science. www.environment.gouv.fr/icri.
32. Woodworth, P.L. (2007), Long Term Sea and Land Level Changes and their Monitoring, Permanent Service for Mean Sea Level. Proudman Oceanographic Laboratory.
1
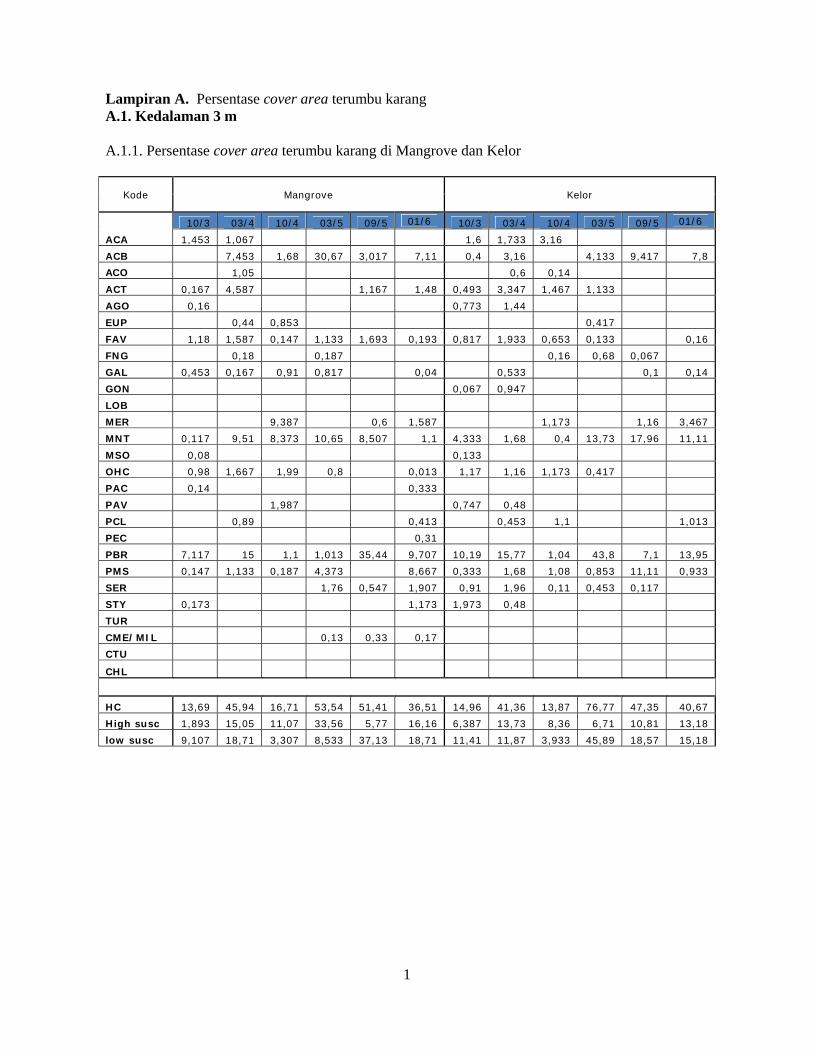
Lampiran A. Persentase cover area terumbu karang A.1. Kedalaman 3 m A.1.1. Persentase cover area terumbu karang di Mangrove dan Kelor
Kode Mangrove Kelor
10/3 03/4 10/4 03/5 09/5 01/6 10/3 03/4 10/4 03/5 09/5 01/6
ACA 1,453 1,067 1,6 1,733 3,16
ACB 7,453 1,68 30,67 3,017 7,11 0,4 3,16 4,133 9,417 7,8
ACO 1,05 0,6 0,14
ACT 0,167 4,587 1,167 1,48 0,493 3,347 1,467 1,133
AGO 0,16 0,773 1,44
EUP 0,44 0,853 0,417
FAV 1,18 1,587 0,147 1,133 1,693 0,193 0,817 1,933 0,653 0,133 0,16
FNG 0,18 0,187 0,16 0,68 0,067
GAL 0,453 0,167 0,91 0,817 0,04 0,533 0,1 0,14
GON 0,067 0,947
LOB
MER 9,387 0,6 1,587 1,173 1,16 3,467
MNT 0,117 9,51 8,373 10,65 8,507 1,1 4,333 1,68 0,4 13,73 17,96 11,11
MSO 0,08 0,133
OHC 0,98 1,667 1,99 0,8 0,013 1,17 1,16 1,173 0,417
PAC 0,14 0,333
PAV 1,987 0,747 0,48
PCL 0,89 0,413 0,453 1,1 1,013
PEC 0,31
PBR 7,117 15 1,1 1,013 35,44 9,707 10,19 15,77 1,04 43,8 7,1 13,95
PMS 0,147 1,133 0,187 4,373 8,667 0,333 1,68 1,08 0,853 11,11 0,933
SER 1,76 0,547 1,907 0,91 1,96 0,11 0,453 0,117
STY 0,173 1,173 1,973 0,48
TUR
CME/MIL 0,13 0,33 0,17
CTU
CHL
HC 13,69 45,94 16,71 53,54 51,41 36,51 14,96 41,36 13,87 76,77 47,35 40,67
High susc 1,893 15,05 11,07 33,56 5,77 16,16 6,387 13,73 8,36 6,71 10,81 13,18
low susc 9,107 18,71 3,307 8,533 37,13 18,71 11,41 11,87 3,933 45,89 18,57 15,18
2
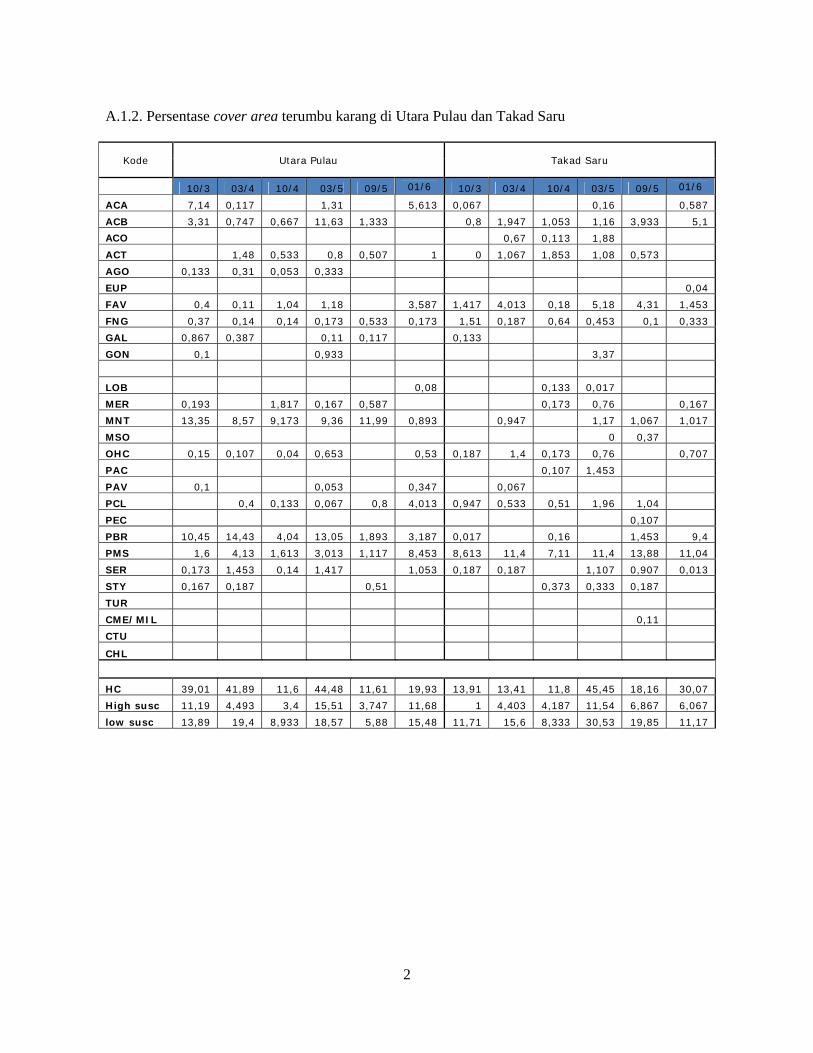
A.1.2. Persentase cover area terumbu karang di Utara Pulau dan Takad Saru
Kode Utara Pulau Takad Saru
10/3 03/4 10/4 03/5 09/5 01/6 10/3 03/4 10/4 03/5 09/5 01/6
ACA 7,14 0,117 1,31 5,613 0,067 0,16 0,587
ACB 3,31 0,747 0,667 11,63 1,333 0,8 1,947 1,053 1,16 3,933 5,1
ACO 0,67 0,113 1,88
ACT 1,48 0,533 0,8 0,507 1 0 1,067 1,853 1,08 0,573
AGO 0,133 0,31 0,053 0,333
EUP 0,04
FAV 0,4 0,11 1,04 1,18 3,587 1,417 4,013 0,18 5,18 4,31 1,453
FNG 0,37 0,14 0,14 0,173 0,533 0,173 1,51 0,187 0,64 0,453 0,1 0,333
GAL 0,867 0,387 0,11 0,117 0,133
GON 0,1 0,933 3,37
LOB 0,08 0,133 0,017
MER 0,193 1,817 0,167 0,587 0,173 0,76 0,167
MNT 13,35 8,57 9,173 9,36 11,99 0,893 0,947 1,17 1,067 1,017
MSO 0 0,37
OHC 0,15 0,107 0,04 0,653 0,53 0,187 1,4 0,173 0,76 0,707
PAC 0,107 1,453
PAV 0,1 0,053 0,347 0,067
PCL 0,4 0,133 0,067 0,8 4,013 0,947 0,533 0,51 1,96 1,04
PEC 0,107
PBR 10,45 14,43 4,04 13,05 1,893 3,187 0,017 0,16 1,453 9,4
PMS 1,6 4,13 1,613 3,013 1,117 8,453 8,613 11,4 7,11 11,4 13,88 11,04
SER 0,173 1,453 0,14 1,417 1,053 0,187 0,187 1,107 0,907 0,013
STY 0,167 0,187 0,51 0,373 0,333 0,187
TUR
CME/MIL 0,11
CTU
CHL
HC 39,01 41,89 11,6 44,48 11,61 19,93 13,91 13,41 11,8 45,45 18,16 30,07
High susc 11,19 4,493 3,4 15,51 3,747 11,68 1 4,403 4,187 11,54 6,867 6,067
low susc 13,89 19,4 8,933 18,57 5,88 15,48 11,71 15,6 8,333 30,53 19,85 11,17
3
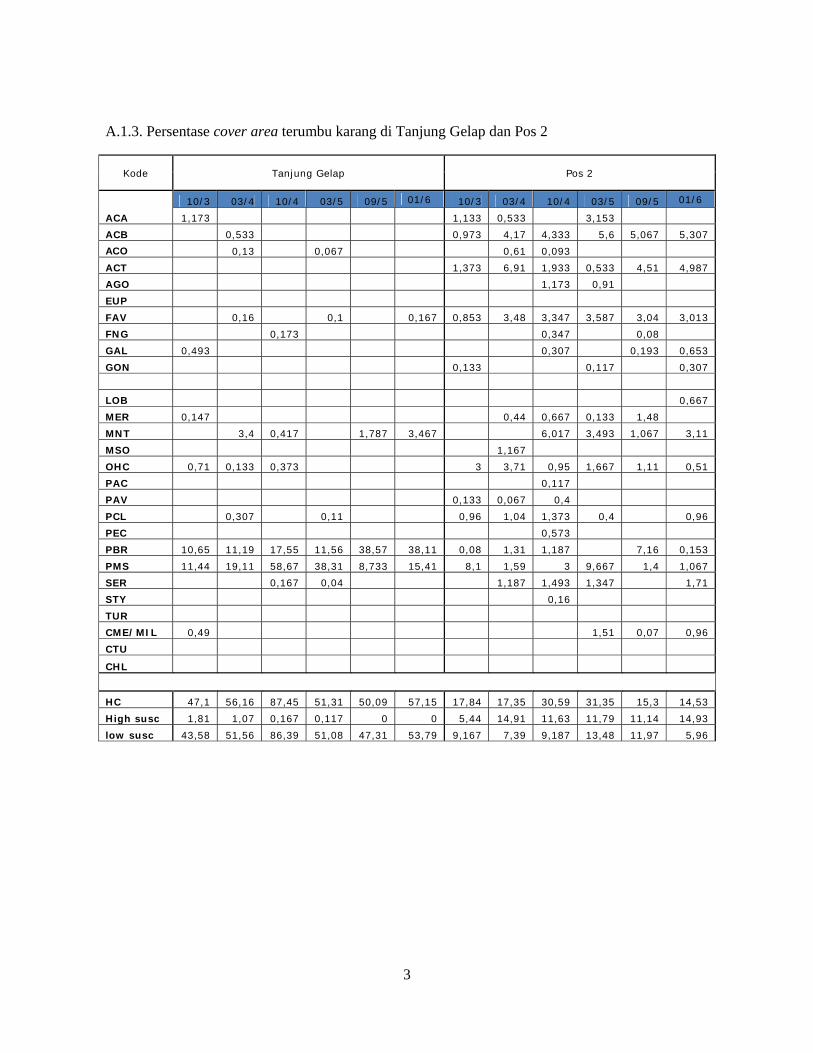
A.1.3. Persentase cover area terumbu karang di Tanjung Gelap dan Pos 2
Kode Tanjung Gelap Pos 2
10/3 03/4 10/4 03/5 09/5 01/6 10/3 03/4 10/4 03/5 09/5 01/6
ACA 1,173 1,133 0,533 3,153
ACB 0,533 0,973 4,17 4,333 5,6 5,067 5,307
ACO 0,13 0,067 0,61 0,093
ACT 1,373 6,91 1,933 0,533 4,51 4,987
AGO 1,173 0,91
EUP
FAV 0,16 0,1 0,167 0,853 3,48 3,347 3,587 3,04 3,013
FNG 0,173 0,347 0,08
GAL 0,493 0,307 0,193 0,653
GON 0,133 0,117 0,307
LOB 0,667
MER 0,147 0,44 0,667 0,133 1,48
MNT 3,4 0,417 1,787 3,467 6,017 3,493 1,067 3,11
MSO 1,167
OHC 0,71 0,133 0,373 3 3,71 0,95 1,667 1,11 0,51
PAC 0,117
PAV 0,133 0,067 0,4
PCL 0,307 0,11 0,96 1,04 1,373 0,4 0,96
PEC 0,573
PBR 10,65 11,19 17,55 11,56 38,57 38,11 0,08 1,31 1,187 7,16 0,153
PMS 11,44 19,11 58,67 38,31 8,733 15,41 8,1 1,59 3 9,667 1,4 1,067
SER 0,167 0,04 1,187 1,493 1,347 1,71
STY 0,16
TUR
CME/MIL 0,49 1,51 0,07 0,96
CTU
CHL
HC 47,1 56,16 87,45 51,31 50,09 57,15 17,84 17,35 30,59 31,35 15,3 14,53
High susc 1,81 1,07 0,167 0,117 0 0 5,44 14,91 11,63 11,79 11,14 14,93
low susc 43,58 51,56 86,39 51,08 47,31 53,79 9,167 7,39 9,187 13,48 11,97 5,96
4
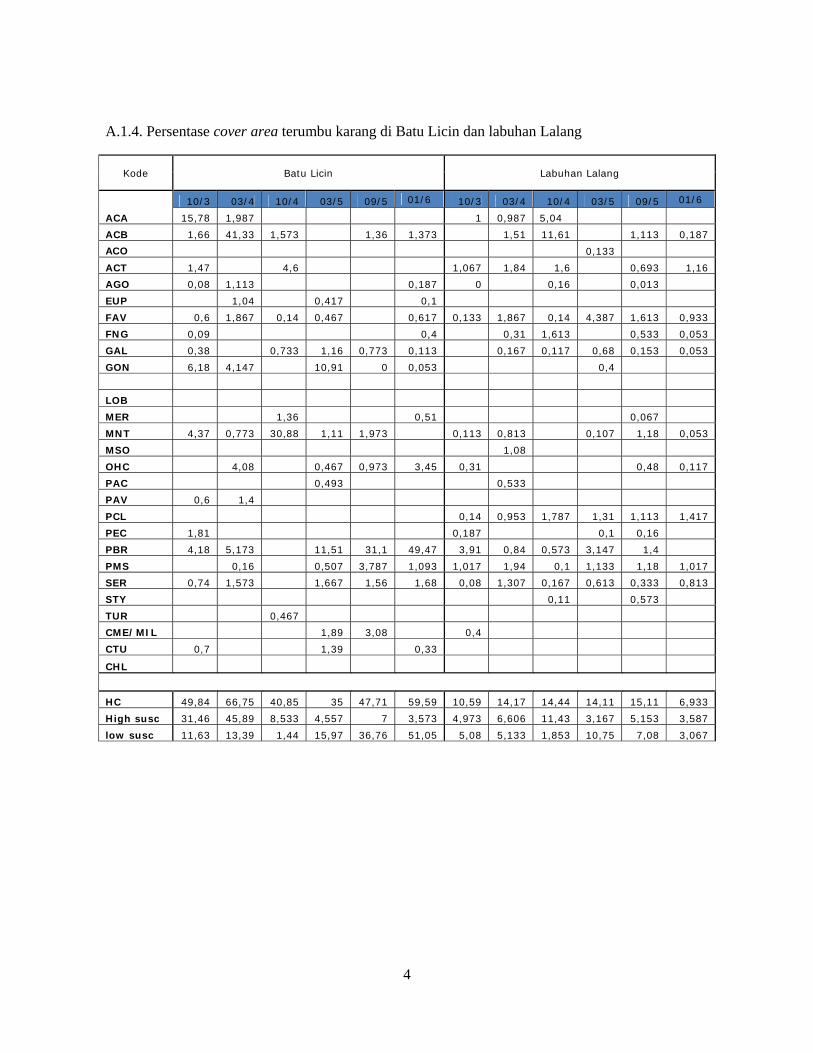
A.1.4. Persentase cover area terumbu karang di Batu Licin dan labuhan Lalang
Kode Batu Licin Labuhan Lalang
10/3 03/4 10/4 03/5 09/5 01/6 10/3 03/4 10/4 03/5 09/5 01/6
ACA 15,78 1,987 1 0,987 5,04
ACB 1,66 41,33 1,573 1,36 1,373 1,51 11,61 1,113 0,187
ACO 0,133
ACT 1,47 4,6 1,067 1,84 1,6 0,693 1,16
AGO 0,08 1,113 0,187 0 0,16 0,013
EUP 1,04 0,417 0,1
FAV 0,6 1,867 0,14 0,467 0,617 0,133 1,867 0,14 4,387 1,613 0,933
FNG 0,09 0,4 0,31 1,613 0,533 0,053
GAL 0,38 0,733 1,16 0,773 0,113 0,167 0,117 0,68 0,153 0,053
GON 6,18 4,147 10,91 0 0,053 0,4
LOB
MER 1,36 0,51 0,067
MNT 4,37 0,773 30,88 1,11 1,973 0,113 0,813 0,107 1,18 0,053
MSO 1,08
OHC 4,08 0,467 0,973 3,45 0,31 0,48 0,117
PAC 0,493 0,533
PAV 0,6 1,4
PCL 0,14 0,953 1,787 1,31 1,113 1,417
PEC 1,81 0,187 0,1 0,16
PBR 4,18 5,173 11,51 31,1 49,47 3,91 0,84 0,573 3,147 1,4
PMS 0,16 0,507 3,787 1,093 1,017 1,94 0,1 1,133 1,18 1,017
SER 0,74 1,573 1,667 1,56 1,68 0,08 1,307 0,167 0,613 0,333 0,813
STY 0,11 0,573
TUR 0,467
CME/MIL 1,89 3,08 0,4
CTU 0,7 1,39 0,33
CHL
HC 49,84 66,75 40,85 35 47,71 59,59 10,59 14,17 14,44 14,11 15,11 6,933
High susc 31,46 45,89 8,533 4,557 7 3,573 4,973 6,606 11,43 3,167 5,153 3,587
low susc 11,63 13,39 1,44 15,97 36,76 51,05 5,08 5,133 1,853 10,75 7,08 3,067
5
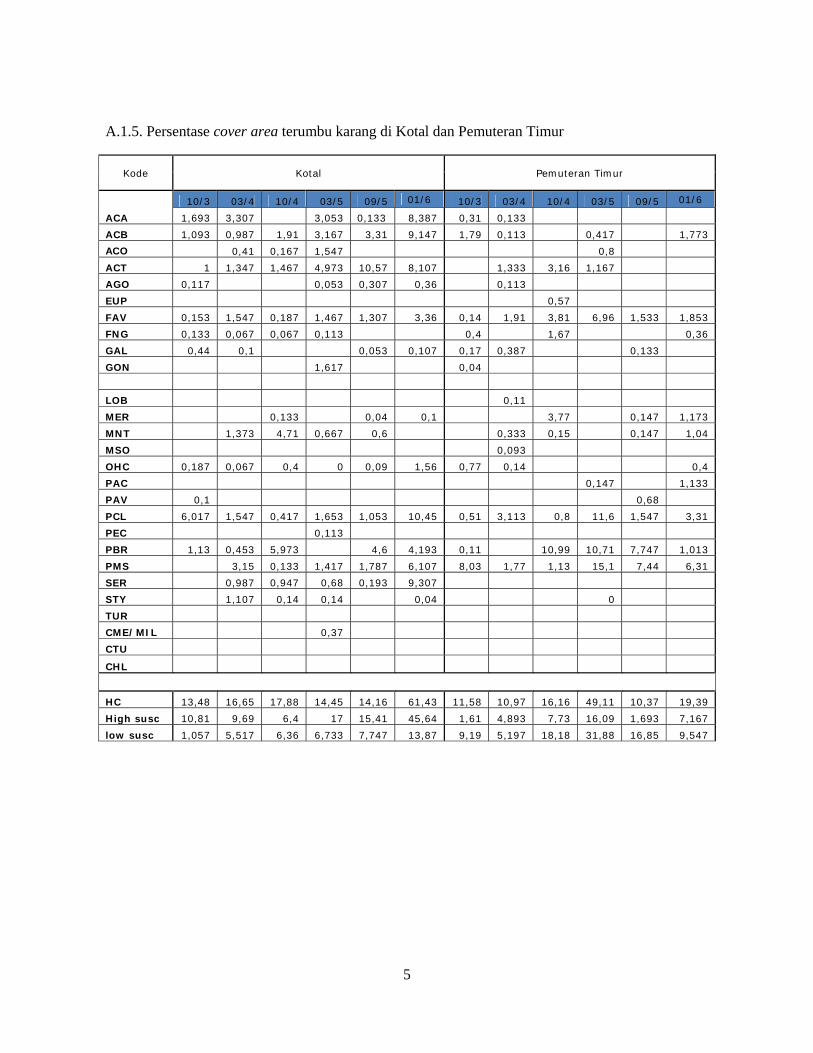
A.1.5. Persentase cover area terumbu karang di Kotal dan Pemuteran Timur
Kode Kotal Pemuteran Timur
10/3 03/4 10/4 03/5 09/5 01/6 10/3 03/4 10/4 03/5 09/5 01/6
ACA 1,693 3,307 3,053 0,133 8,387 0,31 0,133
ACB 1,093 0,987 1,91 3,167 3,31 9,147 1,79 0,113 0,417 1,773
ACO 0,41 0,167 1,547 0,8
ACT 1 1,347 1,467 4,973 10,57 8,107 1,333 3,16 1,167
AGO 0,117 0,053 0,307 0,36 0,113
EUP 0,57
FAV 0,153 1,547 0,187 1,467 1,307 3,36 0,14 1,91 3,81 6,96 1,533 1,853
FNG 0,133 0,067 0,067 0,113 0,4 1,67 0,36
GAL 0,44 0,1 0,053 0,107 0,17 0,387 0,133
GON 1,617 0,04
LOB 0,11
MER 0,133 0,04 0,1 3,77 0,147 1,173
MNT 1,373 4,71 0,667 0,6 0,333 0,15 0,147 1,04
MSO 0,093
OHC 0,187 0,067 0,4 0 0,09 1,56 0,77 0,14 0,4
PAC 0,147 1,133
PAV 0,1 0,68
PCL 6,017 1,547 0,417 1,653 1,053 10,45 0,51 3,113 0,8 11,6 1,547 3,31
PEC 0,113
PBR 1,13 0,453 5,973 4,6 4,193 0,11 10,99 10,71 7,747 1,013
PMS 3,15 0,133 1,417 1,787 6,107 8,03 1,77 1,13 15,1 7,44 6,31
SER 0,987 0,947 0,68 0,193 9,307
STY 1,107 0,14 0,14 0,04 0
TUR
CME/MIL 0,37
CTU
CHL
HC 13,48 16,65 17,88 14,45 14,16 61,43 11,58 10,97 16,16 49,11 10,37 19,39
High susc 10,81 9,69 6,4 17 15,41 45,64 1,61 4,893 7,73 16,09 1,693 7,167
low susc 1,057 5,517 6,36 6,733 7,747 13,87 9,19 5,197 18,18 31,88 16,85 9,547
6
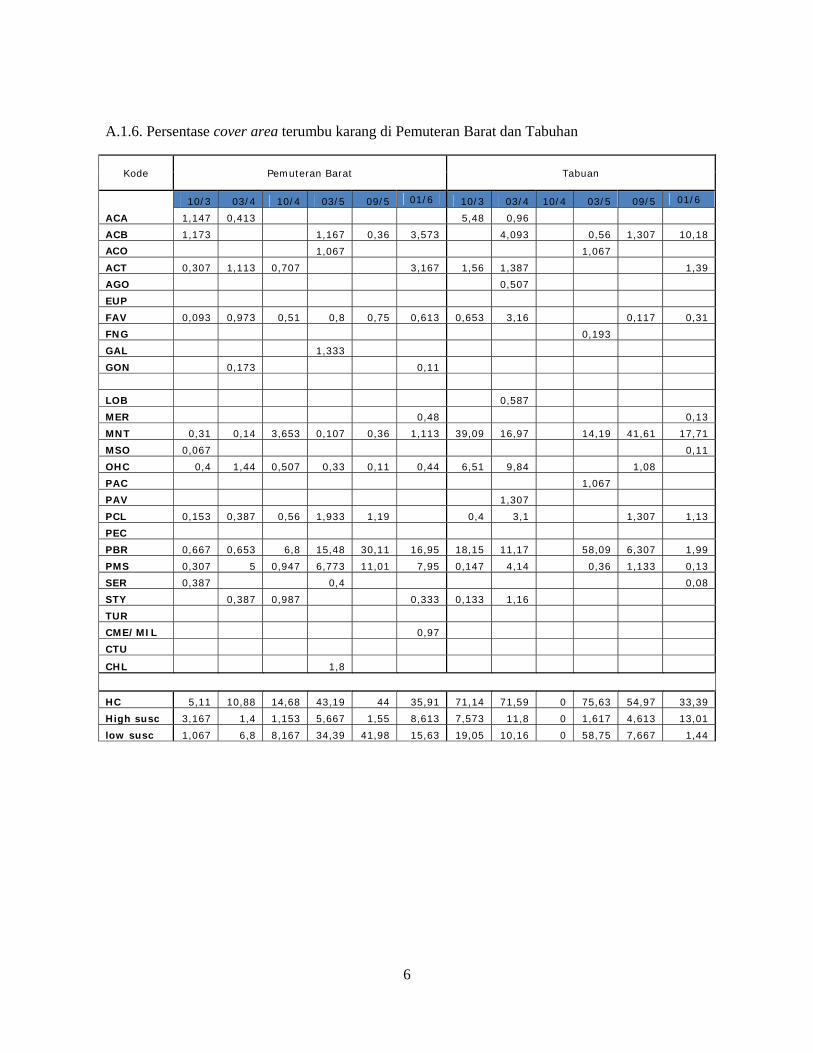
A.1.6. Persentase cover area terumbu karang di Pemuteran Barat dan Tabuhan
Kode Pemuteran Barat Tabuan
10/3 03/4 10/4 03/5 09/5 01/6 10/3 03/4 10/4 03/5 09/5 01/6
ACA 1,147 0,413 5,48 0,96
ACB 1,173 1,167 0,36 3,573 4,093 0,56 1,307 10,18
ACO 1,067 1,067
ACT 0,307 1,113 0,707 3,167 1,56 1,387 1,39
AGO 0,507
EUP
FAV 0,093 0,973 0,51 0,8 0,75 0,613 0,653 3,16 0,117 0,31
FNG 0,193
GAL 1,333
GON 0,173 0,11
LOB 0,587
MER 0,48 0,13
MNT 0,31 0,14 3,653 0,107 0,36 1,113 39,09 16,97 14,19 41,61 17,71
MSO 0,067 0,11
OHC 0,4 1,44 0,507 0,33 0,11 0,44 6,51 9,84 1,08
PAC 1,067
PAV 1,307
PCL 0,153 0,387 0,56 1,933 1,19 0,4 3,1 1,307 1,13
PEC
PBR 0,667 0,653 6,8 15,48 30,11 16,95 18,15 11,17 58,09 6,307 1,99
PMS 0,307 5 0,947 6,773 11,01 7,95 0,147 4,14 0,36 1,133 0,13
SER 0,387 0,4 0,08
STY 0,387 0,987 0,333 0,133 1,16
TUR
CME/MIL 0,97
CTU
CHL 1,8
HC 5,11 10,88 14,68 43,19 44 35,91 71,14 71,59 0 75,63 54,97 33,39
High susc 3,167 1,4 1,153 5,667 1,55 8,613 7,573 11,8 0 1,617 4,613 13,01
low susc 1,067 6,8 8,167 34,39 41,98 15,63 19,05 10,16 0 58,75 7,667 1,44
7
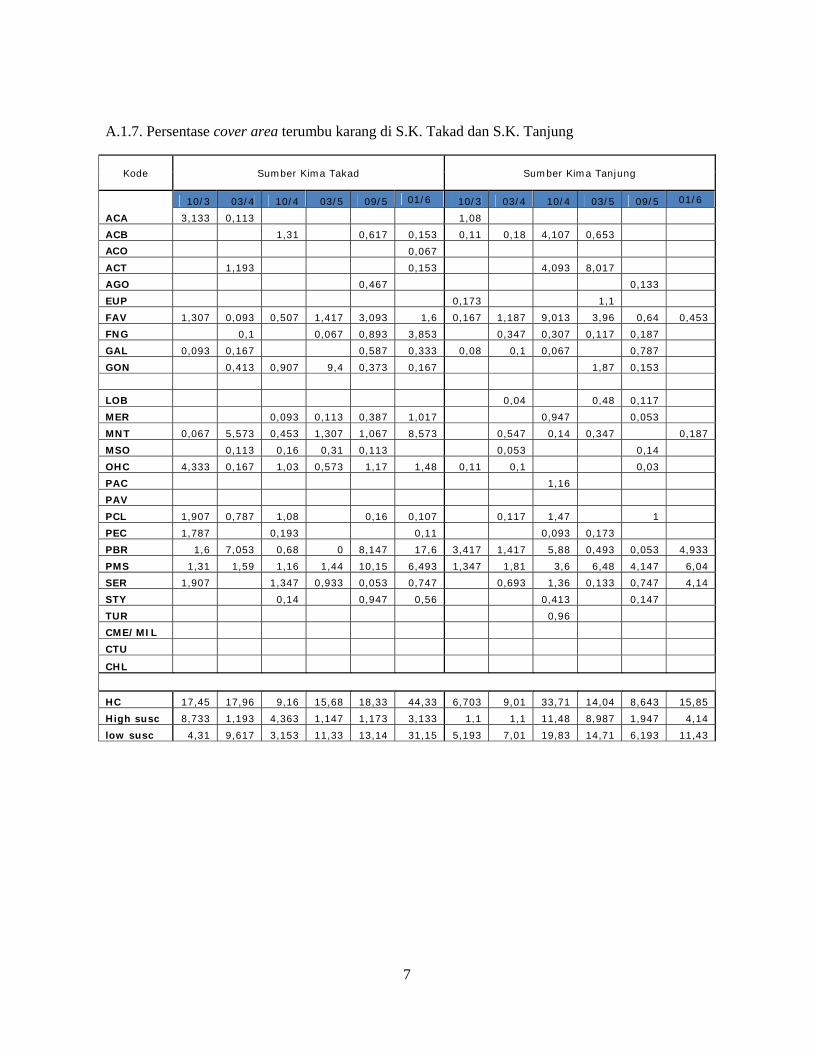
A.1.7. Persentase cover area terumbu karang di S.K. Takad dan S.K. Tanjung
Kode Sumber Kima Takad Sumber Kima Tanjung
10/3 03/4 10/4 03/5 09/5 01/6 10/3 03/4 10/4 03/5 09/5 01/6
ACA 3,133 0,113 1,08
ACB 1,31 0,617 0,153 0,11 0,18 4,107 0,653
ACO 0,067
ACT 1,193 0,153 4,093 8,017
AGO 0,467 0,133
EUP 0,173 1,1
FAV 1,307 0,093 0,507 1,417 3,093 1,6 0,167 1,187 9,013 3,96 0,64 0,453
FNG 0,1 0,067 0,893 3,853 0,347 0,307 0,117 0,187
GAL 0,093 0,167 0,587 0,333 0,08 0,1 0,067 0,787
GON 0,413 0,907 9,4 0,373 0,167 1,87 0,153
LOB 0,04 0,48 0,117
MER 0,093 0,113 0,387 1,017 0,947 0,053
MNT 0,067 5,573 0,453 1,307 1,067 8,573 0,547 0,14 0,347 0,187
MSO 0,113 0,16 0,31 0,113 0,053 0,14
OHC 4,333 0,167 1,03 0,573 1,17 1,48 0,11 0,1 0,03
PAC 1,16
PAV
PCL 1,907 0,787 1,08 0,16 0,107 0,117 1,47 1
PEC 1,787 0,193 0,11 0,093 0,173
PBR 1,6 7,053 0,68 0 8,147 17,6 3,417 1,417 5,88 0,493 0,053 4,933
PMS 1,31 1,59 1,16 1,44 10,15 6,493 1,347 1,81 3,6 6,48 4,147 6,04
SER 1,907 1,347 0,933 0,053 0,747 0,693 1,36 0,133 0,747 4,14
STY 0,14 0,947 0,56 0,413 0,147
TUR 0,96
CME/MIL
CTU
CHL
HC 17,45 17,96 9,16 15,68 18,33 44,33 6,703 9,01 33,71 14,04 8,643 15,85
High susc 8,733 1,193 4,363 1,147 1,173 3,133 1,1 1,1 11,48 8,987 1,947 4,14
low susc 4,31 9,617 3,153 11,33 13,14 31,15 5,193 7,01 19,83 14,71 6,193 11,43
8
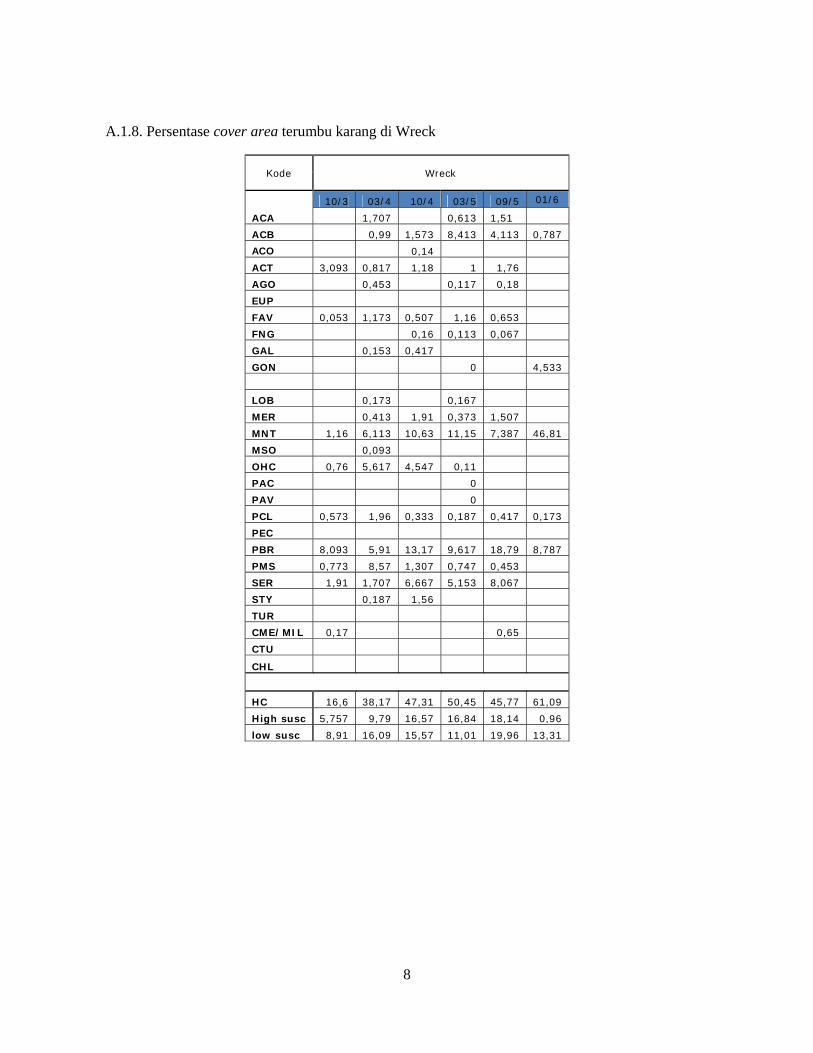
A.1.8. Persentase cover area terumbu karang di Wreck
Kode Wreck
10/3 03/4 10/4 03/5 09/5 01/6
ACA 1,707 0,613 1,51
ACB 0,99 1,573 8,413 4,113 0,787
ACO 0,14
ACT 3,093 0,817 1,18 1 1,76
AGO 0,453 0,117 0,18
EUP
FAV 0,053 1,173 0,507 1,16 0,653
FNG 0,16 0,113 0,067
GAL 0,153 0,417
GON 0 4,533
LOB 0,173 0,167
MER 0,413 1,91 0,373 1,507
MNT 1,16 6,113 10,63 11,15 7,387 46,81
MSO 0,093
OHC 0,76 5,617 4,547 0,11
PAC 0
PAV 0
PCL 0,573 1,96 0,333 0,187 0,417 0,173
PEC
PBR 8,093 5,91 13,17 9,617 18,79 8,787
PMS 0,773 8,57 1,307 0,747 0,453
SER 1,91 1,707 6,667 5,153 8,067
STY 0,187 1,56
TUR
CME/MIL 0,17 0,65
CTU
CHL
HC 16,6 38,17 47,31 50,45 45,77 61,09
High susc 5,757 9,79 16,57 16,84 18,14 0,96
low susc 8,91 16,09 15,57 11,01 19,96 13,31
9
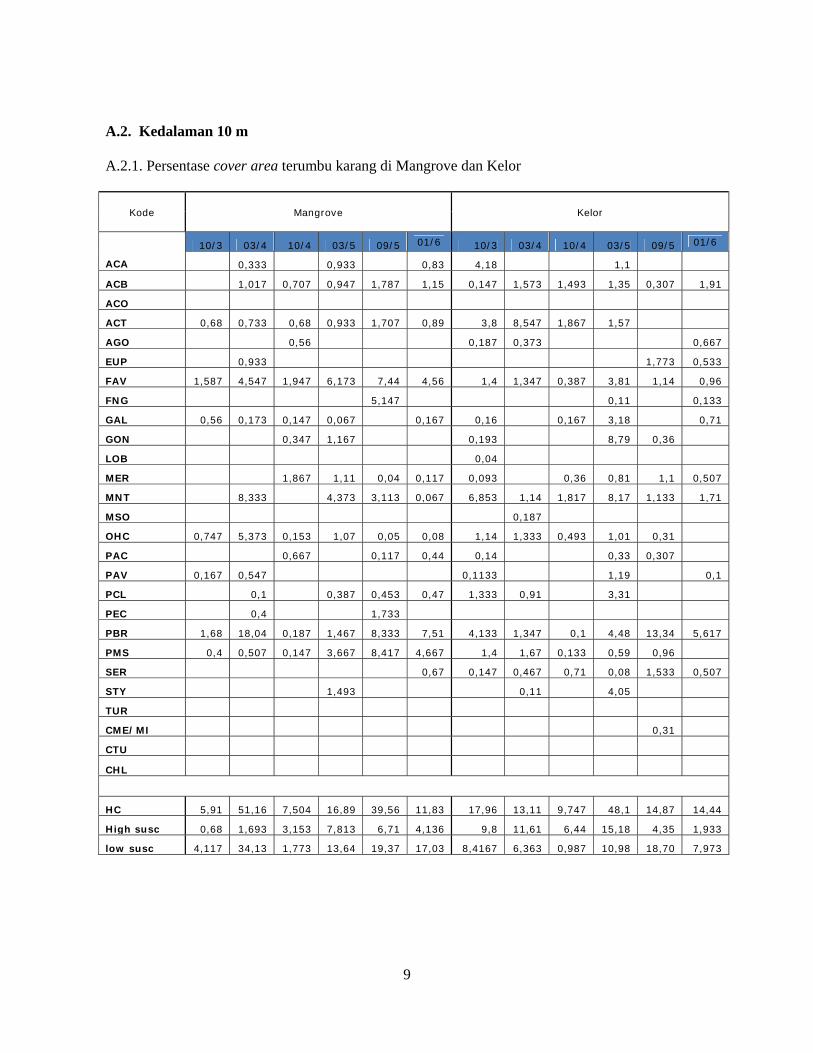
A.2. Kedalaman 10 m A.2.1. Persentase cover area terumbu karang di Mangrove dan Kelor
Kode Mangrove Kelor
ACA
10/3 03/4 10/4 03/5 09/5 01/6 10/3 03/4 10/4 03/5 09/5 01/6
0,333 0,933 0,83 4,18 1,1
ACB 1,017 0,707 0,947 1,787 1,15 0,147 1,573 1,493 1,35 0,307 1,91
ACO
ACT 0,68 0,733 0,68 0,933 1,707 0,89 3,8 8,547 1,867 1,57
AGO 0,56 0,187 0,373 0,667
EUP 0,933 1,773 0,533
FAV 1,587 4,547 1,947 6,173 7,44 4,56 1,4 1,347 0,387 3,81 1,14 0,96
FNG 5,147 0,11 0,133
GAL 0,56 0,173 0,147 0,067 0,167 0,16 0,167 3,18 0,71
GON 0,347 1,167 0,193 8,79 0,36
LOB 0,04
MER 1,867 1,11 0,04 0,117 0,093 0,36 0,81 1,1 0,507
MNT 8,333 4,373 3,113 0,067 6,853 1,14 1,817 8,17 1,133 1,71
MSO 0,187
OHC 0,747 5,373 0,153 1,07 0,05 0,08 1,14 1,333 0,493 1,01 0,31
PAC 0,667 0,117 0,44 0,14 0,33 0,307
PAV 0,167 0,547 0,1133 1,19 0,1
PCL 0,1 0,387 0,453 0,47 1,333 0,91 3,31
PEC 0,4 1,733
PBR 1,68 18,04 0,187 1,467 8,333 7,51 4,133 1,347 0,1 4,48 13,34 5,617
PMS 0,4 0,507 0,147 3,667 8,417 4,667 1,4 1,67 0,133 0,59 0,96
SER 0,67 0,147 0,467 0,71 0,08 1,533 0,507
STY 1,493 0,11 4,05
TUR
CME/MI 0,31
CTU
CHL
HC 5,91 51,16 7,504 16,89 39,56 11,83 17,96 13,11 9,747 48,1 14,87 14,44
High susc 0,68 1,693 3,153 7,813 6,71 4,136 9,8 11,61 6,44 15,18 4,35 1,933
low susc 4,117 34,13 1,773 13,64 19,37 17,03 8,4167 6,363 0,987 10,98 18,70 7,973
10
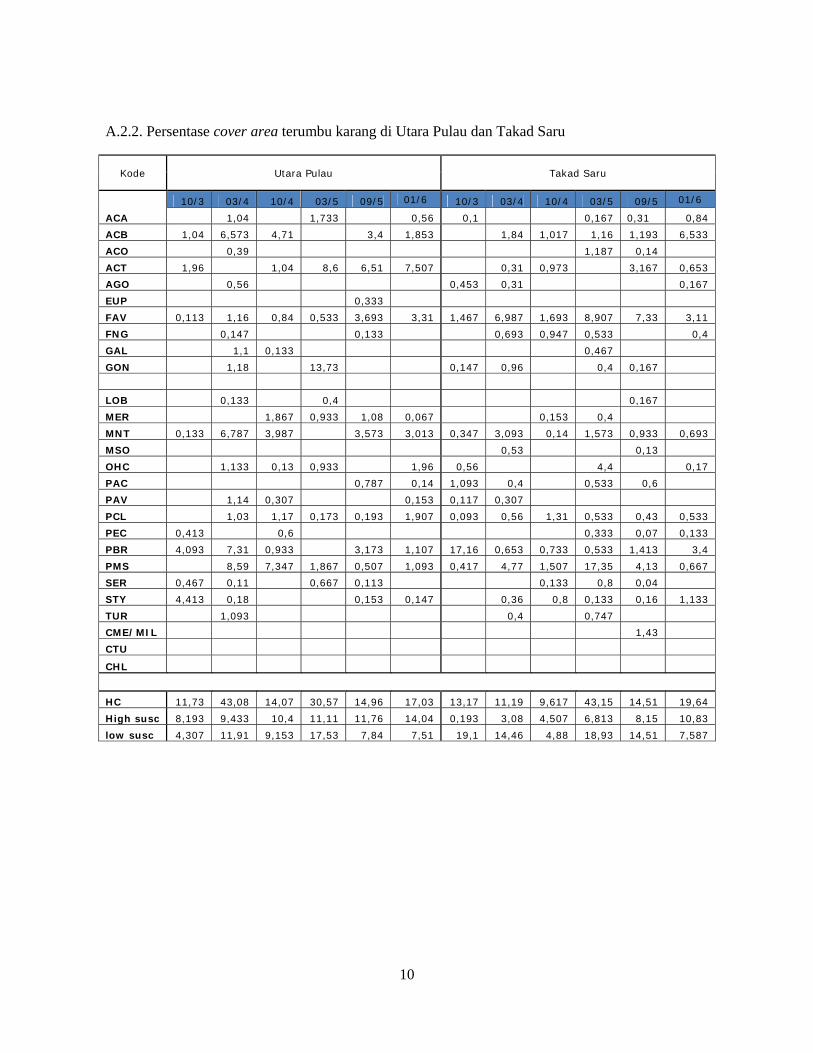
A.2.2. Persentase cover area terumbu karang di Utara Pulau dan Takad Saru
Kode Utara Pulau Takad Saru
10/3 03/4 10/4 03/5 09/5 01/6 10/3 03/4 10/4 03/5 09/5 01/6
ACA 1,04 1,733 0,56 0,1 0,167 0,31 0,84
ACB 1,04 6,573 4,71 3,4 1,853 1,84 1,017 1,16 1,193 6,533
ACO 0,39 1,187 0,14
ACT 1,96 1,04 8,6 6,51 7,507 0,31 0,973 3,167 0,653
AGO 0,56 0,453 0,31 0,167
EUP 0,333
FAV 0,113 1,16 0,84 0,533 3,693 3,31 1,467 6,987 1,693 8,907 7,33 3,11
FNG 0,147 0,133 0,693 0,947 0,533 0,4
GAL 1,1 0,133 0,467
GON 1,18 13,73 0,147 0,96 0,4 0,167
LOB 0,133 0,4 0,167
MER 1,867 0,933 1,08 0,067 0,153 0,4
MNT 0,133 6,787 3,987 3,573 3,013 0,347 3,093 0,14 1,573 0,933 0,693
MSO 0,53 0,13
OHC 1,133 0,13 0,933 1,96 0,56 4,4 0,17
PAC 0,787 0,14 1,093 0,4 0,533 0,6
PAV 1,14 0,307 0,153 0,117 0,307
PCL 1,03 1,17 0,173 0,193 1,907 0,093 0,56 1,31 0,533 0,43 0,533
PEC 0,413 0,6 0,333 0,07 0,133
PBR 4,093 7,31 0,933 3,173 1,107 17,16 0,653 0,733 0,533 1,413 3,4
PMS 8,59 7,347 1,867 0,507 1,093 0,417 4,77 1,507 17,35 4,13 0,667
SER 0,467 0,11 0,667 0,113 0,133 0,8 0,04
STY 4,413 0,18 0,153 0,147 0,36 0,8 0,133 0,16 1,133
TUR 1,093 0,4 0,747
CME/MIL 1,43
CTU
CHL
HC 11,73 43,08 14,07 30,57 14,96 17,03 13,17 11,19 9,617 43,15 14,51 19,64
High susc 8,193 9,433 10,4 11,11 11,76 14,04 0,193 3,08 4,507 6,813 8,15 10,83
low susc 4,307 11,91 9,153 17,53 7,84 7,51 19,1 14,46 4,88 18,93 14,51 7,587
11
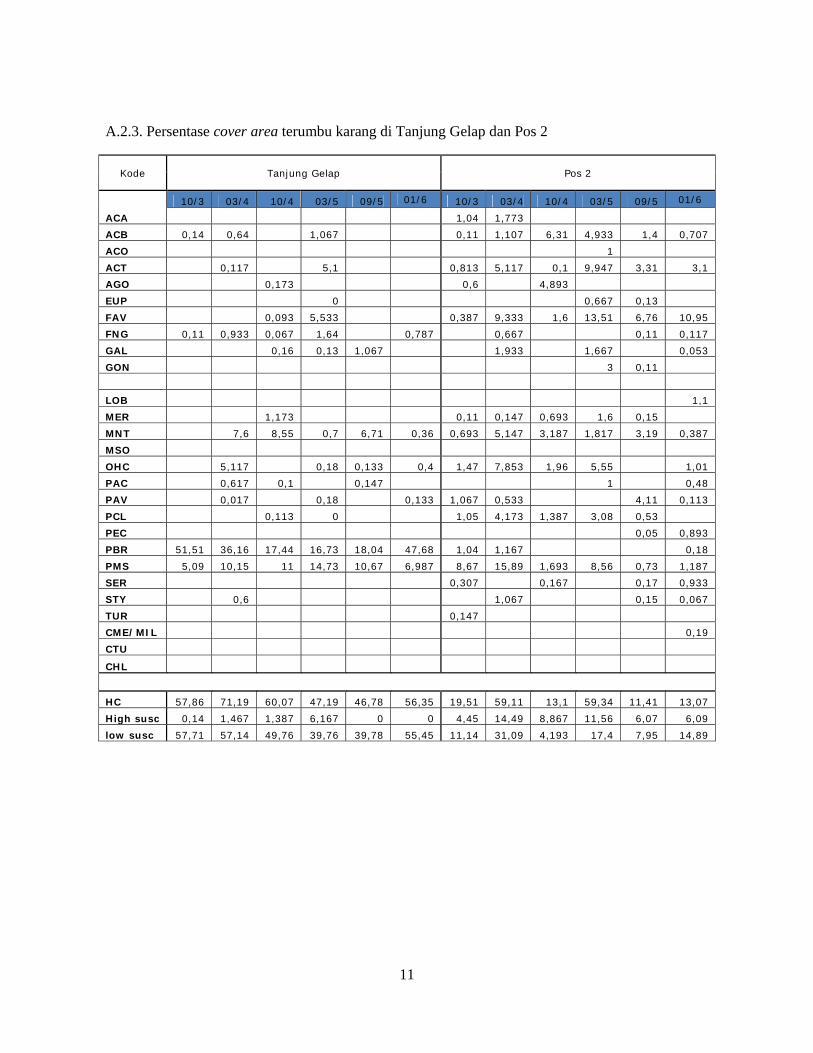
A.2.3. Persentase cover area terumbu karang di Tanjung Gelap dan Pos 2
Kode Tanjung Gelap Pos 2
10/3 03/4 10/4 03/5 09/5 01/6 10/3 03/4 10/4 03/5 09/5 01/6
ACA 1,04 1,773
ACB 0,14 0,64 1,067 0,11 1,107 6,31 4,933 1,4 0,707
ACO 1
ACT 0,117 5,1 0,813 5,117 0,1 9,947 3,31 3,1
AGO 0,173 0,6 4,893
EUP 0 0,667 0,13
FAV 0,093 5,533 0,387 9,333 1,6 13,51 6,76 10,95
FNG 0,11 0,933 0,067 1,64 0,787 0,667 0,11 0,117
GAL 0,16 0,13 1,067 1,933 1,667 0,053
GON 3 0,11
LOB 1,1
MER 1,173 0,11 0,147 0,693 1,6 0,15
MNT 7,6 8,55 0,7 6,71 0,36 0,693 5,147 3,187 1,817 3,19 0,387
MSO
OHC 5,117 0,18 0,133 0,4 1,47 7,853 1,96 5,55 1,01
PAC 0,617 0,1 0,147 1 0,48
PAV 0,017 0,18 0,133 1,067 0,533 4,11 0,113
PCL 0,113 0 1,05 4,173 1,387 3,08 0,53
PEC 0,05 0,893
PBR 51,51 36,16 17,44 16,73 18,04 47,68 1,04 1,167 0,18
PMS 5,09 10,15 11 14,73 10,67 6,987 8,67 15,89 1,693 8,56 0,73 1,187
SER 0,307 0,167 0,17 0,933
STY 0,6 1,067 0,15 0,067
TUR 0,147
CME/MIL 0,19
CTU
CHL
HC 57,86 71,19 60,07 47,19 46,78 56,35 19,51 59,11 13,1 59,34 11,41 13,07
High susc 0,14 1,467 1,387 6,167 0 0 4,45 14,49 8,867 11,56 6,07 6,09
low susc 57,71 57,14 49,76 39,76 39,78 55,45 11,14 31,09 4,193 17,4 7,95 14,89
12
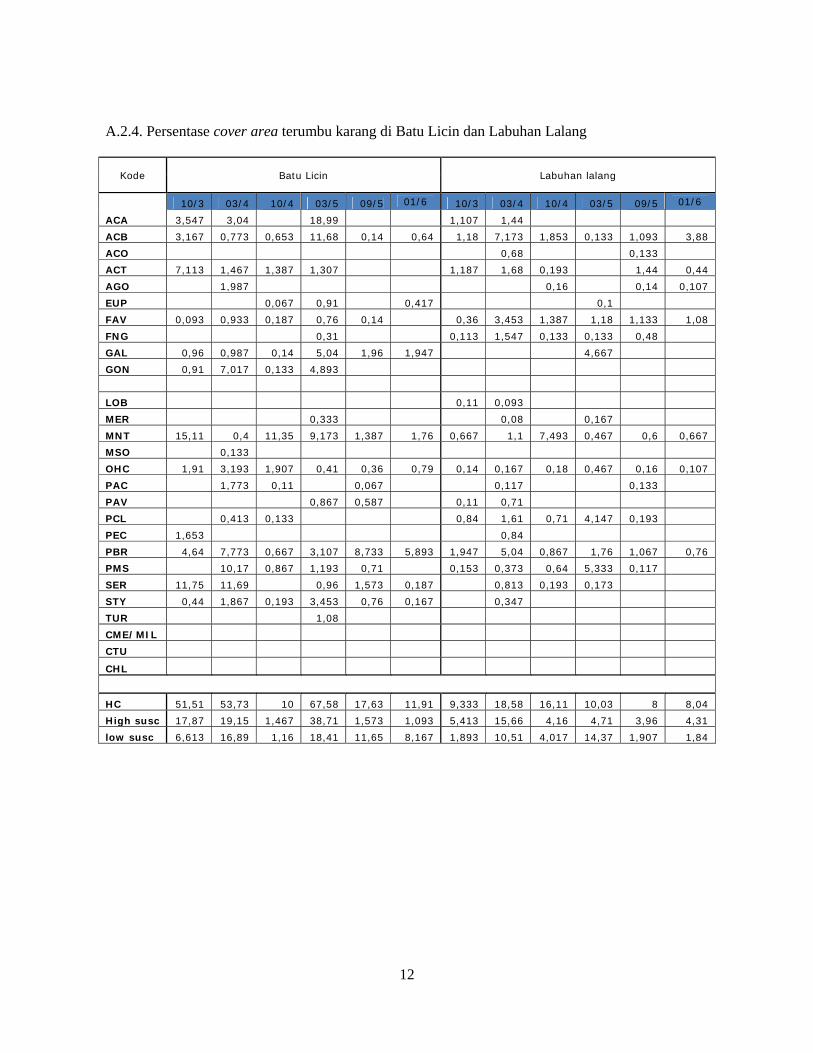
A.2.4. Persentase cover area terumbu karang di Batu Licin dan Labuhan Lalang
Kode Batu Licin Labuhan lalang
10/3 03/4 10/4 03/5 09/5 01/6 10/3 03/4 10/4 03/5 09/5 01/6
ACA 3,547 3,04 18,99 1,107 1,44
ACB 3,167 0,773 0,653 11,68 0,14 0,64 1,18 7,173 1,853 0,133 1,093 3,88
ACO 0,68 0,133
ACT 7,113 1,467 1,387 1,307 1,187 1,68 0,193 1,44 0,44
AGO 1,987 0,16 0,14 0,107
EUP 0,067 0,91 0,417 0,1
FAV 0,093 0,933 0,187 0,76 0,14 0,36 3,453 1,387 1,18 1,133 1,08
FNG 0,31 0,113 1,547 0,133 0,133 0,48
GAL 0,96 0,987 0,14 5,04 1,96 1,947 4,667
GON 0,91 7,017 0,133 4,893
LOB 0,11 0,093
MER 0,333 0,08 0,167
MNT 15,11 0,4 11,35 9,173 1,387 1,76 0,667 1,1 7,493 0,467 0,6 0,667
MSO 0,133
OHC 1,91 3,193 1,907 0,41 0,36 0,79 0,14 0,167 0,18 0,467 0,16 0,107
PAC 1,773 0,11 0,067 0,117 0,133
PAV 0,867 0,587 0,11 0,71
PCL 0,413 0,133 0,84 1,61 0,71 4,147 0,193
PEC 1,653 0,84
PBR 4,64 7,773 0,667 3,107 8,733 5,893 1,947 5,04 0,867 1,76 1,067 0,76
PMS 10,17 0,867 1,193 0,71 0,153 0,373 0,64 5,333 0,117
SER 11,75 11,69 0,96 1,573 0,187 0,813 0,193 0,173
STY 0,44 1,867 0,193 3,453 0,76 0,167 0,347
TUR 1,08
CME/MIL
CTU
CHL
HC 51,51 53,73 10 67,58 17,63 11,91 9,333 18,58 16,11 10,03 8 8,04
High susc 17,87 19,15 1,467 38,71 1,573 1,093 5,413 15,66 4,16 4,71 3,96 4,31
low susc 6,613 16,89 1,16 18,41 11,65 8,167 1,893 10,51 4,017 14,37 1,907 1,84
13
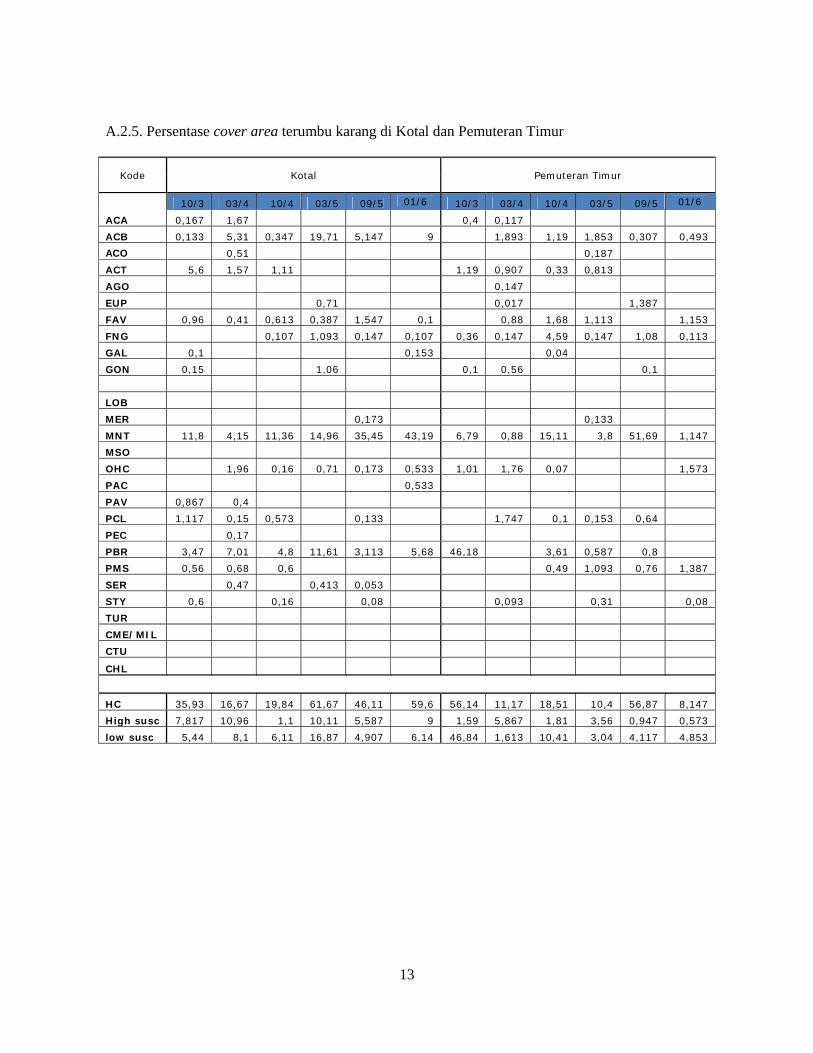
A.2.5. Persentase cover area terumbu karang di Kotal dan Pemuteran Timur
Kode Kotal Pemuteran Timur
10/3 03/4 10/4 03/5 09/5 01/6 10/3 03/4 10/4 03/5 09/5 01/6
ACA 0,167 1,67 0,4 0,117
ACB 0,133 5,31 0,347 19,71 5,147 9 1,893 1,19 1,853 0,307 0,493
ACO 0,51 0,187
ACT 5,6 1,57 1,11 1,19 0,907 0,33 0,813
AGO 0,147
EUP 0,71 0,017 1,387
FAV 0,96 0,41 0,613 0,387 1,547 0,1 0,88 1,68 1,113 1,153
FNG 0,107 1,093 0,147 0,107 0,36 0,147 4,59 0,147 1,08 0,113
GAL 0,1 0,153 0,04
GON 0,15 1,06 0,1 0,56 0,1
LOB
MER 0,173 0,133
MNT 11,8 4,15 11,36 14,96 35,45 43,19 6,79 0,88 15,11 3,8 51,69 1,147
MSO
OHC 1,96 0,16 0,71 0,173 0,533 1,01 1,76 0,07 1,573
PAC 0,533
PAV 0,867 0,4
PCL 1,117 0,15 0,573 0,133 1,747 0,1 0,153 0,64
PEC 0,17
PBR 3,47 7,01 4,8 11,61 3,113 5,68 46,18 3,61 0,587 0,8
PMS 0,56 0,68 0,6 0,49 1,093 0,76 1,387
SER 0,47 0,413 0,053
STY 0,6 0,16 0,08 0,093 0,31 0,08
TUR
CME/MIL
CTU
CHL
HC 35,93 16,67 19,84 61,67 46,11 59,6 56,14 11,17 18,51 10,4 56,87 8,147
High susc 7,817 10,96 1,1 10,11 5,587 9 1,59 5,867 1,81 3,56 0,947 0,573
low susc 5,44 8,1 6,11 16,87 4,907 6,14 46,84 1,613 10,41 3,04 4,117 4,853
14
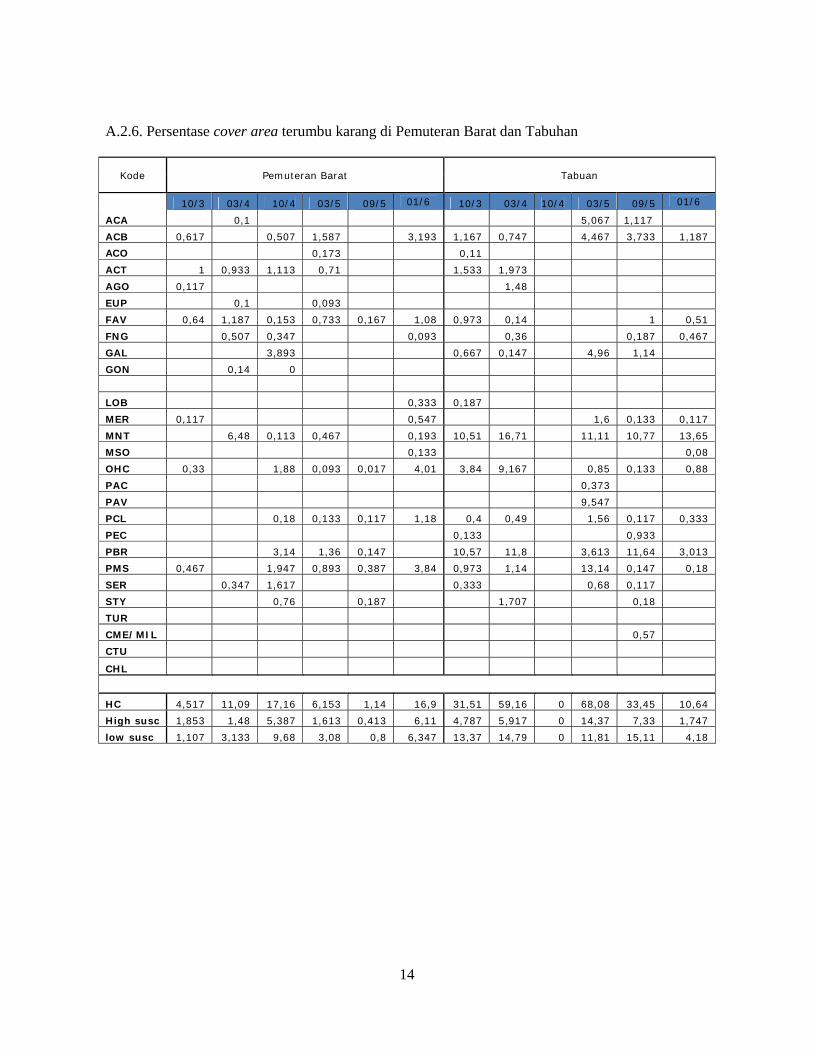
A.2.6. Persentase cover area terumbu karang di Pemuteran Barat dan Tabuhan
Kode Pemuteran Barat Tabuan
10/3 03/4 10/4 03/5 09/5 01/6 10/3 03/4 10/4 03/5 09/5 01/6
ACA 0,1 5,067 1,117
ACB 0,617 0,507 1,587 3,193 1,167 0,747 4,467 3,733 1,187
ACO 0,173 0,11
ACT 1 0,933 1,113 0,71 1,533 1,973
AGO 0,117 1,48
EUP 0,1 0,093
FAV 0,64 1,187 0,153 0,733 0,167 1,08 0,973 0,14 1 0,51
FNG 0,507 0,347 0,093 0,36 0,187 0,467
GAL 3,893 0,667 0,147 4,96 1,14
GON 0,14 0
LOB 0,333 0,187
MER 0,117 0,547 1,6 0,133 0,117
MNT 6,48 0,113 0,467 0,193 10,51 16,71 11,11 10,77 13,65
MSO 0,133 0,08
OHC 0,33 1,88 0,093 0,017 4,01 3,84 9,167 0,85 0,133 0,88
PAC 0,373
PAV 9,547
PCL 0,18 0,133 0,117 1,18 0,4 0,49 1,56 0,117 0,333
PEC 0,133 0,933
PBR 3,14 1,36 0,147 10,57 11,8 3,613 11,64 3,013
PMS 0,467 1,947 0,893 0,387 3,84 0,973 1,14 13,14 0,147 0,18
SER 0,347 1,617 0,333 0,68 0,117
STY 0,76 0,187 1,707 0,18
TUR
CME/MIL 0,57
CTU
CHL
HC 4,517 11,09 17,16 6,153 1,14 16,9 31,51 59,16 0 68,08 33,45 10,64
High susc 1,853 1,48 5,387 1,613 0,413 6,11 4,787 5,917 0 14,37 7,33 1,747
low susc 1,107 3,133 9,68 3,08 0,8 6,347 13,37 14,79 0 11,81 15,11 4,18
15
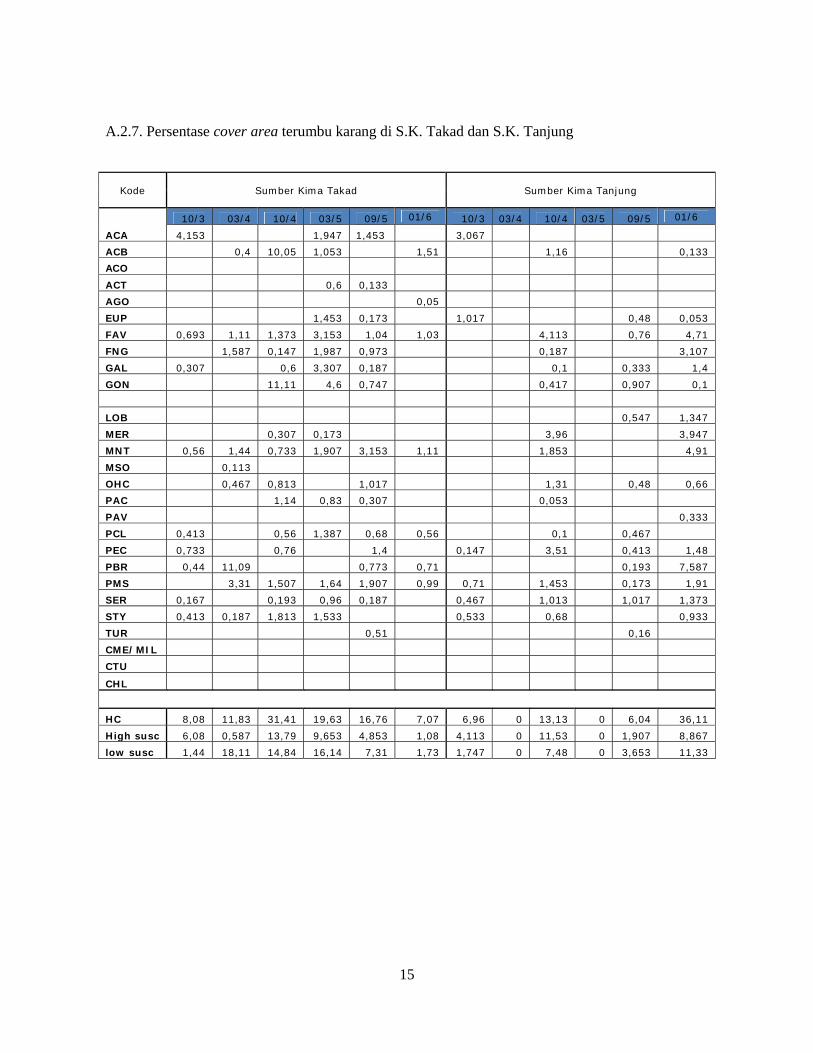
A.2.7. Persentase cover area terumbu karang di S.K. Takad dan S.K. Tanjung
Kode Sumber Kima Takad Sumber Kima Tanjung
10/3 03/4 10/4 03/5 09/5 01/6 10/3 03/4 10/4 03/5 09/5 01/6
ACA 4,153 1,947 1,453 3,067
ACB 0,4 10,05 1,053 1,51 1,16 0,133
ACO
ACT 0,6 0,133
AGO 0,05
EUP 1,453 0,173 1,017 0,48 0,053
FAV 0,693 1,11 1,373 3,153 1,04 1,03 4,113 0,76 4,71
FNG 1,587 0,147 1,987 0,973 0,187 3,107
GAL 0,307 0,6 3,307 0,187 0,1 0,333 1,4
GON 11,11 4,6 0,747 0,417 0,907 0,1
LOB 0,547 1,347
MER 0,307 0,173 3,96 3,947
MNT 0,56 1,44 0,733 1,907 3,153 1,11 1,853 4,91
MSO 0,113
OHC 0,467 0,813 1,017 1,31 0,48 0,66
PAC 1,14 0,83 0,307 0,053
PAV 0,333
PCL 0,413 0,56 1,387 0,68 0,56 0,1 0,467
PEC 0,733 0,76 1,4 0,147 3,51 0,413 1,48
PBR 0,44 11,09 0,773 0,71 0,193 7,587
PMS 3,31 1,507 1,64 1,907 0,99 0,71 1,453 0,173 1,91
SER 0,167 0,193 0,96 0,187 0,467 1,013 1,017 1,373
STY 0,413 0,187 1,813 1,533 0,533 0,68 0,933
TUR 0,51 0,16
CME/MIL
CTU
CHL
HC 8,08 11,83 31,41 19,63 16,76 7,07 6,96 0 13,13 0 6,04 36,11
High susc 6,08 0,587 13,79 9,653 4,853 1,08 4,113 0 11,53 0 1,907 8,867
low susc 1,44 18,11 14,84 16,14 7,31 1,73 1,747 0 7,48 0 3,653 11,33
16
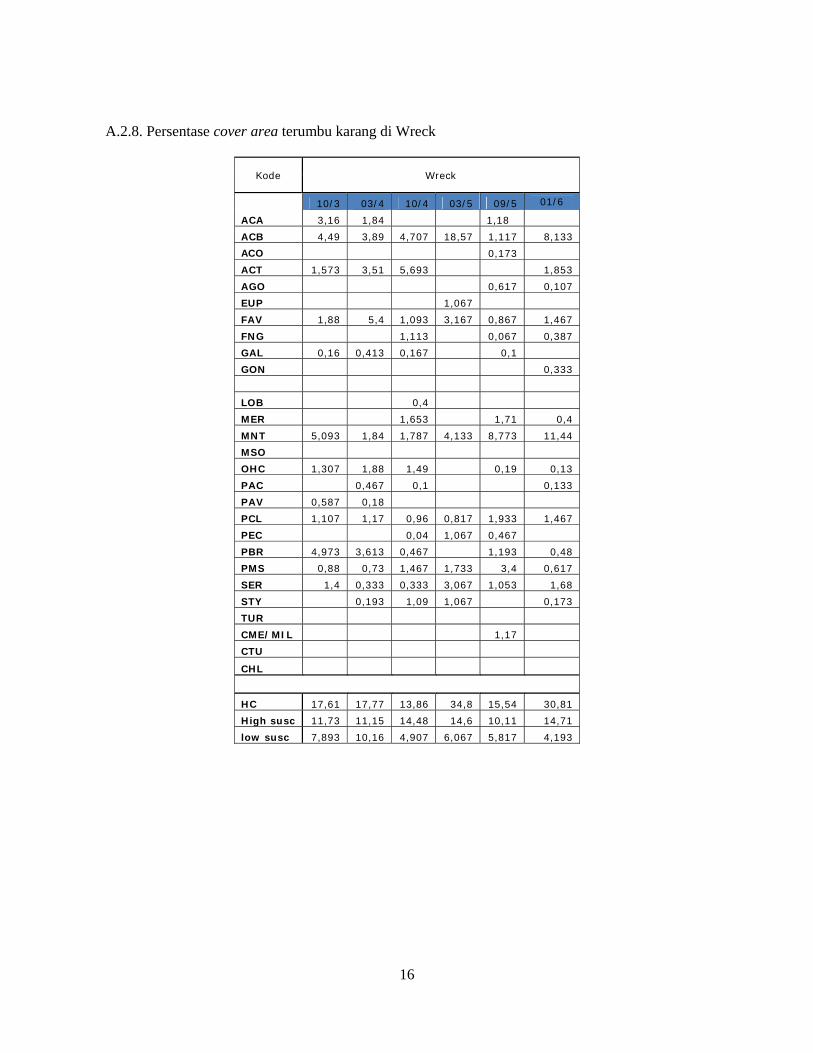
A.2.8. Persentase cover area terumbu karang di Wreck
Kode Wreck
10/3 03/4 10/4 03/5 09/5 01/6
ACA 3,16 1,84 1,18
ACB 4,49 3,89 4,707 18,57 1,117 8,133
ACO 0,173
ACT 1,573 3,51 5,693 1,853
AGO 0,617 0,107
EUP 1,067
FAV 1,88 5,4 1,093 3,167 0,867 1,467
FNG 1,113 0,067 0,387
GAL 0,16 0,413 0,167 0,1
GON 0,333
LOB 0,4
MER 1,653 1,71 0,4
MNT 5,093 1,84 1,787 4,133 8,773 11,44
MSO
OHC 1,307 1,88 1,49 0,19 0,13
PAC 0,467 0,1 0,133
PAV 0,587 0,18
PCL 1,107 1,17 0,96 0,817 1,933 1,467
PEC 0,04 1,067 0,467
PBR 4,973 3,613 0,467 1,193 0,48
PMS 0,88 0,73 1,467 1,733 3,4 0,617
SER 1,4 0,333 0,333 3,067 1,053 1,68
STY 0,193 1,09 1,067 0,173
TUR
CME/MIL 1,17
CTU
CHL
HC 17,61 17,77 13,86 34,8 15,54 30,81
High susc 11,73 11,15 14,48 14,6 10,11 14,71
low susc 7,893 10,16 4,907 6,067 5,817 4,193
17
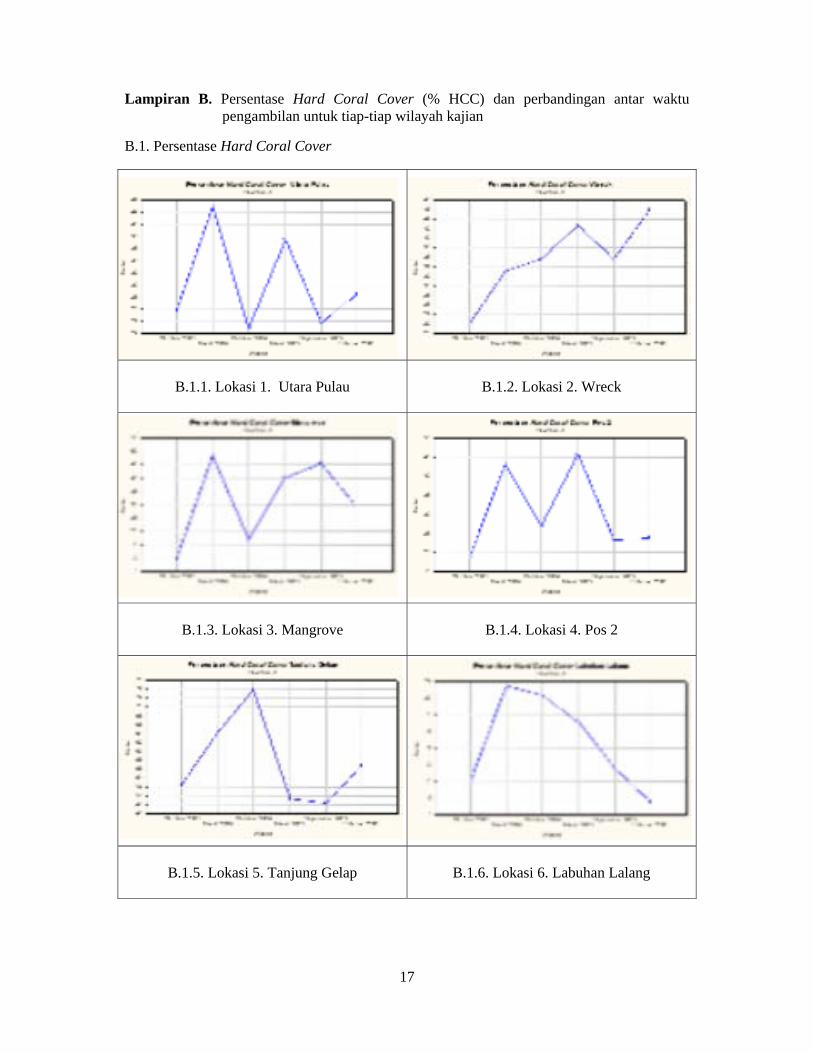
Lampiran B. Persentase Hard Coral Cover (% HCC) dan perbandingan antar waktu pengambilan untuk tiap-tiap wilayah kajian
B.1. Persentase Hard Coral Cover
B.1.1. Lokasi 1. Utara Pulau
B.1.2. Lokasi 2. Wreck
B.1.3. Lokasi 3. Mangrove
B.1.4. Lokasi 4. Pos 2
B.1.5. Lokasi 5. Tanjung Gelap
B.1.6. Lokasi 6. Labuhan Lalang
18
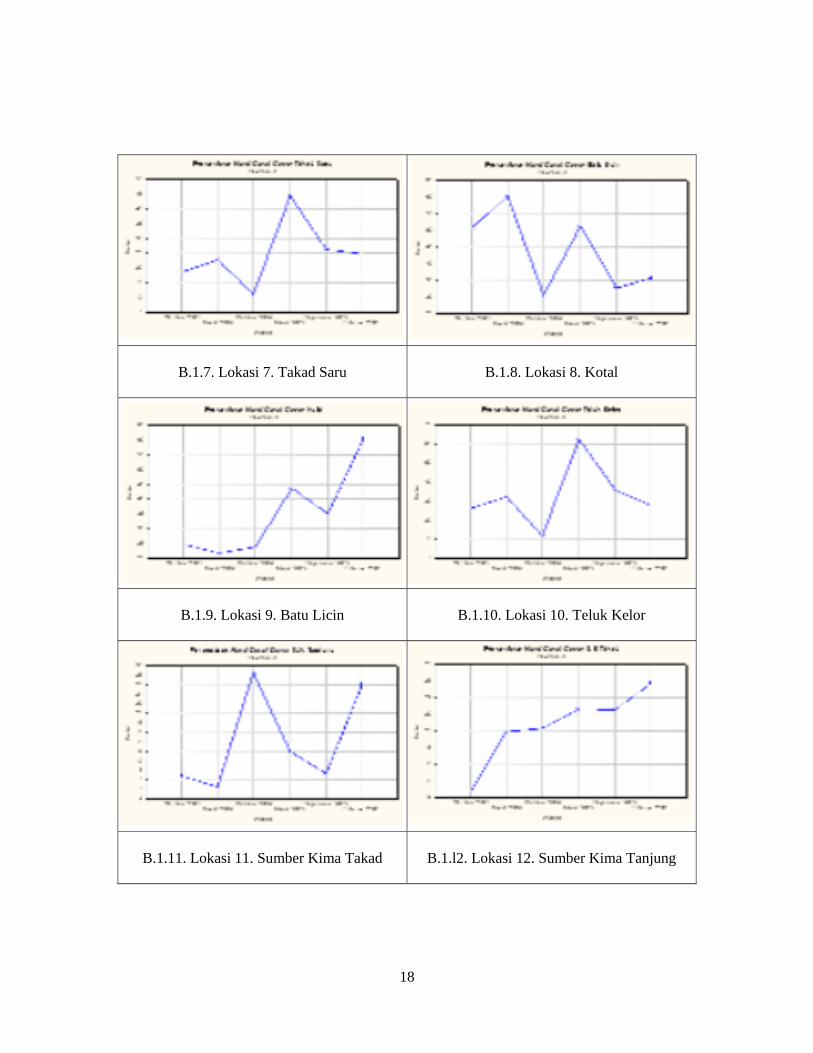
B.1.7. Lokasi 7. Takad Saru
B.1.8. Lokasi 8. Kotal
B.1.9. Lokasi 9. Batu Licin
B.1.10. Lokasi 10. Teluk Kelor
B.1.11. Lokasi 11. Sumber Kima Takad
B.1.l2. Lokasi 12. Sumber Kima Tanjung
19
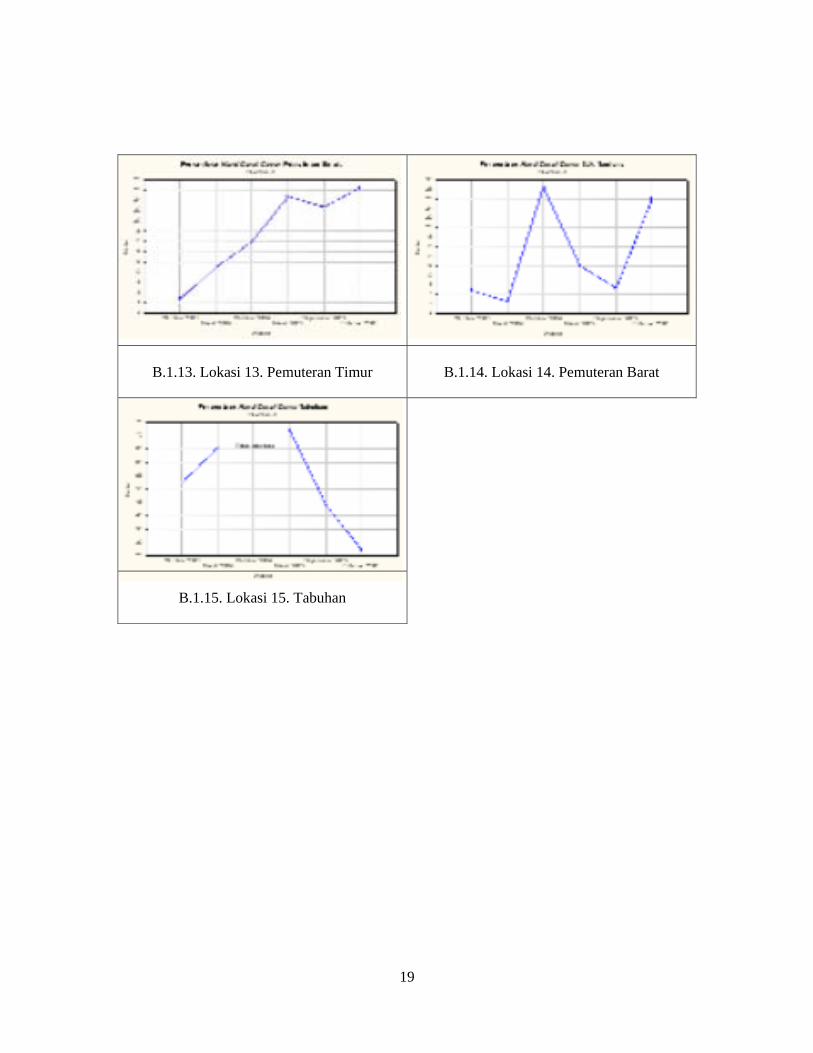
B.1.13. Lokasi 13. Pemuteran Timur
B.1.14. Lokasi 14. Pemuteran Barat
B.1.15. Lokasi 15. Tabuhan
20
Perbandingan pengambilan I&II
0
10
20
30
40
50
60
70
Utara P
ulau
Wre
ck
Mangrov
e
Pos 2
Tanj. G
elap
Lab.
Lalang
Taka
d Saru
Kotal
Batu Li
cin
Teluk
Kelo
r
S.K. T
akad
S.K. T
anjun
g
Pem. T
imur
Pem. B
arat
Tabu
han
Lokasi
Pers
enta
se
Okt03 Mart04
Perbandiang pengambilan II&III
0
10
20
30
40
50
60
70
80
Utara P
ulau
Wreck
Man
grov
e
Pos 2
Tanj.
Gela
p
Lab.
Lalan
g
Taka
d Sa
ru
Kotal
Batu Licin
Teluk
Kelo
r
S.K.
Tak
ad
S.K.
Tan
jung
Pem. T
imur
Pem. B
arat
Tabu
han
Lokasi
Pers
enta
se
Mart04 Okt04
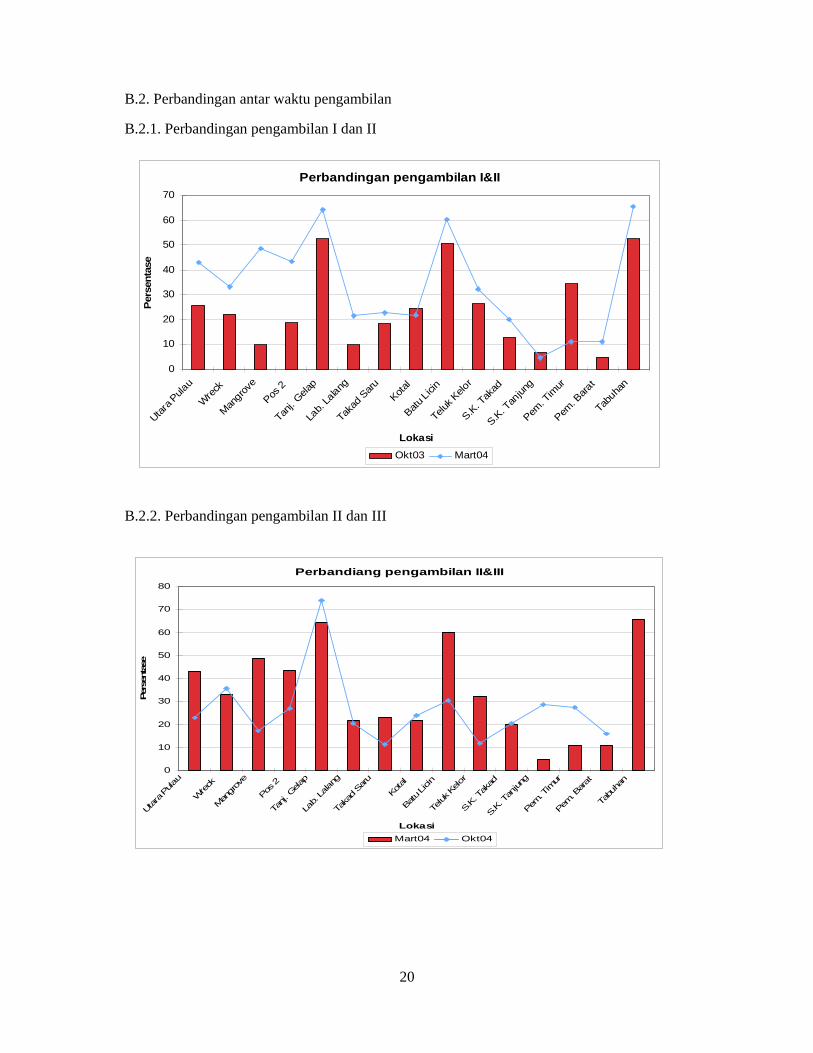
B.2. Perbandingan antar waktu pengambilan
B.2.1. Perbandingan pengambilan I dan II
B.2.2. Perbandingan pengambilan II dan III
21
Perbandingan pengambilan III&IV
0
10
20
30
40
50
60
70
80
Utara P
ulau
Wre
ck
Mangrov
e
Pos 2
Tanj. G
elap
Lab.
Lalang
Takad
Saru
Kotal
Batu Li
cin
Teluk
Kelo
r
S.K. T
akad
S.K. T
anjun
g
Pem. T
imur
Pem. B
arat
Tabuh
an
Lokasi
Pers
enta
se
Okt04 Mart05
Perbandingan pengambilan IV&V
0
10
20
30
40
50
60
70
80
Utara P
ulau
Wre
ck
Mangr
ove
Pos 2
Tanj.
Gela
p
Lab.
Lalan
g
Taka
d Saru
Kotal
Batu Li
cin
Teluk
Kelo
r
S.K. T
akad
S.K. T
anjun
g
Pem. T
imur
Pem. B
arat
Tabu
han
Lokasi
Pers
enta
se
Mart05 Septm05
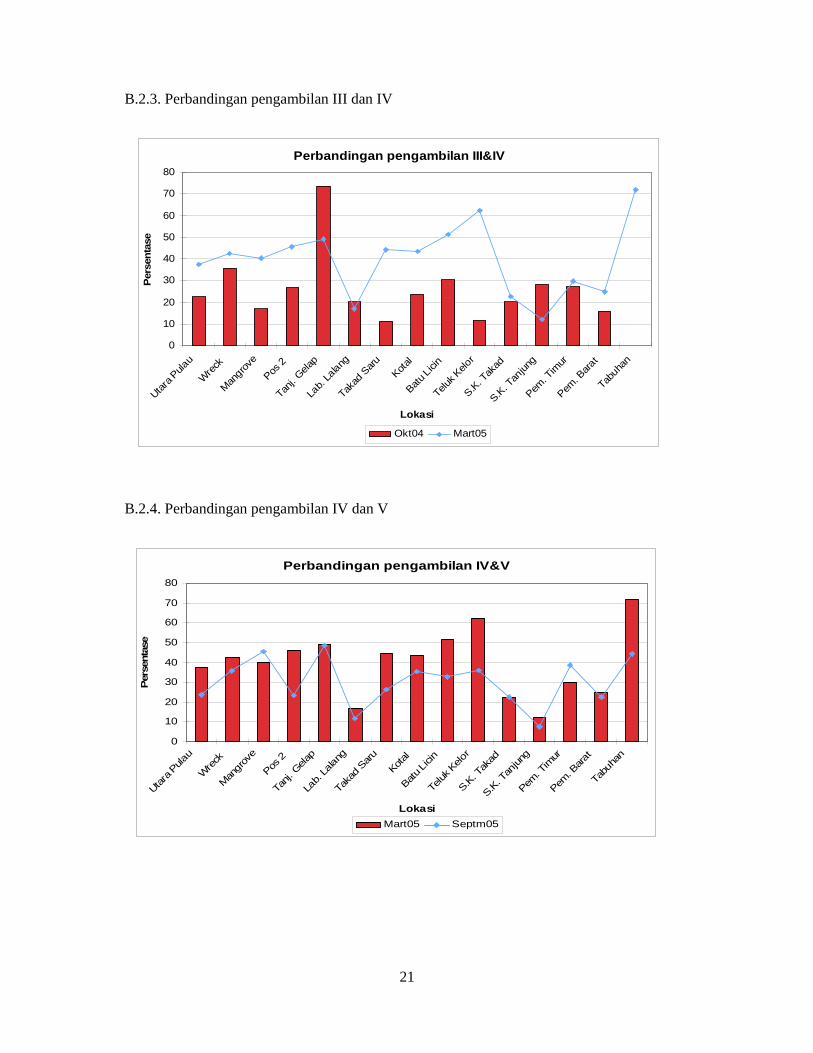
B.2.3. Perbandingan pengambilan III dan IV
B.2.4. Perbandingan pengambilan IV dan V
22
Perbandingan pengambilan V&VI
0
10
20
30
40
50
60
70
Utara P
ulau
Wreck
Man
grov
e
Pos 2
Tanj.
Gela
p
Lab.
Lalan
g
Taka
d Sa
ru
Kotal
Batu Licin
Teluk
Kelo
r
S.K.
Tak
ad
S.K.
Tan
jung
Pem. T
imur
Pem. B
arat
Tabu
han
Lokasi
Pers
enta
se
Septm05 Febu06
Perbandingan pengambilan I&VI
0
10
20
30
40
50
60
70
Utara P
ulau
Wreck
Man
grov
e
Pos 2
Tanj.
Gela
p
Lab.
Lalan
g
Taka
d Sa
ru
Kotal
Batu Licin
Teluk
Kelo
r
S.K.
Tak
ad
S.K.
Tan
jung
Pem. T
imur
Pem. B
arat
Tabu
han
Lokasi
Pers
enta
se
Okt03 Febu06
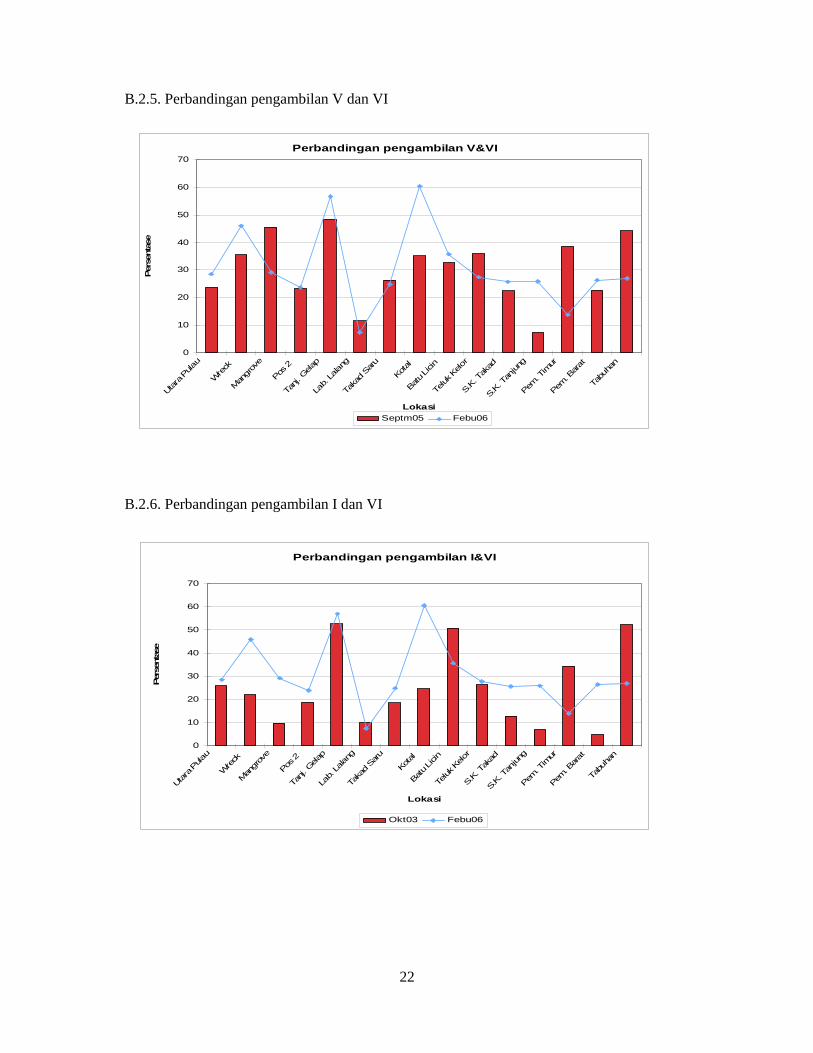
B.2.5. Perbandingan pengambilan V dan VI
B.2.6. Perbandingan pengambilan I dan VI
23
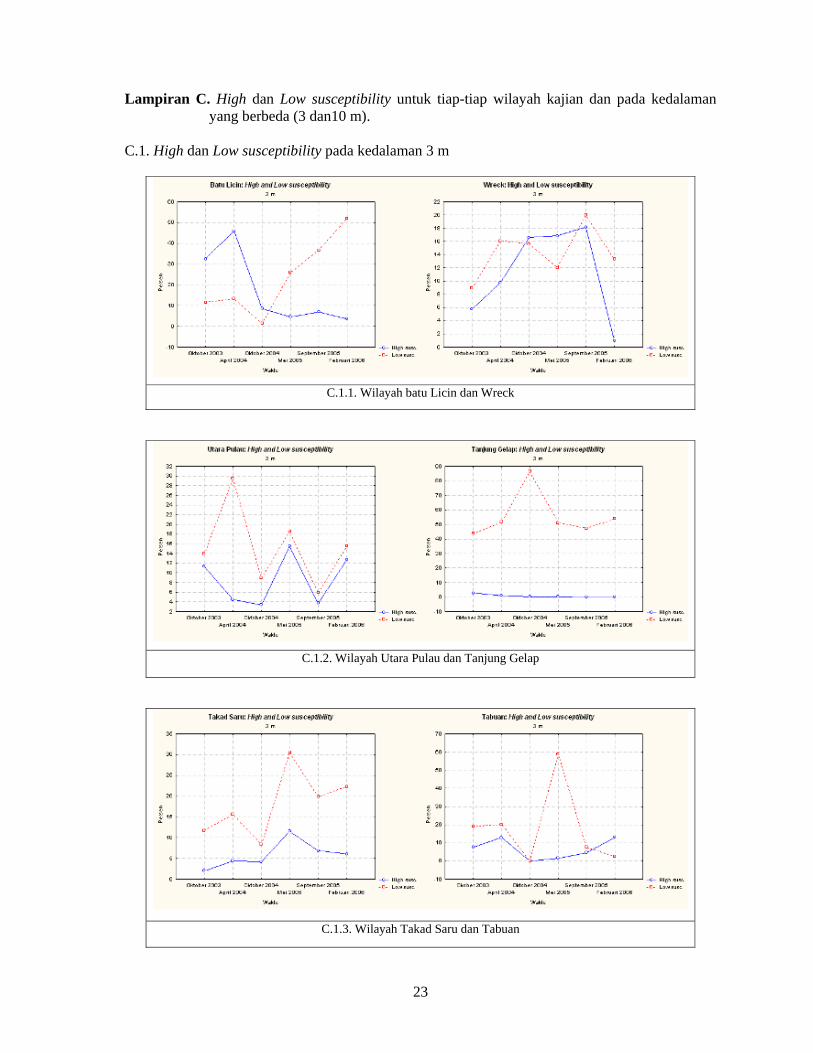
Lampiran C. High dan Low susceptibility untuk tiap-tiap wilayah kajian dan pada kedalaman yang berbeda (3 dan10 m).
C.1. High dan Low susceptibility pada kedalaman 3 m
C.1.1. Wilayah batu Licin dan Wreck
C.1.2. Wilayah Utara Pulau dan Tanjung Gelap
C.1.3. Wilayah Takad Saru dan Tabuan
24
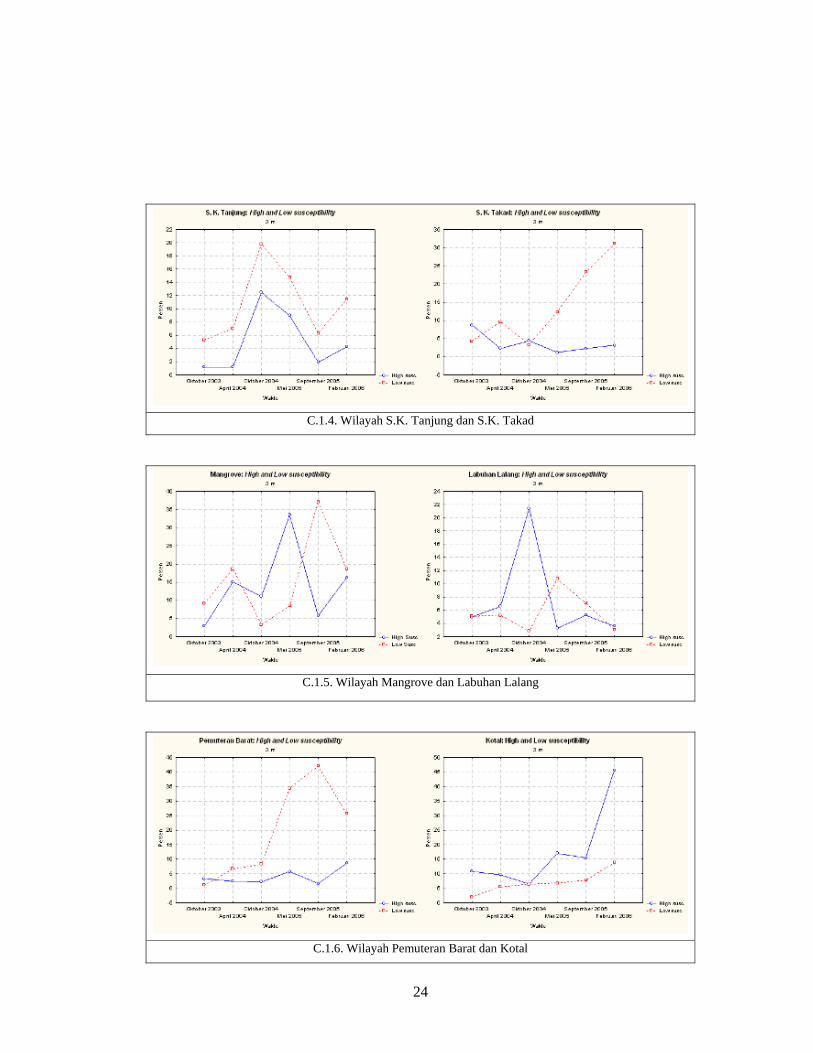
C.1.4. Wilayah S.K. Tanjung dan S.K. Takad
C.1.5. Wilayah Mangrove dan Labuhan Lalang
C.1.6. Wilayah Pemuteran Barat dan Kotal
25
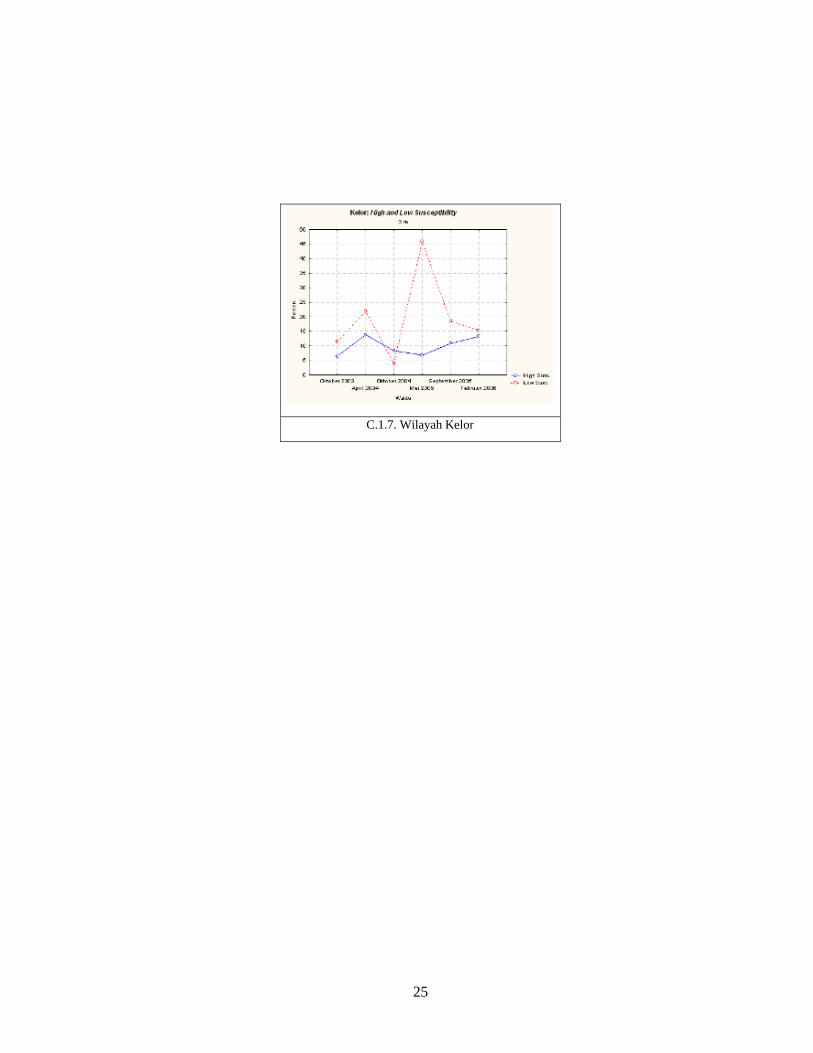
C.1.7. Wilayah Kelor
26
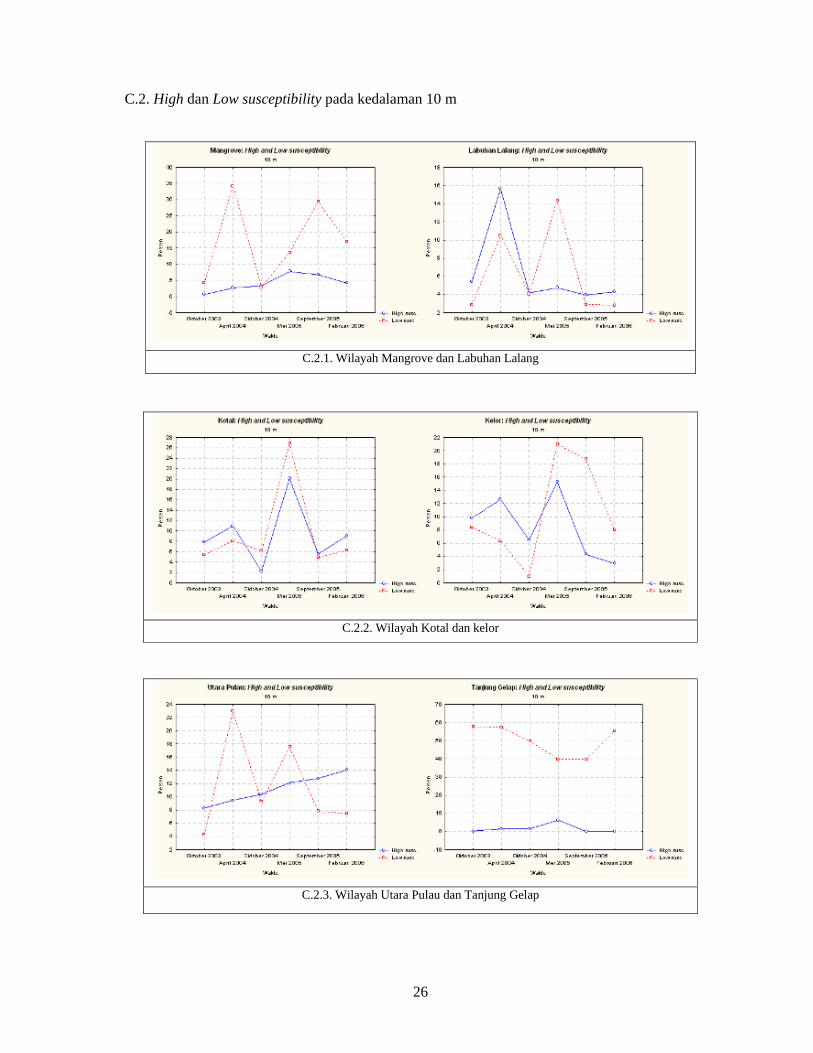
C.2. High dan Low susceptibility pada kedalaman 10 m
C.2.1. Wilayah Mangrove dan Labuhan Lalang
C.2.2. Wilayah Kotal dan kelor
C.2.3. Wilayah Utara Pulau dan Tanjung Gelap
27
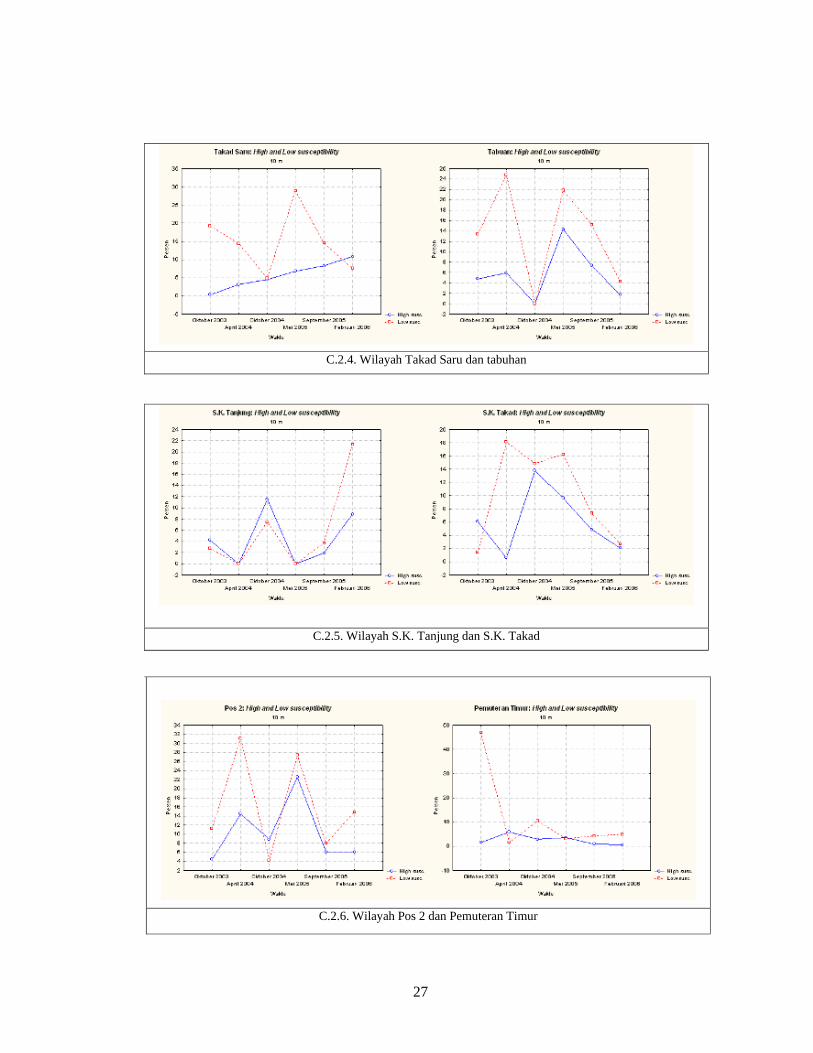
C.2.4. Wilayah Takad Saru dan tabuhan
C.2.5. Wilayah S.K. Tanjung dan S.K. Takad
C.2.6. Wilayah Pos 2 dan Pemuteran Timur
28
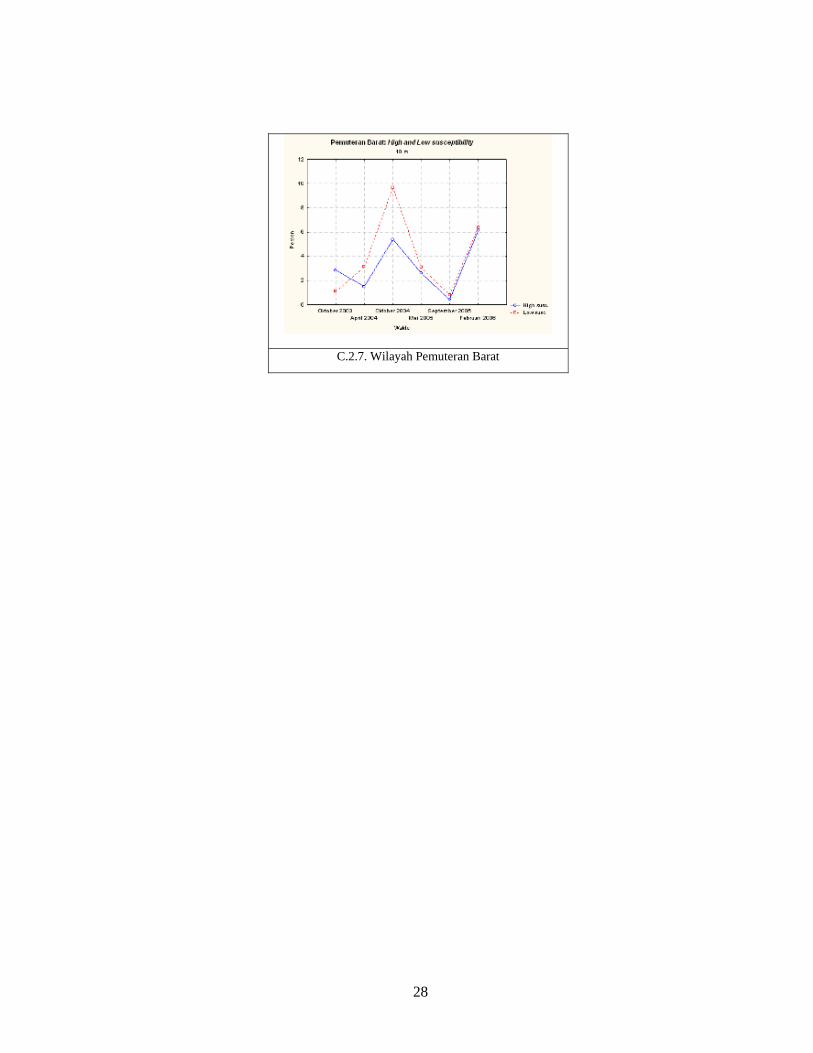
C.2.7. Wilayah Pemuteran Barat
29
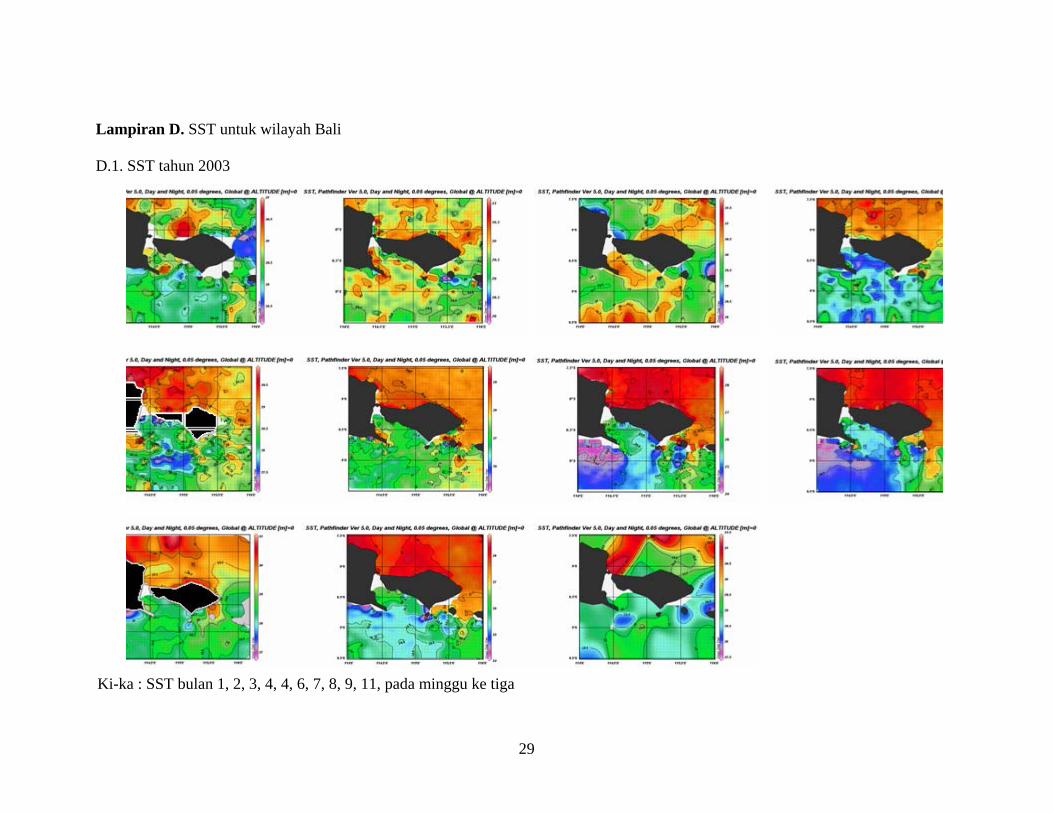
Lampiran D. SST untuk wilayah Bali D.1. SST tahun 2003
Ki-ka : SST bulan 1, 2, 3, 4, 4, 6, 7, 8, 9, 11, pada minggu ke tiga
30
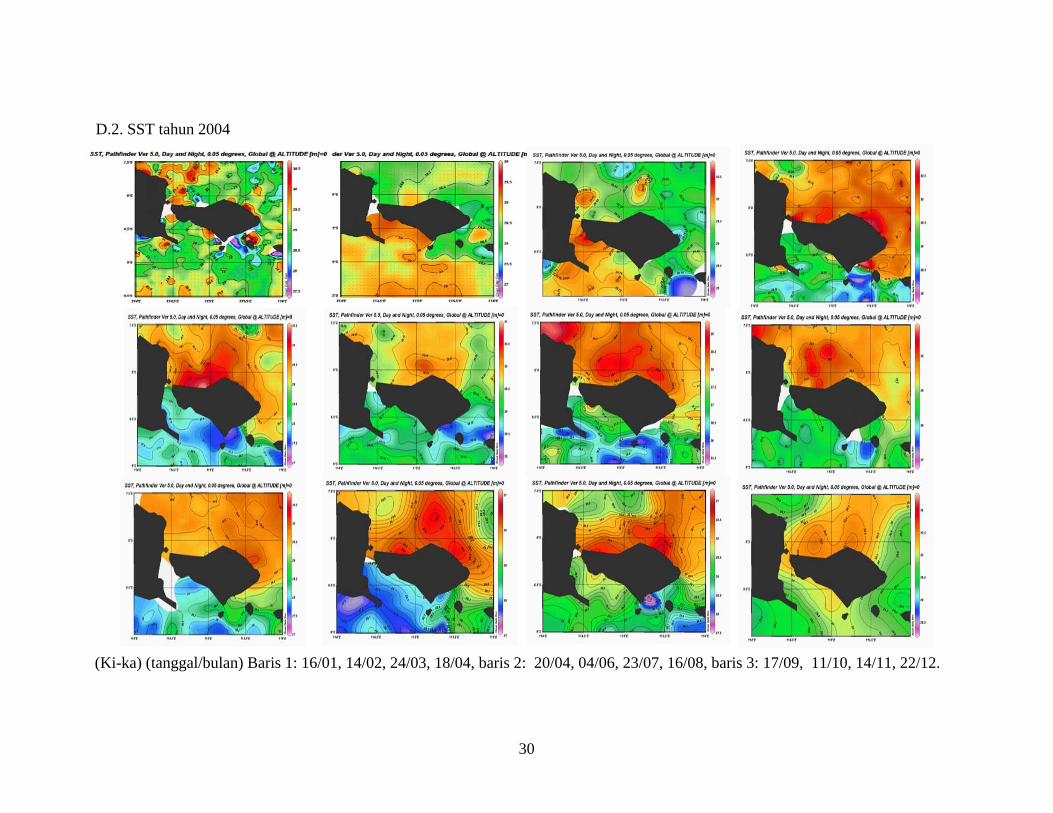
(Ki-ka) (tanggal/bulan) Baris 1: 16/01, 14/02, 24/03, 18/04, baris 2: 20/04, 04/06, 23/07, 16/08, baris 3: 17/09, 11/10, 14/11, 22/12.
D.2. SST tahun 2004
31
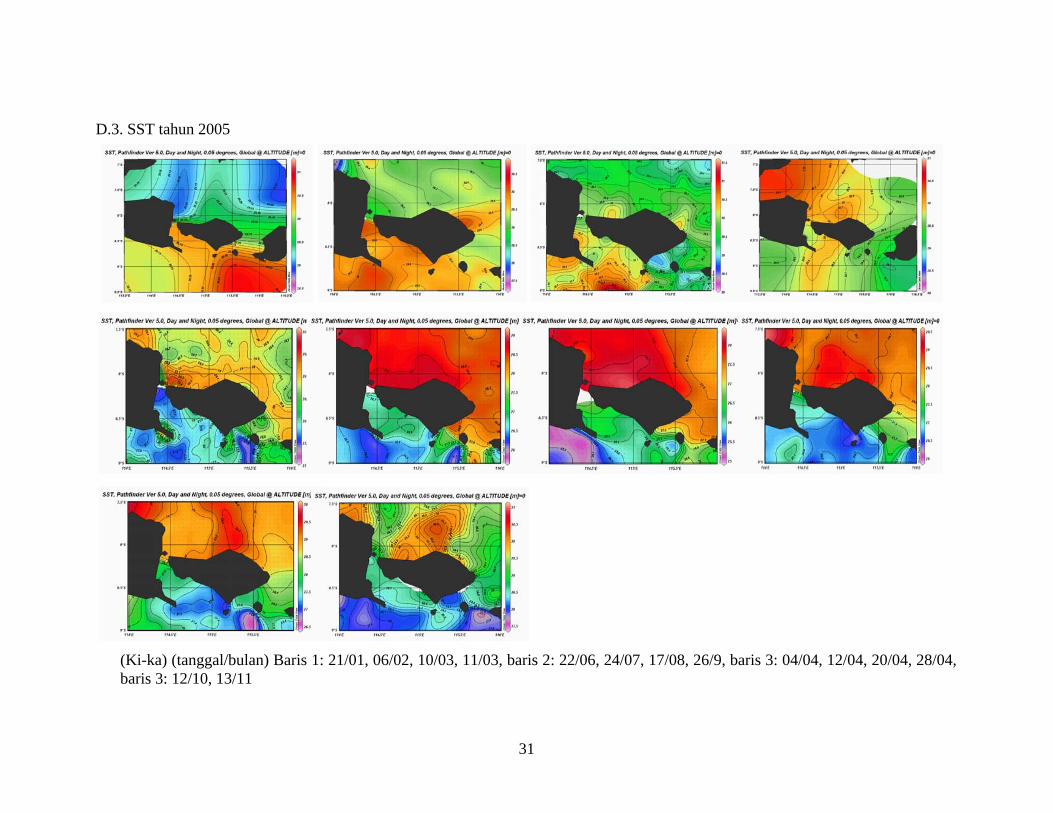
(Ki-ka) (tanggal/bulan) Baris 1: 21/01, 06/02, 10/03, 11/03, baris 2: 22/06, 24/07, 17/08, 26/9, baris 3: 04/04, 12/04, 20/04, 28/04, baris 3: 12/10, 13/11
D.3. SST tahun 2005
32
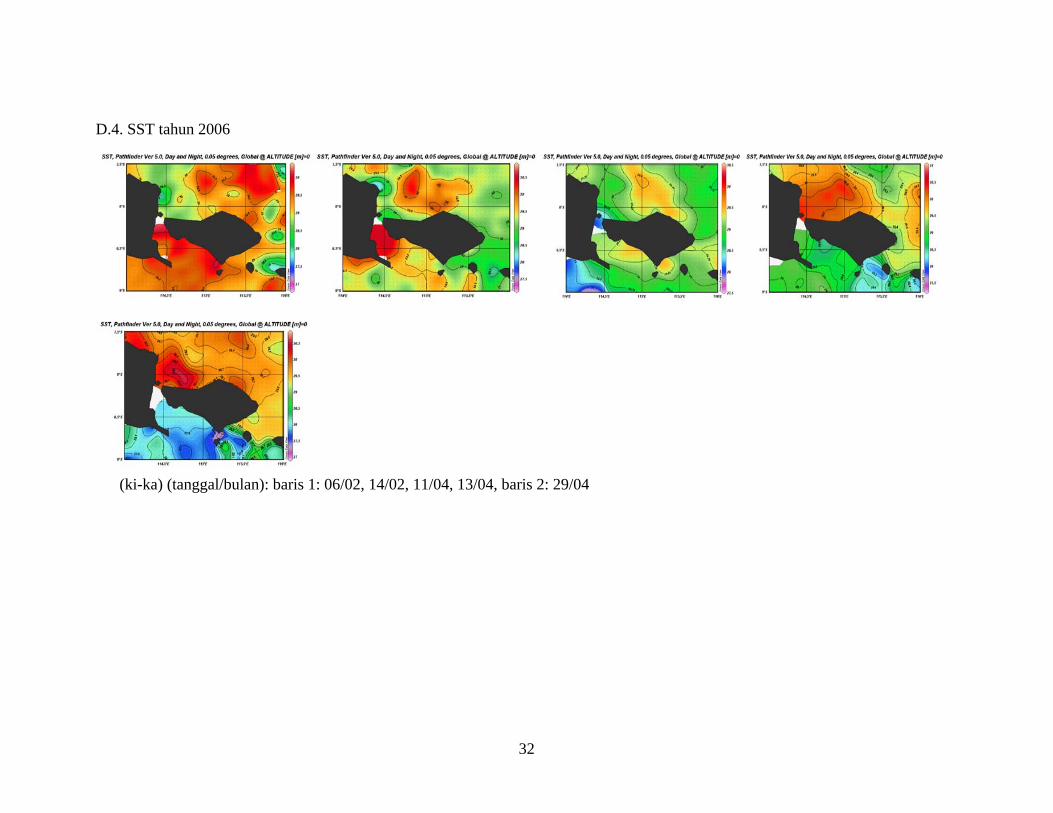
D.4. SST tahun 2006
(ki-ka) (tanggal/bulan): baris 1: 06/02, 14/02, 11/04, 13/04, baris 2: 29/04
33
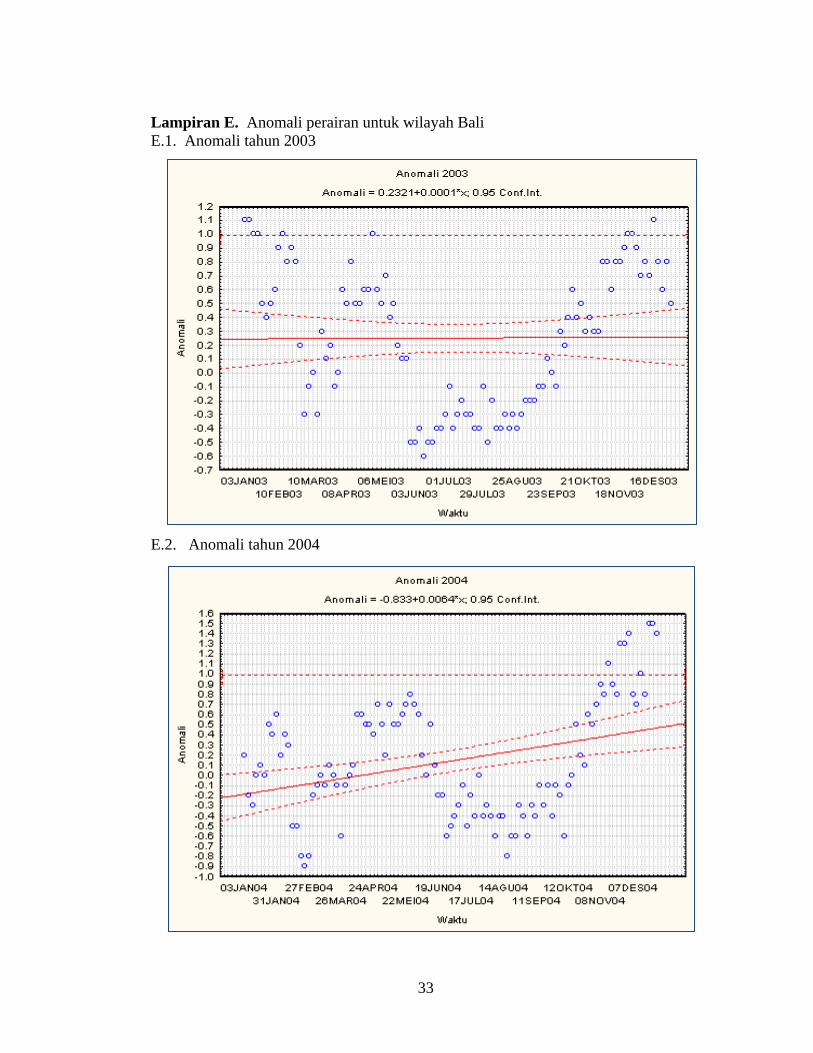
Lampiran E. Anomali perairan untuk wilayah Bali E.1. Anomali tahun 2003
E.2. Anomali tahun 2004
34
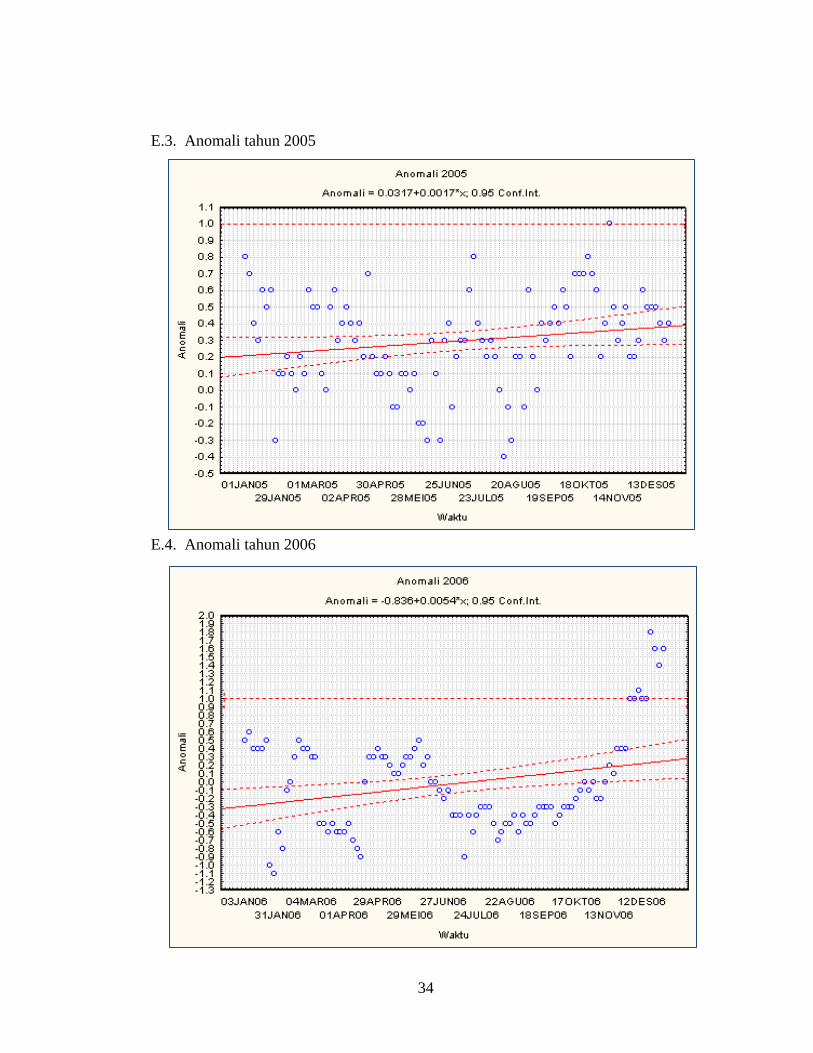
E.3. Anomali tahun 2005
E.4. Anomali tahun 2006
35
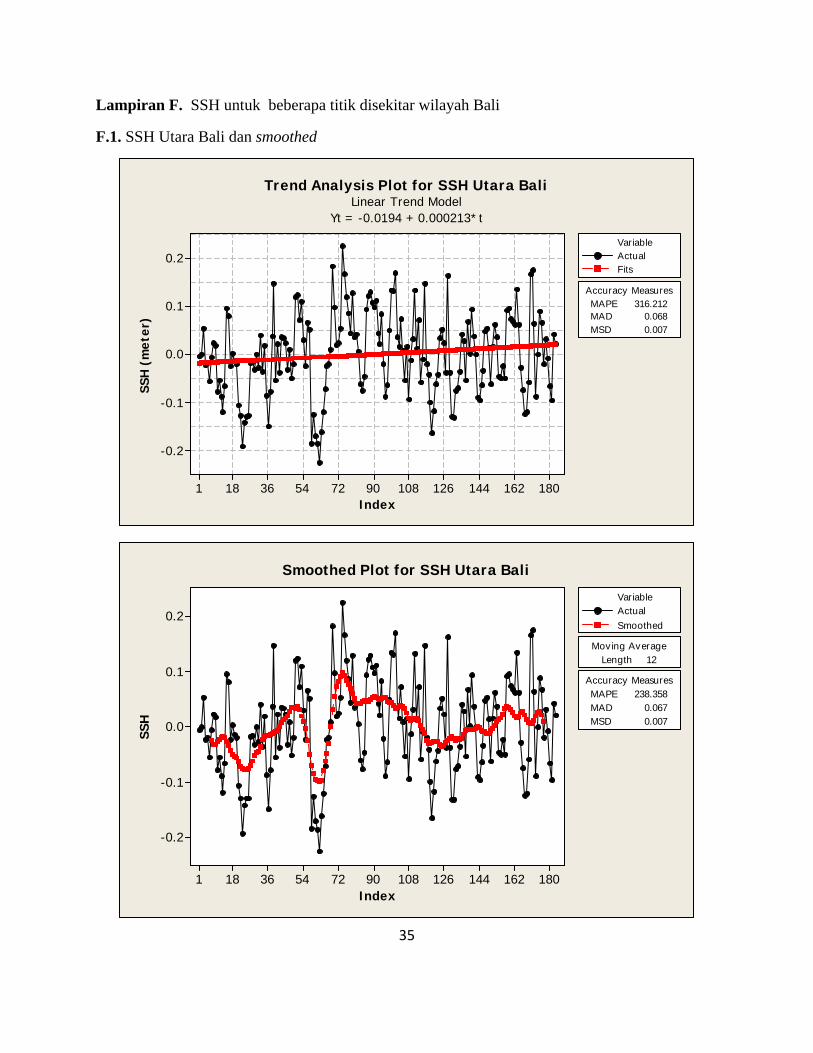
Lampiran F. SSH untuk beberapa titik disekitar wilayah Bali
F.1. SSH Utara Bali dan smoothed
18016214412610890725436181
0.2
0.1
0.0
-0.1
-0.2
Index
SSH
(m
eter
)
MAPE 316.212MAD 0.068MSD 0.007
Accuracy Measures
ActualF its
Variable
Trend Analysis Plot for SSH Utara BaliLinear Trend Model
Yt = -0.0194 + 0.000213*t
18016214412610890725436181
0.2
0.1
0.0
-0.1
-0.2
Index
SSH
Length 12Moving Average
MAPE 238.358MAD 0.067MSD 0.007
Accuracy Measures
ActualSmoothed
Variable
Smoothed Plot for SSH Utara Bali
36
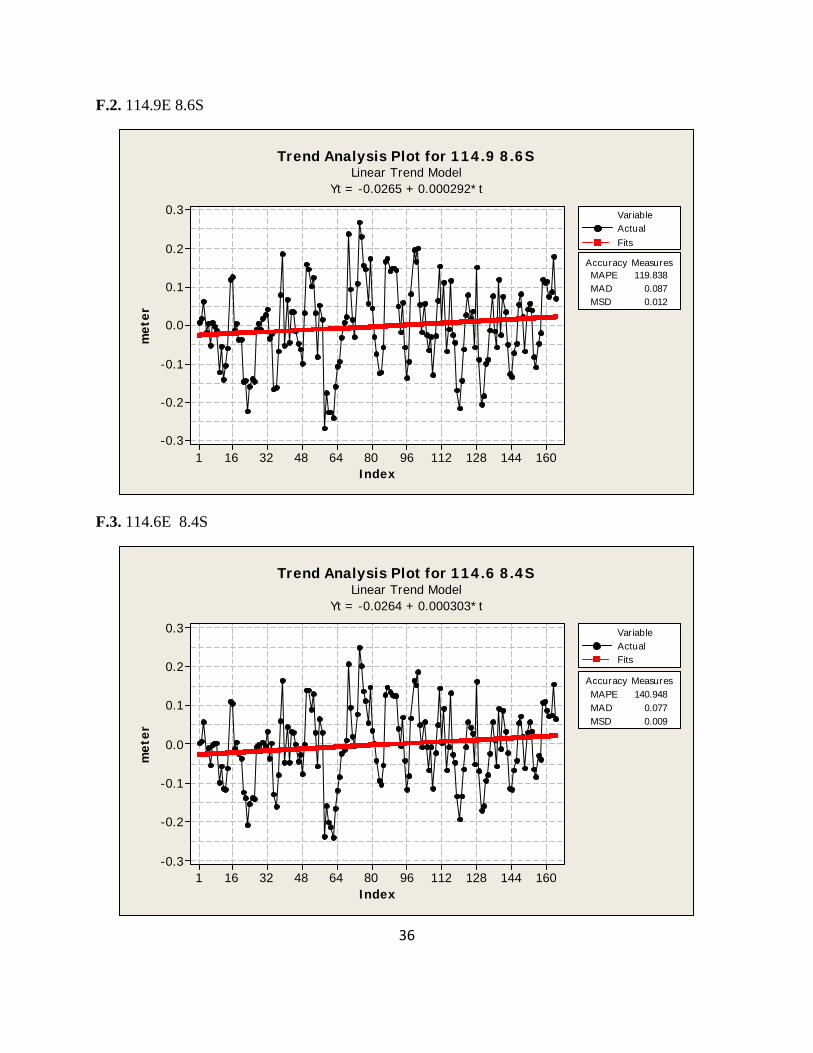
F.2. 114.9E 8.6S
1601441281129680644832161
0.3
0.2
0.1
0.0
-0.1
-0.2
-0.3
Index
met
er
MAPE 119.838MAD 0.087MSD 0.012
Accuracy Measures
ActualF its
Variable
Trend Analysis Plot for 114.9 8.6SLinear Trend Model
Yt = -0.0265 + 0.000292*t
F.3. 114.6E 8.4S
1601441281129680644832161
0.3
0.2
0.1
0.0
-0.1
-0.2
-0.3
Index
met
er
MAPE 140.948MAD 0.077MSD 0.009
Accuracy Measures
ActualFits
Variable
Trend Analysis Plot for 114.6 8.4SLinear Trend Model
Yt = -0.0264 + 0.000303*t
37
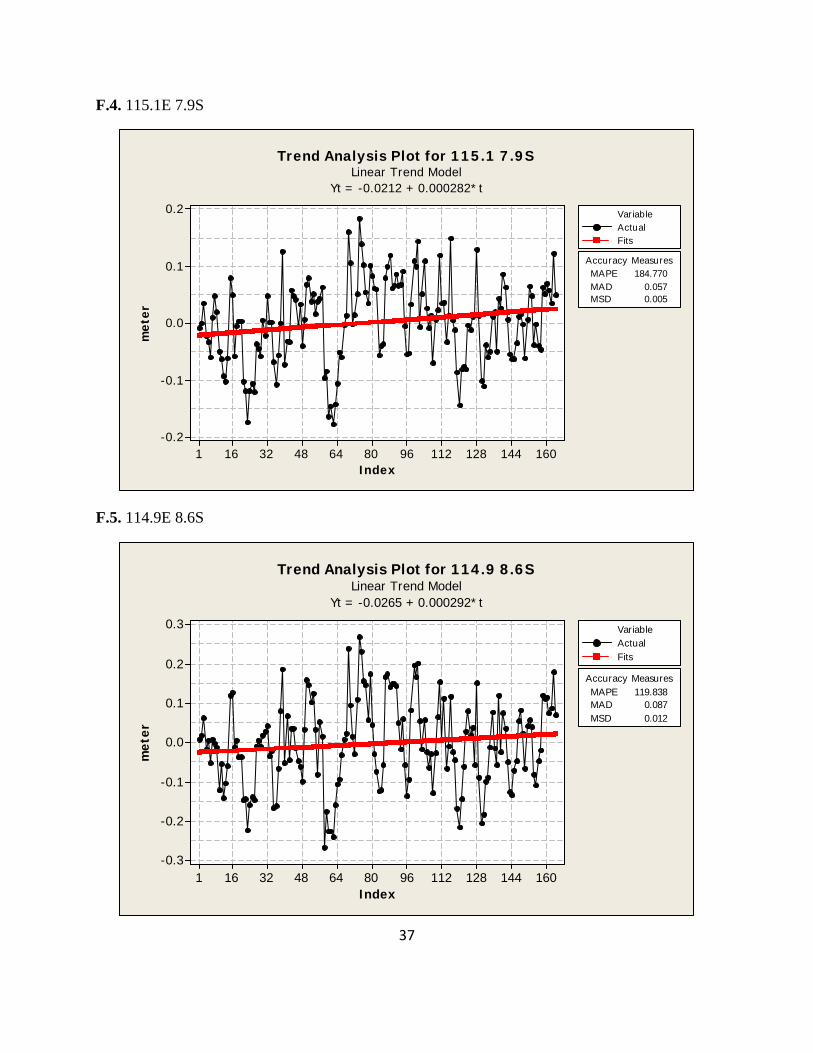
F.4. 115.1E 7.9S
1601441281129680644832161
0.2
0.1
0.0
-0.1
-0.2
Index
met
er
MAPE 184.770MAD 0.057MSD 0.005
Accuracy Measures
ActualF its
Variable
Trend Analysis Plot for 115.1 7.9SLinear Trend Model
Yt = -0.0212 + 0.000282*t
F.5. 114.9E 8.6S
1601441281129680644832161
0.3
0.2
0.1
0.0
-0.1
-0.2
-0.3
Index
met
er
MAPE 119.838MAD 0.087MSD 0.012
Accuracy Measures
ActualFits
Variable
Trend Analysis Plot for 114.9 8.6SLinear Trend Model
Yt = -0.0265 + 0.000292*t
38
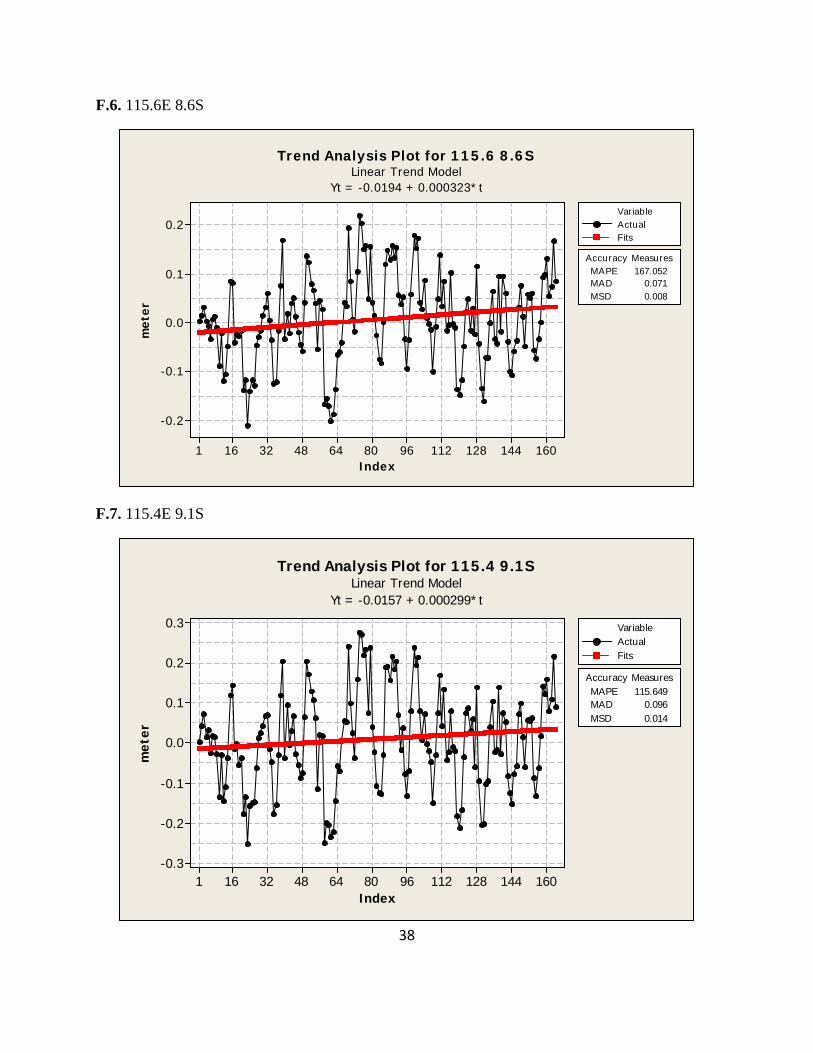
F.6. 115.6E 8.6S
1601441281129680644832161
0.2
0.1
0.0
-0.1
-0.2
Index
met
er
MAPE 167.052MAD 0.071MSD 0.008
Accuracy Measures
ActualF its
Variable
Trend Analysis Plot for 115.6 8.6SLinear Trend Model
Yt = -0.0194 + 0.000323*t
F.7. 115.4E 9.1S
1601441281129680644832161
0.3
0.2
0.1
0.0
-0.1
-0.2
-0.3
Index
met
er
MAPE 115.649MAD 0.096MSD 0.014
Accuracy Measures
ActualFits
Variable
Trend Analysis Plot for 115.4 9.1SLinear Trend Model
Yt = -0.0157 + 0.000299*t
39
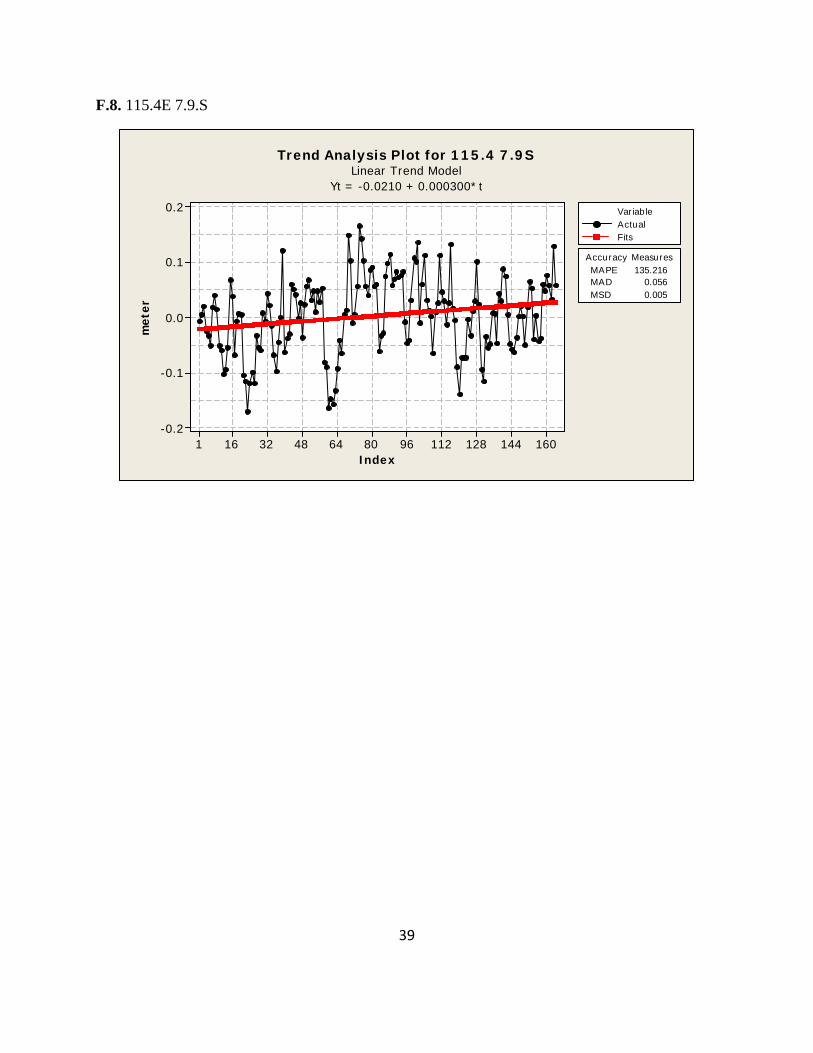
F.8. 115.4E 7.9.S
1601441281129680644832161
0.2
0.1
0.0
-0.1
-0.2
Index
met
er
MA PE 135.216MA D 0.056MSD 0.005
A ccuracy Measures
A ctualF its
Variable
Trend Analysis Plot for 115.4 7.9SLinear Trend Model
Yt = -0.0210 + 0.000300*t
![DAFTAR PUSTAKA - etd.repository.ugm.ac.idetd.repository.ugm.ac.id/downloadfile/96937/potongan/S1-2016... · 90 DAFTAR PUSTAKA DAFTAR PUSTAKA [1] Badan Standardisasi Nasional. “SNI](https://img.pdfslide.us/doc/110x75/5ccf188d88c99385278e02a1/daftar-pustaka-etd-90-daftar-pustaka-daftar-pustaka-1-badan-standardisasi.jpg)