Embed Size (px)
Citation preview

42
DAFTAR PUSTAKA
1. Acharya AB, Sivapathasundharam B. Forensic Odontology. In: Rajendran R,
Sivapathasundharam B. Eds. Shafer′s Textbook of Oral Pathology 5th
. New
Delhi: Elsevier2006;1199-1227.
2. Caldas IM, Magalhães T, Afonso A. Establishing identity using cheiloscopy
and palatoscopy. Forensic SciInt 2007;165:1-9.
3. Winslow JB. Exposition Anatomique de la structure du corps humain. 1732.
Cited by: Lysell L. Plicae palatinae transversae and papilla incisiva in man.
ActaOdontolScand 1955;13:(suppl 18):5-137.
4. Santorini JD. Septemdecim Tabulae. Cited by: Lysell L. Plicae palatinae
transversae and papilla incisiva in man. ActaOdontolScand 1955;13 (suppl
18):5-137.
5. Abizadeh, Arash. "Ethnicity, Race, and a Possible Humanity". World
Order 2001;33; 23–34.
6. Pretty IA and Sweet D. A Look at Forensic Dentistry – Part 1 : The Role of
Teeth in The Determination of Human Identity. British Dental Journa 2001;
190(7):359-66.
7. Kapali S, Townsend G, Richards L, Parish T. Palatal Rugae Patterns in
Australian Aborigines and Caucasians. Australian Dental Journal1997;42(2):
129-33.
8. Nayak P, Acharya AB, Padmini AT, Kaveri H. Differences in the palatal
rugae shape in two populations of India. Arch Oral Biol. 2007;52:977–82.

43
9. Marco AA, Philips C, Kula K, Tulloch C. Stability of palatal rugae as
landmarks for analysis of dental cast. Angle Orthod. 1995;65:43–8.
10. Amasaki H, Ogawa M, Nagasao J, Mutoh K, Ichihara N, Asari M, et al.
Distributional Changes of BrdU, PCNA, E2F1 and PAL31 MoleculesIn
Developing Murine Palatal Rugae. Ann Anat 2003;185: 517-23.
11. Peavy DC, Jr., Kendrick GS. The effects of tooth movement on the palatine
rugae. J Prosthet Dent 1967;18: 536-42.
12. Van Der Linden FP. Changes in the position of posterior teeth in relation to
ruga points. Am J Orthod 1978;74: 142-143.
13. English WR, Robison SF, Summitt JB, Oesterle LJ, Brannon RB, Morlang
WM. Individuality of human palatal rugae. J Forensic Sci 1988;33: 718-26.
14. Hauser G, Daponte A, Roberts MJ. Palatal rugae. J Anat 1989;165: 237-49.
15. Lysell L. Plicae palatinae transversae and papilla incisiva in man; a
morphologic and genetic study. ActaOdontolScand 1955;13: 5-137.
16. Almeida MA, Phillips C, Kula K, Tulloch C. Stability of The Palatal Rugae
As Landmarks for Analysis of DentalCasts. AngleOrthod 1995;65:43-8.
17. Thomas CJ, KotzeTJvW. The palatal ruga pattern in sixsouthern African
human populations, Part I: a description of thepopulations and a method for
its investigation. J Dent AssocSouth Africa 1983;38:547-53.
18. Wolf, Eric R. (2004). "Alfred L. Kroeber". In Sydel Silverman (ed.). Totems
and Teachers: Key Figures in the History of Anthropology (2nd edition ed.).
Walnut Creek, CA: AltaMira Press. pp. 27–50.

44
19. Filho EM, Helena SP, Arsenio SP, Suzana MC. Palatal rugae patterns as
bioindicator of identification in forensic dentistry. RFO 2009;14:33-277
20. Eva T. Perbedaan pola ruge palatal pada penduduk keturunan Deutro Melayu
dengan keturunan Cina di Jawa Tengah. Universitas Diponegoro. Semarang :
2013. 40-45
45
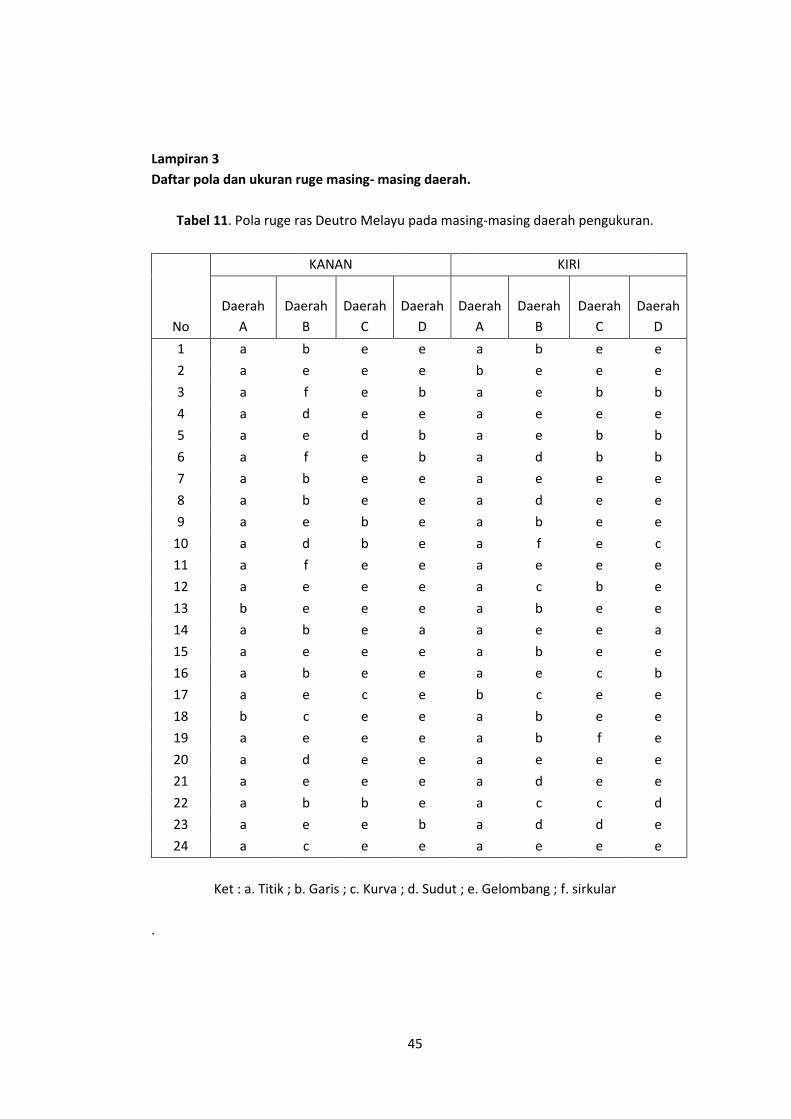
Lampiran 3
Daftar pola dan ukuran ruge masing- masing daerah.
Tabel 11. Pola ruge ras Deutro Melayu pada masing-masing daerah pengukuran.
No
KANAN KIRI
Daerah
A
Daerah
B
Daerah
C
Daerah
D
Daerah
A
Daerah
B
Daerah
C
Daerah
D
1 a b e e a b e e
2 a e e e b e e e
3 a f e b a e b b
4 a d e e a e e e
5 a e d b a e b b
6 a f e b a d b b
7 a b e e a e e e
8 a b e e a d e e
9 a e b e a b e e
10 a d b e a f e c
11 a f e e a e e e
12 a e e e a c b e
13 b e e e a b e e
14 a b e a a e e a
15 a e e e a b e e
16 a b e e a e c b
17 a e c e b c e e
18 b c e e a b e e
19 a e e e a b f e
20 a d e e a e e e
21 a e e e a d e e
22 a b b e a c c d
23 a e e b a d d e
24 a c e e a e e e
Ket : a. Titik ; b. Garis ; c. Kurva ; d. Sudut ; e. Gelombang ; f. sirkular
.

46
Tabel 12. Pola ruge ras Australoid pada masing-masing daerah pengukuran
KANAN KIRI
No
Daerah
A
Daerah
B
Daerah
C
Daerah
D
Daerah
A
Daerah
B
Daerah
C
Daerah
D
1 b e d b b e d e
2 b f e e b e d e
3 a d e b a e d b
4 b e e e b e e e
5 b e d e b e e e
6 b d e e b d e e
7 b f d e b f d e
8 b e d e b e d e
9 b d d e a d d b
10 a b d b b e d b
11 b e e b b e e b
12 b d e e b f e e
13 a e d e a f b e
14 a e d d a e c e
15 b d e e b c d e
16 b e d e b e c e
17 b f d e b f d e
18 b e d b b f e b
19 b b d b a c d e
20 b e d b b b f e
21 b d d c b e d c
22 b c f b b d d d
23 b e e b b d d e
24 b e d b b e d e

47
Tabel 13. Jumlah pola ruge ras Deutro Melayu pada masing-masing daerah pengukuran
kiri dan kanan.
KANAN KIRI
Daerah
A
Daerah
B
Daerah
C
Daerah
D
Daerah
A
Daerah
B
Daerah
C
Daerah
D
TITIK 22 0 0 1 22 0 0 1
GARIS 2 6 3 4 2 6 3 4
KURVA 0 2 3 0 0 3 0 1
SUDUT 0 3 1 0 0 4 1 1
GELOMBANG 0 10 17 19 0 10 18 17
SIRKULER 0 3 0 0 0 1 2 0
Tabel 14. Jumlah pola ruge ras Australoid pada masing-masing daerah pengukuran kiri
dan kanan.
KANAN KIRI
Daerah
A
Daerah
B
Daerah
C
Daerah
D
Daerah
A
Daerah
B
Daerah
C
Daerah
D
TITIK 4 0 0 0 5 0 0 0
GARIS 20 2 0 10 19 1 1 5
KURVA 0 1 0 1 0 2 2 1
SUDUT 0 6 15 1 0 4 12 1
GELOMBANG 0 12 8 12 0 12 6 17
SIRKULAR 0 3 1 0 0 5 1 0
Lampiran 4

48
Lembar pengolahan data
UJI POLA
Frequency Table
A.ka
26 54,2 54,2 54,2
22 45,8 45,8 100,0
48 100,0 100,0
Titik
Garis
Total
Valid
Frequency Percent Valid Percent
Cumulat iv e
Percent
B.ka
8 16,7 16,7 16,7
3 6,3 6,3 22,9
8 16,7 16,7 39,6
22 45,8 45,8 85,4
7 14,6 14,6 100,0
48 100,0 100,0
Garis
Kurv a
Sudut
Gelombang
Sirkuler
Total
Valid
Frequency Percent Valid Percent
Cumulat iv e
Percent
C.ka
3 6,3 6,3 6,3
1 2,1 2,1 8,3
16 33,3 33,3 41,7
27 56,3 56,3 97,9
1 2,1 2,1 100,0
48 100,0 100,0
Garis
Kurv a
Sudut
Gelombang
Sirkuler
Total
Valid
Frequency Percent Valid Percent
Cumulat iv e
Percent

49
D.ka
1 2,1 2,1 2,1
14 29,2 29,2 31,3
1 2,1 2,1 33,3
1 2,1 2,1 35,4
31 64,6 64,6 100,0
48 100,0 100,0
Titik
Garis
Kurv a
Sudut
Gelombang
Total
Valid
Frequency Percent Valid Percent
Cumulat iv e
Percent
A.ki
27 56,3 56,3 56,3
21 43,8 43,8 100,0
48 100,0 100,0
Titik
Garis
Total
Valid
Frequency Percent Valid Percent
Cumulat iv e
Percent
B.ki
7 14,6 14,6 14,6
5 10,4 10,4 25,0
8 16,7 16,7 41,7
22 45,8 45,8 87,5
6 12,5 12,5 100,0
48 100,0 100,0
Garis
Kurv a
Sudut
Gelombang
Sirkuler
Total
Valid
Frequency Percent Valid Percent
Cumulat iv e
Percent
C.ki
5 10,4 10,4 10,4
4 8,3 8,3 18,8
15 31,3 31,3 50,0
22 45,8 45,8 95,8
2 4,2 4,2 100,0
48 100,0 100,0
Garis
Kurv a
Sudut
Gelombang
Sirkuler
Total
Valid
Frequency Percent Valid Percent
Cumulat iv e
Percent

50
D.ki
1 2,1 2,1 2,1
9 18,8 18,8 20,8
2 4,2 4,2 25,0
2 4,2 4,2 29,2
34 70,8 70,8 100,0
48 100,0 100,0
Titik
Garis
Kurv a
Sudut
Gelombang
Total
Valid
Frequency Percent Valid Percent
Cumulat iv e
Percent

51
Mann-Whitney Test
Ranks
24 15,50 372,00
24 33,50 804,00
48
24 23,46 563,00
24 25,54 613,00
48
24 27,85 668,50
24 21,15 507,50
48
24 27,58 662,00
24 21,42 514,00
48
24 16,00 384,00
24 33,00 792,00
48
24 20,02 480,50
24 28,98 695,50
48
24 27,48 659,50
24 21,52 516,50
48
24 24,40 585,50
24 24,60 590,50
48
DEUTRO
MELAYU
PAPUA
Total
MELAYU
PAPUA
Total
MELAYU
PAPUA
Total
MELAYU
PAPUA
Total
MELAYU
PAPUA
Total
MELAYU
PAPUA
Total
MELAYU
PAPUA
Total
MELAYU
PAPUA
Total
A.ka
B.ka
C.ka
D.ka
A.ki
B.ki
C.ki
D.ki
N Mean Rank Sum of Ranks
Test Statisticsa
72,000 372,000 -5,160 ,000
263,000 563,000 -,546 ,585
207,500 507,500 -1,873 ,061
214,000 514,000 -1,816 ,069
84,000 384,000 -4,894 ,000
180,500 480,500 -2,345 ,019
216,500 516,500 -1,579 ,114
285,500 585,500 -,065 ,949
A.ka
B.ka
C.ka
D.ka
A.ki
B.ki
C.ki
D.ki
Mann-Whitney U Wilcoxon W Z Asy mp. Sig. (2-tailed)
Grouping Variable: DEUTROa.

52
UJI UKURAN
Case Summaries
24 24 24 24 24 24
,9292 1,0583 1,3312 ,8813 1,0958 1,3333
,17749 ,14646 ,24575 ,16071 ,16741 ,23805
,9000 1,0500 1,4000 ,8500 1,1000 1,3750
,60 ,65 ,35 ,55 ,75 ,50
1,40 1,30 1,60 1,15 1,40 1,60
24 24 24 24 24 24
1,2167 1,4375 1,4792 1,2792 1,4958 1,5021
,13486 ,16697 ,17993 ,14289 ,15102 ,19808
1,2000 1,4250 1,4500 1,3000 1,4750 1,4750
,95 1,05 1,20 1,00 1,20 1,20
1,45 1,70 2,00 1,50 1,80 1,85
48 48 48 48 48 48
1,0729 1,2479 1,4052 1,0802 1,2958 1,4177
,21312 ,24667 ,22579 ,25111 ,25637 ,23281
1,1000 1,2500 1,4000 1,1250 1,3000 1,4000
,60 ,65 ,35 ,55 ,75 ,50
1,45 1,70 2,00 1,50 1,80 1,85
N
Mean
Std. Dev iation
Median
Minimum
Maximum
N
Mean
Std. Dev iation
Median
Minimum
Maximum
N
Mean
Std. Dev iation
Median
Minimum
Maximum
DEUTRO
MELAYU
PAPUA
Total
Uk.B.ka Uk.C.ka Uk.D.ka Uk.B.ki Uk.C.ki Uk.D.ki
Tests of Normality
,203 24 ,012 ,937 24 ,143
,133 24 ,200* ,972 24 ,704
,179 24 ,046 ,935 24 ,128
,125 24 ,200* ,969 24 ,639
,245 24 ,001 ,695 24 ,000
,180 24 ,042 ,900 24 ,021
,168 24 ,078 ,935 24 ,124
,100 24 ,200* ,962 24 ,483
,113 24 ,200* ,977 24 ,840
,138 24 ,200* ,969 24 ,646
,278 24 ,000 ,794 24 ,000
,147 24 ,191 ,941 24 ,171
DEUTRO
MELAYU
PAPUA
MELAYU
PAPUA
MELAYU
PAPUA
MELAYU
PAPUA
MELAYU
PAPUA
MELAYU
PAPUA
Uk.B.ka
Uk.C.ka
Uk.D.ka
Uk.B.ki
Uk.C.ki
Uk.D.ki
Stat ist ic df Sig. Stat ist ic df Sig.
Kolmogorov-Smirnova
Shapiro-Wilk
This is a lower bound of the true signif icance.*.
Lillief ors Signif icance Correctiona.
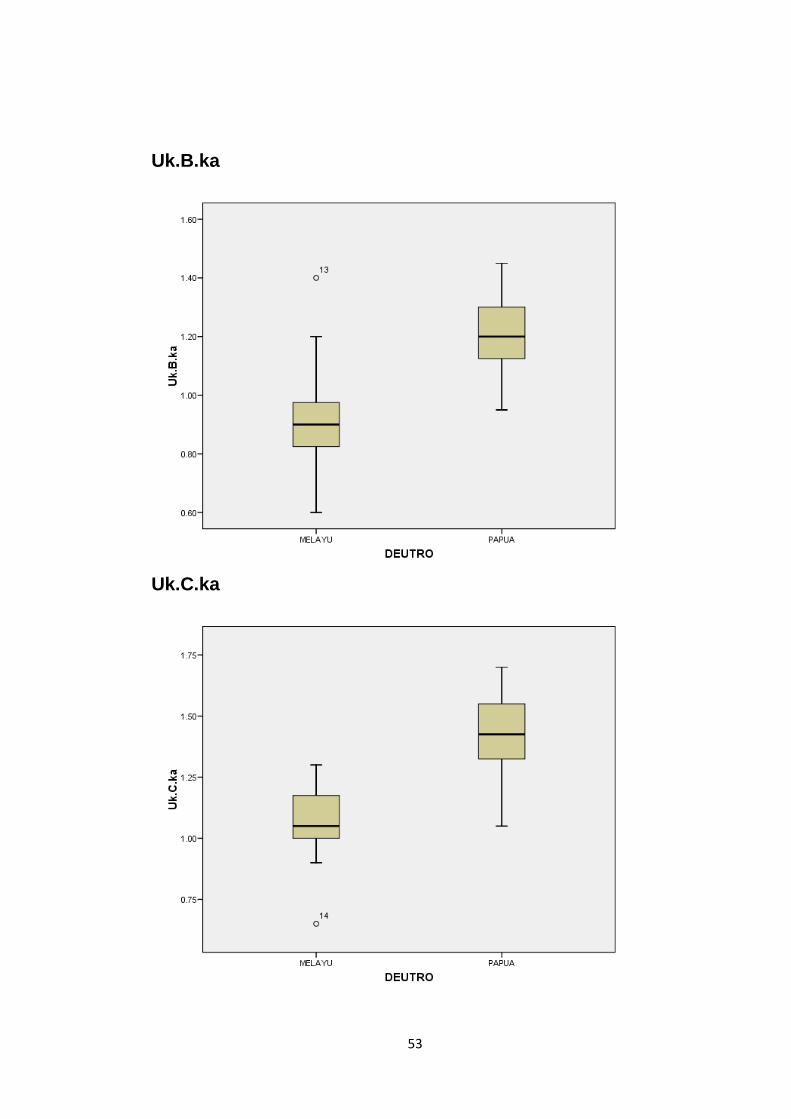
53
Uk.B.ka
Uk.C.ka

54
Uk.D.ka
Uk.B.ki

55
Uk.C.ki
Uk.D.ki

56
T-Test
Group Statistics
24 ,9292 ,17749 ,03623
24 1,2167 ,13486 ,02753
DEUTRO
MELAYU
PAPUA
Uk.B.ka
N Mean Std. Dev iation
Std. Error
Mean
Independent Samples Test
,625
,433
-6,318 -6,318
46 42,918
,000 ,000
-,28750 -,28750
,04550 ,04550
-,37909 -,37927
-,19591 -,19573
F
Sig.
Levene's Test f or
Equality of Variances
t
df
Sig. (2-tailed)
Mean Dif ference
Std. Error Dif ference
Lower
Upper
95% Conf idence Interv al
of the Dif f erence
t-test for Equality of
Means
Equal variances
assumed
Equal variances
not assumed
Uk.B.ka

57
T-Test
NPar Tests
Mann-Whitney Test
Group Statistics
24 1,0583 ,14646 ,02990
24 1,4375 ,16697 ,03408
DEUTRO
MELAYU
PAPUA
Uk.C.ka
N Mean Std. Dev iation
Std. Error
Mean
Independent Samples Test
,734
,396
-8,363 -8,363
46 45,231
,000 ,000
-,37917 -,37917
,04534 ,04534
-,47042 -,47047
-,28791 -,28787
F
Sig.
Levene's Test f or
Equality of Variances
t
df
Sig. (2-tailed)
Mean Dif ference
Std. Error Dif ference
Lower
Upper
95% Conf idence Interv al
of the Dif f erence
t-test for Equality of
Means
Equal variances
assumed
Equal variances
not assumed
Uk.C.ka
Ranks
24 19,92 478,00
24 29,08 698,00
48
DEUTRO
MELAYU
PAPUA
Total
Uk.D.ka
N Mean Rank Sum of Ranks
Test Statisticsa
178,000
478,000
-2,285
,022
Mann-Whitney U
Wilcoxon W
Z
Asy mp. Sig. (2-tailed)
Uk.D.ka
Grouping Variable: DEUTROa.

58
T-Test
T-Test
Group Statistics
24 ,8813 ,16071 ,03281
24 1,2792 ,14289 ,02917
DEUTRO
MELAYU
PAPUA
Uk.B.ki
N Mean Std. Dev iation
Std. Error
Mean
Independent Samples Test
,380
,541
-9,065 -9,065
46 45,378
,000 ,000
-,39792 -,39792
,04390 ,04390
-,48628 -,48631
-,30956 -,30953
F
Sig.
Levene's Test f or
Equality of Variances
t
df
Sig. (2-tailed)
Mean Dif ference
Std. Error Dif ference
Lower
Upper
95% Conf idence Interv al
of the Dif f erence
t-test for Equality of
Means
Equal variances
assumed
Equal variances
not assumed
Uk.B.ki
Group Statistics
24 1,0958 ,16741 ,03417
24 1,4958 ,15102 ,03083
DEUTRO
MELAYU
PAPUA
Uk.C.ki
N Mean Std. Dev iation
Std. Error
Mean

59
NPar Tests
Mann-Whitney Test
Independent Samples Test
,114
,737
-8,691 -8,691
46 45,520
,000 ,000
-,40000 -,40000
,04602 ,04602
-,49264 -,49266
-,30736 -,30734
F
Sig.
Levene's Test f or
Equality of Variances
t
df
Sig. (2-tailed)
Mean Dif ference
Std. Error Dif ference
Lower
Upper
95% Conf idence Interv al
of the Dif f erence
t-test for Equality of
Means
Equal variances
assumed
Equal variances
not assumed
Uk.C.ki
Ranks
24 20,19 484,50
24 28,81 691,50
48
DEUTRO
MELAYU
PAPUA
Total
Uk.D.ki
N Mean Rank Sum of Ranks
Test Statisticsa
184,500
484,500
-2,149
,032
Mann-Whitney U
Wilcoxon W
Z
Asy mp. Sig. (2-tailed)
Uk.D.ki
Grouping Variable: DEUTROa.

60

61

62

63

64