Embed Size (px)
Citation preview

Daekyo Co., Ltd. and Subsidiaries Consolidated Financial Statements December 31, 2013 and 2012

Daekyo Co., Ltd. and Subsidiaries Index
December 31, 2013 and 2012
Page(s)
Report of Independent Auditors .............................................................................................. 1 - 2
Consolidated Financial Statements
Consolidated Statements of Financial Position .......................................................................... 3 - 4
Consolidated Statements of Income …….................................................................................... 5
Consolidated Statements of Comprehensive Income .................................................. ............... 6
Consolidated Statements of Changes in Equity ......................................................................... 7
Consolidated Statements of Cash Flows .................................................................................... 8
Notes to the Consolidated Financial Statements .......................................................................... 9-75

Samil PricewaterhouseCoopers, 92 Hangang-daero, Yongsan-gu, Seoul 140-702, Korea, www.samil.com
Report of Independent Auditors
To the Board of Directors and Shareholders of
Daekyo Co., Ltd.
We have audited the accompanying consolidated statements of financial position of Daekyo Co., Ltd.
(the “Company”) and its subsidiaries (collectively the “Group”) as of December 31, 2013 and 2012, and
the related consolidated statements of income, comprehensive income, changes in equity and cash
flows for the years then ended, expressed in Korean won. These financial statements are the
responsibility of the Company's management. Our responsibility is to express an opinion on these
financial statements based on our audits. We did not audit the financial statements of certain
consolidated subsidiaries, whose financial statements represent 1% of the Group's consolidated total
assets as of December 31, 2013 and 2012, respectively. These statements were audited by other
auditors whose reports have been furnished us and our opinion, insofar as it relates to the amounts
included for certain consolidated subsidiaries, is based solely on the reports of the other auditors.
We conducted our audits in accordance with auditing standards generally accepted in the Republic of
Korea. Those standards require that we plan and perform the audit to obtain reasonable assurance
about whether the financial statements are free of material misstatement. An audit includes examining,
on a test basis, evidence supporting the amounts and disclosures in the financial statements. An audit
also includes assessing the accounting principles used and significant estimates made by
management, as well as evaluating the overall financial statement presentation. We believe that our
audits and the reports of other auditors provide a reasonable basis for our opinion.
In our opinion, based on our audit and the reports of other auditors, the consolidated financial
statements, referred to above, present fairly, in all material respects, the financial position of the Group
as of December 31, 2013 and 2012, and their financial performance and cash flows for the years then
ended, in accordance with International Financial Reporting Standards as adopted by the Republic of
Korea (“Korean IFRS”).

2
Auditing standards and their application in practice vary among countries. The procedures and
practices used in the Republic of Korea to audit such financial statements may differ from those
generally accepted and applied in other countries. Accordingly, this report is for use by those who are
informed about Korean auditing standards and their application in practice.
Seoul, Korea
March 12, 2014
This audit report is effective as of March 12, 2014, the audit report date. Certain subsequent events or
circumstances, which may occur between the audit report date and the time of reading this report,
could have a material impact on the accompanying consolidated financial statements and notes
thereto. Accordingly, the readers of the audit report should understand that there is a possibility that
the above audit report may have to be revised to reflect the impact of such subsequent events or
circumstances, if any.

Daekyo Co., Ltd. and SubsidiariesConsolidated Statements of Financial Position
December 31, 2013 and 2012
(in Korean won) Notes 2013 2012
Assets
Current assets
Cash and cash equivalents 4,5,7,8 104,846,553,211 38,604,012,540
Financial deposits 4,5,7,8,30 11,479,330,091 9,322,951,126
Trade receivables 5,7,9,42 35,968,389,587 40,079,039,627
Other receivables 5,7,9,42 46,620,463,670 41,548,039,125
Financial assets at fair value
through profit or loss5,7,10 21,460,842,325 57,548,068,785
Available-for-sale financial assets 5,7,11 38,671,635,292 81,611,056,374
Inventories 12 23,149,811,700 24,161,843,707
Other current assets 13 5,716,001,322 9,285,733,466
287,913,027,198 302,160,744,750
Non-current assets
Financial deposits 5,7,8,30 303,000,000 305,062,981
Long-term other receivables 5,7,9,42 12,846,374,009 21,430,025,285
Available-for-sale financial assets 5,7,11 195,998,283,359 165,510,215,304
Investments in associates 14 2,385,454,747 2,395,226,005
Property, plant and equipment 15 141,487,519,919 147,787,114,662
Investment property 16 125,024,075,697 90,558,212,739
Intangible assets 17 75,452,258,810 83,557,928,606
Net defined benefit assets 22 396,404,967 -
Other non-current assets 13 484,885,524 408,609,492
554,378,257,032 511,952,395,074
Total assets 842,291,284,230 814,113,139,824
3

Daekyo Co., Ltd. and SubsidiariesConsolidated Statements of Financial Position
December 31, 2013 and 2012
(in Korean won) Notes 2013 2012
Liabilities
Current liabilities
Trade payables 4,5,6,7,42 9,706,668,910 10,195,505,884
Other payables 4,5,6,7,18,42 68,854,106,421 67,399,278,670
Borrowings 4,5,6,7,19 28,507,225,446 23,274,150,019
Income tax payable 10,777,083,978 5,151,477,094
Provisions 20 558,651,378 493,666,331
Other current liabilities 21 53,688,275,284 58,487,258,347
172,092,011,417 165,001,336,345
Non-current liabilities
Other payables 4,5,6,7,18 9,705,640,718 3,379,390,583
Borrowings 4,5,6,7,19 117,618,471 891,174,021
Net defined benefit liability 22 - 4,071,156,664
Deferred income tax liabilities 23 13,828,530,026 18,840,534,464
23,651,789,215 27,182,255,732
Total liabilities 195,743,800,632 192,183,592,077
Equity attributable to owners of the Parent
Capital stock 24 52,064,920,000 52,064,920,000
Capital surplus 25 69,626,473,529 68,919,275,425
Other components of equity 26,27,28 (60,803,172,427) (54,890,574,087)
Accumulated other comprehensive income 23 87,265,353,428 76,774,703,864
Retained earnings 29 490,317,798,983 472,739,016,936
638,471,373,513 615,607,342,138
Non-controlling interest
Non-controlling interest 8,076,110,085 6,322,205,609
Total equity 646,547,483,598 621,929,547,747
Total liabilities and equity 842,291,284,230 814,113,139,824
The accompanying notes are an integral part of these consolidated financial statements.
4

Daekyo Co., Ltd. and Subsidiaries
Consolidated Statements of Income
Years Ended December 31, 2013 and 2012
(in Korean won) Notes 2013 2012
Net Sales 6,31,42 839,582,028,779 869,494,013,911
Cost of sales 33,42 688,639,185,290 718,594,395,558
Gross profit 150,942,843,489 150,899,618,353
Selling and administrative expenses 32,33,42 119,236,297,569 119,244,641,391
Operating income 6 31,706,545,920 31,654,976,962
Other income 34 34,556,419,556 35,446,688,746
Other expenses 35 13,787,391,292 25,785,593,784
Share of loss of associates 14 9,771,258 171,650,218
Financial income 36 2,543,519,867 2,171,101,449
Financial expenses 37 862,410,304 903,701,563
Profit before income tax 54,146,912,489 42,411,821,592
Income tax expense 38 21,924,273,673 12,840,893,988
Profit for the year from continuing operations 32,222,638,816 29,570,927,604
Discontinued operations
Loss for the year from discontinued operations - (8,803,232,809)
Profit for the year 32,222,638,816 20,767,694,795
Profit for the year attributable to:
Equity holders of the Parent Company 35,304,614,129 22,933,324,738
Non-controlling interests (3,081,975,313) (2,165,629,943)
Basic earnings per share from continuing operations 39
attributable to the equity holders
of the Parent Company during the year:
Basic earnings per share for ordinary shares 381 338
Basic earnings per share for preferred shares 389 347
Basic loss per share from discontinued operations 39
attributable to the equity holders
of the Parent Company during the year:
Basic loss per share for ordinary shares - (94)
Basic loss per share for preferred shares - (94)
Diluted earnings per share from continuing operations 39
attributable to the equity holders
of the Parent Company during the year:
Diluted earnings per share for ordinary shares 381 338
Diluted earnings per share for preferred shares 388 347
Diluted loss per share from discontinued operations 39
attributable to the equity holders
of the Parent Company during the year:
Diluted loss per share for ordinary shares - (94)
Diluted loss per share for preferred shares - (94)
The accompanying notes are an integral part of these consolidated financial statements.
5

Daekyo Co., Ltd. and Subsidiaries
Consolidated Statements of Comprehensive Income
Years Ended December 31, 2013 and 2012
(in Korean won) Notes 2013 2012
Profit for the year 32,222,638,816 20,767,694,795
Other comprehensive income, net of tax:
Items that will not be reclassified subsequently to profit or loss
Remeasurements of the net defined benefit liability 22,23,29 1,334,745,193 (1,037,122,857)
Items that may be reclassified subsequently to profit or loss
23 10,620,300,640 (11,117,380,656)
Currency translation differences (92,073,699) (979,533,905)
Other comprehensive income(loss) for the year, net of tax 11,862,972,134 (13,134,037,418)
Total comprehensive income for the year 44,085,610,950 7,633,657,377
Comprehensive income (loss) for the year
attributable to:
Equity holders of the Parent Company 47,132,116,438 10,216,205,637
Non-controlling interest (3,046,505,488) (2,582,548,260)
The accompanying notes are an integral part of these consolidated financial statements.
Gain(loss) on valuation of available-for-sale
financial assets
6

Daekyo Co., Ltd. and Subsidiaries
Consolidated Statements of Changes in Equity
Years Ended December 31, 2013 and 2012
(in Korean won)
Accumulated Other
Notes Other components Comprehensive Retained Non-controlling Total
Capital Stock Capital Surplus of Equity Income(loss) Earnings Interest Equity
Balance at January 1, 2012 52,064,920,000 69,422,725,682 (47,569,505,865) 88,482,807,653 475,330,769,940 6,049,459,569 643,781,176,979
Comprehensive income (loss)
Profit for the year - - - - 22,933,324,738 (2,165,629,943) 20,767,694,795
- - - (11,117,380,656) - - (11,117,380,656)
Remeasurement of net defined
benefit liability- - - - (1,009,015,312) (28,107,545) (1,037,122,857)
Currency translation differences - - - (590,723,133) - (388,810,772) (979,533,905)
Transactions with equity holders
of the Parent Company:
Dividends 40 - - - - (14,233,557,340) - (14,233,557,340)
Interim dividends 40 - - - - (10,282,505,090) - (10,282,505,090)
Dividends of subsidiaries - - - - - (117,941,130) (117,941,130)
Issuance of stocks of
subsidiaries- (750,553,330) - - - 2,973,235,430 2,222,682,100
Acquisition of treasury stock - - (9,755,776,800) - - - (9,755,776,800)
Disposal of treasury stock - 247,103,073 2,580,291,476 - - - 2,827,394,549
Stock options - - (145,582,898) - - - (145,582,898)
Balance at December 31, 2012 52,064,920,000 68,919,275,425 (54,890,574,087) 76,774,703,864 472,739,016,936 6,322,205,609 621,929,547,747
Balance at January 1, 2013 52,064,920,000 68,919,275,425 (54,890,574,087) 76,774,703,864 472,739,016,936 6,322,205,609 621,929,547,747
Comprehensive income (loss)
Profit for the year - - - - 35,304,614,129 (3,081,975,313) 32,222,638,816
- - - 10,603,038,307 - 17,262,333 10,620,300,640
Remeasurement of net defined
benefit liability- - - - 1,336,852,745 (2,107,552) 1,334,745,193
Currency translation differences - - - (112,388,743) - 20,315,044 (92,073,699)
Transactions with equity holders
of the Parent Company:
Dividends 40 - - - - (9,415,857,270) - (9,415,857,270)
Interim dividends 40 - - - - (10,171,129,650) - (10,171,129,650)
Dividends of subsidiaries - - - - - (76,695,500) (76,695,500)
Issuance of stocks of
subsidiaries- (547,828) - - - 4,877,105,464 4,876,557,636
Changes in scope of
consolidation- - - - 524,302,093 - 524,302,093
Acquisition of treasury stock - - (9,376,722,400) - - - (9,376,722,400)
Disposal of treasury stock - 707,745,932 3,613,252,396 - - - 4,320,998,328
Stock options - - (149,128,336) - - - (149,128,336)
Balance at December 31, 2013 52,064,920,000 69,626,473,529 (60,803,172,427) 87,265,353,428 490,317,798,983 8,076,110,085 646,547,483,598
The accompanying notes are an integral part of these consolidated financial statements.
Attributable to equity holders of the Parent Company
Gain(loss) on valuation of
available-for-sale financial assets
Gain(loss) on valuation of
available-for-sale financial assets
7

Daekyo Co., Ltd. and SubsidiariesConsolidated Statements of Cash Flows
Years Ended December 31, 2013 and 2012
(in Korean won) Notes 2013 2012
Cash flows from operating activities
Cash generated from operations 41 131,858,439,656 73,638,742,227
Dividends received 2,894,079,719 3,785,229,641
Interest received 2,159,317,466 1,849,769,014
Interest paid (834,715,590) (1,562,254,298)
Income tax paid (25,262,927,556) (19,466,202,457)
Net cash generated from operating activities 110,814,193,695 58,245,284,127
Cash flows from investing activities
Decrease in short-term financial deposits 11,690,445,246 8,986,217,938
Proceeds from disposal of available-for-sale financial assets 92,375,533,865 74,647,692,485
Decrease in other receivables 13,582,996,974 15,168,847,763
Proceeds from disposal of property, plant and equipment 1,751,067,739 50,776,444
Proceeds from disposal of intangible assets 175,807,668 -
Grants from goverments 553,000,000 120,000,000
Proceeds from disposal of business 1,100,000,000 -
Increase in long-term financial deposits (13,813,241,466) (5,806,646,045)
Acquisition of available-for-sale financial assets (47,613,856,764) (49,172,416,117)
Increase in other receivables (10,418,623,510) (16,808,746,331)
Acquisition of investments in associates - (2,400,000,000)
Acquisition of property, plant and equipment (50,229,372,798) (28,949,751,738)
Acquisition of investment property (779,449,935) (2,907,896,148)
Acquisition of intangible assets (26,986,485,338) (35,307,368,180)
Net cash used in investing activities (28,612,178,319) (42,379,289,929)
Cash flows from financing activities
Disposal of treasury stock 3,749,520,973 1,727,152,949
Issuance of stocks of subsidiaries 4,876,557,636 2,218,039,256
Proceeds from borrowings 6,051,494,157 7,289,177,859
Acquisition of treasury stock (9,376,722,400) (9,755,776,800)
Dividends paid (19,663,682,420) (24,635,179,705)
Repayments of borrowings (1,305,824,507) (3,456,107,215)
Net cash used in financing activities (15,668,656,561) (26,612,693,656)
Net increase(decrease) in cash and cash equivalents 66,533,358,815 (10,746,699,458)
Cash and cash equivalents at the beginning of year 38,604,012,540 49,874,764,951
Exchange losses on cash and cash equivalents (290,818,144) (524,052,953)
Cash and cash equivalents at the end of year 104,846,553,211 38,604,012,540
The accompanying notes are an integral part of these consolidated financial statements.
8

Daekyo Co., Ltd. and Subsidiaries Notes to the Consolidated Financial Statements December 31, 2013 and 2012
9
1. General Information
Daekyo Co., Ltd. (the "Company") and its subsidiaries (collectively referred to as “the Group”) are
engaged in educational and cultural work. The Company was incorporated in December 1986, to
engage in the publication, manufacturing and sales of home-school materials. The Company, as
an education and culture company, provides various products and educational services such as
the Noonnoppi education, pre-school education, publishing, educational institutions, home-based
teaching, on-line education, and after-school teaching.
In February 2004, the Company listed its shares on the KRX KOSPI Market of the Korean
Exchange. As of December 31, 2013, the majority shareholder, Daekyo Holdings Co., Ltd. owns
54.5% of the Company.
1.1 Subsidiaries
Percentage of ownership (%)
December 31, 2013 December 31, 2012
Subsidiaries Location
Controlling
interest
Non-
controlling
interest
Controlling
interest
Non-
controlling
interest
Closing
Month
Major
Business
Daekyo Edupia Co., Ltd. Korea 97.41 2.59 97.41 2.59 December Education
BSCK (formerly, Daekyo Bookscan
Co., Ltd.)
Korea
- - 100.00 -
December Book sales
Daekyo Book Center Co., Ltd. Korea 97.93 2.07 97.93 2.07 December Book sales
Daekyo CSA Co., Ltd. Korea 70.00 30.00 70.00 30.00 December Education
Daekyo Edu camp Co., Ltd.
(formerly, DK Educamp Co., Ltd.)
Korea
98.36 1.64 98.36 1.64
December Education
Daekyo New Development
Investment Association.
Korea
80.00 20.00 80.00 20.00
December Investment
Daekyo America, Inc. America 50.06 49.94 50.06 49.94 December Education
Daekyo Hong Kong Co., Ltd. 1 China 47.89 52.11 47.89 52.11 December Education
Beijing Daekyo Co., Ltd. China 100.00 - 100.00 - December Education
Daekyo Malaysia Sdn. Bhd. Malaysia 100.00 - 100.00 - December Education
Shanghai Daekyo Co., Ltd. China 100.00 - 100.00 - December Education
P.T Daekyo Indonesia Indonesia 99.77 0.23 99.71 0.29 December Education
Daekyo Enopi Singapore PTE Ltd. Singapore 100.00 - 100.00 - December Education
Heungkuk Altoran Securities Private
Investment Trust
Korea
66.22 33.78 - -
December Investment
Hyundai Advantage Private Equity 5 Korea 100.00 - - - December Investment
Truston Private Securities
Investment Trust 4
Korea
100.00 - - -
December Investment
Hanwha Quant Long-short Private
Securities Investment Trust 1
Korea
100.00 - - -
December Investment
1 Although the Group has less than 50% of the voting power in the investee, it is included in subsidiaries as
the Group has a right to appoint the majority of its Board of Directors.

Daekyo Co., Ltd. and Subsidiaries Notes to the Consolidated Financial Statements December 31, 2013 and 2012
10
1.2 Summary of Financial Information of Consolidated Subsidiaries
Summary of financial position and comprehensive income of consolidated subsidiaries as of and
for the years ended December 31, 2013 and 2012, is as follows:
(in millions of Korean won)
December 31, 2013 December 31, 2012
Assets Liabilities Equity Assets Liabilities Equity
Daekyo Edupia Co., Ltd.
11,806
17,225
(5,419)
13,550
14,284
(734)
Daekyo Book Center Co., Ltd.
5,613
3,962
1,651
6,143
4,492
1,651
Daekyo CSA Co., Ltd.
157
140
17
1,279
1,206
73 Daekyo Edu camp Co., Ltd.
(formerly, DK Educamp Co.,
Ltd.)
21,700
20,413
1,287
28,579
24,178
4,401
Daekyo New Development
Investment Association.
9,411
3
9,408
4,624
110
4,514
Daekyo America, Inc.
21,009
20,097
912
25,187
17,375
7,812
Daekyo Hong Kong Co., Ltd.
6,239
2,313
3,926
5,059
2,363
2,696
Beijing Daekyo Co., Ltd.
269
62
207
259
48
211
Daekyo Malaysia Sdn. Bhd.
1,831
1,571
260
2,943
1,984
959
Shanghai Daekyo Co., Ltd.
1,654
167
1,487
1,713
101
1,612
P.T Daekyo Indonesia
1,147
950
197
1,113
717
396
Daekyo Enopi Singapore PTE
Ltd.
967
203
764
130
57
73
Heungkuk Altoran Securities
Private Investment Trust
11,162
4
11,158
-
-
-
Hyundai Advantage Private
Equity 5
10,189
58
10,131
-
-
-
Truston Private Securities
Investment Trust 4
4,670
7
4,663
-
-
-
Hanwha Quant Long-short
Private Securities Investment
Trust 1
5,046
7
5,039
-
-
-

Daekyo Co., Ltd. and Subsidiaries Notes to the Consolidated Financial Statements December 31, 2013 and 2012
11
(in millions of Korean won)
2013 2012
Sales Net income
(loss) Comprehensive
income Sales Net income
(loss) Comprehensive
income
Daekyo Edupia Co., Ltd.
14,767
(4,665)
(4,685)
17,953
(6,265)
(6,449)
Daekyo Book Center Co., Ltd.
10,667
(9)
-
12,630
(43)
(51)
Daekyo CSA Co., Ltd.
7,416
(56)
(56)
9,715
(1,349)
(1,418) Daekyo Edu camp Co., Ltd.
(formerly, DK Educamp Co.,
Ltd.)
46,734
(3,006)
(3,114)
54,800
(158)
(206)
Daekyo New Development
Investment Association.
-
(1,106)
(1,106)
-
(403)
(403)
Daekyo America, Inc.
7,341
(7,040)
(6,900)
6,424
(3,898)
(4,488)
Daekyo Hong Kong Co., Ltd.
5,330
1,472
1,377
4,856
1,138
957
Beijing Daekyo Co., Ltd.
148
(7)
(4)
150
(159)
(175)
Daekyo Malaysia Sdn. Bhd.
2,110
(672)
(699)
1,988
131
87
Shanghai Daekyo Co., Ltd.
460
(149)
(125)
503
(351)
(458)
P.T Daekyo Indonesia
647
(463)
(537)
546
(220)
(267)
Daekyo Enopi Singapore PTE
Ltd.
362
(373)
(437)
218
(332)
(328)
Heungkuk Altoran Securities
Private Investment Trust
-
225
276
-
-
-
Hyundai Advantage Private
Equity 5
-
(160)
131
-
-
-
Truston Private Securities
Investment Trust 4
-
(569)
(337)
-
-
-
Hanwha Quant Long-short
Private Securities Investment
Trust 1
-
(23)
23
-
-
-
1.3 Changes in the Scope of Consolidation
Subsidiaries newly included in the consolidation for the year ended December 31, 2013 are as
follows:
Name of a company Reason
Heungkuk Altoran Securities Private Investment Trust Newly acquired
Hyundai Advantage Private Equity 5 Newly acquired
Truston Private Securities Investment Trust 4 Newly acquired
Hanwha Quant Long-short Private Securities Investment Trust 1 Newly acquired
For the year ended December 31, 2013, BSCK (formerly Daekyo Bookscan Co., Ltd.) was
excluded from the consolidation due to liquidation.

Daekyo Co., Ltd. and Subsidiaries Notes to the Consolidated Financial Statements December 31, 2013 and 2012
12
2. Significant Accounting Policies
The principal accounting policies applied in the preparation of these consolidated financial
statements are set out below. These policies have been consistently applied to all the periods
presented, unless otherwise stated.
2.1 Basis of Preparation
The Group’s financial statements are prepared in accordance with the International Financial
Reporting Standards as adopted by the Republic of Korea (“Korean-IFRS”). These are the
standards, subsequent amendments and related interpretations issued by the International
Accounting Standards Board ("IASB") that have been adopted by the Republic of Korea.
The preparation of the consolidated financial statements requires the use of certain critical
accounting estimates. It also requires management to exercise judgment in the process of
applying the Group’s accounting policies. The areas involving a higher degree of judgment or
complexity, or areas where assumptions and estimates are significant to the consolidated financial
statements are disclosed in Note 3.
2.1.1 Changes in Accounting Policy and Disclosures
(a) New and amended standards adopted by the Group
The Group newly applied the following amended and enacted standards for the annual period
beginning on January 1, 2013:
- Amendment to Korean IFRS 1001, Presentation of Financial Statements: Presentation of Items
of Other Comprehensive Income
The amendment requires entities to group items presented in other comprehensive income based
on whether they are potentially reclassifiable to profit or loss subsequently. The Group applies the
amendment retroactively and there is no impact of the application of this amendment on its total
comprehensive income or loss.
- Amendment to Korean IFRS 1019, Employee Benefits
The amendment requires entities to immediately recognize all actuarial gains and losses incurred
in other comprehensive income or loss. All past service costs incurred are immediately recognized
in accordance with the change of the plan, and the previous separate calculation of the interest
cost and the expected returns on plan assets has been revised to calculate net interest expense
(income) by applying the discount rate used in the defined benefit obligation measurement in the
net defined benefit liabilities (assets). There is no material impact of the application of this
amendment on the consolidated financial statements.

Daekyo Co., Ltd. and Subsidiaries Notes to the Consolidated Financial Statements December 31, 2013 and 2012
13
- Korean IFRS 1110, Consolidated Financial Statements
Korean IFRS 1110, Consolidated Financial Statements, introduces a single control concept and
provides a specific guidance for the control. The adoption of this standard does not have an
impact on consolidation scope in the consolidated financial statements.
- Korean IFRS 1111, Joint Arrangements
Korean IFRS 1111, Joint Arrangements, reflects the substance of joint arrangements and focuses
on the rights and obligations of the parties to the joint arrangements rather than on the legal forms
of the arrangements. Joint arrangements are classified into joint operations or joint ventures. The
adoption of this standard does not have an material impact on the consolidated financial
statements.
- Korean IFRS 1112, Disclosures of Interests in Other Entities
Korean IFRS 1112, Disclosure of Interests in Other Entities, provides disclosure requirements for
all types of equity investments in other entities including subsidiaries, associates, joint ventures
and unconsolidated structured entities.
- Korean IFRS 1113, Fair Value Measurement
Korean IFRS 1113, Fair Value Measurement, provides a precise definition of fair value, and a
single source of fair value measurement and disclosure requirements for use across K-IFRS. The
Group has applied this standard prospectively according to the transitional provisions of K-IFRS
1113 and there is no material impact of the application of this standard on the consolidated
financial statements.
(b) New standards and interpretations not yet adopted
New standards, amendments and interpretations issued but not effective for the financial year
beginning January 1, 2013, and not early adopted by the Group are as follows:
- Amendment to Korean IFRS 1110, Consolidated Financial Statements
Amendment to Korean IFRS 1110, Consolidated Financial Statements, provides that, if a parent
company qualifies as an investment entity, it is required to measure its investments in subsidiaries
at fair value through profit and loss instead of consolidating these subsidiaries in its consolidated
financial statements. The amendment does not apply for a parent of an investment entity if the
parent itself is not an investment entity. This amendment is effective for annual periods beginning
on or after January 1, 2014, with early adoption permitted. The Group expects that the application
of this amendment would not have a material impact on its consolidated financial statements.

Daekyo Co., Ltd. and Subsidiaries Notes to the Consolidated Financial Statements December 31, 2013 and 2012
14
- Amendment to Korean IFRS 1032, Financial Instruments: Presentation
Amendment to Korean IFRS 1032, Financial Instruments: Presentation, provides that the right to
offset must not be contingent on a future event and must be legally enforceable in all of
circumstances; and if an entity can settle amounts in a manner such that outcome is, in effect,
equivalent to net settlement, the entity will meet the net settlement criterion. This amendment is
effective for annual periods beginning on or after January 1, 2014, and the Group is assessing the
impact of application of this amendment on its consolidated financial statements.
- Amendment to Korean IFRS 1039, Financial Instruments: Recognition and Measurement
Amendment to Korean IFRS 1039, Financial Instruments: Recognition and Measurement, allows
the continuation of hedge accounting for a derivative that has been designated as a hedging
instrument in a circumstance in which that derivative is novated to a central counterparty (CCP) as
a consequence of laws or regulations. This amendment is effective for annual periods beginning
on or after January 1, 2014, with early adoption permitted. The Group expects that the application
of this amendment would not have impact on its consolidated financial statements.
- Enactment of Korean IFRS 2121, Levies
Korean IFRS 2121, Levies, are applied to a liability to pay a levy imposed by a government in
accordance with the legislation. The interpretation requires that the liability to pay a levy is
recognized when the activity that triggers the payment of the levy occurs, as identified by the
legislation (the obligating event). This interpretation is effective for annual periods beginning on or
after January 1, 2014, with early adoption permitted. The Group expects that the application of this
interpretation would not have a material impact on its consolidated financial statements.
2.2 Consolidation
The Group has prepared the consolidated financial statements in accordance with Korean IFRS
1110, Consolidated Financial Statements.
(a) Subsidiaries
Subsidiaries are all entities (including special purpose entities) over which the Company has
control. The Company controls the corresponding investee when it is exposed, or has rights, to
variable returns from its involvement with the investee and has the ability to affect those returns
through its power over the investee. Consolidation of a subsidiary begins from the date the
Company obtains control of a subsidiary and ceases when the Company loses control of the
subsidiary.
The Group applies the acquisition method to account for business combinations. The
consideration transferred is measured at the fair values of the assets transferred, and identifiable
assets acquired and liabilities and contingent liabilities assumed in a business combination are

Daekyo Co., Ltd. and Subsidiaries Notes to the Consolidated Financial Statements December 31, 2013 and 2012
15
initially measured at their fair values at the acquisition date. The Group recognizes any non-
controlling interest in the acquiree on an acquisition-by-acquisition basis in the event of liquidation,
either at fair value or at the non-controlling interest’s proportionate share of the recognized
amounts of acquiree’s identifiable net assets. All other non-controlling interests are measured at
their acquisition-date fair values, unless another measurement basis is required by IFRSs.
acquisition-related costs are expensed as incurred.
Goodwill is recognized as the excess of the aggregate of the consideration transferred, the
amount of any non-controlling interest in the acquiree, and the acquisition-date fair value of the
acquirer’s previously held equity interest in the acquiree over the identifiable net assets acquired.
If this consideration is lower than the fair value of the net assets of the subsidiary acquired, the
difference is recognized in profit or loss.
Balances of receivables and payables, income and expenses and unrealized gains on
transactions between the Group subsidiaries are eliminated. Accounting policies of subsidiaries
have been changed where necessary to ensure consistency with the policies adopted by the
Group.
(b) Changes in ownership interests in subsidiaries without change of control
In transactions with non-controlling interests, which do not result in loss of control, the Group
recognizes directly in equity any difference between the amount by which the non-controlling
interests are adjusted and the fair value of the consideration paid or received, and attribute it to
the owners of the parent.
(c) Disposal of subsidiaries
If the Group loses control of a subsidiary, any investment continuously retained in the subsidiary is
re-measured at its fair value at the date when control is lost and any resulting differences are
recognized in profit or loss.
(d) Associates
Associates are all entities over which the Group has significant influence, and investments in
associates are initially recognized at acquisition cost using the equity method. Unrealized gains on
transactions between the Group and its associates are eliminated to the extent of the Group’s
interest in the associates. If there is any objective evidence that the investment in the associate is
impaired, the Group recognizes the difference between the recoverable amount of the associate
and its book value as impairment loss.

Daekyo Co., Ltd. and Subsidiaries Notes to the Consolidated Financial Statements December 31, 2013 and 2012
16
2.3 Segment Reporting
Information of each operating segment is reported in a manner consistent with the business
segment reporting provided to the chief operating decision-maker (Note 6). The chief operating
decision-maker, who is responsible for allocating resources and assessing performance of the
operating segments, has been identified as the steering committee that makes strategic decisions.
2.4 Foreign Currency Translation
(a) Functional and presentation currency
Items included in the financial statements of each of the Group’s entities are measured using the
currency of the primary economic environment in which the each entity operates (the “functional
currency’). The consolidated financial statements are presented in Korean won, which is the
Controlling Company’s functional and presentation currency.
(b) Transactions and balances
Foreign currency transactions are translated into the functional currency using the exchange rates
prevailing at the dates of the transactions or valuation where items are re-measured. Foreign
exchange gains and losses resulting from the settlement of such transactions and from the
translation at year-end exchange rates of monetary assets and liabilities denominated in foreign
currencies are recognized in profit or loss, except when deferred in other comprehensive income
as qualifying cash flow hedges.
Foreign exchange gains and losses that relate to borrowings and cash and cash equivalents are
presented in ‘financial income or expenses’ in the statement of income. All other foreign exchange
gains and losses are presented in ‘other non-operating income and expenses’ in the statement of
income.
Changes in the fair value of monetary securities denominated in foreign currency classified as
available-for-sale are analyzed between translation differences resulting from changes in the
amortized cost of the security and other changes in the carrying amount of the security.
Translation differences related to changes in amortized cost are recognized in profit or loss, and
other changes in carrying amount are recognized in other comprehensive income.
Exchange differences arising on non-monetary financial assets and liabilities such as equity
instruments at fair value through profit or loss and available-for-sale equity instruments are
recognized in profit or loss and included in other comprehensive income, respectively, as part of
the fair value gain or loss.

Daekyo Co., Ltd. and Subsidiaries Notes to the Consolidated Financial Statements December 31, 2013 and 2012
17
(c) Translation to presentation currency
The financial performance and financial position of all Group entities whose functional currency is
different from the presentation currency are translated into the presentation currency as follows:
assets and liabilities for each statement of financial position presented are translated at the
closing rate at the end of the reporting period;
income and expenses for each statement of income are translated at average exchange
rates; and
all resulting exchange differences are recognized in other comprehensive income.
When the Company ceases to control the subsidiary, the cumulative exchange differences that
were recorded in equity are recognized in the statement of income as part of the gain or loss on
sale.
Goodwill and fair value adjustments arising on the acquisition of a foreign entity are treated as
assets and liabilities of the foreign entity and translated at the closing rate. Exchange differences
arising are recognized in other comprehensive income.
2.5 Cash and Cash Equivalents
Cash and cash equivalents include cash in hand, deposits held at call with banks, and other short-
term highly liquid investments with original maturities of three months or less.
2.6 Financial Assets
(a) Classification and measurement
The Group classifies its financial assets in the following categories: financial assets at fair value
through profit or loss, available-for-sale financial assets, loans and receivables, and held-to-
maturity financial assets. Regular purchases and sales of financial assets are recognized on trade
date.
For hybrid (combined) instruments, the Group is unable to measure an embedded derivative
separately from its host contract and therefore, the entire hybrid (combined) contract is classified
as at fair value through profit or loss. The financial assets designated as at fair value through profit
or loss by the Group are equity-linked securities.
Regular purchases and sales of financial assets are recognized on the trade date. At initial
recognition, financial assets are measured at fair value plus, in the case of financial assets not
carried at fair value through profit or loss, transaction costs. Transaction costs of financial assets
carried at fair value through profit or loss are expensed in the statement of income. After the initial
recognition, available-for-sale financial assets and financial assets at fair value through profit or
loss are subsequently carried at fair value. Loans and receivables, and held-to-maturity

Daekyo Co., Ltd. and Subsidiaries Notes to the Consolidated Financial Statements December 31, 2013 and 2012
18
investments are subsequently carried at amortized cost using the effective interest rate method.
Changes in fair value of financial assets at fair value through profit or loss are recognized in profit
or loss and changes in fair value of available-for-sale financial assets are recognized in other
comprehensive income. When the available-for-sale financial assets are sold or impaired, the fair
value adjustments recorded in equity are reclassified into profit or loss.
(b) Impairment
The Group assesses at the end of each reporting period whether there is objective evidence that a
financial asset or a group of financial assets is impaired. A financial asset or a group of financial
assets is impaired and impairment losses are incurred only if there is objective evidence of
impairment as a result of one or more events that occurred after the initial recognition of the asset
(a ‘loss event’) and that loss event (or events) has an impact on the estimated future cash flows of
the financial asset or a group of financial assets that can be reliably estimated.
Impairment of loans and receivables is presented as a deduction in an allowance account.
Impairment of other financial assets is directly deducted from their carrying amount. The Group
writes off financial assets when the assets are determined to be no longer recoverable.
The objective evidence that a financial asset is impaired includes significant financial difficulty of
the issuer or obligor; a delinquency in interest or principal payments; or the disappearance of an
active market for that financial asset because of financial difficulties.
(c) Derecognition
If the Group transfers a financial asset and the transfer does not result in derecognition because
the Group has retained substantially of all risks and rewards of ownership of the transferred asset
due to a recourse in the event the debtor defaults, the Group continues to recognize the
transferred asset in its entirety and recognizes a financial liability for the consideration received.
The related financial liability is classified as ‘borrowings’ in the statement of financial position.
2.7 Derivative Instruments
Derivatives are initially recognized at fair value on the date when a derivative contract is entered
into and are subsequently re-measured at their fair value. Changes in the fair value of the
derivatives that are not qualified for hedge accounting are recognized in the statement of income
within 'other income (expenses)' or 'finance income (expenses)' according to the nature of
transactions.

Daekyo Co., Ltd. and Subsidiaries Notes to the Consolidated Financial Statements December 31, 2013 and 2012
19
2.8 Trade Receivables
Trade receivables are amounts due from customers for merchandise sold or services performed in
the ordinary course of business. If collection is expected in one year or less, they are classified as
current assets. If not, they are presented as non-current assets. Trade receivables are recognized
initially at fair value and subsequently measured at amortized cost using the effective interest
method, less allowance for doubtful accounts.
2.9 Inventories
Inventories are stated at the lower of cost and net realizable value. Cost is determined using the
moving average method.
2.10 Non-current Assets (or disposal group) Held for Sale
Non-current assets (or disposal group) are classified as ‘non-current assets held-for-sale’ (or
assets of disposal group classified as held for sale) when their carrying amount is to be recovered
principally through a sale transaction and a sale is considered highly probable. They are stated at
the lower of carrying amount and fair value less costs to sell.
2.11 Property, Plant and Equipment
All property, plant and equipment are stated at historical cost less depreciation and accumulated
impairment loss. Historical cost includes expenditures directly attribute to the acquisition of the
items.
Subsequent costs are included in the asset’s carrying amount or recognized as a separate asset,
as appropriate, only when it is probable that future economic benefits associated with the item will
flow to the Group and the cost of the item can be measured reliably. The carrying amount of the
replaced part is derecognized. All other repairs and maintenance are charged to the statement of
income during the financial period in which they are incurred.
Land, standing timber and construction-in-progress are not depreciated. Depreciation on other
assets is calculated using the straight-line method to allocate the difference between their cost
and their residual values over their estimated useful lives, as follows:
Buildings 40 - 60 years
Structures 3 - 40 years
Machinery 4 - 5 years
Vehicles 2 - 10 years
Tools 2 - 6 years
Supplies 2 - 17 years
Equipment 5 years

Daekyo Co., Ltd. and Subsidiaries Notes to the Consolidated Financial Statements December 31, 2013 and 2012
20
The assets’ depreciation method, residual values and useful lives are reviewed, and adjusted if
appropriate, at the end of each reporting period. An asset’s carrying amount is written down
immediately to its recoverable amount if the asset’s carrying amount is greater than its estimated
recoverable amount. Gains and losses on disposals are determined by comparing the proceeds
with the carrying amount and are recognized within ‘other income and expenses’ in the statement
of income.
2.12 Borrowing Costs
Borrowing costs incurred in the acquisition or construction of a qualifying asset are capitalized in
the period when it is prepared for its intended use, and investment income earned on the
temporary investment of borrowings made specifically for the purpose obtaining a qualifying
asset is deducted from the borrowing costs eligible for capitalization during the period. Other
borrowing costs are recognized as expenses for the period in which they are incurred.
2.13 Investment Property
Property held to earn rentals or for capital appreciation or both is classified as investment property.
Investment property is measured initially at its cost. After recognition as an asset, investment
property is carried at cost less accumulated depreciation and impairment losses. Investment
property, except for land, is depreciated using the straight-line method over their useful lives from
40 to 60 years.
2.14 Intangible Assets
(a) Goodwill
Goodwill is measured as explained in Note 2.2 and goodwill arising on the acquisition of
subsidiaries and business is included in intangible assets. Goodwill is tested annually for
impairment and carried at cost less accumulated impairment losses. Impairment losses on
goodwill are not reversed. Gains and losses on the disposal of an entity include the carrying
amount of goodwill relating to the entity sold.
For the purpose of impairment testing, goodwill acquired in a business combination is allocated to
each of the CGUs, or group of CGUs, that is expected to benefit from the synergies of the
combination.
Goodwill impairment reviews are undertaken annually or more frequently if events or changes in
circumstances indicate a potential impairment. The carrying value of goodwill is compared to the
recoverable amount, which is the higher of value in use and the fair value less costs to sell. Any
impairment is recognized immediately as an expense and is not subsequently reversed.

Daekyo Co., Ltd. and Subsidiaries Notes to the Consolidated Financial Statements December 31, 2013 and 2012
21
(b) Membership rights
Membership rights are regarded as intangible assets with indefinite useful life and not amortized
because there is no foreseeable limit to the period over which the asset is expected to be utilized.
(c) Development Costs
Expenditure on research is expensed as incurred. Development costs which are individually
identifiable and directly related to a new technology or to new products which carry probable
future economic benefits are recognized as intangible assets when all the following criteria are
met:
It is technically feasible to complete the intangible asset so that it will be available for use or
sale;
Management intends to complete the intangible asset and use or sell it;
There is the ability to use or sell the intangible asset;
It can be demonstrated how the intangible asset will generate probable future economic
benefits;
Adequate technical, financial and other resources to complete the development and to use
or sell the intangible asset are available; and
The expenditure attributable to the intangible asset during its development can be reliably
measured.
Other development expenditures that do not meet these criteria are expensed as incurred.
Development costs previously recognized as an expense are not recognized as an asset in a
subsequent period. Capitalized development costs stated as intangible assets are amortized using
the straight-line method over their estimated useful lives when the assets are available for using or
selling and are tested for impairment.
(d) Other intangible assets
Other intangible assets such as industrial property rights, right to use donated assets and software
which meet the definition of an intangible asset are amortized using the following amortization
method and estimated useful lives when the asset is available for use.
Estimated Useful Lives Amortization Method
Industrial property rights 5 - 10 years Straight-line method
Software 4 - 5 years Straight-line method
Other intangible assets 1 - 15 years Straight-line method
Right to use donated assets 1 - 4 years Straight-line method

Daekyo Co., Ltd. and Subsidiaries Notes to the Consolidated Financial Statements December 31, 2013 and 2012
22
2.15 Government Grants
Grants from a government are recognized at their fair value where there is a reasonable
assurance that the grant will be received and the Group will comply with all attached conditions.
Government grants related to income are deferred and recognized in the statement of income over the period necessary to match them with the costs that they are intended to compensate.
Government grants related to property, plant and equipment are presented as a deduction of
related assets and are credited to depreciation over the expected lives of the related assets.
2.16 Impairment of Non-financial Assets
Goodwill or intangible assets with indefinite useful lives are not subject to amortization and are
tested annually for impairment. Assets that are subject to amortization are reviewed for
impairment whenever events or changes in circumstances indicate that the carrying amount may
not be recoverable. An impairment loss is recognized for the amount by which the asset’s carrying
amount exceeds its recoverable amount. The recoverable amount is the higher of an asset’s fair
value less costs to sell and value in use. For the purposes of assessing impairment, assets are
grouped at the lowest levels for which there are separately identifiable cash flows (cash-
generating units). Non-financial assets, other than goodwill, that suffered an impairment are
reviewed for possible reversal of the impairment at each reporting date.
2.17 Financial Liabilities
(a) Classification and measurement
Financial liabilities at fair value through profit or loss are financial instruments held for trading.
Financial liabilities are classified in this category if incurred principally for the purpose of
repurchasing them in the near term. Derivatives that are not designated as hedges or bifurcated
from financial instruments containing embedded derivatives are also categorized as held-for-
trading.
The Group classifies non-derivative financial liabilities, except for financial liabilities at fair value
through profit or loss, financial guarantee contracts and financial liabilities that arise when a
transfer of financial assets does not qualify for derecognition, as financial liabilities carried at
amortized cost and presented as ‘trade payables’, ‘other payables’, ‘borrowings’, and ‘other
financial liabilities’ in the statement of financial position.
(b) Derecognition
Financial liabilities are removed from the statement of financial position when it is extinguished, for
example, when the obligation specified in the contract is discharged, cancelled or expired or when
the terms of an existing financial liability are substantially modified.

Daekyo Co., Ltd. and Subsidiaries Notes to the Consolidated Financial Statements December 31, 2013 and 2012
23
2.18 Trade Payables
Trade payables are obligations to pay for goods or services that have been acquired in the
ordinary course of business from suppliers. Trade payables are classified as current liabilities if
payment is due within one year or less. If not, they are presented as non-current liabilities. Trade
payables are recognized initially at fair value and subsequently measured at amortized cost using
the effective interest method.
2.19 Borrowings
Borrowings are recognized initially at fair value, net of transaction costs incurred. Borrowings are
subsequently carried at amortized cost; any difference between the proceeds (net of transaction
costs) and the redemption value is recognized in the statement of income over the period of the
borrowings using the effective interest method. The Group classifies the liability as current as long
as it does not have an unconditional right to defer its settlement for at least 12 months after the
reporting date.
2.20 Provisions
Provisions are recognized when the Group has a present legal or constructive obligation as a
result of past events and an outflow of resources required to settle the obligation is probable and
can be reliably estimated. Provisions are not recognized for future operating losses. The Group
recognises the sales return provision for the estimated sales return based on historical results.
2.21 Current and Deferred Income Tax
The tax expense for the period comprises current and deferred tax. Tax is recognized in the
statement of income, except to the extent that it relates to items recognized in other
comprehensive income or directly in equity. In this case, the tax is also recognized in other
comprehensive income or directly in equity.
Management periodically evaluates positions taken in tax returns with respect to situations in
which applicable tax regulation is subject to interpretation. It establishes provisions where
appropriate on the basis of amounts expected to be paid to the tax authorities.
Deferred income tax is recognized on temporary differences arising between the tax bases of
assets and liabilities and their carrying amounts in the consolidated financial statements. It
represents future tax consequences that will arise when recovering or settling the carrying amount
of its assets and liabilities. However, the deferred income tax is not accounted for if it arises from
initial recognition of an asset or liability in a transaction other than a business combination that at
the time of the transaction affects neither accounting nor tax profit or loss. Deferred income tax is
determined using tax rates and laws that have been enacted or substantially enacted by the end
of the reporting period and are expected to apply when the related deferred income tax asset is
realized or the deferred income tax liability is settled.

Daekyo Co., Ltd. and Subsidiaries Notes to the Consolidated Financial Statements December 31, 2013 and 2012
24
Deferred income tax assets are recognized only to the extent that it is probable that future taxable
profit will be available against which the temporary differences can be utilized.
Deferred income tax liabilities are provided on temporary differences arising on investments in
subsidiaries, associates and joint ventures, except where the timing of the reversal of the
temporary difference is controlled by the Group and it is probable that the temporary difference will
not reverse in the foreseeable future. Deferred income tax assets are recognized only to the
extent that it is probable that the temporary difference will reverse in the foreseeable future and
taxable profit will be available against which the temporary difference can be utilized.
Deferred income tax assets and liabilities are offset when there is a legally enforceable right to
offset current tax assets against current tax liabilities and when the deferred income taxes assets
and liabilities relate to income taxes levied by the same taxation authority on either the same
taxable entity or different taxable entities where there is an intention to settle the balances on a
net basis.
2.22 Employee Benefits
(a) Post-employment benefits
The Group companies operate various pension schemes. The schemes are generally funded
through payments to insurance companies or trustee-administered funds, determined by periodic
actuarial calculations. The Group has both defined benefit and defined contribution plans.
A defined contribution plan is a pension plan under which the Group pays fixed contributions into a
separate entity. The Group has no legal or constructive obligations to pay further contributions if
the fund does not hold sufficient assets to pay all employees the benefits relating to employee
service in the current and prior periods. For defined contribution plans, the Group pays
contributions to publicly or privately administered pension insurance plans on a mandatory,
contractual or voluntary basis. The Group has no further payment obligations once the
contributions have been paid. The contributions are recognized as employee benefit expense
when employees render services. Prepaid contributions are recognized as an asset to the extent
that a cash refund or a reduction in the future payments is available.
A defined benefit plan is a pension plan that is not a defined contribution plan. Typically defined
benefit plans define an amount of pension benefit that an employee will receive on retirement,
usually dependent on one or more factors such as age, years of service and compensation. The
liability recognized in the statement of financial position in respect of defined benefit pension plans
is the present value of the defined benefit obligation at the end of the reporting period less the fair
value of plan assets. The defined benefit obligation is calculated annually by independent
actuaries using the projected unit credit method. The present value of the defined benefit
obligation is determined by discounting the estimated future cash outflows using interest rates of
high-quality corporate bonds that are denominated in the currency in which the benefits will be
paid, and that have terms to maturity approximating to the terms of the related pension liability.

Daekyo Co., Ltd. and Subsidiaries Notes to the Consolidated Financial Statements December 31, 2013 and 2012
25
The remeasurements of the net defined benefit liability are recognized in other comprehensive
income.
If any plan amendments, curtailments, or settlements occur, past service costs or any gains or
losses on settlement are recognized as profit or loss for the year.
(b) Share-based payments
The Group operates equity-settled, share-based compensation plans, under which the Group
receives services from employees as consideration for equity instruments (options) of the Group.
The fair value of the employee services received in exchange for the grant of the options is
recognized as an expense. The total amount to be expensed is determined by reference to the fair
value of the options granted. The Group makes payments with its treasury shares when the
options are exercised.
2.23 Share Capital
Ordinary shares and preferred shares that are not mandatorily redeemable are classified as equity.
Where the Company purchases its own equity share capital (treasury shares), the consideration
paid, including any directly attributable incremental costs is deducted from equity attributable to
owners of the parent until the shares are cancelled or reissued. Where such ordinary shares are
subsequently reissued, any consideration received is included in equity attributable to owners of
the parent.
2.24 Revenue Recognition
Revenue comprises the fair value of the consideration received or receivable for the sales of
goods and services rendered in the ordinary course of the Group’s activities. Revenue is
presented net of value-added tax, returns and discounts, after eliminating sales within the Group.
The Group recognizes revenue when the amount of revenue can be reliably measured; when it is
probable that future economic benefits will flow to the entity; and when specific criteria have been
met for each of the Group’s activities, as described below. The Group bases its estimate on
historical results, taking into consideration the type of customer, the type of transaction and the
specifics of each arrangement.
(a) Sales of goods
The Group sells reference books, collections, publications and others. Sales of goods are
recognized when products are delivered to the purchaser. Delivery does not occur until the
products have been shipped to the specified location, the risks of obsolescence and loss have
been transferred to the wholesaler, and either the purchaser has accepted the products in
accordance with the sales contract, the acceptance provisions have lapsed or the Group has

Daekyo Co., Ltd. and Subsidiaries Notes to the Consolidated Financial Statements December 31, 2013 and 2012
26
objective evidence that all criteria for acceptance have been satisfied.
(b) Sales of services
Revenue is generally recognized on a straight-line basis over the period the service is rendered
when weekly home-school services are provided. For the rest of services, revenue is recognized
by reference to the stage of completion in accordance with the substance of the relevant
agreements.
(c) Interest income
Interest income is recognized using the effective interest method according to the time passed.
When a loan and receivable is impaired, the Group recognizes the difference between the
carrying amount and its recoverable amount as impairment loss and continues unwinding the
discount as interest income. Interest income on impaired loans and receivables is recognized
using the original effective interest rate.
(d) Dividend income
Dividend income is recognized when the right to receive payment is established.
(e) Royalty income
Royalty income is recognized on an accrual basis in accordance with the substance of the
relevant agreements.
2.25 Lease
Leases in which a substantial portion of the risks and rewards of ownership are retained by the
leassor are classified as operating leases. Payments made under operating leases are charged to
the statement of income on a straight-line basis over the period of the lease.
2.26 Dividend Distribution
Dividend distribution to the Company’s shareholders is recognized as a liability in the financial
statements in the period in which the dividends are approved by the Company’s shareholders.

Daekyo Co., Ltd. and Subsidiaries Notes to the Consolidated Financial Statements December 31, 2013 and 2012
27
3. Critical Accounting Estimates and Judgments
The Group makes estimates and assumptions concerning the future. The resulting accounting
estimates will, by definition, seldom equal the related actual results. Estimations and assumptions
are continuously evaluated with consideration to factors such as events reasonably predictable in
the foreseeable future within the present circumstance according to historical experience. The
estimates and assumptions that have a significant risk of causing a material adjustment to the
carrying amounts of assets and liabilities within the next financial year are addressed below.
(a) Estimated impairment of goodwill
The Group tests annually whether goodwill has suffered any impairment in accordance with the
accounting policy stated in Note 2.16. The recoverable amounts of cash-generating units have
been determined based on value-in-use calculations. These calculations require the use of
estimates.
(b) Income taxes
The Group is operating in numerous countries and the income generated from these operations is
subject to income taxes based on tax laws and interpretations of tax authorities in numerous
jurisdictions. There are many transactions and calculations for which the ultimate tax
determination is uncertain. The Group recorded, based on its best estimate, current taxes and
deferred taxes that the Group will be liable in the future for the operating results as of the financial
year end. However, the final tax outcome in the future may be different from the amounts that
were initially recorded. Such differences will impact the current and deferred income tax assets
and liabilities in the period in which such determination is made.
(c) Fair value of financial instruments
The fair value of financial instruments that are not traded in an active market is determined by
using valuation techniques. The Group uses its judgment to select a variety of methods and make
assumptions that are mainly based on market conditions existing at the end of each reporting
period.
(d) Provisions
As described in Note 20, the Group recognizes provisions for estimated returns as of the reporting
date. The amounts are estimated based on historical data.
(e) Net defined benefit liability
The present value of the defined benefit liability depends on a number of factors that are
determined on an actuarial basis using a number of assumptions. The assumptions used in
determining the net cost (income) for pensions include the discount rate. Any changes in these
assumptions will impact the carrying amount of the defined benefit liability. The Group determines

Daekyo Co., Ltd. and Subsidiaries Notes to the Consolidated Financial Statements December 31, 2013 and 2012
28
the appropriate discount rate at the end of each year. This is the interest rate that is used to
determine the present value of estimated future cash outflows expected to be required to settle
the defined benefit liability. In determining the appropriate discount rate, the Group considers the
interest rates of high-quality corporate bonds that are denominated in the currency in which the
pension benefits will be paid, and that have terms to maturity approximating to the terms of the
related pension liability. Other key assumptions for defined benefit liability are based in part on
current market conditions. Additional information is disclosed in Note 22.
4. Financial Risk Management
4.1 Financial Risk Factors
The Group’s activities expose it to a variety of financial risks: market risk (interest rate risk and
price risk), credit risk and liquidity risk. The Group’s overall risk management program focuses on
the unpredictability of financial markets and seeks to minimize potential adverse effects on the
Group’s financial performance.
Risk management is carried out by the Group’s financial management department under policies
approved by the board of directors. The Group’s treasury department identifies evaluates and
hedges financial risks in close co-operation with the Group’s operating units.
(a) Market risk
i) Interest rate risk
The interest rate risk is the risk that interest expenses arising from borrowings would fluctuate
because of changes in market interest rates in the future. The risk mainly arises from borrowings
with variable interest rates. The Group holds all fixed rate financial deposits and therefore there is
no effect on the net income or net asset due to changes in interest rates.
As of December 31, 2013 and 2012, if interest rates fluctuate by 100bp without other variables
changing, the effects on interest expense are as follows:
(in millions of Korean won)
December 31, 2013 December 31, 2012
100bp increase 100bp decrease 100bp increase 100bp decrease
Interest expense 224 (224) 205 (205)
ii) Price risk
The Group is exposed to equity securities price risk because of investments held by the Group
and classified on the consolidated statement of financial position as available-for-sale financial
assets, financial assets at fair value through profit or loss or derivative financial instruments. To
manage its price risk arising from investments in equity securities, the Group diversifies its

Daekyo Co., Ltd. and Subsidiaries Notes to the Consolidated Financial Statements December 31, 2013 and 2012
29
portfolio. Diversification of the portfolio is done in accordance with the limits set by the group.
As of December 31, 2013 and 2012, if the prices of equity instruments fluctuated by 5% while
other variables were fixed, the effects on net income (loss) and total comprehensive income (loss)
would be as follows:
December 31, 2013 December 31, 2012
(in millions of Korean won)
5% increase 5% decrease 5% increase 5% decrease
Net income(loss) 813 (813) 2,181 (2,181)
Comprehensive income(loss) 8,992 (8,992) 11,158 (11,158)
(b) Credit Risk
Credit risk is managed on a group basis. Credit risk arises from cash and cash equivalents and
deposits with banks and financial institutions, as well as credit exposures to customers, including
outstanding receivables and committed transactions. For banks and financial institutions, only
independently rated parties with a minimum rating of ’A’ are accepted. Corporate customers are
evaluated taking into account its financial position, past experience and other factors and
individual customers are settled in cash or using major credit cards.
(c) Liquidity Risk
The Group forecasts its cash flow and liquidity status and sets action plans on a regular basis to
manage liquidity risk proactively.
In addition, the Group copes with potential financial distress by maintaining adequate amount of
cash and financial deposits. The balances of cash and cash equivalents, and current-financial
deposits as of December 31, 2013, is ₩ 116,326 million (2012 : ₩ 47,927 million)
The analysis of the Group’s financial liabilities into relevant maturity groupings based on the
remaining period at the end of the reporting period to the contractual maturity date as of
December 31, 2013 and 2012, are as follows:
December 31, 2013
(In millions of Korean won)
Book value Cash flow
on contract Less than
1 year Between
1 and 2 years Between
2 and 5 years Over
5 years
Trade payables 9,707 9,707 9,707 - - -
Other payables (current) 68,854 68,854 68,854 - - -
Borrowings (current) 28,507 29,169 29,169 - - -
Other payables (non-current) 9,706 10,472 - 10,472 - -
Borrowings (non-current) 118 131 2 45 84 -

Daekyo Co., Ltd. and Subsidiaries Notes to the Consolidated Financial Statements December 31, 2013 and 2012
30
December 31, 2012
(In millions of Korean won)
Book value Cash flow
on contract Less than
1 year Between
1 and 2 years Between
2 and 5 years Over
5 years
Trade payables 10,196 10,196 10,196 - - -
Other payables (current) 67,399 67,445 67,445 - - -
Borrowings (current) 23,274 23,772 23,772 - - -
Other payables (non-current) 3,379 3,571 - 3,571 - -
Borrowings (non-current) 891 1,221 55 55 238 873
The amounts disclosed in the table are the contractual undiscounted cash flows, prepared based
on the earliest date of the payments that can be requested and the cash flow of interest is
included.
4.2 Capital Management
The Group’s objectives when managing capital are to maintain a sound capital structure. The
Group monitors capital on the basis of the liabilities/equity ratio which is calculated as total
liabilities divided by total equity on statements of financial position.
Debt-to-equity ratios as of December 31, 2013 and 2012, are as follows:
(in millions of Korean won) December 31, 2013 December 31, 2012
Total liabilities (A) 195,744 192,184
Total equity (B) 646,547 621,930
Debt-to-equity ratio (A/B)(%) 30% 31%

Daekyo Co., Ltd. and Subsidiaries Notes to the Consolidated Financial Statements December 31, 2013 and 2012
31
5. Fair Value
5.1 Fair Value of Financial Instruments by Category
Carrying amount and fair value of financial instruments by category as of December 31, 2013 and
2012, are as follows:
(in millions of Korean won)
December 31, 2013 December 31, 2012
Carrying
amount Fair value Carrying amount Fair value
Financial assets
Current:
Cash and cash equivalents 104,847 104,847 38,604 38,604
Financial deposits 11,479 11,479 9,323 9,323
Trade receivables 35,968 35,968 40,079 40,079
Other receivables 46,620 46,620 41,548 41,548
Financial assets at fair value
through profit or loss
21,461
21,461
57,548
57,548
Available-for-sale financial
assets
38,672
38,672
81,611
81,611
259,047 259,047 268,713 268,713
Non-current:
Financial deposits 303 303 305 305
Other receivables 12,846 12,985 21,430 22,867
Available-for-sale financial
assets
184,278
184,278
155,249
155,249
197,427 197,566 176,984 178,421
456,474 456,613 445,697 447,134
Financial liabilities
Current:
Trade payables 9,707 9,707 10,196 10,196
Other payables 68,854 68,877 67,399 67,399
Borrowings 28,507 28,507 23,274 23,274
107,068 107,091 100,869 100,869
Non-current:
Other payables 9,706 9,728 3,379 3,253
Borrowings 118 118 891 909
9,824 9,846 4,270 4,162
116,892 116,937 105,139 105,031
Carrying amount of financial assets and financial liabilities classified as current portion is measured at a reasonable approximation of fair value. Equity instruments that do not have a quoted price in an active market are measured at cost because their fair value cannot be measured reliably and excluded from the fair value disclosures.

Daekyo Co., Ltd. and Subsidiaries Notes to the Consolidated Financial Statements December 31, 2013 and 2012
32
For the year ended December 31, 2013, there are no significant changes in the business or economic circumstances that affect the fair value of financial assets and financial liabilities.
5.2 Fair Value Measurement Method For the purpose of measurement and disclosure, fair value is determined by the below methods. (a) Available-for-sale financial assets The fair value of financial instruments traded in active markets is based on quoted market prices at the end of the reporting period. A market is regarded as active if quoted prices are readily and regularly available from an exchange, dealer, broker, an entity within the same industry, pricing service, or regulatory agency, and those prices represent actual and regularly occurring market transactions on an arm’s length basis. The quoted market price used for financial assets held by the Group is the current bid price. (b) Non-current other receivables
Carrying amount and fair value of non-current other receivables as of December 31, 2013 and
2012, are as follows:
(in millions of Korean won)
December 31, 2013 December 31, 2012
Carrying
amount Fair value Carrying amount Fair value
Long-term loans 552 552 552 552
Deposits 12,294 12,433 20,878 22,315
12,846 12,985 21,430 22,867
Fair value of non-current other receivables is calculated based on a nominal value of expected
future cash inflows discounted using a discount rate reflecting credit risk.
December 31,
2013 December 31,
2012
Discount rate 4.91% 5.52%
(c) Non-current other payables Carrying amount and fair value of non-current other payables as of December 31, 2013 and 2012, are as follows:
(in millions of Korean won)
December 31, 2013 December 31, 2012
Carrying
amount Fair value Carrying amount Fair value
Long-term deposits received 9,706 9,728 3,379 3,253
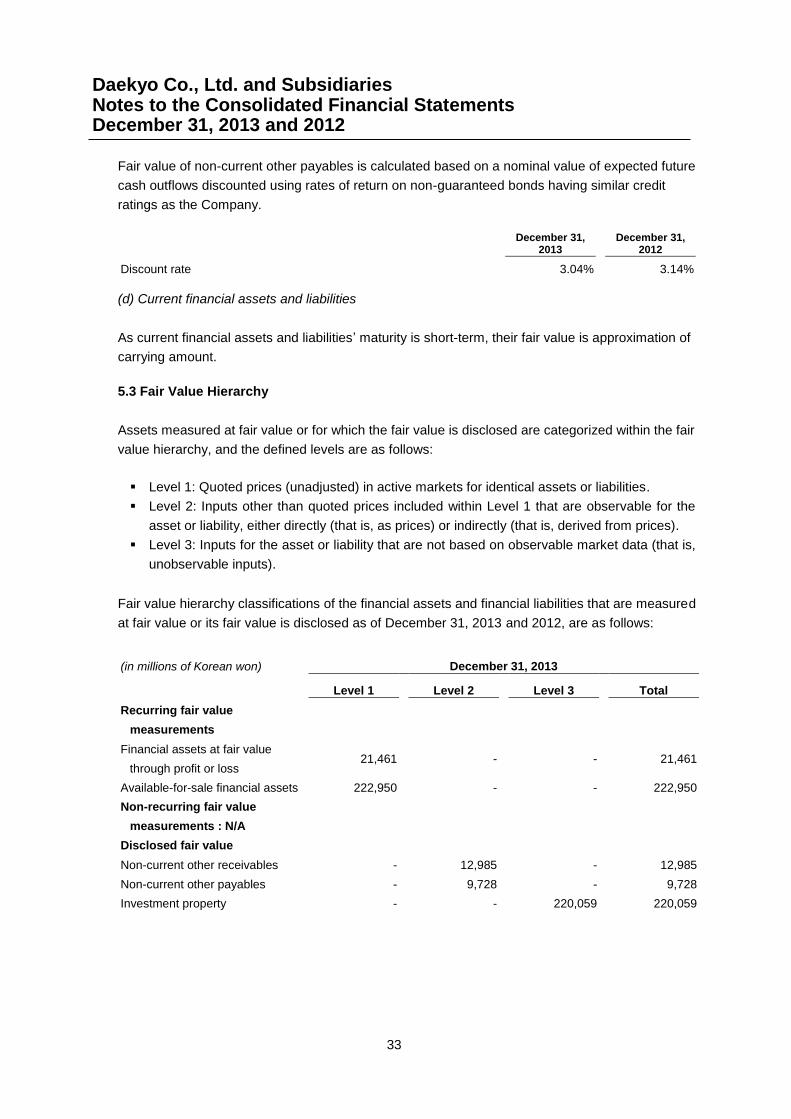
Daekyo Co., Ltd. and Subsidiaries Notes to the Consolidated Financial Statements December 31, 2013 and 2012
33
Fair value of non-current other payables is calculated based on a nominal value of expected future
cash outflows discounted using rates of return on non-guaranteed bonds having similar credit
ratings as the Company.
December 31,
2013 December 31,
2012
Discount rate 3.04% 3.14%
(d) Current financial assets and liabilities
As current financial assets and liabilities’ maturity is short-term, their fair value is approximation of
carrying amount.
5.3 Fair Value Hierarchy
Assets measured at fair value or for which the fair value is disclosed are categorized within the fair
value hierarchy, and the defined levels are as follows:
Level 1: Quoted prices (unadjusted) in active markets for identical assets or liabilities.
Level 2: Inputs other than quoted prices included within Level 1 that are observable for the
asset or liability, either directly (that is, as prices) or indirectly (that is, derived from prices).
Level 3: Inputs for the asset or liability that are not based on observable market data (that is,
unobservable inputs).
Fair value hierarchy classifications of the financial assets and financial liabilities that are measured
at fair value or its fair value is disclosed as of December 31, 2013 and 2012, are as follows:
(in millions of Korean won)
December 31, 2013
Level 1 Level 2 Level 3 Total
Recurring fair value
measurements
Financial assets at fair value
through profit or loss
21,461
-
-
21,461
Available-for-sale financial assets 222,950 - - 222,950
Non-recurring fair value
measurements : N/A
Disclosed fair value
Non-current other receivables - 12,985 - 12,985
Non-current other payables - 9,728 - 9,728
Investment property - - 220,059 220,059

Daekyo Co., Ltd. and Subsidiaries Notes to the Consolidated Financial Statements December 31, 2013 and 2012
34
(in millions of Korean won)
December 31, 2012
Level 1 Level 2 Level 3 Total
Recurring fair value
measurements
Financial assets at fair value
through profit or loss
57,548
-
-
57,548
Available-for-sale financial assets 236,860 - - 236,860
Non-recurring fair value
measurements : N/A
Disclosed fair value
Non-current other receivables - 22,867 - 22,867
Non-current other payables - 3,253 - 3,253
Investment property - - 134,149 134,149
The fair value of financial instruments traded in active markets is based on quoted market prices
at the end of the reporting period. A market is regarded as active if quoted prices are readily and
regularly available from an exchange, dealer, broker, an entity in the same industry, pricing
service, or regulatory agency, and those prices represent actual and regularly occurring market
transactions on an arm’s length basis. The quoted market price used for financial assets held by
the Group is the current bid price. These instruments are included in ‘level 1’.
The fair value of financial instruments that are not traded in an active market is determined by
using valuation techniques. The Group uses various valuation techniques and makes judgments
based on current market conditions. These valuation techniques maximise the use of observable
market data where it is available and rely as little as possible on entity specific estimates. If all
significant inputs required to measure the fair value an instrument are observable, the instrument
is included in ‘level 2’.
If one or more of the significant inputs is not based on observable market data, the instrument is
included in ‘level 3’.
Equity instruments that do not have a quoted price in an active market and are measured at cost
are not included in above hierarchy because there are no fair value measurements recognized in
the statement of financial position.

Daekyo Co., Ltd. and Subsidiaries Notes to the Consolidated Financial Statements December 31, 2013 and 2012
35
6. Segment Information
Management has determined the operating segments based on the reports reviewed by the board
of directors that are used to make strategic decisions.
The segments of the Group are strategic business divisions providing different products and
services. They are reported separately because each business division requires different
technologies and marketing strategies. The main products and services of each business division
for the year ended December 31, 2013, follows:
Products and services
Noonnoppi business Noonnoppi home-school material, Premium home-school material (CHAIHONG, Soluny)
Media business Publication, library, textbook, media business and others
Other Managing and supporting non-operating business
Subsidiaries Domestic/Overseas subsidiaries
The segment information for sales and operating income for the years ended December 31, 2013
and 2012, are as follows:
(in millions of Korean won)
2013 2012
Segment
sales Operating
income (loss) Segment
sales Operating
income (loss)
Noonnoppi business 682,040 44,049 707,868 53,499
Media business 59,298 604 52,868 (10,893)
Other 29,953 (1,535) 23,942 (2,332)
Subsidiaries 95,981 (11,439) 109,784 (8,772)
867,272 31,679 894,462 31,502
Other segments and inter-
segment transactions
(27,690)
28
(24,968)
153
839,582 31,707 869,494 31,655
Segment information of share of profit from associates, depreciation, amortization and fluctuation
of non-current assets for the years ended December 31, 2013 and 2012, follows:
2013 2012
(in millions of Korean won) Loss from
associates
Depreciation/Amortization
Fluctuation of non-current
assets1
Loss from associates
Depreciation/Amortization
Fluctuation of non-current
assets1
Noonnoppi business - 22,794 43,730 - 18,628 (5,260)
Media business - 5,905 4,801 - 6,760 (2,772)
Other (10) 5,062 (35,930) (172) 5,836 14,018
Subsidiaries - 14,983 - - 19,968 (6,048)
(10) 48,744 12,601 (172) 51,192 (62)
1 Financial instrument, deferred income tax asset and investment in associates are excluded from ‘fluctuation
of non-current assets’.

Daekyo Co., Ltd. and Subsidiaries Notes to the Consolidated Financial Statements December 31, 2013 and 2012
36
Details of segment information of assets, liabilities and investments in associates are as follows:
2013 2012
(in millions of Korean won) Assets Investments in associates Liabilities
Assets
Investments in associates Liabilities
Noonnoppi business 127,980 - 104,030 79,739 - 92,253
Media business 41,975 - 12,763 37,926 - 21,633
Other 653,510 2,385 44,761 674,175 2,395 44,920
Subsidiaries 18,826 - 34,190 22,273 - 33,378
842,291 2,385 195,744 814,113 2,395 192,184
Sales by geographic areas for the years ended December 31, 2013 and 2012, are as follows:
(in millions of Korean won) 2013 2012
Domestic 821,561 856,083
Overseas 18,021 13,411
839,582 869,494
There is no external customer attributing to more than 10% of total sales for the years ended
December 31, 2013 and 2012.
7. Financial Instruments by Category
Categorizations of financial instruments are as follows:
(in millions of Korean won) December 31, 2013
Financial assets at fair value through
profit or loss Loans and receivables
Available-for-sale financial assets
Total
Financial assets
Current
Cash and cash equivalents - 104,847 - 104,847
Financial deposits - 11,479 - 11,479
Trade receivables - 35,968 - 35,968
Other receivables - 46,620 - 46,620 Financial assets at fair value
through profit or loss 21,461 - - 21,461
Available-for-sale
financial assets - - 38,672 38,672
21,461 198,914 38,672 259,047
Non-current
Financial deposits - 303 - 303
Other receivables - 12,846 - 12,846 Available-for-sale
financial assets - - 195,998 195,998
- 13,149 195,998 209,147
21,461 212,063 234,670 468,194

Daekyo Co., Ltd. and Subsidiaries Notes to the Consolidated Financial Statements December 31, 2013 and 2012
37
(in millions of Korean won) December 31, 2013
Financial liabilities at fair value through
profit or loss
Financial liabilities carried at amortized
cost Total
Financial liabilities
Current
Trade payables - 9,707 9,707
Other payables - 68,854 68,854
Borrowings - 28,507 28,507
- 107,068 107,068
Non-current
Other payables - 9,706 9,706
Borrowings - 117 117
- 9,823 9,823
- 116,891 116,891
(in millions of Korean won) December 31, 2012
Financial assets at fair value through
profit or loss Loans and receivables
Available-for-sale financial assets
Total
Financial assets
Current
Cash and cash equivalents - 38,604 - 38,604
Financial deposits - 9,323 - 9,323
Trade receivables - 40,079 - 40,079
Other receivables 41,548 41,548 Financial assets at fair value
through profit or loss 57,548 - - 57,548
Available-for-sale
financial assets - - 81,611 81,611
57,548 129,554 81,611 268,713
Non-current
Financial deposits - 305 - 305
Other receivables - 21,430 - 21,430 Available-for-sale
financial assets - - 165,510 165,510
- 21,735 165,510 187,245
57,548 151,289 247,121 455,958

Daekyo Co., Ltd. and Subsidiaries Notes to the Consolidated Financial Statements December 31, 2013 and 2012
38
(in millions of Korean won) December 31, 2012
Financial liabilities at fair value through
profit or loss
Financial liabilities carried at amortized
cost Total
Financial liabilities
Current
Trade payables - 10,196 10,196
Other payables - 67,399 67,399
Borrowings - 23,274 23,274
- 100,869 100,869
Non-current
Other payables - 3,379 3,379
Borrowings - 891 891
- 4,270 4,270
- 105,139 105,139
Income and loss of financial instruments by category for the years ended December 31, 2013 and
2012, are as follows:
2013
(in millions of Korean won)
Financial
assets at fair value through profit or loss
Loans and Receivables
Available-for-sale financial
assets
Financial liabilities at fair value through profit or loss
Financial liabilities carried at
amortized cost Total
Dividend income - - 2,891 - - 2,891 Gain (loss) on foreign currency translation
- (168) - - 38 (130)
Gain (loss) on foreign currency transactions
- (175) - - (40) (215)
Interest income (expenses) - 4,308 358 - (1,032) 3,634
Bad debt expenses - (1,617) - - - (1,617) Gain on valuation of financial assets
1,2
461 - 10,620 - - 11,081
Gain on disposal of financial assets
5,589 - 19,307 - - 24,896
Gain on disposal of derivatives
26 - - - - 26
Impairment loss on assets - - (993) - - (993)

Daekyo Co., Ltd. and Subsidiaries Notes to the Consolidated Financial Statements December 31, 2013 and 2012
39
2012
(in millions of Korean won)
Financial
assets at fair value through profit or loss
Loans and Receivables
Available-for-sale financial
assets
Financial liabilities at fair value through profit or loss
Financial liabilities carried at
amortized cost Total
Dividend income - - 3,785 - - 3,785 Gain (loss) on foreign currency translation
- (473) - - 203 (270)
Gain (loss) on foreign currency transactions
- (62) - - 44 (18)
Interest income (expenses) - 4,216 1 - (1,052) 3,165
Bad debt expenses - (1,957) - - - (1,957) Gain (loss) on valuation of financial assets
1,2
5,043 - (11,117) - - (6,074)
Gain on disposal of financial assets
516 - 18,000 - - 18,516
Gain on disposal of derivatives
- - - 63 - 63
1
The amounts recognized as other comprehensive income(loss) are included.
2 The reclassified amounts from other comprehensive income(loss) into the statement of income include
₩11,244 million (2012: ₩11,452 million).
8. Cash and Cash Equivalents, and Financial Deposits
Details of cash and cash equivalents are as follows:
(in millions of Korean won) December 31, 2013
December 31, 2012
Ordinary deposits 32,967 29,756
Short-term bank deposits 71,880 8,848
104,847 38,604
The financial deposits restricted in use are as follows:
(in millions of Korean won) December 31,
2013
December 31, 2012
Reason
Financial deposits 1,535 1,192 Security deposits and others

Daekyo Co., Ltd. and Subsidiaries Notes to the Consolidated Financial Statements December 31, 2013 and 2012
40
9. Trade Receivables and Other Receivables
Details of trade receivables and other receivables are as follows:
(in millions of Korean won)
December 31, 2013
Original amount
Less : allowance for doubtful accounts Carrying amount
Current
Trade receivables 43,801 (7,833) 35,968
Non trade receivables 9,291 (4,754) 4,537
Accrued income 914 (257) 657
Loans 314 - 314
Deposits 41,112 - 41,112
95,432 (12,844) 82,588
Non-current
Loans 552 - 552
Deposits 12,294 - 12,294
12,846 - 12,846
108,278 (12,844) 95,434
(in millions of Korean won)
December 31, 2012
Original amount
Less : allowance for doubtful accounts Carrying amount
Current
Trade receivables 46,498 (6,419) 40,079
Non trade receivables 10,046 (4,540) 5,506
Accrued income 276 (257) 19
Loans 364 - 364
Deposits 35,659 - 35,659
92,843 (11,216) 81,627
Non-current
Loans 552 - 552
Deposits 20,878 - 20,878
21,430 - 21,430
114,273 (11,216) 103,057

Daekyo Co., Ltd. and Subsidiaries Notes to the Consolidated Financial Statements December 31, 2013 and 2012
41
The aging analyses of trade and other receivables are as follows:
December 31, 2013
Past due but not impaired
(in millions of Korean won)
Current Up to 3
months 3 to 6
months
6 to 12 months
Over one year
Impaired
1
Total
Current
Trade receivables 34,596 89 928 683 156 7,349 43,801
Non trade receivables 4,452 - - - 93 4,746 9,291
Accrued income 657 - - - - 257 914
Loans 314 - - - - - 314
Deposits 41,112 - - - - - 41,112
81,131 89 928 683 249 12,352 95,432
Non-current
Loans 552 - - - - - 552
Deposits 12,294 - - - - - 12,294
12,846 - - - - - 12,846
93,977 89 928 683 249 12,352 108,278
December 31, 2012
Past due but not impaired
(in millions of Korean won)
Current Up to 3
months 3 to 6
months
6 to 12 months
Over one year
Impaired
1
Total
Current
Trade receivables 36,363 811 1,191 1,179 1,026 5,928 46,498
Non trade receivables 5,531 - - 1 93 4,421 10,046
Accrued income 19 - - - - 257 276
Loans 364 - - - - - 364
Deposits 35,659 - - - - - 35,659
77,936 811 1,191 1,180 1,119 10,606 92,843
Non-current
Loans 552 - - - - - 552
Deposits 20,854 - - - 24 - 20,878
21,406 - - - 24 - 21,430
99,342 811 1,191 1,180 1,143 10,606 114,273
1 All impaired receivables have been provided with allowance for doubtful accounts.
The Group assesses whether a loss event exists for individual receivables and recognizes
impairment loss with the difference between the recoverable amount and its carrying amount
based on such assessment. The impairment loss for the overdue receivables is recognized by
applying the setup rate of allowance for bad debts using historic experiences according to the
period.

Daekyo Co., Ltd. and Subsidiaries Notes to the Consolidated Financial Statements December 31, 2013 and 2012
42
The movements in bad debts allowance for the years ended December 31, 2013 and 2012, are as
follows:
2013
(in millions of Korean won)
At January 1 Addition (reversal) Write-off
Exchange differences
Changes in scope of
subsidiaries At December 31
Trade receivables 6,419 1,434 (11) (9) - 7,833
Non trade receivables 4,540 183 - 31 - 4,754
Accrued income 257 - - - - 257
11,216 1,617 (11) 22 - 12,844
2012
(in millions of Korean won)
At January 1 Addition (reversal) Write-off
Exchange differences
Changes in scope of
subsidiaries At December 31
Trade receivables 7,725 1,490 (2,783) (13) - 6,419
Non trade receivables 4,376 467 (159) (144) - 4,540
Accrued income 257 - - - - 257
12,358 1,957 (2,942) (157) - 11,216
The provision of bad debts allowance for impaired receivables have been included in ‘selling and
administrative expenses’ in the statement of income and the provision of bad debts allowance of
other receivables have been included in ‘other expenses’ in the statement of income.
10. Financial Assets at Fair Value through Profit or Loss
Details of financial assets at fair value through profit or loss are as follows:
(in millions of Korean won) December 31, 2013
December 31, 2012
Equity-linked securities 21,461 57,548
Financial assets at fair value through profit or loss are presented within operating activities as part
of changes in working capital in the statements of cash flows.
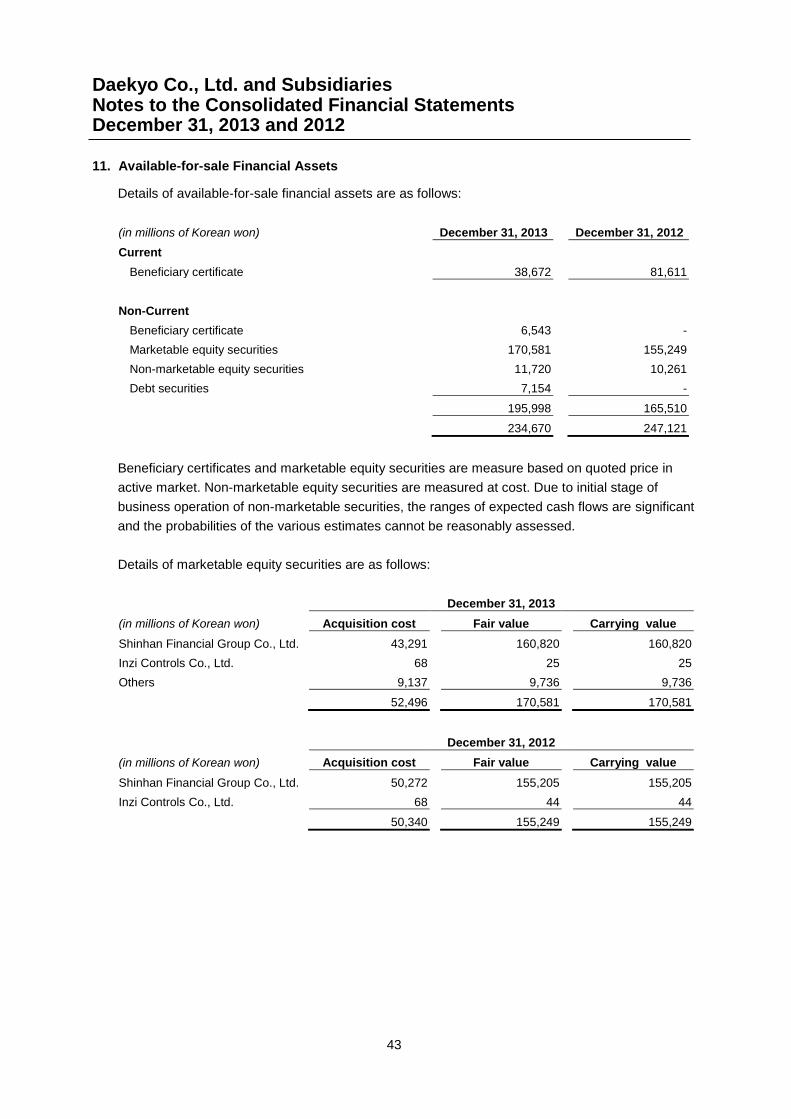
Daekyo Co., Ltd. and Subsidiaries Notes to the Consolidated Financial Statements December 31, 2013 and 2012
43
11. Available-for-sale Financial Assets
Details of available-for-sale financial assets are as follows:
(in millions of Korean won) December 31, 2013
December 31, 2012
Current
Beneficiary certificate 38,672
81,611
Non-Current
Beneficiary certificate 6,543 -
Marketable equity securities 170,581
155,249
Non-marketable equity securities 11,720
10,261
Debt securities 7,154 -
195,998
165,510
234,670
247,121
Beneficiary certificates and marketable equity securities are measure based on quoted price in
active market. Non-marketable equity securities are measured at cost. Due to initial stage of
business operation of non-marketable securities, the ranges of expected cash flows are significant
and the probabilities of the various estimates cannot be reasonably assessed.
Details of marketable equity securities are as follows:
(in millions of Korean won)
December 31, 2013
Acquisition cost Fair value Carrying value
Shinhan Financial Group Co., Ltd. 43,291 160,820 160,820
Inzi Controls Co., Ltd. 68 25 25
Others 9,137 9,736 9,736
52,496 170,581 170,581
(in millions of Korean won)
December 31, 2012
Acquisition cost Fair value Carrying value
Shinhan Financial Group Co., Ltd. 50,272 155,205 155,205
Inzi Controls Co., Ltd. 68 44 44
50,340 155,249 155,249

Daekyo Co., Ltd. and Subsidiaries Notes to the Consolidated Financial Statements December 31, 2013 and 2012
44
Changes in available-for-sale financial assets for the years ended December 31, 2013 and 2012,
are as follows:
2013
(in millions of Korean won)
Beginning
balance Acquisition
Disposal
Valuation Impairment
Ending
balance
Beneficiary certificate 81,611 24,801 (60,676) (521) - 45,215
Marketable equity securities 155,248 10,947 (24,925) 29,311 - 170,581
Non-marketable equity
securities
10,262 4,700 (2,249) - (993) 11,720
Debt securities - 7,166 (62) 50 - 7,154
247,121 47,614 (87,912) 28,840 (993) 234,670
2012
(in millions of Korean won)
Beginning
balance Acquisition
Disposal
Valuation Impairment
Ending
balance
Beneficiary certificate 86,932 41,233 (51,128) 4,574 - 81,611
Marketable equity securities 174,930 4,939 (20,488) (4,133) - 155,248
Non-marketable equity
securities
7,403 3,000 (140) - (1) 10,262
269,265 49,172 (71,756) 441 (1) 247,121
12. Inventories
Details of inventories are as follows:
(In millions of Korean won)
December 31, 2013
December 31, 2012
Merchandise
6,877 9,439
Finished goods
14,677 14,504
Stored goods
2,229 2,276
Raw materials
1,236 966
25,019 27,185
Allowance for losses on valuation of inventories
(1,869) (3,023)
23,150 24,162
The cost of inventories recognized as expense and included in ‘cost of sales’ amounts to ₩65,303
million (2012: ₩72,257 million) including ‘losses on valuation of inventories’ of ₩210 million (2012:
₩1,944 million).

Daekyo Co., Ltd. and Subsidiaries Notes to the Consolidated Financial Statements December 31, 2013 and 2012
45
13. Other Assets
Details of other assets are as follows:
(In millions of Korean won)
December 31,2013
December 31, 2012
Current
Advances
1,831
4,917
Prepaid expenses
3,885
4,369
5,716
9,286
Non-current
Advances
485
409
485
409
6,201
9,695
14. Investments in Associates
Details of investments in associates are as follows:
(in millions of Korean won)
Country
Percentage of ownership (%) at December
31, 2013 December 31,
2013 December 31,
2012
Domestic corporation DKI Growing Star 1 Investment
partnership Korea 24.00
2,385
2,395
Foreign corporation
Daekyo Bertelsmann
Educational Service Limited
China
50.00
-
-
2,385 2,395
Changes in investments in associates for the years ended December 31, 2013 and 2012, are as
follows:
(in millions of Korean won) 2013
2012
Beginning balance 2,395 466
Acquisition - 2,400
Share of profit(loss)
(10) (172)
Impairment losses - (299)
Ending balance 2,385 2,395

Daekyo Co., Ltd. and Subsidiaries Notes to the Consolidated Financial Statements December 31, 2013 and 2012
46
Summarized financial information of associates for the year ended December 31, 2013, is as
follows:
(in millions of Korean won)
Assets Liabilities Net sales Loss
for the year
DKI Growing Star 1 Investment partnership
9,942 3 219 (41)
Daekyo Bertelsmann Educational Service Limited
- - - -
15. Property, Plant and Equipment
Details of property, plant and equipment are as follows:
December 31, 2013
(in millions of Korean won)
Land
Buildings
Structures Machinery
Vehicles Tools Supplies Equipment
Standing timber
Construction-in-progress Total
Acquisition cost
49,756 82,810 3,361 468 1,827 177 62,093 2,890 528 2,793 206,703
Accumulated depreciation
- (20,590) (937) (468) (1,066) (144) (39,287) (2,450) - - (64,942)
Accumulated impairment
loss -
-
-
-
-
-
(273)
-
-
-
(273)
Net book amount
49,756 62,220 2,424 - 761 33 22,533 440 528 2,793 141,488
December 31, 2012
(in millions of Korean won)
Land
Buildings
Structures Machinery
Vehicles Tools Supplies Equipment
Standing timber
Construction-in-progress Total
Acquisition cost
35,956 100,810 3,409 468 1,475 146 50,985 2,844 528 16,971 213,592
Accumulated depreciation
- (32,219) (862) (468) (797) (122) (28,960) (2,377) - - (65,805)
Net book amount
35,956 68,591 2,547 - 678 24 22,025 467 528 16,971 147,787
Changes in property, plant and equipment for the years ended December 31, 2013 and 2012, are
as follows:
2013
(in millions of Korean won)
Land
Buildings
Structures
Vehicles Tools Supplies Equipment Standing
timber
Construction-in-progress Total
At January 1
35,956 68,591 2,547 678 24 22,025 467 528 16,971 147,787
Acquisitions
- 8,282 - 416 34 13,185 255 - 25,172 47,344
Disposal/disuse
(1,081) (941) (31) (16) - (537) (125) - - (2,731)
Impairment - - - - - (273) - - - (273)
Depreciation
- (1,620) (92) (309) (24) (11,782) (157) - - (13,984)
Reclassification to
investment property
11,897 (48,439) - - - - - - - (36,542)
Transfer-in(out)
2,960 36,388 - - - - - - (39,348) -
Exchange differences
24 (41) - (8) (1) (85) - (2) (113)
At December 31
49,756 62,220 2,424 761 33 22,533 440 528 2,793 141,488

Daekyo Co., Ltd. and Subsidiaries Notes to the Consolidated Financial Statements December 31, 2013 and 2012
47
2012
(in millions of Korean won)
Land
Buildings
Structures
Vehicles Tools Supplies Equipment Standing
timber
Construction-in-progress Total
At January 1
37,783 83,671 2,569 186 12 22,006 479 528 2,694 149,928
Acquisitions
- 3,867 79 690 78 11,412 305 - 12,902 29,333
Disposal/disuse
- - - - - (247) (152) - - (399)
Depreciation
- (2,483) (100) (190) (65) (11,094) (166) - - (14,098)
Reclassification to
investment property
(1,746) (15,963) - - - - - - - (17,709)
Transfer-in
- - - - - - - - 1,383 1,383
Exchange differences
(81) (501) (1) (8) (1) (52) 1 - (8) (651)
At December 31
35,956 68,591 2,547 678 24 22,025 467 528 16,971 147,787
Depreciation for the years ended December 31, 2013 and 2012, is charged as follows:
(In millions of Korean won)
2013 2012
Cost of sales 7,659 7,950
Selling and administrative expenses 6,325 6,148
13,984 14,098
16. Investment Property
Details of investment property are as follows:
December 31, 2013
(in millions of Korean won) Acquisition cost
Accumulated
depreciation Carrying amount
Land 20,994 - 20,994
Buildings 131,435 (27,405) 104,030
152,429 (27,405) 125,024
December 31, 2012
(in millions of Korean won) Acquisition cost
Accumulated
depreciation Carrying amount
Land 32,892 69,260 102,152
Buildings - (11,594) (11,594)
32,892 57,666 90,558

Daekyo Co., Ltd. and Subsidiaries Notes to the Consolidated Financial Statements December 31, 2013 and 2012
48
Changes in carrying amounts of investment property for the years ended December 31, 2013 and
2012, are as follows:
2013
(in millions of Korean won) Land Buildings Total
At January 1 32,892 57,666 90,558
Acquisition - 779 779
Transfer (11,898) 48,440 36,542
Depreciation - (2,673) (2,673)
Exchange differences - (182) (182)
At December 31 20,994 104,030 125,024
2012
(in millions of Korean won) Land Buildings Total
At January 1 31,146 40,936 72,082
Acquisition - 2,908 2,908
Transfer 1,746 15,963 17,709
Depreciation - (1,549) (1,549)
Exchange differences - (592) (592)
At December 31 32,892 57,666 90,558
Fair value of investment property as of December 31, 2013, is \220,059 million (2012: \134,149
million).
Rental income from investment property during the year ended December 31, 2013, is \5,763
million (2012: \4,401 million), and operating expenses (including repairs and maintenance)
directly related to those investment property is \7,109 million (2012: \3,322 million).

Daekyo Co., Ltd. and Subsidiaries Notes to the Consolidated Financial Statements December 31, 2013 and 2012
49
17. Intangible Assets
Details of intangible assets are as follows:
December 31, 2013
(in millions of Korean won) Goodwill
Membership rights
Development costs
Industrial property
rights
Software
Other intangible
assets
Right to use donated assets Total
Acquisition cost
3,732 5,858 125,442 1,762 31,158 14,432 28,133 210,517
Accumulated amortization
- - (82,986) (1,522) (18,476) (10,911) (17,129) (131,024)
Accumulated impairments loss
(1,407) - (1,778) - (79) (24) - (3,288)
Government grants
- - - - (91) (662) - (753)
Net book amounts
2,325 5,858 40,678 240 12,512 2,835 11,004 75,452
December 31, 2012
(in millions of Korean won) Goodwill
Membership rights
Development costs
Industrial property
rights
Software
Other intangible
assets
Right to use donated assets Total
Acquisition cost
6,769 5,557 130,495 1,637 23,555 12,241 36,830 217,084
Accumulated amortization
- - (69,576) (1,480) (13,961) (8,934) (21,045) (114,996)
Accumulated impairments loss
(4,148) - (13,417) (2) (376) - - (17,943)
Government grants
- - - - - (587) - (587)
Net book amounts
2,621 5,557 47,502 155 9,218 2,720 15,785 83,558
Changes in intangible assets for the years ended December 31, 2013 and 2012, are as follows:
2013
(in millions of Korean won)
Goodwill
Membership rights
Development costs
Industrial property
rights
Software
Other intangible
assets
Right to use donated assets Total
At January 1
2,621 5,557 47,502 155 9,218 2,720 15,785 83,558
Acquisitions
- 301 - 128 2,181 2,203 6,386 11,199
Acquisitions by internal development
- - 15,508 - - - - 15,508
Disposal - - (60) - (79) - - (139)
Amortization (including government grants)
- - (14,487) (43) (4,715) (1,679) (11,163) (32,087)
Impairments (296) - (1,779) - - (24) - (2,099)
Transfer-in (out) - - (6,006) - 6,075 - (4) 65
Grants from governments
- - - - (168) (385) - (553)
At December 31
2,325 5,858 40,678 240 12,512 2,835 11,004 75,452

Daekyo Co., Ltd. and Subsidiaries Notes to the Consolidated Financial Statements December 31, 2013 and 2012
50
2012
(in millions of Korean won)
Goodwill
Membership rights
Development costs
Industrial property
rights
Software
Other intangible
assets
Right to use donated assets Total
At January 1
5,818 5,557 54,454 114 7,766 2,223 22,228 98,160
Acquisitions
- - - 92 1,697 1,274 7,247 10,310
Acquisitions by internal development
-
-
24,013
-
-
-
-
24,013
Amortization (including government grants)
-
-
(13,086)
(49)
(3,713)
(3,218)
(15,479)
(35,545)
Impairments (3,197) - (11,389) (2) (376) (104) - (15,068)
Transfer-in (out) - - (6,490) - 3,844 2,667 1,789 1,810
Grants from governments
- - - - - (120) - (120)
Exchange differences
- - - - - (2) - (2)
At December 31
2,621 5,557 47,502 155 9,218 2,720 15,785 83,558
Amortization for the years ended December 31, 2013 and 2012, is charged as follows:
(In millions of Korean won)
2013 2012
Cost of sales 29,213 33,130
Selling and administrative expenses 2,874 2,415
32,087 35,545
Goodwill is allocated among the Group’s cash-generating units (CGUs) according to operating
segments. Details of goodwill by operating segments are as follows:
(In millions of Korean won)
December 31, 2013 December 31, 2012
CHAIHONG division 480 480
Academy division
1,844 2,141
2,324 2,621
The recoverable amounts of cash-generating units have been determined based on value-in-use
calculations. These calculations use pre-tax cash flow projections based on financial budgets
approved by management covering from one year to three years.
Management determined the budgeted EBIT margin based on past performance and its
expectations of market development. The discount rates used are pre-tax and reflect specific risks
relating to the relevant operating segments. Growth rates and discount rates used for value-in-use
calculations of the CHAIHONG division are 10.89% and 2.87%, and of the Academy division are 0%
and 2.87%, respectively.
The carrying value of Academy division exceeded the recoverable amounts based on value-in-use
calculations and the part of exceeded amounts was recognized as impairment loss. No
impairment was recognized in other operating segments.

Daekyo Co., Ltd. and Subsidiaries Notes to the Consolidated Financial Statements December 31, 2013 and 2012
51
18. Other Payables
Details of other payables are as follows:
(in millions of Korean won) December 31, 2013
December 31, 2012
Current
Non-trade payables 21,107
23,312
Accrued expenses 42,407
39,294
Deposits received 5,340
4,793
68,854
67,399
Non-current
Deposits received 9,706
3,379
9,706
3,379
78,560
70,778
19. Borrowings
Details of borrowings are as follows:
(in millions of Korean won)
Details
Latest maturity
date
Annual interest rate (%) at
Dec 31, 2013 December 31,
2013 December 31,
2012
Current Korea Exchange Bank General loans in foreign currency 2014-11-24 LIBOR 1M + 145bp 2,533 2,571 Hana Bank
1 Operating loans 2014-06-08 FTP + 206bp 3,000 3,000
Woori Bank1 Operating loans 2014-05-22 3M CD + 296bp 1,000 1,000
Woori Bank1 Operating loans 2014-05-22 3M CD + 303bp 500 500
Woori Bank1 Operating loans 2014-05-22 3M CD + 301bp 600 600
Korea Exchange Bank Facility loans 2014-06-04 LIBOR 3M+180bp 8,443 8,569 Korea Exchange Bank Facility loans 2014-04-02 LIBOR 3M+180bp 4,221 4,284 Korea Exchange Bank Facility loans 2014-10-04 LIBOR 3M+150bp 2,110 -
Daekyo Holdings, Inc. Borrowings from related party 2014-02-03 ~
2014-12-31 6.90
6,100
2,750
28,507 23,274
Non-Current Wells Fargo General loans in foreign currency 2022-03-05 6.75 31 819 HSBC General loans 2015-12-31 3.34 76 72 Hitachi Capital ingapore
Pte. Ltd General loans
2018-02-12 15.00
11
-
118 891
28,625 24,165
1 The Group is provided with payment guarantees from related parties in relation to these borrowings
(Note 30).

Daekyo Co., Ltd. and Subsidiaries Notes to the Consolidated Financial Statements December 31, 2013 and 2012
52
20. Provisions
Changes in provisions for sales return for the years ended December 31, 2013 and 2012, are as
follows:
(in millions of Korean won) 2013 2012
At January 1 494 415
Addition 431 465
Utilization (366) (386)
At December 31 559 494
21. Other Liabilities
Details of other liabilities are as follows:
(in millions of Korean won) December 31, 2013
December 31, 2012
Current
Withholding 6,523
8,215
Advances from customer 45,680
49,355
Unearned income 1,485
917
53,688
58,487
22. Post-employment Benefit
22.1 Defined Benefit Plan
Details of net defined benefit liability(asset) recognized on the consolidated statements of financial
position are as follows:
(in millions of Korean won) December 31, 2013
December 31, 2012
Present value of funded defined benefit obligations 45,869 45,092
Present value of unfunded defined benefit obligations 606 541
Fair value of plan assets (46,871) (41,562)
Liability(asset) on the statement of financial position (396) 4,071
The amounts recognized in the consolidated statements of income for the years ended December
31, 2013 and 2012, are as follows:
(in millions of Korean won) 2013 2012
Current service cost 9,266 9,862
Net interest cost 134 316
Total expenses 9,400 10,178

Daekyo Co., Ltd. and Subsidiaries Notes to the Consolidated Financial Statements December 31, 2013 and 2012
53
Cumulative actuarial losses recognized in the consolidated statements of comprehensive income
as of December 31, 2013 and 2012, are as follows:
(in millions of Korean won) December 31, 2013 December 31, 2012
Remeasurement of net defined benefit liability before tax (5,484) (7,283)
Tax effect 1,144 1,609
Remeasurement of net defined benefit liability after tax (4,340) (5,674)
Total expenses for the years ended December 31, 2013 and 2012, are charged as follows:
(in millions of Korean won) 2013 2012
Cost of sales 7,522 7,704
Selling and administrative expenses 1,878 2,474
9,400 10,178
Changes in the carrying amount of defined benefit liability for the years ended December 31, 2013
and 2012, are as follows:
(in millions of Korean won) 2013 2012
At January 1 45,633 42,624
Current service cost 9,266 9,862
Interest expense 1,441 1,605
Remeasurements:
- Actuarial gains and losses arising from changes in
financial assumptions
(833)
1,456
- Actuarial gains and losses arising from experience
adjustments
(983)
(145)
Benefit payments (8,049) (9,769)
At December 31 46,475 45,633
Changes in the fair value of plan assets for the years ended December 31, 2013 and 2012, are as
follows:
(in millions of Korean won) 2013 2012
At January 1 41,562 33,051
Expected return on plan assets 1,306 1,289
Remeasurements:
- Return on plan assets (17) 42
Contributions of employers 11,097 15,880
Benefit payments (7,077) (8,700)
At December 31 46,871 41,562

Daekyo Co., Ltd. and Subsidiaries Notes to the Consolidated Financial Statements December 31, 2013 and 2012
54
The principal actuarial assumptions to calculate defined benefit liability are as follows:
(%) December 31, 2013
December 31, 2012
Discount rate 3.74 ~ 3.89
3.25 ~ 3.50
Future salary increases 2.72 ~ 2.96
2.08 ~ 2.99
Plan assets consist of as follows:
(in millions of Korean won) December 31, 2013
December 31, 2012
Time deposits 7,677
12,177
Equity-linked Securities 12,143
14,482
Derivative linked securities
(Principal and interest assured) and others
27,051
14,903
46,871
41,562
Expected future contribution of defined benefit plans by employer is best estimated to be ₩8,990
million after the reporting period.
The sensitivity of the overall pension liability to changes in the principal actuarial assumptions is
as follows:
Changes in principal assumption Impact on overall liability
Discount rate 0.5% increase/decrease 2.33% decrease / 2.44% increase
Salary growth rate 0.5% increase/decrease 2.53% increase / 2.43% decrease
A decrease in corporate bond yields will increase plan liabilities, although this will be partially
offset by an increase in the value of the plans’ bond holdings.
The above sensitivity analyses are based on a change in an assumption while holding all other
assumptions constant. In practice, this is unlikely to occur, and changes in some of the
assumptions may be correlated. The sensitivity of the defined benefit obligation to changes in
principal actuarial assumptions is calculated using the projected unit credit method, the same
method applied when calculating the defined benefit obligations recognized on the statement of
financial position.
The methods and types of assumptions used in preparing the sensitivity analysis did not change
compared to the previous period.
The Group reviews the funding level on an annual basis and has a policy to eliminate deficit in the
fund.

Daekyo Co., Ltd. and Subsidiaries Notes to the Consolidated Financial Statements December 31, 2013 and 2012
55
Expected maturity analysis of undiscounted pension benefits as of December 31, 2013, is as
follows:
(in millions of Korean won) Less than
1 year
Between 1 and 2 years
Between 2 and 5 years
Between 5
and 10 years
Over 10 years
Total
Pension benefits 7,998 9,044 26,823 36,216 45,213 125,294
The weighted average duration of the defined benefit obligations is 7.37 years.
22.2 Defined Contribution Plan
Recognized expense related to the defined contribution plan for the year ended December 31,
2013, is \426 million (2012: \439 million).
23. Deferred Income Tax
Details of deferred tax assets and deferred tax liabilities are as follows:
(in millions of Korean won) December 31, 2013
December 31, 2012
Deferred tax assets
Deferred tax asset to be recovered within 12 months 17,930 4,619
Deferred tax asset to be recovered after more than 12
months
12,439 13,575
Deferred tax assets before offsetting 30,369 18,194
Deferred tax liabilities
Deferred tax liability to be recovered within 12 months 778 1,983
Deferred tax liability to be recovered after more than 12
months
43,420 35,052
Deferred tax liabilities before offsetting 44,198 37,035
Deferred tax assets (liabilities) ,net (13,829) (18,841)
The gross movement in the deferred income tax assets and liabilities for the years ended
December 31, 2013 and 2012, is as follows:
(in millions of Korean won) 2013 2012
At January 1 (18,841) (24,689)
Charged to the statement of income 8,861 2,066
Charged(credited) to other comprehensive income (3,849) 3,782
At December 31 (13,829) (18,841)

Daekyo Co., Ltd. and Subsidiaries Notes to the Consolidated Financial Statements December 31, 2013 and 2012
56
The movements in deferred income tax assets and liabilities for the years ended December 31,
2013 and 2012, without offsetting balances within the same tax jurisdiction, are as follows:
(in millions of Korean won) 2013
Increase (decrease)
Beginning
balance Profit or loss
Other comprehensive
income Ending balance
Deferred tax assets
Net defined benefit liability 6,734 693 - 7,427
Allowance for doubtful accounts 1,417 211 - 1,628
Accrued expenses 1,385 183 - 1,568 Loss on valuation of available-for-
sale financial assets 791 12,965 (169) 13,587
Remeasurement of net defined benefit liability
1,701 - (470) 1,231
Impairment loss on intangible assets
1,523 (1,007) - 516
Amortization 578 (86) - 492
Guarantee deposits 658 (190) - 468
Depreciation 2,227 - - 2,227
Other 1,180 45 - 1,225
18,194 12,814 (639) 30,369
Deferred tax liabilities
Available-for-sale financial assets (1,227) - - (1,227)
Plan assets (8,251) (589) 6 (8,834) Gain on valuation of available-for-
sale financial assets (25,444) (2,797) (3,216) (31,457)
Depreciation - (1,573) - (1,573)
Other (2,113) 1,006 - (1,107)
(37,035) (3,953) (3,210) (44,198)
(18,841) 8,861 (3,849) (13,829)

Daekyo Co., Ltd. and Subsidiaries Notes to the Consolidated Financial Statements December 31, 2013 and 2012
57
(in millions of Korean won) 2012
Increase (decrease)
Beginning
balance Profit or loss
Other comprehensive
income Ending balance
Deferred tax assets
Net defined benefit liability 5,585 1,149 - 6,734
Allowance for doubtful accounts 2,362 (945) - 1,417
Accrued expenses 1,278 107 - 1,385 Loss on valuation of available-for-
sale financial assets 1,778 - (987) 791
Remeasurement of net defined benefit liability
1,458 - 243 1,701
Impairment loss on intangible assets
559 964 - 1,523
Amortization 876 (298) - 578
Guarantee deposits 656 2 - 658
Depreciation - 2,227 - 2,227
Other 1,249 (69) - 1,180
15,801 3,137 (744) 18,194
Deferred tax liabilities
Available-for-sale financial assets (1,227) - - (1,227)
Plan assets (7,602) (639) (10) (8,251) Gain on valuation of available-for-
sale financial assets (29,980) - 4,536 (25,444)
Depreciation (336) 336 - -
Other (1,345) (768) - (2,113)
(40,490) (1,071) 4,526 (37,035)
(24,689) 2,066 3,782 (18,841)
Tax effects recognized directly in other comprehensive income are as follows:
December 31, 2013
(in millions of Korean won) Before Tax Tax effects After Tax
Gain(loss) on valuation of available-
for-sale financial assets 115,864
(28,039)
87,825
Remeasurement of net defined benefit
liability (5,484)
1,144
(4,340)
Currency translation differences (559) - (559)

Daekyo Co., Ltd. and Subsidiaries Notes to the Consolidated Financial Statements December 31, 2013 and 2012
58
December 31, 2012
(in millions of Korean won) Before Tax Tax effects After Tax
Gain(loss) on valuation of available-
for-sale financial assets 101,875
(24,654)
77,221
Remeasurement of net defined benefit
liability (7,283)
1,609
(5,674)
Currency translation differences (908) - (908)
Details of temporary differences that are unrecognized as deferred income tax assets are as
follows:
(in millions of Korean won) December 31, 2013
December 31, 2012
Investments in subsidiaries and others 62,571 67,673
24. Share Capital
The Company is authorized to issue 1,500 million shares with a par value per share of ₩500. As
of December 31, 2013, 84.7 million shares (\42,352 million) of common stock and 19.4 million
shares (\9,713 million) of preferred stock are issued outstanding. There are no movements in
common and preferred stocks during 2013 and 2012.
When the dividend rate of common stock exceeds the dividend rate of preferred stock (over 9% of
the par value according to the resolution of the Board of Directors), the preferred stock has the
right to be entitled to receive dividends at the same rate with the common stock for the excess
rate.
25. Capital Surplus
Details of capital surplus are as follows:
(in millions of Korean won) December 31, 2013
December 31, 2012
Share premium 46,797
46,797
Other capital surplus 22,829
22,122
69,626
68,919

Daekyo Co., Ltd. and Subsidiaries Notes to the Consolidated Financial Statements December 31, 2013 and 2012
59
26. Other Components of Equity
Details of other components of equity are as follows:
(in millions of Korean won) December 31, 2013
December 31, 2012
Stock options 210
359
Treasury shares (61,013)
(55,250)
(60,803)
(54,891)
27. Share-Based Payments
As of December 31, 2013, the summary of stock options to be granted to employees is as follows:
Details
Date of the first announcement January 8, 2014
Grant method Issuance of shares
Exercise period February 4, 2014 ~ February 10, 2014 (expected)
Vesting conditions Options are conditional on the employee completing service
between July 1, 2013 and December 31, 2013 and achieving
performance goals.
Exercise price1 Standard price of common stock (1- discount rate)
Shares to be granted2 71,083 shares of common stock (expected)
1
The standard price of common stock is calculated as mathematical average of closing price on reference
date, one month average closing price and one week average closing price rolled-back from the reference
date, December 31, 2013. The discount rates are 30%, 40%, 50% and 100%. 2
Shares to be issued can be replaced with preferred stock of equivalent value, depending on the employees’
choice.

Daekyo Co., Ltd. and Subsidiaries Notes to the Consolidated Financial Statements December 31, 2013 and 2012
60
The summary of stock options granted to employees for the year ended December 31, 2013, are
as follows:
- The first half 2013
Details
Date of the first announcement September 13, 2012
Grant method Issuance of shares
Exercise period April 22, 2013 ~ April 26, 2013
Vesting conditions Options are conditional on the employee completing service
between July 1, 2012 and December 31, 2012 and achieving
performance goals.
Exercise price1 Standard price of common stock (1- discount rate)
Shares to be granted2 129,223 shares of common stock
1
The standard price of common stock is \6,390 and the discount rates are 30%, 40%, 50% and 100%. 2
Shares to be issued can be replaced with preferred stock in equivalent value, depending on the employees’
choice. Standard price of preferred stock for replacement was \3,830. Vested stock options of 118,572 of
common stock and 17,771 of preferred stock were exercised and unexercised options have lapsed.
- The second half 2013
Details
Date of the first announcement January 4, 2013
Grant method Issuance of shares
Exercise period July 19, 2013 ~ July 25, 2013
Vesting conditions Options are conditional on the employee completing service
between January 1, 2013 and June 30, 2013 and achieving
performance goals.
Exercise price1 Standard price of common stock (1- discount rate)
Shares to be granted2 82,621 shares of common stock
1
The standard price of common stock is \7,250 and the discount rates are 30%, 40%, 50% and 100%. 2
Shares to be issued can be replaced with preferred stock in equivalent value, depending on the employees’
choice. Standard price of preferred stock for replacement was \4,290. Vested stock options of 76,084 of
common stock and 11,047 of preferred stock were exercised and unexercised options have been lapsed.
The fair value of stock appreciation rights determined using the Black-Scholes valuation model
was ₩210 million (2012: ₩359 million). The significant inputs into the model were the weighted
average share price of ₩7,300 (2012: ₩6,350), exercise price ₩4,716 (2012: ₩4,127), volatility
of 20% (2012: 27%), dividend yield of 3.25% (2012: 4.1%), an expected option life of 0.11 years
(2012: 0.83 years) and an annual risk-free interest rate of 2.7% (2012: 2.8%).

Daekyo Co., Ltd. and Subsidiaries Notes to the Consolidated Financial Statements December 31, 2013 and 2012
61
Changes in stock options for the years ended December 31, 2013 and 2012, are as follows:
(in millions of Korean won) 2013 2012
At January 1 359 504
Compensation cost 415 761
Exercise (564) (906)
At December 31 210 359
28. Treasury Shares
Changes in treasury shares for the years ended December 31, 2013 and 2012, are as follows:
(shares, in millions of Korean won) 2013
Common stock Preferred stock Amounts
At January 1 7,497,995 4,077,903 55,250
Acquisition 1,168,460 403,470 9,377
Disposal (594,656) (35,238) (3,614)
At December 31 8,071,799 4,446,135 61,013
(shares, in millions of Korean won) 2012
Common stock Preferred stock Amounts
At January 1 6,468,932 3,831,516 48,074
Acquisition 1,442,010 337,150 9,756
Disposal (412,947) (90,763) (2,580)
At December 31 7,497,995 4,077,903 55,250
29. Retained Earnings
Details of retained earnings are as follows:
(in millions of Korean won) December 31, 2013
December 31, 2012
Legal reserve1 32,300 32,300
Discretionary reserve 439,505 426,505
Unappropriated retained earnings 18,513 13,934
490,318 472,739
1 The Commercial Code of the Republic of Korea requires the Company to appropriate, as a legal reserve,
an amount equal to a minimum of 10% of cash dividends paid until such reserve equals 50% of its issued
capital stock. As of December 31, 2013, the Company’s reserve equals 50% of the capital, therefore no
additional reserve is needed. The reserve is not available for the payment of cash dividends, but may be
transferred to capital stock through an appropriate resolution by the general meeting of shareholders or

Daekyo Co., Ltd. and Subsidiaries Notes to the Consolidated Financial Statements December 31, 2013 and 2012
62
used to reduce accumulated deficit, if any, with the ratification of the Company’s majority shareholders.
The changes in retained earnings for the years ended December 31, 2013 and 2012, are as
follows:
(in millions of Korean won) 2013 2012
At January 1 472,739 475,331
Profit attributable to equity holders of
the Parent Company
35,305 22,933
Remeasurement of net defined benefit liability 1,337 (1,009)
Changes in scope of consolidation 524 -
Dividend paid (19,587) (24,516)
At December 31 490,318 472,739
30. Contingencies and Commitments
As of December 31, 2013, the Group has credit agreements with Woori Bank up to ₩19,000
million in relation to corporate purchase card programs.
As of December 31, 2013, the Group provides short-term financial instruments as collaterals
amounting to ₩1,535 million for certain lessees in connection with the lessees’ guarantees
deposits and internet card payment. Seoul Guarantee Insurance Co., Ltd. has provided
guarantees up to ₩2,730 million for the company’s execution of contracts.
The Group entered into contracts with free-lance instructors to manage its educational service
members. In accordance with the contracts, the Group pays the instructors a certain percentage
of monthly cash collections from its educational service members. Expenses in relation to these
contracts amounted to ₩361,194 million (2012: ₩ 361,004 million) in 2013.
As of December 31, 2013, the Group is either a plaintiff in one legal case or a defendant in three
legal cases. The outcome of the cases and effect on the financial statements could not be
ascertained at the end of the reporting period.
As of December 31, 2013, the Group has been provided with payment guarantees of ₩5,100
million from the Parent Company, Daekyo Holdings Co., Ltd., in relation to borrowings of Daekyo
Edupia Co., Inc.

Daekyo Co., Ltd. and Subsidiaries Notes to the Consolidated Financial Statements December 31, 2013 and 2012
63
31. Sales
Details of sales for the years ended December 31, 2013 and 2012, are as follows:
(in millions of Korean won) 2013 2012
Sales of goods 749,871 766,066
Sales of services 78,849 88,734
Royalty income 10,862 14,694
839,582 869,494
32. Selling and Administrative Expenses
Details of selling and administrative expenses for the years ended December 31, 2013 and 2012,
are as follows:
(in millions of Korean won) 2013 2012
Wages and salaries 25,138 23,418
Severance benefits 1,878 2,582
Welfare expense 6,099 6,362
Depreciation 6,692 6,148
Advertising expense 29,785 32,935
Commission expense 27,016 24,704
Amortization 2,874 2,415
Taxes and dues 3,602 3,596
Transportation expense 2,291 2,180
Printing expense 945 1,830
Rental expense 4,348 4,306
Other 8,568 8,769
119,236 119,245

Daekyo Co., Ltd. and Subsidiaries Notes to the Consolidated Financial Statements December 31, 2013 and 2012
64
33. Expenses by Nature
Expenses that are recorded by nature as cost of sales and selling and administrative expenses in
the statement of income for the years ended December 31, 2013 and 2012, consist of:
(in millions of Korean won) 2013 2012
Changes in inventories 1,012 8,268
Purchase of raw materials and merchandise 64,291 63,989
Depreciation, amortization 48,744 51,192
Employee benefit expenses 153,655 173,587
Commission expenses 437,135 428,837
Rental expenses 29,765 29,702
Advertising expenses 30,418 33,014
Other expenses 42,855 49,250
807,875 837,839
34. Other Income
Other income for the years ended December 31, 2013 and 2012, consist of:
(in millions of Korean won) 2013 2012
Interest income (lease) 2,160 2,270
Dividend income 2,891 3,785 Gain on disposal of financial assets at fair value through
profit or loss 5,616 647
Gain on valuation of financial assets at fair value through profit or loss
583 5,707
Gain on disposal of available-for-sale financial assets 21,172 18,271
Other 2,134 4,767
34,556 35,447

Daekyo Co., Ltd. and Subsidiaries Notes to the Consolidated Financial Statements December 31, 2013 and 2012
65
35. Other Expenses
Other expenses for the years ended December 31, 2013 and 2012, consist of:
(in millions of Korean won) 2013 2012
Interest expense (lease) 209 190
Loss on foreign currency transaction 239 49
Loss on foreign currency translation 149 474
Contribution expense 2,247 2,011
Commission for investment counseling 1,258 1,705 Loss on disposal of financial assets at fair value through
profit or loss 122 664
Impairment loss on available-for-sale financial assets 993 -
Impairment loss on investments in associates - 299
Impairment loss on property, plant and equipment 273 -
Impairment loss on intangible assets 2,099 12,298
Loss on disposal of available-for-sale financial assets 1,865 -
Other 4,333 8,096
13,787 25,786
36. Financial Income
Financial income for the years ended December 31, 2013 and 2012, are as follows:
(in millions of Korean won) 2013 2012
Interest Income 2,506 1,948
Gain on foreign currency translation 38 203
Gain on foreign currency transaction - 20
2,544 2,171
37. Financial Expenses
Financial expenses for the years ended December 31, 2013 and 2012, are as follows:
(in millions of Korean won) 2013 2012
Interest expenses 823 863
Loss on foreign currency translation 39 41
862 904

Daekyo Co., Ltd. and Subsidiaries Notes to the Consolidated Financial Statements December 31, 2013 and 2012
66
38. Income Tax Expense
Income tax expense for the years ended December 31, 2013 and 2012, consists of:
(in millions of Korean won) 2013 2012
Current income taxes:
Current tax on profit for the year 18,356 11,249
Adjustments in respect of prior years 12,610 733
30,966 11,982
Deferred tax:
Changes in temporary differences (8,861) (2,066)
Other:
Income tax directly to equity (197) (6)
Difference of changes in currency exchange 16 120
Income tax relating to discontinued operations - 2,811
(181) 2,925
Income tax expense 21,924 12,841
The tax on the Group’s profit before tax differs from the theoretical amount that would arise using
the weighted average tax rate applicable to profits of the consolidated entities as follows:
(in millions of Korean won)
2013
2012
Profit before tax
54,147
42,412
Tax calculated at domestic tax rates applicable to profits
in the respective countries 12,133
10,560
Tax adjustments:
Income not subject to tax / expenses not deductible
for tax purposes 1,663
504
Effects of unrecognized deferred income tax at the
beginning 7,057
2,531
Changes in deferred tax assets
(13,604)
(1,233)
Adjustments in respect of prior years
12,610
733
Others
2,065
(254)
Income tax expense
21,924
12,841
Effective tax rate (Income tax over profit before tax)
40.5%
30.3%

Daekyo Co., Ltd. and Subsidiaries Notes to the Consolidated Financial Statements December 31, 2013 and 2012
67
39. Earnings per Share
Basic earnings per share is calculated by dividing the profit attributable to equity holders of the
Parent Company by the weighted average number of shares in issue excluding shares purchased
by the Group and held as treasury shares. Preferred shares have rights to participate in the profits
of the Company. These participation rights have been considered in presenting the EPS for
ordinary shares and preferred shares.
Basic earnings per ordinary share for the years ended December 31, 2013 and 2012, is as follows:
(in millions of Korean won) 2013 2012
Profit attributable to ordinary shares1 29,386 19,005
Profit from continuing operations 29,386 26,345
Loss from discontinued operations - (7,340)
Weighted average number of ordinary shares in issue2
(Unit: share)
77,103,111 77,835,494
Basic earnings per share (in won)
Basic earnings per ordinary share from continuing operations
381 338
Basic loss per ordinary share from discontinued operations
- (94)
Basic earnings per preferred share for the years ended December 31, 2013 and 2012, is as
follows:
(in millions of Korean won) 2013 2012
Profit attributable to preferred shares1 5,919 3,928
Profit from continuing operations 5,919 5,391
Profit from discontinued operations - (1,463)
Weighted average number of preferred shares in issue2
(Unit: share)
15,229,545 15,520,403
Basic earnings per share (in won)
Basic earnings per preferred share from continuing operations
389 347
Basic loss per preferred share from discontinued operations
- (94)

Daekyo Co., Ltd. and Subsidiaries Notes to the Consolidated Financial Statements December 31, 2013 and 2012
68
1 Profit attributable to ordinary and preferred shares is as follows:
(in millions of Korean won) 2013 2012
Profit from continuing operations attributable to equity holders of the Parent Company (A)
35,305 31,736
Ordinary shares dividends (B) 16,153 20,073
Preferred shares dividends (C) 3,332 4,144
Undistributed earnings from continuing operations (D=A-B-C) 15,820 7,519
Undistributed earnings available for ordinary shares ( E) 13,233 6,272
Undistributed earnings available for preferred shares(F) 2,587 1,247 Profit attributable to ordinary shares
from continuing operations (G=B+E) 29,386 26,345
Profit attributable to preferred shares from continuing operations (H=C+F)
5,919 5,391
Profit from discontinued operations(J) - (8,803)
Ordinary shares dividends (K) - -
Preferred shares dividends (L) - -
Undistributed earnings from discontinued operations(M=J-K-L) - (8,803)
Undistributed earnings available for ordinary shares (N) - (7,340)
Undistributed earnings available for preferred shares (O) - (1,463)
Profit attributable to ordinary shares from discontinued operations (P=K+N)
- (7,340)
Profit attributable to preferred shares from discontinued operations (Q=L+O)
- (1,463)
Profit attributable to ordinary shares (R=G+P) 29,386 19,005
Profit attributable to preferred shares (S=H+Q) 5,919 3,928
2 Weighted average numbers of shares are calculated as follows:
(Shares)
2013 2012
Ordinary shares outstanding
84,702,850 84,702,850
Ordinary treasury shares
(8,071,799) (7,497,995)
Ordinary shares
76,631,051 77,204,855
Weighted average number of ordinary shares outstanding
77,103,111 77,835,494
Preferred shares outstanding
19,426,990 19,426,990
Preferred treasury shares
(4,446,135) (4,077,903)
Preferred shares
14,980,855 15,349,087
Weighted average number of preferred shares outstanding
15,229,545 15,520,403

Daekyo Co., Ltd. and Subsidiaries Notes to the Consolidated Financial Statements December 31, 2013 and 2012
69
Diluted earnings per ordinary share for the years ended December 31, 2013 and 2012, is as
follows:
(in millions of Korean won) 2013 2012
Profit attributable to ordinary shares 29,386 19,005
Profit from continuing operations 29,386 26,345
Loss from discontinued operations - (7,340)
Weighted average number of ordinary shares in issue and dilutive potential ordinary shares
(Unit: share)
77,168,566 77,907,144
Diluted earnings per share (in won)
Diluted earnings per ordinary share from continuing operations
381 338
Diluted loss per ordinary share from discontinued operations
- (94)
Basic earnings per preferred share for the years ended December 31, 2013 and 2012, is as
follows:
(in millions of Korean won) 2013 2012
Profit attributable to preferred shares 5,919 3,928
Profit from continuing operations 5,919 5,391
Profit from discontinued operations - (1,463)
Weighted average number of preferred shares in issue and dilutive potential ordinary shares
(Unit: share)
15,241,200 15,534,985
Diluted earnings per share (in won)
Diluted earnings per preferred share from continuing operations
388 347
Diluted loss per preferred share from discontinued operations
- (94)
40. Dividends
The interim dividends for ordinary shares paid in 2013 and 2012 were ₩8,490 million (₩110 per
share, dividend rate: 22%) and ₩8,566 million (₩110 per share, dividend rate: 22%) and the
interim dividends for preferred shares were ₩1,681 million (₩110 per share, dividend rate: 22%)
and ₩1,717 million (₩110 per share, dividend rate: 22%), respectively.
The dividends for ordinary shares paid in 2013 and 2012 were ₩7,727 million (₩100 per share,
dividend rate: 20%) and ₩11,736 million (₩150 per share, dividend rate: 30%) and the dividends
for preferred shares were ₩1,689 million (₩110 per share, dividend rate: 22%) and ₩2,498
million (₩160 per share, dividend rate: 32%), respectively.

Daekyo Co., Ltd. and Subsidiaries Notes to the Consolidated Financial Statements December 31, 2013 and 2012
70
A dividend for ordinary share in respect of the year ended December 31, 2013, of ₩100 per share
(dividend rate: 20%), amounting to a total dividend of ₩7,663 million and a dividend for preferred
share of ₩110 per share (dividend rate: 22%), amounting to a total dividend of ₩1,650 million, are
to be proposed at the annual general meeting on March 21, 2014. These financial statements do
not reflect this dividend payable.
41. Cash Generated from Operations
Cash generated from operations for the years ended December 31, 2013 and 2012, is as follows:
(in millions of Korean won) 2013 2012
Profit for the year 32,223 20,768
Adjustments : 61,837 69,231
Severance benefits 9,400 10,178
Depreciation and amortization 48,744 51,192
Impairment loss on available-for-sale financial assets 993 -
Impairment loss on investments in associates - 299
Impairment loss on property, plant and equipment 273 -
Impairment loss on intangible assets 2,099 15,068
Interest income (4,665) (4,218)
Gain on disposal of available-for-sale financial assets (21,172) (18,271)
Dividend income (2,891) (3,785)
Income tax expense 21,924 10,030
Other 7,132 8,738
Changes in operating assets and liabilities: 37,798 (16,360)
Decrease in financial assets at fair value
through gain or loss
42,162 2,455
Decrease in trade receivables 10 3,373
Decrease(increase) in inventories (1,840) 4,401
Decrease(increase) in other assets 1,303 (3,339)
Decrease in trade payables (1,705) (893)
Increase(decrease) in other payables 14,228 (13,089)
Increase in provisions 65 78
Increase(decrease) in other liabilities (4,845) 9,618
Payment of net defined benefit liability (972) (1,069)
Deposit in plan assets, net (11,097) (15,880)
Increase(decrease) in other assets, liabilities 489 (2,015)
Cash generated from operations 131,858 73,639

Daekyo Co., Ltd. and Subsidiaries Notes to the Consolidated Financial Statements December 31, 2013 and 2012
71
The significant non-cash transactions for the years ended December 31, 2013 and 2012, are as
follows:
(in millions of Korean won) 2013 2012
Valuation of available-for-sale financial assets 14,011 (14,667)
Exercise of stock options 564 906
Reclassification of investment property 36,542 17,709
Increase(decrease) in other payables in relation to
property, plant and equipment
(2,885)
383
Increase in other payables in relation to intangible assets (195) (984)
42. Related Party Transactions
As of December 31, 2013 and 2012, the Parent Company is Daekyo Holdings Co., Ltd.
Details of other related parties that have sales and other transactions with the Group or have
receivables and payables balances as of December 31, 2013 and 2012, are as follows:
December 31, 2013 December 31, 2012 Relationship
Other related parties Gangwon Deep Sea Water
Co., Ltd. Gangwon Deep Sea Water
Co., Ltd.
Subsidiary of Parent Company
Daekyo D&S Co., Ltd. Daekyo D&S Co., Ltd. Subsidiary of Parent Company
Daekyo CNS Co., Ltd. Daekyo CNS Co., Ltd. Subsidiary of Parent Company
Daekyo CTU Co., Ltd. - Subsidiary of Parent Company
-
Sindaesin Construction Co.,
Ltd
Although it was subsidiary of Parent Company in prior year, it merged with Daekyo D&S Co., Ltd. in 2013
Daekyo Culture foundation Daekyo Culture foundation Key management performs the important duty
Deakyo Investment Co., Ltd Deakyo Investment Co., Ltd Key management performs the important duty
-
Gasan Co., Ltd Key management is the entity’s shareholders and
the entity merge with Twohandsmedia Co., Ltd.
Tara Graphics Co., Ltd. Tara Graphics Co., Ltd. Relatives of key managements is the entity’s CEO
Tara Distribution Co., Ltd. Tara Distribution Co., Ltd. Relatives of key managements is the entity’s CEO
Tara TPS Co., Ltd. Tara TPS Co., Ltd. Relatives of key managements is the entity’s CEO
Twohandsmedia Co., Ltd. Twohandsmedia Co., Ltd. Relatives of key managements is the entity’s CEO
Crystalwine Club Co., Ltd - Relatives of key managements is the entity’s CEO

Daekyo Co., Ltd. and Subsidiaries Notes to the Consolidated Financial Statements December 31, 2013 and 2012
72
Significant transactions for the years ended December 31, 2013 and 2012, are as follows:
(in millions of Korean won) 2013
Sales Purchases
Sales1 Others Purchases
2
Acquisition of non-current
assets
Selling and administrative
expenses Others
Parent Company
Daekyo Holdings Co., Ltd. 75 1 - 224 1,218 187
Other related parties
Daekyo D&S Co., Ltd. 26 21 - 1,268 3,944 23
Daekyo CNS Co., Ltd. 69 29 - 1,427 14,336 -
Gangwon Deep Sea Water
Co., Ltd.
70
12
-
-
834
6
Daekyo CTU Co., Ltd. 5 - - - - -
Daekyo Culture foundation 438 191 - - - 177
BongAm Institute - - - - 3 606
Twohandsmedia Co., Ltd. 1 - - - 839 -
Crystalwine Club Co., Ltd - - - - 7 -
Deakyo Investment Co., Ltd 15 - - - 425 -
Daekyo Culture foundation 1 - - - 256 -
Tara Distribution Co., Ltd. - - 9,184 - 440 -
Tara TPS Co., Ltd. 294 - 28,073 - 876 -
994 254 37,257 2,919 23,178 999
(in millions of Korean won) 2012
Sales Purchases
Sales1 Others Purchases
2
Acquisition of non-current
assets
Selling and administrative
expenses Others
Parent Company
Daekyo Holdings Co., Ltd. 23 - 14 - 1,694 115
Other related parties
Gasan Co., Ltd - - - - 52 -
Daekyo D&S Co., Ltd. 1 - - 76 3,085 -
Daekyo CNS Co., Ltd. 33 - - 1,215 18,530 -
Gangwon Deep Sea Water
Co., Ltd.
34
-
-
-
466
6
Sindaesin Construction Co.,
Ltd
-
-
-
-
4
-
Daekyo Culture foundation 194 260 - - - -
Twohandsmedia Co., Ltd. 1 - 19 - 1,717 -
Deakyo Investment Co., Ltd - - - - 483 -
Tara Graphics Co., Ltd. - - 3 - 142 -
Tara Distribution Co., Ltd. - - 6,722 - 506 -
Tara TPS Co., Ltd. 294 - 27,461 - 1,253 -

Daekyo Co., Ltd. and Subsidiaries Notes to the Consolidated Financial Statements December 31, 2013 and 2012
73
580 260 34,219 1,291 27,932 121
1 Sale of goods and rendering of services are included.
2 Purchases of goods and services (royalty and others) are included.
The balances of significant transactions are as follows:
(in millions of Korean won) December 31, 2013
Receivables Payables
Trade
receivables Other
receivables Others Trade
payables Other
payables
Parent Company
Daekyo Holdings Co., Ltd. 3 1 - - 6,934
Other related parties
Gasan Co., Ltd - - - - -
Daekyo D&S Co., Ltd. - 28 4,560 - 1,705
Daekyo CNS Co., Ltd. - - - - 3,739
Gangwon Deep Sea Water
Co., Ltd.
1
116
-
-
176
Daekyo Culture foundation 16 - - - 75
World Youth&Culture
Foundation
-
-
-
-
34
Twohandsmedia Co., Ltd. 4 - - - 224
Crystal Wine Collection Co.,
Ltd
-
-
-
-
35
Crystalwine Club Co., Ltd - - - - 29
Deakyo Investment Co., Ltd - - - - 532
Tara Graphics Co., Ltd. - - - - 31
Tara Distribution Co., Ltd. - - - 1,865 -
Tara TPS Co., Ltd. - - - 4,774 2
24 145 4,560 6,639 13,516

Daekyo Co., Ltd. and Subsidiaries Notes to the Consolidated Financial Statements December 31, 2013 and 2012
74
(in millions of Korean won) December 31, 2012
Receivables Payables
Trade
receivables Other
receivables Others Trade
payables Other
payables
Parent Company
Daekyo Holdings Co., Ltd. - 61 - - 4,037
Other related parties
Gasan Co., Ltd 1 1 - - -
Daekyo D&S Co., Ltd. - - 4,420 - 289
Daekyo CNS Co., Ltd. - 150 - - 3,083
Gangwon Deep Sea Water
Co., Ltd.
-
4
-
-
25
Daekyo Culture foundation 104 - - - 19
World Youth&Culture
Foundation
-
-
-
-
-
Twohandsmedia Co., Ltd. - - - - 221
Crystal Wine Collection Co.,
Ltd
-
-
-
-
-
Crystalwine Club Co., Ltd - - - - -
Deakyo Investment Co., Ltd - - - - -
Tara Graphics Co., Ltd. - - - - 27
Tara Distribution Co., Ltd. - - - 1,281 -
Tara TPS Co., Ltd. - - - 4,620 21
105 216 4,420 5,901 7,722
Fund transactions with related parties for the years ended December 31, 2013 and 2012, are as
follows:
(in millions of Korean won) 2013
Equity Loan transactions Borrowing transactions
Dividend received
contributions (reduction)
in cash Trade
receivables Other
receivables Borrowings Repayments
Parent Company
Daekyo Holdings Co., Ltd. - - - - 3,850 500
- - - - 3,850 500

Daekyo Co., Ltd. and Subsidiaries Notes to the Consolidated Financial Statements December 31, 2013 and 2012
75
(in millions of Korean won) 2013
Equity Loan transactions Borrowing transactions
Dividend received
contributions (reduction)
in cash Trade
receivables Other
receivables Borrowings Repayments
Parent Company
Daekyo Holdings Co., Ltd. - - - - 2,750 2,500
Associates
DKI Growing Star 1
Investment partnership
-
2,400
-
-
-
-
- 2,400 - - 2,750 2,500
Key management compensation of the Group for the years ended December 31, 2013 and 2012,
consists of:
(in millions of Korean won) 2013 2012
Short-term salaries 3,694 3,716
Severance benefits 329 1,336
4,023 5,052
Key management refers to the directors who have significant control and responsibilities on the
Group’s business plans, operations and controls.
As of December 31, 2013, no payment guarantees are provided by the Group for the funding
sources of the related parties and payment guarantees provided by the related parties are
described in Note 30.
43. Approval of Financial Statements
The issuance of the December 31, 2013 financial statements of the Group was approved by the
Board of Directors on March 4, 2014, which is subject to change with the approval of the
shareholders at their annual shareholders’ meeting.
44. Events After the Reporting Period
The amended income tax law which was enacted on January 1, 2014, is expected to affect the
calculation of deferred tax asset as the estimated current income tax amount and the amount of
tax credit carryforward of the Group will decrease.