Embed Size (px)
Citation preview

DESCRIPTION OF SPATIAL DATABASES
Deliverable no. D6.6
Baptiste Hautdidier, Ramon Laplana, Hadj Mahboubi
Partners: Cemagref
Submission date: 23-Dec-11
Seventh Framework Programme Theme 6 (ENV-2007-1)
Environment (including climate change)
Collaborative project (Small or medium-scale focused research project) Grant agreement no. : 212345 Project duration: November 2008 - - November 2011

Contract no. 212345 | Deliverable no. | 24/12/2011
Description of spatial databases 2/19
PRIMA aims to develop a method for scaling down the analysis of policy impacts on multifunctional land uses and on the economic activities. The scoped policies will include the cohesion policy (ERDF, ESF, CF), the enlargement process (IPA) & the rural development policy (EAFRD) of the European Commission, with a special focus on agriculture, forestry, tourism, and ecosystem services. The approach will: rely on micro-simulation and multi-agents models, designed and validated at municipality level, using input from stakeholders; address the structural evolution of the populations (appearance, disappearance and change of agents) depending on the local conditions for applying the structural policies on a set of municipality case studies. Involving eleven partners, the project is coordinated by Cemagref.
Email: [email protected] & [email protected]
Internet: https://prima.cemagref.fr
Authors of this report and contact details
Name: Baptiste Hautdidier Partner acronym: Irstea (Cemagref) Address: 50, avenue de Verdun. Gazinet. F-33612 Cestas Cédex, France E-mail: [email protected]
If you want to cite a Public Deliverable that originally was meant for use within the project only, please make sure you are allowed to disseminate or cite this report. If so, please cite as follows:
Baptiste Hautdidier, Ramon Laplana, Hadj Mahboubi 2011. Description of spatial databases PD no. D6.6 PRIMA collaborative project, EU 7th Framework Programme, contract no. 212345, https://prima.cemagref.fr, 19 p.
DISCLAIMER
“This publication has been funded under the PRIMA collaborative project, EU 7th Framework Programme, Theme 6 (ENV 2007-1) Environment (including climate change) European Commission, DG Research, contract no. 212345. Its content does not represent the official position of the European Commission and is entirely under the responsibility of the authors.”
“The information in this document is provided as is and no guarantee or warranty is given that the information is fit for any particular purpose. The user thereof uses the information at its sole risk and liability.”

Contract no. 212345 | Deliverable no. | 24/12/2011
Description of spatial databases 3/19
TABLE OF CONTENTS
Executive summary........................................................................................6
1 Introduction...........................................................................................7
2 A three-tiered approach to the management of spatial data...............7
2.1 A data gathering process in case studies regions ........................7
2.2 A common GIS database...............................................................8
2.3 Specific needs and research interests of modellers.....................9
3 The consequences of working with municipalities ..............................9
3.1 Going local when the data is scarce..............................................9
3.2 Beware the MAUP! ........................................................................ 11
3.3 Boundaries as workarounds ....................................................... 12
3.4 Costs and use restrictions, INSPIRE compliance......................... 13
4 Data cubes, spatial ‘OLAP’ tools ........................................................... 16
5 Spatial autoregressive models for the assessment of land-cover changes ......................................................................................................... 17
References .................................................................................................... 19

Contract no. 212345 | Deliverable no. | 24/12/2011
Description of spatial databases 4/19
LIST OF FIGURES
Figure 1 | UML class diagram of the WP3/WP4 database parameterized for the Auvergne region. ........................................................................................... 9
Figure 2 | Local “HDI-2” on LAU2 municipalities of the Île-de-France region (NUTS FR10), 1999 data. .....................................................................................10
Figure 3 | Estimation of presence rates on LAU2 municipalities of the Auvergne region (NUT FR72), 2005 data. .........................................................10
Figure 4 | An exemple of MAUP. .........................................................................12
Figure 5 | An example of simple geoprocessing operations with LAU2-level municipal boundaries, landcover changes in Auvergne region.......................12
Figure 6 | Four cartographical views of the wards (LAU2 areas) of Eastern midlands, PRIMA’s UK wider case study region.................................................14
Figure 7 | Draft UML diagram class of the ‘Population Distribution / Demography’ spatial data theme.......................................................................16
Figure 8 | Overview of a spatial OLAP architecture. ..........................................16
Figure 9 | 2nd-order Queen contiguity network of the LAU2 municipalities of South Moravia (Czech PRIMA regional case study). ..........................................18
LIST OF TABLES
Table 1 | Two examples of municipal-level downscalings................................10
Table 2 | Relevance of INSPIRE spatial data themes for PRIMA ......................... 15

Contract no. 212345 | Deliverable no. | 24/12/2011
Description of spatial databases 5/19
GENERAL INFORMATION
Task(s) code(s): T6.6
Input from (Task codes): T1.5, T3.2
Output to (Task codes): …
Related milestones: M1.4, M3.7, M3.8, M6.4
CONTACTS
Baptiste Hautdidier Cemagref, ADBX 50, Avenue de Verdun, Gazinet F-33612 Cestas Cedex, France [email protected]

Contract no. 212345 | Deliverable no. | 24/12/2011
Description of spatial databases 6/19
EXECUTIVE SUMMARY
The current report describes shortly the three kinds of spatial databases developed during the PRIMA project: tabular datasets covering the regional case studies, a common GIS, a specific spatially explicit XML data warehouse.
Questions of data availability and use restriction are further discussed. The scarcity of local data can be compensated by the use of proxies or parallel downscaling efforts. Licensing conditions and uncertainties over the status of outputs (scenario-based, weak spatial nature) limits the compliance needs of PRIMA data with the INSPIRE directive. Potential compatibility of PRIMA modelling outputs, in terms of thematic areas, structure and metadata, is assessed. Alternative cartographic visualizations are proposed.
A further emphasis is put on the innovative aspects of the work related to spatial databases: developing a spatial OLAP framework, fitting spatial autoregressive models of landcover transitions on PRIMA regions.

Contract no. 212345 | Deliverable no. | 24/12/2011
Description of spatial databases 7/19
✍ Baptiste Hautdidier
Diana Kopeva
1 INTRODUCTION
Processes of data collection and database structuration are key aspects in the life of a research project. They have been central for the internal exchanges in PRIMA, be them viewed in terms of:
- ‘Work Packages’ (WP1 with T1.5, WP3/4 with T3.2, WP5 with T5.1);
- Disciplines (economics, modelling, geography and GIS Science); and of
- Regional case studies (six in PRIMA regions, including new member states and candidate countries, with varying degrees of involvement in the Eurostat system)
As related in D1.4, the refinement of data needs from the modeling process (i.e. WP3/4/5), in terms of calibration and parameterization, but especially of modeling choices, was an important driver in this respect. While some indicators (eg. those related to land-use intensity) were not essential to the first phase of the model development, others (such as the presence/absence of service facilities) emerged as key drivers of the social-ecological dynamics of LAU1/LAU2 rural areas, sparking thus new data needs and research questions.
As a main consequence of this evolution, the approach followed in the current deliverable will entail a short explanation of the databases, but will mostly focus on the innovative aspects of the related work.
2 A THREE-TIERED APPROACH TO THE MANAGEMENT OF SPATIAL DATA
2.1 A data gathering process in case studies regions
As explained in detail in D1.4, the tabular database fed by the regional partners is divided in 8 modules:
Module A. General. In this section information about territory, population, number of administrative regions on different levels.
Module B. Land. Information about different types of land use – agricultural, forestry, environmental, urban, non-utilized; type of ownership; territory of rural areas; designation of Rural Areas according to the OECD methodology; preserved and protected territories.

Contract no. 212345 | Deliverable no. | 24/12/2011
Description of spatial databases 8/19
✍ Baptiste Hautdidier
Module C. Population/Labour: General information about population – number, age structure, employment in sectors; unemployment; migration; sectoral differences in annual wages of workers by sectors.
Module D. Economic Indicators: GDP, GVA, Foreign Direct Investments (FDI), Number of enterprises.
Module E. Tourism. Number of hotels and accommodation facilities, persons stayed overnight, revenue from tourism, number of projects funded under PAFs/IPA and SFs, as well as amount of funding, and types of activities.
Module F Agriculture: Number of holdings – total and by juridical form; specialization (typology) of holdings; Standard Gross Margin of holdings by typology, output from crop and livestock production, labour force by age groups; labour input in AWU, major occupation of farmer, revenue from agricultural production, projects funded under PAFs/IPA and SFs (number, amount of funding, project aim).
Module G. Forestry: Revenue of forest production, number of enterprises, GFCF in forest products, projects funded under PAFs/IPA and SFs (number, amount of funding, project aim).
Module H. Environment. Expenditures on protection and restoration of the environment; increase of forests and protected areas, territory designated as Nitrate Vulnerable Zone; amount of nitrogen and Phosphorus in the soil, projects funded under PAFs/IPA and SFs (number, amount of funding, project aim).
2.2 A common GIS database
The tabular databases established in WP1 were interconnected with a GIS (ESRI ArcGIS 9.3 geodatabases and shapefiles), comprising inter alia the boundaries of the LAU21 of the case study regions (Milestone M6.4). Geoprocessing operations delivered LAU1 & LAU2 summaries of spatial datasets that were otherwise unavailable at those levels (such as CORINE LandCover, usually supplied in raster or in base polygon format).
A common identifier was built for all the 3149 LAU2 municipalities of the PRIMA regional case studies, based on the concatenation of their overarching Eurostat NUTS3 regional (two-letters and three-digits) and their national LAU2-level code (five-figit).
1 ‘Local Administrative Unit’, the most detailed level of the Eurostat NUTS administrative nomenclature. For an explanation and an updated list, see: http://epp.eurostat.ec.europa.eu/portal/page/portal/nuts_nomenclatu
re/local_administrative_units

Contract no. 212345 | Deliverable no. | 24/12/2011
Description of spatial databases 9/19
2.3 Specific needs and research interests of modellers
Both features (ie. hierarchical relationships and geographical attributes) of the collected data were handed out to WP3/WP4 and WP5, and integrated in a common data warehouse (Cf. Figure 1).
Figure 1 | UML class diagram of the WP3/WP4 database parameterized for the Auvergne region. Source: Cemagref (2010)
3 THE CONSEQUENCES OF WORKING WITH MUNICIPALITIES
A key methodological choice of PRIMA is to opt for municipalities as the base unit of analysis. Equating municipalities with LAU2 areas is not trivial though: the latter, as a statistical level, may not be associated with:
- a political role (as is the case in Bulgaria, where only LAU1 are considered as a relevant entity), or ;
- a functional relevance (in UK, wards are electoral divisions with unstable geometries).
As a result, and in order to make sense for the modelling and the stakeholders, it was decided early on to explicitly include network of municipalities in the modelling process, while keeping LAU2 as ‘base’ bricks.
3.1 Going local when the data is scarce
The often-invoked trade-offs between national/regional & local data could be summarized roughly as an opposition between general, “fast” variables vs. detailed, “slow” variables. We could compare for example the quarterly unemployment figures delivered by a national institute with long-term demographical data built with municipal population registers. The very nature of the data may change when going ‘local’. Three main reasons could be identified for the local unavailability of a given indicator or parameter:

Contract no. 212345 | Deliverable no. | 24/12/2011
Description of spatial databases 10/19
– Data usage is costly (either financially or computationally) – Data may be protected (license restriction, statistical secret) – Data may be irrelevant
We provide with table 1 examples of the stakes raised by two different strategies for the downscaling of regional data.
Table 1 | Two examples of municipal-level downscalings
Human Development Index
Presence rate
Standard version
The Human Development Index, developed for the needs of UNDP’s Human Development Reports as an alternative of GDP, is an index combining three indicators considered as essential component of a development process: - Life expectancy - Literacy rate - GDP See (Stapleton et al., 2007) for a discussion
The ‘presence rate’, an estimation of the population that is actually present in an area over the year, has been elaborated to compensate for the bias of residence-based data for the analysis of rural development patterns
In France, it is delivered at NUTS3 level by the ministry in charge of tourism
“Local” implementation
The ‘Local HDI-2’, proposed by (Boutaud et al., 2007), is a combination at LAU2 level of three alternate indicators:
- Life expectancy (NUTS3) - Rate of 15-yr dropouts - Median income
As proposed by (Talandier, 2007: annex 4, p. 16), a linear regression is built on NUTS3 level, to be later fit on LAU2-level data:
Presence Rate = 69.87 – 0.0008 × Mean Income + 29.44 × IPAT
Where IPAT (indice de potentiel d’accueil touristique) is a ratio of the estimated number of ‘tourism’ beds on the actual population
Maps
Figure 2 | Local “HDI-2” on LAU2 munici-palities of the Île-de-France region (NUTS FR10), 1999 data. Source : IAURIF (Boutaud et al., 2007)
Figure 3 | Estimation of presence rates on LAU2 municipalities of the Auvergne region (NUT FR72), 2005 data. Source: own figure, INSEE data
Contract no. 212345 | Deliverable no. | 24/12/2011
Description of spatial databases 11/19
In the 1st case, the use of relevant proxies (dropouts, median income) is favored over an unquestioned localization of the indicator. In the case of the ‘life expectancy’ component of the local-HDI2, it is relevant to note that it is available at a regional level (NUTS3): it can be downscaled in some urban areas but its proponents consider that the resulting data should be considered with caution, due to the inherent imprecision associated with lifetime migration patterns.
The second example illustrates a different strategy, where the downscaling at LAU2 level is achieved by relying on a linear model fitted with regional data (NUTS3). Such use of linear models is powerful but implies a thorough multilevel examination, as the relationship may not be scale-invariant.
Working with municipal data covering the whole metropolitan France, Hautdidier & Kuentz (2011) tested a scaling relationship proposed by (Um et al., 2009). The argument is the following:
1. there is a relationship between the density of population (ρ) and facilities (D) of the form D ≈ ρ α;
2. the optimal values of α are either 1 or 2/3, whether the facilities are respectively of a commercial or a public kind;
3. a simple model can account for the latter kind.
Encompassing a broad (~140) list of facilities, the empirical assessment revealed inconsistent patterns between various levels of the NUTS/LAU hierarchy, sparking the need for an alternative approach. After attributing point locations to each facility, we constructed new tessellations (‘clipped Voronoi maps’ in ESRI ARCINFO) approximating potential attraction basins in a continuous Euclidean space. Estimating the populations covered by these basins with two methods, we were thus able to build a new tabular dataset of population and facility densities, on which we fit linear models. These refined results led to a much more robust diagnosis, confirming -once the specific patterns of health facilities removed- empirical values of 1 and 2/3 for public & commercial facilities.
3.2 Beware the MAUP!
This issue, labelled as ‘change of support problem ’ or MAUP (Modifiable Area Unit Problem), is characterised by two components: (i) Some variability is lost when upscaling; (ii) There is a spatial mismatch between spatially autocorrelated data and the administrative tessellations. Fig. 4 illustrates a case of MAUP, where the shapes of the tessellation chosen for the upscaling lead (in b, c, d) to different average values, at ‘overall’ & regional levels.

Contract no. 212345 | Deliverable no. | 24/12/2011
Description of spatial databases 12/19
Figure 4 | An exemple of MAUP. Source: own figure
MAUP is not an unavoidable problem but should be acknowledged for, and can partly be overcome with bottom-up approaches. The use of LAU2-level data is favoured, but grid-based data may also be relevant, requiring processing work and geostatistical methods (disaggregation, krigeing…). Indicators can indeed be available in raster format, eg. population density (released by the EEA or CIESIN), or landcover (Cf. infra for an example with CORINE landcover). Such a grid-based approach was opted for example by (van Eupen et al., in press), where the superposition of 1-km² raster maps led to an EU-wide typology of rural areas.
3.3 Boundaries as workarounds
A central tool when dealing with ‘change of support’ issues, administrative geometries allows for the crosstabulation of factors, or the averaging of continuous variables.
Figure 5 | An example of simple geoprocessing operations with LAU2-level municipal boundaries, landcover changes in Auvergne region. Source: own figure

Contract no. 212345 | Deliverable no. | 24/12/2011
Description of spatial databases 13/19
As described by the flowchart of fig. 5, the availability of municipal boundaries for a given region allows to estimate for each LAU2 municipality the areas where landcover changes have been identified in the CORINE LandCover database over the 1990-2000 & 2000-2006 periods. By relying on the LEAC nomenclature (Land & Ecosystem Accounts) developed for the EEA, it is further possible to simplify the 44×43 potential transitions into nine broad categories of land-change processes (land cover flows) (Haines-Young et al., 2006), without losing the initial 1-ha resolution.2
3.4 Costs and use restrictions, INSPIRE compliance
3.4.1 INSPIRE, geographical outputs
In 2008, a notable share of European countries were maintaining pricing & licensing conditions over GIS datasets describing the geometries of their local administrations. Typically, the use could be restricted to national public bodies, or to a research consortium during the only duration of a project3.
One can note that Eurogeographics, the EU-wide association of national surveys and geodetic institutes remains in late 2011 the sole distributor of a commercial product comprising the local administrative boundaries of 36 countries. Yet the overall situation has evolved, resulting partly from the introduction of the INSPIRE directive. In the UK for example, an OpenData initiative led to an important release of geospatial data, including ward-level boundaries but also lower-levels statistical areas, such as Lower Layer Super Output Areas. Accordingly, the French Survey Institute IGN made its GeoFla® product freely available in dec. 2011. The parallel spread of open-source alternatives such as OpenStreetMap should also be noted. By the end of 2011, the digitalization of French LAU2 municipal boundaries was for example reaching completion4.
The INSPIRE directive (Directive 2007/2/EC of the European Parliament on March 14, 2007) 5 aims to “ensure that the spatial data infrastructures of the Member States are compatible and usable in a Community and transboundary context, [and] requires that common implementing rules are
2 Such a procedure was implemented with the geoprocessing tools of ESRI ARCGIS but can be easily translated to open-source frameworks (eg. QGIS with RGDAL).
3 It was the case for PRIMA, for the regional case studies located in Czech Republic, France & Germany.
4 72% progress on the 1st of december for the whole country; 59% on the 14st of December for the Auvergne region
5 http://inspire.jrc.ec.europa.eu/

Contract no. 212345 | Deliverable no. | 24/12/2011
Description of spatial databases 14/19
adopted in a number of specific areas (metadata, data specifications, network services, data and service sharing and monitoring and reporting)”.
3.4.2 INSPIRE, geographical outputs
As long as it is considered as ‘spatial’, a very broad range of public data, including research results, is in the scope of INSPIRE. Reaching a compromise with the aforementioned use restrictions becomes difficult to attain. Figure 6 exhibits such attempts for PRIMA’s output visualization.
Figure 6 | Four cartographical views of the wards (LAU2 areas) of Eastern midlands, PRIMA’s UK wider case study region. (in dark grey: the network of wards modelled in WP4/WP4). Source: own figure
Figure 6 starts with a conformal map, then proposes three cartograms, preserving thus either the general topology and geometry (6a/6c, a

Contract no. 212345 | Deliverable no. | 24/12/2011
Description of spatial databases 15/19
contiguous cartogram6) or the areas (6a/6b7, while 6c/6d entities are sized proportionally to the ward’s populations). These three latter layouts are freely shareable. But paradoxically, as they imply non negligible spatial distortions, they cannot easily be included as mashable layers in a SDI, and can thus arguably be considered as falling outside the scope of the INSPIRE directive.
A more radical visualization is to remove entirely the spatial reference, only to keep the hierarchical relationships between entities. See (Hautdidier, 2011a) for such a proposal with the whole Eurostat set of NUTS regions.
3.4.3 INSPIRE, topics, structure, metadata
The INSPIRE directive covers 34 spatial themes, described in 3 annexes with different timelines and priority orders. Table 2 offers a short display of the thematic areas that are of relevance for PRIMA.
Table 2 | Relevance of INSPIRE spatial data theme for PRIMA
Potential status for PRIMA
Annex Spatial data theme Required inputs
Possible outputs
4. Administrative units ���� - I
9. Protected areas ���� ����
II 2. Land-cover ���� ����
1. Statistical units ���� -
4. Land-use (actual & planned) ���� ����
6. Utility & governmental services ���� ����
8. Production & industrial facilities ���� ����
9. Agricultural & aquaculture facilities ���� ����
III
10. Population distribution & demography ���� ����
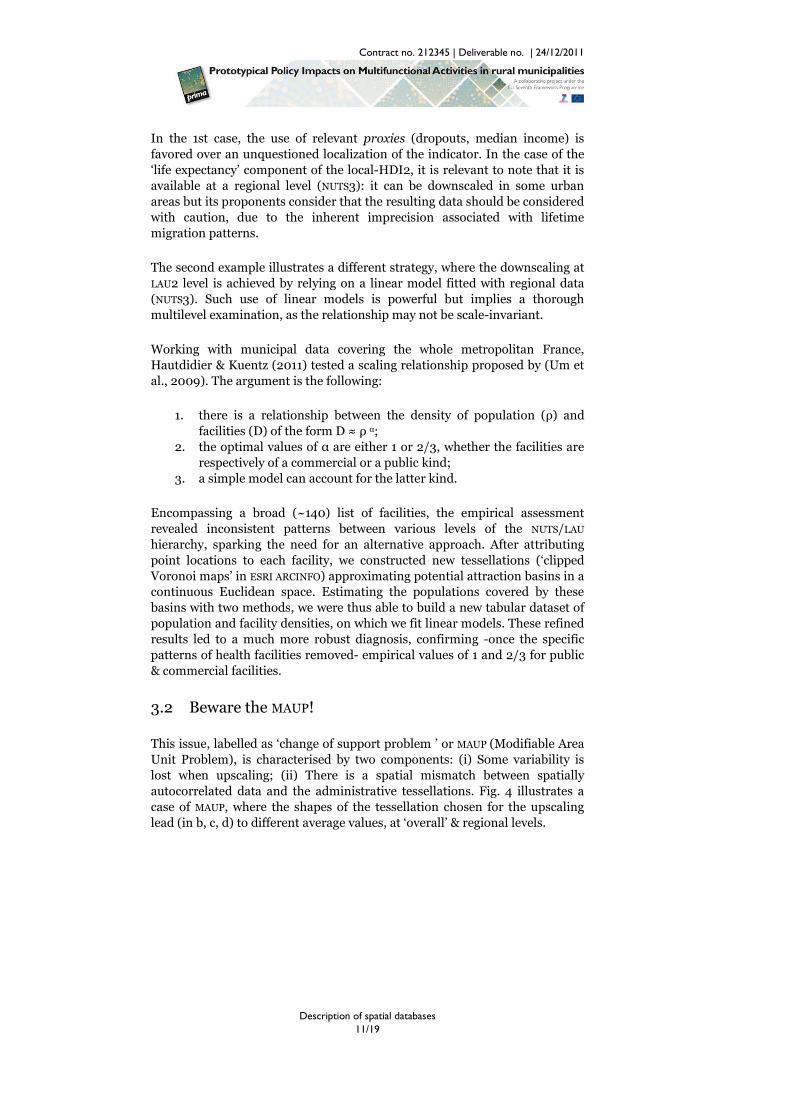
Considering the discussion that was ongoing in late 2011, it appears likely that the expected INSPIRE-compliant rules for data & metadata structure will impact topics crucial for PRIMA’s WP3/WP4 models. For an overview of the ‘demography’ data theme, see (INSPIRE Thematic Working Group Population Distribution - Demography, 2011: 10), and fig. 6. Considering however methodological choices retained for the modelling outputs (semi-structured data, XML), future interoperability will be straightforward on these core data themes.
6 Following the algorithm introduced by (Gastner et al., 2004). Implemented with Scapetoad: http://scapetoad.choros.ch/
7 Dorling cartograms : http://mbostock.github.com/protovis/ex/cartogram.html
Contract no. 212345 | Deliverable no. | 24/12/2011
Description of spatial databases 16/19
✍ Hadj Mahboubi
Baptiste Hautdidier
Figure 7 | Draft UML diagram class of the ‘Population Distribution / Demography’ spatial data theme, source: INSPIRE
4 DATA CUBES, SPATIAL ‘OLAP’ TOOLS
One will refer to (Mahboubi et al., 2011; Mahboubi et al., 2010) as well as (Mahboubi et al., Submitted) for an overview of the specific database developments related to the modeling framework.
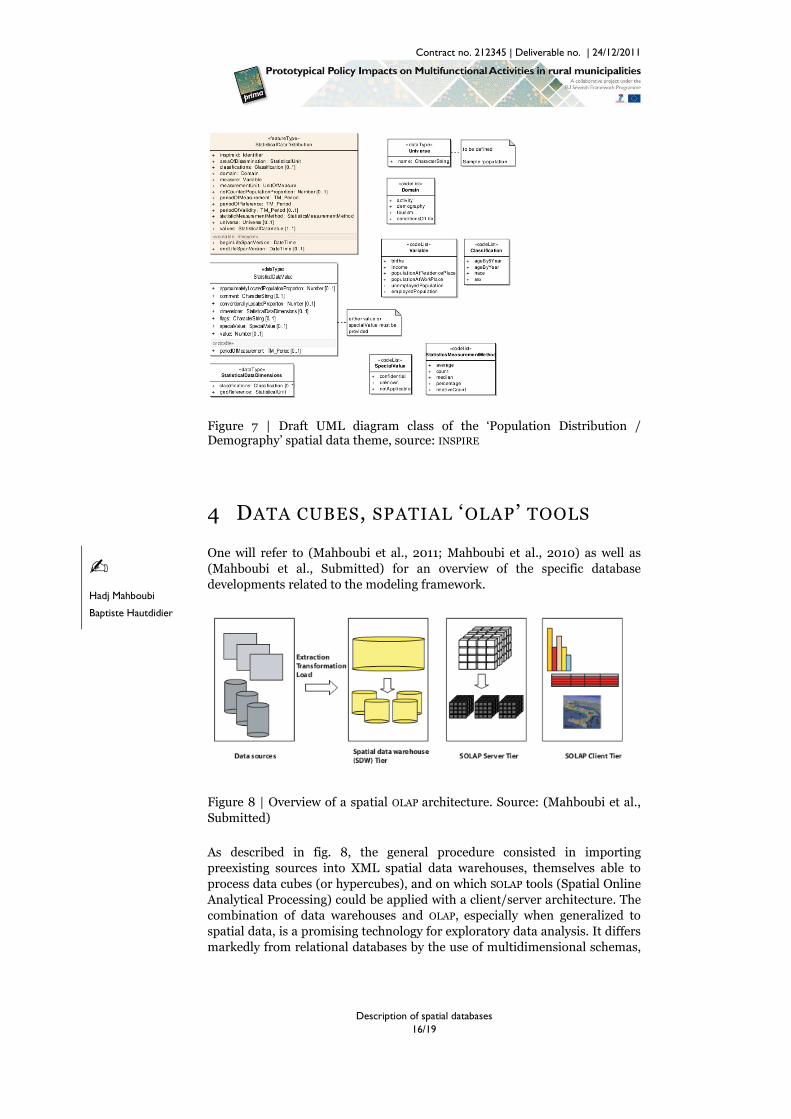
Figure 8 | Overview of a spatial OLAP architecture. Source: (Mahboubi et al., Submitted)
As described in fig. 8, the general procedure consisted in importing preexisting sources into XML spatial data warehouses, themselves able to process data cubes (or hypercubes), and on which SOLAP tools (Spatial Online Analytical Processing) could be applied with a client/server architecture. The combination of data warehouses and OLAP, especially when generalized to spatial data, is a promising technology for exploratory data analysis. It differs markedly from relational databases by the use of multidimensional schemas,

Contract no. 212345 | Deliverable no. | 24/12/2011
Description of spatial databases 17/19
✍ Baptiste Hautdidier
defined by: (i) facts, described by one or several measures (ie. measures, indicators): (ii) dimensions, representing observation strategies, organized in hierarchies.
The successful implementation on PRIMA’s networks of municipalities helped to demonstrate significant advances on the following research challenges:
• Improve user-driven approaches to data exploration by the semi-automatic implementation of multidimensional schemas
• Ensure flexibility and interactivity through multidimensional representations of model outputs
• Handle efficiently the semi-structured nature of models outputs.
5 SPATIAL AUTOREGRESSIVE MODELS FOR THE ASSESSMENT OF LAND-COVER CHANGES
We conclude here by a short insight on results solely derived on the empirical analysis of the common spatial database (Hautdidier, 2011b). When it appeared that, due to time constraints, landuse and landcover would not be at the core of PRIMA’s agent-based and microsimulation models, spatial regression techniques arose as relevant complementary tools for defining realistic ranges of future landcover transitions on PRIMA’s municipalities.
This interest was also based on other shortcomings: CORINE Land Cover does not capture well local incremental changes, municipality clusters (defined in M1.4) were not necessarily homogeneous in terms of landcover change patterns. While refinement was possible for specific transitions (forest), it remained difficult to ascertain generalization effects, commission errors and structural/contextual changes
Considering transitions over 1990-2000 and 2000-2006 as learning data that could be used for inferring future trends, spatial autoregressive models were introduced in order to answer the following questions:
• Does any spatial smoothing compensate for the grainy nature of CLC data?
• To what extent are past trends related to more recent changes ? • Are there any categories of landcover transitions associated with
specific spatiotemporal patterns?
Three kinds of models
• Spatial lag model : y = ρWy + Xβ + ε • Spatial error model: y = Xβ + ε, where: ε = λWε + u • Spatial Durbin model: y = ρWy + Xβ + σWx + ε

Contract no. 212345 | Deliverable no. | 24/12/2011
Description of spatial databases 18/19
where X and y are respectively associated to 1990-2000 and 2000-2006 broad categories of landcover transitions, Cf. (Haines-Young et al., 2006) and § 3.3.
W are spatial weight matrices that describe the neighbouring relationships of municipalities. As described in fig. 9, geoprocessing tools can map these neighbourhoods in a straightforward manner, with GIS files of boundariesas inputs8. Once exported in a tabular format for their inclusion in statistical models, these weights can then be considered as a ‘degraded’ form of spatiality.
Figure 9 | 2nd-order Queen contiguity network of the LAU2 municipalities of South Moravia (Czech PRIMA regional case study). Source: own figure
The procedure was then the following:
1. Run OLS regressions, run tests for spatial dependence 2. Run autoregressive models 3. Compare outputs with ANOVA, AIC
It appeared that for some land-cover transition associated with agriculture or forest, the added value of autoregressive models -especially the spatial Durbin (mixed)- was clear. For others, such as internal urban transitions or changes related to waterbodies, basic OLS models were not outperformed. In other words, regional trends make sense for some landcover change processes. But for others, such a quest is much more delusional, requiring a longer-term and/or landscape perspectives, as well as more complex models.
8 The open-source software OpenGeoda takes in charge most of these steps, but the R package spdep is even more complete, including inter alia the spatial Durbin

Contract no. 212345 | Deliverable no. | 24/12/2011
Description of spatial databases 19/19
REFERENCES
BOUTAUD A. ; MENDEZ A. ; NASCIMENTO I. (2007) Les indices synthétiques du PNUD : IDH, IPH, IPF en région Île-de-France. IAURIF, Paris. http://www.iaurif.org/fileadmin/Etudes/etude_369/pdf_les_indices_synthetiques_du_PNUD_ia_48459.pdf
GASTNER M.T. ; NEWMAN M.E.J. (2004) Diffusion-based method for producing density-equalizing maps. Proceedings of the National Academy of Sciences of the United States of America, vol. 101, n° 20, p. 7499-7504. http://www.pnas.org/content/101/20/7499.abstract
HAINES-YOUNG R. ; WEBER J.-L. (2006) Land accounts for Europe 1990–2000. Towards integrated land and ecosystem accounting. Rap. n° 11. European Environment Agency, Copenhagen. http://www.eea.europa.eu/publications/eea_report_2006_11/at_download/file
HAUTDIDIER B. (2011a) Featured graphic: What's in a NUTS? Visualizing hierarchies of Europe's administrative/statistical regions. Environment and Planning A, vol. 43, n° 8, p. 1754-1755. http://dx.doi.org/10.1068/a4457
HAUTDIDIER B. (2011b) Regional trends or local shocks? Typologies and spatial statistics for the assessment of landcover transitions in European rural municipalities. In: PRIMA final conference, IADT/Cemagref, Clermont-Ferrand, 27-28/10/2011.
HAUTDIDIER B. ; KUENTZ V. (2011) Quelles invariances d'échelle entre densité de la population et des équipements ? Une approche empirique sur données communales françaises. In: Rencontres de Théo Quant 2011, 23/02/2011 - 25/02/2011, Besançon, FRA, p. 32. http://thema.univ-fcomte.fr/theoq/pdf/resumes/TQ2011%20RESUMES.pdf
INSPIRE THEMATIC WORKING GROUP POPULATION DISTRIBUTION - DEMOGRAPHY (2011) D2.8.III.10 Data Specification on Population Distribution - Demography – Draft Guideline. http://inspire.jrc.ec.europa.eu/documents/Data_Specifications/PD_2.0.1.pdf
MAHBOUBI H. ; BIMONTE S. ; DEFFUANT G. (2011) Analyzing demographic and economic simulation model results: a semi-automatic spatial OLAP approach. Lecture Notes in Computer Science, vol. 6782, p. 17-31. http://dx.doi.org/10.1007/978-3-642-21928-3_2
MAHBOUBI H. ; BIMONTE S. ; DEFFUANT G. ; PINET F. ; JEAN-PIERRE CHANET (Submitted) Semi-automatic Design of Spatial Data Cubes from Structurally Generic Simulation Model Results. Decision Support Systems.
MAHBOUBI H. ; FAURE T. ; BIMONTE S. ; DEFFUANT G. ; CHANET J.P. ; PINET F. (2010) A multidimensional model for data warehouses of simulation results. International Journal of Agricultural and Environmental Information Systems IJAEIS, vol. 1, n° 2, p. 1-19. http://dx.doi.org/10.4018/jaeis.2010070101
STAPLETON L. ; GARROD G. (2007) Keeping things simple: why the Human Development Index should not diverge from its equal weights assumption. Social Indicators Research, vol. 84, n° 2, p. 179-188. http://dx.doi.org/10.1007/s11205-006-9081-3
TALANDIER M. (2007) Un nouveau modèle de développement hors métropolisation. Le cas du monde rural français. Thèse de doctorat nouveau régime en Urbanisme, Aménagement et Politiques urbaines, Université Paris-XII, Institut d’Urbanisme de Paris, Paris, 479 p. http://talandier.com/thesetalandier.pdf
UM J. ; SON S.-W. ; LEE S.-I. ; JEONG H. ; KIM B.J. (2009) Scaling laws between population and facility densities. Proceedings of the National Academy of Sciences, vol. 106, n° 34, p. 14236-14240. http://dx.doi.org/10.1073/pnas.0901898106
VAN EUPEN M. ; METZGER M.J. ; PÉREZ-SOBA M. ; VERBURG P.H. ; VAN DOORN A. ; BUNCE R.G.H. (in press) A rural typology for strategic European policies. Land Use Policy, n° 0. http://dx.doi.org/10.1016/j.landusepol.2011.07.007


![Spatial Databases - Semantic Scholar · Spatial Databases 1.1 Introduction 1.1.1 Spatial Database Spatial database management systems [43, 58, 120, 119, 97, 74] aim at the effective](https://img.pdfslide.us/doc/110x75/5edc6310ad6a402d666706d6/spatial-databases-semantic-scholar-spatial-databases-11-introduction-111-spatial.jpg)