Embed Size (px)
Citation preview
D3 Tutorial Shapes
EditbyJiayiXuandHan-WeiShen,TheOhioStateUniversity
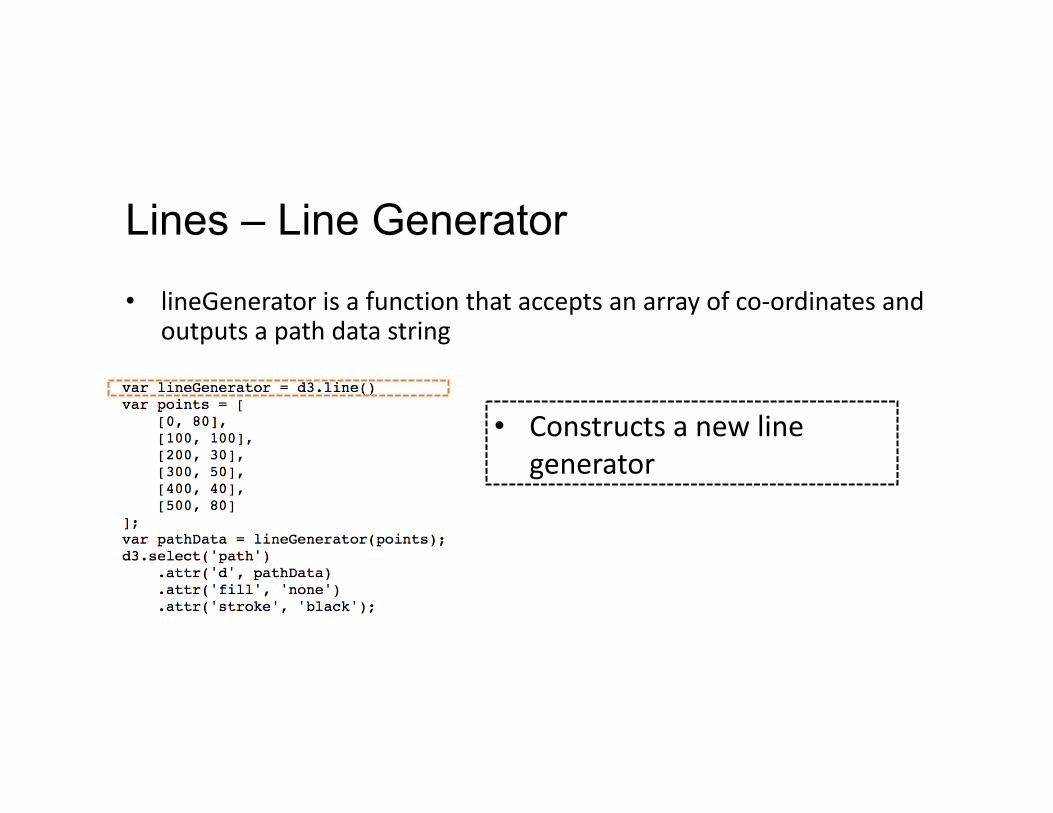
• lineGeneratorisafunctionthatacceptsanarrayofco-ordinatesandoutputsapathdatastring
Lines – Line Generator
• Constructsanewlinegenerator
Lines – Line Generator
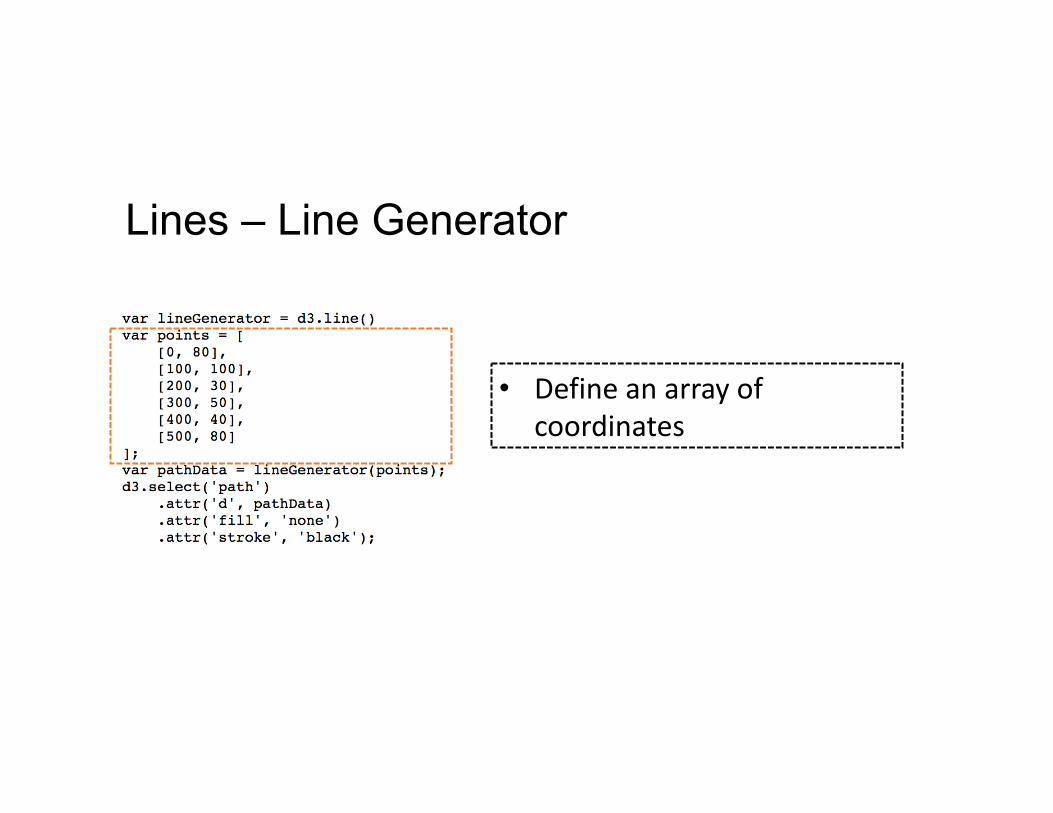
• Defineanarrayofcoordinates
Lines – Line Generator
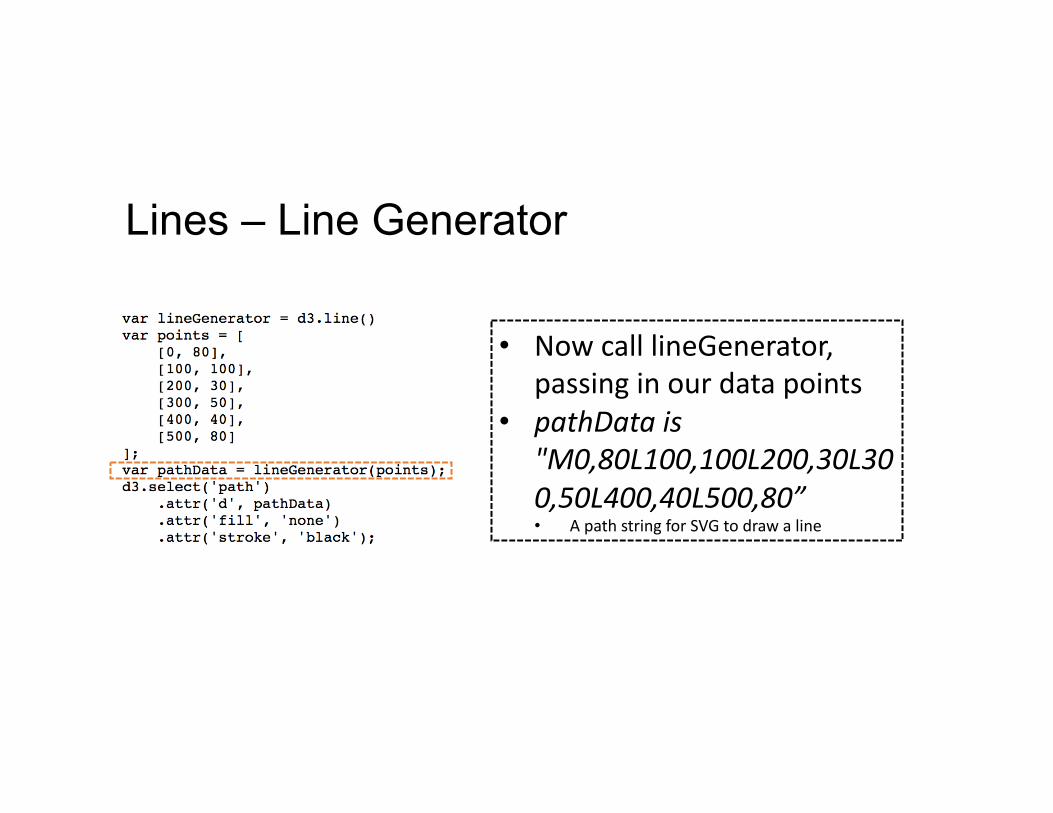
• NowcalllineGenerator,passinginourdatapoints
• pathDatais"M0,80L100,100L200,30L300,50L400,40L500,80”• ApathstringforSVGtodrawaline
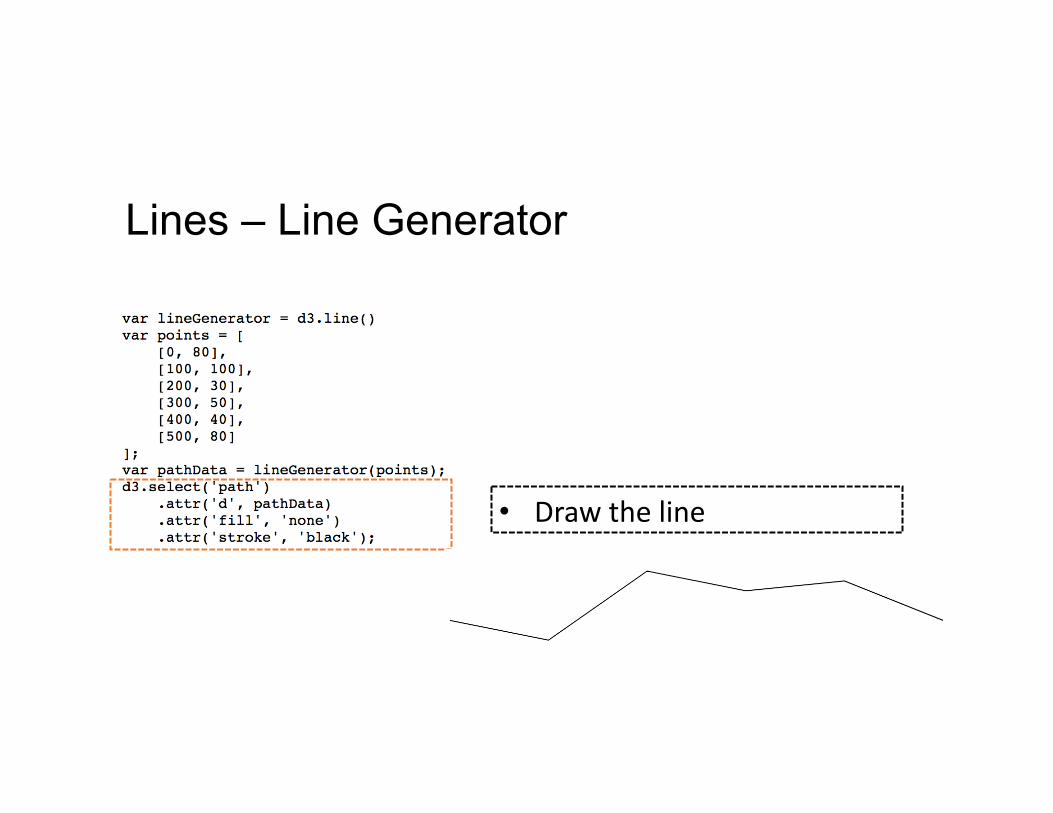
Lines – Line Generator
• Drawtheline
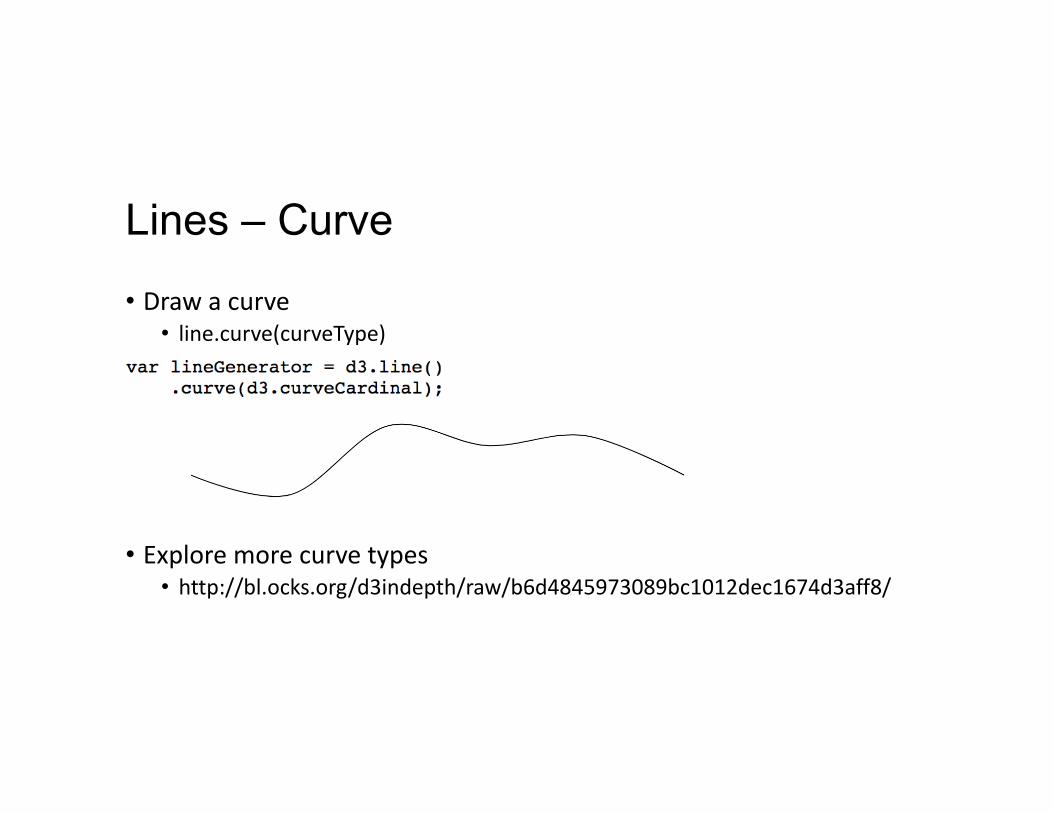
Lines – Curve
• Drawacurve• line.curve(curveType)
• Exploremorecurvetypes• http://bl.ocks.org/d3indepth/raw/b6d4845973089bc1012dec1674d3aff8/
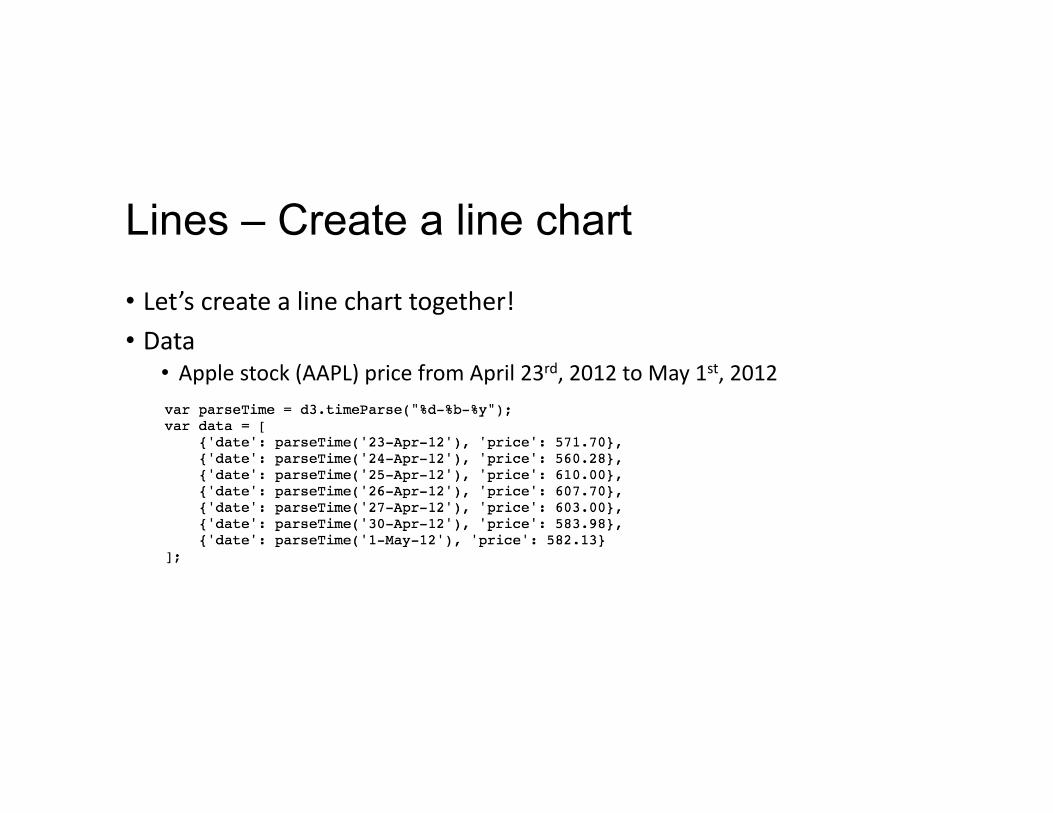
• Let’screatealinecharttogether!• Data
• Applestock(AAPL)pricefromApril23rd,2012toMay1st,2012
Lines – Create a line chart
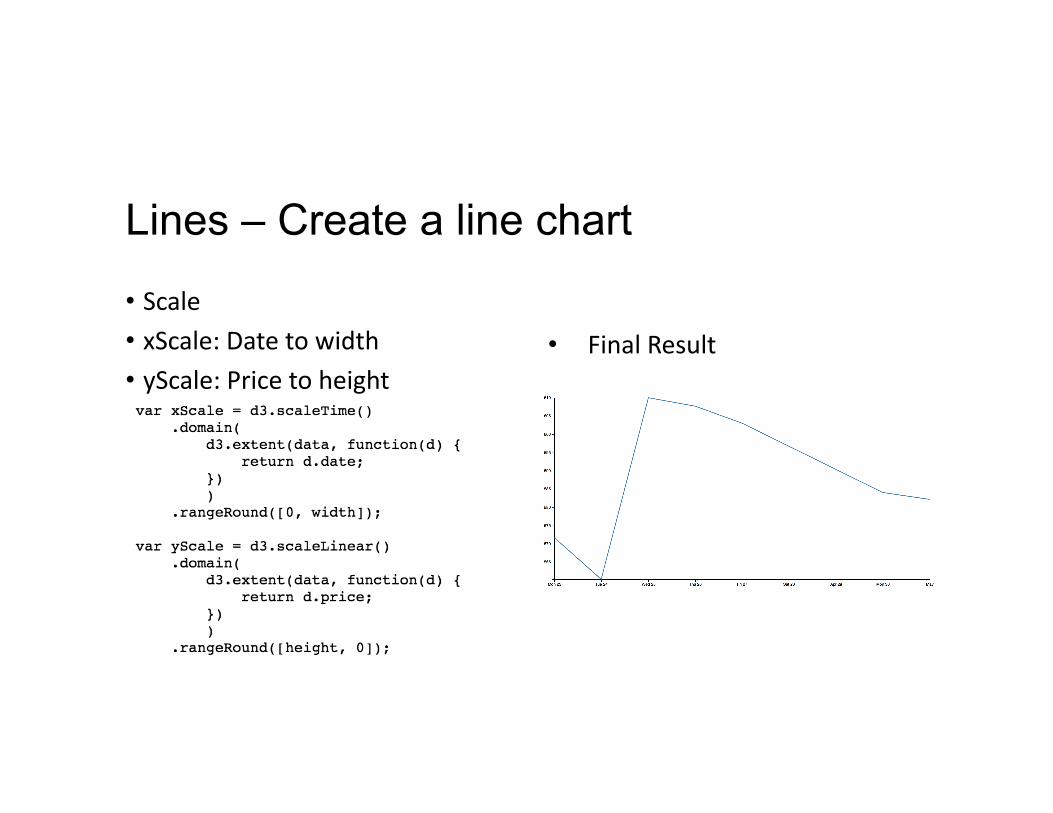
• Scale• xScale:Datetowidth• yScale:Pricetoheight
Lines – Create a line chart
• FinalResult
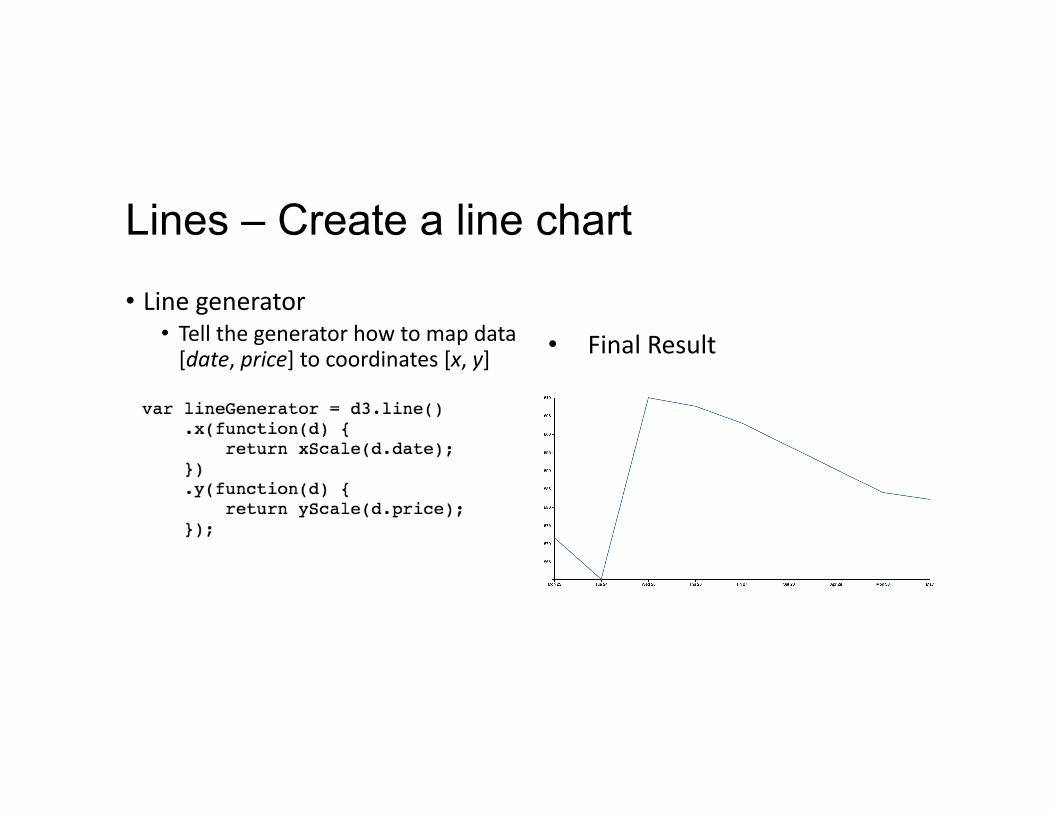
• Linegenerator• Tellthegeneratorhowtomapdata[date,price]tocoordinates[x,y]
Lines – Create a line chart
• FinalResult
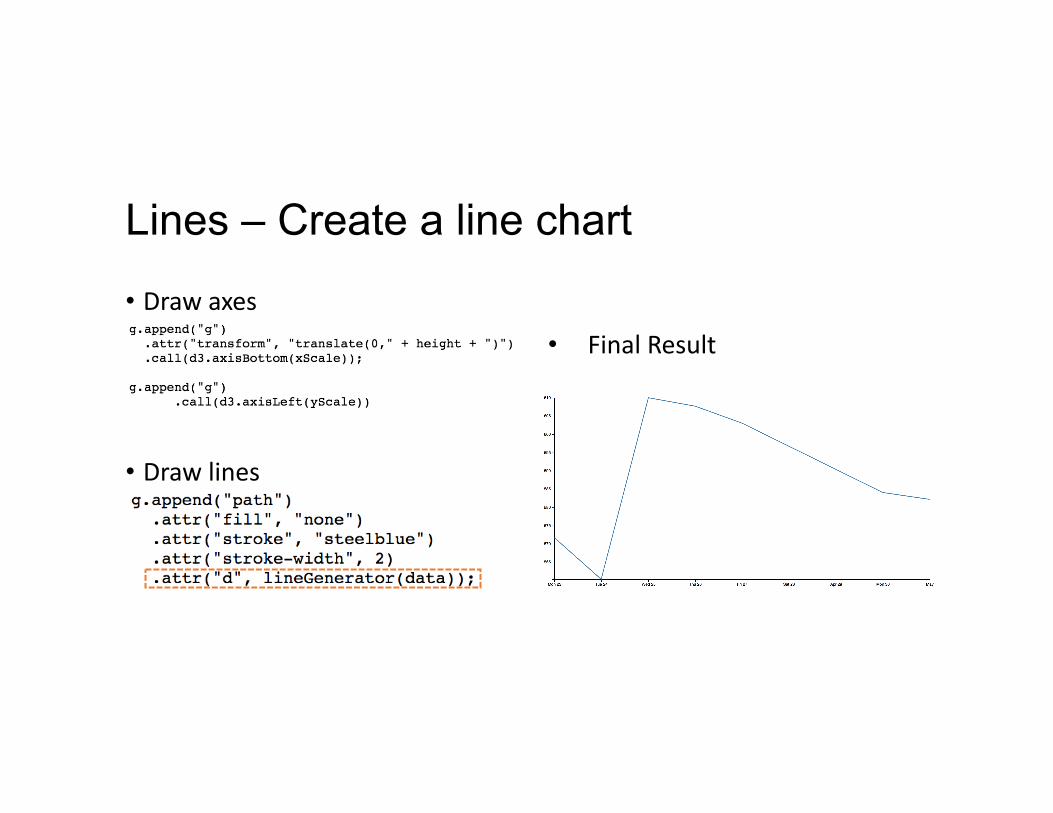
• Drawaxes
• Drawlines
Lines – Create a line chart
• FinalResult
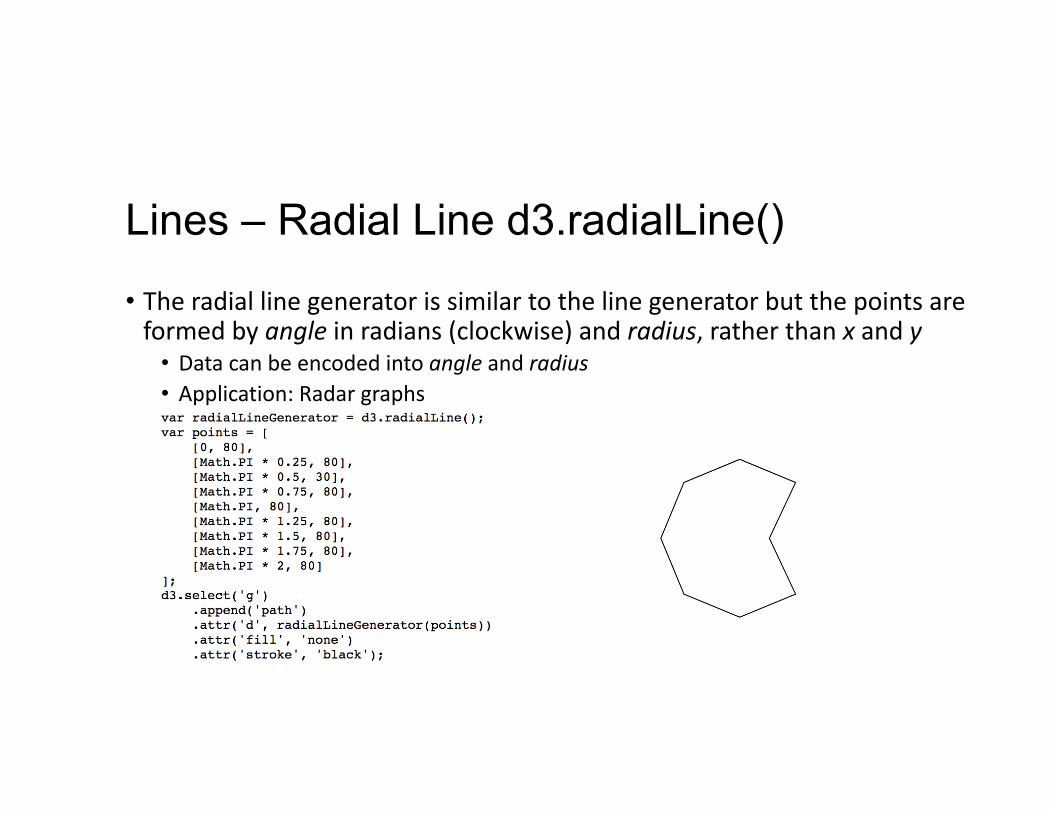
• Theradiallinegeneratorissimilartothelinegeneratorbutthepointsareformedbyangleinradians(clockwise)andradius,ratherthanxandy
• Datacanbeencodedintoangleandradius• Application:Radargraphs
Lines – Radial Line d3.radialLine()
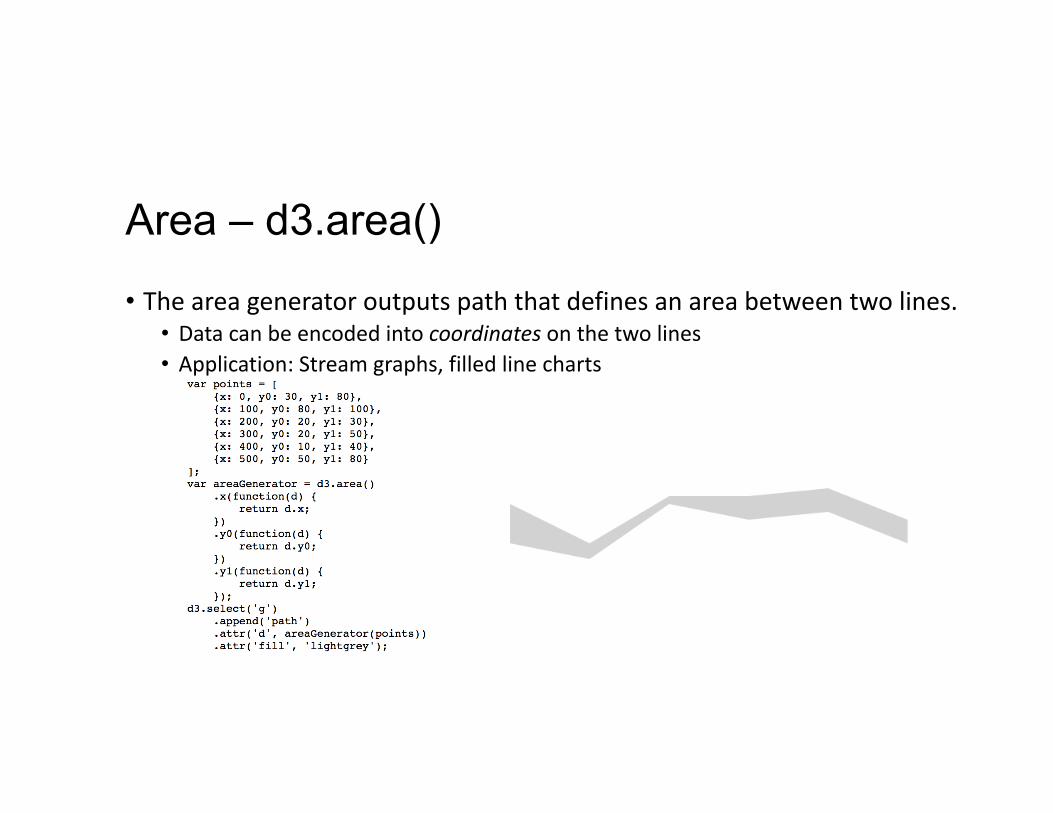
• Theareageneratoroutputspaththatdefinesanareabetweentwolines.• Datacanbeencodedintocoordinatesonthetwolines• Application:Streamgraphs,filledlinecharts
Area – d3.area()
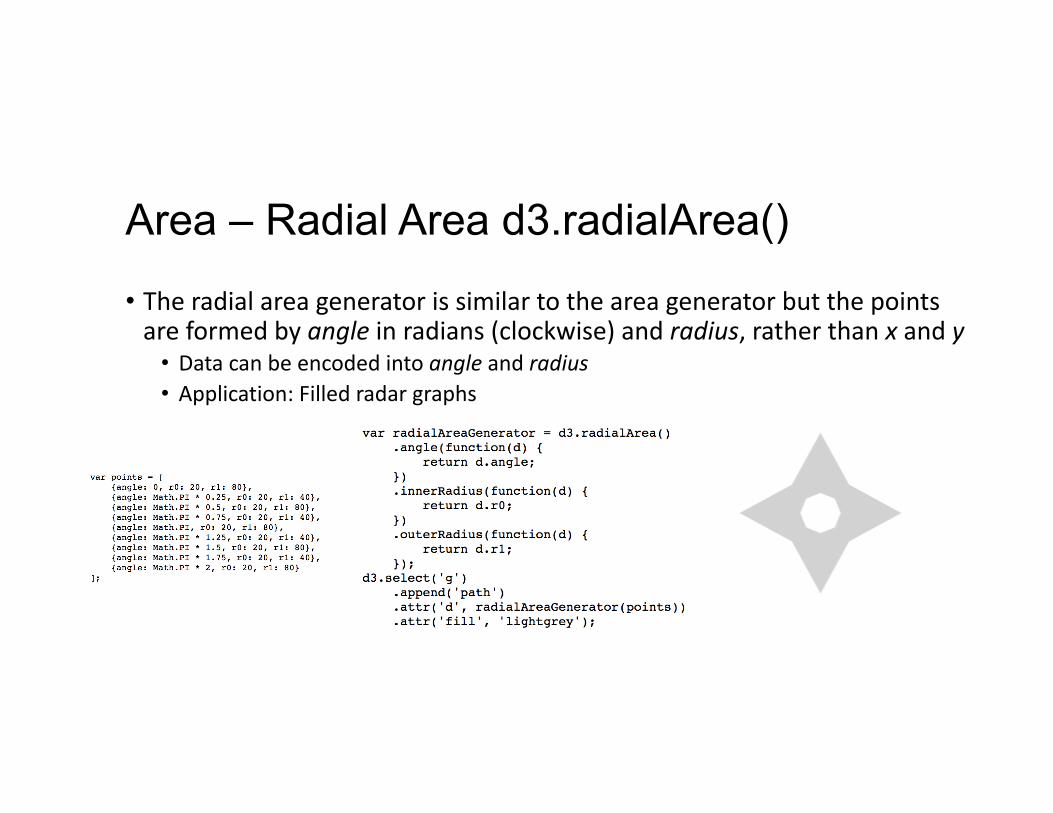
• Theradialareageneratorissimilartotheareageneratorbutthepointsareformedbyangleinradians(clockwise)andradius,ratherthanxandy
• Datacanbeencodedintoangleandradius• Application:Filledradargraphs
Area – Radial Area d3.radialArea()
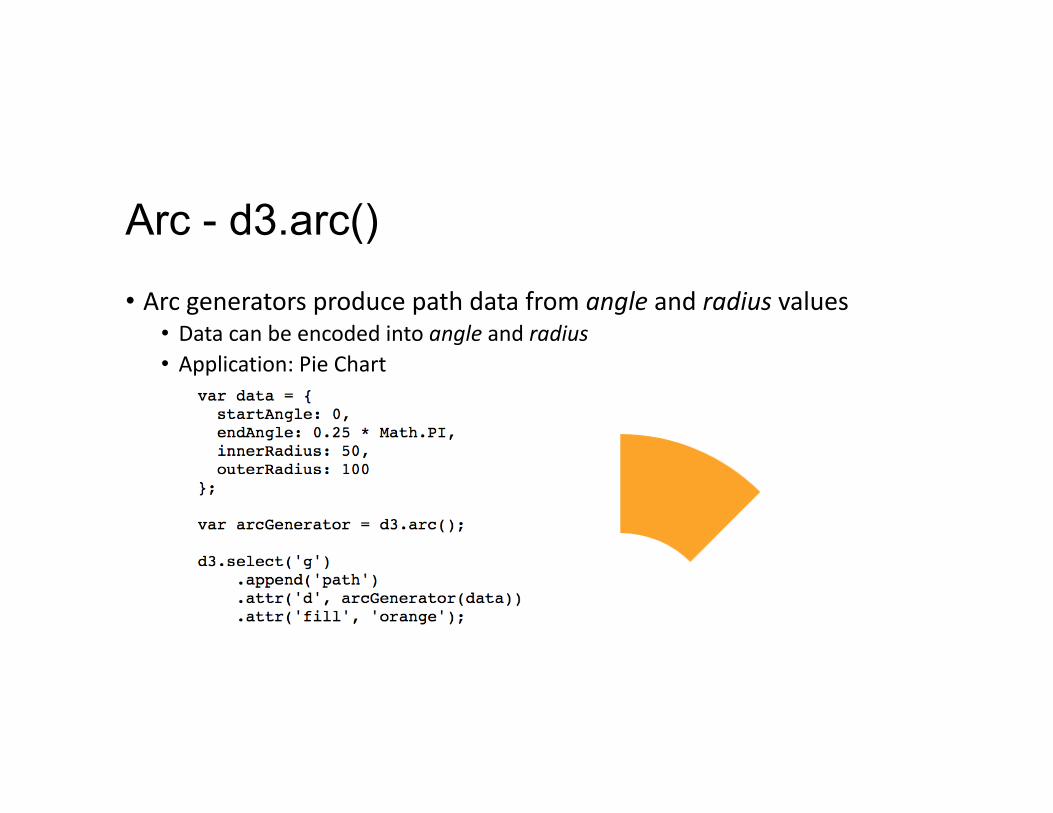
Arc - d3.arc()
• Arcgeneratorsproducepathdatafromangleandradiusvalues• Datacanbeencodedintoangleandradius• Application:PieChart
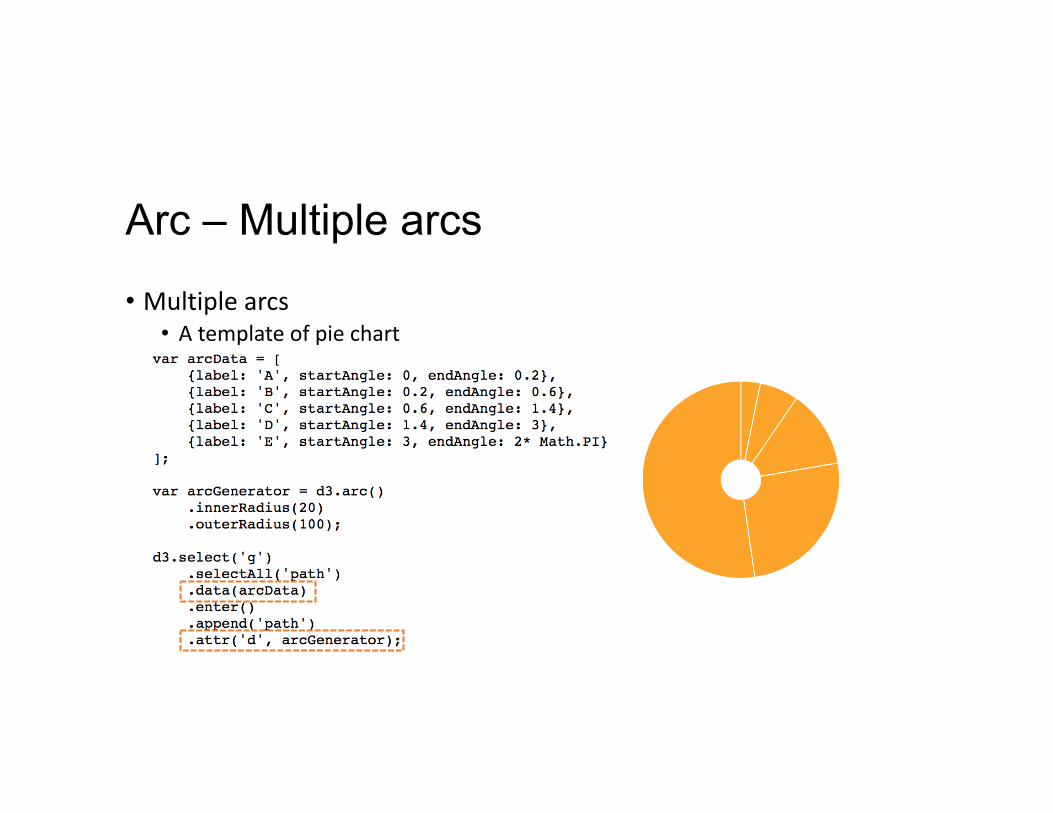
Arc – Multiple arcs
• Multiplearcs• Atemplateofpiechart
Symbols - d3.symbol()
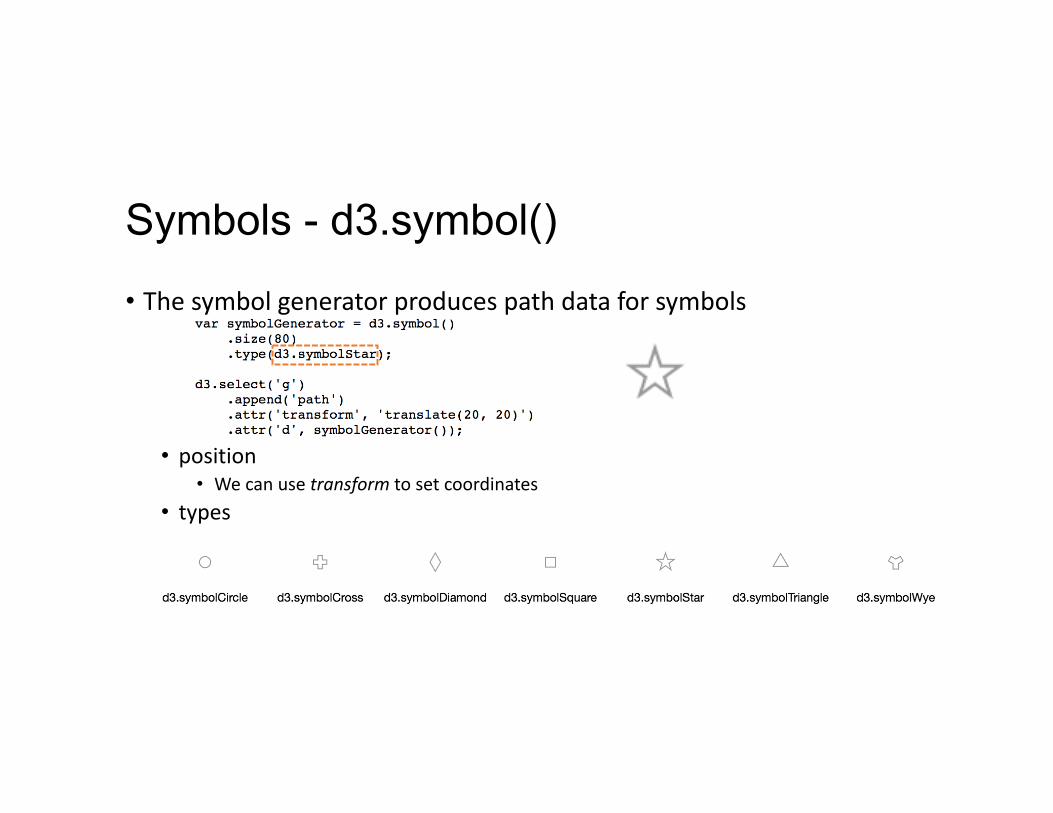
• Thesymbolgeneratorproducespathdataforsymbols
• position• Wecanusetransformtosetcoordinates
• types