Embed Size (px)
Citation preview

D3: Abnormal Driving Behaviors Detection andIdentification Using Smartphone Sensors
Zhongyang Chen∗, Jiadi Yu∗‡, Yanmin Zhu∗, Yingying Chen† and Minglu Li∗∗Department of Computer Science and Engineering, Shanghai Jiao Tong University, Shanghai, P.R.China
Email: {wodoo2474, jiadiyu, yzhu, mlli}@sjtu.edu.cn†Department of Electrical and Computer Engineering, Stevens Institute of Technology, Hoboken, USA
Email: [email protected]‡Corresponding Author
Abstract—Real-time abnormal driving behaviors monitoring is acorner stone to improving driving safety. Existing works on drivingbehaviors monitoring using smartphones only provide a coarse-grained result, i.e. distinguishing abnormal driving behaviors fromnormal ones. To improve drivers’ awareness of their driving habitsso as to prevent potential car accidents, we need to consider a fine-grained monitoring approach, which not only detects abnormaldriving behaviors but also identifies specific types of abnormaldriving behaviors, i.e. Weaving, Swerving, Sideslipping, Fast U-turn, Turning with a wide radius and Sudden braking. Throughempirical studies of the 6-month driving traces collected fromreal driving environments, we find that all of the six types ofdriving behaviors have their unique patterns on acceleration andorientation. Recognizing this observation, we further propose a fine-grained abnormal Driving behavior Detection and iDentificationsystem, D3, to perform real-time high-accurate abnormal drivingbehaviors monitoring using smartphone sensors. By extractingunique features from readings of smartphones’ accelerometer andorientation sensor, we first identify sixteen representative featuresto capture the patterns of driving behaviors. Then, a machinelearning method, Support Vector Machine (SVM), is employed totrain the features and output a classifier model which conductsfine-grained identification. From results of extensive experimentswith 20 volunteers driving for another 4 months in real drivingenvironments, we show that D3 achieves an average total accuracyof 95.36%.
I. INTRODUCTION
According to the statistics from World Health Organization(WHO), traffic accidents have become one of the top 10 leadingcauses of death in the world[1]. Specifically, traffic accidentsclaimed nearly 3500 lives each day in 2014. Studies show thatmost traffic accidents are caused by human factors, e.g. drivers’abnormal driving behaviors [2]. Therefore, it is necessary todetect drivers’ abnormal driving behaviors to alert the driversor report Transportation Bureau to record them.
Although there has been works[3][4][5] on abnormal drivingbehaviors detection, the focus is on detecting driver’s statusbased on pre-deployed infrastructure, such as alcohol sensor,infrared sensor and cameras, which incur high installation cost.Since smartphones have received increasing popularities over therecent years and blended into our daily lives, more and moresmartphone-based vehicular applications[6][7][8] are developedin Intelligent Transportation System. Driving behavior analysisis also a popular direction of smartphone-based vehicular ap-
(a) (b) (c) (d) (e) (f)Fig. 1: Six types of abnormal driving behaviors: (a) Weaving,(b) Swerving, (c) Sideslipping, (d) Fast U-turn, (e) Turning witha wide radius, (f) Sudden braking.
plications. However, existing works[9][10] on driving behaviorsdetection using smartphones can only provide a coarse-grainedresult using thresholds, i.e. distinguishing abnormal driving be-haviors from normal ones. Since thresholds may be affectedby car type and sensors’ sensitivity, they cannot accuratelydistinguish the differences in various driving behavioral patterns.Therefore, Those solutions cannot provide fine-grained identifi-cation, i.e. identifying specific types of driving behaviors.
Moving along this direction, we need to consider a fine-grained abnormal driving behaviors monitoring approach usingsmartphone sensors without requiring any additional hardwares.The fine-grained abnormal driving behaviors monitoring is ableto improve drivers’ awareness of their driving habits as mostof the drivers are over-confident and not aware of their recklessdriving habits. Additionally, some abnormal driving behaviorsare unapparent and easy to be ignored by drivers. If we canidentify drivers’ abnormal driving behaviors automatically, thedrivers can be aware of their bad driving habits, so that theycan correct them, helping to prevent potential car accidents.Furthermore, if the results of the monitoring could be passedback to a central server, they could be used by the police to detectdrunken-driving automatically or Vehicle Insurance Company toanalyze the policyholders’ driving habits.
According to [11], there are six types of abnormal drivingbehaviors defined, and they are illustrated in Fig.1. Weaving(Fig.1(a)) is driving alternately toward one side of the laneand then the other, i.e. serpentine driving or driving in S-shape; Swerving (Fig.1(b)) is making an abrupt redirection whendriving along a generally straight course; Sideslipping (Fig.1(c))
1
978-1-4673-7331-9/15/$31.00 ©2015 IEEE
2015 12th Annual IEEE International Conference on Sensing, Communication, and Networking (SECON)
524
is when driving in a generally straight line, but deviating from thenormal driving direction; Fast U-turn (Fig.1(d)) is a fast turningin U-shape, i.e. turning round (180 degrees) quickly and thendriving along the opposite direction; Turning with a wide radius(Fig.2(e)) is turning cross an intersection at such an extremelyhigh speed that the car would drive along a curve with a bigradius, and the vehicle sometimes appears to drift outside of thelane, or into another line; Sudden braking (Fig.2(f)) is when thedriver slams on the brake and the vehicle’s speed falls downsharply in a very short period of time.
This work uses smartphone sensing and machine learningtechniques. By extracting unique features from the readings ofsmartphone sensors, we can detect and identify the six typesof abnormal driving behaviors above. To realize a fine-grainedabnormal driving behaviors monitoring, we face the followinggreat challenges. First, patterns of driving behaviors need tobe identified from readings of smartphone sensors. Second,the noise of smartphone sensors’ readings should be removed.Finally, the solution should be lightweight and computationalfeasible on smartphones.
In this paper, we first set out to investigate effective featuresfrom smartphone sensors’ readings that are able to depict eachtype of abnormal driving behavior. Through empirical studies ofthe 6-month driving traces collected from smartphone sensorsof 20 drivers in a real driving environment, we find that eachtype of abnormal driving behaviors has its unique patterns onreadings from accelerometers and orientation sensors. Effectivefeatures thus can be extracted to capture the patterns of abnormaldriving behaviors. Then, we train those features through amachine learning method, Support Vector Machine (SVM), togenerate a classifier model which could clearly identify each ofdriving behaviors. Based on the classifier model, we propose anabnormal Driving behaviors Detection and iDentification system,D3, which can realize a fine-grained abnormal driving behaviorsmonitoring in real-time using smartphone sensors. Our prototypeimplementation of D3 on Android-based mobile devices verifiesthe feasibility of using D3 in real driving environments.
We highlight our main contributions as follows:
• We identify sixteen representative features to capture thepatterns of abnormal driving behaviors by empirically ana-lyzing the 6-month driving traces collected from real drivingenvironments.
• We use a machine learning method, SVM, to train thefeatures of driving behaviors and obtain a classifier modelwhich can not only distinguish abnormal driving behav-iors from normal ones but also identify specific types ofabnormal driving behavior. Machine learning rather thanthreshold is used in our paper to play down the impactcaused by car type or sensor’s sensitivity.
• We propose a fine-grained abnormal driving behaviors mon-itoring system, D3, to perform real-time high-accurate ab-normal driving behaviors detection and identification usingsmartphone sensors. The fine-grained system can informdrivers of their abnormal driving behaviors which otherwisemay be ignored by them so as to improve their awareness
of driving habits.• We conduct extensive experiments in real driving environ-
ments. The result shows that D3 can identify specific typesof abnormal driving behaviors in real time with an averagetotal accuracy of 95.36%.
The rest of the paper is organized as follows: The relatedwork is reviewed in Section II. In Section III, we analyze theacceleration and orientation patterns of the six specific types ofabnormal driving behaviors. We present the design details of D3
in Section IV. We evaluate the performance of D3 and presentthe results in Section V. Finally, we give the conclusion remarksin Section VI.
II. RELATED WORK
In this section, we review the existing works on drivingbehaviors detection, which can be categorized as follows.
Detection using pre-deployed infrastructure: [3] uses anEGG equipment which samples the driver’s EGG signals todetect drowsiness during car driving. [12] uses infrared sensorsmonitoring the driver’s head movement to detect drowsy driving.[13] captures the driver’s facial images using a camera to detectwhether the driver is drowsy driving by image processing. In[4], GPS, cameras, alcohol sensor and accelerometer sensor areused to detect driver’s status of drunk, fatigued, or reckless.However, the solutions all rely on pre-deployed infrastructuresand additional hardwares that incur installation cost. Moreover,those additional hardwares could suffer the difference of day andnight, bad weather condition and high maintenance cost.
Detection using smartphone sensors: To eliminate the needof pre-deployed infrastructures and additional hardwares, recentstudies concentrate on using smartphones to detect abnormaldriving behaviors. In particular, [14] uses accelerometers, mag-netometers and GPS sensors to determine whether high-riskmotorcycle maneuvers or accidents occur. [15] uses accelerom-eters, gyroscopes and magnetometers to estimate a driver’sdriving style as Safe or Unsafe. [9][10] use accelerometers todetect drunk driving and sudden driving maneuver, respectively.The works are similar in that they perform a coarse-graineddriving behavior detection which uses some thresholds to findout abnormal driving behaviors. Nevertheless, thresholds maybe affected by car type and sensors’ sensitivity so that theycannot accurately distinguish the differences in various drivingbehavioral patterns. Therefore, none of existing works can realizefine-grained identification.
III. DRIVING BEHAVIOR CHARACTERIZATION
In this section, we first describe the data collection processfor driving behavior samples from real driving environments.Then we analyze patterns of each type of driving behavior fromsmartphone sensors’ readings.
A. Collecting Data from Smartphone Sensors
We develop an Andriod-based App to collect readings fromthe 3-axis accelerometer and the 3-axis orientation sensor. Wealign the two coordinate systems in the smartphone and inthe vehicle by making the accelerometer’s y-axis along the
2
2015 12th Annual IEEE International Conference on Sensing, Communication, and Networking (SECON)
525
0 2500 5000 7500 10000 12500 15000−10
−5
0
5
10
Time (ms)
Accele
rati
on
(m
/s2)
acceleration on x axis acceleration on y axis
0 2500 5000 7500 10000 12500 15000−150
−100
−50
0
50
100
150
Time (ms)
Ori
en
tati
on
orientation on x axis orientation on y axis
(a) Weaving
0 500 1,000 1,500 2,000 2,500 3,000−10
−5
0
5
10
Time (ms)
Accele
rati
on
(m
/s2)
acceleration on x axis acceleration on y axis
0 500 1,000 1,500 2,000 2,500 3,000−150
−100
−50
0
50
100
150
Time (ms)
Ori
en
tati
on
orientation on x axis orientation on y axis
(b) Swerving
0 500 1,000 1,500 2,000 2,500 3,000 3,500−10
−5
0
5
10
Time (ms)
Accele
rati
on
(m
/s2)
acceleration on x axis acceleration on y axis
0 500 1,000 1,500 2,000 2,500 3,000 3,500−150
−100
−50
0
50
100
150
Time (ms)
Ori
en
tati
on
orientation on x axis orientation on y axis
(c) Sideslipping
0 1,000 2,000 3,000 4,000 5,000 6,000 7,000 8,000 9,00010,000−10
−5
0
5
10
Time (ms)
Accele
rati
on
(m
/s2)
acceleration on x axis acceleration on y axis
0 1,000 2,000 3,000 4,000 5,000 6,000 7,000 8,000 9,00010,000−150
−100
−50
0
50
100
150
Time (ms)
Ori
en
tati
on
orientation on x axis orientation on y axis
(d) Fast U-turn
0 1,000 2,000 3,000 4,000 5,000 6,000 7,000−10
−5
0
5
10
Time (ms)
Accele
rati
on
(m
/s2)
acceleration on x axis
acceleration on y axis
0 1,000 2,000 3,000 4,000 5,000 6,000 7,000−150
−100
−50
0
50
100
150
Time (ms)
Ori
en
tati
on
orientation on x axis orientation on y axis
(e) Turning with a wide radius
0 500 1,000 1,500 2,000 2,500 3,000 3,500 4,000−10
−5
0
5
10
Time (ms)
Accele
rati
on
(m
/s2)
acceleration on x axis acceleration on y axis
0 500 1,000 1,500 2,000 2,500 3,000 3,500 4,000−150
−100
−50
0
50
100
150
Time (ms)
Ori
en
tati
on
orientation on x axis orientation on y axis
(f) Sudden braking
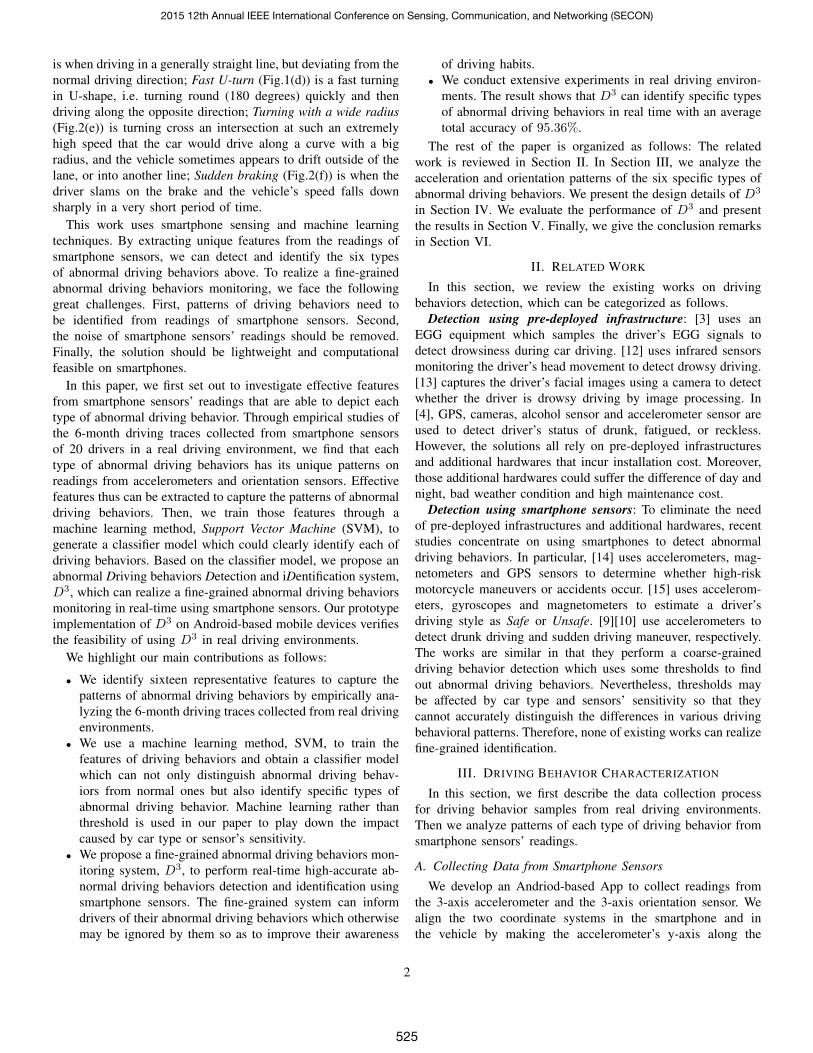
Fig. 2: The acceleration and orientation patterns of the six types of abnormal driving behaviors from an accelerometer and anorientation sensor’s readings.
moving direction of the vehicle. Therefore, we could monitorthe vehicle’s acceleration and orientation by retrieving readingsfrom the smartphone’s accelerometer and orientation sensor.
We collect traces from the accelerometers and orientationsensors’ readings on 20 drivers with distinct vehicles from Jan.11 to July 12, 2014. Each driver fixes a smartphone alongwith a Car Digital Video Recorder (DVR) in his/her vehiclewithin daily natural driving. The smartphone and Car DVRrecord the sensors’ readings and all objective driving behaviors,respectively. The 20 drivers keep collecting data in their dailydriving, including commute to work, shopping, touring and soon. Those 20 drivers live in different communities and they havedifferent commute routes. On average, each driver may drive 60to 80 kilometers per day. 20 smartphones of 5 different types areused in our data collection, i.e. Huawei Honor3C, ZTE U809,SAMSUNG Nexus3, SAMSUNG Nexus4 and HTC sprint, fourdevices for each type. After that, we ask 9 experienced driversto watch the videos recorded by the Car DVR and recognize alltypes of abnormal driving behaviors from the 6-month traces,i.e. Weaving, Swerving, Sideslipping, Fast U-turn, Turning with awide radius or Sudden braking. In total, we obtain 4029 samplesof abnormal driving behaviors from the collected traces, whichis viewed as the ground truth.
B. Analyzing Patterns of Abnormal Driving Behaviors
After high frequency noises are removed in the collected datausing the low-pass filter, we can analyze the acceleration andorientation patterns of each type of abnormal driving behaviors.Let accx and accy be the acceleration on x-axis and y-axis,
respectively. Let orix and oriy be the orientation on x-axis andy-axis, respectively.
1) Weaving: Fig.2(a) shows the acceleration and orientationpatterns of weaving from an accelerometer and orientation sen-sor’s readings. We observe from this figure that there is a drasticfluctuation on accx and this fluctuation continues for a period oftime, while accy keeps smooth. Thus, both the standard deviationand the range of accx are very large and the time duration islong. The mean value of accx is around zero. In addition, theorientation values have similar patterns as acceleration values.
2) Swerving: Fig.2(b) shows the acceleration and orientationpatterns of swerving. Since swerving is an abrupt, instant be-havior, the time duration is very short. When swerving occurs,there is a great peak on both accx and orix. Thus, the rangeand standard deviation of both accx and orix are large, and themean value is not near zero. In addition, both accy and oriy areflat during swerving.
3) Sideslipping: Fig.2(c) shows the acceleration and orien-tation patterns of sideslipping. When sideslipping occurs, accyfalls down sharply. Thus, the minimum value and mean value ofaccy are negative, and the range of accy is large. In addition,accx in sideslipping is not near zero. If the vehicle slips towardthe right side, accx would be around a positive value, whileif left, then negative. The mean value of accx thus is not nearzero. When it comes to orientation, there are no obvious changes.Moreover, since sideslipping is an abrupt driving behavior, thetime duration is short.
4) Fast U-turn: Fig.2(d) shows the acceleration and orienta-tion patterns of fast U-turn. When a driver turns right or left fast
3
2015 12th Annual IEEE International Conference on Sensing, Communication, and Networking (SECON)
526
Modeling Driving Behaviors (offline)
CollectedData
Monitoring Driving Behaviors (online)
Model
Feature Extracting
Max ( accx )
Min ( accy )
Std ( orix )
Identifying
weaving
swerving
sideslipping
fast u-turn
sudden braking
turning with a wide radius
Data Sensing
OrientationAccelerationCo
ordi
nate
Re
orie
ntat
ion
Aler
ting
Trai
ning
Cutti
ng D
rivin
g Be
havi
oral
Pat
tern
s
Fig. 3: System architecture.
in U-shape, accx rises quickly to a very high value or drops fastto a very low value, respectively. Moreover, the value would lastfor a period of time. The standard deviation of accx thus is largeon the beginning and ending of a fast U-turn, the mean valueof accx is far from zero and the range of accx is large. Whenit comes to accy , there are no obvious changes. Moreover, orixwould pass over the zero point. Specifically, orix would changeeither from positive to negative or from negative to positive,depending on the original driving direction. Thus, the standarddeviation and value range of orix would be large. The meanvalues in first half and second half of orix would be of oppositesign, i.e. one positive and the other negative. It may take a periodof time to finish a fast U-turn, so its time duration is long.
5) Turning with a wide radius: The acceleration and ori-entation patterns of turning with a wide radius are shown inFig.2(e). When turning at an extremely high speed, accx sees ahigh magnitude for a period of time, while the accy is aroundzero. Thus, the mean value of accx is far from zero and thestandard deviation of accx is large. When it comes to orientation,orix sees a fluctuation, while oriy keeps smooth. The standarddeviation of orix thus is relatively large, and the mean value oforix is not near zero since the driving direction is changed. Itmay take a period of time to finish a turning with a wide radius,so the time duration is long.
6) Sudden braking: Fig.2(f) shows the acceleration and ori-entation patterns of sudden braking. When a vehicle brakessuddenly, accx remains flat while accy sharply downs and keepsnegative for some time. Thus, the standard deviation and valuerange of accx are small. On accy , the standard deviation is largeat the beginning and ending of a sudden braking and the rangeof accy is large. Moreover, there are no obvious changes onboth orix and oriy . Since sudden braking is an abrupt drivingbehavior, the time duration is short.
7) Normal Driving Behavior: Normal driving behavior meanssmooth and safe driving with few and small fluctuations. Sincethere are few drastic actions in a normal driving behavior, thevalues on both accx and accy are not very large. So the mean,standard deviation, maximum and minimum values in accelera-tion on x-/y-axis are near zero. When it comes to orientation, anormal driving behavior presents smooth most of time. So thestandard deviation and range of orientation are small.
Based on the analysis above, we find that each drivingbehavior has its unique features, e.g. standard deviation, mean,
maximum, minimum, value range on accx, accy , orix and oriy ,as well as the time duration. Therefore, we could use thosefeatures to identify specific types of abnormal driving behaviorsusing machine learning techniques.
IV. SYSTEM DESIGN
In this section, we present the design of our proposed system,D3, which detects abnormal driving behaviors from normal onesand identifies different abnormal types using smartphone sensors.D3 does not depend on any pre-deployed infrastructures andadditional hardwares.
A. Overview
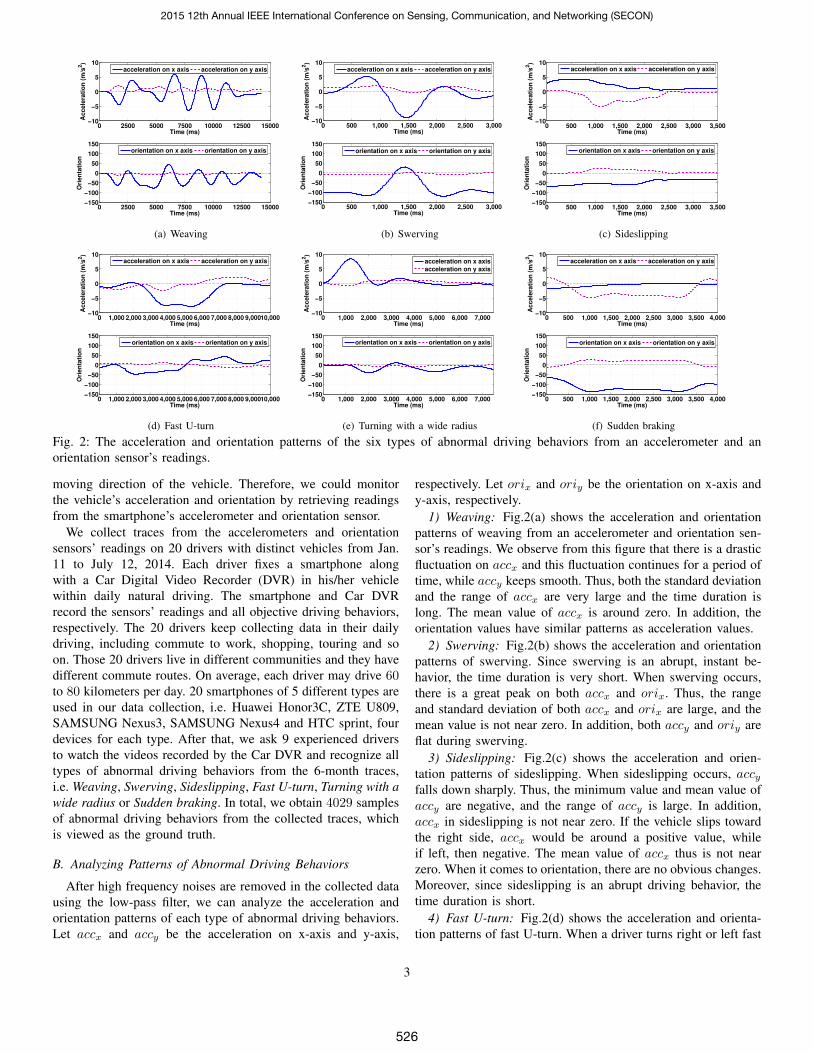
In our system, D3, abnormal driving behaviors could bedetected and identified by smartphones according to readingsfrom accelerometers and orientation sensors. Fig.3 shows thearchitecture of D3. The whole system is separated into offlinepart-Modeling Driving Behaviors and online part-MonitoringDriving Behaviors.
In the offline part, Modeling Driving Behaviors, D3 trainsa classifier model using machine learning techniques basedon the collected data, which could identify specific types ofdriving behaviors. In the Feature Extracting, effective featuresare extracted from specific types of driving behavioral patternson acceleration and orientation. Afterwards, the features aretrained in the Training and a classifier model would be gen-erated which can realize fine-grained identification. Finally, theclassifier model is output and stored to Model Database.
The online part, Monitoring Driving Behaviors, is installedon smartphones which senses real-time vehicular dynamics todetect and identify abnormal driving behaviors. D3 first sensesthe vehicles’ acceleration and orientation by smartphone sensors.After getting real-time readings from the accelerometer and theorientation sensor, the Coordinate Reorientation is performed toalign the smartphone’s coordinate system with the vehicle’s usingthe method in [6][7]. Then, in the Cutting Driving BehavioralPatterns, the beginning and ending of a driving behavior arefound out from accelerometer and orientation sensor’s readings.Afterwards, in Identifying, D3 extracts features from patternsof the driving behaviors, then identifies whether one of theabnormal driving behaviors occurs based on the classifier modeltrained in Modeling Driving Behaviors. Finally, if any of theabnormal driving behaviors were identified, a warning messagewould be sent to receivers by the Alerting.
B. Extracting and Selecting Effective Features
In D3, we use machine learning techniques to identify fine-grained abnormal driving behaviors. The process of featureextraction and selection is discussed in the following.
1) Feature Extraction: When machine learning algorithmsare processed, representative tuple of features rather than rawdata is a more effective input. Thus, it is necessary to extracteffective features from driving behavioral patterns. According tothe analysis in Section III, each driving behavior has its uniquepatterns on accx, accy , orix, oriy and time duration (t). Themain difference between various driving behaviors lies in the
4
2015 12th Annual IEEE International Conference on Sensing, Communication, and Networking (SECON)
527

0 2.5 5 7.5 10 12.5 15 17.5 200
2
4
6
8
10
12acc y
ran
ge
acc x range
Normal
Sideslipping
Swerving
Weaving
U−turn
Turning with a wide radius
Sudden Braking
(a) Normal vs. Abnormal
0 0.5 1 1.5 2 2.5 3 3.5 40
1
2
3
4
5
6
7
8
ori
y s
td
acc x std
Weaving
Swerving
(b) Weaving vs. Swerving
−2.5 −2 −1.5 −1 −0.5 0 0.5 1 1.50
2
4
6
8
10
12
acc y
ran
ge
acc x mean
Weaving
Sideslipping
(c) Weaving vs. Sideslipping
−3 −2 −1 0 1 2 30
5
10
15
20
25
30
35
40
45
50
ori
y m
ax
acc x mean
Weaving
U−turn
(d) Weaving vs. Fast U-turn
−8 −6 −4 −2 0 2 4 60
25
50
75
100
125
150
ori
x s
td
acc x mean
Weaving
Turning with a wide radius
(e) Weaving vs. Turning with a wide radius
0 2.5 5 7.5 10 12.5 15 17.5 20−14
−12
−10
−8
−6
−4
−2
0
2
acc y
min
acc x range
Weaving
Sudden Braking
(f) Weaving vs. Sudden braking
Fig. 4: Some effective features for identifying normal driving behavior from abnormal ones and weaving behavior from other fiveabnormal driving behaviors.
maximum, minimum, value range, mean, and standard deviationof accx, accy , orix and oriy and t. Therefore, those values canbe used as features for training. However, not all of them areequally effective for abnormal driving behaviors’ detection andidentification.
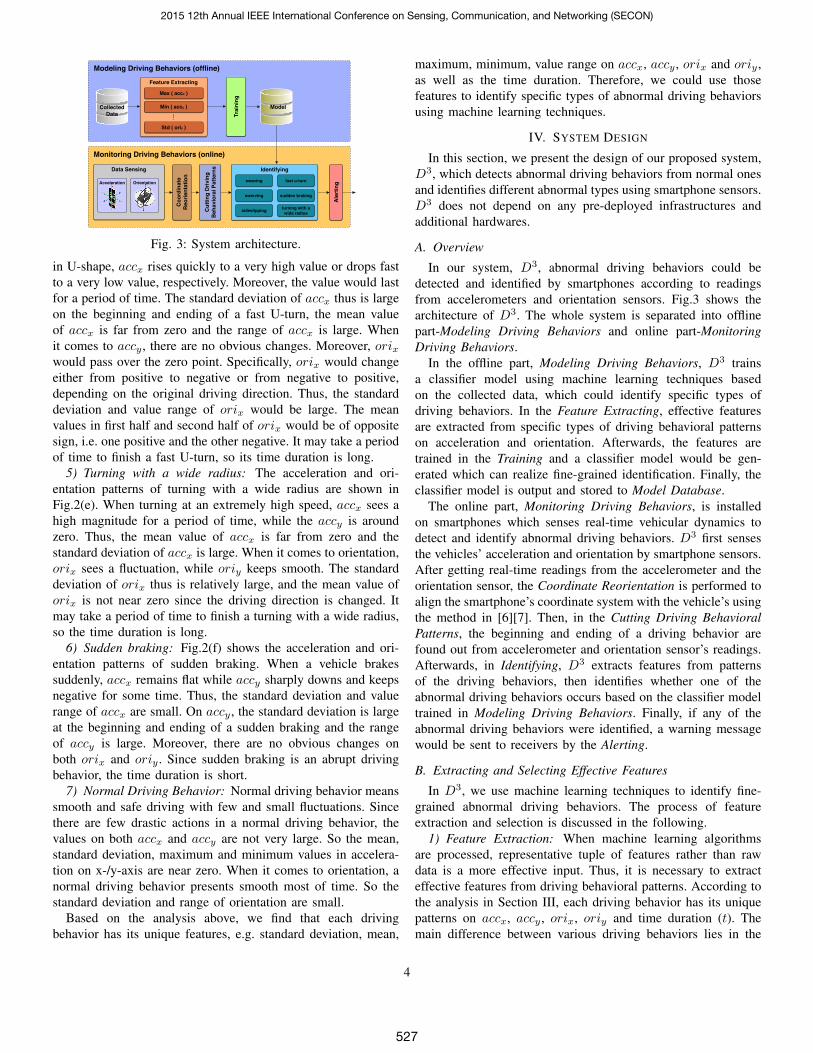
2) Feature Selection: In order to select the really effectivefeatures, we analyze the collected traces. Fig.4 shows some of theeffective features which distinguish abnormal driving behaviorsfrom normal ones and distinguish weaving from the other fiveabnormal driving behaviors.
Fig.4(a) shows the difference between normal and abnor-mal driving behaviors in a 2-dimensional features tuple (i.e.rangeacc,x and rangeacc,y). It can be seen that the two featurescan clearly discriminate normal and abnormal driving behaviors.Therefore, we manage to distinguish abnormal driving behaviorsfrom normal ones with only two features.
In fact, additionally to the two features shown in Fig.4(a),some other combinations of a 2-dimensional features tuple (i.e.any 2 out of t, maxori,x, maxori,y, σori,x, σori,y, σacc,x,rangeacc,x, minacc,y and rangeacc,y) also manage to distin-guish abnormal driving behaviors from normal ones.
Although we can distinguish abnormal driving behaviors fromnormal ones using a 2-dimensional features tuple, we fail todifferentiate the six types of abnormal behaviors from eachother only using 2-dimensional features. As the example shownin Fig.4(a), the six types of abnormal driving behaviors aremixed with each other. Nevertheless, they could be differentiatedpairwise with a 2-dimensional features tuple. In other words,
although the six abnormal driving behaviors cannot be differenti-ated from each other at the same time, any two among them canbe differentiated intuitively by a 2-dimensional features tuple.Taking weaving for example (see Fig.4(b) - Fig.4(f)), weavingcan be distinguished from the other five abnormal drivingbehaviors using a 2-dimensional features tuple. For instance,in Fig.4(b), weaving and swerving can be discriminated fromeach other using σori,y and σacc,x. Similarly, other abnormaldriving behaviors can also be pairwise discriminated using 2-dimensional features tuples.
Based on the collected traces, we investigate all possiblepairwise cases. In each case, we find out several effectivefeatures conductive to distinguishing one driving behavior fromanother. Finally, we identify sixteen effective features that areable to capture the patterns of different types of abnormal drivingbehaviors, as listed in TABLE I.
C. Training a Fine-grained Classifier Model to Identify Abnor-mal Driving Behaviors
After feature extracting, we obtain a tuple of features for eachdriving behavior. Then a classifier model is trained based onthe tuples for all driving behaviors through machine learningtechniques [17] to identify various driving behaviors. We usethe multi-class SVM [18][19] to train the classifier model. Foreach driving behavior, the input into SVM is in the form of <16-dimensional features, label>, where the 16-dimensional featuresare the tuples obtained from the Feature Extracting and the labelis the type of the driving behavior.
5
2015 12th Annual IEEE International Conference on Sensing, Communication, and Networking (SECON)
528
250-250 -200 -150 -100 -50 0 50 100 150 200
1.2
-0.5
0
0.4
0.8
Lag (Samples)
Auto
-Cor
rela
tion
500
0 50 100 150 200 250 300 350 400 450
17
5
7.2
9.6
12
14.4
Samples
Acce
lera
tion
on Z
-Axi
s ∆T
Front wheels Rear wheels
∆T ∆T 250-250 -200 -150 -100 -50 0 50 100 150 200
1.2
-0.5
0
0.4
0.8
Lag (Samples)
Auto
-Cor
rela
tion
500
0 50 100 150 200 250 300 350 400 450
17
5
7.2
9.6
12
14.4
Samples
Acce
lera
tion
on Z
-Axi
s ∆T
Front wheels Rear wheels
∆T ∆T
0 10,000 20,000 30,000 40,000 50,000 60,000−10
−5
0
5
10
time (ms)
Acc
eler
atio
n (m
/s2 )
acceleration on x axis acceleration on y axis
0 10,000 20,000 30,000 40,000 50,000 60,000−150−100−50
050
100150
time (ms)
Orie
ntat
ion
orientation on x axis orientation on y axis
����� ���
����� ���
Fig. 5: The acceleration and orientation patterns of one minutedriving behaviors.
The cores in SVM are the kernel and the similarity function. Akernel is a landmarks, and the similarity function computes thesimilarity between an input example and the kernels. Specifically,assume that our training set contains m samples, and each sampleis 16-dimensional (i.e. the 16-dimensional features), denoted by
x(i) = (x(i)1 , x
(i)2 , · · · , x(i)16 ), i = 1, 2, · · · ,m (1)
where x(i) is the i-th sample, and x(i)j means the j-th feature ofx(i). When SVM starts, all input samples (x(1), x(2), · · · , x(m))are selected as kernels, recorded as l(1), l(2), · · · , l(m). Note thatx(i) = l(i) for i = 1, 2, · · · ,m. Afterwards, for each sample,SVM compute its similarity between the kernels by
f(i)j = e
−||x(i) − l(j)||
2σ2
2
, i, j = 1, 2, · · · ,m (2)
where f (i)j is the similarity between input sample x(i) and the
kernel l(j), σ is a parameter defined manually, and ||x(i) − l(j)||2
is the distance between x(i) and l(j) calculated by
||x(i) − l(j)||2=
16∑k=1
(x(i)k − l
(j)k )2,
i, j = 1, 2, · · · ,m(3)
In SVM, those m 16-dimensional input samples (i.e.x(1), x(2), · · · , x(m)) would be converted into m m-dimentionalsimilarity features (i.e. f (1), f (2), · · · , f (m)), since for each x(i),the similarity between x(i) and any l(j) in l(1), l(2), · · · , l(m)
are calculated by Equation 2. With the new features f =(f (1), f (2), · · · , f (m)), a cost function J(θ) (see Equation 4)calculated from f would be minimized to find optimal θ.
J(θ) =C
m∑i=1
y(i)cost1(θT f (i)) + (1− y(i))cost0(θT f (i))
+1
2
m∑j=1
θ2j
(4)
where C is a parameter defined manually, y(i) is the label of i-thinput example (i.e. the label of x(i)), θT means θ transpose and
cost1(θT f (i)) = log(
1
1 + e−θT f(i)),
cost0(θT f (i)) = log(1− 1
1 + e−θT f(i))
(5)
WeavingSwervingSideslippingFast U-turn
Turning with a wide radiusSudden Braking 211
78
14712
10535Weaving
SwervingSideslippingFast U-turnTurning with a wide radiusSudden Braking 211
78147
12
10535
< > to now
Total 588
Start Stop
2014-03-01
Abnormal Driving Behavior Analysis
to nowfrom
Weaving Swerving
SideslippingFast U-turn
Turning with a wide radius
Sudden braking
Total
1134
20
17
36
91
Abnormal Driving Behavior Analysis
Start Stop
< >2014-05-11D3: abnormal driving behavior detection and identification system
Test
beds
Car
DVR
Fig. 6: User interface of D3 and testbeds.
and
θT f (i) = θ1f(i)1 + θ2f
(i)2 + · · ·+ θmf
(i)m (6)
The classifier model would be finally determined by the optimalθ. In a word, SVM trains the inputs and then output a classifiermodel which conducts fine-grained identification to the six typesof abnormal driving behaviors.
D. Detecting and Identifying Abnormal Driving Behaviors
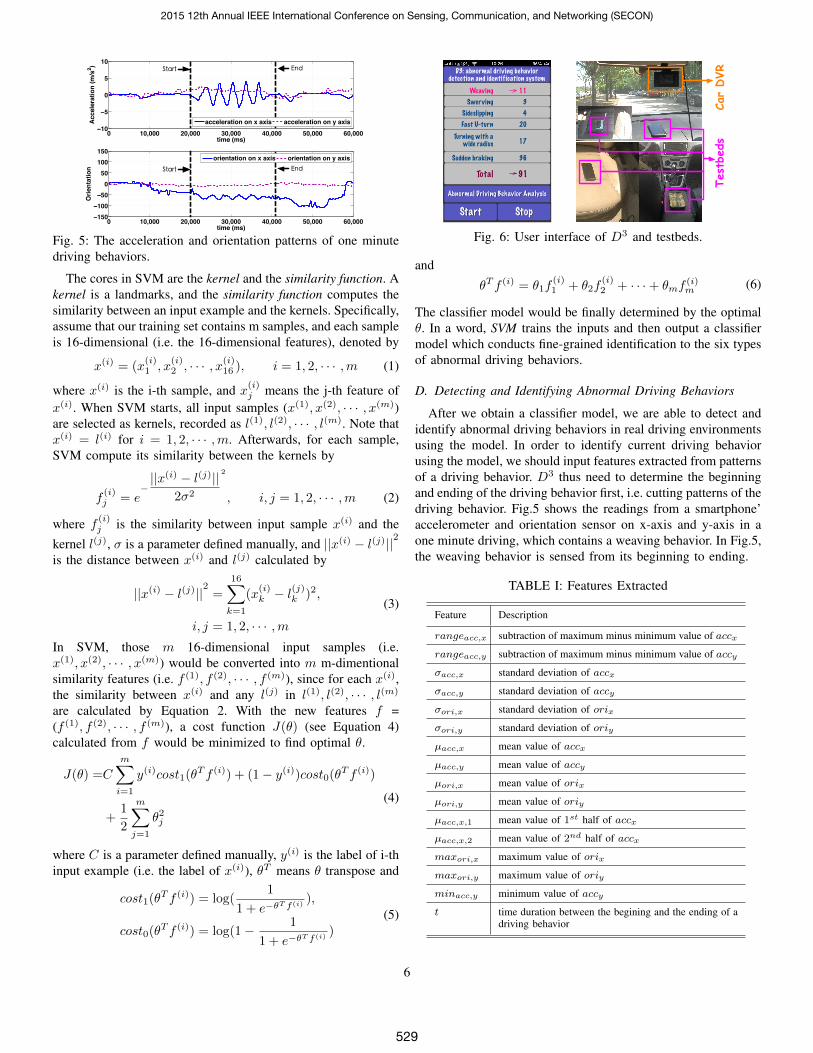
After we obtain a classifier model, we are able to detect andidentify abnormal driving behaviors in real driving environmentsusing the model. In order to identify current driving behaviorusing the model, we should input features extracted from patternsof a driving behavior. D3 thus need to determine the beginningand ending of the driving behavior first, i.e. cutting patterns of thedriving behavior. Fig.5 shows the readings from a smartphone’accelerometer and orientation sensor on x-axis and y-axis in aone minute driving, which contains a weaving behavior. In Fig.5,the weaving behavior is sensed from its beginning to ending.
TABLE I: Features Extracted
Feature Description
rangeacc,x subtraction of maximum minus minimum value of accx
rangeacc,y subtraction of maximum minus minimum value of accy
σacc,x standard deviation of accx
σacc,y standard deviation of accy
σori,x standard deviation of orix
σori,y standard deviation of oriy
µacc,x mean value of accx
µacc,y mean value of accy
µori,x mean value of orix
µori,y mean value of oriy
µacc,x,1 mean value of 1st half of accx
µacc,x,2 mean value of 2nd half of accx
maxori,x maximum value of orix
maxori,y maximum value of oriy
minacc,y minimum value of accy
t time duration between the begining and the ending of adriving behavior
6
2015 12th Annual IEEE International Conference on Sensing, Communication, and Networking (SECON)
529

0
0.5
1
1.5
2
2.5
Fals
e P
osit
ive R
ate
(%
)
WeavingSwerving
SideslippingU−turn
Turning/n with a wide radius
Sudden BrakingOverall
Fig. 7: Box plot of FPR of identifying specific types of drivingbehaviors.
The method of sensing the beginning and ending of a drivingbehavior is proposed based on an analysis on the acceleration andorientation patterns of all types of driving behaviors. Specifically,when an abnormal driving behavior begins, the standard devia-tion of either the acceleration or the orientation values sharplyrise to and keep a relatively high value until the ending, whilein most normal driving behaviors, the standard deviation alwayspresents as low and smooth. Moreover, during an abnormaldriving behavior, the magnitude of acceleration on either x-axis or y-axis presents an extremely high value, as illustratedin Section III. But when driving normally, the magnitude ofaccelerations seldomly reaches to such a high value.
Therefore, It is simple but effective that we monitor thestandard deviation of acceleration and orientation as well as themagnitude of acceleration of the vehicle to cut patterns of drivingbehaviors. In real driving environments, we retrieve readingsfrom smartphones’ accelerometers and orientation sensors andthen compute their standard deviation as well as mean value in asmall window. Under normal driving, D3 compares the standarddeviation and the mean value with some thresholds to determinewhether an abnormal driving behavior begins. The window sizeand thresholds can be learned from the collected data. Afterthe beginning of a driving behavior is found out, D3 continuesto check the standard deviation and mean value to determinewhether the driving behavior ends.
After cutting patterns of a driving behavior, effective featurescan be extracted from the driving behavioral patterns and thensent to the classifier model. Finally, the model outputs a fine-
TABLE II: Total accuracy in 20 drivers’ experiments
Driver 1 2 3 4 5
Total Accuracy (%) 98.66 96.43 95.29 95.61 97.13
Driver 6 7 8 9 10
Total Accuracy (%) 94.55 97.83 99.07 98.37 92.44
Driver 11 12 13 14 15
Total Accuracy (%) 93.46 96.30 94.02 99.59 91.35
Driver 16 17 18 19 20
Total Accuracy (%) 94.50 92.86 94.68 95.49 95.43
0 50 100 150 200 250 300 350 400 450 5000
10
20
30
40
50
60
70
80
90
100
Size of Training Set
Accu
racy (
%)
Weaving
Swerving
Sideslipping
Fast U−turn
Turning with a wide radius
Sudden Braking
Fig. 8: Total accuracy under different sizes of training set.
grained identification result. If the result denotes the normaldriving behavior, it is ignored, and if it denotes any one ofabnormal driving behaviors, D3 sends a warning message.
V. EVALUATIONS
In this section, we first present the prototype of D3, thenevaluate the performance of D3 in real driving environments.
A. Prototype
We implement D3 as an Android App and install it onsmartphones (listed in Section III-A). Fig.6 shows the userinterface of D3 and testbeds in vehicles. D3 is running by 20drivers with distinct vehicles in real driving environments tocollect the data for evaluation. Meanwhile, Car DVRs are usedto record driving behaviors and 9 experienced drivers are askedto recognize abnormal driving behaviors as ground truth. After a4-month data collection (i.e. July 21 to Nov. 30, 2014, using thesame method of collecting data as described in Section III-A),we obtain a test set with 3141 abnormal driving behaviors toevaluate the performance of D3.
B. Metrics
To evaluate the performance of D3, we define the followingmetrics based on the True Positive (TP), True Negative (TN),False Positive (FP) and False Negative (FN).
• Accuracy: The probability that the identification of a be-havior is the same as the ground truth.
TABLE III: Accuracy evaluation
Behavior Accuracy(%) Precision(%) Recall(%) FPR(%)
Normal 99.84 98.80 100.00 0.19
Abnormal 94.81 100.00 99.80 0.00
Weaving 98.43 92.55 87.87 0.63
Swerving 97.94 92.29 94.15 1.39
Sideslipping 98.60 87.96 71.43 0.37
Fast U-turn 98.49 85.71 76.00 0.54
Turning with awide radius
98.68 89.30 92.72 0.86
Sudden braking 95.74 97.88 99.04 1.93
7
2015 12th Annual IEEE International Conference on Sensing, Communication, and Networking (SECON)
530
91
92
93
94
95
96
97
98
Accu
racy (
%)
WeavingSwerving
Sideslipping U−turn
Turning/n with a wide radius
Sudden BrakingOverall
peak time & local road
off−peak time & local road
peak time & highway
off−peak time & highway
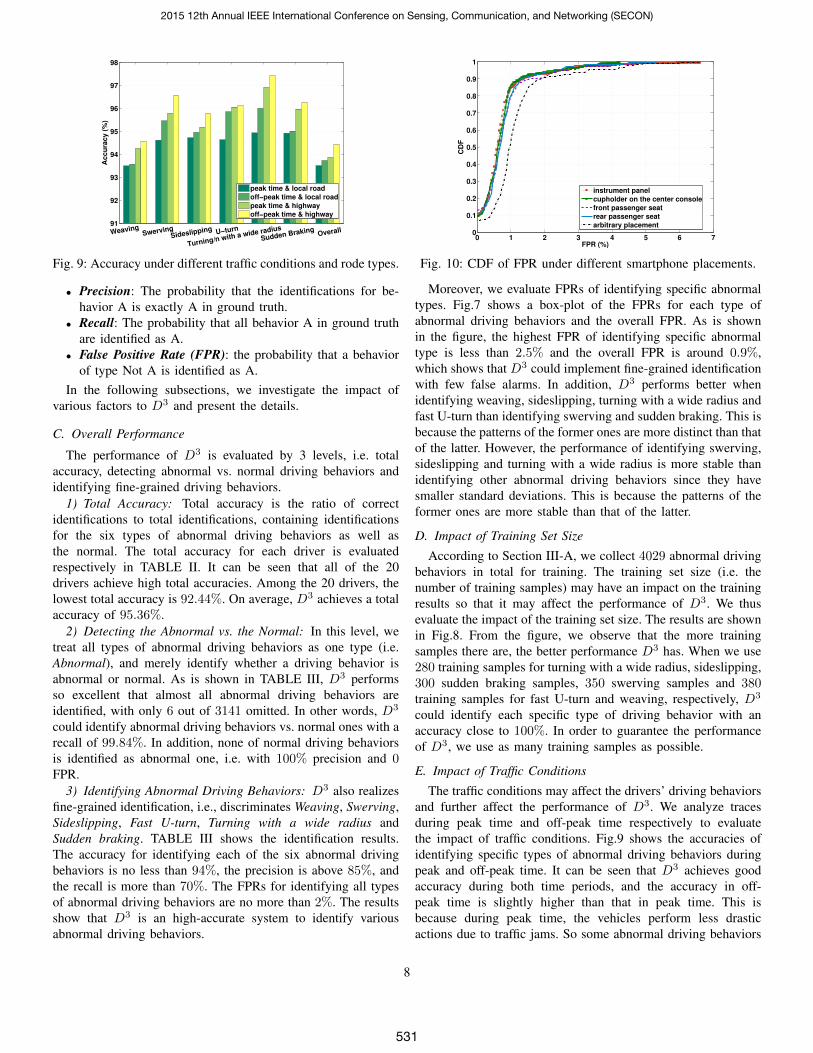
Fig. 9: Accuracy under different traffic conditions and rode types.
• Precision: The probability that the identifications for be-havior A is exactly A in ground truth.
• Recall: The probability that all behavior A in ground truthare identified as A.
• False Positive Rate (FPR): the probability that a behaviorof type Not A is identified as A.
In the following subsections, we investigate the impact ofvarious factors to D3 and present the details.
C. Overall Performance
The performance of D3 is evaluated by 3 levels, i.e. totalaccuracy, detecting abnormal vs. normal driving behaviors andidentifying fine-grained driving behaviors.
1) Total Accuracy: Total accuracy is the ratio of correctidentifications to total identifications, containing identificationsfor the six types of abnormal driving behaviors as well asthe normal. The total accuracy for each driver is evaluatedrespectively in TABLE II. It can be seen that all of the 20drivers achieve high total accuracies. Among the 20 drivers, thelowest total accuracy is 92.44%. On average, D3 achieves a totalaccuracy of 95.36%.
2) Detecting the Abnormal vs. the Normal: In this level, wetreat all types of abnormal driving behaviors as one type (i.e.Abnormal), and merely identify whether a driving behavior isabnormal or normal. As is shown in TABLE III, D3 performsso excellent that almost all abnormal driving behaviors areidentified, with only 6 out of 3141 omitted. In other words, D3
could identify abnormal driving behaviors vs. normal ones with arecall of 99.84%. In addition, none of normal driving behaviorsis identified as abnormal one, i.e. with 100% precision and 0FPR.
3) Identifying Abnormal Driving Behaviors: D3 also realizesfine-grained identification, i.e., discriminates Weaving, Swerving,Sideslipping, Fast U-turn, Turning with a wide radius andSudden braking. TABLE III shows the identification results.The accuracy for identifying each of the six abnormal drivingbehaviors is no less than 94%, the precision is above 85%, andthe recall is more than 70%. The FPRs for identifying all typesof abnormal driving behaviors are no more than 2%. The resultsshow that D3 is an high-accurate system to identify variousabnormal driving behaviors.
0 1 2 3 4 5 6 70
0.1
0.2
0.3
0.4
0.5
0.6
0.7
0.8
0.9
1
FPR (%)
CD
F
instrument panel
cupholder on the center console
front passenger seat
rear passenger seat
arbitrary placement
Fig. 10: CDF of FPR under different smartphone placements.
Moreover, we evaluate FPRs of identifying specific abnormaltypes. Fig.7 shows a box-plot of the FPRs for each type ofabnormal driving behaviors and the overall FPR. As is shownin the figure, the highest FPR of identifying specific abnormaltype is less than 2.5% and the overall FPR is around 0.9%,which shows that D3 could implement fine-grained identificationwith few false alarms. In addition, D3 performs better whenidentifying weaving, sideslipping, turning with a wide radius andfast U-turn than identifying swerving and sudden braking. This isbecause the patterns of the former ones are more distinct than thatof the latter. However, the performance of identifying swerving,sideslipping and turning with a wide radius is more stable thanidentifying other abnormal driving behaviors since they havesmaller standard deviations. This is because the patterns of theformer ones are more stable than that of the latter.
D. Impact of Training Set Size
According to Section III-A, we collect 4029 abnormal drivingbehaviors in total for training. The training set size (i.e. thenumber of training samples) may have an impact on the trainingresults so that it may affect the performance of D3. We thusevaluate the impact of the training set size. The results are shownin Fig.8. From the figure, we observe that the more trainingsamples there are, the better performance D3 has. When we use280 training samples for turning with a wide radius, sideslipping,300 sudden braking samples, 350 swerving samples and 380training samples for fast U-turn and weaving, respectively, D3
could identify each specific type of driving behavior with anaccuracy close to 100%. In order to guarantee the performanceof D3, we use as many training samples as possible.
E. Impact of Traffic Conditions
The traffic conditions may affect the drivers’ driving behaviorsand further affect the performance of D3. We analyze tracesduring peak time and off-peak time respectively to evaluatethe impact of traffic conditions. Fig.9 shows the accuracies ofidentifying specific types of abnormal driving behaviors duringpeak and off-peak time. It can be seen that D3 achieves goodaccuracy during both time periods, and the accuracy in off-peak time is slightly higher than that in peak time. This isbecause during peak time, the vehicles perform less drasticactions due to traffic jams. So some abnormal driving behaviors
8
2015 12th Annual IEEE International Conference on Sensing, Communication, and Networking (SECON)
531
present restrained patterns during peak time. Different types ofabnormal driving behaviors thus are much easier to be mistakenby each other and even be mistaken as normal driving behaviors.Nevertheless, during off-peak time, the patterns of all types ofdriving behaviors are performed more obvious. So different typesof abnormal driving behaviors are more distinguishable.
F. Impact of Road Type
Drivers could perform abnormal driving behaviors on highwayor local road, thus we further investigate the impact of thetwo road types on the performance of D3. Fig.9 shows howroad types affect the accuracy of identifying various types ofabnormal driving behaviors. It can be seen that D3 achievesgood accuracy both on highway and local road, but the accuracyis slightly higher on highway than that on local road. This isbecause the better road condition on highway could reduce thefluctuations caused by bumpy surfaces. Since highway is moresmooth and has less slopes compared with local road, there areless disturbances then. In addition, there are less curves and notraffic light stops on the highway, so when driving normally onthe highway, drivers have less chance to perform drastic actions.As a result, D3 can achieve a better performance on highwaythan that on local road.
G. Impact of Smartphone Placement
Smartphones could be arbitrarily placed in vehicles, we thusinvestigate the impact of smartphone placement. In our exper-iments with 20 vehicles, smartphones are fixed on instrumentpanel, cupholder on the center console, front passenger seat,or left rear passenger seat, where smartphone sensors’ y-axis isaligned along the moving direction of vehicles, or on arbitraryplacement (i.e. smartphones are put in the driver’s pocket and itspose could be arbitrary). Fig.10 shows the CDF of FPRs of fine-grained identifications under different smartphone placements. Itcan be seen that D3 can achieve low FPRs under all smartphoneplacements, which shows D3 performs excellent wherever thesmartphone is placed in a vehicle. Although there is slightlyhigher FPR under arbitrary placement because of errors in thecoordinate reorientation process, a FPR of less than 2% in 90%of the cases is still a good result.
VI. CONCLUSION
In this paper, we address the problem of performing abnormaldriving behaviors detection (coarse-grained) and identification(fine-grained) to improve driving safety. In particular, we proposea system, D3, to detect and identify specific types of abnormaldriving behaviors by sensing the vehicle’s acceleration andorientation using smartphone sensors. Compared with existingabnormal driving detection systems, D3 not only implementescoarse-grained detections but also conducts fine-grained identi-fications. To identify specific abnormal driving behaviors, D3
trains a multi-class classifier model through SVM based on theacceleration and orientation patterns of specific types of drivingbehaviors. To obtain effective training inputs, we extract 16effective features from driving behavioral patterns collected fromthe 6-month driving traces in real driving environments. The
extensive experiments driving in real driving environments inanother 4 months show that D3 achieves high accuracy whendetecting and identifying abnormal driving behaviors.
ACKNOWLEDGMENT
This work was supported in part by National ScienceFoundation CNS1217387 and CCF1018270, the 973 Program2014CB340303, NSFC 61170238, NSFC 61373157, ChangjiangScholar and Innovative Research Team in University (IRT1158,PCSIRT) China.
REFERENCES
[1] World.Health.Organisation. The top ten causes of death. [Online].Available: http://www.who.int/mediacentre/factsheets/fs310/en/
[2] C. Saiprasert and W. Pattara-Atikom, “Smartphone enabled dan-gerous driving report system,” in Proc. HICSS, 2013.
[3] M. V. Yeo, X. Li, K. Shen, and E. P. Wilder-Smith, “Can svmbe used for automatic eeg detection of drowsiness during cardriving?” Elsevier Safety Science, vol. 47, pp. 115–124, 2009.
[4] S. Al-Sultan, A. H.Al-Bayatti, and H. Zedan, “Context-awaredriver behavior detection system in intelligent transportaion sys-tem,” IEEE Trans. on Vehicular Technology, vol. 62, pp. 4264–4275, 2013.
[5] J. Paefgen, F. Kehr, Y. Zhai, and F. Michahelles, “Driving behavioranalysis with smartphones: insights from a controlled field study.”
[6] Y. Wang, J. Yang, H. Liu, Y. Chen, M. Gruteser, and R. P. Martin,“Sensing vehicle dynamics for determining driver phone use,” inProc. ACM MobiSys, 2013.
[7] H. Han, J. Yu, H. Zhu, Y. Chen, J. Yang, Y. Zhu, G. Xue, andM. Li, “Senspeed: Sensing driving conditions to estimate vehiclespeed in urban environments,” in Proc. IEEE INFOCOM, 2014.
[8] S. Reddy, M. Mun, J. Burke, D. Estrin, M. Hansen, and M. Srivas-tava, “Using mobile phones to determine transportation modes,”ACM Trans. on Sensor Networks, vol. 6, no. 13, 2010.
[9] J. Dai, J. Teng, X. Bai, and Z. Shen, “Mobile phone based drunkdriving detection,” in Proc. PervasiveHealth, 2010.
[10] M. Fazeen, B. Gozick, R. Dantu, M. Bhukuiya et al., “Safe drivingusing mobile phones,” IEEE Trans. on Intelligent TransportationSystems, vol. 13, pp. 1462–1468, 2012.
[11] U.S.NHTSA. The visual detection of dwi motorists. [Online].Available: http://www.shippd.org/Alcohol/dwibooklet.pdf
[12] D. Lee, S. Oh, S. Heo, and M. Hahn, “Drowsy driving detectionbased on the driver’s head movement using infrared sensors,” inProc. IEEE ISUC, 2008.
[13] M. Kaneda, H. Obara, and T. Nasu, “Adaptability to ambient lightchanges for drowsy driving detection using image processing,” inJSAE Review, 1999.
[14] N. Condro, M.-H. Li, and R.-I. Chang, “Motosafe: Active safesystem for digital forensics of motorcycle rider with android,”IJIEE, vol. 2, no. 4, pp. 612–616, 2012.
[15] H. Eren, S. Makinist, E. Akin, and A. Yilmaz, “Estimating drivingbehavior by a smartphone,” in Proc. IEEE IV, 2012.
[16] Y. Wang, J. Yang, and Y. Chen, “Tracking human queues usingsingle-point signal monitoring,” in Proc. ACM MobiSys, 2014.
[17] P. Harrington, Machine Learning in Action. Manning Publica-tions, 2012.
[18] Y. Guo, L. Yang, X. Ding, J. Han, and Y. Liu, “Opensesame:Unlocking smart phone through handshaking biometrics,” in Proc.IEEE INFOCOM, 2013.
[19] C. Chang and C. Lin, “Libsvm: a library for support vectormachines,” ACM Trans. on Intelligent Systems and Technology,vol. 2, no. 3, pp. 1–27, 2011.
[20] H. Han, J. Yu, H. Zhu, Y. Chen, J. Yang, G. Xue, Y. Zhu, andM. Li, “E3: Energy-efficient engine for frame rate adaptation onsmartphones,” in Proc. ACM SenSys, 2013.
9
2015 12th Annual IEEE International Conference on Sensing, Communication, and Networking (SECON)
532