Embed Size (px)
Citation preview

PROMOTioN – Progress on Meshed HVDC Offshore Transmission NetworksMail [email protected] www.promotion-offshore.net
This result is part of a project that has received funding form the European Union’sHorizon 2020 research and innovation programme under grant agreement No 691714.
Publicity reflects the author’s view and the EU is not liable of any use made of theinformation in this report.
CONTACTCornelis Plet – DNV [email protected] Riechert – ABB Switzerland [email protected]
D15.6 White- and position papers onpre-standardization of DC GIStesting

DOCUMENT INFO SHEET
Document Name: White- and position papers on pre-standardization of DC GIS testing
Responsible partner: DNV GL
Work Package: WP 15
Work Package leader: Uwe Riechert
Task: 15.4
Task lead: Michael Gatzsche
DISTRIBUTION LIST
APPROVALS
Name Company
Validated by:
Reviewer:
Reviewer:
Task leader: Michael Gatzsche ABB Power Grids Switzerland Ltd
WP Leader: Uwe Riechert ABB Power Grids Switzerland Ltd
DOCUMENT HISTORY
Version Date Main modification Author
1.0
2.0
WP
NumberWP Title Person months Start month End month
15 HVDC GIS Technology Demonstrator 164.5 23 54
Deliverable
NumberDeliverable Title Type
Dissemination
levelDue Date
15.6White- and position papers on pre-standardization of DC GIS testing Report Public 54

PROJECT REPORT
ii
LIST OF CONTRIBUTORS
Work Package and deliverable involve a large number of partners and contributors. The names of the partners,
who contributed to the present deliverable, are presented in the following table.
PARTNER NAME
KEMA B.V. Hong He
ABB Uwe Riechert, Michael Gatzsche
TU Delft Armando Rodrigo Mor, Fabio Muñoz Muñoz, Luis Carlos Castro Heredia
SuperGrid Institute Thanh Vu, Caterina Toigo, Alain Girodet
TenneT Maximilian Tuczek

PROJECT REPORT
iii
CONTENTDocument info sheet ...................................................................................................................................................... i
Distribution list .............................................................................................................................................................. iApprovals ..................................................................................................................................................................... iDocument history .......................................................................................................................................................... i
List of contributors ........................................................................................................................................................ ii
Content ......................................................................................................................................................................... iii
Nomenclature ................................................................................................................................................................ 5
Executive summary ....................................................................................................................................................... 6
1 Introduction ............................................................................................................................................................ 7
2 Current Status of HVDC GIS Standardization Activities ....................................................................................... 82.1 Integration/addition of DC specific standardization into existing AC GIS standardization ..................................... 82.2 Parallel HVDC GIS standardization activities ..................................................................................................... 8
3 Inputs for Standardization from PROMOTioN WP15 Work ................................................................................. 103.1 Specification of HVDC GIS ............................................................................................................................. 10
Introduction ............................................................................................................................................. 10Rated voltages and currents .................................................................................................................... 10Lightning and switching impulse withstand voltages ................................................................................. 10Test requirements ................................................................................................................................... 11
3.2 Prototype installation test ................................................................................................................................ 13Test program .......................................................................................................................................... 13Test object .............................................................................................................................................. 13Test load conditions ................................................................................................................................ 15Superimposed lightning and switching impulse test .................................................................................. 16
3.3 Monitoring and diagnostics of HVDC GIS ........................................................................................................ 18General .................................................................................................................................................. 18Example of different PD measuring methods............................................................................................ 19
3.4 Measurement and behavior of partial discharge for SF6 substitute gases ......................................................... 21Inception voltage ..................................................................................................................................... 23PD behavior ............................................................................................................................................ 23PD evolution in function of time ............................................................................................................... 24Dielectric Behaviour: Insulation System Test with FK-mixture ................................................................... 25Summary & remark ................................................................................................................................. 25

PROJECT REPORT
iv
3.5 Special considerations for pre-standardization of DC GIS ................................................................................ 26Harmonisation of definitions .................................................................................................................... 26Pre-tests and subsequent tests ............................................................................................................... 26
4 Conclusion ........................................................................................................................................................... 27
5 References ........................................................................................................................................................... 28

PROJECT REPORT
5
NOMENCLATURE
ABBREVIATION EXPLANATION
HVAC High Voltage Alternating Current
HVDC High Voltage Direct Current
GIS Gas Insulated Switchgear / System
VSC Voltage Source Converter
LCC Line Commutated Converter
IEC International Electrotechnical Committee
WP Work Package
D15.X PROMOTioN WP 15 deliverables 15.x
PROJECT REPORT
6
EXECUTIVE SUMMARY
As a result of significant developments and space-saving benefits in switchgear systems for HVDC applications,
the EU funded project “Progress on Meshed HVDC Offshore Transmission Networks” (PROMOTioN) with its
aim to increase the Technology Readiness Level (TRL) of HVDC GIS for a meshed offshore grid. Due to the
limit of operating experience to 250 kV, the Work Package (WP) 15 of PROMOTioN set up to demonstrate the
long-term performance of a complete HVDC gas-insulated metal-enclosed system. Due to the lack of
standardisation of HVDC GIS, this paper aims to summarise the experience and knowledge gained from all
participants of WP 15, which includes prototype installation test, novel approaches of partial discharge (PD)
measurements and eco-efficient SF6 alternatives for HVDC GIS, while to contribute to standardise testing DC
GIS for power transmission at a rated voltage of 550 kV and higher.
This prototype installation test covers three types of load conditions with both DC voltage polarities. The 320 kV
DC GIS test pole consists of different forms of busbars, disconnectors, earthing switches, bushing and build-in
instrument transformers. The tests involve continuous DC stress (20% above rated value), impulse voltage
tests, polarity reversal tests, superimposed impulse voltage tests, DC and AC PD measurement and a full rated
current thermal stress. The detailed test program, test requirement and test procedure published in
PROMOTioN WP deliverable D 15.2. Eventually, DC GIS demonstrates the technology will be well suitable for
commercial HVDC station application.
This paper focuses on inputs from all participants of WP 15, including specification of HVDC GIS from TSO
point of view, prototype installation test, novel approaches of partial discharge (PD) measurements and eco-
efficient SF6 alternatives for HVDC GIS. The structure of this paper is described below.
After a brief introduction of chapter 1 about the importance of product standardization. Chapter 2 explains the
current status of HVDC GIS standardization activities. Chapter 3 focuses on the inputs for standardization from
PROMOTioN WP15 work. It covers the specification of HVDC GIS, prototype installation test, monitoring and
diagnostics of HVDC GIS, measurement and behaviour of partial discharge for SF6 substitute gases and
special considerations for pre-standardization of DC GIS. Chapter 4 concludes the main contributions and
recommendations to the progress of the standardisation of HVDC GIS. Chapter 5 gives all the references.

PROJECT REPORT
7
1 INTRODUCTION
Standardization is essential to provide a common base for users to specify and operate, manufacturers to
design and laboratories to test HVDC GIS equipment. Additionally, results from basic research at universities
and institutes provide the technical foundation for standardization. Thus, contributions from all four areas are
important to create a meaningful, effective specification.
The importance of HVDC GIS is increasing based on its advantages for contribution to DC transmission
network. The operational experience and standardised qualification testing program are not ready yet. Therefore
CIGRE JWG D1/B3.57 (Joint Working Group) has been working for collecting practical experience, research
contributions and manufacturer’s design testing and development testing carried out in independent laboratories
and academic institutes. This working group made sufficient progress and contributions [1]. Especially, EU
project PROMOTioN stepped into this topic and organised WP 15 to focus on the long term performance to
HVDC GIS, including to develop novel approaches for PD measurement and investigate SF6 and its alternative
gases to interactions with standardisation work. PROMOTioN WP15 partners include TSOs, GIS manufacturer,
an independent lab, research institute as well as university. The participants from WP 15 of PROMOTioN
contribute to increasing the Technology Readiness Level (TRL) of HVDC GIS and deliver a significant
contribution towards standardisation.
The main topics of deliverables of WP 15 are listed below:
D15.1 Recommendations for Specifying DC GIS Systems [2]
D15.2 Document on test requirements, procedures and methods [3]
D15.3 Report on DC GIS diagnostic and monitoring tools and methods [4]
D15.4 Test report of prototype installation test on HVDC GIS [5]
D15.5 Report on diagnostic analysis and condition assessment [6]
D15.6 White- and position papers on pre-standardization of DC GIS testing (the present document)
D15.7 Report on PD characteristics of SF6 alternative gases: comparison with SF6 [7]
D15.8 Report on long term monitoring of DC GIS with defects [8]
The present deliverable D15.6 aims at evaluating the key results of all WP15 deliverable and deriving inputs for
standardisation of HVDC GIS.

PROJECT REPORT
8
2 CURRENT STATUS OF HVDC GISSTANDARDIZATION ACTIVITIES
With the beginning of R&D on a new compact generation of HVDC GIS in the early 2010s, basic work into
standardization begun [9]. As of now (March 2020), within IEC first steps are planned to integrate DC-specific
standards into existing AC switchgear standardization. In parallel to PROMOTioN WP15 activities, CIGRE
working groups are active to draft Technical Brochures (TB) to build a technical foundation for future
standardization.
2.1 INTEGRATION/ADDITION OF DC SPECIFIC STANDARDIZATION INTO EXISTING AC GISSTANDARDIZATION
• Results from IEC SC 17 C – AHG37:• It is recommended to establish a new DC GIS standard
IEC 62271-317 DC GIS “DC gas-insulated switchgear assemblies.”
• First NWIP draft rejected due to lack of participation, the second proposal with more
participation
• Start expected 2020, Uwe Riechert possible convener
• It is recommended to establish a new DC GIL standard
IEC 62271-3XX DC GIL• start later
• It is recommended to establish a new DC Common Specification standard
IEC 62271-5 DC Common Specification for direct current switchgear• This document shall cover all requirements which are common to DC GIS and DC GIL as well
as air-insulated DC switchgear
• Start 2020
• Convener Motoharu Shiiki (Toshiba)
2.2 PARALLEL HVDC GIS STANDARDIZATION ACTIVITIES
• CIGRE JWG B1/B3/D1.79: new working group created “Recommendations for dielectric testing of
HVDC gas insulated system cable sealing ends.”
• Cornelis Plet will be a convener
• Kick-off in February 2020, final report 2022
• Members from WP15 from DNV GL, KEMA Labs, ABB, SGI, TenneT
• Further members wanted
• CIGRE JWG D1/B3.57: Technical Brochure TB expected for publication in Summer 2020, currently in
an internal review
• D15.2 references CIGRE TB for type tests

PROJECT REPORT
9
• CIGRE TB contains a description of the prototype installation test
• Feedback gained from execution of PROMOTioN WP15 prototype installation test at KEMA
Labs Arnhem was introduced into the CIGRE JWGComparison of PROMOTioN prototype installation test (D15.2 and test experiences) withdefinitions in TB (Table 1 and
• Table 2): The prototype installation test performed as part of PROMOTioN WP15 is valid for
HVDC GIS also according to CIGRE JWG, during test execution, care has to be taken with
regard to interruptions time that can easily occur during lab handlingTable 1: Similarities in Definition of Prototype Installation Test in upcoming CIGRE JWG D1/B3.57 and PROMOTioN D15.2
Similarities
Non-mandatory test to gain operational experience
Aging can not be proven by the long-term test
Min one year total test time
All major modules to be included
Include thermal and mechanical stresses
Pretests and subsequent condition check
Test voltage levels (1.2 rated DC & 0.8 rated impulse withstand with superimposed on 1.0 rated DC), 3impulses per polarity and test
AC and DC heating current allowed
One ZL and two HL cycles for each polarity
Max interruption time 3 days
Make sure that interruptions are followed by triple the interruption time for recharging (early in interruptionsprolong the test only by the 1 x t_off)
Table 2: Differences in Definition of Prototype Installation Test in upcoming CIGRE JWG D1/B3.57 and PROMOTioN D15.2
Differences
CIGRE JWG D1/B3.57 PROMOTioN D15.2
GIL also covered -
Oscillation impulse voltage with higher timetolerances allowed
would also be possible to test as an additional test butnot included in D15.2
Separation of superimposed LI and SI possible(split of 60-day cycles in two 30 day cycles)
-
- Load cycles with varying load current levels included
- Mechanical operations of switching devices included
Interruption: each interruption must becompensated by min 2 h (exceptions for voltagedips during superimposed testing with spark gap)
No min. compensation time defined but considered intest execution

PROJECT REPORT
10
3 INPUTS FOR STANDARDIZATION FROMPROMOTION WP15 WORK
3.1 SPECIFICATION OF HVDC GIS
INTRODUCTION
Within this chapter recommendation for specifying HVDC GIS systems shall be given. The main differences to
the specification of AC GIS are related to the specific insulating systems, voltage stresses, monitoring and
testing. Therefore this chapter focus on these topics. An example specification of an HVDC GIS for three-
terminal HVDC hub is given in [2].
The HVDC GIS shall comprise of at least the following equipment: bus-bars/bus-ducts, disconnectors, earthing
switches, DC current transformers, DC voltage transformers, bushings, cable connection and appropriate
insulation medium and enclosure. Note that circuit breakers will not be included in the DC GIS. On-load
interruption of DC current is not possible without specialized DC circuit breakers which are until now not
includable in DC GIS.
Besides, connections and sensors should be provided to facilitate the monitoring and testing of partial
discharges.
RATED VOLTAGES AND CURRENTS
There are presently no standard transmission voltages for VSC-HVDC. Voltages ranging from ±150 kV DC to
±525 kV DC have been used recently and in projects under commissioning [10]. The DC voltage used is mostly
determined by the amount of power required to be transferred through the link and is limited by the available
voltage rating of the cable technology.
The current rating of the HVDC link is usually limited by the IGBT devices used. Typically, existing devices are
rated up to 2000 A, but this is usually de-rated to achieve a safe operating area.
However, several HVDC converters may be connected in parallel onto a common HVDC transmission grid.
Hence, the HVDC grid and its associated switchgear would be rated for currently more than 2000 A.
LIGHTNING AND SWITCHING IMPULSE WITHSTAND VOLTAGES
Lightning and switching phenomena determine the maximum transient voltages and currents experienced by
the switchgear. Required Lightning Withstand Level (LIWL) and Switching Withstand Level (SIWL) vary
depending on insulation coordination study. Standard withstand levels provided in IEC 60071 for AC systems,
may be used as a reference for HVDC systems. Appropriate insulation withstands level should be ensured
through insulation coordination and transient overvoltage studies. SIWL and LIWL levels selected should
maintain a margin to the maximum calculated Switching Impulse Protection Level (SIPL) and Lightning Impulse
Protection Level (LIPL) respectively. Typically, a margin of 15% to 30% is applied.

PROJECT REPORT
11
TEST REQUIREMENTS
Unlike AC, the accumulation of charge over surfaces for DC can take a long time. It is highly dependent on the
atmospheric conditions, temperature, physical design and construction: shape and material used. The
accumulation of charge can range from a few minutes to months, which makes testing extremely challenging.
There is currently no standard for testing of HVDC GIS. However, sections of IEC 62271-1 and IEC 62271-203
for testing of AC gas-insulated metal-enclosed switchgear for rated voltages above 52 kV could be used as a
reference for HVDC.
3.1.4.1 ROUTINE TESTS
Routine tests shall be carried out on all items of the HVDC GIS. They prove that the performance of the
components being tested agrees with the base design for which type tests have been performed. They serve to
eliminate defects introduced by the manufacturing process, which may fail operation. As such, AC GIS routine
test standards for this purpose are sufficient [11]. Routine tests shall be conducted in accordance to IEC62271-1
Clause 8, and IEC 62271-203 Clause 7 with the exception that the dielectric tests on the main circuit either
power frequency voltage or DC voltage and partial discharge tests shall be used.
3.1.4.2 TYPE TESTS
Most of the type tests listed in IEC 62271-1, and IEC 62271-203 are suitable to be performed for HVDC GIS as
stated. However, additional tests to prove to withstand DC stresses should also be performed. Type tests
suitable to be performed for HVDC GIS are as follows:
• Tests to verify the insulation level of the equipment and dielectric tests on auxiliary circuits.
• Tests to prove the radio interference voltage (RIV) level (This test applies only to bushings.)
• Tests to prove the temperature rise of any part of the equipment and measure the resistance of the
main circuit.
• Tests to prove the rated peak and the rated short-time withstand current
• Verification of protection (IP/IK coding)
• Gas tightness tests
• Electromagnetic compatibility test
• Tests to prove the satisfactory operation of the included switching devices
• Insulator tests
3.1.4.3 ADDITIONAL TYPE TESTS
Most of the type tests listed in IEC 62271-1, and IEC 62271-203 are suitable to be performed for HVDC GIS as
already stated.
DIELECTRIC TEST WITH DC PRE-STRESS APPLIED
DC voltage leads to an accumulation of surface charges on insulators. It may take a long time for the charge to
accumulate fully. The period could even take several months. This accumulation of charge tends to lower the
switching impulse and lightning impulse flashover voltage. Typically, the DC voltage must be applied for a

PROJECT REPORT
12
longer period [12]. However, appropriate charging time must be derived and verified through a multi-physics
simulation with consideration to the GIS geometries and prevailing environmental conditions. A higher voltage or
higher temperatures may be used in the test to shorten the period of charge accumulation after it is first
demonstrated through appropriate simulation. Lightning impulse and switching impulse tests under 3.1.3 may
then be carried out.
Superimposed DC voltage and lightning/switching impulse tests should also be conducted to test such
conditions which are likely during operation of the HVDC GIS.
The insulator/gas interface superimposed tests shall be performed at high load conditions. The tests shall be
performed, as shown in Table 3.
Description Test Voltage DurationType testsGas insulation
DC voltage withstand test
Lightning impulse (LI) voltage test
Switching impulse (SI) voltage test
Superimposed voltage test
Polarity reversal test*1
1.5 x Un
IEC 60071-1/-5
IEC 60071-1/-5
1.0 x Un + rated LI/SI voltage
1.25 x Un
1 min
15 impulses.
15 impulses
15 impulses
30 minutesInsulator/gasinterface
Insulation system test: DC voltage test
Superimposed voltage tests (worstcase conditions)
1.0 x Un
Ur + rated LI/SI voltage
90% charging time
3 impulses
*1 The polarity reversal test is applicable for LCC systems only. The dielectric stresses are covered by more criticaltests like superimposed voltage tests. Therefore, polarity reversal tests are optional tests and not mandatory.
Table 3: Dielectric testing [2]
LONG DURATION TESTS
For HVDC gas-insulated systems, a verification of the electrical lifetime (V-t characteristic) is of insignificant
importance. Because the electrical lifetime of solid insulating material used in GIS/GIL is equal or even better
under DC voltage stress compared to AC at typical service stress.
Experiences with AC gas-insulated systems show that all parts of the insulation system, assuming sound
manufacturing quality requirements, do not reveal any ageing mechanisms which cause critical ageing.
Therefore, overall the entire sound insulation system should not exhibit an increase in the failure rate with time.
After 30 years of operation, there is no general ageing which recognizably affects the long-term performance.
The lifetime can be estimated to be much higher than 30 years. This is in line with the findings based on
considerations about the critical physical phenomena and investigations of the long-term statistical performance.
Additional mechanical stresses caused by load cycles similar to those in cables are of minor interest for GIS/GIL
applications. They are covered by thermal cycles performance tests of each insulator design, according to IEC
62271-203 (6.106). Additional tests are not necessary. Nevertheless, a combination with the insulation system
tests under high load conditions could be performed.

PROJECT REPORT
13
3.2 PROTOTYPE INSTALLATION TEST
HVDC GIS has the standard parameters as HVAC GIS such as solid insulation, gas insulation and interface
gas-solid. Still, it also has different electrical field distribution determined by the temperature, conductivity of the
insulating materials and particular phenomena of the accumulation of space- and surface charges. Zooming into
the history of operation of HVDC GIS worldwide, there is little service experience and no persuasive long-term
reliability to ensure the technology readiness level for real service conditions. Therefore, this prototype
installation test is valuable for evaluation of this technology and providing the evidence of long-term
performance capability under simulated the closest service condition. This prototype installation test under the
task of WP 15 especially meets the needs of such necessity.
TEST PROGRAM
Prototype installation test especially applies for the first installation of a new gas-insulated system for a long-
term test period. This long-term test requires the overall assembling process represents the real application in
the real grid and the size and components of the test arrangement match with all critical components of the real
customer projects.
Figure 1 shows the brief test program and test procedure of the prototype installation test; the detailed
information refers to [3].
Figure 1: Test program and test procedure of the prototype installation test
The test program includes pre-tests, long-term voltage test (ZL, HL and LC loads) and subsequent tests. After
each test block (ZL/HL/LC), superimposed impulse tests needs to be performed. Additionally, to simulate the
real grid operation covers the mechanical operations of the switching devices under no-load condition, which
might create particles or other unforeseen defects during the mechanical open and close switching operations.
TEST OBJECT
The test object is a 320 kV DC GIS complete system and has the nominal DC voltage of 320 (Undc) kV and the
rated continuous DC voltage of 350 (Urdc) kV. This test loop consists of approximately 40 m of the DC GIS
circuit, see Figure 2.

PROJECT REPORT
14
Figure 2: 320 kV HVDC GIS prototype test
The test object equipped with voltage, current, temperature, gas, arc detection, and PD monitoring system, see
Figure 3. There are three ambient thermocouples located in different location of the test object because this is a
relatively large test loop (7.3 x 12.7 m). The test experience is that multiple locations of the ambient temperature
recording system are necessary, especially for larger test loop, to get proper test environment information.
Furthermore, the surface temperature of each section of DC GIS should be recorded as well.
Figure 3: The overview of the test arrangement

PROJECT REPORT
15
TEST LOAD CONDITIONS
There are three types of load conditions: zero load (ZL), high load (HL) and load cycle (LC) see Figure 4, Figure
5 and Figure 6, respectively. During HL and LC load cases, to achieve the corresponding temperature
differences on the solid insulation in the GIS, a heating transformer needs to produce the current following the
busbar (conductor) as the main current path. This current is possible with DC as well as with thermally
equivalent AC. For the PROMOTioN test, three conventional AC CTs to induce the equivalent AC, which is
often easier to achieve in a lab environment.
Figure 4: The real zero load graph
Figure 5: The real high load graph
0
500
1000
1500
2000
2500
3000
3500
4000
4500
5000
0
5
10
15
20
25
30
35
40
45
50
0 2 4 6 8 10 12 14 16 18 20 22 24
Cur
rent
[A]/
Volta
ge/1
0 [kV
]
Tem
pera
ture
[°C
]
Elapsed time [h]
Record on 12-2-2019 at 10:46
Zero load (ZL) at 0 Arms and - 420 kVdc
Ambient and enclosure temperatures
0
500
1000
1500
2000
2500
3000
3500
4000
4500
5000
0
10
20
30
40
50
60
70
80
90
100
0 1 2 3 4 5 6 7 8 9 10 11 12 13 14 15 16 17 18 19 20 21 22 23 24
Curr
ent [
A]/V
olta
ge/1
0 [k
V]
Tem
pera
ture
[°C]
Elapsed time [h]
Record on 21-5-2019 at 11:13
High load (HL) at 4000 Arms and - 420 kVdc
Ambient temperature
Enclosure temperatures

PROJECT REPORT
16
Figure 6: The real load cycle graph during pre-conditioning test
Based on all temperature recording data of HL, the temperature difference between enclosure and ambient (ΔT)* is 20 ± 1 K during thermal steady state. In this project, after 6 hours, the temperature of the test object reaches
the thermal steady state at HL load conditions.
*: ΔT = T average surface of enclosure – T average of ambient.
The prototype installation test simulates long-term interruption-free operation at DC voltage with regular impulse
overvoltage due to switching operations or lightning strikes. However, in practice, there can occur unforeseen
interruption, including lab power-downs, equipment handling or other unforeseen (voltage, current, temperature)
interruptions. The compensation requirement is defined as detailed in [3]. Compensation times are only for
short-term (max. three days) interruption. Otherwise, each cycle block needs to be resumed.
SUPERIMPOSED LIGHTNING AND SWITCHING IMPULSE TEST
The superimposed impulse voltage test is a unique requirement for HVDC components, including HVDC cable
and HVDC GIS. There are two methods (Spark gap and blocking capacitor) introduced in IEC 60230:2018.
A spark gap method is applied to generate the superimposed DC and impulse voltages in this project, the actual
test circuit and real test set-up see Figure 7.
Figure 7: Superimposed impulse test diagram and real test set-up
Moreover, the typical superimposed LI and SI test graphs are present in Figure 8.
0
500
1000
1500
2000
2500
3000
3500
4000
4500
5000
0
10
20
30
40
50
60
70
80
90
100
Curr
ent [
A]
Tem
pera
ture
[°C
]
Elapsed time [h]
Record on 10-10-2018 at 10:46
Load cycle (LC) at various currents
Enclousure temperatures
Ambient temperature
VDC
Rf
Rt
Lp
DC voltage divider
universal divider
Impulse Voltage divider
CDC GIS
Spark gap
VDC+ SI /LI VSI/LI
Impu
lse
volta
ge g
ener
ato
r
DC
volta
ge g
ener
ator
Rp

PROJECT REPORT
17
+ DC 350 kV and – LI 940 kV + DC 350 kV and – SI 760 kV
+ DC 350 kV and + LI 940 kV + DC 350 kV and + SI 760 kV
Figure 8: Typical superimposed LI and SI test graphs, all combinations with positive DC voltage shown, four further
combinations with negative DC analogously.
Based on the practice experience, the pros and cons of both methods are summarized below, see Table 4 and
Table 5.Table 4: The spark gap method:
Pros Cons
Smaller impulse generator required;
A spark gap is cheap;
Space-saving;
Easy to implement;
Cost-effective for a laboratory.
Energy dissipation to the test object with extra discharging and
recharging process;
The breakdown of a spark gap influenced by the ambient
conditions of a laboratory (air pressure, humidity, temperature);
Distance control of spark gap is critical to avoid the impulse
extinguish and re-ignition;
Table 5:The blocking capacitor method:
Pros Cons
Energy dissipation to the test object
without extra discharging and recharging
process;
Less influenced by ambient conditions of
a laboratory.
Large impulse generator required;
Expensive capacitive coupling capacitor;
Large testing space required;
Un-easy to implement;
Costly.

PROJECT REPORT
18
The spark gap method is an effective solution, but if there are no equipped trigger units can have extinction and
reignition effects (see Figure 9).
Figure 9: a few samples of extinction and reignition effects of spark gap method
3.3 MONITORING AND DIAGNOSTICS OF HVDC GIS
GENERAL
Partial discharge measurements can be carried out in HVDC GIS following the traditional UHF method as
described in [13]. However, the UHF method is not able to properly estimate the apparent charge due to the
frequency bandwidth of the sensors and the propagation modes in the UHF range in the GIS. Moreover, at high
frequency, the attenuation of the signals in the UHF is prominent, which in practice means that the distance
between antennas has to be carefully considered to ensure a good sensitivity in the whole GIS. The signal
attenuation is due to the GIS components, like spacers [14], disconnecting elements [15], T-branches [16], L-
branches [17] and in general due to any installed element that either creates a geometrical or material discontinuity
in the GIS with respect to the GIS tube.
To overcome these limitations, a new method based on magnetic antennas has been developed at the Delft
University of Technology. The foundations of the method have been presented in [18]. The magnetic antennas
consist of two shielded loops that can be installed in the conventional dielectric windows where the UHF antennas
are connected when a partial discharge propagates through the GIS the induced currents in the GIS enclosure
have to diverge as they encounter the opening of the dielectric window. The charge in the direction of the currents
surrounding the dielectric window induces a magnetic field that is picked up by two shielded coils. The shielded
coils are arranged in such a way that one coil measures the flux created in the upper part of the opening and the
other coil measures the flux in the lower part, both with respect to the propagation direction of the partial discharge.
Since the induced partial discharge currents flowing in the GIS are homogeneously distributed, both antennas
measure opposite polarity signals of similar magnitude. This fact helps in recognition of the partial discharges
since external coupled noise normally doesn’t induce symmetric voltage in the antennas.

PROJECT REPORT
19
Due to their constructive aspects, the magnetic loop antennas work in the HF and low VHF range, [19]. In practice,
due to the geometry and dimensions of typical HVDC GIS, this means that the antennas measure the portion of
the partial discharge signal that propagates in the transverse electromagnetic mode (TEM). In this frequency
range, the signal attenuation is smaller than in the UHF range. In laboratory experiments, the sensitivity of the
magnetic loop antennas is in the order of magnitude of 1 pC at 3.3 m distance for a free moving particle in SF6.
Moreover, it has been experimentally measured that after propagating 20 m in the GIS, including switchgear, a
disconnector switch, a T-branch and several L-branches, the peak value of the measured partial discharge signals
is normally attenuated by around 50%.
Since the measuring system uses the HF and VHF range, a normal partial discharge calibrator can be used to
perform the sensitivity check and the charge calibration. Since the antennas are based on magnetic detection, it
is advisable not to mount the antennas close to GIS ends or terminations; otherwise, the reflected currents due
to the impedance mismatching will reduce the sensitivity of the antenna. In that regard, a minimum distance
around 1.5 m to the GIS terminations or ends is recommended for the magnetic antenna location.
The charge calibration of the magnetic antenna can be done by using a mathematical method that performs the
double-time integral of the measured signals affected by a calibration factor. This calibration factor can be
experimentally determined using a calibration rig. At the Delft University of Technology, a testbench has been
built to perform the calibration. The testbench is a calibration rig that uses a small GIS compartment reproduction
in which the inner conductor has been adapted to mount a high-frequency current transformer [19]. Using the
high-frequency current transformer and applying the double-time integral of the measured signal, the calibration
constant is experimentally determined. The calibration should inject a PD pulse with a broader frequency content
than the magnetic loop antenna, which in practice means that a partial discharge calibrator for cable testing is
suitable. The calibration factor heavily depends upon the GIS dimensions; therefore, it can only be used in partial
discharge GIS measurements that use GIS tubes or the same dimensions. The experimentally determined
calibration constant has been checked in laboratory experiments using real GIS and test cells equipped with
current measurements for charge reference, [19]. The experiments show small deviations between the antennas
and between them and the test cell reference, in the order of 30% maximum differences. This deviation is
attributed to small differences in the orientation and position of the antennas in the real GIS dielectric window with
respect to the calibration rig.
EXAMPLE OF DIFFERENT PD MEASURING METHODS
Within the WP15 of PROMOTioN project, PD measurements are carried out with different measurement systems.
Figure 10 shows an example of the evolution of PD signal recorded by the conventional system, light emission
and UHF methods under negative DC voltage for a protrusion of 2 cm in 5 bar abs SF6.
As illustrated in Figure 10, the recorded signals remain below the background noise level until the PD inception
voltage (PDIV) is reached (about 60 kV). The current, image of the emitted light and the apparent charge follow
the same tendency when the voltage increases above the PDIV. The sensitivity of both systems is similar as they

PROJECT REPORT
20
lead to the same PDIV whatever the type of gas. For UHF measuring system, when the PDIV is exceeded, the
frequency spectrum amplitude changes due to the presence of electromagnetic waves inside test setup generated
by PD (Figure 10(c) at -40kV and -60kV).
(a)
(b)
(c)Figure 10: PD signal recorded by a different measuring system under a negative DC voltage with a protrusion defect of 2 cm.
(a) Convention method: the red curve is the applied voltage, and the green curve is the PD amplitude (b) Light emission: the
orange curve is the applied voltage, and the blue curve is the measured current image of light emission quantity and (c) UHF
antenna with a spectrum analyzer for SF6 5 bar abs (background noise at 40 kV and PD activity at 60 kV).
An example of a PD signal generated by a protrusion defect of 10 mm and recorded by the magnetic antenna,
provided by TU Delft University can be found in Figure 11b. When PD inception voltage is exceeded, and the PD
amplitude is sufficiently high (>3 pC), the magnetic antenna is able to detect a PD pulse. Moreover, there is a
good correlation between different measuring systems (Figure 11c).
0
20
40
60
80
100
120
140
160
1.0E-12
1.0E-11
1.0E-10
1.0E-09
1.0E-080 500 1000 1500 2000 2500 3000
Volta
ge (k
V)
Curr
ent (
A)
Time (s)
Light emission measurement
-75
-70
-65
-60
-55
-50
-45
-40
300 400 500 600 700 800 900 1000 1100 1200
UHF
outp
ut (d
B)
Frequency (MHz)
-40kV
-75
-70
-65
-60
-55
-50
-45
-40
300 400 500 600 700 800 900 1000 1100 1200
UHF
out
put (
dB)
Frequency (MHz)
-60kV

PROJECT REPORT
21
Figure 11: Example of PD pulse (a) generated by a protrusion of 10 mm and measured by a magnetic antenna (b) and a UHFantenna (c), the apparent charge measured by the conventional method is ≈ 7 pC.
3.4 MEASUREMENT AND BEHAVIOR OF PARTIAL DISCHARGE FOR SF6 SUBSTITUTEGASES
Nowadays, SF6 is commonly used as insulation gas for high voltage equipment. However, it is classified in the
Kyoto protocol list as one of the gas with high GWP. In the past few years, researches have been conducted to
find alternatives to SF6 with a lower GWP. Among different solutions, the two fluorinated gases: (CF3)2CFCN –
NovecTM 4710 (FN) and CF3C(O)CF(CF3)2 – NovecTM 5110 (FK) are selected as promising candidates as they
present very high dielectric strength, non-flammability, and low GWP. Unfortunately, they present a high boiling
point, and they must be mixed with buffer gases to be suitable for low-temperature applications. Different gas
mixtures combining FN/FK and CO2/air are thus investigated to replace SF6 in GIS/GIL. With the SF6 replacement
tendency, the performance of SF6 alternatives HVDC GIS might need to be verified for future applications. In this
context, the Workpackage 15 (WP15) of the EU funded project “Progress on Meshed HVDC Offshore
Transmission Networks” (PROMOTioN) deals with the technology demonstration of HVDC GIS and investigation
of partial discharge (PD) monitoring systems with SF6 alternative gases.
There are CIGRE Working groups with regards to DC PD measurement:
D1.63 2015 Partial Discharge Detection under DC voltage stress [20]
As well as towards eco-efficient SF6 alternatives, mainly for AC applications:
D1.67 2016 Dielectric performance of new non-SF6 gases and gas mixtures for gas-insulated systems Christian
Franck (CH)
Within PROMOTioN, the PD behaviour of eco-efficient SF6 alternatives applied in HVDC GIS is investigated [7]
and [8]. The results can deliver significant results for future standardisation.
A PD measurement is the most effective method for defect detection and identification inside the apparatus.
Unfortunately, the methods for measurement and detection of PD under DC voltage are less developed and might
be less effective than that under AC voltage. There is, therefore, still a lack of knowledge on PD measurement

PROJECT REPORT
22
under DC and especially if SF6 alternative gases will be used as insulation gas in HVDC GIS/GIL. In the
perspective of future HVDC meshed networks, it is thus necessary to anticipate the possibility to install SF6 free
DC GIS and to develop dielectric monitoring system based on PD measurement to reach the same reliability level
as it is on AC GIS.
In order to overcome these gaps, studies on the PD behaviour of defect in potential SF6 alternative gases, FN
and FK mixtures under DC voltage in comparison with SF6 have been realized in the WP15 of PROMOTioN
project. The main results are summarized below. For more detail of this work, please refer to [7] and [8].
Investigated gases & defect
Various alternative gases with different SF6 equivalent dielectric strength were investigated. They are listed in
Table 6, Table 7 and Table 8. Note that the equivalent dielectric strength is determined under a uniform electric
field.
Gas Pressure (bar abs)SF6 5 (reference)
NovecTM 5110/Dry Air Mixture(6.6 % NovecTM 5110)
7.5
NovecTM 5110 (pure) 0.5Dry Air (pure) 7
NovecTM 4710/CO2 Mixture(10 % NovecTM 4710)
6.5
NovecTM 4710 (pure) 0.65CO2 (pure) 5.85
NovecTM 4710/CO2 Mixture(4% NovecTM 4710)
8.0
NovecTM 4710 (pure) 0.32CO2 (pure) 7.68
Table 6: Investigated gases with the same dielectric strength like SF6 at 5 bar abs
Gas Pressure (bar abs) Gas Pressure (bar abs)SF6 6 (reference) SF6 6.8 (reference)
NovecTM 5110/Dry AirMixture
( 5.3% NovecTM 5110)9.4
NovecTM 5110/Dry AirMixture
( 4.5% NovecTM 5110)11
NovecTM 5110 (pure) 0.5 NovecTM 5110 (pure) 0.5Dry Air (pure) 8.9 Dry Air (pure) 10.5
Table 7: Investigated gases with the same equivalent dielectric
strength like SF6 at 6 bar abs
Table 8: Investigated gases with the same equivalent dielectric
strength like SF6 at 6.8 bar abs
In the framework of Workpackage 15 - PROMOTioN project, PD behaviour of defect in SF6 and SF6 alternative
gases is investigated in a GIS test compartment as illustrated in Figure 12. The test compartment is part of a real-
size GIS to be closer to industrial applications. The studied defect is a tungsten needle with a diameter of 0.5 mm,
a tip radius of 50 µm and a length exceeding the high voltage conductor of 1 cm or 2 cm. Different measuring
systems, including conventional and non-conventional methods, are used to detect and analyse PD signals [4],
[5], [7] and [8].

PROJECT REPORT
23
Figure 12: Test compartment used to study the PD with a protrusion on high voltage conductor and different PD measuring
systems.
INCEPTION VOLTAGE
The inception voltages for the tested gases under negative and positive DC voltage are reported in Figure 13.
Almost the same order of PDIV was observed for SF6 and FN-CO2 mixtures while a slightly lower PDIV was
obtained for FK-Air mixtures compared to SF6, i.e., about 20 - 30% depending on the equivalent SF6 dielectric
strength pressure. Moreover, slightly higher inception voltage is observed for all gases with positive polarity. The
difference in term of PDIV might be due to the difference of dielectric strength between gas mixtures and SF6
under an inhomogeneous electric field.
Figure 13: Partial discharge inception voltage for a 20mm protrusion. (a) 5 bar SF6 equivalent dielectric strength, (b) 6 bar SF6
equivalent dielectric strength and (c) 6.8bar SF6 equivalent dielectric strength
PD BEHAVIOR
Figure 14 reports the evolution of PD amplitude and the average PD repetition frequency (average number of
discharges per second) in the function of applied voltage for different investigated gases at 5 bar SF6 equivalent
dielectric strength.
30
4050
6070
80
90
500 650 750 800
PDIV
(kV
)
Pressure (kPa abs)
(a)
SF6
10%FN-CO2
6,6%FK-Air
4%FN-CO2
3040
5060
70
8090
600 940
PDIV
(kV
)
Pressure (kPa abs)
(b)
SF6 5,3%FK-Air
30
4050
6070
80
90
680 1100
PDIV
(kV
)
Pressure (kPa abs)
(c)
SF6 4,5%FK-Air

PROJECT REPORT
24
Figure 14: Evolution of PD behaviour in function of voltage for a 20 mm protrusion. (a), (c) Positive polarity, (b), (d) Negative
polarity.
One can note that the PD amplitude and the PD repetition frequency increase generally with the increase of
applied DC voltage. However, the gas nature influences PD behaviour significantly. For example, at the voltage
of 100 kV, the PD amplitude is 13.2, 30.5, 99.3 and 18.9 pC for SF6 at 5 bar abs, 10% FN-CO2, 4% FN-CO2 and
6.6% FK-Air, respectively. Besides, the influence of DC polarity to PD amplitude in the function of gas composition
is evidenced. Higher PD amplitude is always observed under negative polarity for SF6 while it is observed under
positive polarity for SF6 alternative gases.
Moreover, a steady-state is observed under positive polarity for all investigated gases, where the PD amplitude
remains constant regardless of the increase of applied voltage. This observation is completely different compared
to PD behaviour under AC, where the PD amplitude usually increases with the increase of applied voltage.
Concerning the PD repetition frequency, the investigated alternative gases show higher PD repetition frequency
compared to SF6. For example, at the voltage of 100 kV, PD repetition frequency is 3520, 10200, 16600 and
35900 1/s for SF6 at 5 bar abs, 10% FN-CO2, 4% FN-CO2 and 6.6% FK-Air, respectively.
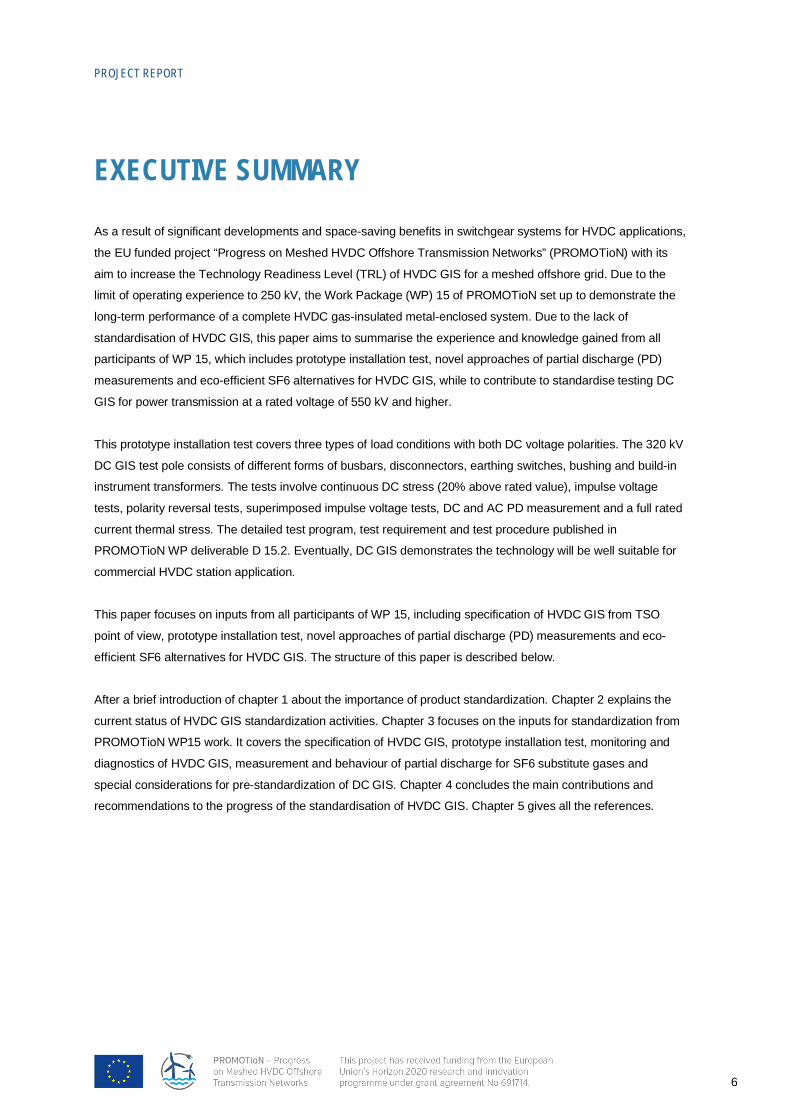
PD EVOLUTION IN FUNCTION OF TIME
Figure 15 reports the evolution of PD amplitude and the PD repetition frequency in function of voltage application
time. One underlines that PD amplitude increases with time before reaching a steady-state and the PD repetition
frequency for alternative gases is higher compared to SF6. For more information about PD behaviour in function
of time, please refer to [8].
0
20
40
60
80
100
120
40 60 80 100 120 140 160
PD a
mpl
itude
(pC
)
Voltage (kV)
SF610% FN-CO24% FN-CO2FK-Air 7.5bar
0
20
40
60
80
100
120
40 60 80 100 120 140 160
PD a
mpl
itude
(pC
)
Voltage (kV)
SF610% FN-CO24% FN-CO2FK-Air 7.5bar
DC+ DC-
1.0E+00
1.0E+01
1.0E+02
1.0E+03
1.0E+04
1.0E+05
40 60 80 100 120 140 160
PD ra
te (1
/s)
Voltage (kV)
SF610% FN-CO24% FN-CO2FK-Air 7.5bar 1.0E+00
1.0E+01
1.0E+02
1.0E+03
1.0E+04
1.0E+05
40 80 120 160
PD ra
te (1
/s)
Voltage (kV)
SF610% FN-CO24% FN-CO2FK-Air 7.5bar
DC+ DC-
(a) (b)
(c) (d)
PROJECT REPORT
25
Figure 15: Evolution of PD behaviour in function of time for a 10 mm protrusion defect. (a), (c) Positive polarity,(b), (d) Negative polarity
DIELECTRIC BEHAVIOUR: INSULATION SYSTEM TEST WITH FK-MIXTURE
Placeholder, PMG extension? Annexe? New revision?==>underconsideration
SUMMARY & REMARK
In the perspective of future HVDC meshed network, DC GIS/GIL should acquire the same reliability levels of AC
GIS. In particular, the capability of detection of partial discharge under DC voltage must be effective. As the partial
discharge experience feedback is still missing for HVDC and even more for SF6 alternative gases, partial
discharge measurements with defects are performed in SF6 and SF6 alternative gases with same theoretical SF6
dielectric strength under both polarities of DC Voltage with different measuring systems. In case of a protrusion,
some differences in terms of partial discharge inception voltage are observed although the gases have the same
theoretical dielectric strength.
Moreover, the studied alternative gases show higher PD amplitude under positive polarity while the PD have
higher amplitude under negative polarity for SF6. The PD repetition frequency is always higher for the SF6
alternative gases than SF6 under both polarities. These results highlight the influence of the field inhomogeneity
and gas composition on the partial discharge characteristics. Even though there are some differences between
gases, PD behaviour of alternative gases is comparable to SF6. Effective PD monitoring systems can thus be
developed for HVDC GIS with alternative gas
1,0E+1
1,0E+2
1,0E+3
1,0E+4
1,0E+5
0 2 4 6 8 10Time (day)
PD repetition frequency pol NEG
SF6 5 bar abs10%FN 6,5 bar abs6,6% FK-Air 7,5 bar abs
d)
0
20
40
60
80
100
0 2 4 6 8 10
PD a
mpl
itude
(pC)
Time (day)
PD amplitude pol NEG
SF6 5 bar abs10%FN 6,5 bar abs6,6% FK-Air 7,5 bar abs
b)
1,0E+1
1,0E+2
1,0E+3
1,0E+4
1,0E+5
0 2 4 6 8 10
PD re
petit
ion
freq
uenc
y (1
/s)
Time (day)
PD repetition frequency pol POS
SF6 5 bar abs10%FN 6,5 bar abs6,6% FK-Air 7,5 bar abs
PD re
petit
ion
frequ
ency
(1/s
)
0
20
40
60
80
100
0 2 4 6 8 10
PD a
mpl
itude
(pC)
Time (day)
PD amplitude pol POS
SF6 5 bar abs10%FN 6,5 bar abs6,6% FK-Air 7,5 bar abs
c)
a)
DC+ DC-

PROJECT REPORT
26
3.5 SPECIAL CONSIDERATIONS FOR PRE-STANDARDIZATION OF DC GIS
HARMONISATION OF DEFINITIONS
PROMOTioN deliverable D 15.2 gives all DC GIS-related definitions and their symbols. The standardization
should pay attention to harmonise all definitions with other DC components which avoid confusion.
PRE-TESTS AND SUBSEQUENT TESTS
Based on DC insulation breakdown characteristics and the conditioning effect of rough-finish electrodes, the DC
GIS test object is allowed to have a pre-conditioning test before being subjected to any dielectric tests on behalf
of the manufacturer. Therefore, there are pre-tests arranged to calibrate relevant values and check the test set-
up before the prototype installation test. After completing the long-term voltage test, the subsequent tests are
recommended after the prototype installation test before disassembling the test objects for inspection. For
instance, there are AC PD measurement, DC PD measurement and lightning impulse test and switching
impulse test listed.
The AC PD measurement is to check if there is no any installation failure before the prototype
installation test.
The DC PD measurement is to check the condition of the test object before and after the prototype
installation test. The results of the PD measurement can be compared.
The test object has low capacitance of 3 nF. Therefore, a proper test setup is needed to make a
standard lightning impulse wave (1.2/50 µs) and switching impulse wave (250/2500 µs).
The proper set-up is to limit the overshoot of lightning impulse within 10% (Figure 16).
The external capacitor (5 nF) parallels to the test object to have a 250 µs front time (Figure 17).
Figure 16: the lightning impulse graphs at 1050 kV
Figure 17: the switching impulse graphs at 950 kV

PROJECT REPORT
27
4 CONCLUSION
The objective of PROMOTioN WP 15 is to develop a thorough understanding of technical and operational
requirements of DC GIS systems in meshed offshore HVDC grids, develop and demonstrate monitoring and
diagnostic methods, develop meaningful standardized test programs based on existing standardization work
and increase technology readiness level (TRL) of DC GIS technology from 6 to 8 by demonstrating a full-scale
prototype in an independent test lab.
This project has also combined the specification from TSO’s perspective. Therefore, the specification focuses
on the main differences to the specification of AC GIS, in which TSO builts knowledge and experience. The
detailed specific testing guideline and requirement of a test object are described.
Prototype installation test is a special and optional test which is not in the category of a type test program.
However, it is a proposed test to be performed after the type tests, to indicate the long-term (more than one
year) performance of a complete HVDC gas-insulated system. Within PROMOTioN project, the prototype
installation test consists of six 60-day blocks plus two 15-day blocks of DC stress, terminated by superimposed
switching and lightning impulse withstand voltage tests, respectively. In order to represent the typical GIS
lifetime of 40 years, the DC voltage level (± 420) is increased to 20% above the rated value (± 350) in the long-
term phase.
Partial discharge measurements can be carried out in HVDC GIS following the traditional UHF method.
However, the UHF method is not able to properly estimate the apparent charge due to the frequency bandwidth
of the sensors and the propagation modes in the UHF range in the GIS. A new method based on magnetic
antennas has been developed at the Delft University of Technology. Due to their constructive aspects, the
magnetic loop antennas work in the HF and low VHF range. The detail descriptions can be found in [6].
Due to lack of the partial discharge experience feedback is still missing for HVDC and even more, for SF6
alternative gases, partial discharge measurements with defects are performed in SF6 and SF6 alternative gases
with same theoretical SF6 dielectric strength under both polarity of DC Voltage with different measuring
systems. In case of a protrusion, some differences in terms of partial discharge inception voltage are observed
although the gases have the same theoretical dielectric strength. The detailed descriptions and results refer to D
15.8. Although there are some differences between gases, PD behaviour of alternative gases is comparable to
SF6. Effective PD monitoring systems can thus be developed for HVDC GIS with alternative gas.
All PROMOTioN WP 15 achievements will be contributed to the standardization of HVDC GIS.

PROJECT REPORT
28
5 REFERENCES
[1] CIGRE JWG D1/B3.57, Dielectric Testing of gas-insulated HVDC Systems, CIGRE, 2016.[2] PROMOTioN WP15, "Deliverable D15.1 recommendations for Specifying DC GIS Systems," 2019.
[Online]. Available: https://www.promotion-offshore.net/results/deliverables/.[3] PROMOTioN WP15, "Deliverable D15.2 document on test requirements, procedures and methods," 2019.
[Online]. Available: https://www.promotion-offshore.net/results/deliverables/.[4] PROMOTioN WP15, "Deliverable D15.3 report on DC GIS diagnostic and monitoring tools and methods,"
2019. [Online]. Available: https://www.promotion-offshore.net/results/deliverables/.[5] PROMOTioN WP15, "Deliverable D15.4 test report of prototype installation test on HVDC GIS," 2020.
[Online]. Available: https://www.promotion-offshore.net/results/deliverables/.[6] PROMOTioN WP15, "Deliverable D15.5 report on diagnostic analysis and condition assessment," 2020.
[Online]. Available: https://www.promotion-offshore.net/results/deliverables/.[7] PROMOTioN WP15, "Deliverable D15.7 report on PD characteristics of SF6 alternative gases:
comparison with SF6," 2020. [Online]. Available: https://www.promotion-offshore.net/results/deliverables/.[8] PROMOTioN WP15, "Deliverable D15.8 report on long term monitoring of DC GIS with defects," [Online].
Available: https://www.promotion-offshore.net/results/deliverables/.[9] M. Gatzsche, U. Riechert, H. He, Y. Audichya, A. R. Mor, L. C. Heredia and F. Muño, Prototype
Installation Test of HVDC GIS for Meshed Offshore Grids, GIGRE SC B3 / PS1, 2020.[10] CIGRE WG B4/C1.65, TB 684: Recommended Voltages for HVDC Grids, CIGRE, 2017.[11] K. Juhre, B. Lutz, D. Imamovic, "Testing and long term performance of gas-insulated DC compact
switchgear," CIGRE.[12] CIGRE WG D1.03, TB 506: Gas Insulated System for HVDC: DC Stress at DC and AC Systems, CIGRE,
2012.[13] U. Schichler et al., "UHF partial discharge detection system for GIS: Application guide for sensitivity
verification CIGRE WG D1.25,"," IEEE Transactions on Dielectrics and Electrical Insulation, vol. 23, no. 3,pp. 1313-1321, 2016.
[14] M. Sawada et al., "Influence of metal flange cover of insulation spacers on propagation properties of PD-induced electromagnetic wave in GIS," in 2008 International Conference on Condition Monitoring andDiagnosis, Beijing, 2008.
[15] M. Hikita, S. Ohtsuka, S. Okabe, J. Wada, T. Hoshino and S. Maruyama, "Influence of disconnecting parton propagation properties of PD-induced electromagnetic wave in model GIS," IEEE Transactions onDielectrics and Electrical Insulation, vol. 17, no. 6, 2010.
[16] M. Hikita, S. Ohtsuka, T. Hoshino, S. Maruyama, G. Ueta and S. Okabe, "Propagation properties of PD-induced electromagnetic wave in GIS model tank with T branch structure," IEEE Transactions onDielectrics and Electrical Insulation, vol. 18, no. 1, pp. 256-263, 2011.
[17] M. Hikita, S. Ohtsuka, J. Wada, S. Okabe, T. Hoshino and S. Maruyama, "Propagation properties of PD-induced electromagnetic wave in 66 kV GIS model tank with L branch structure," IEEE Transactions onDielectrics and Electrical Insulation, vol. 18, no. 5, pp. 1678-1685, 2011.
[18] A. Rodrigo Mor, F. A. Muñoz Muñoz, L. C. Castro Heredia, "A Novel Antenna for Partial DischargeMeasurement in GIS Based on Magnetic Field Detection," Sensors, vol. 19, p. 858, 2019.
[19] A. Rodrigo Mor, L. C. Castro Heredia, F. A. Muñoz Muñoz, "A magnetic loop antenna for partial dischargemeasurements on GIS," International Journal of Electrical Power & Energy Systems, vol. 115, pp. 1-6,2020.
[20] CIGRE WG D1.63, Progress on Partial Discharge Detection under DC Voltage Stress, New Delhi (India):CIGRE, 2019.