Embed Size (px)
Citation preview

1
Project funded by the European Community under the Information and Communication Technologies Programme - Contract ICT-FP7-270833
D1.1 Report on Big Data Available and Privacy Aspects
DATA science for SIMulating the era of electric vehicles
www.datasim-fp7.eu
Project details
Project reference: 270833 Status: Execution Programme acronym: FP7-ICT (FET Open) Subprogramme area: ICT-2009.8.0 Future and Emerging Technologies Contract type: Collaborative project (generic)
Consortium details
Coordinator: 1. (UHasselt) Universiteit Hasselt
Partners: 2. (CNR) Consiglio Nazionale delle Ricerche 3. (BME) Budapesti Muszaki es Gazdasagtudomanyi Egyetem 4. (Fraunhofer) Fraunhofer-Gesellschaft zur Foerdering der Angewandten Forschung E.V 5. (UPM) Universidad Politecnica de Madrid 6. (VITO) Vlaamse Instelling voor Technologisch Onderzoek N.V. 7. (IIT) Technion – Israel Institute of Technology 8. (UPRC) University of Piraeus Research Center 9. (HU) University of Haifa
Contact details
Prof. dr. Davy Janssens Universiteit Hasselt– Transportation Research Institute (IMOB)
Function in DATA SIM: Person in charge of scientific and technical/technological aspects Address: Wetenschapspark 5 bus 6 | 3590 Diepenbeek | Belgium Tel.: +32 (0)11 26 91 28 Fax: +32 (0)11 26 91 99 E-mail: [email protected] URL: www.imob.uhasselt.be
Deliverable details
Work Package 1 Deliverable: 1.1 Dissemination level: PU Nature: R Contractual Date of Delivery: 31.08.2012 Actual Date of Delivery: 31.08.2012 Total number of pages: 44 Authors: Davy Janssens, Luk Knapen, Christine Körner, Anna Monreale, Luc Int Panis, Salvatore Rinzivillo, Daniel Schulz, Filippo Simini; Jesùs Fraille Ardanuy, Reinhilde D’hulst, Nikos Pelekis, Yannis Theodoridis

2
Project funded by the European Community under the Information and Communication Technologies Programme - Contract ICT-FP7-270833
Abstract
This document is the DATA SIM deliverable of WP1 for the first review period of the project (01.09.2011-31.08.2012). The document is mainly a descriptive report of the consortium’s availability of the different datasets that will be used in the project. The document also contains a selection of the main study area and a section about privacy issues. The deliverable should be seen as a first step which the consortium had to take in order to be able to execute the different work packages in the project.
Copyright
This report is DATASIM Consortium 2012. Its duplication is restricted to the personal use within the consortium and the European Commission.
www.datasim-fp7.eu
3
Project funded by the European Community under the Information and Communication Technologies Programme - Contract ICT-FP7-270833
Content
1 Introduction ....................................................................................................................................... 5
2 Selection of main study area ............................................................................................................ 7
3 Data that can be used for the representation of real movement of people: GPS traces and mobile phone data ............................................................................................................................................... 9
3.1 GPS Traces ............................................................................................................................. 9
3.1.1 Positioning within the project ............................................................................................... 9
3.1.2 Available data within the consortium ................................................................................. 11
3.2 Mobile Phone Data ................................................................................................................ 16
3.2.1 Positioning within the project ............................................................................................. 16
3.2.2 Available data within the consortium ................................................................................. 17
4 Data that can be used for extracting the behavior behind movements and motion: travel surveys (and GPS traces) ................................................................................................................................... 19
5 Data that can be used as complementary information for the development of a simulation platform .................................................................................................................................................. 29
5.1 Network data .......................................................................................................................... 29
5.2 Land use data ........................................................................................................................ 30
5.3 Population data ...................................................................................................................... 31
5.4 Traffic Loop Detector Data .................................................................................................... 32
6 Data that can be used for the application scenario ........................................................................ 33
7 Privacy issues related to GPS Traces and mobile phone data ...................................................... 35
7.1 Privacy by Design .................................................................................................................. 35
7.2 Privacy research in DATA SIM .............................................................................................. 39
8 Annex 1: Electric Grid Typologies .................................................................................................. 41
9 References ..................................................................................................................................... 42

4
Project funded by the European Community under the Information and Communication Technologies Programme - Contract ICT-FP7-270833
List of Tables
Table 1: Total number of participants for the Ag.ma GPS and CATI dataset ................................... 13
List of Figures
Figure 1: The different zonal layers that are planned in the simulation model of WP3 ........................ 8
Figure 2: A visualization of the BB level for the study area of Flanders ............................................... 8
Figure 3: left: Municipalities with GPS measurements (source: Arbeitsgemeinschaft Media-Analyse e.V. and Media-Micro-Census GmbH, ma 2012 Plakat Methoden-Steckbrief zur Berichterstattung); right: municipalities with CATI measurements .................................................................... 14
Figure 4: GPS device used in the study ............................................................................................. 14
Figure 5: Call volumes (Erlang) in city center of Munich from May 2010 till June 2011 ..................... 18
Figure 6: The PARROTS application, showing from left to right, the beginscreen, the activity diary, the attributes of the activity part 1 (the type of activity, the date, the location) and the attributes of the activity part 2 (start time, end time, number of persons, with whom) ........ 24
Figure 7: left: Graphical illustration of the data storage and transmission process. right: Hardware tool to collect and transmit vehicle data and GPS data ............................. 26
Figure 8: Website: calender and trip information ................................................................................ 26
Figure 9: The SPARROW application (from left to right: the beginscreen, the annotation module for trips and activities, splash screen)....................................................................................... 28
Figure 10: DB building along the road network .................................................................................... 31
Figure 11: left: Selection of available loop detector data in Flanders. right: Time plot of Traffic Counts ......................................................................................... 32
Figure 12: Belgian High Voltage transmission grid (2012 .................................................................... 33
Figure 13: top: Commonly visited regions bottom: A de-identified GPS Trajectory ............................... Error! Bookmark not defined.6

5
Project funded by the European Community under the Information and Communication Technologies Programme - Contract ICT-FP7-270833
1 Introduction
The goal in the DATA SIM project is to develop a highly detailed spatio-temporal microsimulation methodology which is able to address the detailed nation-wide consequences of a massive switch to EV, given the intertwined nature of mobility and power distribution networks. The innovative methodology which needs to be developed for this kind of integrated analysis, has to be grounded on massive amounts of big data of various types and from various sources. The final outcome of the project is to have a prototype of a smart agent-based simulator ready. This means that not only big spatio-temporal data (such as GPS and mobile phone data) are fed into the model, but that the model is also enriched with behaviourally rich information (such as survey data). This should lead to a smart agent-based simulator that can be applied in at least one application domain. See the detailed Document Of Work (DOW, p. 4-9) for a more detailed description of the aims and challenges in the project related to this.
This deliverable is a descriptive report of the consortium’s availability of the different datasets in the project. It should be seen as a first step which needed to be taken in order to be able to execute the different work packages and to fulfill the main goal stated above. Obviously, we also started to work with these different datasets in the project. Detailed work progress is out-of-scope of this deliverable. Results achieved during Year 1 of the project have been described in Deliverable (DLV) 2.1 (WP2) and in the yearly report where a detailed status of work done has been given for all the other workpackages (WP’s) (since no other deliverables of other WP’s were due at the end of year 1).
Although the report is only descriptive in terms of which data can be used in the project, the “background” work which is done for every dataset is more extensive. Indeed, activities did not only include inventorisation of data among the different partners in the project and compiling this deliverable, but also consisted of contractual negotiations about the possibility to use existing data in the DATA SIM project, technical processing of the data, communication about input-output specifications of data for the benefit of integration in bilateral research, and the development of a tool that will collect a new data set (regarding electric vehicles) because we concluded that it was not available by the different partners in the project and also not publicly available. Those activities were foreseen in task 1.1. in the DOW on p. 31. In case other data would become available during the course of the next period of the project, we will indicate those changes in the annual report.
The usage of data is twofold: first of all, the datasets will obviously be used to carry out the different tasks as described in the DOW. This means that in some cases, datasets will be used by individual partners to test and develop specific algorithms needed for the completion of the different work packages in the project. The second usage applies in case where the data concerns the study area, data will be shared with other partners to develop joint knowledge and test the transferability of algorithms in another environment.
The remainder of this document is structured along with the variety of different datasources that will be used within the project. In terms of use, these data can be divided into four main categories:
6
Project funded by the European Community under the Information and Communication Technologies Programme - Contract ICT-FP7-270833
(i) data that can be used for the representation of real movement of people,
(ii) data that can be used for the extraction of the real behavior behind these movements,
(iii) data that can be used as complementary information for the development of an operational simulation platform where at least data coming from sources (i) and (ii) is integrated
(iv) data that can be used for the application scenario of the developed simulation platform (electric vehicles and implications on the power grid).
In most cases, the data was collected in previous projects by members of the consortium, acquired (bought or provided) from external sources, which implies that some restrictions in terms of use or privacy are in place. Section 7 elaborates on this. Most data are protected by NDA agreements. Each data source is introduced by a detailed description of the added value and use of the data source in terms of the DATA SIM project. Before we do so, we first highlight the chosen study area in the project in the next section.

7
Project funded by the European Community under the Information and Communication Technologies Programme - Contract ICT-FP7-270833
2 Selection of main study area
While it is not always common to achieve and realize an application level in a FET-OPEN project, it is our ambition to construct at least one study area where, at the end of the project, the integrated set of techniques, algorithms etc. (especially the simulator in WP3 along with its application in WP6) will be demonstrated as a show case to demonstrate the scientific outcome and scientific relevance of the project. This activity is also consistent with our description of Task 1.1 in the DOW on p. 31.
Important to note in this respect is that this does not mean that there is only one application area in our papers. On the contrary, because of research about transferability which still need to be completed, or sometimes because of lack of one particular data source in one region, we first have chosen to scientifically finetune and develop the algorithms and methodologies. And in the beginning stages of the project, it is most easy to do this for different application areas. Also, the study area application should be seen as a showcase and dissemination case, the other regions where intermediary scientific solutions are tested and deployed certainly do not have a lower priority in the project.
The main study area selected is the Flanders region, which is located at the northern part of Belgium. This selection in the consortium was mainly made because of the largest availability of data in this region, the possibility to share these data among the different partners in the project (such that algorithms and techniques could be tested/benchmarked in this region), and the possibility to have data about the electric vehicles application scenario in this region
1. The region is approximately 13500
km². The study area will be segmented in “analysis zones” (see WP3 and annual report about a status update of this activity). During the course of the first year, we identified different levels of zonal layers for our main study area. Currently, we identified six levels of geographic detail of Flanders, i.e., Building block (BB) level, Subzone level, Zone level, Superzone level, Province level, and the whole Flanders level, all are illustrated below in Figure 1. Each zone corresponds to a different average area (km²) and the final simulation model (output of WP3) will be operational at all geographical layers. The lowest layer (BB level) has been geographically illustrated in Figure 2 for the Flanders area.
1 It is a continuous effort of the full consortium to look for interesting data sources and negotiate the
terms of use in the DATA SIM project. In case other data would become available for application in the project, the consortium may want to extend the chosen study area. Changes with respect to this will be indicated in the annual reports.

8
Project funded by the European Community under the Information and Communication Technologies Programme - Contract ICT-FP7-270833
Figure 1: The different zonal layers that are planned in the simulation model of WP3
Figure 2: A visualization of the BB level for the study area of Flanders

9
Project funded by the European Community under the Information and Communication Technologies Programme - Contract ICT-FP7-270833
3 Data that can be used for the representation of real movement of people: GPS traces and mobile phone data
3.1 GPS Traces
3.1.1 Positioning within the project
In this project, the automated construction of real movement of people will be done by means of traces which are collected through a Global Positioning System (GPS). GPS traces provide an extremely accurate description of movements, through sequences of very precise spatial locations that are collected at a high time rate, leading to an extremely detailed spatio-temporal representation of movement. GPS traces will be primarily used in this project within WP1 –where a moving object database will be constructed–, in WP2 –where theories of mobility demand will be derived–, in WP3 –where the data will be semantically enriched with the reason/behaviour of the movement–, and in WP4 –where GPS traces are used for validation purposes (e.g. through origin destination matrices). Secondary use of GPS traces is in WP5 –which deals with computational and scalability issues and in WP6 –which deals with the application scenario.
Using adequate Geographic Knowledge Discovery methods (see e.g. the Geopkdd project: http://www.geopkdd.eu), GPS traces can provide, detailed information of the traffic state on the network and can provide valuable input into transportation models. Therefore, the detailed use and application of GPS information in the project is as follows:
Automatically construct origin/destination (O/D) matrices. The O/D matrix is a popular tool of transportation engineering, describing users’ flows between any pairs of certain geographic areas designated as possible origins and destinations of users' trips. In most applications, periodic surveys are used to approximate O/D matrices (Cascetta, 2009). An overview of different travel survey data-collection methods can be found in Ortúzar and Willumsen (2001). Nevertheless, despite the economical and practical advantages of travel survey data, sampling estimates from travel surveys are rarely used for direct statistical inference. The reason is that travel surveys are subjected to considerable error-producing characteristics, such as inadequate sample sizes, non-representative samples, large non-response rates, under-reporting of trips and finally imprecise travel-time measurements (Stopher and Greaves, 2007). Furthermore, it has been widely accepted, within the scientific community, that sample-expansion is not an appropriate solution (Brög and Ampt, 1982), a fact which has been also verified empirically, recently, in Cools, Moons and Wets (2010) where it is shown that sample estimates are considerably biased even for large sampling rates. Hence, information from travel surveys is traditionally used either as a starting point or as a supplementary source of information for a specific transportation model. Travel demand models, such as the four-step model (Hensher and Button, 2000), take into account trip productions and trip attractions derived from travel surveys and deliver more reliable OD estimates through gravity or entropy- maximization models during the trip distribution step. Activity-based models, which form another trend in transportation modeling (Henson et al., 2009), also use information from travel surveys in the model training phase. Finally, methods which rely on observed link traffic counts, use OD matrices derived from travel surveys as ‘‘prior’’ information in order to impose constraints and cope with the under-specification problem between number of links and OD pairs. The last category of methods constitutes the main body of existing research in OD matrix estimation and the relative literature is extensive; classification of methods and discussion is provided by Timms (2001).

10
Project funded by the European Community under the Information and Communication Technologies Programme - Contract ICT-FP7-270833
Provide insights about how the flow between some given origin and/or destination is distributed along the paths over the road network; e.g. describing the itineraries towards a specific destination. This is a unique characteristic of the GPS data, for which little or no alternatives exist at this level of detail. One of the only other frequently used alternatives is model-based, and typically origin-destination matrices are “assigned” to the road network. Traffic assignment involves allocating the n-m inter-zonal OD flows on a corresponding transport network. A transport network consists of all the available links which define the possible routes from zone of origin o to zone of destination d for o,d=1,2,…,m. when o≠d. In vector notation the traffic assignment problem can be broadly described as follows; if we denote by l the total number of links, then traffic assignment seeks an operator A which will map the inter-zonal OD flows from the (n-m)-dimensional vector space of OD pairs to the l-dimensional vector space of links and
result to a vector of link flows or volumes 1 2( , ,..., )T
lv v vv , i.e. Ay v , by minimizing an
objective function of travel time with respect to link flows. The operator A is commonly non-linear. Put into practice, this is a complicated problem and several traffic assignment models have been developed over the years, each imposing specific assumptions on the objective function to be minimized; ranging from simple all-or-nothing deterministic/stochastic uncongested network models and deterministic/stochastic user-equilibrium and system-optimum models for congested networks to more advanced models such as variable demand, multiclass and dynamic process assignment. Information is available in numerous books, as for instance in Thomas (1991), Patriksson (1994) and Cascetta (2009). In general, traffic assignment models take as input the structure of a transportation network and a corresponding OD estimate. The output itself, depends on the complexity of the assignment model, nevertheless all assignment models produce a minimal output which includes traffic volumes and corresponding travel times or costs for each network link (Patriksson, 1994).
Analyse and discover in detail the systematic movement, i.e. movements that repeat periodically during the week (routine). Since GPS traces can be monitored continuously, it is possible to extract systematic movement patterns such as home-to-work/school and work/school-to-home. Also regular daily patterns such as bringing/getting children are part of this systematic daily movement which is possible to identify. A detailed procedure about how we extracted systematic mobility during year 1 of the project, can be found in DLV 2.1, under section “Individual Patterns”, subsection “Extraction of invididual mobility profile”. Unfortunately, this does not capture the full day travel patterns of an individual. It is for instance known from travel behavior studies in Flanders (Belgium) that not more than 30% of the daily travel is carried out for work/school purposes
2. However, if you can add daily regular systematic behavior such as bringing/getting
children (share is in range from 10%-11% in Flanders), and perhaps also weekly systematic behavior such as shopping (share is in range from 21%-22% in Flanders) or leisure activities (share is in range of 13-14% in Flanders), we should –in theory- be able to roughly capture about ¾ of the daily travel pattern using GPS traces. This also means that the remainder of information available in GPS traces has to do with unsystematic behavior: e.g. going to the doctor, to a specific non-recurring appointment, to a concert etc. Anyway, irrespective of whether we have to do with systematic or unsystematic behavior, we may want to “annotate” the traces, which means that a specific activity label has been assigned to those traces. Also this is an important activity in DATA SIM (see DOW), and –again- first results of algorithms which are developed for this purpose can be found in Deliverable 2.1, under section “Individual Patterns”, subsections “Extraction of individual activities” and “Extraction of individual points of interest”.
Explore the difference between vehicular and people movement GPS information. On the one hand, GPS traces can be collected using vehicular information. In this case, a hardware device
2 This is an average of the average number of trips per person per day, including all persons in the population: e.g. also
including persons that are unemployed, retired etc. Numbers used in this section come from the Research Travel Behaviour in Flanders (accessible at http://www.mobielvlaanderen.be/ovg/ovg04.php?a=19&nav=11 (only available in Dutch))

11
Project funded by the European Community under the Information and Communication Technologies Programme - Contract ICT-FP7-270833
can be installed into the car which monitors GPS information that can be transmitted through GPRS or through other forms of data communication. The logged data can this way be transmitted to a central data collection point. This transmission can be performed on a real time basis or in blocks, for example during the night when mobile communication activity and costs are low. The result is vehicular data, which means that if a car is left for 3 hours at a parking lot, it is more difficult to identify the behavioral information behind the raw GPS trace. Second, GPS traces can also be captured using person-based hardware devices such as mobile phones, PDA’s, tracing devices, etc. In this case, the device always stays with the owner and (in theory) one should be able to determine semantically/behavioural information. In the previous example, one may for instance be able to identify the 3-hours parking stay as a working and a shopping activity. The consortium is in possession of both kinds of data (see section 4 in this document) and we will be able to determine comparison results of both data sources.
Incorporate the behavioural sensitivity in the simulator. The final use of the GPS data in the project is WP3 in the DOW, where it has been explicitly stated that the goal is to integrate information derived from big data in the travel simulator. Amongst other things, this can be detailed information about the spatio-temporal choices in the simulator, the starting time of activities/events etc. These tasks will be executed in year 2 of the project according to schedule (see DOW p. 11-12).
For the application scenario about electric vehicles, we want to investigate whether the travel behaviour of people changes when driving an electric vehicle. To this end, a new data collection will be undertaken using a novel smartphone device (that collects GPS traces) that was specifically developed for this purpose. (see section 4.1.2, D)
In addition to the previous points, which reflect individual patterns because they explore relevant behaviours of each individual; GPS data can also be used for analysing collective patterns. Those collective patterns may provide us with more generic information that results from the contribution of several individual movements of people. Activities which have been conducted in the first year of DATA SIM have been reported in DLV 2.1 (see section “Collective Patterns”).
Finally, GPS data can also be used for extracting global models and complex systems, which define the general rules of mobility at a large scale and then try to bridge the link with individual and collective patterns. Activities which have been conducted in the first year of DATA SIM have been reported in DLV 2.1 (see section “Global Models and Complex Systems”).
3.1.2 Available data within the consortium
A) GPS Data Pisa and Milan
These data contain three GPS datasets where traces of a set of private cars have been collected in different geographical areas in Italy, in different time periods and with different space extensions. These data are a very valuable source of information to sense the mobility phenomena over a territory since they portrait the trips over several thousands of private cars. The data is collected by Octotelematics SpA, one of the companies participating at the Advisory Board of the project and subcontractor of CNR partner as data provider. Octotelematics SpA has developed a data collection service that it provides to insurance companies in order to enable them to offer special fares to their clients. For example, the tracing infrastructure allows the insurance company to avoid fraud accidents by analyzing the actual movement of the car at the moment of the crash. Moreover, insurance companies also offer special fares for low frequency travelers by providing a “pay-as-you-drive” fare. Although these data are collected for these specific tasks, they are very useful to analyze mobility since the devices are automatically set up to collect positions without the intervention of the driver. Each car served by the company is equipped with an electronic device containing a GPS receiver to

12
Project funded by the European Community under the Information and Communication Technologies Programme - Contract ICT-FP7-270833
measure the position on the geography, a gyroscope to measure relative acceleration of the vehicle and a GSM module to transmit the collected data to servers of the company. Since the transmission channel is limited and expensive, not all the collected measurements are sent to central servers. For example, data provided by the gyroscope is stored internally on a limited buffer on the device and is not sent: in the case of a crash this information is retrieved directly from the device via wired connection. The GPS receiver collects positions with a high sample rate; the sequence of points is simplified before being sent to the server according to a fixed procedure. The procedure is as follows. The device starts collecting points as long as the car is turned on. When the car is turned off, the last point is measured and then the device is automatically turned off as well. The first and the last points are always stored in the device buffer and they are marked with a special tag to indicate the two phases. All the points in the between are processed to remove redundant positions. The proprietary algorithms of the company ensures the following constraints: the simplified sequence maintains a point that is distant from the previous one around 2000m and 30 seconds. Thus, each vehicle provides a stream of points collected when the engine is on and each point in this sequence is associated with a label to identify the points where the engine is tuned on or off and a series of quality measure to assess the precision of the position in terms of number of satellites visible at each point. After the collection step, there may exist noise points that are filtered in a successive step (explained below).
The company performs the collection of data all over Italy plus some other countries in Europe. It is stated that the tracked vehicles represent approx. 2% of all the registered vehicles in Italy. Even if the percentage may seem low, this sample has been tested to assess the statistical validity against some ground-truth data sources. In Giannotti et al. (2011), for example, we show how the general statistics of the observed travels are compatible with the expected statistical distribution measured by means of survey-based data. In Pappalardo et al. (2012), we extend this comparison to assess the validity of general human mobility laws to the context of private car movements. In the same work, we formally provide a scaling procedure to relate the flow of GPS vehicles in a series of road section to the corresponding traffic counts in a coherent period (see also DLV 2.1).
Within the DATA SIM project there are three datasets provided by Octotelematics that cover different time periods and different spatial granularities. Here are some details about these datasets:
Milano2007 (KDD/gpsMilano.2007-04) contains approximately 17,000 cars tracked during one week (from April 1st through April 7th, 2007) of ordinary mobile activity in the urban area of the city of Milan (a 20 km × 20 km square)
Octopisa2010 (KDD/gpsPisa.2010-07) contains approximately 40,000 cars tracked during 5 weeks (from June 14th through July 18th, 2011) in coastal Tuscany, a 100km × 100 km square around the city of Pisa.
Octoscana2011 (KDD/gpsToscana.2011-05) contains approximately 159,000 cars tracked during one month (May 2011) in an area corresponding to central Italy, a 250km × 250km square.
The sequence of points for each vehicle has been filtered by removing noise points (i.e. points with coordinates outside the focus box, points with very high speed, etc.). The sequence of points for each vehicle has been split into several sub-trajectories, corresponding to different trips, by using different time thresholds. When the vehicle stops, no points are logged nor sent. We exploit these stops to split the global trajectory into several sub-trajectories that correspond to the travels performed by the vehicle. Clearly, the vehicle may have stops of different duration, corresponding to different activities: if the time gap between two consecutive points is larger than the threshold, the first observation is considered as the end of the previous trip and the second one is considered as the start of another one.
Depending on the value of the threshold for the reconstruction, we obtained up to 200,000 trips (KDD/gpsMilan.2007-04), 1,831,030 trips (KDD/gpsPisa.2010-07), and 9.8 million trips

13
Project funded by the European Community under the Information and Communication Technologies Programme - Contract ICT-FP7-270833
(KDD/gpsToscana.2011-05). As a first cleaning step the data has been checked against coherence constraints. For instance, a check has been carried to evaluate whether the coordinates are within the expected geographic envelope for each dataset. Secondly, a check has been done to evaluate if the calculated speed between two consecutive points of the same vehicle is realistic to remove erroneus positions. Finally, a check was done to see if each point is coherent with the road network. Each dataset has been compared with background knowledge of each territory to assess their statistical validity to represent real human movement. For instance the data (KDD/gpsMilan.2007-04) has been compared with the annual report of the mobility agency AmaMi by extracting several statistical distributions. The data (KDD/gpsPisa.2010-07) has been compared with other sources to evaluate the statistical significance. In particular, we computed the entering flows in Pisa using the GPS logs, and such flows have been compared with the flows measured with other two datasources: the vehicle count statistics provided by the local Mobility Agency (PisaMO S.p.A.), and an estimation of the flows using GSM handover data (see Pappalardo et al., 2012)
The datasets contain only information about the movement of each vehicle, since the demographic information about the owner of the vehicle has been omitted for privacy preservation. Each GPS point is represented by the tuple (user_id, lon, lat, timestamp, velocity, heading, status), where user_id is an anonymized identifier for each vehicle, lon and lat represent the spatial position of the point on the WGS84 ellipsoid, timestamp is the time instant when the point is stored by the GPS device, velocity is the speed measured by the GPS device, heading is the compass direction measured by the GPS device, and status contains three distinct values: 0, the vehicle is starting, 1 the vehicle is moving, 2 the vehicle has stopped.
The data is organized in a relational database powered by PostgreSQL (version 8.4) and by the spatial extension PostGIS (version 1.4). All the datasets are stored in separate databases, each one compliant with the schemas provided by the M-Atlas System (see also Giannotti et al., 2011).
B) Ag.ma GPS and CATI Data
The Arbeitsgemeinschaft Media-Analyse e.V. (Ag.ma) is a joint industry committee of German advertising vendors and customers. Starting in 2006, it commissioned a yearly nationwide mobility survey as basis for an objective performance evaluation of outdoor advertisements in Germany. The survey contains mobility information collected via GPS or CATI (Computer Assisted Telephone Interview) as well as detailed socio-demographic information of the test persons. The total number of participants for each year and wave is shown in the table below.
2007 2009 2010 2011 Total
GPS 8.595 3.175 0 2.993 14.763
CATI 21.125 9.885 10.096 10.091 51.197
Total 29.720 13.060 10.096 13.084 65.960
Table 1: Total number of participants for the Ag.ma GPS and CATI dataset
The GPS measurements are concentrated on 42 selected cities in Germany including the 15 largest cities in Germany, major cities above 100,000 inhabitants as well as a number of cities with inhabitants between 50,000 and 100,000 inhabitants (see Figure 3 left, Media-Micro-Census GmbH, 2012). The participants are selected according to a two-stage sampling process, the first one is a random selection of sample-points, the second process involves quota-sampling of persons within the selected

14
Project funded by the European Community under the Information and Communication Technologies Programme - Contract ICT-FP7-270833
sample-points. The CATI measurements are a proportional sample for the whole of Germany where the participants have been chosen according to a three-stage systematic random sampling process (see Figure 3, right). Both data sets have been jointly weighted to form a representative sample of the German population. The population hereby refers to the German speaking population of all private households (at principal domicile) with an age of 14 years and more.
Figure 3 left: Municipalities with GPS measurements (source: Arbeitsgemeinschaft Media-Analyse e.V. and Media-Micro-Census GmbH, ma 2012 Plakat Methoden-Steckbrief zur Berichterstattung);
right: municipalities with CATI measurements
The GPS data has been collected in three waves in the years 2007, 2009 and 2011. The duration of GPS recording is one week per person, however, the measurement periods are distributed over one year such that a representative mobility sample for the whole year is obtained. The participants of the survey are equipped with GPS devices (see Figure 4), which respondents carried along during the measurement period. The GPS devices record positions every second as long as the devices are turned on. Measurement gaps may arise if participants forget to charge the devices or if they turn them off deliberately. In addition, faulty measurements may arise if participants forget to carry the GPS device along with them. In order to distinguish between days without mobility of the participant and between days with erroneous measurements, a follow-up survey is conducted where the participants can specify the validity of measurement days with low movement or few position records.
In addition to this extensive set of data, participants are questioned during a telephone interview about their movements on the previous day (or their last day with movement if they stayed at home that day). The resulting data set comprises a sequence of traversed street segments together with an annotation of the trip id, means of annotation and trip purpose. Since this integrated data set contains GPS traces together with a behavioural component, the data has been described in more detail in section 4, (part C).
Figure 4: GPS
device used in the study

15
Project funded by the European Community under the Information and Communication Technologies Programme - Contract ICT-FP7-270833
C) GPS traces IMOB
The project coordinator IMOB is in possession of computer-assisted instrument and handheld palm device, equipped with a GPS receiver. The device also collected travel behaviour survey data. Since the dataset contains more information than only GPS traces, and also this kind of information can be used to integrate GPS traces with a behavioural (survey) component, the data has been described in more detail in section 4. Other similar data (GPS information enrichted with behavioural information) are available at IMOB through the VEDETT and the SPARROW applications, both described in section 4, part B and part D.
D) Publicly available datasets
In addition to the data that are in possession of the consortium, we did an extensive search on publicly available data. By definition, these data are collected in completely different study areas and could only be used in the DATA SIM project to test the transferability of developed algorithms.
One useful publicly available dataset contains GPS traces. This dataset was collected in (Microsoft Research Asia) Geolife project by 182 users in a period of over three years (from April 2007 to August 2012). A GPS trajectory of this dataset is represented by a sequence of time-stamped points, each of which contains the information of latitude, longitude and altitude. This dataset contains 17,621 trajectories with a total distance of about 1.2 million kilometers and a total duration of 48,000+ hours. These trajectories were recorded by different GPS loggers and GPS-phones, and have a variety of sampling rates. 91 percent of the trajectories are logged in a dense representation, e.g. every 1~5 seconds or every 5~10 meters per point. This dataset recoded a broad range of users’ outdoor movements, including not only life routines like go home and go to work but also some entertainments and sports activities, such as shopping, sightseeing, dining, hiking, and cycling.
Another dataset temporarily became publicly available during the course of the project. The data were released by Nokia in the context of the “Mobile Data Challenge” (Nokia Mobile Data Challenge, 2012). Between 2009 and 2011 the Nokia Research Center Lausanne NRC-Lausanne conducted a long-term data collection campaign in Lausanne using mobile phones (Lausanne Data Collection Campaign, 2011). During this campaign social and geographic data from smartphones (Nokia N95) of about 200 participants living around Lake Geneva was collected. Anonymized subsets of the data became available.
The MDC data contains information about the following aspects: acceleration, running applications, detected Bluetooth devices, calendar, call logs, contacts, GPS position, GSM cell, media files, played media, running processes, system information of the phone, detected WLAN devices, geo-position of WLAN access points as well as sociodemographic information of the users. Current results of the data have been reported as an activity in WP2 (see DLV 2.1 section “Individual Patterns”, subsection “Extraction of individual activities”, in the work “Exploring Underlying activities at phone calling locations”). The consortium is currently negotiating about the possibility to be able to keep on using the data set in the DATA SIM project.
16
Project funded by the European Community under the Information and Communication Technologies Programme - Contract ICT-FP7-270833
3.2 Mobile Phone Data
3.2.1 Positioning within the project
Another datasource that can be used for the representation of real movement of people are mobile phone data. One type of data are Call Detail Records (CDR), essentially describing the movement of active devices, which means that during calls or other traffic exchange activities (e.g. SMS), location area switches (of the mobile phone) can be systematically tracked. Accordingly, these data provide information about continuous sequences of large areas, which means that the spatial uncertainty of a specific location is quite high. Indeed, because of this characteristic, the continuity of the traces will be lost to a large extent. This also implies that this kind of data is particularly suitable for long-range movements, e.g. highway traffic.
Another mobile phone source are handover (HO) hourly aggregates which are sometimes available, describing the number of cell switches occurred between adjacent cells over predefined periods (one hour being the most common). Using mobile phone data, mobility data can be reconstructed in a reliable and objective manner, more specifically, the data are particularly useful for describing the general statistical laws governing some relevant quantities about human motion.
Mobile phone data will be primarily used in this project within WP2 –where theories of mobility demand will be derived from mobile phone data and where the domain of network science is coupled with datamining–, and in WP3 –where the data will be semantically enriched with the reason/behaviour of the movement–, and in WP4 –where origin destination matrices will be reconstructed.
The advantages of using mobile phone data in the project are multiple and complementary to GPS traces. In summary, mobile phone data can be used in the DATA SIM project for:
Automatically constructing origin/destination (O/D) matrices. Unlike GPS data, in a GSM network, locations are represented with coordinates of base stations, each of which has a wide coverage ranging from a highly dense network (e.g. few hundred square meters in metropolitan areas) to a more spare network (e.g. few thousand meters in rural areas), making it a challenge to pinpoint a calling location to a single specific geographic object. This means that the geographical resolution is less detailed, while on the other hand, data are usually easy to collect on significantly large samples. The latter is a clear disadvantage of GPS data, where the effort to compose a sample of respondents is more difficult. The details are not repeated here, but WP4 in the DoW describes the challenges for using HO mobile phone data for the estimation of origin-destination matrices in the context of evaluating and validating agent-based simulation models.
Deriving statistical laws of human mobility. Uncovering the statistical patterns that characterize the trajectories humans follow during their daily activity is an important focus of research in DATA SIM. The general aim is to come to statistical laws that govern the key dimensions of human travels, such as distance travelled, time spent at different positions, number of visited locations, and so on. The availability of mobile-phone records enables us to further build upon the pioneering work of Gonzáles et al.2008, especially to develop extensions to better capture aspects of human mobility and to benchmark results with the travel behavior research field. First activities regarding this use of data have been described in DLV2.1, see section “Global Models and Complex Systems”.
Collecting social network information. For inventorizing social relationships and links we intend to build upon country-wide mobile communication datasets that can simultaneously capture the location and the communication patterns of the mobile phone users. We plan to rebuild from these datasets the detailed social network of the user base (who calls whom); other source of social relations and links. Besides the mobility laws and patterns, we plan to analyze the topological and the dynamical properties of the underlying social network, and in particular to explore the formation of communities in the social network, to the purpose of better characterizing the mobility behaviours of subpopulations

17
Project funded by the European Community under the Information and Communication Technologies Programme - Contract ICT-FP7-270833
on the basis of their social relations. Moreover, social networks are highly dynamic and episodic in nature: for example, if we were to look at the proximity patterns of individuals over time, there would be meaningful changes from minute to minute. Understanding dynamics of these networks is of fundamental importance to our project. The analytical of network science using mobile phone data, therefore, bring into our project another semantic dimension, which may play a key role in better understanding the mobility behaviour at society-wide scale. First activities regarding this use of data have been described in DLV2.1, see section “Global Models and Complex Systems”, subsection “Human Mobility and Social Ties”.
Estimating population profiles. While large sample of GPS traces and also mobille phone data, can be used for analysing systematic movement, i.e. movements that repeat periodically during the week, mobile phone data are also very well suited to estimate population profiles and population distributions. First activities regarding this use of data have been described in DLV2.1, see section “Collective patterns”, subsection “Characteristic behaviors”.
Hourly travel patterns. CDR data can also be used to calculate the average number of trips occurring every hour among the municipalities. Phone data can be analysed during a long period of time (e.g. 6 months), recording the locations of users between two moments in a day (e.g. 7am to 10pm). A trip from municipality i to municipality j can be defined if the same user in municipality i at time t and in municipality j at time t+1 can be recorded, where t is a daytime one-hour time interval (i.e. t = 7, 8, …, 21, 22). Through aggregation of all all trips from hour t to hour t+1, the hourly commuting flows among municipalities can be generated. An initial exercise has been conducted in the project by BME partner in WP2 for exploration purposes, leading to and obtaining 15 OD matrices.
3.2.2 Available data within the consortium
A) Mobile Phone Data Pisa and Milan
These datasets contain both CDR data and Handover data and they are collected by the Italian Telecomunication Company Wind. The two datasets cover a period of about one week. One dataset contains 1,166,770 calls, the second contains 828,008 calls. The CDR data contain details about each call performed by each user and they are stored to process the periodic bill for the client. For each client the company stores the time the call started, the duration of the call, the cell where the call started and the cell where the call ended. Each call is associated with an anonymized indentifier of the client, thus it is possible to link the calls performed by the same user. This kind of data portraits the movement and the behavior of users but only during active communication, while the device is transparent during idle time.
Our handover data contain aggregated flow information between adjacent cells at regular time intervals comprising all the devices, either in active communication or in idle state. This information is used by the company to balance the load over the network by identifying overloaded cells. Even though this kind of data cover all the population of mobile devices, it is able to provide an aggregated value of flow and it is not suitable to follow the movement of a device through consecutive cells.
The spatial component of each call is determined by a join with an estimated coverage of the territory. The territory is partitioned in polygons where a given polygon p is associated with a cell c, meaning that the polygon p is served by the cell c with the highest probability. A call starting (ending) in c can be then localized with a uniform probability on the area covered by polygon p. The spatial precision of this kind of positioning depends on the spatial granularity of the cell network. The area covered by each cell in the network may vary on the basis of the location of the antennas. In rural areas, for example, a single cell is able to cover very large surfaces while in urban areas each cell cover an area of around 100 m². The spatial resolution of the location may be improved by exploiting specific methods to provide triangulation of positions. However this approach requires specific hardware on the

18
Project funded by the European Community under the Information and Communication Technologies Programme - Contract ICT-FP7-270833
cell network. To link each call to the corresponding position on the geography the company has provided also a spatial coverage of polygons associated to each cell computed by estimating the electromagnetic field on the territory. CNR has also computed an alternative spatial coverage based on a spatial tessellation by Voronoi partition centered on the location of each antenna.
The datasets provided by the company cover different geographical regions and different time periods. The geographic regions covered comprise the city of Milan and the city of Pisa and its province.
B) Mobile Phone Handover Data
This dataset contains anonymized billing records from a European mobile phone service provider. The records cover over 10M subscribers within a single country over 4 years of activity (2007-2011). Each billing record (CDR), for voice and text services, contains the unique anonymous identifiers of the caller placing the call and the callee receiving the call; an identifier for the cellular antenna (tower) that handled the call; and the date and time when the call was placed. Coupled with a dataset describing the locations (latitude and longitude) of cellular towers, we have the approximate location of the caller when placing the call. For a significant fraction of the company’s users, self-reported age, gender, and billing postal code is available.
C) Mobile Phone Data Vodafone
Vodafone (VF) is one of the largest mobile communications companies in Germany. It owns and operates a nationwide mobile phone network and offers a wide range of telecommunication services to its customers.
The network itself consists of various network cells for different frequency ranges. In total there exist thousands of networks cells in Germany, which cover most of the populated areas. Each time a mobile device establishes a network connection, e.g. to make a phone call, a connection is made to one of those network cells. Each cell has its own maximum capacity of accepted connections. Therefore the performance of the network has to be measured. This is done by a network performance parameter called ‘Erlang’, which is a unit to measure traffic load. The higher the parameter rises, the more network traffic is registered for one cell. Error! Reference source not found.5 shows weekly aggregated Erlang values for the city center of Munic between May 2010 and June 2011. The periods of vacation and holiday are clearly visible in the time series.
Figure 5: Call volumes (Erlang) in city center of Munich from May 2010 till June 2011
The dataset, used in the project, consists of the Erlang values for all Vodafone networks cells in Germany. They cover the frequency ranges 900 Mhz and 1.800 Mhz. The data is available since April 2010 and has an temporal resolution of one hour. Each line in the database represents the Erlang-value for one hour and one cell. To be able to relate this data with the street network, also the polygon of each cell is part of this dataset.

19
Project funded by the European Community under the Information and Communication Technologies Programme - Contract ICT-FP7-270833
4 Data that can be used for extracting the behavior behind movements and motion: travel surveys (and GPS traces)
4.1.1 Positioning within the project
While the datasets discussed under section 3, are an extremely valuable source of information for getting insight in mobility patterns, for determining highly returning locations, for extracting O/D matrices, for collecting social network information, for estimating population distributions etc., these data do not provide further insights into what motivates people to perform this observed phenomena. However, the goal in this project is not simply to understand how people behave in large groups, but to understand what motivates individuals to behave the way they do. This is exactly the contribution that travel survey data will play in this project. The data will be used to enrich mass data under section 1 with behavioral knowledge. Travel survey data will be primarily used in this project within WP1 –to construct Hermes
sem, a semantically enriched moving object datawarehouse–, in WP2 –where
semantically enriched theories of mobility demand and mobility behavior will be derived– and in WP3 –where a simulation model will be developed based on the work in WP2. The main problem with travel survey data is that it is not only highly expensive but also highly time-consuming to collect, and the resulting dataset is also often limited in size. Therefore, the combination of GPS data with travel survey data will add value to the scientific literature covering the following dimensions:
*with respect to the semantic annotation of travelling/motion. The basic objective of the semantic enrichment process is to introduce a domain-dependent characterization of movement data and patterns. An example is the semantic trajectory definition (see Spaccapietra et al., 2008), where the trajectory is semantically partitioned in episodes such as stops (part of trajectories where the object stays still) and moves (the change of the position). The approach in (Alvares et al., 2007) introduces data mining methods for semantic trajectories, thus discovering patterns based on the places where trajectories stop or move, instead of the raw geometric features. There is a rich literature, originated in the artificial intelligence field, on developing methods that goes one step further in the semantic enrichment trying to automatically infer people behaviour. Some of these methods analyse the traces to infer the transportation mode - see for example (Patterson et al., 2003, Liao et al., 2007, Zheng et al., 2010), whereas others approaches infer the activity performed by the travelling users - see for example (Andrienko and Andrienko, 2007; Kiefer and Stein, 2008; Liao et al., 2005a; Liao et al., 2005b; Spinsanti et al., 2010). An ontology-based approach for the semantic interpretation of (semantic) trajectory patterns as movement behaviour has been proposed in (Baglioni et al. 2009a, 2009b) and was further extended in the GeoPKDD project. The main idea is to exploit the knowledge representation and reasoning capabilities of formal ontologies to automatically classify trajectories and patterns into the appropriate behaviour definition, depending on the spatio-temporal characteristics of the movement (e.g. a given trajectory may be classified as tourist, or home-work movement depending on the characteristics of the movement itself and the geographical context). An orthogonal approach for the semantic enrichment of mobility goes towards the combination of mining and contextual semantics (e.g. Survey questionnaires), thus enriching the knowledge discovery process with further annotations steps with the objective un explaining the trajectory patterns (Ong et al., 2010). The explicit involvement of semantic and context aspects in the mining process is the main topic of a series of workshops (Semantic Aspects in Data Mining - SADM), organized by partners of this consoritum during the last three years in conjunction with IEEE International Conference of Data Mining.
While all these techniques and initiatives add significant value to the domain, real-world travel surveys are often not used and integrated in this semantic annotation process. The integration with surveys may prove to be of added value because activity and related travel decisions that are made in daily life, may be largely shaped by spatial and temporal regularities that are typically well described in surveys. For instance, it is known from literature that individuals in society may be bound by a number of fixed scripts, originated from long-term commitments and various work- and family- related

20
Project funded by the European Community under the Information and Communication Technologies Programme - Contract ICT-FP7-270833
constraints, framing the following routine, automated travel decision making process. Obligatory activities such as ‘work’ and ‘bring/get’ people are assumed to be planned first, non-obligatory activities, e.g. ‘social visit’ and ‘leisure’, are then considered within emerging time and space constraints and according to a predefined priority order (Arentze et Timmermans, 2004). However, evidence has shown that people do not generally plan the activities consciously on a day to day basis; rather, they rely on fixed routines or scripts executed during the day without much consideration (Hannes et al., 2008; Spissu et al., 2009). This set of fixed anchor points thus predefines individual activity-travel behavior to a large extent, and bound further scheduling flexibility.
In other words: the current research about semantic annotation is often done based on single vehicle trajectories, consisting of stops and moves, while individuals may explicitly reason in terms of their own contextual and/or household situation and their social relations. This makes the annotation process much more challenging, since behavioural reflection of the indivudal traveller is incorporated in some way in the process.
Finally, the most important use of this kind of data is for evaluation purposes of the semantic annotation. Indeed, we do possess of survey and GPS data from the same set of individuals (see next section), which makes it possible to test the accuracy of the developed algorithms in the project, using for instance the survey data as an independent test set. A review of literature learned us that this value is significant, since most developed algorithms are not validated using a separate test set containing the real executed activities. Research efforts are ongoing in the project along this line (see DLV 2.1, section “Individual patterns”; subsection “Extraction of individual activities”).
*with respect to the need for (GIS) geographical information system- information to semantically annotate travel. So far, several models have been developed to integrate GPS-based (Global Positioning Systems) trajectories with geographical information to infer the motivation of the movement (Alvares et al., 2007; Du and Aultmanhall, 2007). These methods relate the GPS information with geographic maps by overlapping them in space, in order to find interesting places specified by users, such as hotel and touristic sites, which are relevant for the semantic annotation of trajectories. However, linking a trajectory to detailed geographic information on all communities, offices, shopping and leisure area in a studied region not only needs a lot of computational effort, it hampers transferability of a particular approach among study areas. Also, this process is relatively easy in theory but extremely difficult in practice (Zheng et al., 2010).
Therefore, using survey data and GPS data from the same set of respondents, one is now able to develop techniques which are only space and time dependent. Little research has been done in this respect. While it can be expected that the annotation process and accuracy is much lower compared to GIS-supported annotation (because more information is added in the latter case), the methodology is transferable and GIS information is not absolutely necessary. Initial research results of this exploration have been described in DLV2.1, section “Individual patterns”; subsection “Extraction of individual activities”, in the work “Semantic Annotation of GPS traces: Activity Type Inference”.
*with respect to the calibration of the developed model in the selected study area
In order to develop and calibrate an operational transportation simulation model (the core activity of WP3), travel survey data are indispensable. Indeed, while GPS and mobile phone data can only contain detailed spatio-temporal information, survey data need to supplement us with the reason and motivation behind travel.
The major insight that enabled researchers to gain a better understanding of the individual decision-making process is the idea that travel demand is derived from the activities that individuals and households need or wish to perform. Travel is thus merely seen as a means to pursue goals in life but not as a goal in itself. Therefore, modelling efforts should merely concentrate on modelling activities or on a collection of activities that form an entire agenda which triggers travel participation. In other words: if one is interested into behavioural simulation modeling, one should not only focus on the

21
Project funded by the European Community under the Information and Communication Technologies Programme - Contract ICT-FP7-270833
output of a phenomenon (like GPS and mobile phone data “do”), but also on the reason behind the phenomenon (like travel survey data “do”). Therefore we intend to develop a simulation model in WP3 which aims at predicting which activities are conducted where, when, for how long, with whom, and the transport mode involved. Travel surveys along with GPS information will be used to feed into this model.
4.1.2 Available data within the consortium
A) Travel behavior studies: the combination of activity-diary and GPS data
The different facets in a travel survey diary
Travel survey data do not only provide the opportunity to semantically annotate GPS traces in the form of activities and the motivation behind travel, but also data is collected about other facets such as where, when, for how long, with whom, and the involved (chain of) transport modes. Because the interdependencies between these facets are critical, one also needs detailed data about these facets for all activity episodes. That is, for each new activity, the data should reveal where it is conducted, when, for how long, etc. Although this seems evident, the collection of such data requires many operational decisions and also the survey design itself is not a straightforward task. In general, we can make a distinction between trip-based and activity-based surveys. Both types of data are available for us within the DATA SIM consortium. In the case of a trip diary, the leading question relates to the trips made, and all other information is derived from or linked to trips. In contrast, the leading question of an activity-based diary is associated with the activities the respondent says to been engaged in (and trips are some kind of ‘activity’ as well). Activity diaries normally provide more detailed information, and may also provide reliable data as they imply a more natural way of storing information. The remainder of this section describes the activity-diary that is available within the DATA SIM project in terms of the facets described above.
In the activity-diary, we have chosen to incorporate 14 activity classes (motivation behind travel): In-home activities, sleeping, services, working, eating, daily shopping, non-daily shopping, education, social activities, leisure, bring or get persons or goods, waiting, touring and other activities. Another facet concerns the spatial dimension or location of activities.
The third facet concerns the timing dimension. This means that data on start and end times, and hence duration of activities and related travel should be collected. An important consideration in this regard is that a longer time interval (for instance “before noon”) will likely result in an under-reporting of short trips, and activities of short duration. We therefore decided to avoid this problem by asking respondents to report the exact start and end times of their activities. This operational definition also has implications for the measurement of spatial-temporal constraints, important in DATA SIM. The more exact start and end times are measured, the better one can measure such constraints.
The next facet concerns the “with whom” dimension. We decided to use a rather broad categorization of travel party: other members, children and partner information. We also explicitly asked for the number of people that are participating in the travel because this has implications for vehicle occupancy rates and traffic volume.
The final facet, that of transport mode, requires data with respect to the transport mode that is used to conduct the various activities. The usual categorization into car (driver versus passenger), various means of public transport, bicycle, and walking would typically suffice. In the context of modelling multi-modal transportation modes, we have equally collected data about travel chains (journeys). To this end, users have the possibility to enter four different trips and their corresponding transport mode

22
Project funded by the European Community under the Information and Communication Technologies Programme - Contract ICT-FP7-270833
in one journey in our data collection. We equally asked respondents to report waiting times, for instance in a context of using public transport.
The above facets concern the principal choice dimensions underlying activity-based models. Obviously, personal and household characteristics also need to be collected for segmentation and clustering purposes. The further details of the data will be discussed later in this section.
The trip- and activity-based diaries (paper-and-pencil studies)
The most traditional way for collecting activity-travel data is by means of a paper-and-pencil data collection survey. This kind of data does not contain detailed GPS traces but individual activity and travel behaviour (diary data), is available. In the household questionnaire, respondents provide information on the composition, the number of cars, the number of people with a driver’s license and the income. In the personal questionnaire, similar information is acquired on modes of transportation, living and work situation, and certain activities as well as detailed socio-demographic information. In the diary, the respondent fills out his personal activity-travel diary which includes all performed activities and journeys during one week.
For DATA SIM, three major sources of travel surveys (collected by paper-and-pencil) can be used:
The first data source is an activity-based diary that has been collected in the context of a project for the Flemish region (Strategic Basic Research: ‘An activity-based approach for modeling and surveying travel behaviour’, 2004-2009, funded by Flemish Institute for Science and innovation) included about 2000 persons that were questioned about their activity and travel behaviour by paper-and-pencil during a one week period. Participants have been selected from census data and constitute a representative sample selection of the population of Flanders with respect to geographical spread, socio-demographic characteristics and household composition. In addition to the activity diary (which covers all the dimensions discussed above), for each household, one person is asked to complete a household questionnaire that gathers data about the household composition, the household mobility (number of available vehicles, etc.). Every individual respondent also has to fill out an individual questionnaire, designed to collect personal socio-demographic data, such as gender, age and income. Moreover, transportation data (e.g. frequently used transport modes, home-work transport mode), activity information (e.g. average frequency of activity types) has been collected in the individual questionnaire.
The second data source is the Flemish travel behavior study (OVG: “Onderzoek VerplaatsingsGedrag”) that is recently collected every year from 2008 onwards (and will be collected to 2014). The dataset is similar to the previous dataset, containing also a household questionnaire, personal questionnaire and diary, but the latter is a trip-based diary and not an activity diary. While the information that can be derived from the previous data is somewhat more extensive and better suited for even more detailed analyses (like for instance planning, and replanning of activities), the vast majority of the information that can be retrieved from OVG data is similar to the previous data. Furthermore, the size of the data is more elaborated: during the period 2008-2009 8800 persons were questioned, while in the period 2009-2014 also 1600 persons will be questioned every year, yielding also a total number of 8000 persons of diaries over these 5 years and an overall total of 16800 persons. The datasource can be used for annotation purposes and for model calibration in WP3.
The final datasource is the Belgian Daily Mobility datasource (Beldam) that is also a recent trip-based dataset collected in 2010 for full Belgium (not only the Flemish area). The characteristics are similar compared to the other datasources but in addition
23
Project funded by the European Community under the Information and Communication Technologies Programme - Contract ICT-FP7-270833
household information is present and this survey is completely household-based. In total, information is available for about 8500 households.
Travel survey data with GPS
Travel survey data and GPS data that are available from the same sample of respondents is quite a unique characteristic in the research field. It is particularly useful source of information for annotation purposes of GPS traces. Furthermore, it also clearly facilitates the collection of travel and route-information and widens the application area of the data in addition to the traditional travel behaviour model development (Wolf, 2004).
The consortium is in the possession of computer-assisted instruments and handheld palm devices, equipped with a GPS receiver to collect travel behaviour data. The purpose of conducting an activity diary survey by means of GPS technology is to gather activity information about destinations, assuming that the location and the time of the destinations are known because of the GPS functionality. When compared to other methods of travel behaviour data collection, GPS is mainly advantageous because respondent burden is reduced with respect to filling out (often difficult to remember) detailed location information. The advantages of using a PDA with GPS to conduct travel survey data collection are numerous. To mention only some: 1) as the PDA integrates a GPS module, the respondent has to take care of only one device, 2) the PDA/GPS solution offers the opportunity to organise the activity-based survey on PDA, 3) in the case of a separate GPS logger, a way would have to be found to transfer the GPS data in the GPS logger to the medium on which the survey takes place. On the other hand, in case of a GPS module implemented in the PDA, the GPS data is directly available in the device memory. A software which is implemented on a PDA-system also has the advantage of supervising the respondents during their activity and trip completions by carrying out consistency checks when filling out data. For this purpose, a travel survey had to be developed (see also next section). Approximately 60 of these PDA devices were acquired and for 800 individuals we collected both GPS and survey information.
The travel survey implemented: the Parrots tool
The data collection application has been labelled as PARROTS (Programme for Activity Registration and Recording Of Travel Scheduling) and has been implemented on the PDA devices (see Bellemans et al., 2008). The devices were distributed to respondents following a rigid distribution and logistic process. Households first received an introduction letter in which the purpose of this research is explained. This letter also includes more information with respect to the PDA-technology and their assignment during this research. Three days after sending the introduction letter, the telephonist tried to reach the household during three calling attempts. When the household has been contacted, the household was asked whether one wants to take part in the research. If so, an appointment for the delivery of the PDA, the household questionnaire and the socio-economic questionnaire is fixed at the respondents’ home location. During this moment, the household receives the PDA and the questionnaires. Further explanation is also provided to the participants during the contact moment. Similar to the procedure concerning the paper-and-pencil diary information, each household will also be called on the second day of the survey to ensure that everything goes smoothly, and to motivate the respondents. At this point, a new appointment is fixed to collect the PDA, preferably the day after the last day of the survey. After this appointment, the data on the PDA will be processed and the PDA is processed for use by another household. The full logistic process has been supported by a computer-assisted logistic application.
For developing PARROTS an object-oriented approach was chosen. The PARROTS system, conceptually consists of two Graphical User Interfaces (GUI) (Household Survey and Activity Based Survey), a GPS logger, a data structure (Activity Diary & Household Data and GPS Data), a data quality control module (Data Integrity Checks), a Trip Identification module, a GIS module and a Communication module. The modular structure of the application allowed for customization. The GPS logger is used to trace the physical travel paths and the travel times. If the GPS logger is active, it

24
Project funded by the European Community under the Information and Communication Technologies Programme - Contract ICT-FP7-270833
receives the GPS data from the GPS chip and stores it using the GPS Data module. The GPS logger collects data continuously and therefore it needs to operate in the background. This automatic feature has two advantages. In the first place, it facilitates data capturing and secondly, although the survey respondent may forget to register a new journey, the GPS logger captures the user’s position during the travel period. This way, the system can prevent the loss of activity-travel data. The GPS data, stored in the GPS Data module, can also be used for trip identification. Once the performed trip is identified, it can be used to verify whether the information about activities, reported by the respondent, is consistent with the actually recorded trip. The Household Survey GUI inquires for personal demographic and activity/travel-related information. These data are collected at the beginning of the survey period and are stored in the Activity Diary & Household Data module. In order to reduce respondent burden, these data are collected by means of paper and pencil. During the survey period, the respondent interacts frequently with the Activity Based Survey GUI (see Figure 6), which is the major interface of the application. This GUI is used to register the activity-travel diary data during the survey period. It is used to enter, to modify or to delete an activity or a trip but it is also triggered if the Data Integrity Checks module detects an inconsistency (e.g. a city name that does not exist) and the Activity Diary Data needs to be altered. The information stored on the hand-held devices can be downloaded through the Communication module. Especially for the spatial dimension or the “where”-facet, the computer-assisted data collection tools can make a significant contribution by integrating a geographical information system (GIS) module, which enables the user to either pinpoint a location on a map or to manually enter a location. In the current application the latter option was chosen. Computer-assisted data collection tools allow for data quality control. Indeed, a computer system can check for anomalies and prompt the respondent for additional information. Errors that report activities where the start hour of an activity is later than the end hour, activity locations that do not exist and many others are detected by the Data Integrity Checks module of the PDA application. More information can be found in Kochan et al. (2010). The detailed description of all variables in the data is extensive and is available upon request.
3
3 Email to [email protected]
Figure 6:The PARROTS application, showing from left to right, the beginscreen, the activity diary, the attributes of the activity part 1 (the type of activity, the date, the location) and the attributes of
the activity part 2 (start time, end time, number of persons, with whom)

25
Project funded by the European Community under the Information and Communication Technologies Programme - Contract ICT-FP7-270833
B) The VEDETT Data
Another rich and extensive datasource that is available from Belgium is a longitudinal datacollection that has been collected using an on-board vehicle logging device. The data is not only rich because respondents are followed during a long period in time (approximately 1 year), but the data is also semantically enriched. The procedure is as follows.
The long term survey has been carried out by means of a VEDETT-device, which has been specifically developed for this purpose (see Figure 7). VEDETT stands for a Vehicle Embedded Data acquisition Enabling Tracking & Tracing device. It consists of a basic structure, which can be equipped with several other functionalities. The main functionality of the apparatus is data logging, mostly vehicle parameters but also location data. The built in memory used to store the data, can vary in capacity depending on the requirements. The VEDETT is installed parallel to the Controller Area Network (CAN) of the vehicle. This configuration allows to monitor and log virtually every electrical signal that passes through the CANBUS. These include parameters as travelled distance and vehicle speed, but also other specific technical parameters such as fuel consumption, chosen gear, engine revolutions per minute, engine temperature and others. This offers, among others, the possibility to determine the driving behaviour of the driver (Beusen et al., 2009). For the purpose of this study, the VEDETT tool is also equipped with a GPS-based element. The VEDETT is equipped with GSM based communication technology (GPRS). The logged data can this way be transmitted to a central data collection point. This transmission can be performed on a real time basis or in blocks, for example during the night when mobile communication activity and costs are low. The integrated GSM technology also offers the opportunity to update the software of the VEDETT from a distance e.g. to change the log frequency without the need to take the vehicle out of circulation.
After the registration of the trips by means of the VEDETT-tool, the set of data is transmitted to a central data collection point. For every trip a new set of data is then being generated by processing the logged data: (i) total distance is calculated from the mileage logged at the arrival and departure point of the trip; (ii) average vehicle speed is calculated from the logged speed data and (iii) the co-ordinates of the departure and arrival point of the trip are translated into addresses. The translation of the GPS co-ordinates into addresses is done by reverse geocoding. The accuracy of these addresses depends on the precision of the GPS readings.
The information with respect to the trips are duration of the trip, distance of the trip, average speed of the trip, address of the departure point and address of the arrival point. A website has been developed (see Figure 8) for the participants in order to communicate with the VEDETT device. On the

26
Project funded by the European Community under the Information and Communication Technologies Programme - Contract ICT-FP7-270833
website, the motivations or reasons behind all the trips made by car, can be indicated (semantic annotation). This information is added manually by the driver in post-processing. To minimize the burden for the participators in the long term field trial, the website has some additional functionalities.
Points of Interest (POI’s): Addresses which are frequently visited, can be designated as POI’s. A specific location can be assigned to the addresses: e.g. ‘home’, ‘work’, ‘grandparents’, etc. Every time this specific address is visited, the information on the trip will no longer display the address, but ‘home’, ‘work’, ‘grandparents’ etc.
Figure 8: Website: calender and trip information
Figure 7: VEDETT: Left: Graphical illustration of the data storage and transmission process.
Right: Hardware tool to collect and transmit vehicle data and GPS data

27
Project funded by the European Community under the Information and Communication Technologies Programme - Contract ICT-FP7-270833
The POI’s are designated to every set of GPS co-ordinates which lie within a circle around the co-ordinates to which the POI was originally designated.
Self learning capability: It is possible and even likely that some trips from two POI’s are frequently made, and that the motivation and number of passengers are always the same. If this kind of trip is made, after a while the system will fill in the motivation and number of passengers by itself. Only a simple confirmation from the driver will be asked for.
Mapping of the trips: It is possible to visualize (on a map) the location of the departure and arrival point of every trip and the trajectory used to go from the departure to the arrival point.
Besides specific sections for each participant, some general sections were set up to provide non-participants or future participants some background information with respect to the project, a detailed manual on how participants have to use the website (add trip information, set up points of interest, …) and an example dataset which was gathered with a first test vehicle.
C) Ag.ma and CATI Data
The third dataset which consist of both behavioural and GPS information is the Ag.ma GPS and CATI dataset, which was already introduced in section 3.1.2, B. The data has been collected in four waves in the years 2007, 2009, 2010 and 2011. Within a telephone interview participants are questioned about their movements on the previous day (or their last day with movement if they stayed at home that day). The interviewer has a special software where he enters the start and end point of each trip as well as the means of transportation for the subsections of the trip. The software then provides a routing, which is controlled by a description of the interviewer to the interviewee. The resulting data set comprises a sequence of traversed street segments together with an annotation of the trip id, means of annotation and trip purpose. The street segments are provided using the Navteq street network. In the case of rail-bound movement, Navteq street segments that fall within a buffer of the rails are assigned. In difference to GPS, no timestamps are available for the trajectory data.
The most suited use of this data for the DATA SIM project seems to be the city of Cologne (because of data quality, availability etc). In Cologne, mobility data of 385 GPS and 677 CATI participants is available. The GPS participants provide a total of 2,079 measurements days, which corresponds to an average of 5.4 valid days per person. In addition to movement information, the survey provides detailed socio-demographic information about the participants including gender, age group, size of household, level of education, type of profession, household income as well as mobility characteristics such as possession of a driving license, use of private vehicles or use of public transport.
D) SPARROW Data
In order to collect data about electric vehicles in our study area, a novel application SPARROW (SmartPhone App for Remote Registration Of Whereabouts) has been developed by IMOB (see Figure 9). The application is implemented on a smartphone, and automatically logs/stores GPS information background at predefined level (e.g. every 30 seconds by default).
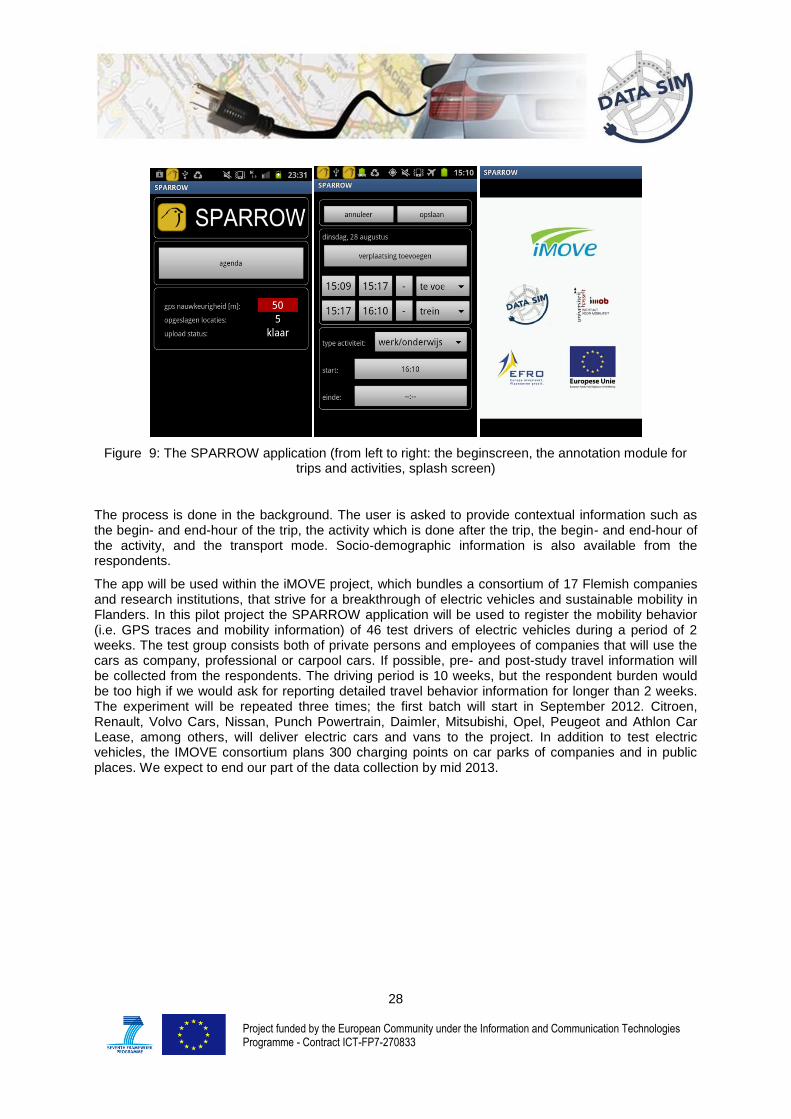
28
Project funded by the European Community under the Information and Communication Technologies Programme - Contract ICT-FP7-270833
Figure 9: The SPARROW application (from left to right: the beginscreen, the annotation module for trips and activities, splash screen)
The process is done in the background. The user is asked to provide contextual information such as the begin- and end-hour of the trip, the activity which is done after the trip, the begin- and end-hour of the activity, and the transport mode. Socio-demographic information is also available from the respondents.
The app will be used within the iMOVE project, which bundles a consortium of 17 Flemish companies and research institutions, that strive for a breakthrough of electric vehicles and sustainable mobility in Flanders. In this pilot project the SPARROW application will be used to register the mobility behavior (i.e. GPS traces and mobility information) of 46 test drivers of electric vehicles during a period of 2 weeks. The test group consists both of private persons and employees of companies that will use the cars as company, professional or carpool cars. If possible, pre- and post-study travel information will be collected from the respondents. The driving period is 10 weeks, but the respondent burden would be too high if we would ask for reporting detailed travel behavior information for longer than 2 weeks. The experiment will be repeated three times; the first batch will start in September 2012. Citroen, Renault, Volvo Cars, Nissan, Punch Powertrain, Daimler, Mitsubishi, Opel, Peugeot and Athlon Car Lease, among others, will deliver electric cars and vans to the project. In addition to test electric vehicles, the IMOVE consortium plans 300 charging points on car parks of companies and in public places. We expect to end our part of the data collection by mid 2013.

29
Project funded by the European Community under the Information and Communication Technologies Programme - Contract ICT-FP7-270833
5 Data that can be used as complementary information for the development of a simulation platform
The data described in the previous sections contain the most crucial information for extracting mobility patterns of individuals, including the behavioural component which underlies travel. However, if the goal is to build a microsimulation methodology that is able to simulate and predict travel patterns, this kind of data is clearly insufficient. Therefore, this section briefly describes all other data that are in possession of the consortium and that will be used to develop the simulator in DATA SIM (WP3).
5.1 Network data
Transportation networks are both necessary for input and for output of the simulator.
Regarding output:
Transportation networks need to be used for traffic assignment procedures to calculate the traffic load on each link/road in the transportation network. In this case, the behavioural patterns of individuals (represented by schedules) are ‘assigned’ to the transportation network and the traffic load can be computed.
Dynamic traffic assignment accounts for the departure time for each driver and for the routing decisions taken. Routing decisions by an individual depend on the traffic intensity on the links to cross as expected by the individual. Hence it involves modeling the perception of the future network state for each participant. The link characteristics specify a non-linear relation between traffic flow (intensity) and expected speed. In addition, the characteristics of the traffic phenomena at nodes (like difference in delay for left and right turning traffic, signaled and non-signaled crossings etc) determine the waiting times. Each individual has a lot of possible routes to move from origin to destination (even if a single transportation mode is considered). The combination of the route choice search space, non-linearity, possibility to shift trip departures in time and the problems associated with future network state expectation, cause traffic assignment to be a very complex problem.
In most of the cases, the expected amount of trips estimated to be active during a given period (15 min, 1 hour) is assigned to the network. This results in a series of static traffic assignments. Even the static assignments require a lot of calculations. The problem size can be estimated using following figures:
number of people involved : 6 million or more for a moderately sized study area like Flanders
the network used for practical situations contains 118k links and 55k nodes. Compare those figures to 643k links and 497k nodes in the networks that are used in GPS based navigators.
The attributes required for each link in the network contain:
link specific characteristics: number of lanes, lane width, one-way road indicator, ...
function related characteristics: local link, arterial ...
region related characteristics: urban, suburban service, shopping center Those characteristics determine the reference speed for free-flow conditions. The actual expected speed under given traffic intensity is derived from the fundamental diagram of traffic flow specifying the speed-density, flow-density and speed-flow relationships for each driving direction. Note that those

30
Project funded by the European Community under the Information and Communication Technologies Programme - Contract ICT-FP7-270833
relationships hold for long links and shall be handled with care in urban areas. A concrete example of a link record looks like:
originNode First node identifier
destinationNode Second node identifier
oneway_OD One-way road in direction from O to D ?
oneway_DO One-way road in direction from D to O ?
nLanes Number of lanes
roadFunction Function of the road (functional class)
fundamDiagramCoeff_OD Coefficients for the fundamental diagram (O-D direction)
fundamDiagramCoeff_DO Coefficients for the fundamental diagram (D-O direction)
leftTurnDelay_OD Left-turn delay when leaving in OD direction
leftTurnDelay_DO Left-turn delay when leaving in DO direction
A node is described by
Id Node identifier
type Junction type (crossing, signaled, …)
regionType Type of the region containing the node (urban, …)
Regarding input:
Transportation networks also need to be used as input in the simulator. In this case the transportation system is represented by a set of Level Of Service (LOS) matrices by transport mode containing information about travel distance, travel time, egress and access time of the different transport modes. In this case, the simulator has information about the modal choice process. Each transport mode has its own pair of distance and travel time matrices. These travel distances and travel times have to be derived in a pre-processing stage outside the system using a GIS tool. This activity was conducted in DATA SIM for the selected study area (see section 2). Furthermore, in a transport simulator, it is also important to have time-of-day dependent travel times rather than a single average. For this reason, free-flow, morning-peak and evening-peak travel time data were derived accordingly.
5.2 Land use data
Data about land use are available for the study area. They involve opening hours and locations of facilities for out-of-home activities. Moreover, the land use system also provides sector-specific data that are used as indicators of availability and attractiveness of facilities for conducting particular activities. The following sector-specific data are being used: total employment, number of primary school children, employment in daily good retailing, employment in non-daily good retailing, employment in banks/post offices and employment in restaurants. By means of assumed relationships between these sector data sets and activity types such as ‘shopping’, ‘bring/get’, etc., possible locations for conducting such kind of activities can be obtained.
Also for Germany some form of land use data is available in the project. The data comes from Microm, which is a commercial provider of (geo-) data for consumer marketing in German-speaking countries. One of their data products is the so called “microm Business Potentialdaten” dataset, which originates in a business database of Creditreform (Germanys biggest credit agency). The dataset offers several attributes describing the business potential of companies for different spatial resolution levels.

31
Project funded by the European Community under the Information and Communication Technologies Programme - Contract ICT-FP7-270833
In the dataset, all data is described on the level of the street segment, More specific all data is connected with an ID of the Navteq street network. In particular the dataset consists of the following attributes:
- Listing of branches which exist on a street segment. This information follows the statistical classification of economic activities of the Federal Statistical Office of Germany
- Number of companies belonging to each branch per street segment - Number of employees for each branch per street segment
5.3 Population data
Transportation models typically also require detailed information on household and person demographics and characteristics. For the Flanders region, the consortium is in possession of census data, containing every individual in the population (6 mio agents).
In case no census data is available, or in case the census data becomes outdated, or one wants to a projection for the future, a common way to proceed is to create a synthetic population data which represents households and household members. A synthetic population is meant to be a statistically duplicate of an actual population.
This means that for each household, characteristics such as number of household members, yearly income, number of cars, etc. have to be generated. Subsequently, each person is characterized by means of attributes such as age, gender, work status and driving license. Within the context of this project, an application of Beckman et al.(1996) as well as Guo and Bhat’s (2007) approaches for generating synthetic populations were chosen. Details for Flanders have been described in Nakamya (2010).
Similar information also exists for Germany. The Deutsche Post AG (DP) is a nationwide provider of postal services in Germany. Data is mainly used internally, for example for the optimization of the daily routes of postmen. In addition, it is also made available commercially by its daughter "German Post Direct" to the market. One part of this data, are the so called “datafactory buildings”. This dataset consists of the addresses and (in parts) coordinates of all buildings in Germany which have a mailbox. In total this makes country-wide about 20.2 million buildings. In addition the number of households is available for each building. Both sources of information give a very detailed estimate of the number of people living on a microscopic level. To make this data available in the project all addresses have been connected with the Navteq Street network by means of a geocoding process in an oracle database.
Figure 10: DB building along the road network

32
Project funded by the European Community under the Information and Communication Technologies Programme - Contract ICT-FP7-270833
5.4 Traffic Loop Detector Data
Traffic loop detecter data can be an external source of validation in the project. Especially in WP4 (benchmarking and validation), these datasets will prove to be very useful for benchmarking purposes once the developed simulation model (WP3) becomes fully operational.
For Flanders, the consortium is in possession of aggregated daily traffic counts containing minute data coming from single inductive loop detectors. The loop detectors are installed on highways and generate four statistics per minute: the number of cars driven by, the number of trucks driven by, the occupancy of the detector and the time-mean speed of all vehicles. Adding up the number of cars and trucks for all lanes in a specific direction, yields a total traffic count for each minute. See figure 11 (left) for a graphical illustration of a selection of the available loop detector data in the Flemish region and Figure 11 (right) for a time plot of traffic counts for one highway in this region (Cools, 2009).
Figure 11: left: Selection of available loop detector data in Flanders. Right: Time plot of Traffic Counts (Cools, 2009)
A similar dataset is available (under negotiation) in Germany by the Bundesanstalt für Straßenwesen (BASt), which is the research institute of the Federal Ministry of Transport, Building and Urban Development (BMVBS) (in Germany). BASt operates a nationwide system for detecting the amount of traffic on German highways in outer-city areas. This is done by induction loops which are embedded in the roadway in each direction. Similar to the Flanders case, for each loop the absolute number of vehicles passing a street segment is detected. A graphical illustration is shown for the outer-city area of Cologne. Thereby the total amount of traffic entering or exiting cologne on the high level street network is detected. This data is available from August 2010 to August 2011 in an hourly resolution for each direction for the shown detectors.
In addition to these information which is typically available on the highest level (e.g.highways), the city of Cologne also contains traffic information on the inner-city street network which can be used in the project (under negotiation). About 140 induction loops exist which detect the total amount of vehicles passing a street segment. The data is stored in a database in a 5-minute-resolution for each direction. In addition to induction loops the City of Cologne operates several video camera systems for monitoring real-time traffic. Based on image processing and object detection this source of data can also be used for the detection of traffic.

33
Project funded by the European Community under the Information and Communication Technologies Programme - Contract ICT-FP7-270833
Figure 12 Belgian High Voltage transmission grid (2012) (Elia, 2012)
6 Data that can be used for the application scenario
Finally, there are also a couple of datasets which may be necessary for the application scenario’s described in the WP6 of the DOW (see p. 27-29).
First of all, we started to collect travel behavior information and GPS traces at the end of Y1 in DATA SIM for electric vehicles driving in Flanders. Since EV was our main application scenario, we found it necessary to collect additional information. To this end, we will be able to analyze driving and activity characteristics of people driving an EV and we will be able to benchmark these main results against other non-electric vehicles. These activities will be continued during Y2, using the SPARROW application (see section 4.1.2 D). Because of this information, we will be able to evaluate the M1-type scenario’s as described in the DOW on p. 29.
For the M2-type scenario’s, no additional data need to be collected for the study area. Since this scenario mainly involves transportation data, no energy/electricity data is necessary. First output results have been developed in Y1 and first results have been published in the annual report and in Knapen et al. (in press).
Finally, the most difficult problem in terms of availability of data relates to the M3-type scenario’s. These scenario’s deal with the regulation of Vehicle to Grid (V2G) systems and with scenario’s which can efficiently program in-home smart grids. In a V2G system, the idea is that vehicles can not only charge, but also discharge and thus inject energy into the grid. In that way, PHEVs can support the grid. Supporting the grid is especially important for voltage control and for congestion management. It was for instance claimed in Clement- Nyns et al.(2010) that there is little storage available in the power grid, so that demand and generation of power should be perfectly matched and continuously managed to avoid frequency instabilities. As a general rule appearing in almost all publications in this domain, is that different small synthetic grids are used due to the difficulty to obtain data from the Distribution System Operators (DSO’s). Also in DATA SIM we encountered this difficulty. We were in contact with Flemish DSO’s and were able to obtain a real semi-urban Belgian distribution network under a strict

34
Project funded by the European Community under the Information and Communication Technologies Programme - Contract ICT-FP7-270833
NDA. However, still, this network is limited and does not cover the full Flemish case study area. So, in order to evaluate the impact of the massive deployment of the PHEV in the Flemish region, additional work needs to be done for this M3 scenario. From the information which is available about the Belgian transmission grid; we started to localize the situation of the main electric substations (see black dots in Figure 12) and we intend to study the effects on the transformers under different charging scenario’s. Significant progress has been made in this respect but the effort is tedious and the quality of the outcome is uncertain. Therefore, additional work regarding this activity may still be necessary and some essential information may still be lacking: rated power of the transformers in the main substations, electrical parameters of the transmission lines (line resistance, conductance, inductance capacitance and total length) etc. In annex 1 we developed a more detailed procedure which we may follow in year 2 to derive the synthetic grid, making a distinction between three different synthetic models: a rural distribution grid, a city distribution grid, and a suburb distribution grid. Other possible solutions will also be explored in year 2.
Finally, the DATA SIM project uses information from a national project where UPM and a Spanish distribution system operator (DSO) is involved. This project is able to provide us with electricity consumption data from the smart meters. The objective in this project is to perform a customer characterization for improving the tariff offer and we exploit this data to get a deeper knowledge about the electric consumer behavior in DATA SIM Project
4. This data will contribute to scenario’s which can
efficiently program and use in-home smart grids.
4 It is important to notice the different consumption patterns between Belgian and Spanish electric
consumption. Anyway, we think that this information is very relevant for the DATA SIM project.

35
Project funded by the European Community under the Information and Communication Technologies Programme - Contract ICT-FP7-270833
7 Privacy issues related to GPS Traces and mobile phone data
Several members of the DATA SIM consortium participated in the GeoPKDD project (www.geopkdd.eu) which goal was to develop theory, techniques and systems for geographic knowledge discovery, based on new privacy-preserving methods for extracting knowledge from large amounts of raw data referenced in space and time. The first part of this section elaborates on some of the concepts introduced in GeoPKDD. The second part of the section describes some of the newer DATA SIM related privacy research, since this is an explicit concern in the development of Hermes
Sem++, the management (storage, indexing, retrieval) system for semantically-enriched mobility
data, as described in the DOW on p.31.
7.1 Privacy by Design
It is probably an understatement to claim that large amounts of mobility data raise serious privacy concerns. Mobility data potentially reveal the behavior of people: where they are going, where they live, where they work, their religious preferences, etc. All this information refers to the private personal sphere of a person and so may potentially reveal many facets of his/her private life. As a consequence, this kind of data has to be considered as personal information and has to be protected against undesirable and unlawful disclosure. Unfortunately, obtaining privacy protection is becoming more and more difficult because of the complex nature of movement data and it cannot simply be accomplished by de-identification (i.e., by removing the direct identifiers contained in the data). Many examples of de-identification from supposedly anonymous data have been reported in the scientific literature. As an example in the context of GPS trajectories, consider Figure 13 that shows a de-identified GPS trajectory of a real user driving in Milan city for a period of one week (i.e., in this case the first week of April 2007). Note that, in this figure street names are omitted in order to avoid easy re-identification of the user. Using only simple analytical tools, able to visualize the trajectory with its context, it is possible to show important and sensitive information of the user. For example, from Figure 13 (top) it is possible to identify the most commonly visited regions; for this specific user there are two locations. In figure 13 (top), the rectangles represent the regions where the user has spent at least a minimum amount of time (10 minutes in this example) and the color darkness of each polygon is proportional to the number of different visits. In addition to this, in Figure 13 (bottom) it is possible to infer: a) the region with identifier 2754 is the user’s home since he/she usually stays there for the night; b) the region with identifier 2450 (the second most frequent region) is the work place, because he/she usually goes there every day at the same time, stays there for a short time and visits a lot of places during the day. Probably, this person is a sales agent. Clearly, by discovering the group of people living in that home and the people working in that company it may be possible to identify the user, which will be the person that belongs to both groups.
Privacy is a concern also in case of mobile phone data. A mobile phone during its communications with the network reveals its approximate location through the ID of the fixed antenna that receives its signal. By knowing the location of the antenna and the direction, its coverage area, or cell, can be estimated. This can enable the inference of an indication of where the mobile device is located.
Additionally, when the communication consists of a billable event – such as a phone call or an SMS, or internet access – details of the event are stored in a billing record that can later be used to generate an invoice; in particular, an information stored is the cell ID where the transmission was received. This last information allows the tracking of movements of a mobile device. In this context privacy is a concern because like in GPS data the tracking of a user’s movements could reveal personal information. Clearly, with respect to the GPS data here the tracked user locations have a coarser granularity; this may help the privacy requirements but in some situations it is not enough. An attacker who knows some typical movements of a user in the dataset could use this information to infer the other (not typical) visited areas (movements). So, it is necessary to apply privacy-preserving methods for the data transformation to protect it from attacks aiming at the re-identification of individuals.

36
Project funded by the European Community under the Information and Communication Technologies Programme - Contract ICT-FP7-270833
Figure 13: top: Commonly visited regions, bottom: A de-identified GPS Trajectory
In general, the data privacy problem requires to find an optimal trade-off between privacy and data utility. From one side, one would like to transform the data in order to avoid the re-identification of individuals and/or locations. Thus, one would like to publish safely the data for mining analysis or to communicate locations for receiving an on-line service without risks (or with negligible risk) for each data subject. From the other side, one would like to minimize the loss of information that can reduce the effectiveness of the underlying data when it is given as input to data mining methods. Therefore, the goal is to maintain the maximum utility of the data. In order to measure the information loss introduced by the data transformation process it is necessary to define measures of utility; analogously, it is necessary to quantify the risks of privacy violation.

37
Project funded by the European Community under the Information and Communication Technologies Programme - Contract ICT-FP7-270833
Privacy by design, in the research field of privacy-preserving data analysis, is a recent paradigm that promises a quality leap in the conflict between data protection and data utility. The idea is to inscribe privacy protection into the knowledge discovery technology by design, so that the analysis incorporates the relevant privacy requirements from the very start.
Here, we evoke the concept of Privacy by Design coined in the ’90s by Ann Cavoukian, the Information and Privacy Commissioner of Ontario, Canada. In brief, Privacy by Design refers to the philosophy and approach of embedding privacy into the design, operation and management of information processing technologies and systems. Here, the articulation of the general “by design” principle in the domain of knowledge discovery is that higher protection and quality can be better achieved in a goal-oriented approach. In such an approach, the knowledge discovery process (including the data collection itself) is designed with assumptions about:
(a) the (sensitive) personal data that are the subject of the analysis;
(b) the attack model, i.e., the knowledge and purpose of a malicious party that has an interest in discovering the sensitive data of certain individuals;
(c) the target analytical questions that are to be answered with the data.
These assumptions are fundamental for the design of a privacy-preserving framework for various reasons.
First of all, the techniques for privacy preservation strongly depend on the nature of the data that we want to protect. For example, many proposed methods are suitable for continuous variables but not for categorical variables (or the other way round), while other techniques employed to anonymize sequential data such as clinical data or tabular data are not appropriate for moving object datasets. Clearly, different forms of data have different properties that must be considered during the transformation process.
Second, a valid framework for privacy protection has to define the background knowledge of the adversary, that strongly depends on the context and on the kind of data. So, an attack model, based on the background knowledge of the attacker, has to be formalized and a specific countermeasure associated to that attack model has to be defined in terms of the properties of the data to be protected. The definition of a suitable attack model is very important in this context. Different assumptions on the background knowledge of an attacker entail different defense strategies. Indeed, it is clear that when the assumption on the background knowledge changes the transformation approach to be adopted also changes significantly. Consider, for example, that an attacker gains the access to a spatio-temporal dataset and that he/she knows some spatio-temporal points belonging to some trajectory of an individual. Two cases are possible: (i) the attacker knows the exact points or (ii) the attacker knows these points with a given uncertainty threshold. The attacker can try to re-identify the respondent by using his/her knowledge and by observing the protected database. Specifically, he/she should generate all the
possible candidate trajectories by using the background knowledge as constraints. Clearly, the defense strategy that it is necessary to use in the case (ii) might be unsuitable for the case (i), because the assumption (ii) is weaker than the assumption (i). This does not mean that assumption (ii) is not valid, as it can be adequate for particular situations where (i) is unrealistically strong. In general, it is natural for different situations to require different privacy requirements and that one person can have different privacy expectations than another. For example the perception of the privacy for a famous actor is surely different from that of a common citizen, since most of the information about the actor’s life is already made public because of the nature of the job. Clearly, the assumption that the background knowledge of an adversary depends on the context allows to realize frameworks that guarantee reasonable levels of privacy according to the privacy expectation.

38
Project funded by the European Community under the Information and Communication Technologies Programme - Contract ICT-FP7-270833
Finally, a privacy-preserving strategy should find an acceptable trade-off between data privacy on one side and data utility on the other side. In order to reach this goal it is fundamental to take into account during the design of the framework the analytical questions that are to be answered with the transformed data. This means designing a transformation process capable to preserve some data properties that are necessary to preserve the results obtained by specific analytical and/or mining tasks.
Under the above assumptions, it is conceivable to design a privacy-preserving analytical process able to:
1. transform the source data into an anonymous or obfuscated version with a quantifiable privacy guarantee - i.e., the probability that the malicious attack fails (measured, e.g., as the probability of re-identification);
2. guarantee that the target analytical questions can be answered correctly, within a quantifiable approximation that specifies the data utility, using the transformed data instead of the original ones.
Recent applications of this paradigm for the design of privacy-preserving frameworks for movement data (see Monreale et al. 2010) prove that it is possible to achieve reasonable and measurable privacy guaranties and a good quality of the analytical results. The technique presented in (Monreale et al. 2010] provides a data transformation ensuring that for any sub-trajectory that can be used by the attacker, the re-identification probability is always controlled below a given threshold 1/k; in other words, ensuring the k-anonymity property in the released dataset. In this framework the linking attack model is considered, i.e., the ability to link the published data to external information, which enables some respondents associated with the data to be re-identified. In relational data, linking is made possible by quasi-identifiers, i.e., attributes that, in combination, can uniquely identify individuals, such as birth date and gender. The remaining attributes represent the private respondent’s information that may be violated by the linking attack. In privacy-preserving data publishing techniques, such as k-anonymity, the goal is precisely to find countermeasures to this attack, and to release person-specific data in such a way that the ability to link to other information using the quasi-identifier(s) is limited. In the case of spatio-temporal data, where each record is a temporal sequence of locations visited by a specific person, the above dichotomy of attributes into quasi-identifiers (QI) and private information (PI) does not hold any longer: here, a (sub)trajectory can play both the role of QI and the role of PI. To see this point, consider the attacker may know a sequence of places visited by some specific person P: e.g., by shadowing P for some time, the attacker may learn that P was in the shopping mall, then in the park, and then at the train station. The attacker could employ such knowledge to retrieve the complete trajectory of P in the released dataset: this attempt would succeed, provided that the attacker knows that P’s trajectory is actually present in the dataset, if the known trajectory is compatible with (i.e., is a sub-trajectory of) just one trajectory in the dataset. In this example of a linking attack in the movement data domain, the sub-trajectory known by the attacker serves as QI, while the entire trajectory is the PI that is disclosed after the re-identification of the respondent. Clearly, as the example suggests, is rather difficult to distinguish QI and PI: in principle, any specific location can be the theater of a shadowing actions by a spy, and therefore any possible sequence of locations can be used as a QI, i.e., as a means for re-identification. Put another way, distinguishing between QI and PI among the locations means putting artificial limits on the attacker’s background knowledge; on the contrary, it is required in privacy and security research to have assumptions on the attacker’s knowledge that are as liberal as possible, in order to achieve maximal protection. As a consequence of this discussion, it is reasonable to consider the radical assumption that any (sub)trajectory that can be linked to a small number of individuals is a potentially dangerous QI and a potentially sensitive PI. Therefore, in the trajectory linking attack, the malicious party M knows a sub-trajectory of a respondent R (e.g., a sequence of locations where R has been spied on by M) and M would like to identify in the data the whole trajectory belonging to R, i.e., learn all places visited by R.

39
Project funded by the European Community under the Information and Communication Technologies Programme - Contract ICT-FP7-270833
The privacy by design paradigm has been also applied to design a framework for semantic-rich trajectory data (see Monreale et al. 2011). In semantic trajectories each location of stop can be attached to some contextual information such as the visited place or the purpose - either by explicit sensing or by inference. An example of semantic trajectory is the sequence of places visited by a moving individual such as Supermarket, Restaurant, Gym, Hospital, Museum.
We argue that the new form of data of semantic trajectories poses important privacy threats. In fact, by definition the semantic trajectories represent the most important places visited by a person and therefore we explicitly represent the person interests in the movement data itself. The first problem introduced by this form of data is that, from the fact that a person has stopped in a certain sensitive location (e.g., an oncology clinic), an attacker can derive private personal information (that person’s health status, in the example). A place is considered sensitive if it allows inferring personal sensitive information of the tracked individual. Monreale et al. (2011) proposes an algorithm for transforming any dataset of semantic trajectories into a c-safe one, which can be safely published under the specified privacy safeguard. The technique also allows preserving some properties in the data such that after the data transformation it is possible to extract from the data useful and reasonable sequential patterns.
7.2 Privacy research in DATA SIM The above discussed approaches, as well as other state-of-the-art techniques as the ones invented in GeoPKDD project, aim at publishing an anonymous counterpart of the original dataset in which adversaries can no longer match the recorded movement of each user to the real identity of the user. A common assumption that is implicitly made in these approaches is that most of the information that is stored in the original dataset can be disclosed without causing any privacy violations. In DATA SIM, we refrain from this assumption as it can be proven unrealistic in certain data sharing scenarios. Instead, we employ a more conservative approach to privacy by assuming that the majority of the information that is captured in the mobility dataset must remain private and that the data has to stay in-house to the hosting organization. Our assumption is primarily based on the following arguments:
(i) The data owner may be reluctant to publish the entire mobility dataset, or conformance to certain business regulations may require that the dataset resides in-house to the hosting organization.
(ii) Mobility datasets can typically support many types of data analysis. In order for the anonymous dataset to be useful in practical applications, it is necessary that the anonymization approach can offer specific utility guarantees and this, in turn, requires knowledge of the intended workload. When the data resides in-house, the privacy preservation algorithms can support many types of data analysis (which may be unknown apriori) by guaranteeing at the same time the privacy of the users, whose information is recorded in the dataset.
(iii) Data sharing policies may change from time to time and new types of privacy attacks to mobility data may be identified, yielding previously released data unprotected. In such events, it is crucial for the data owner to have knowledge of the sensitive information that was leaked, as well as be capable of safeguarding the data based on the new evidence. When the data resides in-house, the privacy-aware query engine can be updated to conform to the new policies and block new types of attack. Additionally, the auditing of queries allows the data owner to have knowledge about the extent of the data leakage by examining the history of user queries to the database and keeping track of the returned answers.
To ensure privacy-aware sharing of in-house mobility data, a mechanism is necessary to control the information that is made available to external parties when they query the database, so that only nonsensitive information leaves the premises of the hosting organization.
In this direction, we have realized and extended the basic design principles that were discussed in Gkoulalas and Verykios (2008) by introducing HERMES++ (see Pelekis et al. 2011), a novel query

40
Project funded by the European Community under the Information and Communication Technologies Programme - Contract ICT-FP7-270833
engine for sensitive trajectory data that allows subscribed end-users to gain restricted access to the database to accomplish various analysis tasks. HERMES++ can shield the trajectory database from potential attacks to user privacy, while supporting popular queries for mobility data analysis, such as range queries, distance queries and nearest neighbor queries. Similarly to Gkoulalas and Verykios (2008), HERMES++ operates by retrieving real user trajectories from the database and replacing them with carefully crafted fake trajectories in order to reduce the confidence of attackers regarding the real trajectories in the query result. However, unlike the privacy-engine that was described in Gkoulalas and Verykios (2008), HERMES++ achieves to (a) audit end-user queries and effectively block an extended set of attacks to user privacy, securing the database against user identification, sensitive location tracking, and sequential tracking attacks, (b) generate smooth and more realistic fake trajectories that preserve the trend of the original data and use them to augment the real ones in returned answers to queries, and (c) ensure that no sensitive locations that would lead to user identification are reported as part of the returned trajectories. The latter goal is achieved by modifying parts of the trajectories that are close to sensitive locations, such as the houses of the users.
Following this line, Pelekis et al. (2012) presented Private-HERMES, a benchmark framework for privacy-preserving mobility data querying and mining methods. The first dimension of this benchmark w.r.t. privacy issues involves in-house stored data and privacy–aware query answering. Private-HERMES incorporates HERMES (see Pelekis et al. 2008), a query engine based on a powerful query language for trajectory databases, which is also the base for data management and analytical processing issues being explored in WP1. HERMES supports a variety of well-known queries such as range, nearest neighbor, topological, directional queries, etc. On top of this functionality, HERMES++ audits queries for trajectory data to block potential attacks to user privacy, supports the most popular spatiotemporal queries (range, distance, k-NN) and preserves user privacy by generating carefully crafted, realistic fake trajectories. The second dimension w.r.t. privacy that is supported by this benchmark involves privacy-preserving mobility data publishing. Several state-of-the-art algorithms have been integrated in Private-HERMES to help anonymize trajectories. The objective is to support the evaluation of such anonymization techniques and to study their effect in the utility of the sanitized data, when compared with queries into the original MOD.
The approach of HERMES++ and Private-HERMES is currently being pursued also for the case of semantic trajectories and for a richer set of queries. The expected outcome, being described as Hermes
Sem++ in the DOW on p.31 will be further discussed in the WP1’s progress report -- described in
the annual report.
41
Project funded by the European Community under the Information and Communication Technologies Programme - Contract ICT-FP7-270833
8 Annex 1: Electric Grid Typologies
1. Assumptions
The electric grid topologies will be used to determine the voltages and currents through the grid, and evaluate the influence of an increased presence of electric vehicles within the grid.
Because the main focus in this project are the local effects on the low voltage distribution grid, only the distribution feeders, up to the distribution transformer are taken into account.
As no data for the actual grids is available, synthetic models are set up for different kinds of distribution grids. The synthetic grid models are constructed assuming the situation in Flanders, Belgium.
The assumptions made in the synthetic grid models are:
The distribution grids have a radial layout.
The distribution grids have a TT grounding topology.
The distribution feeders contain 4 conductors: 3 phase conductors and one neutral.
The distribution grids have a 400V phase voltage, and a 230V line voltage.
Each customer has either a single phase or a three-phase connection.
Three different synthetic models are made: a rural distribution grid, a city distribution grid, and a
suburb distribution grid.
2. Rural distribution grid
In a rural area, houses are standing relatively far from each other, so the distance between two grid connections in a rural distribution grid is large. In the modeled rural grid, the average feeder length between two connections is 40m. A total of 20 households are connected to the rural distribution grid.
The cables used are aluminum cables with each conductor having a cross-section of 70mm². The connections from the feeder to the households have a length between 10 and 25m, these cables are assumed to be copper cables with a cross-section of 16mm².
3. City distribution grid
A city distribution grid has a short average distance between two (household) connections, typically shorter than 10 m. In the modeled distribution grid, the average feeder length between two connections is 8m. A total of 55 houses is connected to the feeder.
The cables used are aluminum cables with each conductor having a cross-section of 95mm². The connections from the feeder to the households have a length between 5 and 15m, these cables are assumed to be copper cables with a cross-section of 16mm².
4. Suburb distribution grid
In a suburban area, the average distance between two grid connections is set to be 25 m. A total of 63 houses is connected to the feeder. The cables used are aluminum cables with each conductor having a cross-section of 150mm². The connections from the feeder to the households have a length between 10 and 25m, these cables are assumed to be copper cables with a cross-section of 16mm².

42
Project funded by the European Community under the Information and Communication Technologies Programme - Contract ICT-FP7-270833
9 References
Alvares, L. O., Bogorny, V., Kuijpers, B., Macedo, J., Moelans, B. & Vaisman, A. (2007). A Model for Enriching Trajectories with Semantic Geographical Information. In GIS ’07: Proceedings of 15th ACM SIGSPATIAL International Symposium on Advances in Geographic Information Systems, p. 22.
Andrienko, G. & Andrienko, N. (2007). Extracting Patterns of Individual Movement Behaviour from a Massive Collection of Tracked Positions. Behaviour Monitoring and Interpretation Workshop – BMI2007.
Arentze, T.A. & Timmermans, H.J.P. (2004). A learning-based transportation oriented simulation system. Transportation Research Part B: Methodological, 38(7), 613-633.
Baglioni, M., Macedo, J., Renso, C., Trasarti, R. & Wachowicz, M. (2009a). Towards Se- mantic Interpretation of Movement Behaviour Agile. Lecture Notes in Geoinformation and Cartography, Hamburg, Germany.
Baglioni, M., Renso, C., & Trasarti, R. (2009b). DAMSEL: a System for Progressive Querying and Reasoning on Movement Data. FlexDBIST Workshop, Linz, Austria, IEEE.
Beckman, R.J., Baggerly, K.A., & McKay, M.D. (1996). Creating synthetic baseline populations. Transportation Research Part A, 30(6), 415-429.
Beckx, C., Panis, L. I., Uljee, I., Arentze, T., Janssens, D., & Wets, G. (2009). Disaggregation of nation-wide dynamic population exposure estimates in The Netherlands: Applications of activity-based transport models. Atmospheric Environment, 43(34), 5454-5462. doi: 10.1016/j.atmosenv.2009.07.035.
Bellemans, T., Kochan, B., Janssens, D., Wets, G. and Timmermans, H.J.P. (2008). Field Evaluation of Personal Digital Assistant Enabled by Global Positioning System Impact on Quality of Activity and Diary Data. Transportation Research Record, 2049, 136-143
Beusen, B., Broekx, S., Denys, T., Beckx, C., Degraeuwe, B., Gijsbers, M., Scheepers, K. Govaers, L., Torfs, R., Int Panis, L. Using on-board logging devices to study the long-term impact of an eco-driving course. Transportation Research D, 14, 514-520
Brög, W. & Ampt, E. (1982). State of the art in the collection of travel behaviour data, Washington, DC: National Research Council.
Cascetta, E. (2009). Transportation Systems Analysis: Models and Applications, second ed. Springer, New York.
Clement-Nyns, K., Haesen, E. & Driesen, J. (2010). The impact of charging plug-in hybrid electric vehicles on a residential distribution grid. IEEE Trans. Power Syst., 25(1), 371 –380.
Cools, M. (2009). Inter and Intraday Variability of Flemish Travel Behaviour. Ph.D. Dissertation, Diepenbeek, Belgium.
Cools, M., Moons, E. & Wets, G. (2010). Assessing Quality of Origin-Destination Matrices Derived from Activity and Travel Surveys: Results from a Monte Carlo Experiment. Transportation Research Record: Journal of the Transportation Research Board.
Du, J. H. & Aultmanhall, L. (2007). Increasing the accuracy of trip rate information from passive multi-day GPS travel datasets: Automatic trip end identification issues. Transportation Research Part A: Policy and Practice, 41(3), 220-232.

43
Project funded by the European Community under the Information and Communication Technologies Programme - Contract ICT-FP7-270833
Gkoulalas-Divanis, A. and Verykios, V. S. (2008). A privacy–aware trajectory tracking query engine. SIGKDD Explorations, 10(1):40-49.
Giannotti, F., Nanni, M., Pedreschi, D., Pinelli, F., Renso, C., Rinzivillo, S., Trasarti, R. (2011). Unveiling the complexity of human mobility by querying and mining massive trajectory data. VLDB Journal 20, 695-719
Gonzáles, M.C., Hidalgo, C.A. & Barabási, A.L. (2008). Understanding individual human mobility patterns. Nature, 453(7196), 779-782.
Guo, J.Y., & Bhat, C.R. (2007). Population Synthesis for Microsimulating Travel Behavior. Transportation Research Record, 2014, 92-101
Hannes, E., Janssens, D. & Wets, G. (2008). Destination Choice in Daily Activity Travel: Mental Map's Repertoire. Transportation Research Record: Journal of the Transportation Research Board, 2054, 20-27.
Hensher, D.A. & Button, K.J. (2000). Handbook of transport modelling. Emerald Group Publishing.
Henson, K.M., Goulias, K.G. & Golledge, R.G. (2009). An assessment of activity-based modeling and simulation for applications in operational studies, disaster preparedness, and homeland security. Transportation letters: The International Journal of Transportation Research, 1, 19-39.
Kiefer, P. & Stein, K. (2008). A Framework for Mobile Intention Recognition in Spatially Structured Environments. Behaviour Monitoring and Interpretation Workshop, BMI2008, 28-41.
Knapen, L., Kochan, B., Bellemans, T., Janssens, D. & Wets, G. (in press). Using Activity-Based Modeling to Predict Spatial and Temporal Electrical Vehicle Power Demand in Flanders. Transportation Research Record. Retrieved from: http://pubsindex.trb.org/view/2012/C/1129871.
Kochan, B., Bellemans, T., Janssens, D., Wets, G. and Timmermans, H.J.P. (2010). Quality assessment of location data obtained by the GPS-enabled PARROTS survey tool. Journal on Location Based Services, 4(2). p. 93-104.
Lausanne Data Collection Campaign (2011). http://research.nokia.com/page/11367
Liao, L., Fox, D. & Kautz, H. (2005a). Location-based Activity Recognition. In Advances in Neural Information Processing Systems (NIPS), MIT Press, 787—794.
Liao, L., Fox, D. & Kautz, H. (2007). Learning and inferring transportation routines, Artificial Intelligence Journal.
Liao, L., Patterson, D.J., Fox, D. & Kautz, H. (2005b). Building personal maps from GPS data. In Proceedings of IJCAI Workshop on Modeling Others from Observation.
Media-Micro-Census GmbH, ma (2012). Plakat Methoden-Steckbrief zur Berichterstattung, 29.08.2012,http://www.agma-mmc.de/publikationen/methodische-berichte/methoden-steckbriefe.html?eID=dam_frontend_push&docID=1792
Monreale, A., Andrienko, G., Andrienko, N., Giannotti, F., Pedreschi, D., Rinzivillo, S. Wrobel, S. (2010). Movement Data Anonymity through Generalization. Transactions on Data Privacy 3(2), 91-121
Monreale, A., Trasarti, R., Pedreschi, D., Renso, C., Bogorny, V. (2011). C-safety: a framework for the anonymization of semantic trajectories. Transactions on Data Privacy 4(2), 73-101
Nakamya, J. (2010). Creating synthetic datasets for microsimulation models. Ph.D. Dissertation, Diepenbeek, Belgium
Nokia Mobile Data Challenge (2012), http://research.nokia.com/page/12000

44
Project funded by the European Community under the Information and Communication Technologies Programme - Contract ICT-FP7-270833
Ong, R., Wachowicz, M., Renso, C. & Nanni, M. (2010). From Pattern Discovery to Pattern Interpretation in Movement Data. Third international workshop on Semantic Aspects of Data Mining, SADM 2010, in conjunction with ICDM 2010, Sydney, Australia, December 2010.
Ortúzar, J. de D. & Willumsen, L.G. (2001). Modelling Transport 3rd ed., Wiley.
Pappalardo, L., Rinzivillo, S., Qu, Z., Pedreschi, D., Giannotti, F. Understanding the patterns of car travel. (2012). EPJ-ST. To appear.
Patriksson, M. (1994). Traffic Assignment Problems: Models and Methods. Topics in transportation., Utrecht: V.N.U. Science Press.
Patterson, D.J., Liao, L., Fox, D. & Kautz, H. (2003). Inferring High Level Behaviour from Low-level Sensors. Proc. of the International Conference on Ubiquitous Computing (UBICOMP-03).
Pelekis, N., Frentzos, E., Giatrakos, N., and Theodoridis, Y. (2008). HERMES: Aggregative LBS via a trajectory DB engine. In Proceedings of SIGMOD, pages 1255-1258.
Pelekis, N., Gkoulalas-Divanis, A., Vodas, M., Kopanaki, D., and Theodoridis, Y. (2011). Privacy-Aware Querying over Sensitive Trajectory Data. In Proceedings of CIKM, pages 895-904.
Pelekis, N., Gkoulalas-Divanis, A., Vodas, M., Plemenos, A., Kopanaki, D., and Theodoridis, Y. (2012). Private-HERMES: A Benchmark Framework for Privacy-Preserving Mobility Data Querying and Mining Methods. In Proceedings of EDBT.
Spaccapietra, S., Parent, C., Damiani, M. L., de Macedo, J. A., Porto, F. & Vangenot, C. A. (2008). Conceptual View on Trajectories. Data and Knowledge Engineering, 65, 126–146.
Spinsanti, L., Celli, F. & Renso, C. (2010). Where you go is who you are: understanding people’s activities by places visited. Proceedings of the Workshop on Behaviour Monitoring and Interpretation.
Spissu, E., Pinjari, A.R., Bhat, C.R., Pendyala, R.M. & Axhausen, K.W. (2009). An analysis of weekly out-of-home discretionary activity participation and time-use behavior. Journal Transportation, 36(5), 483-510.
Stopher, P.R. & Greaves, S.P. (2007). Household travel surveys: Where are we going? Transportation Research Part A: Policy and Practice, 41(5), 367-381.
Thomas, R. (1991). Traffic Assignment Techniques, Aldershot: Avebury Technical.
Timms, P. (2001). A philosophical context for methods to estimate origin destination trip matrices using link counts. Transport Reviews: A Transnational Transdisciplinary Journal, 21(3), p.269.
Wolf, J. (2004). Applications of new technologies in travel surveys, Paper for the Seventh International Conference on Travel Survey Methods, Costa Rica, 1st – 6th August.
Zheng, Y., Chen, Y.K., Xie, X. & Ma, W.Y. (2010). Understanding transportation modes based on GPS data for Web applications. ACM Transaction on the Web, Association for Computing Machinery, Inc.
Zheng, Y., Yukun, C., Xing, X. & Wei-Ying, M. (2010). Understanding transportation mode based on GPS data for Web applications. ACM Transaction on the Web, 4(1), January 2010.