Embed Size (px)
Citation preview

Improved Customer Understanding with Survival Analysis
D1 Solutions White Paper
In this paper we discuss how survival analysis can be used to study the active lifetime of customers.
We show how to calculate hazard probabilities and survival curves for segments of the customer base and how these can be used to extract valuable key performance indicators and to fine-tune the timing of campaigns.
Abstract
Origins of Survival Analysis Application to Customer Behavior Analysis Hazard Probabi-lity and First Insights Survival analysis is the field of statistics that studies the timing of events. It can model any population whose individuals move between a set of well defined states. The term survival analysis comes from the biomedical scien-ces where the interest is in observing patients’ time to death.
This type of analysis has been also widely used in the social and engineering sciences to study other time-to-event scenarios such as employment transitions, marital transi-tions, and machine failures.
Application to Customer Behavior AnalysisSurvival analysis can be applied to study the behavior of cus-tomers. The methodology lends itself nicely to the study of subscription-based services where a customer can move from an active status to inactive. Typical such examples are to be found in the telecommunication sector where custo-mers can churn, i.e. terminate their contracts or their usage.
Other sectors where survival analysis can be applied include internet service providers, newspapers or magazines, pre-mium web-site memberships, etc.
Hazard Probability and First InsightsThe first step in survival analysis is the calculation of hazard probabilities. The hazard probability at a given customer life-time t is defined as the ratio of the number of customers that terminate their subscriptions at time t after joining over the number of customers that are at risk of terminating at t. Thus the hazard function can be easily calculated for a sample of customers by simply counting given the subscription start and end dates.
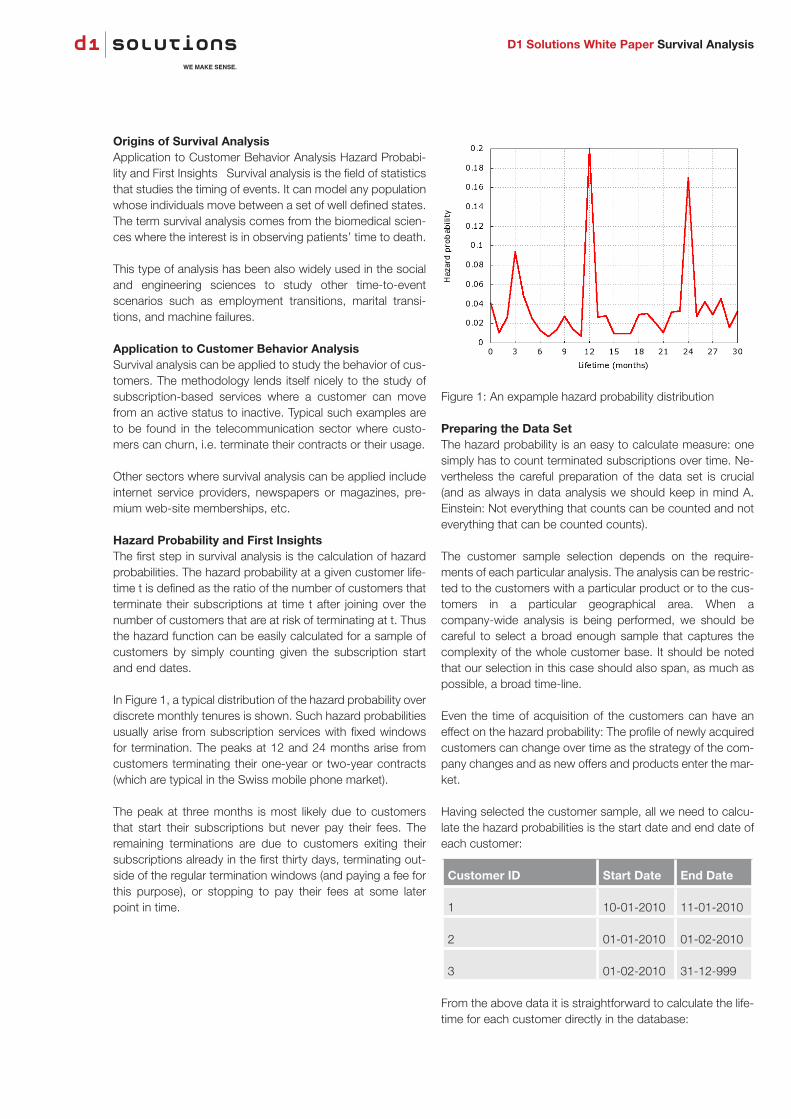
In Figure 1, a typical distribution of the hazard probability over discrete monthly tenures is shown. Such hazard probabilities usually arise from subscription services with fixed windows for termination. The peaks at 12 and 24 months arise from customers terminating their one-year or two-year contracts (which are typical in the Swiss mobile phone market).
The peak at three months is most likely due to customers that start their subscriptions but never pay their fees. The remaining terminations are due to customers exiting their subscriptions already in the first thirty days, terminating out-side of the regular termination windows (and paying a fee for this purpose), or stopping to pay their fees at some later point in time.
Figure 1: An expample hazard probability distribution
Preparing the Data SetThe hazard probability is an easy to calculate measure: one simply has to count terminated subscriptions over time. Ne-vertheless the careful preparation of the data set is crucial (and as always in data analysis we should keep in mind A. Einstein: Not everything that counts can be counted and not everything that can be counted counts).
The customer sample selection depends on the require-ments of each particular analysis. The analysis can be restric-ted to the customers with a particular product or to the cus-tomers in a particular geographical area. When a company-wide analysis is being performed, we should be careful to select a broad enough sample that captures the complexity of the whole customer base. It should be noted that our selection in this case should also span, as much as possible, a broad time-line.
Even the time of acquisition of the customers can have an effect on the hazard probability: The profile of newly acquired customers can change over time as the strategy of the com-pany changes and as new offers and products enter the mar-ket.
Having selected the customer sample, all we need to calcu-late the hazard probabilities is the start date and end date of each customer:
Customer ID Start Date End Date
1 10-01-2010 11-01-2010
2 01-01-2010 01-02-2010
3 01-02-2010 31-12-999
From the above data it is straightforward to calculate the life-time for each customer directly in the database:
D1 Solutions White Paper Survival Analysis
Customer ID Start Date End Date
1 10-01-2010 11-01-2010
2 01-01-2010 01-02-2010
3 01-02-2010 31-12-999
We are discretizing here the lifetime in months; in many cases having the lifetime in days will offer more insights.
The number of customers terminating their subscription in month t over the total number of customers that are at risk of terminating in t gives us the hazard probability for t. Note that we are dividing with the total number of customers that can potentially terminate in month t: this excludes these custo-mers that have terminated in t -1 or earlier but includes those that are currently active.
We will see that the most value of such analysis arises from comparing different customer segments in terms of their sur-vival characteristics. Therefore the data should be extended to include any existing customer segments or enough custo-mer dimensions to facilitate comparisons along ad-hoc seg-ments. Such data might include: product and pricing infor-mation, socio-demographic information, time-of-acquisition of the customer, and usage and revenue information.
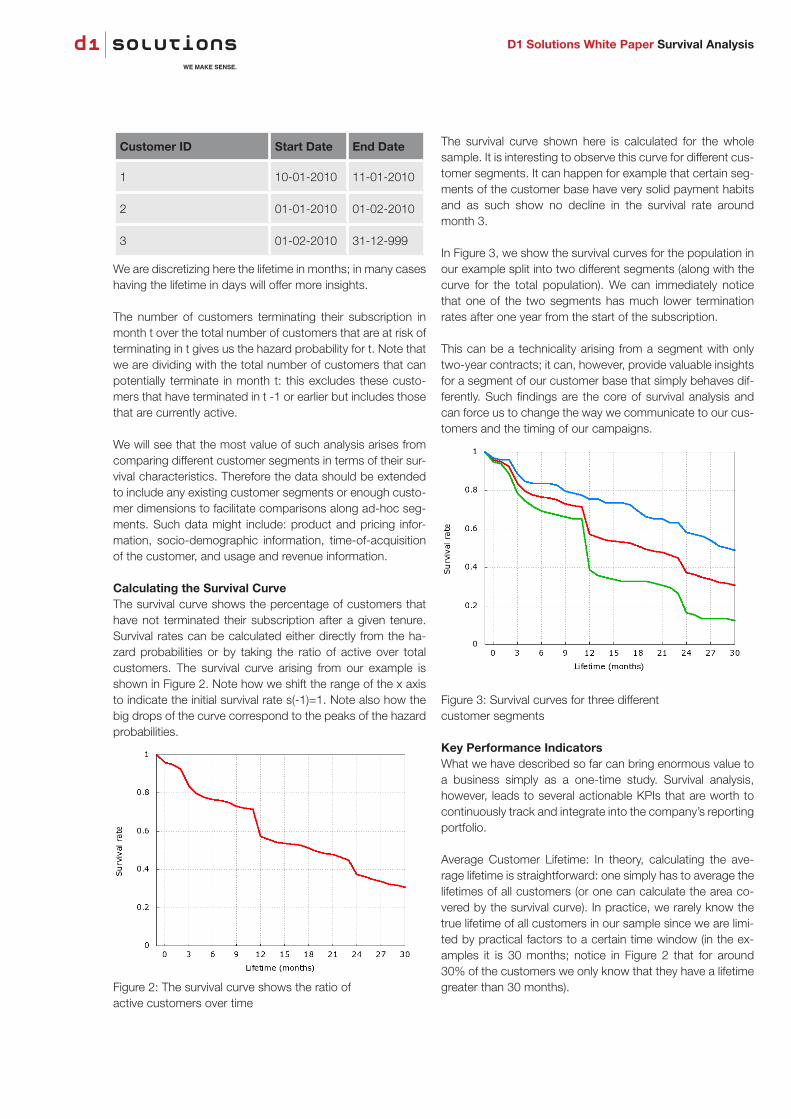
Calculating the Survival CurveThe survival curve shows the percentage of customers that have not terminated their subscription after a given tenure. Survival rates can be calculated either directly from the ha-zard probabilities or by taking the ratio of active over total customers. The survival curve arising from our example is shown in Figure 2. Note how we shift the range of the x axis to indicate the initial survival rate s(-1)=1. Note also how the big drops of the curve correspond to the peaks of the hazard probabilities.
Figure 2: The survival curve shows the ratio of active customers over time
The survival curve shown here is calculated for the whole sample. It is interesting to observe this curve for different cus-tomer segments. It can happen for example that certain seg-ments of the customer base have very solid payment habits and as such show no decline in the survival rate around month 3.
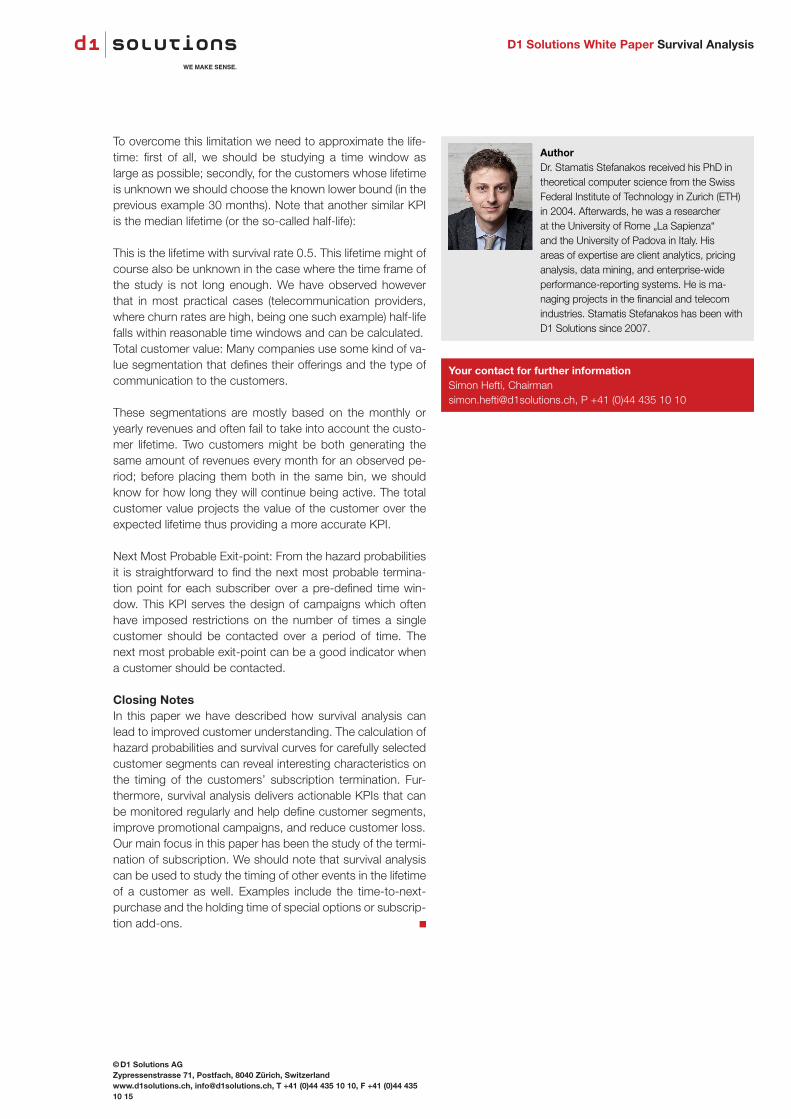
In Figure 3, we show the survival curves for the population in our example split into two different segments (along with the curve for the total population). We can immediately notice that one of the two segments has much lower termination rates after one year from the start of the subscription.
This can be a technicality arising from a segment with only two-year contracts; it can, however, provide valuable insights for a segment of our customer base that simply behaves dif-ferently. Such findings are the core of survival analysis and can force us to change the way we communicate to our cus-tomers and the timing of our campaigns.
Figure 3: Survival curves for three different customer segments
Key Performance IndicatorsWhat we have described so far can bring enormous value to a business simply as a one-time study. Survival analysis, however, leads to several actionable KPIs that are worth to continuously track and integrate into the company’s reporting portfolio.
Average Customer Lifetime: In theory, calculating the ave-rage lifetime is straightforward: one simply has to average the lifetimes of all customers (or one can calculate the area co-vered by the survival curve). In practice, we rarely know the true lifetime of all customers in our sample since we are limi-ted by practical factors to a certain time window (in the ex-amples it is 30 months; notice in Figure 2 that for around 30% of the customers we only know that they have a lifetime greater than 30 months).
D1 Solutions White Paper Survival Analysis
To overcome this limitation we need to approximate the life-time: first of all, we should be studying a time window as large as possible; secondly, for the customers whose lifetime is unknown we should choose the known lower bound (in the previous example 30 months). Note that another similar KPI is the median lifetime (or the so-called half-life):
This is the lifetime with survival rate 0.5. This lifetime might of course also be unknown in the case where the time frame of the study is not long enough. We have observed however that in most practical cases (telecommunication providers, where churn rates are high, being one such example) half-life falls within reasonable time windows and can be calculated.Total customer value: Many companies use some kind of va-lue segmentation that defines their offerings and the type of communication to the customers.
These segmentations are mostly based on the monthly or yearly revenues and often fail to take into account the custo-mer lifetime. Two customers might be both generating the same amount of revenues every month for an observed pe-riod; before placing them both in the same bin, we should know for how long they will continue being active. The total customer value projects the value of the customer over the expected lifetime thus providing a more accurate KPI.
Next Most Probable Exit-point: From the hazard probabilities it is straightforward to find the next most probable termina-tion point for each subscriber over a pre-defined time win-dow. This KPI serves the design of campaigns which often have imposed restrictions on the number of times a single customer should be contacted over a period of time. The next most probable exit-point can be a good indicator when a customer should be contacted.
Closing NotesIn this paper we have described how survival analysis can lead to improved customer understanding. The calculation of hazard probabilities and survival curves for carefully selected customer segments can reveal interesting characteristics on the timing of the customers’ subscription termination. Fur-thermore, survival analysis delivers actionable KPIs that can be monitored regularly and help define customer segments, improve promotional campaigns, and reduce customer loss.Our main focus in this paper has been the study of the termi-nation of subscription. We should note that survival analysis can be used to study the timing of other events in the lifetime of a customer as well. Examples include the time-to-next-purchase and the holding time of special options or subscrip-tion add-ons.
© D1 Solutions AGZypressenstrasse 71, Postfach, 8040 Zürich, Switzerlandwww.d1solutions.ch, [email protected], T +41 (0)44 435 10 10, F +41 (0)44 435 10 15
AuthorDr. Stamatis Stefanakos received his PhD in theoretical computer science from the Swiss Federal Institute of Technology in Zurich (ETH) in 2004. Afterwards, he was a researcher at the University of Rome „La Sapienza“ and the University of Padova in Italy. His areas of expertise are client analytics, pricing analysis, data mining, and enterprise-wide performance-reporting systems. He is ma-naging projects in the financial and telecom industries. Stamatis Stefanakos has been with D1 Solutions since 2007.
Your contact for further informationSimon Hefti, [email protected], P +41 (0)44 435 10 10
D1 Solutions White Paper Survival Analysis