Embed Size (px)
Citation preview

D. Light Towers 1. Use S.P.T. and 3" shelby tubes to sample one hole per tower. 2. Push 3" shelby tube 2.5 feet followed by the split spoon. 3. Clean out to the next 5' interval and repeat the procedure.
4. Alternate S.P.T.s and 3" shelby tubes for at least 30' below finished ground line. Take Qus (undrained shear strength), Atterberg samples, moisture samples, pocket penetrometer readings, and torvane readings.
5. In either cohesive or cohesionless soil, perform SPT test at 35’ and 40’ to complete the boring. Take Atterberg samples, moisture samples, and pocket penetrometer readings.
6. If the soil is too rocky to use the Shelby tube, split spoon on 2.5 foot intervals to achieve a depth of 30' below finished ground line and then penetrate again at 35’ and 40’ to complete the boring.
7. Amount of Rock Core. a. If rock is encountered within 20' of finished ground line, core 10'.
b. If rock is more than 20' from finished ground line, core 5'.
Tower borings will need to be reported on a bridge log for spt’s and core log and a summary sheet for p-y parameters and electro-chemical parameters.
Cohesionless soil (Sand)
1. Friction Angle from Bowles 1977 using corrected Blow Count (N1)60 (N1)60 = CnN60 (N1)60 = N60 corrected for effective Overburden Pressure Cn = correction factor for Overburden Pressure (Peck et. al.1974) 2. Relative density from either DM 7.1-87 or FHWA/RD-86/102. DM 7.1
probably a better value because it accounts for effective overburden pressure.
Cohesive soils 1. Undrained Shear Strength- USS or C from Bowles 1977 using uncorrected
blow count N60, preferably Qu/2. 2. Friction Angle from correlation of PI to angle of internal friction minus
one standard deviation as published in Navdocks DM-7. P-Y Curve Parameters
1. K(f) = slope (variation) of linear subgrade modulus. From Section 6.1 of the Bridge Manual or “Soil Properties (Lpile & Com624P)”
2. K(f)cyclic = for cyclic loading 3. E50 = strain at 50 % of the maximum difference in principal stresses,
unitless, from Qu test and Section 6.1 of the Bridge Manual or “Soil Properties (Lpile & Com624P)”
Electro Chemical Parameters Resistivity is a function of the chloride ion and sulfate ion content and most of the time we will not run this test. To run the test we need about half a materials sack and the sample is entered into site manager.


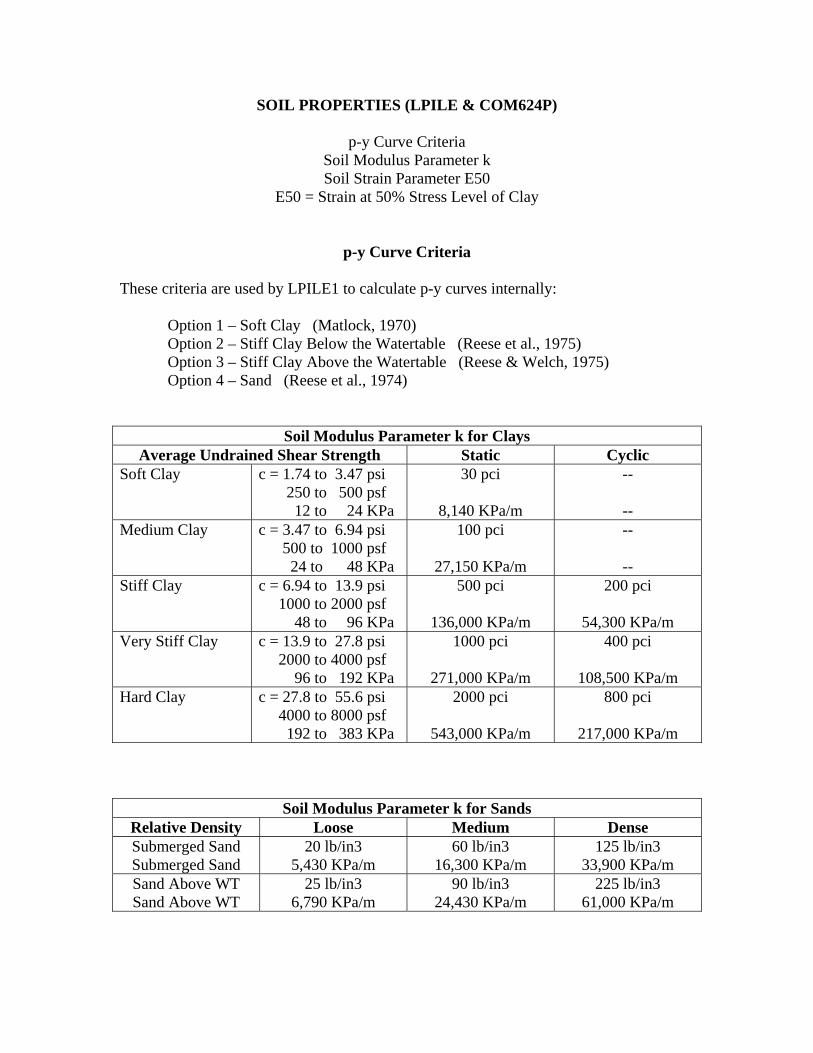
SOIL PROPERTIES (LPILE & COM624P)
p-y Curve Criteria Soil Modulus Parameter k Soil Strain Parameter E50
E50 = Strain at 50% Stress Level of Clay
p-y Curve Criteria These criteria are used by LPILE1 to calculate p-y curves internally: Option 1 – Soft Clay (Matlock, 1970) Option 2 – Stiff Clay Below the Watertable (Reese et al., 1975) Option 3 – Stiff Clay Above the Watertable (Reese & Welch, 1975) Option 4 – Sand (Reese et al., 1974)
Soil Modulus Parameter k for Clays Average Undrained Shear Strength Static Cyclic
Soft Clay c = 1.74 to 3.47 psi 250 to 500 psf 12 to 24 KPa
30 pci
8,140 KPa/m
--
-- Medium Clay c = 3.47 to 6.94 psi
500 to 1000 psf 24 to 48 KPa
100 pci
27,150 KPa/m
--
-- Stiff Clay c = 6.94 to 13.9 psi
1000 to 2000 psf 48 to 96 KPa
500 pci
136,000 KPa/m
200 pci
54,300 KPa/m Very Stiff Clay c = 13.9 to 27.8 psi
2000 to 4000 psf 96 to 192 KPa
1000 pci
271,000 KPa/m
400 pci
108,500 KPa/m Hard Clay c = 27.8 to 55.6 psi
4000 to 8000 psf 192 to 383 KPa
2000 pci
543,000 KPa/m
800 pci
217,000 KPa/m
Soil Modulus Parameter k for Sands Relative Density Loose Medium Dense Submerged Sand Submerged Sand
20 lb/in3 5,430 KPa/m
60 lb/in3 16,300 KPa/m
125 lb/in3 33,900 KPa/m
Sand Above WT Sand Above WT
25 lb/in3 6,790 KPa/m
90 lb/in3 24,430 KPa/m
225 lb/in3 61,000 KPa/m

Soil Strain Parameter E50
Soft Clay
c = 1.74 to 3.47 psi 250 to 500 psf 12 to 24 KPa
E50 =
0.02
Medium Clay
c =
3.47 to 6.94 psi 500 to 1000 psf 24 to 48 KPa
E50 =
0.01
Stiff Clay
c =
6.94 to 13.9 psi 1000 to 2000 psf 48 to 96 KPa
E50 =
0.007
Very Stiff Clay
c =
13.9 to 27.8 psi 2000 to 4000 psf 96 to 192 KPa
E50 =
0.005
Hard Clay
c =
27.8 to 55.6 psi 4000 to 8000 psf 192 to 383 KPa
E50 =
0.004
Limestone
E50 =
0.001


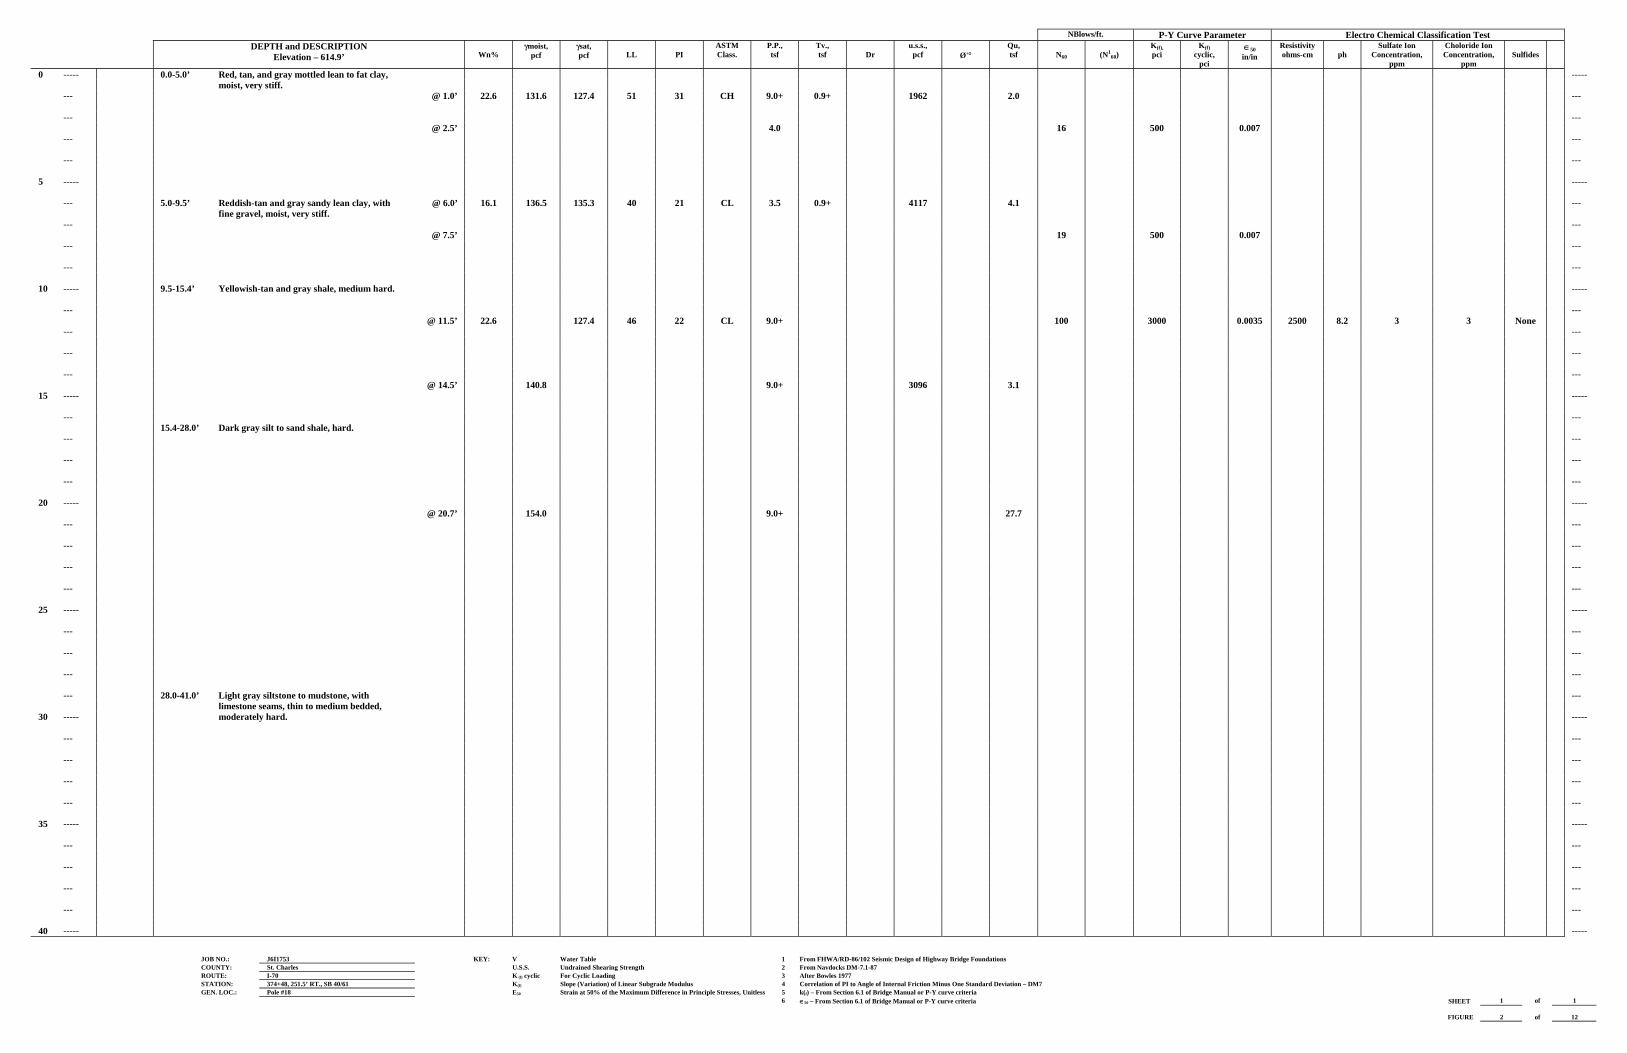
NBlows/ft. P-Y Curve Parameter Electro Chemical Classification Test DEPTH and DESCRIPTION
Elevation – 614.9’
Wn% γmoist,
pcf γsat, pcf
LL
PI
ASTM Class.
P.P., tsf
Tv., tsf
Dr
u.s.s., pcf
Ø'°
Qu, tsf
N60
(N1
60) K(f),pci
K(f) cyclic,
pci
∈50in/in
Resistivity ohms-cm
ph
Sulfate Ion Concentration,
ppm
Choloride Ion Concentration,
ppm
Sulfides
0 ----- 0.0-5.0’ Red, tan, and gray mottled lean to fat clay, ----- moist, very stiff. --- @ 1.0’ 22.6 131.6 127.4 51 31 CH 9.0+ 0.9+ 1962 2.0 --- --- --- @ 2.5’ 4.0 16 500 0.007 --- --- --- --- 5 ----- ----- --- 5.0-9.5’ Reddish-tan and gray sandy lean clay, with @ 6.0’ 16.1 136.5 135.3 40 21 CL 3.5 0.9+ 4117 4.1 --- fine gravel, moist, very stiff. --- --- @ 7.5’ 19 500 0.007 --- --- --- --- 10 ----- 9.5-15.4’ Yellowish-tan and gray shale, medium hard. ----- --- --- @ 11.5’ 22.6 127.4 46 22 CL 9.0+ 100 3000 0.0035 2500 8.2 3 3 None --- --- --- --- --- --- @ 14.5’ 140.8 9.0+ 3096 3.1 15 ----- ----- --- --- 15.4-28.0’ Dark gray silt to sand shale, hard. --- --- --- --- --- --- 20 ----- ----- @ 20.7’ 154.0 9.0+ 27.7 --- --- --- --- --- --- --- --- 25 ----- ----- --- --- --- --- --- --- --- 28.0-41.0’ Light gray siltstone to mudstone, with --- limestone seams, thin to medium bedded, 30 ----- moderately hard. ----- --- --- --- --- --- --- --- --- 35 ----- ----- --- --- --- --- --- --- --- --- 40 ----- -----
JOB NO.: J6I1753 KEY: V Water Table 1 From FHWA/RD-86/102 Seismic Design of Highway Bridge Foundations COUNTY: St. Charles U.S.S. Undrained Shearing Strength 2 From Navdocks DM-7.1-87 ROUTE: I-70 K (f) cyclic For Cyclic Loading 3 After Bowles 1977 STATION: 374+48, 251.5’ RT., SB 40/61 K(f) Slope (Variation) of Linear Subgrade Modulus 4 Correlation of PI to Angle of Internal Friction Minus One Standard Deviation – DM7 GEN. LOC.: Pole #18 E50 Strain at 50% of the Maximum Difference in Principle Stresses, Unitless 5 k(f) – From Section 6.1 of Bridge Manual or P-Y curve criteria 6 ∈50 – From Section 6.1 of Bridge Manual or P-Y curve criteria SHEET 1 of 1 FIGURE 2 of 12