Embed Size (px)
Citation preview
Cytoarchitecture of the Locust Olfactory System
Thesis by
S. Sarah Farivar
In Partial Fulfillment of the Requirements
for the Degree of
Doctor of Philosophy
California Institute of Technology
Pasadena, California
2005
(Defended February 18, 2005)

ii
c© 2005
S. Sarah Farivar
All Rights Reserved

iii
Acknowledgements
I would like to thank my thesis advisor, Gilles Laurent, for the opportunity to conduct
this research and for his guidance in its progress. I would also like to thank my
committee members Erin Schuman, Henry Lester and Christof Koch for advice and
encouragement along the way. Thanks to Scott Fraser, his lab and the Biological
Imaging Center where I spent many hours doing all of my imaging work.
All of my lab-mates, past and present, have afforded me with delightful scientific
conversations and many mostly delightful non-scientific conversations. Thanks to
Javier Perez-Orive, Ben Rubin, Stijn Cassenaer, Vivek Jayaraman, and Roni Jortner
for allowing me to vent on just about every topic. I’m indebted to Ofer Mazor for
being a great office mate, in several offices, and generally introducing me to my
husband.
Thanks to all of my fellow biology classmates for a fabulous first-year. The girls
of girls’-lunch have my eternal gratitude for their unending support, always showing
up for lunch, and our deep lunchtime discussions.
I owe my parents all my thanks for their encouragement and support (as well as
much of my nutrition) these past 23 years that I’ve insisted on staying in school.
Thanks to my brother Shervin for his computer expertise and numerous hours spent
debugging my laptop. Lastly, thanks to Adam Hayes for his unending criticisms,
many late-nights keeping me company in lab, his MATLAB programming expertise
and his support of my work and me in general.
iv
Abstract
The insect mushroom body (MB) receives and processes olfactory information. The
MB is a highly conserved structure found in all but a few insect species, and has
been shown to be a relevant area in learning and memory of olfactory information.
The functional properties of the intrinsic cells of the MB — the Kenyon cells (KCs)
— have been extensively studied, and their integrative properties are starting to be
understood, particularly in locust. To help decipher its role in odor processing, this
thesis presents an in-depth study of the architecture of the locust MB, using a variety
of anatomical techniques and original software. Four divisions in the MB’s input area,
the calyx, are defined and described, as well as a division in one of its output regions,
the β lobe. KCs are characterized based on their morphologies and extents within
the calyx divisions and the β lobe. MB input cells — the projection neurons — are
described in relation to their own input area, the antennal lobe, as well as their output
to MB calyx divisions. Two classes of cells downstream from the KCs are also defined
anatomically and related to immunochemistry on neurotransmitters. A specific area
within the brain — the lateral horn lobe — to which projection neurons and extrinsic
cells project, is also defined. Similarities of these structures to other insect orders are
also discussed.
v
Abbreviations
PN Projection Neuron
LN Local Neuron
AL Antennal Lobe
MB Mushroom Body
ORN Olfactory Receptor Neuron
OB Olfactory Bulb
KC Kenyon Cell
GABA Gamma-aminobutyric Acid
LH Lateral Horn
LHI Lateral Horn Interneuron
LFP Local Field Potential
EPSP Excitatory Post-synaptic Potential
IPSP Inhibitory Post-synaptic Potential
LY Lucifer Yellow
AF Alexa Fluor
OC Outer-Calyx
MC Mid-Calyx
IC Inner-Calyx
CI Class I Extrinsic Cell
CII Class II Extrinsic Cell
vi
PI Pars Intercerebralis
MOB Main Olfactory Bulb
AOB Accessory Olfactory Bulb
VNO Vomeronasal Organ
vii
Contents
Acknowledgements iii
Abstract iv
1 Introduction 1
1.1 Studying the Sensory Nervous System . . . . . . . . . . . . . . . . . . 1
1.2 Olfaction: A General Survey . . . . . . . . . . . . . . . . . . . . . . . 2
1.3 Anatomical Considerations of Olfactory Systems In Insects . . . . . . 4
1.3.1 The Antennae and Antennal Lobes . . . . . . . . . . . . . . . 4
1.3.2 Mushroom Bodies . . . . . . . . . . . . . . . . . . . . . . . . . 9
1.4 Examples from Three Insect Orders . . . . . . . . . . . . . . . . . . . 12
1.4.1 Order Hymenoptera: Apis mellifera . . . . . . . . . . . . . . . 12
1.4.2 Order Diptera: Drosophila melanogaster . . . . . . . . . . . . 15
1.4.3 Order Dictyoptera: Periplaneta americana . . . . . . . . . . . 17
1.4.4 Comparison Between the Three Orders . . . . . . . . . . . . . 19
1.5 A Detailed Look at Order Orthoptera: Schistocerca americana . . . . 21
1.5.1 Olfactory Anatomy: The Antennal Lobes . . . . . . . . . . . . 22
1.5.2 Olfactory Anatomy: The Mushroom Bodies . . . . . . . . . . 23
1.5.3 Olfactory Coding . . . . . . . . . . . . . . . . . . . . . . . . . 26
1.6 Specific Goals and Layout of this Study . . . . . . . . . . . . . . . . . 28
2 Methods 29
2.1 Golgi Staining . . . . . . . . . . . . . . . . . . . . . . . . . . . . . . . 29
2.2 Intracellular Recording and Dye Fills . . . . . . . . . . . . . . . . . . 31
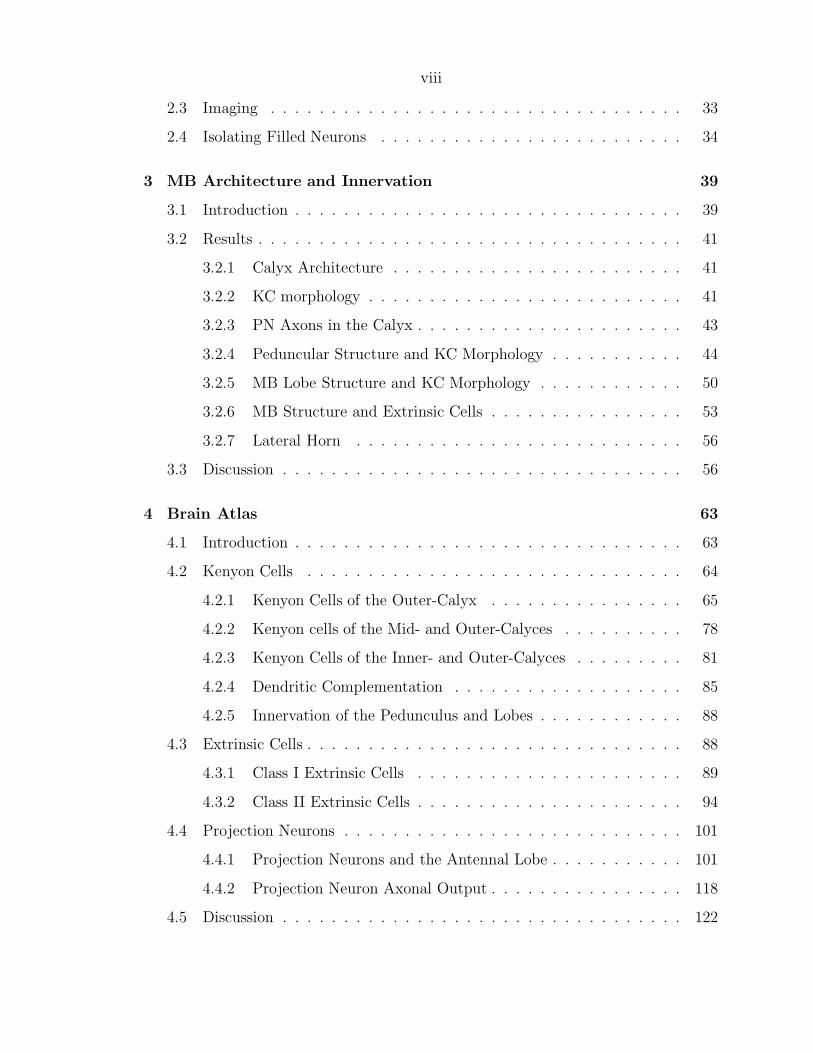
viii
2.3 Imaging . . . . . . . . . . . . . . . . . . . . . . . . . . . . . . . . . . 33
2.4 Isolating Filled Neurons . . . . . . . . . . . . . . . . . . . . . . . . . 34
3 MB Architecture and Innervation 39
3.1 Introduction . . . . . . . . . . . . . . . . . . . . . . . . . . . . . . . . 39
3.2 Results . . . . . . . . . . . . . . . . . . . . . . . . . . . . . . . . . . . 41
3.2.1 Calyx Architecture . . . . . . . . . . . . . . . . . . . . . . . . 41
3.2.2 KC morphology . . . . . . . . . . . . . . . . . . . . . . . . . . 41
3.2.3 PN Axons in the Calyx . . . . . . . . . . . . . . . . . . . . . . 43
3.2.4 Peduncular Structure and KC Morphology . . . . . . . . . . . 44
3.2.5 MB Lobe Structure and KC Morphology . . . . . . . . . . . . 50
3.2.6 MB Structure and Extrinsic Cells . . . . . . . . . . . . . . . . 53
3.2.7 Lateral Horn . . . . . . . . . . . . . . . . . . . . . . . . . . . 56
3.3 Discussion . . . . . . . . . . . . . . . . . . . . . . . . . . . . . . . . . 56
4 Brain Atlas 63
4.1 Introduction . . . . . . . . . . . . . . . . . . . . . . . . . . . . . . . . 63
4.2 Kenyon Cells . . . . . . . . . . . . . . . . . . . . . . . . . . . . . . . 64
4.2.1 Kenyon Cells of the Outer-Calyx . . . . . . . . . . . . . . . . 65
4.2.2 Kenyon cells of the Mid- and Outer-Calyces . . . . . . . . . . 78
4.2.3 Kenyon Cells of the Inner- and Outer-Calyces . . . . . . . . . 81
4.2.4 Dendritic Complementation . . . . . . . . . . . . . . . . . . . 85
4.2.5 Innervation of the Pedunculus and Lobes . . . . . . . . . . . . 88
4.3 Extrinsic Cells . . . . . . . . . . . . . . . . . . . . . . . . . . . . . . . 88
4.3.1 Class I Extrinsic Cells . . . . . . . . . . . . . . . . . . . . . . 89
4.3.2 Class II Extrinsic Cells . . . . . . . . . . . . . . . . . . . . . . 94
4.4 Projection Neurons . . . . . . . . . . . . . . . . . . . . . . . . . . . . 101
4.4.1 Projection Neurons and the Antennal Lobe . . . . . . . . . . . 101
4.4.2 Projection Neuron Axonal Output . . . . . . . . . . . . . . . . 118
4.5 Discussion . . . . . . . . . . . . . . . . . . . . . . . . . . . . . . . . . 122
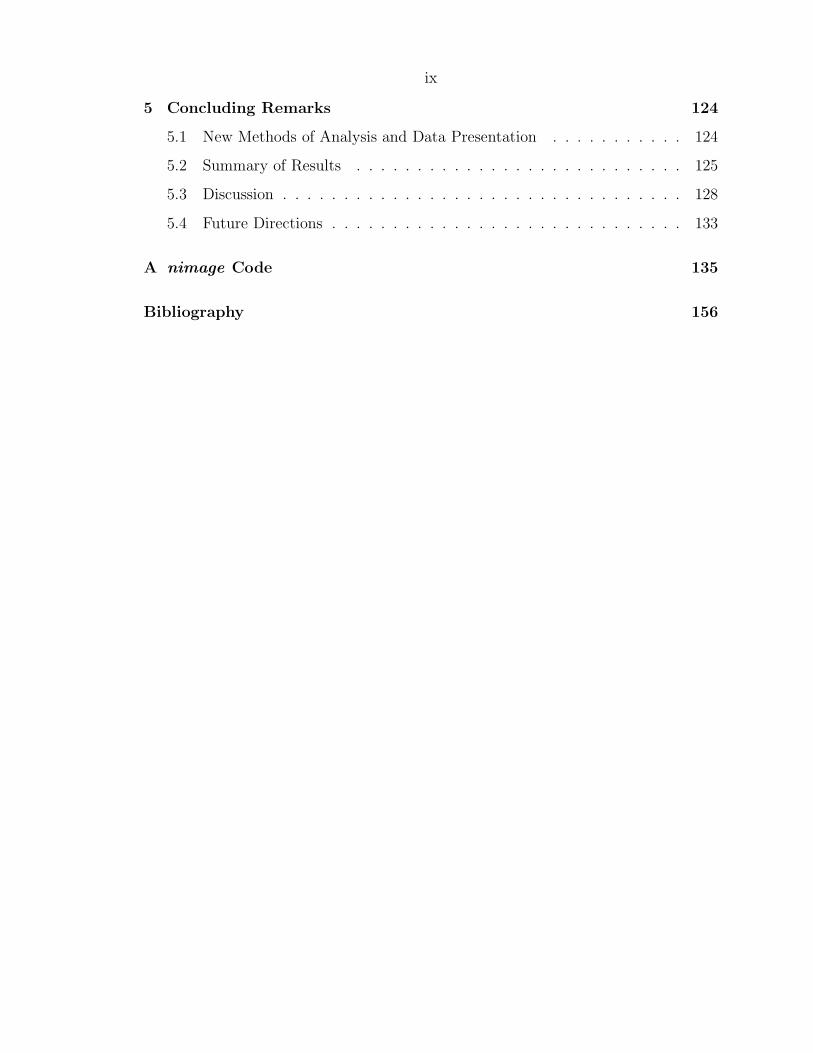
ix
5 Concluding Remarks 124
5.1 New Methods of Analysis and Data Presentation . . . . . . . . . . . 124
5.2 Summary of Results . . . . . . . . . . . . . . . . . . . . . . . . . . . 125
5.3 Discussion . . . . . . . . . . . . . . . . . . . . . . . . . . . . . . . . . 128
5.4 Future Directions . . . . . . . . . . . . . . . . . . . . . . . . . . . . . 133
A nimage Code 135
Bibliography 156
x
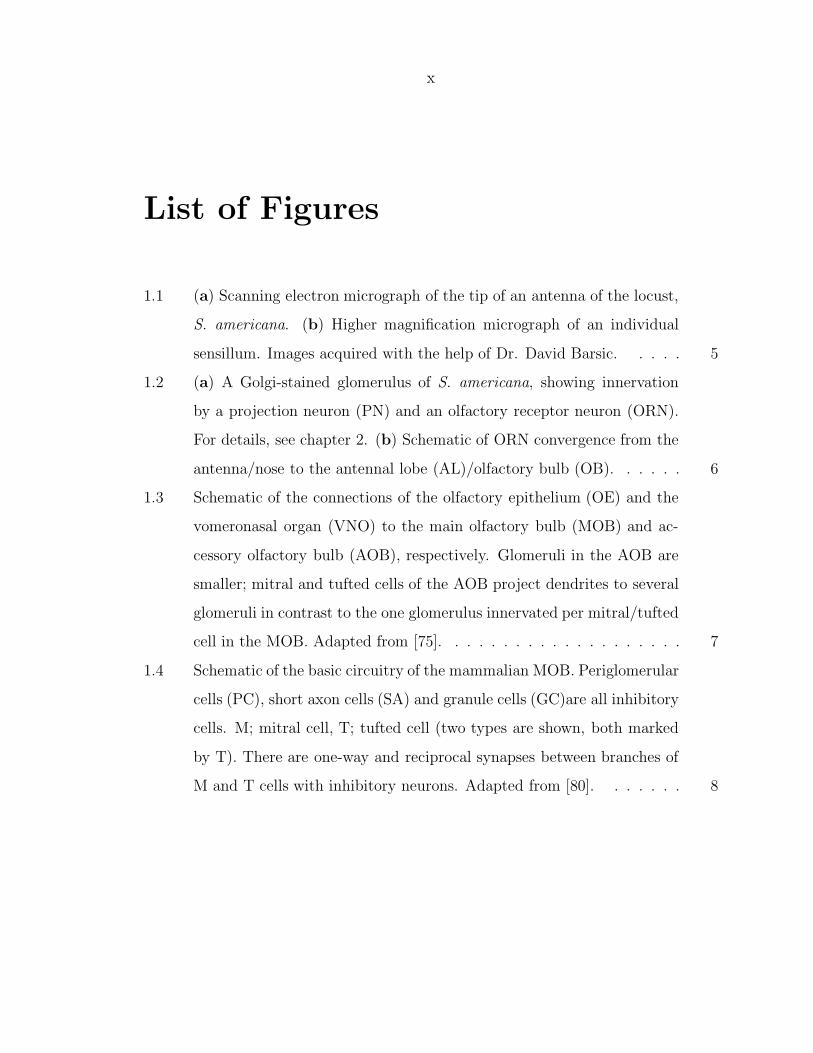
List of Figures
1.1 (a) Scanning electron micrograph of the tip of an antenna of the locust,
S. americana. (b) Higher magnification micrograph of an individual
sensillum. Images acquired with the help of Dr. David Barsic. . . . . 5
1.2 (a) A Golgi-stained glomerulus of S. americana, showing innervation
by a projection neuron (PN) and an olfactory receptor neuron (ORN).
For details, see chapter 2. (b) Schematic of ORN convergence from the
antenna/nose to the antennal lobe (AL)/olfactory bulb (OB). . . . . . 6
1.3 Schematic of the connections of the olfactory epithelium (OE) and the
vomeronasal organ (VNO) to the main olfactory bulb (MOB) and ac-
cessory olfactory bulb (AOB), respectively. Glomeruli in the AOB are
smaller; mitral and tufted cells of the AOB project dendrites to several
glomeruli in contrast to the one glomerulus innervated per mitral/tufted
cell in the MOB. Adapted from [75]. . . . . . . . . . . . . . . . . . . . 7
1.4 Schematic of the basic circuitry of the mammalian MOB. Periglomerular
cells (PC), short axon cells (SA) and granule cells (GC)are all inhibitory
cells. M; mitral cell, T; tufted cell (two types are shown, both marked
by T). There are one-way and reciprocal synapses between branches of
M and T cells with inhibitory neurons. Adapted from [80]. . . . . . . 8
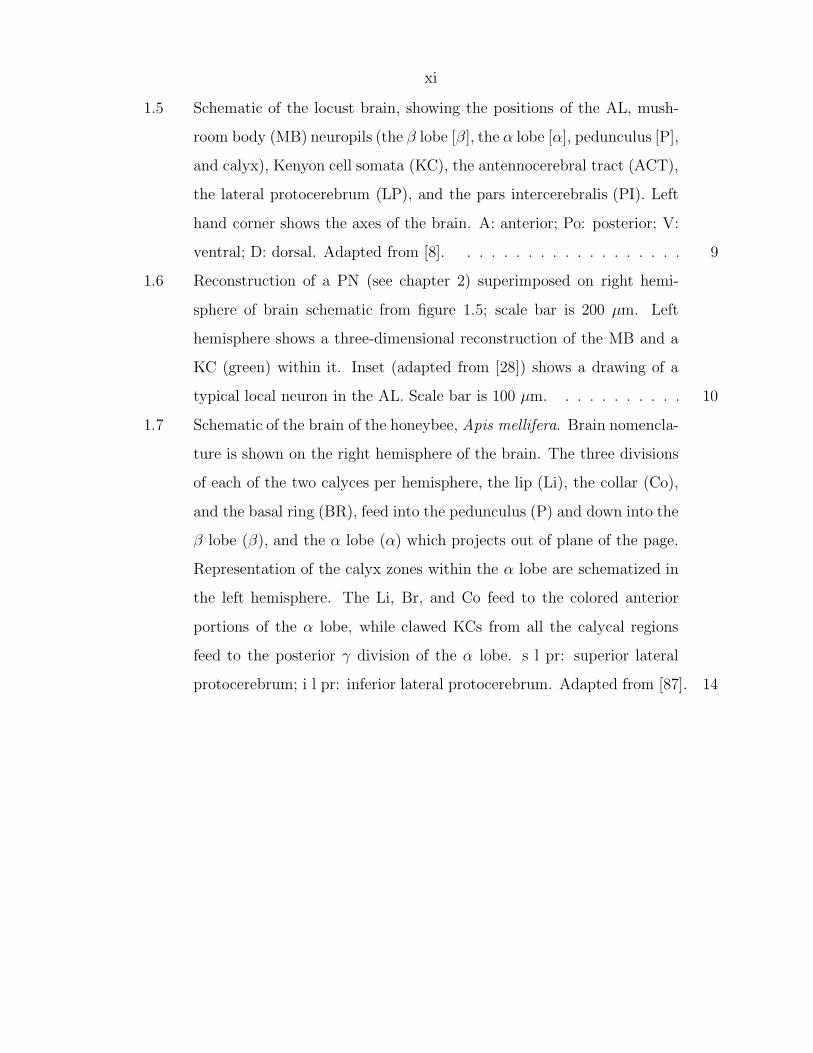
xi
1.5 Schematic of the locust brain, showing the positions of the AL, mush-
room body (MB) neuropils (the β lobe [β], the α lobe [α], pedunculus [P],
and calyx), Kenyon cell somata (KC), the antennocerebral tract (ACT),
the lateral protocerebrum (LP), and the pars intercerebralis (PI). Left
hand corner shows the axes of the brain. A: anterior; Po: posterior; V:
ventral; D: dorsal. Adapted from [8]. . . . . . . . . . . . . . . . . . . 9
1.6 Reconstruction of a PN (see chapter 2) superimposed on right hemi-
sphere of brain schematic from figure 1.5; scale bar is 200 µm. Left
hemisphere shows a three-dimensional reconstruction of the MB and a
KC (green) within it. Inset (adapted from [28]) shows a drawing of a
typical local neuron in the AL. Scale bar is 100 µm. . . . . . . . . . . 10
1.7 Schematic of the brain of the honeybee, Apis mellifera. Brain nomencla-
ture is shown on the right hemisphere of the brain. The three divisions
of each of the two calyces per hemisphere, the lip (Li), the collar (Co),
and the basal ring (BR), feed into the pedunculus (P) and down into the
β lobe (β), and the α lobe (α) which projects out of plane of the page.
Representation of the calyx zones within the α lobe are schematized in
the left hemisphere. The Li, Br, and Co feed to the colored anterior
portions of the α lobe, while clawed KCs from all the calycal regions
feed to the posterior γ division of the α lobe. s l pr: superior lateral
protocerebrum; i l pr: inferior lateral protocerebrum. Adapted from [87]. 14
xii
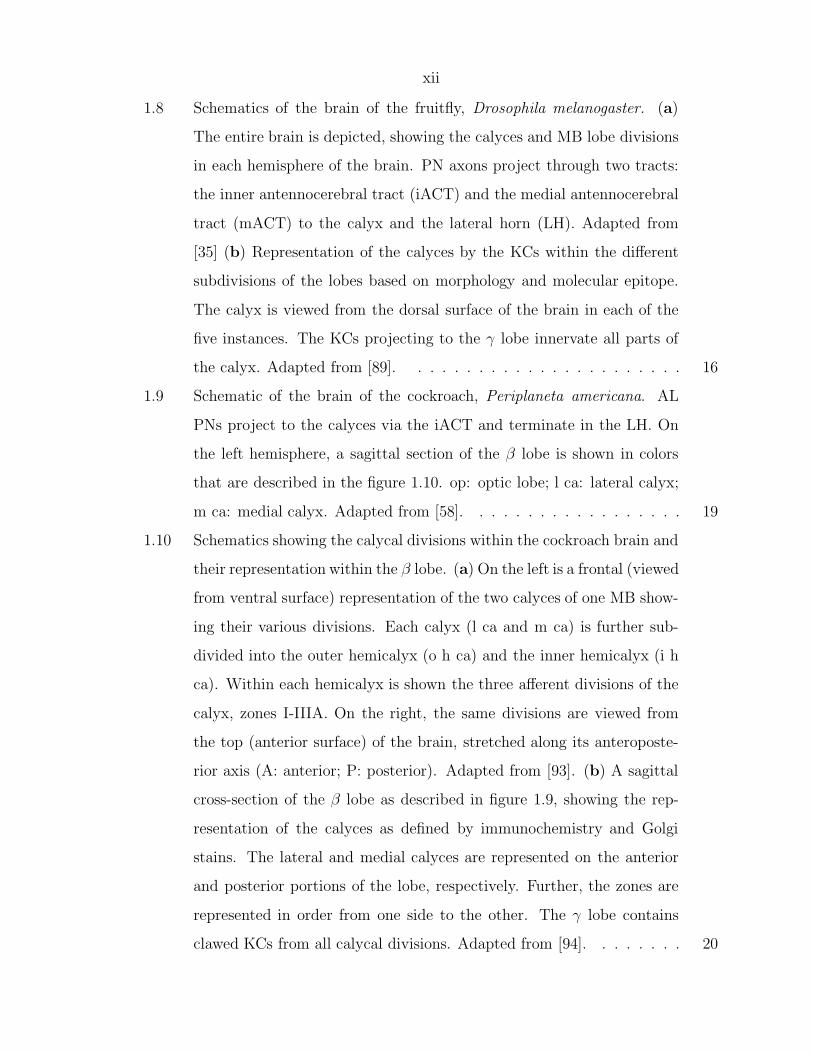
1.8 Schematics of the brain of the fruitfly, Drosophila melanogaster. (a)
The entire brain is depicted, showing the calyces and MB lobe divisions
in each hemisphere of the brain. PN axons project through two tracts:
the inner antennocerebral tract (iACT) and the medial antennocerebral
tract (mACT) to the calyx and the lateral horn (LH). Adapted from
[35] (b) Representation of the calyces by the KCs within the different
subdivisions of the lobes based on morphology and molecular epitope.
The calyx is viewed from the dorsal surface of the brain in each of the
five instances. The KCs projecting to the γ lobe innervate all parts of
the calyx. Adapted from [89]. . . . . . . . . . . . . . . . . . . . . . . 16
1.9 Schematic of the brain of the cockroach, Periplaneta americana. AL
PNs project to the calyces via the iACT and terminate in the LH. On
the left hemisphere, a sagittal section of the β lobe is shown in colors
that are described in the figure 1.10. op: optic lobe; l ca: lateral calyx;
m ca: medial calyx. Adapted from [58]. . . . . . . . . . . . . . . . . . 19
1.10 Schematics showing the calycal divisions within the cockroach brain and
their representation within the β lobe. (a) On the left is a frontal (viewed
from ventral surface) representation of the two calyces of one MB show-
ing their various divisions. Each calyx (l ca and m ca) is further sub-
divided into the outer hemicalyx (o h ca) and the inner hemicalyx (i h
ca). Within each hemicalyx is shown the three afferent divisions of the
calyx, zones I-IIIA. On the right, the same divisions are viewed from
the top (anterior surface) of the brain, stretched along its anteroposte-
rior axis (A: anterior; P: posterior). Adapted from [93]. (b) A sagittal
cross-section of the β lobe as described in figure 1.9, showing the rep-
resentation of the calyces as defined by immunochemistry and Golgi
stains. The lateral and medial calyces are represented on the anterior
and posterior portions of the lobe, respectively. Further, the zones are
represented in order from one side to the other. The γ lobe contains
clawed KCs from all calycal divisions. Adapted from [94]. . . . . . . . 20
xiii
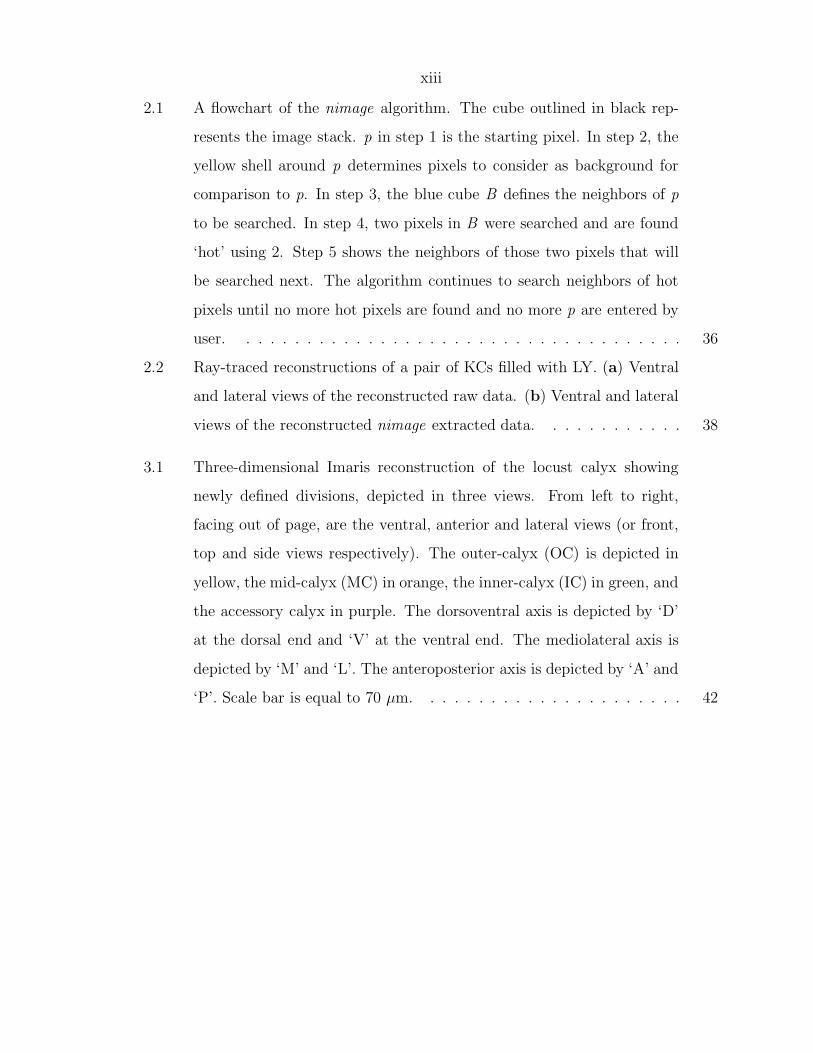
2.1 A flowchart of the nimage algorithm. The cube outlined in black rep-
resents the image stack. p in step 1 is the starting pixel. In step 2, the
yellow shell around p determines pixels to consider as background for
comparison to p. In step 3, the blue cube B defines the neighbors of p
to be searched. In step 4, two pixels in B were searched and are found
‘hot’ using 2. Step 5 shows the neighbors of those two pixels that will
be searched next. The algorithm continues to search neighbors of hot
pixels until no more hot pixels are found and no more p are entered by
user. . . . . . . . . . . . . . . . . . . . . . . . . . . . . . . . . . . . . 36
2.2 Ray-traced reconstructions of a pair of KCs filled with LY. (a) Ventral
and lateral views of the reconstructed raw data. (b) Ventral and lateral
views of the reconstructed nimage extracted data. . . . . . . . . . . . 38
3.1 Three-dimensional Imaris reconstruction of the locust calyx showing
newly defined divisions, depicted in three views. From left to right,
facing out of page, are the ventral, anterior and lateral views (or front,
top and side views respectively). The outer-calyx (OC) is depicted in
yellow, the mid-calyx (MC) in orange, the inner-calyx (IC) in green, and
the accessory calyx in purple. The dorsoventral axis is depicted by ‘D’
at the dorsal end and ‘V’ at the ventral end. The mediolateral axis is
depicted by ‘M’ and ‘L’. The anteroposterior axis is depicted by ‘A’ and
‘P’. Scale bar is equal to 70 µm. . . . . . . . . . . . . . . . . . . . . . 42
xiv
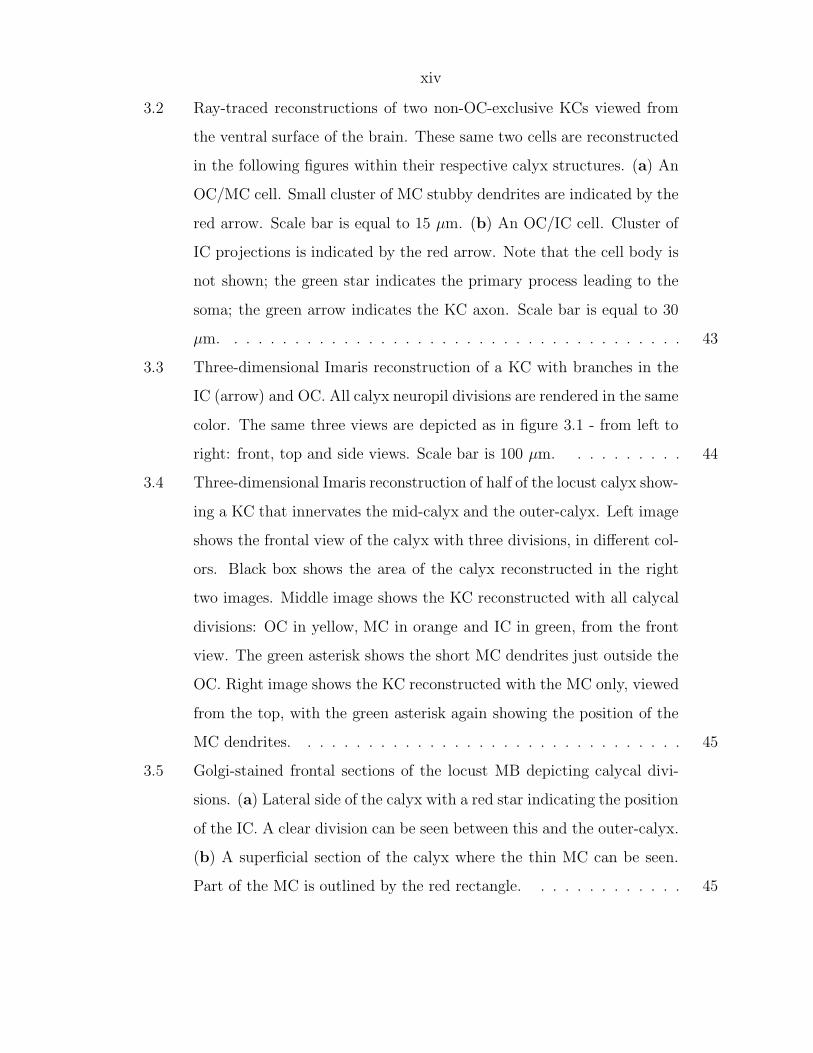
3.2 Ray-traced reconstructions of two non-OC-exclusive KCs viewed from
the ventral surface of the brain. These same two cells are reconstructed
in the following figures within their respective calyx structures. (a) An
OC/MC cell. Small cluster of MC stubby dendrites are indicated by the
red arrow. Scale bar is equal to 15 µm. (b) An OC/IC cell. Cluster of
IC projections is indicated by the red arrow. Note that the cell body is
not shown; the green star indicates the primary process leading to the
soma; the green arrow indicates the KC axon. Scale bar is equal to 30
µm. . . . . . . . . . . . . . . . . . . . . . . . . . . . . . . . . . . . . . 43
3.3 Three-dimensional Imaris reconstruction of a KC with branches in the
IC (arrow) and OC. All calyx neuropil divisions are rendered in the same
color. The same three views are depicted as in figure 3.1 - from left to
right: front, top and side views. Scale bar is 100 µm. . . . . . . . . . 44
3.4 Three-dimensional Imaris reconstruction of half of the locust calyx show-
ing a KC that innervates the mid-calyx and the outer-calyx. Left image
shows the frontal view of the calyx with three divisions, in different col-
ors. Black box shows the area of the calyx reconstructed in the right
two images. Middle image shows the KC reconstructed with all calycal
divisions: OC in yellow, MC in orange and IC in green, from the front
view. The green asterisk shows the short MC dendrites just outside the
OC. Right image shows the KC reconstructed with the MC only, viewed
from the top, with the green asterisk again showing the position of the
MC dendrites. . . . . . . . . . . . . . . . . . . . . . . . . . . . . . . . 45
3.5 Golgi-stained frontal sections of the locust MB depicting calycal divi-
sions. (a) Lateral side of the calyx with a red star indicating the position
of the IC. A clear division can be seen between this and the outer-calyx.
(b) A superficial section of the calyx where the thin MC can be seen.
Part of the MC is outlined by the red rectangle. . . . . . . . . . . . . 45
xv
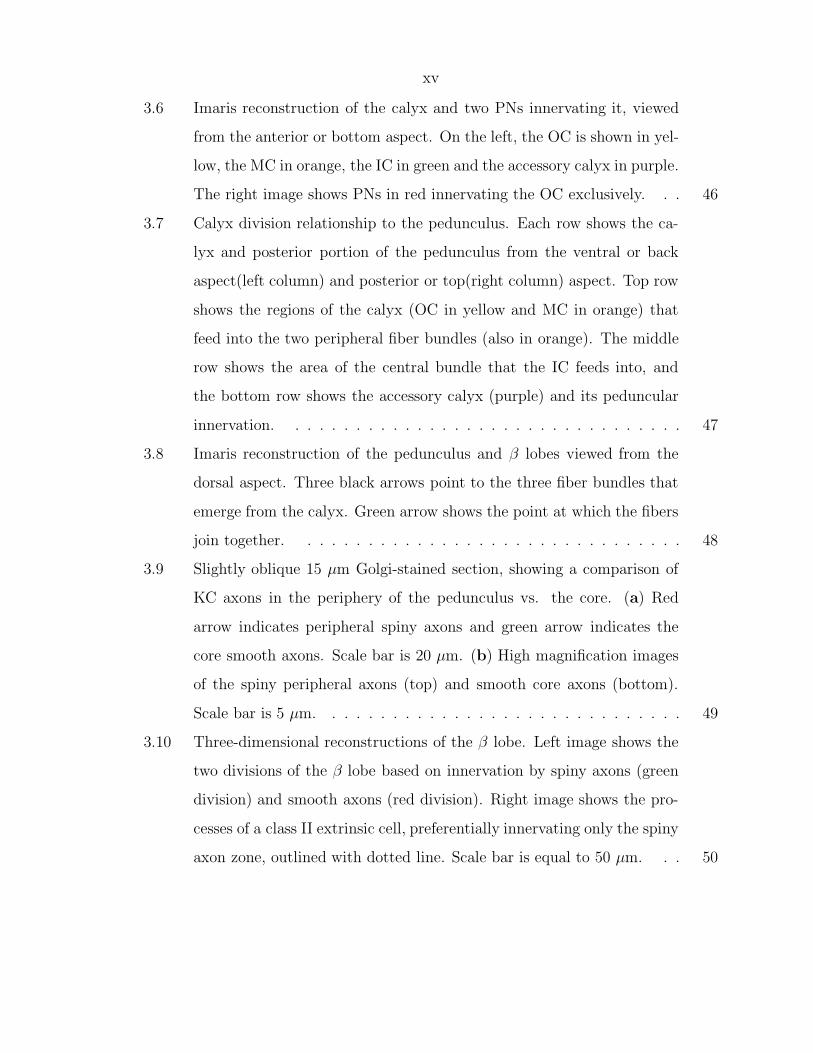
3.6 Imaris reconstruction of the calyx and two PNs innervating it, viewed
from the anterior or bottom aspect. On the left, the OC is shown in yel-
low, the MC in orange, the IC in green and the accessory calyx in purple.
The right image shows PNs in red innervating the OC exclusively. . . 46
3.7 Calyx division relationship to the pedunculus. Each row shows the ca-
lyx and posterior portion of the pedunculus from the ventral or back
aspect(left column) and posterior or top(right column) aspect. Top row
shows the regions of the calyx (OC in yellow and MC in orange) that
feed into the two peripheral fiber bundles (also in orange). The middle
row shows the area of the central bundle that the IC feeds into, and
the bottom row shows the accessory calyx (purple) and its peduncular
innervation. . . . . . . . . . . . . . . . . . . . . . . . . . . . . . . . . 47
3.8 Imaris reconstruction of the pedunculus and β lobes viewed from the
dorsal aspect. Three black arrows point to the three fiber bundles that
emerge from the calyx. Green arrow shows the point at which the fibers
join together. . . . . . . . . . . . . . . . . . . . . . . . . . . . . . . . 48
3.9 Slightly oblique 15 µm Golgi-stained section, showing a comparison of
KC axons in the periphery of the pedunculus vs. the core. (a) Red
arrow indicates peripheral spiny axons and green arrow indicates the
core smooth axons. Scale bar is 20 µm. (b) High magnification images
of the spiny peripheral axons (top) and smooth core axons (bottom).
Scale bar is 5 µm. . . . . . . . . . . . . . . . . . . . . . . . . . . . . . 49
3.10 Three-dimensional reconstructions of the β lobe. Left image shows the
two divisions of the β lobe based on innervation by spiny axons (green
division) and smooth axons (red division). Right image shows the pro-
cesses of a class II extrinsic cell, preferentially innervating only the spiny
axon zone, outlined with dotted line. Scale bar is equal to 50 µm. . . 50
xvi
3.11 KC axon morphology within the β lobe. (a) Imaris reconstruction of the
β lobe viewed from the black arrow shown figure 3.10. White dotted line
shows the position of the Golgi section in (b). (b) Golgi-stained section
of the β lobe showing spiny axons at the medial edge and smooth axons
at the posterior edge. . . . . . . . . . . . . . . . . . . . . . . . . . . . 51
3.12 The spiny axon division of the β lobe exhibits a non-fluorescent core
which KCs do no innervate. Scale bars are 50 µm. (a) 15 µm Golgi
section showing a superficial slice of the spiny axon division. Red arrow
indicates core. (b) 3 µm optical slice of intrinsic fluorescence showing
the beta lobe at the same angle as in part (a). Red arrow indicates core. 51
3.13 Imaris reconstruction of two CII extrinsic cells within the beta lobe.
Black arrow indicates the core of the spiny axon division shown in figure
3.12. P: peduncular processes; α: α lobe processes. . . . . . . . . . . . 52
3.14 Schematic of the locust brain, showing the position of a class I extrinsic
cell. Ray-traced reconstruction of a single LY-filled cell overlaid on a
schematic of the locust brain. Soma lies in the pars intercerebralis,
between the two MB calyces. The cell’s processes innervate the MB
lobes and the posterior end of the pedunculus. An extension of the β
lobe process innervates the LH. Sparse fibers are seen in the midbrain
area. Scale bar is equal to 200 µm. . . . . . . . . . . . . . . . . . . . . 54
3.15 Schematic of the locust brain, showing the position of a class II extrinsic
cell. The cell image is a ray-traced reconstruction of one cell filled with
the dye LY, overlaid on a brain schematic. Soma lies in the LH, and
processes are sent to the MB lobes, pedunculus, IC and MC. Diffuse
processes are also seen in the LH, off the cell’s primary neurite as it
passes to the MB. Scale bar is equal to 200 µm. . . . . . . . . . . . . 55
3.16 Reconstruction of a pair of CII cells (green) along with the MB neuropil
(in red), from the frontal view. Extensive innervation of both lobes and
pedunculus is visible. LH, MC and IC innervation are also visible. Scale
bar is equal to 100 µm. . . . . . . . . . . . . . . . . . . . . . . . . . . 59
xvii
3.17 1 µm confocal image of the calyx from a stack of the pair of the LY-filled
CII cells depicted in figure 3.16. Red arrows indicate the processes of
the CII cells innervating the IC. Scale bar is equal to 100 µm. . . . . 60
3.18 20 µm thick ray-traced projection of several images from a confocal stack
of the β lobe of the pair of filled CII cells depicted in figure 3.16. Pairs
of red arrows indicate pairs of identical fibers from each cell. Scale bar
is equal to 25 µm. . . . . . . . . . . . . . . . . . . . . . . . . . . . . . 60
3.19 Ray-traced reconstruction of three PNs filled with LY, showing the en-
tirety of processes with innervated neuropils labeled. Frontal view. . . 61
3.20 Three-dimensional Imaris reconstruction of the set of PNs in 3.19, in-
cluding the OC and the LH. The red bulb that is labeled as the LH is
a defined area visible autofluorescently, and in both Bodian and Golgi
stains. This same bulb is innervated by both PN terminals (as shown)
and extrinsic cell processes. . . . . . . . . . . . . . . . . . . . . . . . . 62
4.1 Comparison of the three types of OC-exclusive cells, shown from the
angle that best depicts classification. (a) An OC-exclusive fan-shaped
cell viewed from the front or ventral aspect. This cell is also shown in
figure 4.2. (b) An OC-exclusive bipartite cell viewed from the side or
lateral aspect. This cell is also shown in figures 4.5(b) and 4.6(b). (c)
An OC-exclusive single-tree cell viewed from the front or ventral aspect.
This cell is also shown in figure 4.12(b). . . . . . . . . . . . . . . . . . 66
4.2 (a) Imaris reconstructions of an OC-exclusive, fan-shaped cell from the
front, top and side views, from left to right, respectively. (b) Ray-traced
reconstruction of the cell in part (a) in the same three views. Green stars
indicate the primary neurite from the soma (soma not shown) and green
arrows indicate the axon. . . . . . . . . . . . . . . . . . . . . . . . . . 67
xviii
4.3 Ray-traced reconstructions of OC-exclusive fan-shaped cells in three
views (as before). (a) Green arrows indicate axon. Note the cluster of
somata indicated by green stars. (b) Green stars indicate primary neu-
rite from soma (soma not shown) and green arrows indicate the cell’s
axon. . . . . . . . . . . . . . . . . . . . . . . . . . . . . . . . . . . . . 68
4.4 Ray-traced reconstructions of OC-exclusive fan-shaped cells in three
views (as before). (a) Green stars indicated primary neurite from soma
(soma not shown) and green arrows indicate the cell’s axon. (b) Green
stars indicate the soma and green arrows indicate the cell’s axon. . . . 69
4.5 (a-c) Imaris reconstructions of OC-exclusive bipartite cells from front,
top and side views (left to right). Ray-tracings of these three cells are
shown in the following figure. . . . . . . . . . . . . . . . . . . . . . . . 70
4.6 (a-c) Ray-traced reconstructions of the OC-exclusive cells depicted in
figure 4.5 in same three views as before. Green stars indicate the primary
neurite from the soma (somata not shown), and green arrows indicate
the axon. . . . . . . . . . . . . . . . . . . . . . . . . . . . . . . . . . . 71
4.7 Ray-traced projections of an OC-exclusive bipartite cell, from three
views. Green stars indicate the soma (a cluster of somata were stained,
though only one cell’s processes are visible). Green arrows indicate ax-
onal projections. . . . . . . . . . . . . . . . . . . . . . . . . . . . . . . 72
4.8 (a-c) Ray-traced reconstructions of OC-exclusive bipartite cells in three
views. Green stars indicate the primary neurite to soma (somata not
shown) and green arrows indicate a cell’s axonal projection. . . . . . . 73
4.9 (a-d) Ray-traced reconstructions of OC-exclusive bipartite cells in three
views. Green stars indicate the primary neurite to soma (soma is shown
for only the cell in figure (d)) and green arrows indicate a cell’s axonal
projection. . . . . . . . . . . . . . . . . . . . . . . . . . . . . . . . . . 74
4.10 (a) Imaris reconstruction of an OC-exclusive single-tree cell in two views.
(b) Ray-traced projection of a single-tree cell. . . . . . . . . . . . . . 75
xix
4.11 Ray-traced reconstructions of OC-exclusive single-tree cells in three views.
Green stars indicate the primary neurite to soma (somata not shown)
and green arrows indicate a cell’s axonal projection. . . . . . . . . . . 76
4.12 (a-c) Ray-traced reconstructions of OC-exclusive single-tree cells in three
views. Green stars indicate the primary neurite to soma (somata not
shown) and green arrows indicate a cell’s axonal projection. . . . . . . 77
4.13 The mid-calyx in relation to the outer-calyx (yellow). The MC (orange)
is shown connected to the parts of the pedunculus to which it projects.
Left hand figure is viewed from the dorsal or back aspect; right hand
figure is viewed from the posterior or top aspect. Note that the IC and
accessory calyx are not depicted. . . . . . . . . . . . . . . . . . . . . . 78
4.14 (a) Imaris reconstructions of an OC/MC cell, reconstructed with outer-
calyx (yellow), mid-calyx (orange) and inner-calyx (green). Green star
indicates MC processes of the cell. (b) Ray-traced projection of the cell
in part (a) in three views. Red arrow indicates mid-calyx processes, and
green arrows indicate the cell’s axon. . . . . . . . . . . . . . . . . . . 79
4.15 Ray-traced projection of three OC/MC cells. Green stars indicate the
primary neurite from the soma (somata not shown), green arrows indi-
cate the cell’s axon and red arrows indicates MC projections/varicosities. 80
4.16 Imaris reconstruction showing the divisions of the calyx; IC is green,
MC is orange and OC is yellow. Left hand figure is a view from the
dorsal or back aspect of the brain and right hand figure is a view from
the posterior or top aspect. . . . . . . . . . . . . . . . . . . . . . . . . 81
4.17 (a) Imaris reconstructions of an OC/IC cell in three views. Black arrows
indicate the cell’s IC processes. (b) Ray-traced projection of the cell
depicted in (a). Green stars indicate primary neurite from the soma,
green arrows indicate the axon, and red arrows indicate the cell’s IC
processes. . . . . . . . . . . . . . . . . . . . . . . . . . . . . . . . . . 82
4.18 (a) Imaris reconstruction of an OC/IC cell in three views. . . . . . . . 83
xx
4.19 Ray-traced projection of another OC/IC cell in three views. Green stars
indicate the primary neurite (soma not shown), green arrows indicate
the axon, and red arrows indicate the cell’s IC processes. . . . . . . . 84
4.20 Imaris projection of three KCs stained concurrently in one brain, from
the front, top and side views. All three cells depicted here are OC-
exclusive cells. . . . . . . . . . . . . . . . . . . . . . . . . . . . . . . . 85
4.21 Imaris reconstruction of three cells filled in one brain. Green cell (left-
most cell in front and top views) is an OC/IC cell, while the other two
cells are OC-exclusive cells. . . . . . . . . . . . . . . . . . . . . . . . . 86
4.22 Imaris reconstruction of two KCs filled in one brain. Red cell is an
OC/IC cell, and green cell is an OC-exclusive bipartite cell. . . . . . . 86
4.23 (a-b) Imaris reconstructions of two pairs of OC-exclusive cells. Due to
their close resemblance, the two cells in each pair were not separable.
(c) Ray-traced reconstruction of the side view of the cells shown in part
(a). Red arrows indicate the two different cells. . . . . . . . . . . . . . 87
4.24 A ray-traced projection of a class I extrinsic cell. . . . . . . . . . . . . 90
4.25 Ray-traced projection of the heel region of the MB, showing six branches
(red arrows) of a CI extrinsic cell, corresponding to the NADPH di-
aphorase positive zones shown in figure 4.27. . . . . . . . . . . . . . . 91
4.26 Ray-traced projection of the LH; CI terminals in the LH lobe are orange
and indicated by the red arrow. . . . . . . . . . . . . . . . . . . . . . 91
4.27 NADPH diaphorase staining in the brain of the locust. Red arrows
indicate two of six immunoreactive lamina that begin in the peduncular
heel and continue up into the α lobe. Adapted from [67]. . . . . . . . 92
xxi
4.28 Odor responses of a class I extrinsic cell. (a) Ten trials with one odor
(octanol). Each line (in blue) is one 10 second trial, where the odor
was presented from between seconds 2 and 3 (as indicated by red line).
Horizontal scale bar is equal to 1 second, vertical scale bar is equal to
20 mV. (b) Histograms of spike counts over ten trials with each of four
odors: hexanol, mint, octanol and cherry. Each bin is the sum of 200
mS bins, odors presented during bins 5-10. Horizontal scale bar is equal
to 1 second, vertical scale bar is equal to 10 spikes. . . . . . . . . . . . 93
4.29 CII extrinsic cells. (a) Ray-traced projection of a single CII extrinsic
cell, showing its soma in the lateral horn (LH) and its innervation of the
MB lobes and pedunculus. (b) Ray-traced projection of a pair of CII
cells filled concurrently. . . . . . . . . . . . . . . . . . . . . . . . . . . 96
4.30 Imaris reconstruction of the pair of CII extrinsic cells shown in figure
4.29(b). The MB neuropil (α and β lobes and calyx) is reconstructed in
red. Note that this is a ventral view, but the brain is tilted back slightly. 97
4.31 6 µm thick ray-traced projection of the β lobe processes of the pair of
CII extrinsic cells shown in figures 4.29(b) and 4.30. Red arrows indicate
the processes that branch off at regular intervals into the lobe. . . . . 98
4.32 Peduncular and calycal innervation of CII extrinsic cells. (a) Red arrow
indicates the fine fibers innervating the pedunculus. (b) Peduncular and
calyx innervation of the same cells as in part (a). Red arrows indicated
the MC and IC divisions. . . . . . . . . . . . . . . . . . . . . . . . . . 98
4.33 Comparison of CII extrinsic cell fill with Bodian stained processes. (a)
A 10 µm Bodian slice showing a bundle of processes entering the MB
lobes that correspond to the CII cell processes. (b) A high magnification
10 µm ray-projection of the primary neurite of the CII cell innervating
the MB lobes. . . . . . . . . . . . . . . . . . . . . . . . . . . . . . . . 99
xxii
4.34 Comparison of CII extrinsic cell fill with Bodian stained somata. (a) A
10 µm Bodian slice showing possible candidates for CII somata in the
lateral horn. (b) A 10 µm ray-projection exhibiting the soma of a CII
extrinsic cell in the lateral horn. . . . . . . . . . . . . . . . . . . . . . 99
4.35 Ray-traced projection of a brain stained for GABA immunoreactivity.
Red arrow indicates a cluster of GABA immunoreactive cells that cor-
respond in position to CII somata position. . . . . . . . . . . . . . . . 100
4.36 Imaris reconstruction of the antennal lobe (yellow) showing the position
of the projection neuron somata (red). Left image shows the frontal
view, with the position of the antennal nerve indicated by the black
arrow. Right image shows a side view in which the antennal nerve is in
back. The black star indicates the position of the antennocerebral tract. 102
4.37 (a) Imaris reconstruction of a single PN within the AL from the frontal
(left image) and posterior (right image) views. (b) Ray-traced projection
of the cell in part (a), from the same two views. Green stars indicate
the cell’s soma and green arrows indicate the axon. . . . . . . . . . . 103
4.38 (a) Imaris reconstruction of a single PN within the AL from the frontal
(left image) and posterior (right image) views. Note that there are two
somata filled, but only one cell’s processes are visible. (b) Ray-traced
projection of the cell in part (a), from the same two views. . . . . . . 104
4.39 (a) Imaris reconstruction of a single PN within the AL from the frontal
(left image) and posterior (right image) views. (b) Ray-traced projection
of the cell in part (a), from the same two views. Note that the soma is
missing. . . . . . . . . . . . . . . . . . . . . . . . . . . . . . . . . . . 105
4.40 (a) Imaris reconstruction of a single PN within the AL from the frontal
(left image) and posterior (right image) views. (b) Ray-traced projection
of the cell in part (a), from the same two views. . . . . . . . . . . . . 106
4.41 Ray-traced projections of two different PNs from the same two views as
before. Note that both cells are missing their somata. . . . . . . . . . 107
xxiii
4.42 (a) Imaris reconstruction of a single PN within the AL from the frontal
(left image) and posterior (right image) views. (b) Ray-traced projection
of the cell in part (a), from the same two views. Note that there are two
somata filled, but only one cell’s processes are visible. . . . . . . . . . 108
4.43 (a) Imaris reconstruction of a single PN within the AL from a slightly
oblique frontal view (left image) and the posterior (right image) view.
(b) Ray-traced projection of the cell in part (a), from the same two
views. Note that the soma is missing. . . . . . . . . . . . . . . . . . . 109
4.44 (a) Imaris reconstruction of a single PN within the AL from the frontal
(left image) and posterior (right image) views. (b) Ray-traced projection
of the cell in part (a), from the same two views. Note that the soma is
missing. . . . . . . . . . . . . . . . . . . . . . . . . . . . . . . . . . . 110
4.45 (a) Imaris reconstruction of a single PN within the AL from the frontal
(left image) and posterior (right image) views. (b) Ray-traced projection
of the cell in part (a), from the same two views. Green arrows indicate
the axon, and the green stars indicate the soma. Note that this PN’s
soma is in a different location that the other PNs shown above. . . . . 111
4.46 Ray-traced projections of two different PNs from the same two views as
before. Note that the cell in part (b) is missing its soma. . . . . . . . 112
4.47 A pair of PNs filled concurrently, showing different radii in the same AL.
These are the PNs shown in figures 4.38 and 4.42. (a) The same pair
shown in an Imaris reconstruction from the frontal and posterior views.
(b) Ray-traced projections of the cells shown in (a), in the same two
views. Overlaps or areas where cells could not be separated are shown
in yellow. . . . . . . . . . . . . . . . . . . . . . . . . . . . . . . . . . . 113
4.48 A pair of PNs filled concurrently, showing different radii in the same
AL. Green PN is also shown in figure 4.37. (a) The pair of PNs shown
in an Imaris reconstruction, from the frontal and posterior views. (b)
Ray-traced projections of the cells shown in (a), in the same two views,
but note that the posterior image is slightly turned about a vertical axis. 114
xxiv
4.49 A pair of PNs filled concurrently, showing different radii in the same AL.
These are the PNs shown in figures 4.39 and 4.44. (a) The same pair
shown in an Imaris reconstruction from the frontal and posterior views.
(b) Ray-traced projections of the cells shown in (a), in the same two
views. Overlaps or areas where cells could not be separated are shown
in yellow. Note that cell bodies are missing. . . . . . . . . . . . . . . 115
4.50 (a) Ray-traced projection of three PNs in one AL. (b) Ray-traced pro-
jection of three PNs in one AL. (c) Ray-traced projection of two PNs in
one AL. . . . . . . . . . . . . . . . . . . . . . . . . . . . . . . . . . . . 116
4.51 Three cells with the same radius size. (a) Ray-projection of three PNs
stained concurrently within one AL. Two are shown in green and one
is shown in red. Scale bar is equal to 70 µm. (b) Close up of the
area around one set of glomeruli for cells in part (a). The two green
cells are visible as different cells because one is less bright than the
other (indicated by white arrows). The two cells innervate the same
glomerulus. Scale bar is equal to 35 µm. . . . . . . . . . . . . . . . . 117
4.52 Calyx innervation of PN axons. Imaris reconstructions of PNs within
the OC, viewed from the ventral and posterior aspects. (a) Single PN
in the OC. (b) Two PNs in the OC. (c) Three PNs in the OC. . . . . 119
4.53 Relationship of PN axons and KC dendrites within the calyx. Left hand
figure shows an Imaris reconstruction of both cells within the calyx.
Right hand figure shows a high magnification ray-projected image of
the same set of cells; KC is shown in green, PN is shown in red, and
areas of over lap appear in yellow. . . . . . . . . . . . . . . . . . . . . 120
4.54 Relationship of the lateral horn lobe to the calyx. (a) Lateral view of
Imaris reconstructed of a PN (as shown in figure 4.52[c]) within the
calyx and LH lobe. (b) Dorsal view of the same reconstruction. . . . . 120
4.55 10 µm thick Bodian-stained section showing the bundle of PN fibers (red
arrow) as they innervate the LH lobe (red star). . . . . . . . . . . . . 121
xxv
5.1 Schematic of the locust antennal lobe showing innervation pattern in
one plane. Dark blue and green cells innervate the same glomeruli and
lie within the same plane. Light blue cell lies in the plane with the other
two cells, but innervates glomeruli at a different radius. . . . . . . . . 126
5.2 Schematics of the proposed structure of the MB and its KC innervation.
(a) Frontal view of the calyx, showing the pattern of innervation of
an OC-exclusive cell (red), an OC/MC cell (blue) and an OC/IC cell
(green). It is possible that OC-exclusive cells innervate the spiny axon
division of the β lobe (shown in gray). (b) Two more views of the MB;
top schematic is the calyx viewed from above (topmost arrow in part [a]),
showing representative innervation of the three types of KCs. Bottom
schematic is a view of the β lobe (bottom arrow in part[a]) showing the
spiny axon and smooth axon divisions within the lobe. It is possible that
OC/IC cells innervate the smooth axon division of the β lobe. Note also
the core of the spiny axon division, as described in chapter 3. . . . . . 127
5.3 Schematics of the proposed structure of the MB and its class II extrinsic
cell innervation. (a) Frontal view of the MB, with the areas of CII inner-
vation shown in yellow. (b) Two more views of the MB; top schematic
is the calyx viewed from above (topmost arrow in part [a]), showing rep-
resentative innervation of the CII extrinsic cells. Bottom schematic is
a view of the β lobe (bottom arrow in part[a]), showing the spiny axon
and smooth axon divisions within the lobe. CII extrinsic cells innervate
the lobe in a characteristic ‘C’ shape around the spiny axon division’s
core, in slightly offset areas. Representative of one cell is shown in yel-
low while another is shown in orange. There are postulated to be 9 to
12 CII cells covering the spiny axon division. . . . . . . . . . . . . . . 128
5.4 Schematics of the MB showing the proposed structure of the peduncular
fibers. . . . . . . . . . . . . . . . . . . . . . . . . . . . . . . . . . . . . 131

xxvi
5.5 Frontal schematic of the MB showing the region (in gray) of the α lobe
that contains the axon collaterals of KCs which innervate the smooth
axon division of the β lobe. . . . . . . . . . . . . . . . . . . . . . . . . 132
xxvii
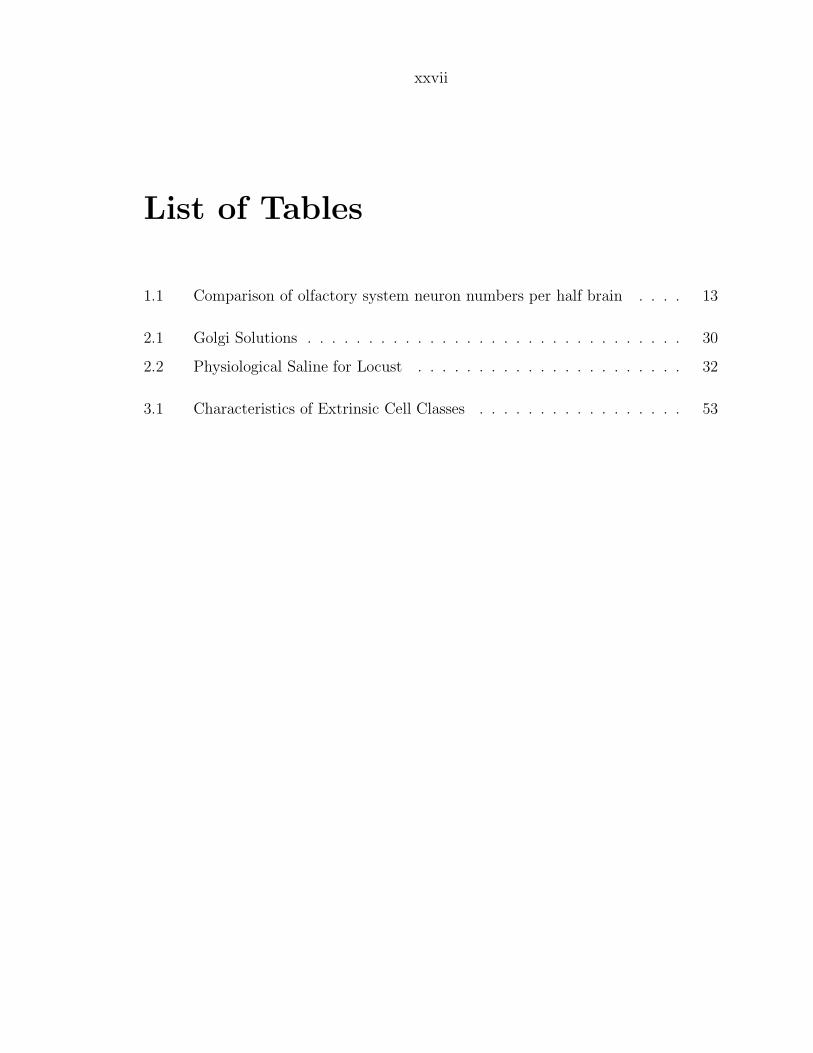
List of Tables
1.1 Comparison of olfactory system neuron numbers per half brain . . . . 13
2.1 Golgi Solutions . . . . . . . . . . . . . . . . . . . . . . . . . . . . . . . 30
2.2 Physiological Saline for Locust . . . . . . . . . . . . . . . . . . . . . . 32
3.1 Characteristics of Extrinsic Cell Classes . . . . . . . . . . . . . . . . . 53