Embed Size (px)
Citation preview

Tŷ Afon, Heol Bedwas Bedwas, Caerffili, CF83 8WT
Tŷ Afon, Bedwas Road Bedwas, Caerphilly CF83 8WT
029 2085 9696 www.hefcw.ac.uk
Cylchlythyr | Circular
Date: 24 November 2017 Reference: W17/33HE To: Heads of higher education institutions in Wales
Principals of directly-funded further education colleges in Wales
Response by: No response required Contact: Name: Ewen Brierley Telephone: 029 2085 9713 Email: [email protected]
This circular provides an overview of the financial position of higher education institutions in Wales. The analysis covers the financial results for the year ended 31 July 2016.
Financial position of higher education institutions in Wales: 2015/16 financial results
If you require this document in an alternative accessible format, please email [email protected].

1
Introduction 1. This circular provides an overview of the financial position of higher
education institutions in Wales. The analysis covers the financial results for the year ended 31 July 2016 (2015/16). The information in this circular has been presented in a similar format to the Financial Health report published by the Higher Education Funding Council for England (HEFCE) for the higher education sector in England and the financial information presented in the tables within this circular are comparable to the equivalent tables published by HEFCE.
Background 2. Financial Reporting Standard (FRS) 102 is the new financial reporting
framework for higher and further education providers for reporting periods starting on or after 1 January 2015, and introduces some significant changes in the way financial performance is reported.
3. The financial results for 2015/16 presented in this circular are consistent
with the new standard and the comparative financial information for 2014/15 has been restated under FRS102. The new financial reporting framework makes it difficult to compare financial results between institutions and against historical trends. Transitional changes reflected in the restated 2014/15 results also make this an atypical year.
4. It is apparent, from the latest financial forecasts received in July 2017, that
a number of institutions and the sector overall are anticipating financial deficits until the funding expected from the implementation of the recommendations of the Review of Higher Education and Student Finance Arrangements in Wales (led by Sir Ian Diamond) starts to be received by institutions from 2019/20 onwards. This, and the increased volatility of financial reporting of income under FRS102, show significant variability in surpluses / deficits, both in the results for 2015/16 and throughout the forecasts. These forecasts will not reflect the Welsh Government’s decision not to increase Full-Time Undergraduate Fees above £9,000.
Financial results 5. The financial results for the higher education sector in 2015/16 show a
financially mixed position overall. Annexes A to C present the financial information for the Welsh Higher Education Institutions in more detail.
6. The sector reported a surplus before other gains and losses and the share
of surplus or deficit in Joint Ventures and associates of £74.8 million (5.0 per cent of total income), compared with a deficit of £(5.5) million ((0.4) per cent of total income) in 2014/15. The sector surplus for 2014/15 as reported under the previous financial reporting framework (UKGAAP) was £60.9 million.

2
7. Some significant transitional accounting changes were introduced as a
result of FRS102, such as the increase in pension provisions for the sector’s multi-employer pension schemes that reduced sector surpluses in 2014/15 by £35 million. If these transitional changes were excluded, the underlying increase in 2015/16 surpluses would be much lower. In addition the impact of the changes in income recognition for Capital grants introduced by FRS102 have significantly increased the sector surplus in 2015/16 by £54.7 million and which will influence the forecasts for future years; however, the amount of capital grant income reported for 2015/16 is not expected to be maintained in future years.
8. At an institutional level, the financial performance for 2015/16 results
ranges from a deficit of 7.3 per cent of total income to a surplus of 17.5 per cent of total income.
9. Three institutions reported deficits in 2015/16, compared with four
institutions in 2014/15. Three institutions reported surpluses of 5% or more of total income. These surpluses were increased due to significant capital grants recognised as income in the year. The capital grants for these institutions contributed £48.8 million to the sector surplus.
10. Cash flow from operating activities increased from 7.1 per cent in 2014/15
to 7.7 per cent of total income in 2015/16. However, unrestricted reserves fell from £878 million (61.2 per cent of income) to £854 million (56.7 per cent of total income) and total net assets fell from £1,562 million to £1,519 million.
11. Total income from research grants and contracts fell 5.5 per cent in
2015/16 compared with 2014/15. However, 2014/15 income was boosted by an estimated £15 million from Research and Development Expenditure Credits from HM Revenue and Customs, which fell to £2 million in 2015/16, with the 2015/16 figure relating to residual claims following closure of the scheme to universities (see Annex A Paragraph 14). Excluding this, the data shows that overall research income remained almost static at £206.7 million in 2015/16.
12. Total fee income from overseas (non-European Union (EU)) students
amounted to £150 million in 2015/16; 4.5 per cent higher than the level reported in 2014/15. This fee income from overseas (non-European Union (EU)) students accounted for 10 percent of total income in 2015/16. Increasing competition from other countries and proposed changes to student immigration rules suggest that maintaining this level of income growth from overseas students may be difficult.
Student recruitment 2016-17 and 2017-18 13. Data from the Higher Education Students Early Statistics (HESES) survey
for the 2016/17 academic year indicates a 6.0 per cent increase in the

3
number of FT undergraduate/PGCE entrants (home and EU). 2016/17 HESES data also indicates a continuing decline in part-time undergraduate total registrations (23,924 to 21,903).
14. For the 2017 cycle, the UCAS application data (Applications to Welsh institutions at the June Deadline 2017) highlights a 5 per cent decline in Welsh applications, an 8 per cent decline in other UK applications and a 5 per cent decline in EU applications, relative to the same point in the previous cycle.
15. UCAS application data for the 2017 cycle indicates that overseas applications have reduced by 5% compared to the same point in the previous year’s cycle.
16. In July 2016 the sector forecast an increase in overseas students between 2015/16 and 2016/17. However, the data and indicators taken together suggest an overconfidence by the sector in student number forecasts
Capital investment 17. Cash flow expenditure on fixed assets in 2015/16 totalled £150.8 million, a
decrease of 17.4 per cent compared with 2014/15. It should be noted that the bulk of this investment was driven by four institutions which contributed 84 per cent of the sector’s capital expenditure. Three institutions reported lower expenditure in the period.
18. Capital expenditure as a percentage of total income varied considerably at
an institutional level, ranging from 0 to 13.6 per cent. 19. Whilst capital investment overall is forecast to continue to grow in response
to the requirements of the student experience and research and innovation infrastructure, the latest estimate for all the Wales institutions is that they still need to invest £168 million1 in their non-residential estate to restore it to a sound baseline condition. Inflationary pressures on the cost of construction are likely to push this figure higher.
20. In order to fund the forecast capital expenditure the Welsh Higher
Education Institutions (HEIs) committed to new borrowing of £353 million during 2015/16, approximately £300 million of which was raised by Cardiff University through a bond issue. Capital grant receipts of £54 million were reported in 2015/16 (2014/15: £18 million). Including service concessions and obligations under finance leases, long-term borrowings have risen in the year from 21.8% of income to 47.4% of income, with significant increases recorded at Cardiff University (see above), Bangor University, Swansea University and the University of Wales Trinity Saint David.
1 HESA Estate Record

4
21. Without increased surpluses and continued government support, there is a risk that Welsh HEIs will be unable to maintain the scale of investment required to meet rising student expectations, build capacity for growth and ensure that they can remain internationally competitive. Government support also fosters confidence among other investors to continue to invest in the sector, including banks’ willingness to lend money. Welsh HEIs’ capacity to lever in funding from other sources, including additional borrowing, is limited and may not be sufficient on its own to meet the sector’s long-term investment needs.
Liquidity and borrowing 22. Long-term external borrowings and obligations under finance leases and
service concessions have increased by 228 per cent; from £312 million at 31 July 2015 to £714 million at 31 July 2016. This is a significant increase and equates to a borrowing level of 47.3 per cent of income. Long-term borrowings alone were £511 million at 31 July 2016 (£199 million at 31 July 2015), which was 33.9% of income (Long-term borrowings for the HE sector in England were 31.2% of income at 31 July 2016). As highlighted above, Cardiff University’s bond issue accounts for £300 million of this increase. There was also an increase in the liquidity days’ ratio, which increased from 120 days of expenditure to 194 days over the same period. Again, much of this increase was due to the fact that Cardiff University received the entire bond proceeds during the year but had spent only £69m on capital projects by the end of July 2016. Most other institutions reported modest increases in liquidity days, with two institutions showing a small reduction. The Welsh HEIs’ net cash position (liquid funds less borrowing) fell from £128.7 million at 31 July 2015 to a net debt position of £(21.0) million at 31 July 2016.
23. The liquidity data is taken as a snapshot of bank and investment balances,
as at 31 July. The main period of capital spending at most institutions happens during the summer months, after 31 July; therefore the available cash, not committed to future capital spending, is likely to be much lower.
Reserves and pension deficits 24. Reserves are an HEI’s total assets less its liabilities and, in very broad
terms, can be used as a proxy for the overall value of an institution. These are the accumulated surpluses of an institution over its lifetime and most of these surpluses have been invested in fixed assets used by the University such as land, buildings and capital equipment. Reserves are not the same as cash, although an institution could dispose of an asset if it was surplus to operational requirements (thereby converting it to cash).
25. Under the new financial reporting framework, reserves are categorised as
either restricted or unrestricted. Unrestricted income and expenditure reserves represent the value of the institution’s accumulated funds through

5
surpluses reported in an HEI’s income statement, where there are no restrictions on the use of funds.
26. After taking into account pension liabilities, the sector reported unrestricted
reserves of £854 million, equivalent to 56.7 per cent of total income. This represents a fall from the previous year, where reported reserves were £878 million (61.2 per cent of total income). The aggregate position masks a significant spread and a concentration of large unrestricted reserves in a small number of institutions, with four institutions reporting 84 per cent of the Welsh HEIs’ total reserves.
27. Under FRS102, reported pension deficits are much higher, with liabilities
relating to the deficit recovery plans for the sector’s multi-employer pension schemes now reflected in institutional balance sheets. As a result of the transition to FRS102, pension liabilities reported by the sector rose from £275 million (under the UK GAAP, the previous financial reporting standard) to £397 million (under FRS102) at 31 July 2015.
28. Reported pension liabilities increased significantly again in 2015/16 to
reach £541 million at 31 July 2016 (a rise of 36.1 per cent). The pension provision was also 44.2 per cent higher than pension liabilities forecast by the sector last year, indicating that earlier projections underestimated the scale of increased pension deficits.
29. The sector’s largest multi-employer pension scheme is the Universities
Superannuation Scheme (USS), with the great majority of current staff working in HEIs that were universities before 1992 being members of this scheme.
30. A complex mix of factors is contributing to the growing pension deficits
across the sector, not least the prevailing economic conditions and the performance of asset investments. The latest interim valuation of the USS scheme shows that the scheme ended the year with a net deficit of £12.6 billion (as at March 2017), compared with the previous year, where the deficit was valued at £10.0 billion (as at March 2016), demonstrating the significant level of volatility in these valuations. The next full triennial valuation was due in 2017.
31. The results of the revaluation of Local Government Pension Schemes
(LGPS) as at 31 March 2016, are also expected to show an increase in the LGPS deficit. With nearly 20 per cent of the sector’s employer contributions paid to these LGPS schemes, an increase in the deficit may lead to increases in employer costs, placing significant financial pressures on HEIs participating in these schemes too.
Financial outlook 32. The Welsh HEIs have had to adapt to a more competitive and uncertain
environment, but there are significant challenges ahead.

6
33. The growing uncertainties and increased competition faced by the sector
will inevitably lead to a greater focus from investors on the underlying financial strength of individual HEIs. Consequently, any fall in confidence levels could restrict the availability of finance in the sector and put significant elements of the investment programme at risk. Falling confidence levels are also likely to lead to a rise in the costs of borrowing.
34. Based on the financial results for the year ended 31 July 2016 our view is
that the sector’s financial position is currently sound overall but with increasing variability in the performance of individual HEIs. However, risks are growing in relation to EU, international and home recruitment and in relation to inflationary cost pressures such as rising construction costs. Pension liabilities also look set to rise across the sector following outcomes of triennial reviews of two of the sector’s major pension schemes: USS and LGPS. The sector faces some significant uncertainties arising from Britain’s forthcoming exit from the European Union, the full impact of which is not yet known. We expect the Welsh HEIs’ financial results for the next financial year 2016/17, and forecasts for subsequent years, to reflect lower financial surpluses, and deficits in some cases, as well as lower future fee income growth projections.
Further information / responses to 35. For further information, contact Ewen Brierley (tel 029 2085 9713; email
Annex A
1
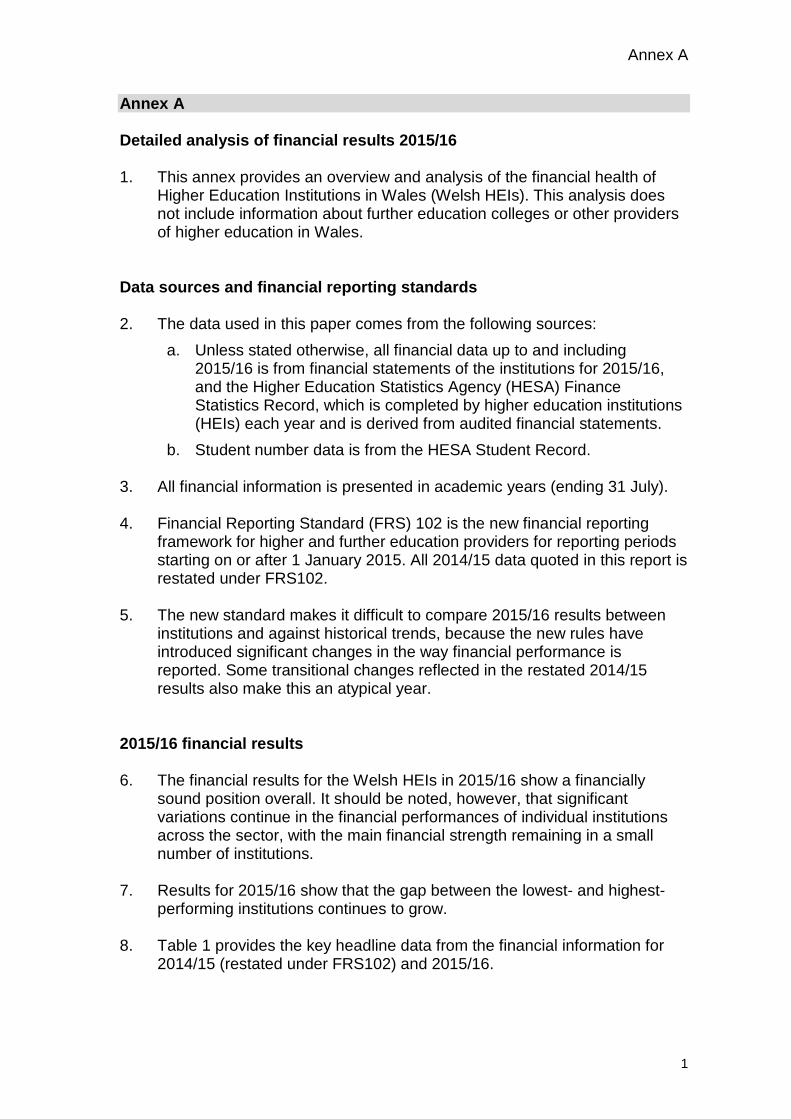
Annex A Detailed analysis of financial results 2015/16 1. This annex provides an overview and analysis of the financial health of
Higher Education Institutions in Wales (Welsh HEIs). This analysis does not include information about further education colleges or other providers of higher education in Wales.
Data sources and financial reporting standards 2. The data used in this paper comes from the following sources:
a. Unless stated otherwise, all financial data up to and including 2015/16 is from financial statements of the institutions for 2015/16, and the Higher Education Statistics Agency (HESA) Finance Statistics Record, which is completed by higher education institutions (HEIs) each year and is derived from audited financial statements.
b. Student number data is from the HESA Student Record. 3. All financial information is presented in academic years (ending 31 July). 4. Financial Reporting Standard (FRS) 102 is the new financial reporting
framework for higher and further education providers for reporting periods starting on or after 1 January 2015. All 2014/15 data quoted in this report is restated under FRS102.
5. The new standard makes it difficult to compare 2015/16 results between
institutions and against historical trends, because the new rules have introduced significant changes in the way financial performance is reported. Some transitional changes reflected in the restated 2014/15 results also make this an atypical year.
2015/16 financial results 6. The financial results for the Welsh HEIs in 2015/16 show a financially
sound position overall. It should be noted, however, that significant variations continue in the financial performances of individual institutions across the sector, with the main financial strength remaining in a small number of institutions.
7. Results for 2015/16 show that the gap between the lowest- and highest-
performing institutions continues to grow. 8. Table 1 provides the key headline data from the financial information for
2014/15 (restated under FRS102) and 2015/16.

Annex A
2
Table 1: Summary of key financial indicators Actual
2014/15 (restated)
2015/16
Total income £1,434M £1,508M
(Deficit)/ Surplus2 (£5.5M) £74.8M
(Deficit)/ Surplus as % of total income (0.4%) 5.0%
Cash flow from operating activities £102M £116M
Cash flow from operating activities as % of total income
7.1% 7.7%
Net liquidity as number of days’ expenditure
120 193
External borrowings as % of total income
22.4% 48.4%
Unrestricted reserves3 as % of total income
61.2% 56.7%
9. The remainder of this report looks at different aspects of the financial
results reported by Welsh HEIs in 2015/16.
2 This is the deficit/surplus reported in the ‘Statement of comprehensive income’, before other gains and losses and the share of surplus or deficit in joint ventures and associates. 3 This is the unrestricted income and expenditure reserve reported in the Consolidated and Institution Balance Sheet.

Annex A
3
Income 10. Total income reported by Welsh HEIs in 2015/16 was £1,508 million, an
increase of 5.1 per cent in cash terms compared with 2014/15. Table 2 provides a breakdown of sector income for the last two years.
Table 2: Breakdown of total income for Welsh HEIs
Actual Change
2014/15 (restated) £Million
2015/16 £Million £Million Percentage
Funding council grants4 186.4 183.4 -3.0 -1.6%
Tuition fees and education contracts (home and European Union)
599.9 648.1 48.2 8.0%
Research grants and contracts 220.9 208.6 -12.3 -5.5%
Overseas fee income 143.6 150.1 6.5 4.5%
Other income* 272.4 302.5 30.1 11.1%
Investment income 4.6 8.9 4.3 93.4%
Donations and endowments 6.3 6.3 0.0 00.0%
Total income 1,434.1 1,507.9 73.8 5.1%
* Other income includes capital grants received of £18.3M for 2014/15 and £54.7M for 2015/16. Excluding the impact of capital grants the increase in total income year on year in cash terms reduces to 2.6%. 4 Funding Council grants include funding received from the Welsh Government Department for Education and Skills for FE provision of £37,412 for 2014/15 and £38,540 for 2015/16.

Annex A
4
11. Table 3 provides a breakdown of tuition fee income received in 2015/16
compared with 2014/15. Table 3: Breakdown of home and EU tuition fee income 2014/15 and 2015/16
Actual Percentage change
2014/15 £Million
2015/16 £Million
Full-time undergraduate 491.3 528.0 7.5%
Full-time postgraduate 26.8 24.0 (10.5%)
Part-time undergraduate and postgraduate 19.7 19.6 (0.5%)
Other fees and support grants 62.1 76.5 23.2%
Total home and EU fee income 599.9 648.1 8.0%
Source: 2015/16 financial statements 12. 2015/16 data from the HESA student record indicates that there was an
increase of 2 per cent in home and EU full-time undergraduate students (expressed as full-time equivalents (FTEs)) from 67,010 in 2014/15 to 68,515. This indicates that much of the corresponding increase in income is due to the increase in student fees from 2012-13 replacing the reduced government funding as opposed to increased student numbers.
13. Income from research grants and contracts fell by £12.3 million to £208.6
million in 2015/16, a 5.5 per cent decrease compared with 2014/15. However, 2014/15 income from research grants and contracts was boosted by the receipt of £15.1 million of Research and Development Expenditure Credits (RDEC) from HM Revenue and Customs. RDEC receipts in 2015/16 was much lower at £2.1 million. Without RDEC, research income would have remained almost static in the year. A breakdown of research and contracts income for 2015/16 is provided below at Figure 1.
14. RDEC credits related to a scheme introduced by the UK Government via
the Finance Act 2013, to offer tax incentives to large companies to encourage greater investment in research and development. This scheme has since been amended through legislation so that universities and charities will be unable to claim RDEC in future.

Annex A
5
Figure 1: Breakdown of research and contracts income (2015/16)
Source: HESA Finance Record
15. The sector reported an increase in ‘other income’; from £272.4 million
(19.0 per cent of total income) in 2014/15 to £302.5 million (20.0 per cent) in 2015/16. The significant factor in the increase was the reporting of capital grant income received, which increased from £18.3 million in 2014/15 to £54.7 million in 2015/16. A breakdown of other income for 2015/16 is provided below at Figure 2.
35%
12%12%1%
40%
Research Councils
UK-based charities
European Union Sources
Research and Development Expenditure Credits
Other

Annex A
6
Figure 2: Breakdown of other income (2015/16)
Source: HESA Finance Record
Overseas fee income (non-EU) 16. The HESA student record data shows that, in 2015/16, total overseas
(non-EU) student numbers (FTEs) decreased 12.8 per cent compared with 2014/15, decreasing from 15,350 to 13,385 FTEs.
17. Table 4 shows the change in overseas students broken down by mode and level of study between 2014/15 and 2015/16.
18. In 2015/16 the sector reported fee income from overseas students of
£150.0 million, an increase of £6.5 million and equivalent to a rise of 4.5 per cent compared with 2014/15. In 2015/16 this made up 10.0 per cent of total income across the sector, unchanged from the previous year.
19. A significant risk to Welsh HEIs as well as the UK HE sector is the impact that a decline in overseas students would have on associated fee income and the longer-term financial sustainability of institutions. Areas of potential risk currently facing the sector include the tightening of UK immigration policy, a downturn in the global economy, including that of the UK, and increasing competition from worldwide markets for outwardly mobile students.
26%
30%
2%
5%
18%
0%
19%
Total other services renderedTotal residences and catering operations (including conferences)Grants from local authorities and other grant incomeIncome from health and hospital authoritiesCapital grants recognised in the yearIncome from intellectual property rightsOther operating income

Annex A
7
Table 4: Breakdown of overseas student FTEs by mode and level of study
FT UG FT PGR FT PGT PT UG PT PGR
PT PGT Total FTEs
2014/15 7,585 1,025 5,700 130 140 765 15,350
2015/16 7,345 1,030 4,235 130 160 485 13,385
% change -3% 1% -26% 0% 15% -37% -13%
Student recruitment 2016-17 and 2017-18 20. Data from the Higher Education Students Early Statistics (HESES) survey
for the 2016/17 academic year indicates a 6.0 per cent increase in the number of undergraduate entrants compared with 2015/16.
21. 2016/17 HESES data also indicates a continuing decline in part-time undergraduates (23,924 to 21,903) total registrations.
22. UCAS data5 at June 2017 indicates a 6 per cent decline in applications for
the 2017 cycle. This includes a 5 per cent decline in Welsh applications, an 8 per cent decline in other UK applications and a 5 per cent decline in EU. applications. Overseas applications have decreased by 5 per cent.
23. The changes in student recruitment highlighted by the latest data raise
questions over the sector’s ability to maintain the income growth that has been achieved to date and to achieve the ambitious growth targets that have previously been forecast and potentially brings into focus the significant uncertainty facing the sector. The impact of these risks is still fully to play out across the sector and it is anticipated that Britain’s forthcoming exit from the European Union, increasing global competition in the higher education market, reduced HEFCW funding in 2016/17 and 2017/18, changes to funding arrangements and a volatile economy both in the UK and internationally will impact on future income and the financial stability of HEIs across the sector.
Expenditure 24. In 2015/16, the sector reported total expenditure of £1,433.1 million, a
decrease of 0.6 per cent in cash terms compared with 2014/15 and equivalent to 95% per cent of total income. Table 5 shows a breakdown of the sector’s expenditure in 2014/15 and 2015/16.
5 See www.ucas.com/corporate/data-and-analysis/ucas-undergraduate-releases/2017-cycle-applicant-figures-june-deadline-0 .

Annex A
8
Table 5: Breakdown of expenditure
2014/15 £Million
2015/16 £Million
% change
Staff costs as a % of total income
844.3 58.9%
828.6 54.9%
-1.8%
Other operating expenses as a % of total income
485.4 33.8%
470.8 31.2%
-3.0%
Depreciation as a % of total income
75.5 5.3%
95.3 6.3%
26.2%
Fundamental restructuring costs as a % of total income
6.3 0.4%
0.7 0.1%
-88.9%
Interest and other finance costs as a % of total income
28.2 2.0%
37.7 2.5%
33.7%
Total expenditure as a % of total income
1,439.7 100.4%
1,433.1 95.0%
-0.6%
25. The sector’s largest expenditure relates to staff costs, which totalled
£828.6 million in 2015/16, equivalent to 54.9 per cent of total income. While this represents a decrease of £15.7 million on the level reported in the previous year, 2014/15 staff costs were higher because of transitional changes introduced as a result of FRS102. In particular, the requirement for HEIs to recognise provisions for liabilities relating to the deficit recovery plans for the sector’s multi-employer pension schemes increased staff costs by £35 million in the transitional year (2014/15).
26. Table 6 provides a breakdown of staff costs in 2014/15 under both the old
and new financial accounting standards, alongside staff costs for 2015/16. This information is based on 2015/16 financial statements and shows the effect of the transitional change to pension provisions under FRS102.
Table 6: Breakdown of staff costs
2014/15 £Million
2014/15 (FRS102) £Million
2015/16 (FRS102) £Million
2015/16 change £Million %
Salaries and wages 640 656 653 -3 -0.5
Social security costs 50 50 55 5 10.0
Employer pension costs 100 103 112 9 8.7
Changes to pension provisions (0.3) 35 8 -27 -77.1
Other staff related costs 3 7 2 -5 -71.4
Total staff costs 793 851 830 -21 -2.5
Annex A
9
Surpluses 27. Welsh HEIs’ total surplus6 increased from a deficit of (5.5) million in
2014/15 to a surplus of £74.8 million in 2015/16. Whilst the increase in surplus in 2015/16 is significant, it should be noted that some significant transitional accounting changes were introduced as a result of FRS102, such as the increase in pension provisions for the sector’s multi-employer pension schemes which reduced surpluses in 2014/15 and resulted in a deficit for Welsh HEIs. £54.7 million of the surplus for 2015/16 relates to capital grants recognised in accordance with the new accounting standard. The underlying increase in 2015/16 surpluses (excluding these transitional changes) is much lower.
28. At institutional level, results range from a deficit of 7.3 per cent to a surplus
of 17.5 per cent. This demonstrates the significant level of variation in the financial performance of individual institutions across the sector.
29. Three institutions reported surpluses of over 5 per cent in 2015/16,
compared with none in 2014/15. The high surpluses recorded by two of these institutions were due to one-off income injections capital grants and research income recognition.
Liquidity and cash flow 30. At the end of 2015/16 the Welsh HEIs had net liquidity equivalent to 194
days’ expenditure. This is considerably higher than the level reported at the end of 2014/15, which was 120 days. It is due largely to the £300m bond proceeds received by Cardiff University in the year, a large proportion of which was still held as cash and short-term investments at the year end. No institution had liquidity of less than 33 days, compared with one in 2014/15.
31. The liquidity data is taken as a snapshot of projected bank and investment
balances, as at 31 July. The main period of capital spending at most institutions happens during the summer months, after 31 July; therefore the available cash, not committed to capital spending, is likely to be much lower.
32. As charities, HEIs are obliged to ensure that they remain sustainable and
do not expose themselves to undue risk. Strong liquidity is particularly important given current levels of uncertainty and risk in the sector, and as part of our accountability process, we continue to monitor liquidity levels, to assess whether HEIs are able to maintain sufficient cash levels to manage their risks effectively.
6 Total income less total expenditure, excluding other gains or losses (from investments and fixed asset disposals) and the share of surplus or deficit in joint ventures and associates.

Annex A
10
33. Cash flow from operating activities rose from £102.1 million in 2014/15 to £116.1 million in 2015/16, equivalent to 7.7 per cent of total income.
34. One institution reported negative cash flow in 2015/16 (compared with
three HEIs in 2014/15). Capital expenditure and borrowing 35. Welsh HEIs are continuing to make a substantial investment in
infrastructure to maintain and enhance the academic and student facilities. In 2015/16, capital additions totalled £252 million, an increase of 16.8 per cent compared with 2014/15.
36. Estate Management Statistics data, as at 31 July 2016, showed that the
sector still needed to invest approximately £168 million to bring its non-residential estate up to a sound and operationally safe condition. This cost reflects the investment required to restore the estate to a sound baseline condition not to achieve the standard required to satisfy rising student expectations. This latter investment is essential for enabling HEIs to compete in the increasingly competitive domestic and global market.
37. With no capital grants available from HEFCW and significantly reduced
levels of publicly funded capital grants, Welsh HEIs will need to generate surpluses and operating cash inflows to sustain the level of capital investment needed to attract students and staff, and ensure their long-term sustainability. Increased surpluses provide the positive cash flow needed to fund future investment and meet finance costs including the repayment of borrowings.
38. HEIs will inevitably reassess their capital investment plans in the light of
economic uncertainty, changing building costs (occurring as a result of inflation and the weakening of sterling) and their ability to fund planned investment levels by generating additional cash or increasing borrowing. A reduction in capital investment could lead to under-investment, with institutions that fail to invest sufficiently in infrastructure finding themselves in a weaker market position and at higher risk of financial instability.
Borrowing and obligations under finance leases and service concessions 39. At the end of July 2016, the sector reported external long-term borrowings
of £ 511 million (equivalent to 33.9 per cent of income). This is £312.3 million higher than the level reported at the end of 2014/15, and is due mainly to the issue by Cardiff University of its £300m bond. Under FRS102 all HEIs were required to bring onto their balance sheets the financial assets and liabilities relating to obligations under finance leases and other service concession arrangements (e.g. for student residences). At the end of 2014/15 these liabilities totalled £113.4 million for Welsh HEIs, and increased to £202.9 million by the end of 2015/16.

Annex A
11
40. As borrowing rises in the sector, interest payments will increase. This rise
in ‘fixed costs’ could put pressure on any institution that fails to constrain other costs or to increase income sufficiently.
41. The cost of increased borrowing has to date largely been mitigated by the
exceptionally low interest rates available to the UK HE sector. However, a rise in interest rates could add significant costs, placing increasing financial burden on individual institutions’ sustainability if not well managed.
42. In 2015/16, Welsh HEIs reported interest and other finance costs of £37.7
million (2014/15: £28.2 million), although some of this increase was due to the recognition of interest costs relating to pension deficit recovery plans and changes in the fair value of financial instruments. This finance cost is forecast to increase as a result of the increase in borrowings committed to during 2015/16.
Reserves and pensions 43. Reserves are an HEI’s total assets less its liabilities and, in very broad
terms, can be used as a proxy for the overall value of an institution. These are the accumulated surpluses of an institution over its lifetime and most of these surpluses have been invested in fixed assets used by the University such as land, buildings and capital equipment. Reserves are not the same as cash, although an institution could dispose of an asset if it was surplus to operational requirements (thereby converting it to cash).
44. Under the new financial reporting framework, reserves are categorised as
restricted or unrestricted. Restricted reserves apply where there are restrictions on how an institution can use the funds, such as endowments and donations designated for a specific purpose. Unrestricted reserves7 represent the value of the institution’s accumulated funds through surpluses reported in its income statement, on whose use there are no restrictions.
45. After taking into account pension deficits, the latest financial data shows
that unrestricted reserves fell from £878.1million as at 31 July 2015 (equivalent to 61.2 per cent of total income) to £864.3 million at 31 July 2016 (56.7 per cent of total income). However, the aggregate sector position masks a significant spread and a concentration of large unrestricted reserves in a small number of institutions.
46. Under FRS102, pension deficits are much higher, with liabilities relating to
the deficit recovery plans for the sector’s multi-employer pension schemes now reflected in institutional balance sheets. As a result, pension liabilities
7 This is the unrestricted income and expenditure reserve reported in the Consolidated and Institution Balance Sheet.

Annex A
12
reported as at 31 July 2015 increased from £275 million (under the previous financial reporting standards) to £397 million under FRS102.
47. The latest financial data shows that reported pension liabilities increased
by £143.6 million in 2015/16, to reach £541.1 million at 31 July 2016 (equivalent to a rise of 36.1 per cent). These were also 44 per cent higher than the level of pension liabilities projected by Welsh HEIs last year, suggesting that actuarial pension deficits had been underestimated.
48. The sector’s largest multi-employer pension scheme is the Universities
Superannuation Scheme (USS), with the great majority of current staff working in HEIs that existed before 1992 being members of this scheme.
49. A complex mix of factors is contributing to the growing pension deficits
across the sector, not least the prevailing economic conditions and the performance of asset investments. The latest interim valuation of the USS shows that the scheme ended the year with a net deficit of £12.6 billion (as at March 2017), compared with the previous year, where the deficit stood at £10 billion (as at March 2016), demonstrating the significant level of volatility in these valuations8. The next full triennial valuation was due to commence in 2017.
50. The results of the revaluation of Local Government Pension Schemes
(LGPS) as at 31 March 2016, are also expected to show an increase in the LGPS deficit. With nearly 20 per cent of the sector’s employer contributions paid to these LGPS schemes, an increase in the deficit may lead to increases in employer costs, placing significant financial pressures on HEIs participating in these schemes.
Disclaimer 51. This report, which is based on information provided by HEFCW-funded
higher education institutions, has been prepared for the benefit of HEIs and their stakeholders in general terms. HEFCW cannot reasonably foresee the various specific uses that may be made of this report, and therefore no responsibility is accepted for any reliance any third party may place upon it.
8 See www.uss.co.uk/how-uss-is-run/running-uss/annual-reports-and-accounts.

Annex B
1
Annex B Welsh HEIs consolidated statement of comprehensive income
2014/15 2015/16 restated £k £k INCOME Funding Council grants 186,412 183,494 Home & EU Tuition fees and contracts FTUG 491,376 528,096 Overseas student fee income 143,633 150,090 Other fee and education contract income 108,543 120,045 Research grant and contract income 220,891 208,611 Other income 272,334 302,396 Investment income 4,636 8,862 Donations and endowments 6,310 6,339 Total Income 1,434,135 1,507,933 EXPENDITURE Staff costs 844,329 828,576 Fundamental staff re-structuring costs 6,292 723 Other operating expenses 485,413 470,835 Depreciation 75,463 95,263 Interest and other finance costs 28,166 37,733 Total expenditure 1,439,663 1,433,130 Surplus/(deficit) before other gains/(losses) and share of surplus/(deficit) joint ventures and associates
(5,528) 74,803
Gains/(losses) on disposal of fixed assets 1,026 (6,029) Gains/(losses) on investments (11,670) 10,024 Share of operating surplus/(deficit) in joint venture(s) (210) (1,145) Share of operating surplus/(deficit) in associate(s) (205) (177) Surplus/(deficit) before tax (16,587) 77,476 Taxation (3,338) (454) Surplus/(deficit) for the year (19,925) 77,022 Unrealised surplus on revaluation of land and buildings 0 0 Actuarial gains(losses) in respect of pension schemes (17,798) (119,935) Change in fair value of hedging financial instruments 46 118 Total comprehensive income for the year (37,677) (42,795)

Annex B
2
Welsh HEIs consolidated balance sheet
2014/15 2015/16 Restated £k £k NON-CURRENT ASSETS - Intangible assets 27 515 - Fixed assets 2,095,787 2,228,925 - Heritage assets 8,230 8,263 - Investments 53,885 93,199 - Investment in joint venture(s) 3,535 17,014 - Investment in associate(s) 327 150
Total non-current assets 2,161,791 2,348,066 CURRENT ASSETS - Stock 3,371 2,962 - Trade and other receivables 152,524 149,082 - Investments 182,444 347,442 - Cash and cash equivalents 268,758 362,821 - Other (e.g. assets for sale) 0 0
Total current assets 607,097 862,307 CREDITORS – amounts falling due within one year - Bank overdrafts 616 1,167 - Loans repayable to funding council 0 0 - Bank loans and external borrowing 7,237 9,723 - Obligations under finance leases and service concessions 2,438 6,275 - Other (including grant claw-back) 363,990 303,512
Total creditors (amounts falling due within one year) 374,281 320,677 Share of net current assets /(liabilities) in associate 0 0 Net current assets /(liabilities) 232,816 541,630 Total assets less current liabilities 2,394,607 2,889,696 CREDITORS – amounts due after more than one year - Loans repayable to funding council 0 0 - Bank loans and external borrowing 198,863 511,151 - Obligations under finance leases and service concessions 113,369 202,903 - Other (including grant clawback) 110,501 102,596
Total creditors (amounts falling due within one year) 422,733 816,650 PROVISIONS - Pension provisions 397,504 541,087 - Other provisions 12,808 13,191
Total provisions 410,312 554,278 Total net assets 1,561,562 1,518,768 RESERVES Restricted reserves - Income and expenditure reserve – endowment reserve 95,855 102,816 - Income and expenditure reserve – restricted reserve 7,348 7,575
Unrestricted reserves - Income and expenditure reserve – unrestricted reserve 878,146 854,319 - Revaluation reserve 580,213 554,058
Total reserves 1,562,562 1,518,768

Annex B
3
Welsh HEIs consolidated statement of cash flow
2014/15 2015/16 restated £k £k Cash flow from operating activities - Surplus for the year (after taxation) (19,925) 77,022
Adjustment for non-cash items - Depreciation 74,675 88,760 - Amortisation of intangibles 794 6,503 - Amortisation of goodwill 12,220 4,000 - Loss/(gain) on investments (628) (7,852) - Decrease/(increase) in stock (57) 408 - Decrease/(increase) in debtors (4,796) 1,654 - Increase/(decrease) in creditors 21,525 (64,662) - Increase/(decrease) in pension provisions 69,364 22,357 - Increase/(decrease) in other provisions (8,740) 384 - Share of operating (surplus)/deficit in joint venture 210 1,145 - Share of operating (surplus)/deficit in associate 205 177 - Other (3,870) (4,812)
Adjustment for investing or financing activities - Investment income (entered as negative) (4,636) (8,862) - Interest payable 16,129 23,380 - Endowment income (entered as negative) (1,192) (3,006) - Loss/(gain) on disposal of fixed assets / other FA disposals (956) 366 - Capital grant income (entered as negative) (48,227) (20,874)
Net cash inflow from operating activities 102,095 116,088
Cash flows from investing activities - Proceeds from sale of fixed assets 6,808 19,428 - Proceeds from sale of intangible assets 0 0 - Capital grants receipts 46,965 22,999 - Disposal of non-current asset investments 8,612 15,487 - Withdrawal of deposits 1,164 15,522 - Investment income 4,657 8,874 - Payments to acquire fixed assets (182,514) (150,806) - Payments to acquire intangible assets (6) (51,667) - New non-current asset investments (9,583) (55,748) - New deposits (34,684) (168,633)
Total cash flow from investing activities (158,581) (344,544) Cash flows from financing activities - Interest paid (12,075) (17,596) - Interest element of finance lease and service concession paymts (4,170) (6,734) - Endowment cash received 1,023 1,647 - New secured loans 20,000 23,034 - New unsecured loans 2,328 329,776 - Repayments of amounts borrowed (8,736) (6,867) - New long-term creditor 14,310 0 - Capital element of finance lease and service concession paymts (747) (1,292)
Total cash flow from financing activities 11,933 321,968 Increase/(decrease) in cash and cash equivalents in the year (44,553) 93,512 Cash and cash equivalents at beginning of year 312,695 268,142 Cash and cash equivalents at the end of the year 268,142 361,654
Annex C
1
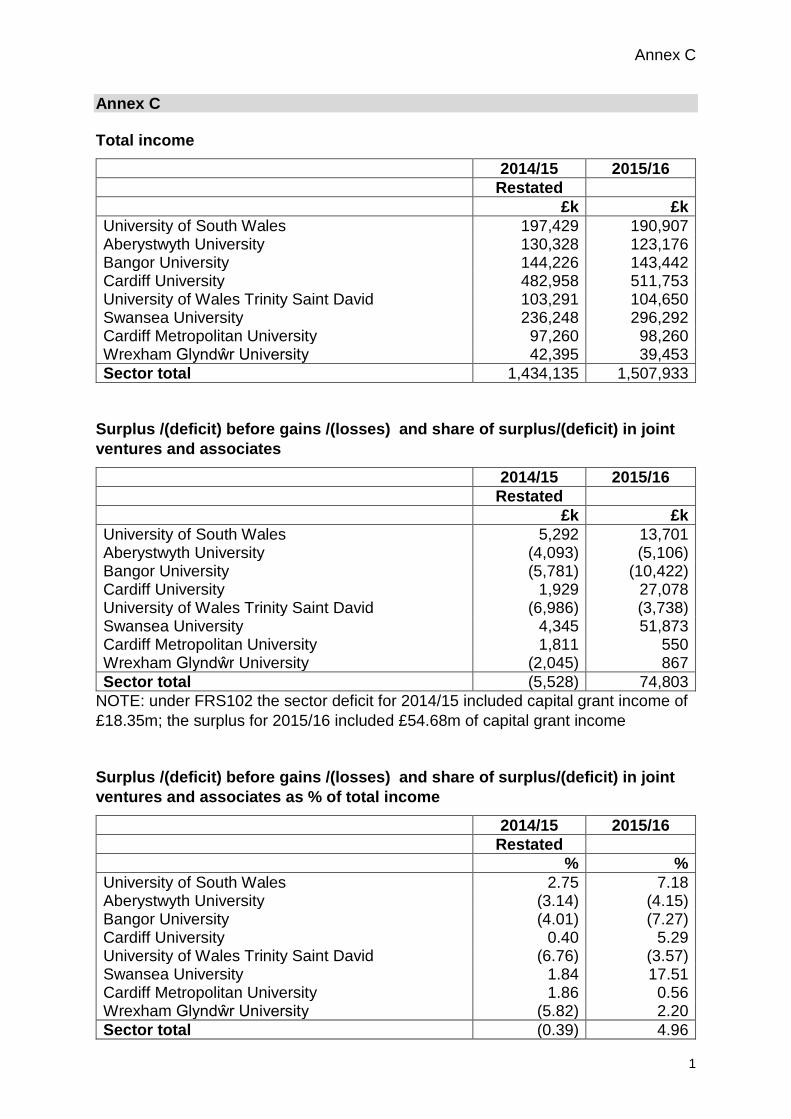
Annex C Total income 2014/15 2015/16 Restated £k £k University of South Wales 197,429 190,907 Aberystwyth University 130,328 123,176 Bangor University 144,226 143,442 Cardiff University 482,958 511,753 University of Wales Trinity Saint David 103,291 104,650 Swansea University 236,248 296,292 Cardiff Metropolitan University 97,260 98,260 Wrexham Glyndŵr University 42,395 39,453 Sector total 1,434,135 1,507,933
Surplus /(deficit) before gains /(losses) and share of surplus/(deficit) in joint ventures and associates 2014/15 2015/16 Restated £k £k University of South Wales 5,292 13,701 Aberystwyth University (4,093) (5,106) Bangor University (5,781) (10,422) Cardiff University 1,929 27,078 University of Wales Trinity Saint David (6,986) (3,738) Swansea University 4,345 51,873 Cardiff Metropolitan University 1,811 550 Wrexham Glyndŵr University (2,045) 867 Sector total (5,528) 74,803
NOTE: under FRS102 the sector deficit for 2014/15 included capital grant income of £18.35m; the surplus for 2015/16 included £54.68m of capital grant income Surplus /(deficit) before gains /(losses) and share of surplus/(deficit) in joint ventures and associates as % of total income 2014/15 2015/16 Restated % % University of South Wales 2.75 7.18 Aberystwyth University (3.14) (4.15) Bangor University (4.01) (7.27) Cardiff University 0.40 5.29 University of Wales Trinity Saint David (6.76) (3.57) Swansea University 1.84 17.51 Cardiff Metropolitan University 1.86 0.56 Wrexham Glyndŵr University (5.82) 2.20 Sector total (0.39) 4.96

Annex C
2
Surplus /(deficit) after gains/(losses) and share of surplus/(deficit) in joint ventures and associates 2014/15 2015/16 Restated £k £k University of South Wales (7,229) 8,478 Aberystwyth University (4,157) (2,509) Bangor University (5,519) (10,073) Cardiff University 1,061 32,114 University of Wales Trinity Saint David (7,084) (3,646) Swansea University 4,136 51,695 Cardiff Metropolitan University 4,250 550 Wrexham Glyndŵr University (2,045) 867 Sector total (16,587) 77,476
Total comprehensive income for the year (after actuarial gains/(losses) in respect of pension schemes) 2014/15 2015/16 Restated £k £k University of South Wales (17,173) (10,531) Aberystwyth University (94) (12,964) Bangor University (3,893) (15,942) Cardiff University (4,982) 10,581 University of Wales Trinity Saint David (11,330) (18,329) Swansea University 4,417 32,158 Cardiff Metropolitan University 84 (19,583) Wrexham Glyndŵr University (4,706) (8,185) Sector total (37,677) (42,795)
Total expenditure 2014/15 2015/16 Restated £k £k University of South Wales 192,137 177,206 Aberystwyth University 134,421 128,282 Bangor University 150,007 153,864 Cardiff University 481,029 484,675 University of Wales Trinity Saint David 110,277 108,388 Swansea University 231,903 244,419 Cardiff Metropolitan University 95,449 97,710 Wrexham Glyndŵr University 44,440 38,586 Sector total 1,439,663 1,433,130

Annex C
3
Staff costs 2014/15 2015/16 Restated £k £k University of South Wales 109,601 108,064 Aberystwyth University 73,398 70,050 Bangor University 87,591 83,967 Cardiff University 284,210 283,321 University of Wales Trinity Saint David 70,963 69,190 Swansea University 137,348 129,601 Cardiff Metropolitan University 56,335 60,939 Wrexham Glyndŵr University 24,883 23,444 Sector total 844,329 828,576
Staff costs as percentage of total income 2014/15 2015/16 restated % % University of South Wales 55.51 57.37 Aberystwyth University 56.32 56.87 Bangor University 60.73 58.54 Cardiff University 58.85 55.36 University of Wales Trinity Saint David 68.70 66.12 Swansea University 58.14 43.74 Cardiff Metropolitan University 57.92 62.02 Wrexham Glyndŵr University 58.69 59.42 Sector total 58.87 54.95
Interest payable (excluding pension interest) 2014/15 2015/16 restated £k £k University of South Wales 3,703 3,594 Aberystwyth University 2,398 3,204 Bangor University 4,933 4,865 Cardiff University 1,169 5,448 University of Wales Trinity Saint David 28 2.077 Swansea University 2,380 4,777 Cardiff Metropolitan University 1,504 1,481 Wrexham Glyndŵr University 15 12 Sector total 16,130 25,458

Annex C
4
Net assets 2014/15 2015/16 restated £k £k University of South Wales 72,950 62,419 Aberystwyth University 162,712 149,748 Bangor University 229,829 213,887 Cardiff University 696,887 707,468 University of Wales Trinity Saint David 145,260 126,931 Swansea University 137,463 169,621 Cardiff Metropolitan University 92,784 73,202 Wrexham Glyndŵr University 23,677 15,492 Sector total 1,561,562 1,518,768
Net liquid assets 2014/15 2015/16 restated £k £k University of South Wales 89,151 98,180 Aberystwyth University 39,666 42,385 Bangor University 19,006 21,970 Cardiff University 171,452 412,453 University of Wales Trinity Saint David 45,143 32,523 Swansea University 58,566 72,403 Cardiff Metropolitan University 26,797 25,879 Wrexham Glyndŵr University 805 3,303 Sector total 450,586 710,263
Net cash inflow from operating activities 2014/15 2015/16 restated £k £k University of South Wales 18,485 27,463 Aberystwyth University 5,976 7,290 Bangor University 12,714 10,345 Cardiff University 35,779 47,658 University of Wales Trinity Saint David (1,036) 171 Swansea University 23,334 11,597 Cardiff Metropolitan University 7,605 9,011 Wrexham Glyndŵr University (762) 2,553 Sector total 102,095 116,088

Annex C
5
Liquidity ratio (days of expenditure) 2014/15 2015/16 restated Days Days University of South Wales 181 215 Aberystwyth University 117 132 Bangor University 50 56 Cardiff University 136 328 University of Wales Trinity Saint David 157 115 Swansea University 97 117 Cardiff Metropolitan University 106 100 Wrexham Glyndŵr University 7 33 Sector total 120 194
Long-term external borrowings and obligations under finance leases and service concessions 2014/15 2015/16 restated £k £k University of South Wales 70,713 67,860 Aberystwyth University 55,277 55,982 Bangor University 61,264 96,334 Cardiff University 17,893 310,220 University of Wales Trinity Saint David 283 17,538 Swansea University 77,801 137,708 Cardiff Metropolitan University 28,762 28,302 Wrexham Glyndŵr University 239 110 Sector total 312,232 714,054
Long-term external borrowings and obligations under finance leases and service concessions as % of total income 2014/15 2015/16 restated % % University of South Wales 35.82 35.55 Aberystwyth University 42.41 45.45 Bangor University 42.48 67.16 Cardiff University 3.70 60.62 University of Wales Trinity Saint David 0.27 16.76 Swansea University 32.93 46.48 Cardiff Metropolitan University 29.57 28.80 Wrexham Glyndŵr University 0.56 0.28 Sector total 21.77 47.35