Embed Size (px)
Citation preview
Interim report Net Insight January– June 2015
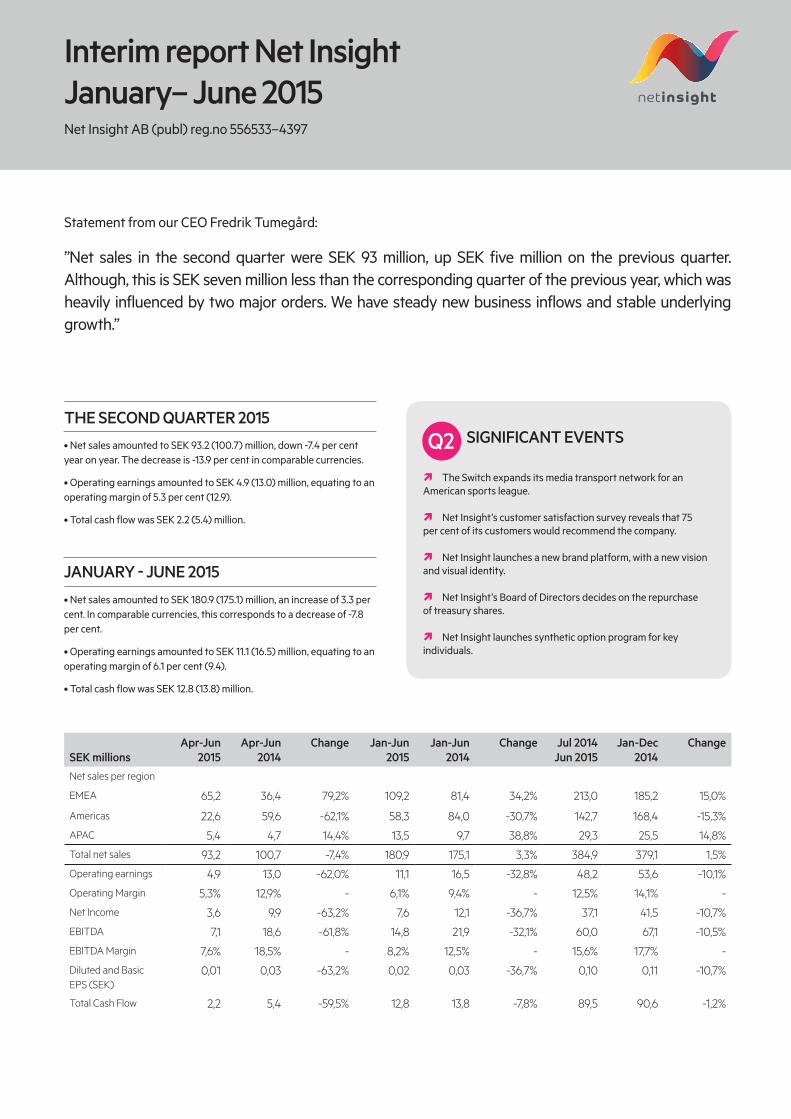
• Net sales amounted to SEK 93.2 (100.7) million, down -7.4 per centyear on year. The decrease is -13.9 per cent in comparable currencies.
• Operating earnings amounted to SEK 4.9 (13.0) million, equating to anoperating margin of 5.3 per cent (12.9).
• Total cash flow was SEK 2.2 (5.4) million.
SIGNIFICANT EVENTSTHE SECOND QUARTER 2015
Q2
Statement from our CEO Fredrik Tumegård:
”Net sales in the second quarter were SEK 93 million, up SEK five million on the previous quarter. Although, this is SEK seven million less than the corresponding quarter of the previous year, which was heavily influenced by two major orders. We have steady new business inflows and stable underlying growth.”
Net Insight AB (publ) reg.no 556533–4397
ì The Switch expands its media transport network for an American sports league.
ì Net Insight’s customer satisfaction survey reveals that 75 per cent of its customers would recommend the company.
ì Net Insight launches a new brand platform, with a new vision and visual identity.
ì Net Insight’s Board of Directors decides on the repurchase of treasury shares.
ì Net Insight launches synthetic option program for key individuals.
JANUARY - JUNE 2015• Net sales amounted to SEK 180.9 (175.1) million, an increase of 3.3 percent. In comparable currencies, this corresponds to a decrease of -7.8 per cent.
• Operating earnings amounted to SEK 11.1 (16.5) million, equating to anoperating margin of 6.1 per cent (9.4).
• Total cash flow was SEK 12.8 (13.8) million.
SEK millionsApr-Jun
2015Apr-Jun
2014Change Jan-Jun
2015Jan-Jun
2014Change Jul 2014
Jun 2015Jan-Dec
2014Change
Net sales per region
EMEA 65,2 36,4 79,2% 109,2 81,4 34,2% 213,0 185,2 15,0%
Americas 22,6 59,6 -62,1% 58,3 84,0 -30,7% 142,7 168,4 -15,3%
APAC 5,4 4,7 14,4% 13,5 9,7 38,8% 29,3 25,5 14,8%
Total net sales 93,2 100,7 -7,4% 180,9 175,1 3,3% 384,9 379,1 1,5%
Operating earnings 4,9 13,0 -62,0% 11,1 16,5 -32,8% 48,2 53,6 -10,1%
Operating Margin 5,3% 12,9% - 6,1% 9,4% - 12,5% 14,1% -
Net Income 3,6 9,9 -63,2% 7,6 12,1 -36,7% 37,1 41,5 -10,7%
EBITDA 7,1 18,6 -61,8% 14,8 21,9 -32,1% 60,0 67,1 -10,5%
EBITDA Margin 7,6% 18,5% - 8,2% 12,5% - 15,6% 17,7% -
Diluted and Basic EPS (SEK)
0,01 0,03 -63,2% 0,02 0,03 -36,7% 0,10 0,11 -10,7%
Total Cash Flow 2,2 5,4 -59,5% 12,8 13,8 -7,8% 89,5 90,6 -1,2%
CEO statement
Net sales decreased by 7.4 per cent in the se-cond quarter. Adjusted for exchange rate fluctua-tions, the downturn was 13.9 per cent. If we consider the first half-year, net sales increased by 3.3 per cent (currency adjusted -7.8 per cent). Gross margin in the quarter was 60.6 per cent, and the operating margin was 5.3 per cent. In absolutely terms, operating earning was SEK 4.9 million. Operating earnings in the first half-year was SEK 11.1 million, corresponding to an operating margin of 6.1 per cent. We also achieved a positive cash flow of SEK 2.2 million in this quarter, and SEK 12.8 mil-lion for the first half-year.
We gained a new terrestrial network customer in Italy, which is promising because terrestrial TV has very strong positioning in the Mediterranean countries, completely unlike northern Europe. EMEA performed well in the quarter, with Western Europe achieving ro-bust sales gains year on year. In the quarter, we secured new business from customers in Italy, the UK and Swe-den. These countries are also our top revenue sources in Western Europe. One notable example is our solution being purchased by SIS LIVE, one of the largest net-work operators in the UK, to transport live video from English Premier league football matches. We also did positive deals in the US and Canada, and are starting to secure a stable presence on these major markets.
We are seeing how a growing number of services, extending to social media, that were previously text based, are now focusing on moving image. We are mig-rating towards a video-centric world, where moving image becomes the dominant way to consume media. This means greater structural demand for effective transmission in real time end to end from production to consumption, where our role lies between production and operator.
The changes in the media market require that the company transforms into a more customer and market-oriented company focusing on sales, marketing, pro-duct development and competence development.
This year’s customer satisfaction survey demonstra-ted that we have very satisfied customers. Our Net Pro-moter Score, the share of customers that would recom-mend us, is 75%, which can be viewed against the sector
average of 25%. As part of our work in getting closer to customers, we brought our key customers together at an event in Stockholm in mid-June. We presented our strategy, our view of market progress and forthcoming products. Customer feedback was positive, which cor-roborated our strategy and view of the market.
We have noted that our customers are satisfied once they have joined our customer base, but that like many other technology companies, we have had a tendency to talk more about technology than its benefit, which is often less easy to understand. There are a lot of compa-nies on the market that we have yet to access, so now, we want to make it easier to become, and remain, a Net Insight customer. Our new branding platform, with its new vision and visual identity, announced on 14 July, is an important component of our growth strategy.
We are now—and want to remain—a growth com-pany. A strong brand is a key prerequisite for this. And we will be able to attract new customers with a clear vision of the media market of the future.
Stockholm, July 2015
Fredrik Tumegård, CEO
Net sales in the second quarter were SEK 93 million, up SEK five million on the previous quarter. Although, this is SEK seven million less than the corresponding quarter of the previous year, which was heavily influenced by two major orders. We have steady new business inflows and stable underlying growth.
”We are now - and want to remain - a growth company. A strong brand is a key prerequisite for this. And we will be able to attract new customers with a clear vision of the media market of the future.
2
REVENUES
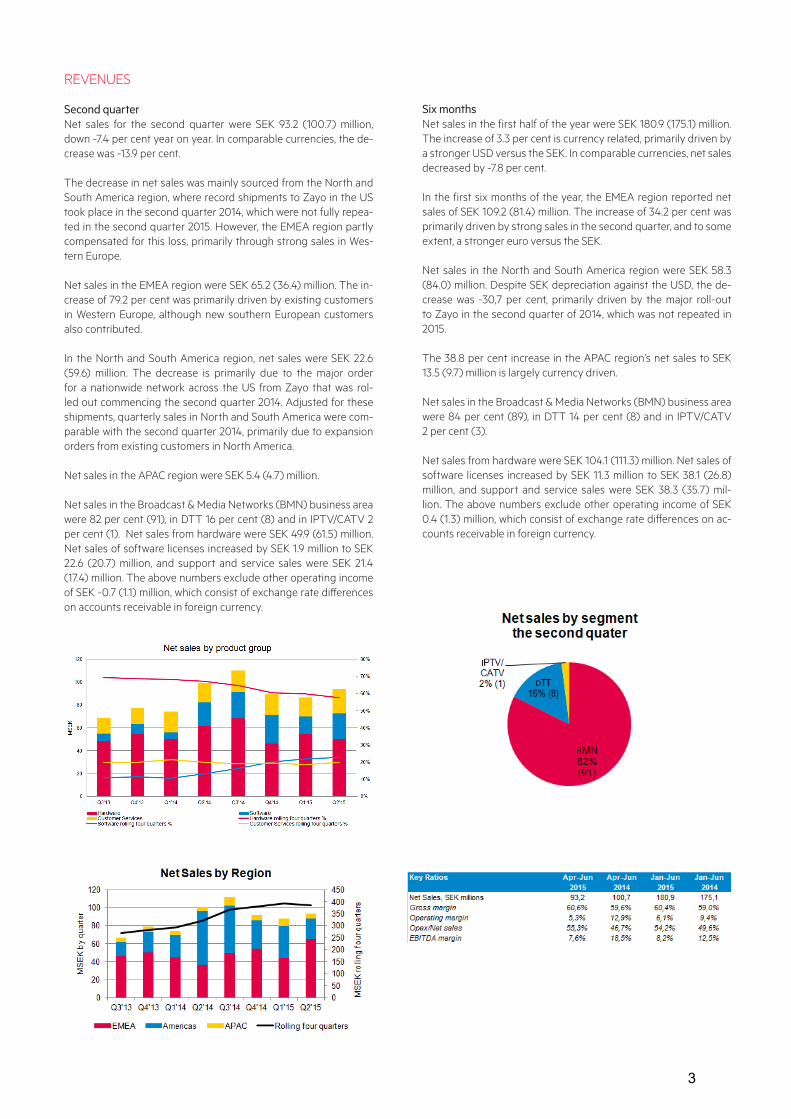
Second quarter Net sales for the second quarter were SEK 93.2 (100.7) million, down -7.4 per cent year on year. In comparable currencies, the de-crease was -13.9 per cent.
The decrease in net sales was mainly sourced from the North and South America region, where record shipments to Zayo in the US took place in the second quarter 2014, which were not fully repea-ted in the second quarter 2015. However, the EMEA region partly compensated for this loss, primarily through strong sales in Wes-tern Europe.
Net sales in the EMEA region were SEK 65.2 (36.4) million. The in-crease of 79.2 per cent was primarily driven by existing customers in Western Europe, although new southern European customers also contributed.
In the North and South America region, net sales were SEK 22.6 (59.6) million. The decrease is primarily due to the major order for a nationwide network across the US from Zayo that was rol-led out commencing the second quarter 2014. Adjusted for these shipments, quarterly sales in North and South America were com-parable with the second quarter 2014, primarily due to expansion orders from existing customers in North America.
Net sales in the APAC region were SEK 5.4 (4.7) million.
Net sales in the Broadcast & Media Networks (BMN) business area were 82 per cent (91), in DTT 16 per cent (8) and in IPTV/CATV 2 per cent (1). Net sales from hardware were SEK 49.9 (61.5) million. Net sales of software licenses increased by SEK 1.9 million to SEK 22.6 (20.7) million, and support and service sales were SEK 21.4 (17.4) million. The above numbers exclude other operating income of SEK -0.7 (1.1) million, which consist of exchange rate differences on accounts receivable in foreign currency.
Six monthsNet sales in the first half of the year were SEK 180.9 (175.1) million. The increase of 3.3 per cent is currency related, primarily driven by a stronger USD versus the SEK. In comparable currencies, net sales decreased by -7.8 per cent.
In the first six months of the year, the EMEA region reported net sales of SEK 109.2 (81.4) million. The increase of 34.2 per cent was primarily driven by strong sales in the second quarter, and to some extent, a stronger euro versus the SEK.
Net sales in the North and South America region were SEK 58.3 (84.0) million. Despite SEK depreciation against the USD, the de-crease was -30,7 per cent, primarily driven by the major roll-out to Zayo in the second quarter of 2014, which was not repeated in 2015.
The 38.8 per cent increase in the APAC region’s net sales to SEK 13.5 (9.7) million is largely currency driven. Net sales in the Broadcast & Media Networks (BMN) business area were 84 per cent (89), in DTT 14 per cent (8) and in IPTV/CATV 2 per cent (3).
Net sales from hardware were SEK 104.1 (111.3) million. Net sales of software licenses increased by SEK 11.3 million to SEK 38.1 (26.8) million, and support and service sales were SEK 38.3 (35.7) mil-lion. The above numbers exclude other operating income of SEK 0.4 (1.3) million, which consist of exchange rate differences on ac-counts receivable in foreign currency.
3
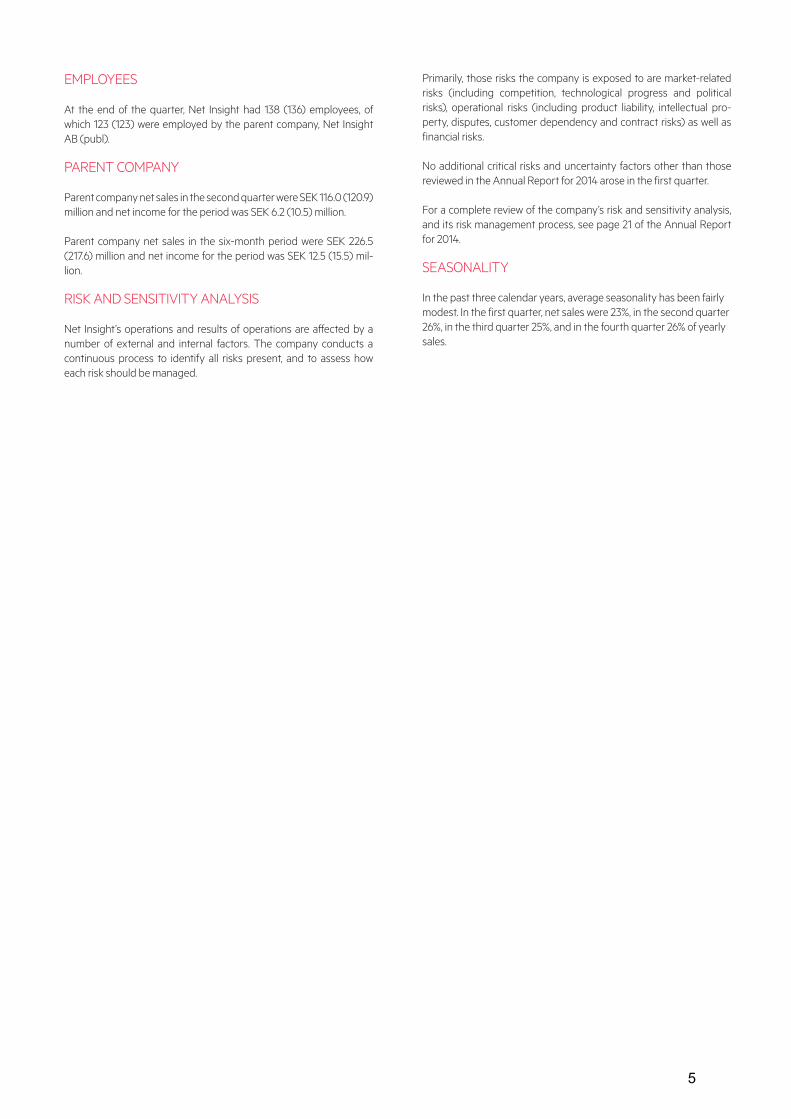
EARNINGS
Second quarter Gross margin expanded by one percentage point because of positive currency effects, and amounted to 60.6 per cent (59.6).
Due to upscaled initiatives, primarily in marketing and sales resources, operating expenses increased by SEK 4.5 million to SEK 51.5 (47.0) mil-lion. These investments are partly intended to raise awareness of the company to facilitate new business customer sales, and stronger sales and sales support activities. The depreciated SEK also made a lesser contribution to increased operating expenses. Administration over-heads and development expenses are comparable to the previous year. However, total R&D expenditure in the quarter did increase to SEK 22.3 (19.6) million.
Operating earnings decreased to SEK 4.9 (13.0) million due to lower sales volumes and increased operating expenses. The operating mar-gin was 5.3 per cent (12.9), and the EBITDA margin was 7.6 per cent (18.5).
Net financial items was a negative SEK -0.3 (0.4) million, due to a re-valuation of bank balances in foreign currencies. Net income was SEK 3.6 (9.9) million, resulting in a net margin of 3.9 per cent (9.8).
Six monthsThe gross margin for the first half-year 2015 expanded to 60.4 per cent (59.0), primarily due to a depreciated SEK.
Operating expenses increased by SEK 11.3 million to SEK 98.1 (86.8) million, mainly driven by more resources and activities in Net Insight’s sales and marketing organizations.
Operating profit was SEK 11.1 (16.5) million, equating to an operating margin of 6.1 per cent (9.4). The decreased operating earnings is pri-marily attributable to higher sales and marketing expenses, partly off-set by increased gross earnings.
Net income was SEK 7.6 (12.1) million, equating to a net margin of 4.2 per cent (6.9).
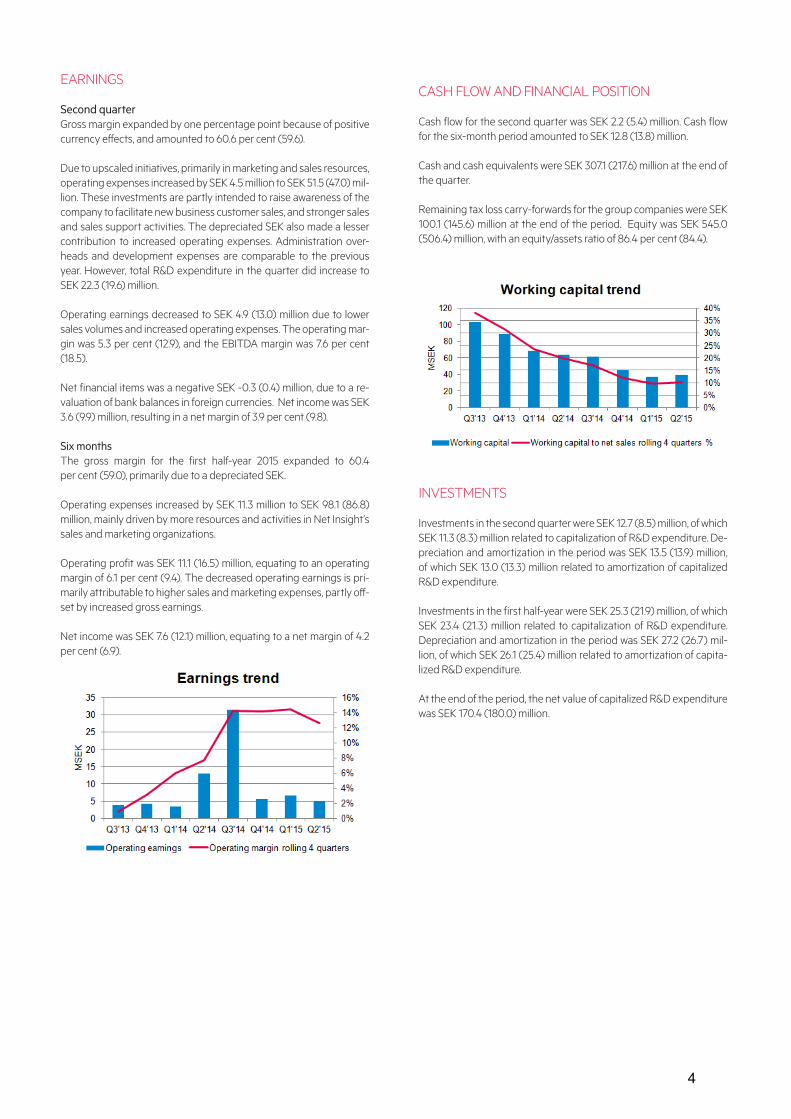
CASH FLOW AND FINANCIAL POSITION
Cash flow for the second quarter was SEK 2.2 (5.4) million. Cash flow for the six-month period amounted to SEK 12.8 (13.8) million.
Cash and cash equivalents were SEK 307.1 (217.6) million at the end of the quarter.
Remaining tax loss carry-forwards for the group companies were SEK 100.1 (145.6) million at the end of the period. Equity was SEK 545.0 (506.4) million, with an equity/assets ratio of 86.4 per cent (84.4).
INVESTMENTS
Investments in the second quarter were SEK 12.7 (8.5) million, of which SEK 11.3 (8.3) million related to capitalization of R&D expenditure. De-preciation and amortization in the period was SEK 13.5 (13.9) million, of which SEK 13.0 (13.3) million related to amortization of capitalized R&D expenditure.
Investments in the first half-year were SEK 25.3 (21.9) million, of which SEK 23.4 (21.3) million related to capitalization of R&D expenditure. Depreciation and amortization in the period was SEK 27.2 (26.7) mil-lion, of which SEK 26.1 (25.4) million related to amortization of capita-lized R&D expenditure.
At the end of the period, the net value of capitalized R&D expenditure was SEK 170.4 (180.0) million.
4
EMPLOYEES
At the end of the quarter, Net Insight had 138 (136) employees, of which 123 (123) were employed by the parent company, Net Insight AB (publ).
PARENT COMPANY
Parent company net sales in the second quarter were SEK 116.0 (120.9) million and net income for the period was SEK 6.2 (10.5) million.
Parent company net sales in the six-month period were SEK 226.5 (217.6) million and net income for the period was SEK 12.5 (15.5) mil-lion.
RISK AND SENSITIVITY ANALYSIS
Net Insight’s operations and results of operations are affected by a number of external and internal factors. The company conducts a continuous process to identify all risks present, and to assess how each risk should be managed.
Primarily, those risks the company is exposed to are market-related risks (including competition, technological progress and political risks), operational risks (including product liability, intellectual pro-perty, disputes, customer dependency and contract risks) as well as financial risks.
No additional critical risks and uncertainty factors other than those reviewed in the Annual Report for 2014 arose in the first quarter.
For a complete review of the company’s risk and sensitivity analysis, and its risk management process, see page 21 of the Annual Report for 2014.
SEASONALITY
In the past three calendar years, average seasonality has been fairly modest. In the first quarter, net sales were 23%, in the second quarter 26%, in the third quarter 25%, and in the fourth quarter 26% of yearly sales.
5
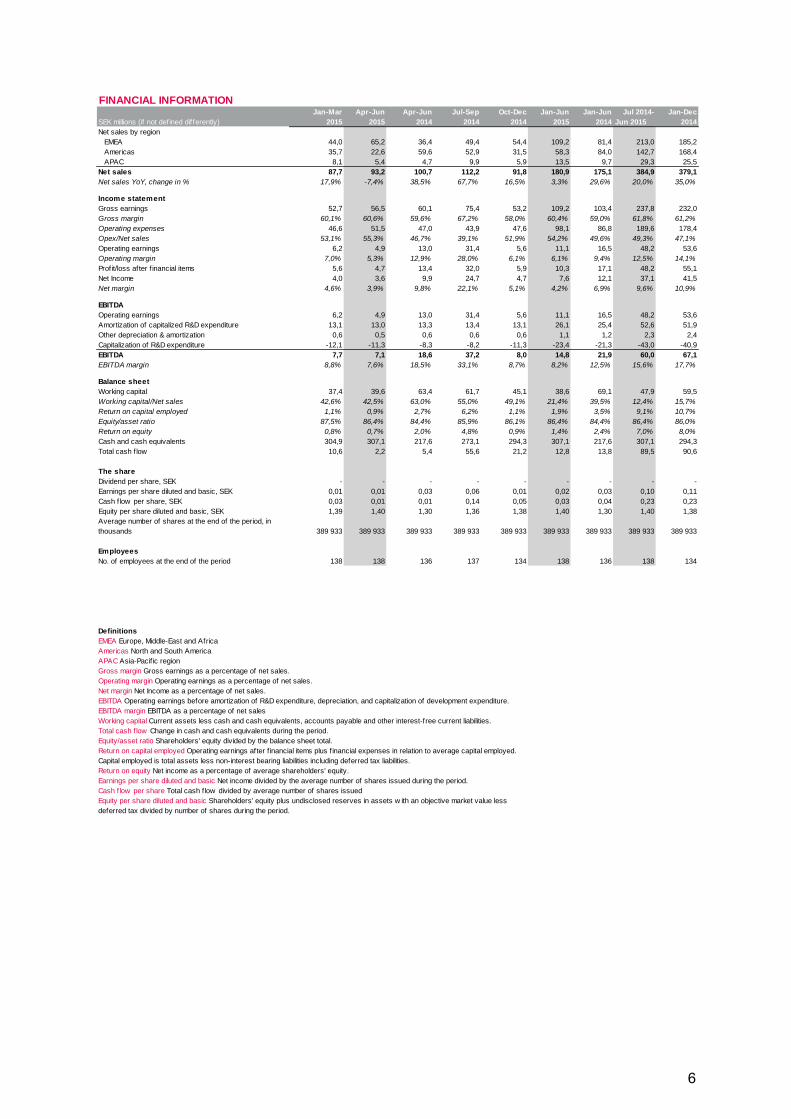
FINANCIAL INFORMATIONJan-Mar Apr-Jun Apr-Jun Jul-Sep Oct-Dec Jan-Jun Jan-Jun Jul 2014- Jan-Dec
SEK millions (if not defined differently) 2015 2015 2014 2014 2014 2015 2014 Jun 2015 2014Net sales by region EMEA 44,0 65,2 36,4 49,4 54,4 109,2 81,4 213,0 185,2 Americas 35,7 22,6 59,6 52,9 31,5 58,3 84,0 142,7 168,4 APAC 8,1 5,4 4,7 9,9 5,9 13,5 9,7 29,3 25,5Net sales 87,7 93,2 100,7 112,2 91,8 180,9 175,1 384,9 379,1Net sales YoY, change in % 17,9% -7,4% 38,5% 67,7% 16,5% 3,3% 29,6% 20,0% 35,0%
Income statementGross earnings 52,7 56,5 60,1 75,4 53,2 109,2 103,4 237,8 232,0Gross margin 60,1% 60,6% 59,6% 67,2% 58,0% 60,4% 59,0% 61,8% 61,2%Operating expenses 46,6 51,5 47,0 43,9 47,6 98,1 86,8 189,6 178,4Opex/Net sales 53,1% 55,3% 46,7% 39,1% 51,9% 54,2% 49,6% 49,3% 47,1%Operating earnings 6,2 4,9 13,0 31,4 5,6 11,1 16,5 48,2 53,6Operating margin 7,0% 5,3% 12,9% 28,0% 6,1% 6,1% 9,4% 12,5% 14,1%Profit/loss after f inancial items 5,6 4,7 13,4 32,0 5,9 10,3 17,1 48,2 55,1Net Income 4,0 3,6 9,9 24,7 4,7 7,6 12,1 37,1 41,5Net margin 4,6% 3,9% 9,8% 22,1% 5,1% 4,2% 6,9% 9,6% 10,9%
EBITDAOperating earnings 6,2 4,9 13,0 31,4 5,6 11,1 16,5 48,2 53,6Amortization of capitalized R&D expenditure 13,1 13,0 13,3 13,4 13,1 26,1 25,4 52,6 51,9Other depreciation & amortization 0,6 0,5 0,6 0,6 0,6 1,1 1,2 2,3 2,4Capitalization of R&D expenditure -12,1 -11,3 -8,3 -8,2 -11,3 -23,4 -21,3 -43,0 -40,9EBITDA 7,7 7,1 18,6 37,2 8,0 14,8 21,9 60,0 67,1EBITDA margin 8,8% 7,6% 18,5% 33,1% 8,7% 8,2% 12,5% 15,6% 17,7%
Balance sheetWorking capital 37,4 39,6 63,4 61,7 45,1 38,6 69,1 47,9 59,5Working capital/Net sales 42,6% 42,5% 63,0% 55,0% 49,1% 21,4% 39,5% 12,4% 15,7%Return on capital employed 1,1% 0,9% 2,7% 6,2% 1,1% 1,9% 3,5% 9,1% 10,7%Equity/asset ratio 87,5% 86,4% 84,4% 85,9% 86,1% 86,4% 84,4% 86,4% 86,0%Return on equity 0,8% 0,7% 2,0% 4,8% 0,9% 1,4% 2,4% 7,0% 8,0%Cash and cash equivalents 304,9 307,1 217,6 273,1 294,3 307,1 217,6 307,1 294,3Total cash f low 10,6 2,2 5,4 55,6 21,2 12,8 13,8 89,5 90,6
The shareDividend per share, SEK - - - - - - - - -Earnings per share diluted and basic, SEK 0,01 0,01 0,03 0,06 0,01 0,02 0,03 0,10 0,11Cash f low per share, SEK 0,03 0,01 0,01 0,14 0,05 0,03 0,04 0,23 0,23Equity per share diluted and basic, SEK 1,39 1,40 1,30 1,36 1,38 1,40 1,30 1,40 1,38Average number of shares at the end of the period, in thousands 389 933 389 933 389 933 389 933 389 933 389 933 389 933 389 933 389 933
EmployeesNo. of employees at the end of the period 138 138 136 137 134 138 136 138 134
DefinitionsEMEA Europe, Middle-East and AfricaAmericas North and South America APAC Asia-Pacif ic regionGross margin Gross earnings as a percentage of net sales.Operating margin Operating earnings as a percentage of net sales.Net margin Net Income as a percentage of net sales.EBITDA Operating earnings before amortization of R&D expenditure, depreciation, and capitalization of development expenditure.EBITDA margin EBITDA as a percentage of net salesWorking capital Current assets less cash and cash equivalents, accounts payable and other interest-free current liabilities.Total cash f low Change in cash and cash equivalents during the period.Equity/asset ratio Shareholders' equity divided by the balance sheet total.Return on capital employed Operating earnings after f inancial items plus f inancial expenses in relation to average capital employed. Capital employed is total assets less non-interest bearing liabilities including deferred tax liabilities.Return on equity Net income as a percentage of average shareholders' equity.Earnings per share diluted and basic Net income divided by the average number of shares issued during the period.Cash f low per share Total cash f low divided by average number of shares issuedEquity per share diluted and basic Shareholders’ equity plus undisclosed reserves in assets w ith an objective market value lessdeferred tax divided by number of shares during the period.
6
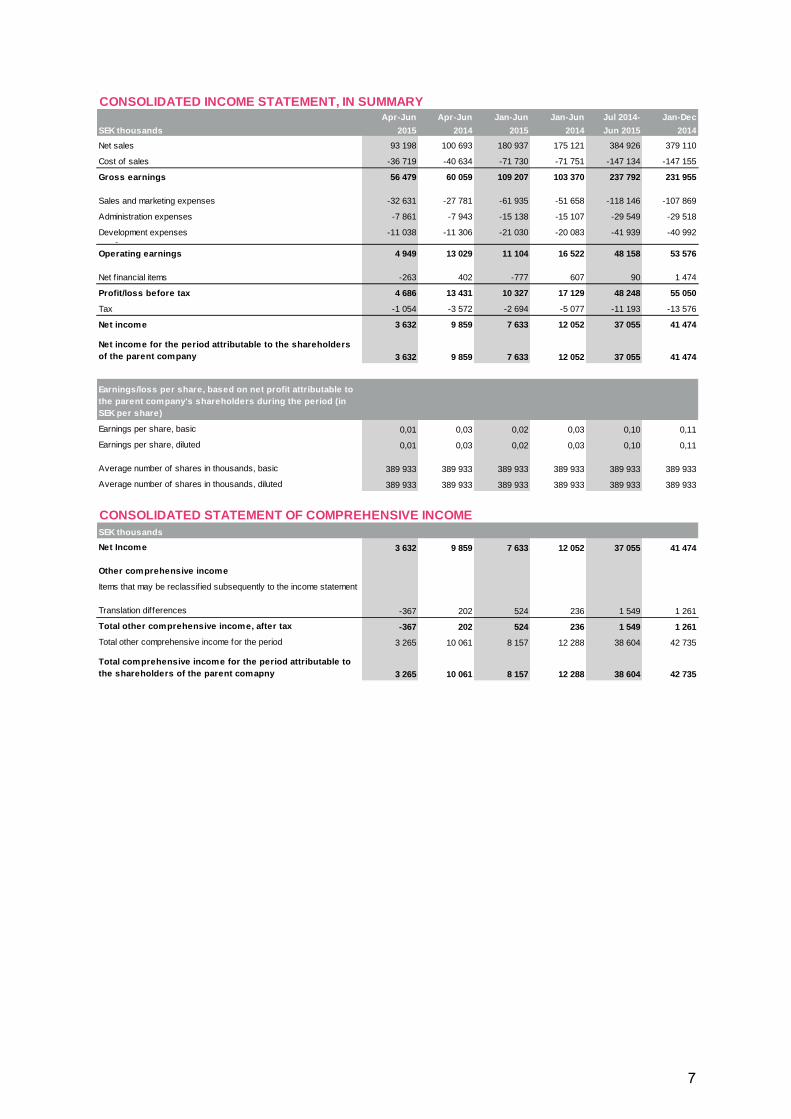
CONSOLIDATED INCOME STATEMENT, IN SUMMARYApr-Jun Apr-Jun Jan-Jun Jan-Jun Jul 2014- Jan-Dec
SEK thousands 2015 2014 2015 2014 Jun 2015 2014Net sales 93 198 100 693 180 937 175 121 384 926 379 110
Cost of sales -36 719 -40 634 -71 730 -71 751 -147 134 -147 155
Gross earnings 56 479 60 059 109 207 103 370 237 792 231 955
Sales and marketing expenses -32 631 -27 781 -61 935 -51 658 -118 146 -107 869
Administration expenses -7 861 -7 943 -15 138 -15 107 -29 549 -29 518
Development expenses -11 038 -11 306 -21 030 -20 083 -41 939 -40 992Övriga kostnader
Operating earnings 4 949 13 029 11 104 16 522 48 158 53 576
Net f inancial items -263 402 -777 607 90 1 474
Profit/loss before tax 4 686 13 431 10 327 17 129 48 248 55 050
Tax -1 054 -3 572 -2 694 -5 077 -11 193 -13 576
Net income 3 632 9 859 7 633 12 052 37 055 41 474
Net income for the period attributable to the shareholders of the parent company 3 632 9 859 7 633 12 052 37 055 41 474
Earnings/loss per share, based on net profit attributable to the parent company's shareholders during the period (in SEK per share)
Earnings per share, basic 0,01 0,03 0,02 0,03 0,10 0,11
Earnings per share, diluted 0,01 0,03 0,02 0,03 0,10 0,11
Average number of shares in thousands, basic 389 933 389 933 389 933 389 933 389 933 389 933
Average number of shares in thousands, diluted 389 933 389 933 389 933 389 933 389 933 389 933
CONSOLIDATED STATEMENT OF COMPREHENSIVE INCOMESEK thousandsNet Income 3 632 9 859 7 633 12 052 37 055 41 474
Other comprehensive income
Items that may be reclassif ied subsequently to the income statement
Translation differences -367 202 524 236 1 549 1 261
Total other comprehensive income, after tax -367 202 524 236 1 549 1 261Total other comprehensive income for the period 3 265 10 061 8 157 12 288 38 604 42 735
Total comprehensive income for the period attributable to the shareholders of the parent comapny 3 265 10 061 8 157 12 288 38 604 42 735
7
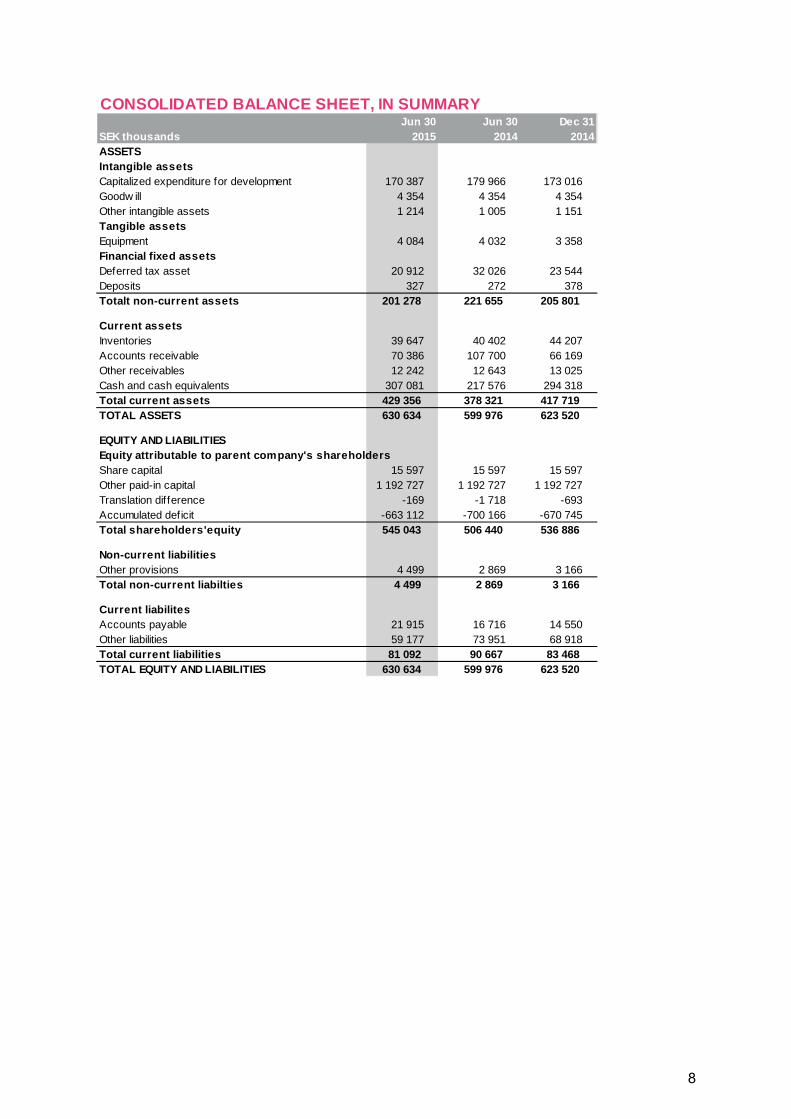
CONSOLIDATED BALANCE SHEET, IN SUMMARYJun 30 Jun 30 Dec 31
SEK thousands 2015 2014 2014ASSETSIntangible assetsCapitalized expenditure for development 170 387 179 966 173 016 Goodw ill 4 354 4 354 4 354 Other intangible assets 1 214 1 005 1 151 Tangible assetsEquipment 4 084 4 032 3 358 Financial fixed assetsDeferred tax asset 20 912 32 026 23 544 Deposits 327 272 378 Totalt non-current assets 201 278 221 655 205 801
Current assetsInventories 39 647 40 402 44 207 Accounts receivable 70 386 107 700 66 169 Other receivables 12 242 12 643 13 025 Cash and cash equivalents 307 081 217 576 294 318 Total current assets 429 356 378 321 417 719 TOTAL ASSETS 630 634 599 976 623 520
EQUITY AND LIABILITIESEquity attributable to parent company's shareholdersShare capital 15 597 15 597 15 597 Other paid-in capital 1 192 727 1 192 727 1 192 727 Translation difference -169 -1 718 -693 Accumulated deficit -663 112 -700 166 -670 745 Total shareholders'equity 545 043 506 440 536 886
Non-current liabilitiesOther provisions 4 499 2 869 3 166 Total non-current liabilties 4 499 2 869 3 166
Current liabilitesAccounts payable 21 915 16 716 14 550 Other liabilities 59 177 73 951 68 918 Total current liabilities 81 092 90 667 83 468 TOTAL EQUITY AND LIABILITIES 630 634 599 976 623 520
8
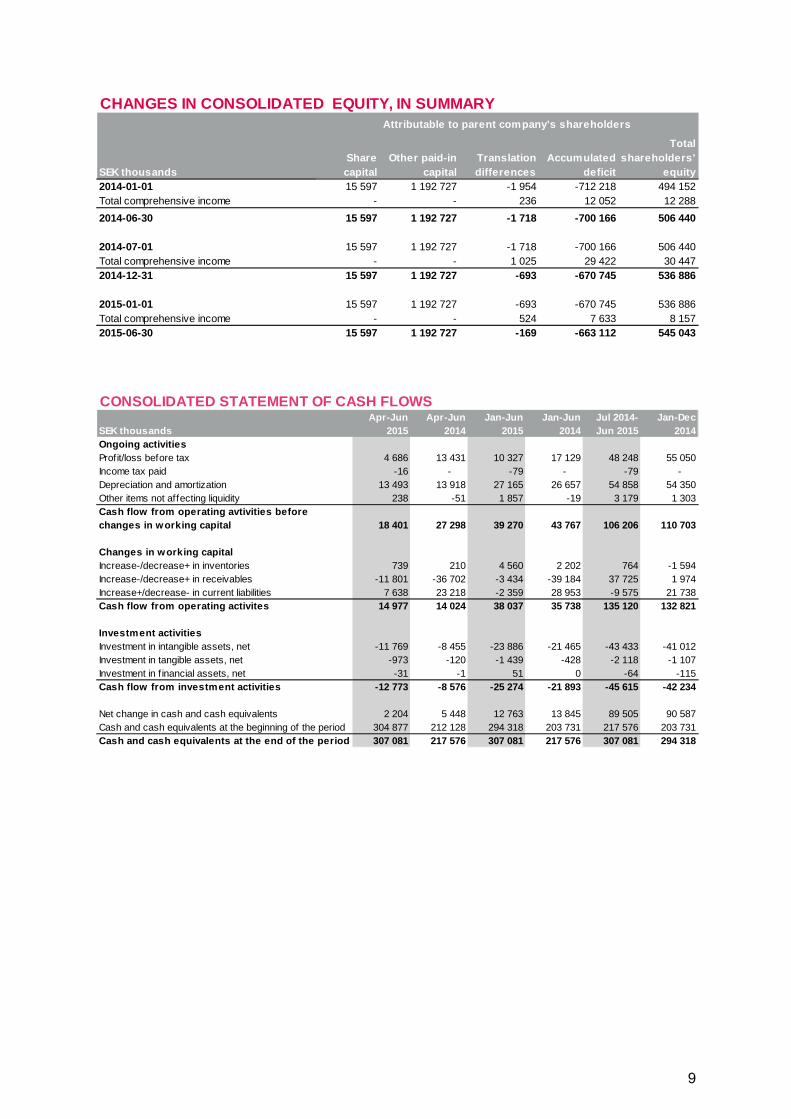
CHANGES IN CONSOLIDATED EQUITY, IN SUMMARY
SEK thousandsShare
capitalOther paid-in
capitalTranslation differences
Accumulated deficit
Total shareholders'
equity2014-01-01 15 597 1 192 727 -1 954 -712 218 494 152Total comprehensive income - - 236 12 052 12 2882014-06-30 15 597 1 192 727 -1 718 -700 166 506 440
2014-07-01 15 597 1 192 727 -1 718 -700 166 506 440Total comprehensive income - - 1 025 29 422 30 4472014-12-31 15 597 1 192 727 -693 -670 745 536 886
2015-01-01 15 597 1 192 727 -693 -670 745 536 886Total comprehensive income - - 524 7 633 8 1572015-06-30 15 597 1 192 727 -169 -663 112 545 043
Attributable to parent company's shareholders
CONSOLIDATED STATEMENT OF CASH FLOWSApr-Jun Apr-Jun Jan-Jun Jan-Jun Jul 2014- Jan-Dec
SEK thousands 2015 2014 2015 2014 Jun 2015 2014Ongoing activitiesProfit/loss before tax 4 686 13 431 10 327 17 129 48 248 55 050Income tax paid -16 - -79 - -79 - Depreciation and amortization 13 493 13 918 27 165 26 657 54 858 54 350Other items not affecting liquidity 238 -51 1 857 -19 3 179 1 303Cash flow from operating avtivities before changes in working capital 18 401 27 298 39 270 43 767 106 206 110 703
Changes in working capitalIncrease-/decrease+ in inventories 739 210 4 560 2 202 764 -1 594Increase-/decrease+ in receivables -11 801 -36 702 -3 434 -39 184 37 725 1 974Increase+/decrease- in current liabilities 7 638 23 218 -2 359 28 953 -9 575 21 738Cash flow from operating activites 14 977 14 024 38 037 35 738 135 120 132 821
Investment activitiesInvestment in intangible assets, net -11 769 -8 455 -23 886 -21 465 -43 433 -41 012Investment in tangible assets, net -973 -120 -1 439 -428 -2 118 -1 107Investment in f inancial assets, net -31 -1 51 0 -64 -115Cash flow from investment activities -12 773 -8 576 -25 274 -21 893 -45 615 -42 234
Net change in cash and cash equivalents 2 204 5 448 12 763 13 845 89 505 90 587Cash and cash equivalents at the beginning of the period 304 877 212 128 294 318 203 731 217 576 203 731Cash and cash equivalents at the end of the period 307 081 217 576 307 081 217 576 307 081 294 318
9
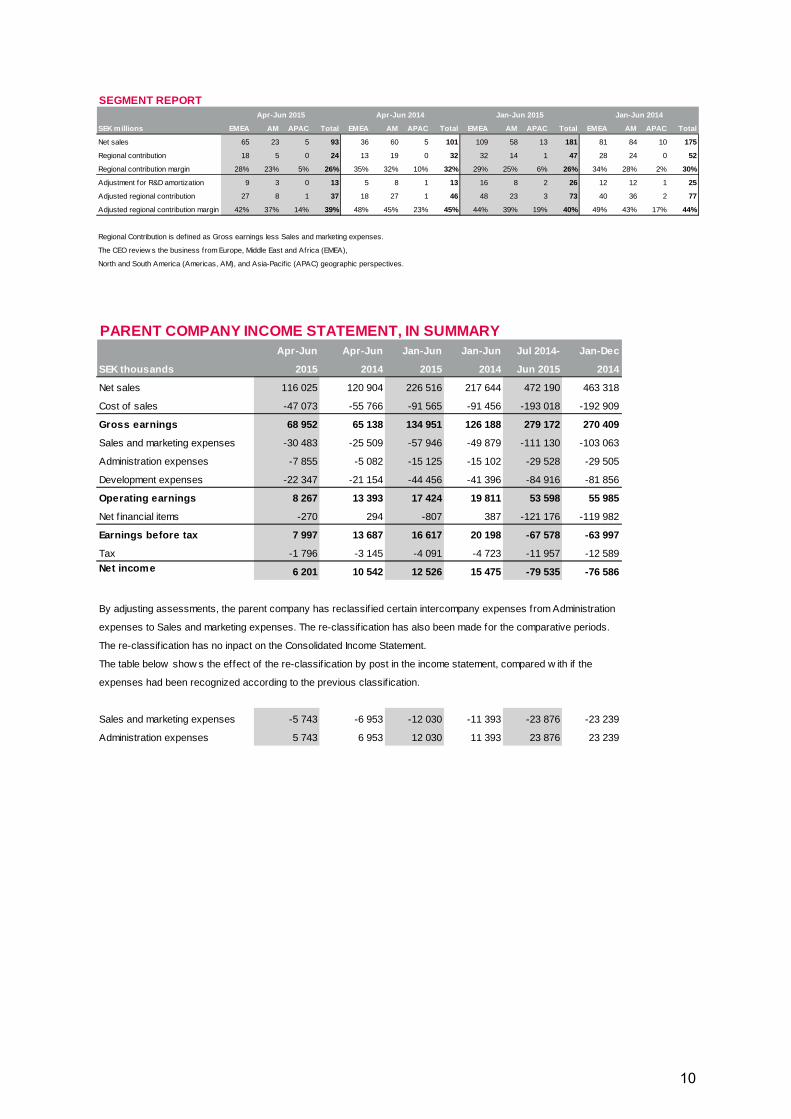
SEGMENT REPORT
SEK millions EMEA AM APAC Total EMEA AM APAC Total EMEA AM APAC Total EMEA AM APAC Total
Net sales 65 23 5 93 36 60 5 101 109 58 13 181 81 84 10 175
Regional contribution 18 5 0 24 13 19 0 32 32 14 1 47 28 24 0 52
Regional contribution margin 28% 23% 5% 26% 35% 32% 10% 32% 29% 25% 6% 26% 34% 28% 2% 30%
Adjustment for R&D amortization 9 3 0 13 5 8 1 13 16 8 2 26 12 12 1 25
Adjusted regional contribution 27 8 1 37 18 27 1 46 48 23 3 73 40 36 2 77
Adjusted regional contribution margin 42% 37% 14% 39% 48% 45% 23% 45% 44% 39% 19% 40% 49% 43% 17% 44%
Regional Contribution is defined as Gross earnings less Sales and marketing expenses.
The CEO review s the business from Europe, Middle East and Africa (EMEA),
North and South America (Americas, AM), and Asia-Pacif ic (APAC) geographic perspectives.
Jan-Jun 2015 Jan-Jun 2014Apr-Jun 2015 Apr-Jun 2014
PARENT COMPANY INCOME STATEMENT, IN SUMMARYApr-Jun Apr-Jun Jan-Jun Jan-Jun Jul 2014- Jan-Dec
SEK thousands 2015 2014 2015 2014 Jun 2015 2014
Net sales 116 025 120 904 226 516 217 644 472 190 463 318
Cost of sales -47 073 -55 766 -91 565 -91 456 -193 018 -192 909
Gross earnings 68 952 65 138 134 951 126 188 279 172 270 409
Sales and marketing expenses -30 483 -25 509 -57 946 -49 879 -111 130 -103 063
Administration expenses -7 855 -5 082 -15 125 -15 102 -29 528 -29 505
Development expenses -22 347 -21 154 -44 456 -41 396 -84 916 -81 856
Operating earnings 8 267 13 393 17 424 19 811 53 598 55 985
Net f inancial items -270 294 -807 387 -121 176 -119 982
Earnings before tax 7 997 13 687 16 617 20 198 -67 578 -63 997
Tax -1 796 -3 145 -4 091 -4 723 -11 957 -12 589Net income 6 201 10 542 12 526 15 475 -79 535 -76 586
By adjusting assessments, the parent company has reclassif ied certain intercompany expenses from Administration
expenses to Sales and marketing expenses. The re-classif ication has also been made for the comparative periods.
The re-classif ication has no inpact on the Consolidated Income Statement.
The table below show s the effect of the re-classif ication by post in the income statement, compared w ith if the
expenses had been recognized according to the previous classif ication.
Sales and marketing expenses -5 743 -6 953 -12 030 -11 393 -23 876 -23 239
Administration expenses 5 743 6 953 12 030 11 393 23 876 23 239
10
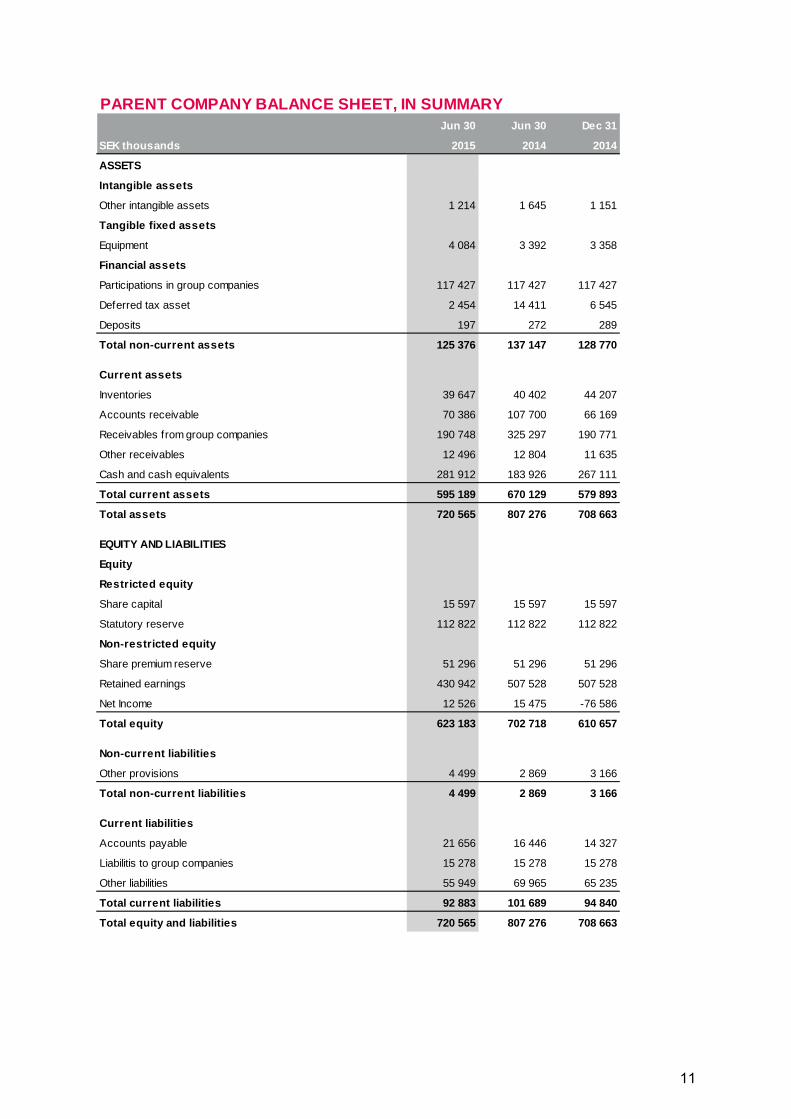
PARENT COMPANY BALANCE SHEET, IN SUMMARYJun 30 Jun 30 Dec 31
SEK thousands 2015 2014 2014
ASSETS
Intangible assets
Other intangible assets 1 214 1 645 1 151
Tangible fixed assets
Equipment 4 084 3 392 3 358
Financial assets
Participations in group companies 117 427 117 427 117 427
Deferred tax asset 2 454 14 411 6 545
Deposits 197 272 289
Total non-current assets 125 376 137 147 128 770
Current assets
Inventories 39 647 40 402 44 207
Accounts receivable 70 386 107 700 66 169
Receivables from group companies 190 748 325 297 190 771
Other receivables 12 496 12 804 11 635
Cash and cash equivalents 281 912 183 926 267 111
Total current assets 595 189 670 129 579 893
Total assets 720 565 807 276 708 663
EQUITY AND LIABILITIES
Equity
Restricted equity
Share capital 15 597 15 597 15 597
Statutory reserve 112 822 112 822 112 822
Non-restricted equity
Share premium reserve 51 296 51 296 51 296
Retained earnings 430 942 507 528 507 528
Net Income 12 526 15 475 -76 586
Total equity 623 183 702 718 610 657
Non-current liabilities
Other provisions 4 499 2 869 3 166
Total non-current liabilities 4 499 2 869 3 166
Current liabilities
Accounts payable 21 656 16 446 14 327
Liabilitis to group companies 15 278 15 278 15 278
Other liabilities 55 949 69 965 65 235
Total current liabilities 92 883 101 689 94 840
Total equity and liabilities 720 565 807 276 708 663
11
ACCOUNTING POLICIES
This Interim Report has been prepared in accordance with IAS 34 In-terim Financial Reporting and applicable regulations of the Swedish Annual Accounts Act. The Interim Report of the parent company complies with chapter 9:e of the Swedish Annual Accounts Act, In-terim Financial Reporting, and RFR 2 Accounting for Legal Entities.
The preparation of the Interim Report requires management to make judgments, estimates and assumptions that affect the company’s ear-nings and position and information presented generally. Estimates and judgments are continually evaluated and are based on historical experience and other factors, including expectations of future events that are believed to be reasonable under the circumstances.
The same accounting principles and basis of calculation as those used in the latest Annual Report have been applied to the group and parent company. For a description of these accounting principles, please refer to the Annual Report.
Figures in brackets in this report refer to comparison with the cor-responding period or date in the previous year. Divergences due to rounding may occur in this report.
SIGNIFICANT EVENTS AFTER THE END OF THE PERIOD
There were no significant events after the end of the period.
REVIEW
This Report has not been reviewed by the company’s auditor.
THIS IS NET INSIGHT
Business concept and modelNet Insight delivers network products and services for effective, high-quality media transport for broadcasters and service providers. Net Insight’s solutions offer customers the benefit of lower cost and the potential for effective new media service launches.
Revenues are generated through direct and indirect sales of pro-ducts and licenses, support and maintenance, professional services and training. Revenues are primarily sourced from hardware sales, although revenues from software and services have increased in re-cent years.
StrategyOur ambition is to be a growth company, and our target is to create profitable growth. On a market in fundamental transformation, we create growth and profitability through close and strategic partner-ships with customers. We create innovative solutions together that make our customers successful and generate business benefits. To grow for the long term, we need to transform Net Insight into a custo-mer and market-oriented company.
Value DriversValue drivers affect Net Insight’s progress and can be divided into three groups: market transformation, innovative technology and glo-bal reach.
Net Insight benefits from the general increase in video traffic such as higher consumption of mobile and broadband TV, e.g OTT, adoption of remote workflows and production as well a wider coverage of live events. An important driver is also the conversion to new TV formats in the broadcast and media industry.
12
REPORTING DATES
Interim report January-September 2015 October 28 2015Year-end report 2015 February 17 2016
CERTIFICATION BY THE BOARD OF DIRECTORS AND CEO
The Board of Directors and the CEO certify that the Interim report for the period January - June 2015 gives a true and fair overview of the Parent Company Net Insight AB and the Group’s operations, their financial position and results of operations, and describes significant risks and uncertain-ties facing the Parent Company and other companies in the Group.
Stockholm, July 22, 2015
Lars Berg Jan BarchanChairman Board member
Cecilia Beck-Friis Crister FritzsonBoard member Board member
Gunilla Fransson Anders HarryssonBoard member Board member
Regina Nilsson Fredrik Tumegård Board member CEO
For more information, please contact:
Fredrik Tumegård, CEO, Net Insight AB (publ)Telefon: +46 (0)8-685 04 00Email: [email protected]
Thomas Bergström, CFO, Net Insight AB (publ)Telefon: +46 (0)8-685 06 05Email: [email protected]
Net Insight AB (publ), reg.no 556533-4397Box 42093126 14 StockholmTel. +46 (0)8 – 685 04 00netinsight.net
13

Net Insight AB (publ)Phone +46 (0)8 685 04 00, [email protected], netinsight.net
The information presented in this document may be subject to change without notice. For further information on product status and availability, please contact [email protected] or visit www.netinsight.net ©Copyright 2015, Net Insight AB, Sweden. All rights reserved. Net Insight and Nimbra are trademarks of Net Insight AB, Sweden. All other registered trademarks are the property of their respective owners.