Embed Size (px)
Citation preview
1
TUNBRIDGE WELLS PROPENSITY TO CYCLE CASE STUDY
Cycling Potential in Tunbridge Wells Executive Summary This report uses the Propensity to Cycle Tool (PCT: see www.pct.bike) to examine cycling potential in Tunbridge Wells along routes and in different areas. It finds substantial potential, particularly using the ‘e-bike’ scenario that combines Dutch cycling propensities with data on how e-bikes are increasingly used for longer and hillier trips. The report illustrates some co-benefits of achieving this substantial mode shift, and highlights core components of a cycle route network that could start to support such a shift. Examples are given of routes with substantial growth in uptake, with a section exploring the potential for rail-cycle commuting; not currently part of the main PCT. Limitations of the tool are also discussed.
2
TUNBRIDGE WELLS PROPENSITY TO CYCLE CASE STUDY
Contents 1. Introduction ..................................................................................................................................... 3
2. About this report .............................................................................................................................. 3
3. About Tunbridge Wells .................................................................................................................... 4
4. Scenarios .......................................................................................................................................... 4
4.1 Kent .......................................................................................................................................... 10
5. E-bikes ............................................................................................................................................ 11
5.1 E-bike mode shift in Tunbridge Wells ...................................................................................... 11
6. Area-based cycling potential .......................................................................................................... 13
6.1 Kent .......................................................................................................................................... 13
6.2 Tunbridge Wells ....................................................................................................................... 16
6.2.1 Health and CO2 benefits .................................................................................................... 17
6.2.2 Additional rail-cycle commute potential in Tunbridge Wells ........................................... 18
7. Route-based cycling potential........................................................................................................ 23
7.1 Overview: desire lines and route network............................................................................... 23
7.2 A core network for Tunbridge Wells? ...................................................................................... 25
7.3 Time penalties and detours ..................................................................................................... 27
7.4 Cycling potential along specific routes .................................................................................... 27
7.4.1 Mount Ephraim ................................................................................................................. 27
7.4.2 Garden Road ..................................................................................................................... 29
7.4.3 St. John’s Road .................................................................................................................. 32
8. Policy Interventions........................................................................................................................ 34
8.1 Area-based interventions ......................................................................................................... 34
8.2 Route-based interventions ...................................................................................................... 35
9. Limitations of the PCT .................................................................................................................... 38
10. Bibliography ................................................................................................................................. 39
3
TUNBRIDGE WELLS PROPENSITY TO CYCLE CASE STUDY
1. Introduction Increasing cycling can have a range of benefits. Health benefits are substantial, arising primarily from rises in physical activity among a largely inactive and often overweight population. Other health benefits stem from declines in air pollution if car trips decline, and – given a substantial amount of mode shift – falls in injury levels. Cycling is an efficient mode of transport, allowing many times more people to be transported in a given space than cars. Hence – perhaps counter-intuitively – major cities where space is at a premium and congestion particularly problematic have been among the first to invest substantially in cycling. Additional benefits of cycling include the ability to increase mobility among those with limited access to private motor vehicles – including children, whose independent mobility is facilitated by being able to cycle without fear. However, the benefits of cycling are far from being realised in England. Research demonstrates that the major barrier to increasing cycling is fear of motor traffic, with a systematic review conducted for DfT showing that women have a particularly strong need for cycling infrastructure separated from motor traffic, such as protected tracks on main roads. Under-represented groups such as women and older people benefit even more from such routes being direct; following key desire lines as closely as possible and comparing favourably in terms of distance and hilliness with routes for motor traffic. This is because they are less likely than men and younger people to cycle longer and/or hillier journeys. But where should this infrastructure be built? The Propensity to Cycle Tool (PCT) can help answer this question. The PCT uses data about trips that people currently make, to look at which trips might be more likely to shift to cycling, under different assumptions. This is important as it means we can now plan not just based on current cycling levels, but also using evidence about cycling potential. This report uses the PCT for Tunbridge Wells and the surrounding area, and highlights in particular the cycling potential using the PCT e-bikes scenario.
2. About this report This report is produced as part of the DfT’s Propensity to Cycle Tool project, with additional support provided by an Economic and Social Research Council Impact Acceleration Grant (via Cambridge University). Advice and input from stakeholders has been much appreciated; in particular we would like to thank Bartholomew Wren and Hilary Smith from Tunbridge Wells Borough Council and Adrian Berendt and Scott Purchas from Tunbridge Wells Bicycle User Group. However this report is independent and represents neither the views of stakeholders nor of the funders (DfT and ESRC). Data for the first wave of case studies was downloaded from the Propensity to Cycle Tool (PCT) as of 1st September 2016. Some of the underlying data may change slightly in future updates to PCT. In particular, an update to be applied in October/November 2016 will improve our estimates of route hilliness, and so reduce measurement error in modelling propensity to cycle, although we do not expect this significantly to change the model results. This report uses the ‘data downloads’ feature of the PCT has been used, with analysis conducted in QGis and Microsoft Excel. The report was led by Rachel Aldred with input from other team members, especially bespoke analysis by Anna Goodman for the rail-cycle potential. Alex Michell produced the visualisations.
4
TUNBRIDGE WELLS PROPENSITY TO CYCLE CASE STUDY
3. About Tunbridge Wells Royal Tunbridge Wells (here and elsewhere often shortened to Tunbridge Wells) is a large affluent town in Kent, England, about 40 miles (64 km) south-east of central London by road, 34.5 miles (55.5 km) by rail1. At the south-western edge of the county, it lies close to the border of the county of East Sussex. The town itself has a population of around 56,500 and the wider Borough (covered in this report) of around double this. While part of the London commuter belt many jobs are local, including in the tourist industry and an industrial zone around High Brooms. There are three rail stations in the borough of Tunbridge Wells, in the town itself, in High Brooms, and to the West in Paddock Wood.
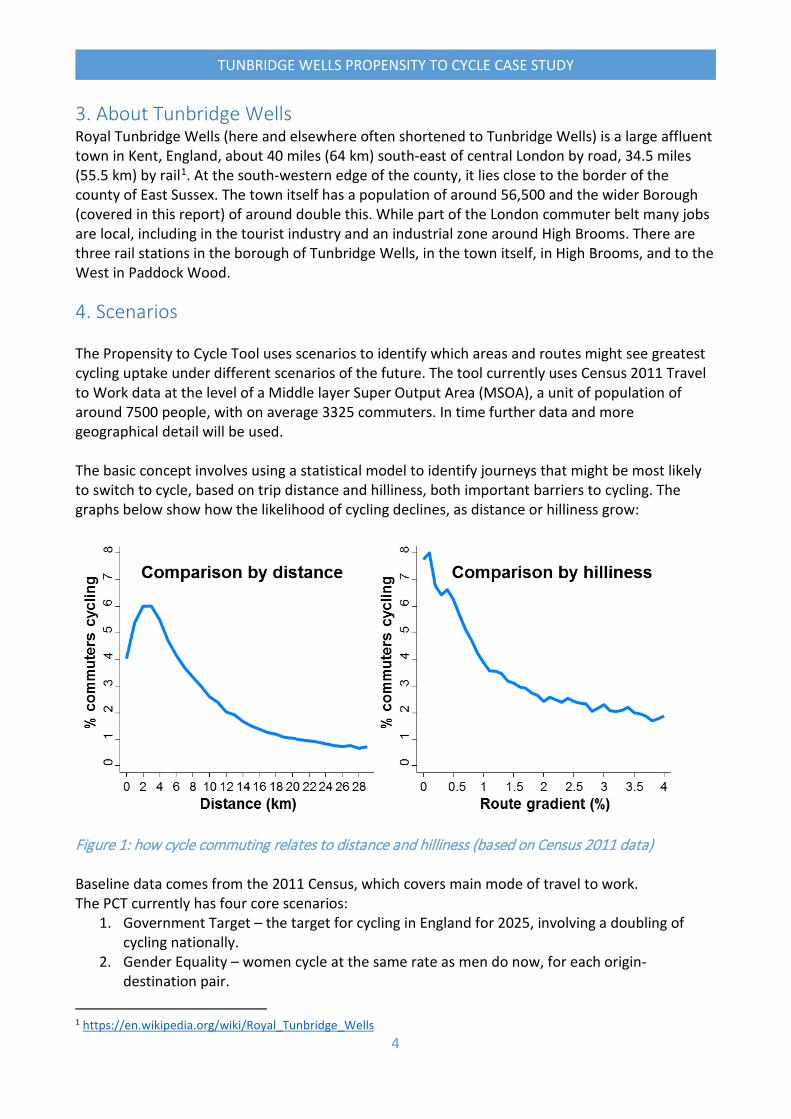
4. Scenarios The Propensity to Cycle Tool uses scenarios to identify which areas and routes might see greatest cycling uptake under different scenarios of the future. The tool currently uses Census 2011 Travel to Work data at the level of a Middle layer Super Output Area (MSOA), a unit of population of around 7500 people, with on average 3325 commuters. In time further data and more geographical detail will be used. The basic concept involves using a statistical model to identify journeys that might be most likely to switch to cycle, based on trip distance and hilliness, both important barriers to cycling. The graphs below show how the likelihood of cycling declines, as distance or hilliness grow:
Figure 1: how cycle commuting relates to distance and hilliness (based on Census 2011 data) Baseline data comes from the 2011 Census, which covers main mode of travel to work. The PCT currently has four core scenarios:
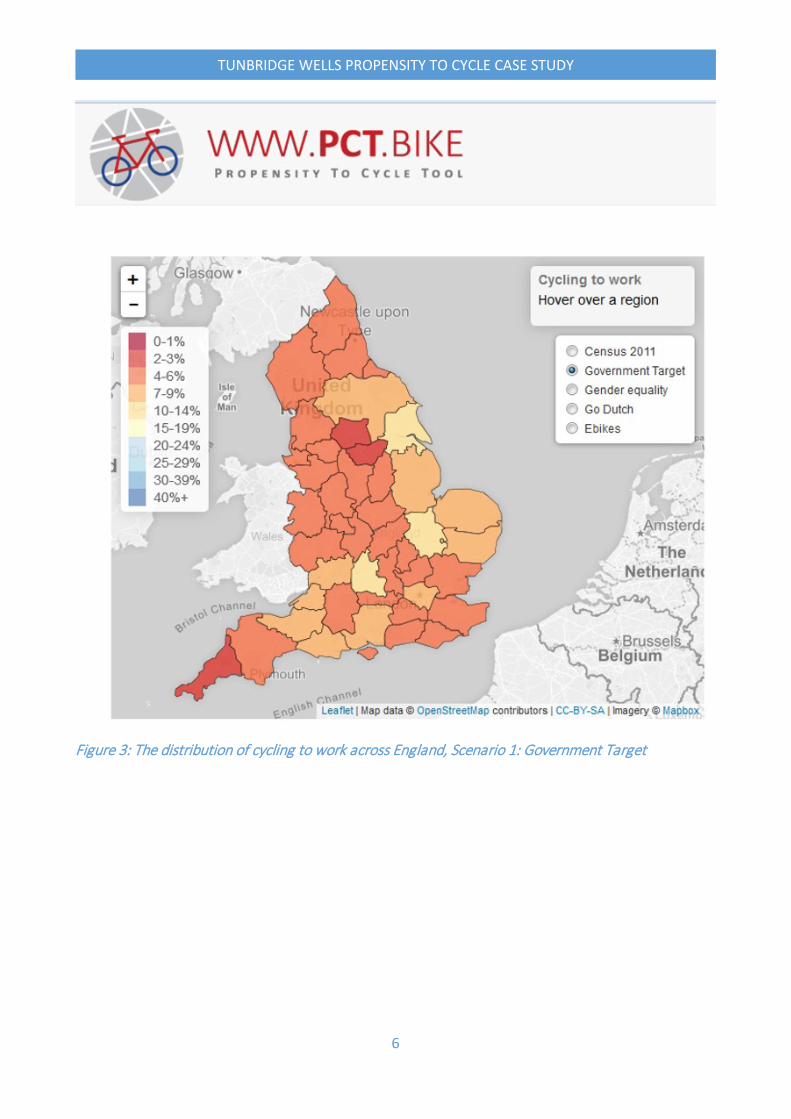
1. Government Target – the target for cycling in England for 2025, involving a doubling of cycling nationally.
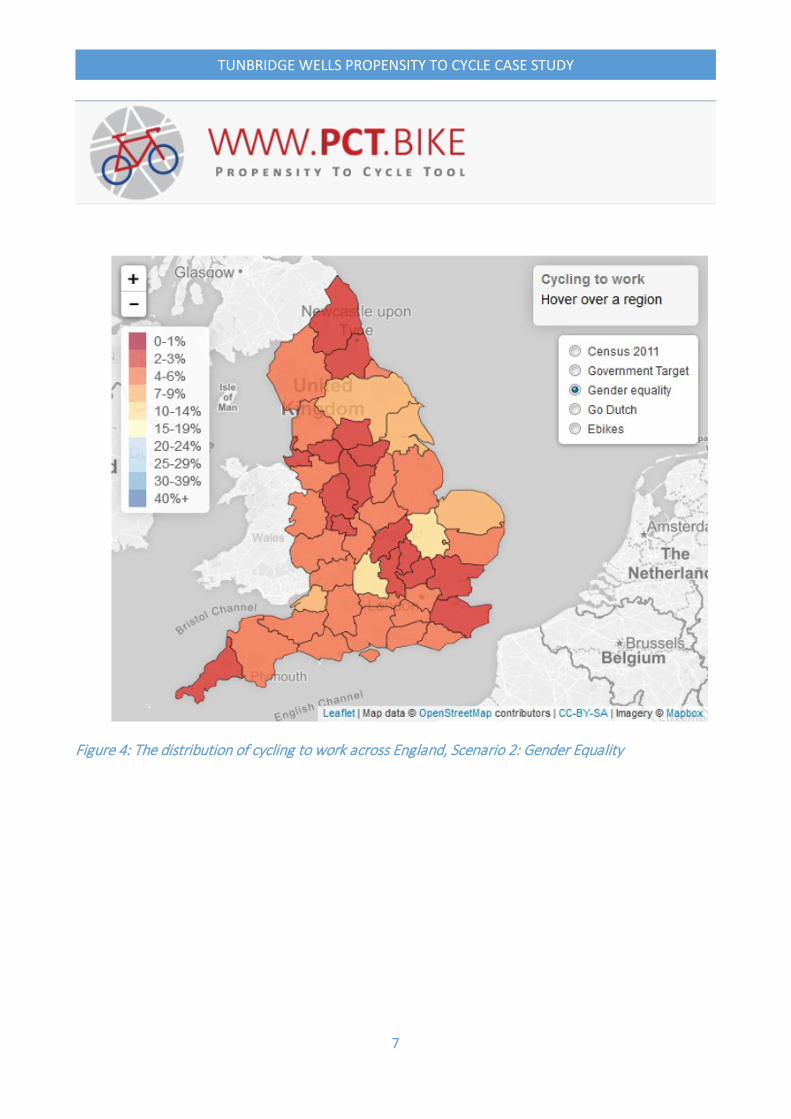
2. Gender Equality – women cycle at the same rate as men do now, for each origin-destination pair.
1 https://en.wikipedia.org/wiki/Royal_Tunbridge_Wells
5
TUNBRIDGE WELLS PROPENSITY TO CYCLE CASE STUDY
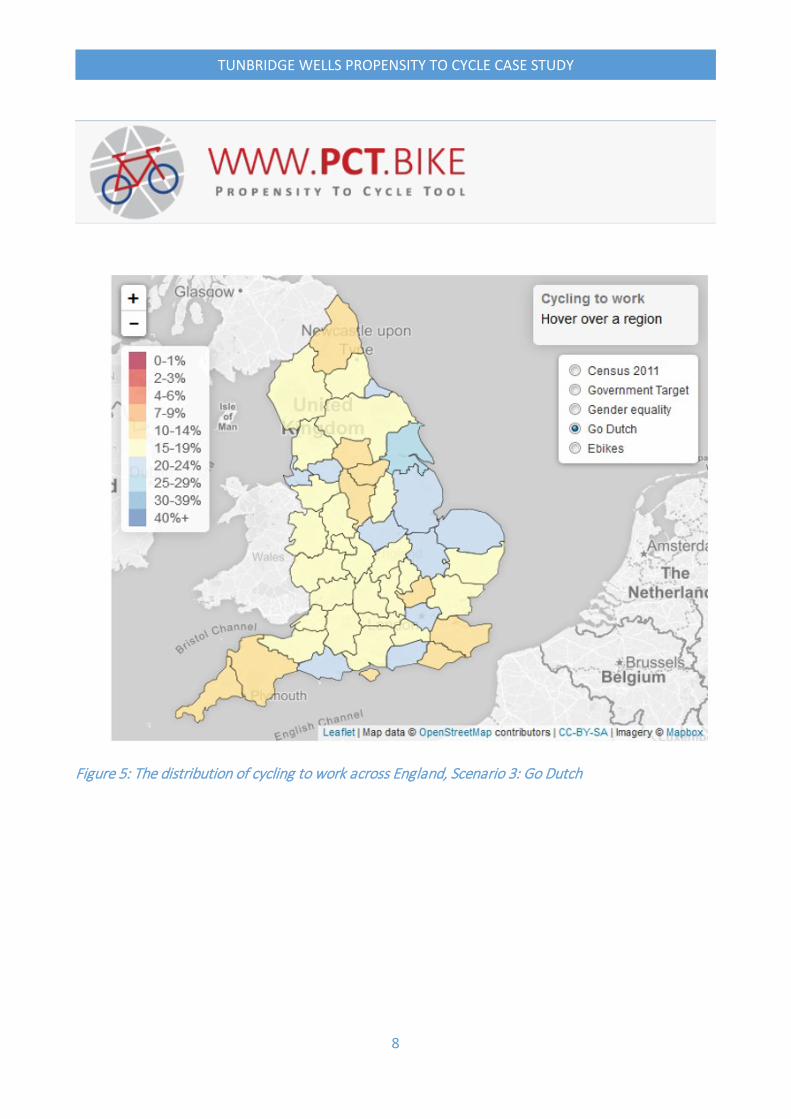
3. Go Dutch – uses the probability that each given trip would be cycled in the Netherlands, based on length and hilliness.
4. E-bikes – A kind of Go Dutch plus, based on Dutch and Swiss data, assuming that people use e-bikes for longer or hillier journeys as the Dutch and Swiss already do.
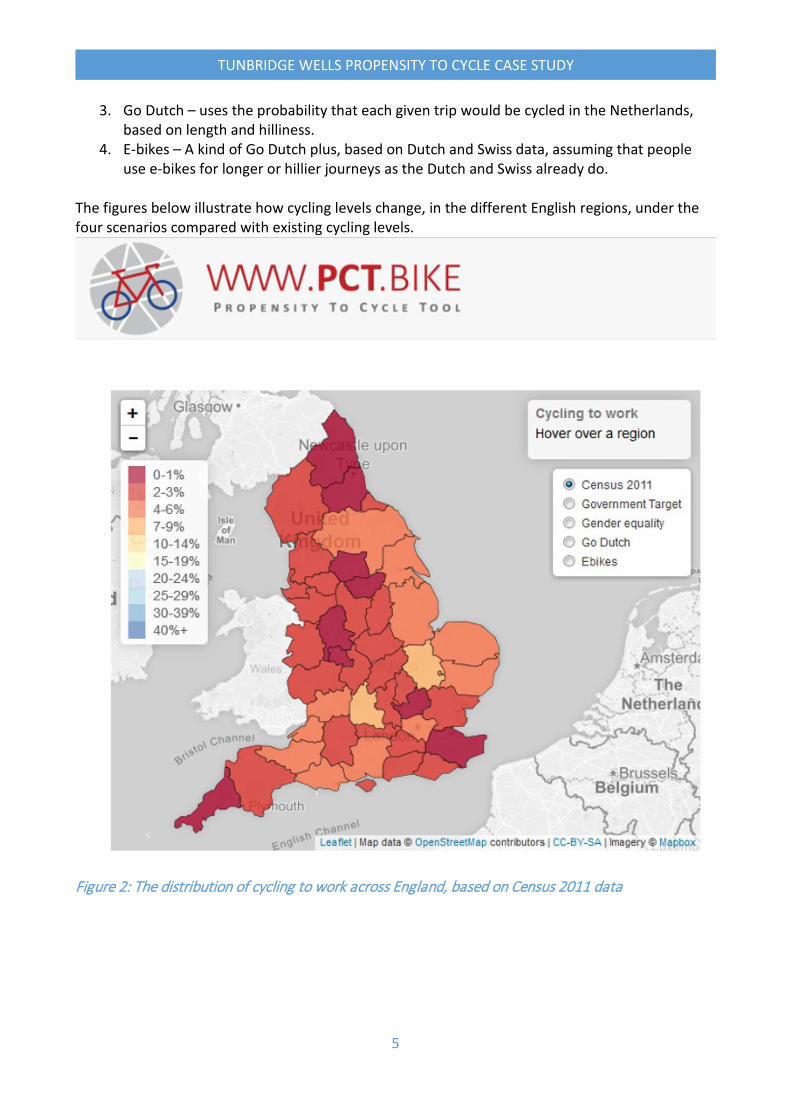
The figures below illustrate how cycling levels change, in the different English regions, under the four scenarios compared with existing cycling levels.
Figure 2: The distribution of cycling to work across England, based on Census 2011 data
6
TUNBRIDGE WELLS PROPENSITY TO CYCLE CASE STUDY
Figure 3: The distribution of cycling to work across England, Scenario 1: Government Target
7
TUNBRIDGE WELLS PROPENSITY TO CYCLE CASE STUDY
Figure 4: The distribution of cycling to work across England, Scenario 2: Gender Equality
8
TUNBRIDGE WELLS PROPENSITY TO CYCLE CASE STUDY
Figure 5: The distribution of cycling to work across England, Scenario 3: Go Dutch

9
TUNBRIDGE WELLS PROPENSITY TO CYCLE CASE STUDY
Figure 6: The distribution of cycling to work across England, Scenario 4: E-bikes
10
TUNBRIDGE WELLS PROPENSITY TO CYCLE CASE STUDY
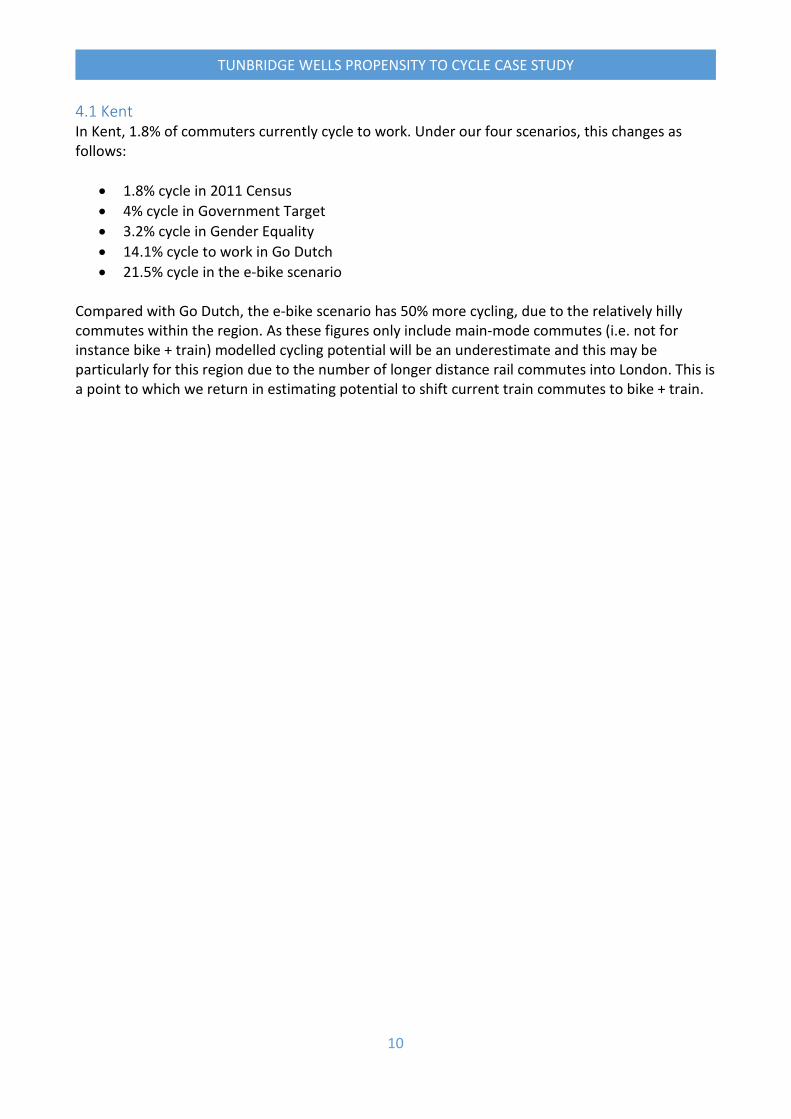
4.1 Kent In Kent, 1.8% of commuters currently cycle to work. Under our four scenarios, this changes as follows:
• 1.8% cycle in 2011 Census • 4% cycle in Government Target • 3.2% cycle in Gender Equality • 14.1% cycle to work in Go Dutch • 21.5% cycle in the e-bike scenario
Compared with Go Dutch, the e-bike scenario has 50% more cycling, due to the relatively hilly commutes within the region. As these figures only include main-mode commutes (i.e. not for instance bike + train) modelled cycling potential will be an underestimate and this may be particularly for this region due to the number of longer distance rail commutes into London. This is a point to which we return in estimating potential to shift current train commutes to bike + train.

11
TUNBRIDGE WELLS PROPENSITY TO CYCLE CASE STUDY
5. E-bikes In this report we have chosen to focus on the e-bike scenario. For a hilly area such as Tunbridge Wells, e-bikes may have great potential to increase cycling, given a supportive environment and infrastructure. In many parts of Germany and Switzerland e-bikes make up a substantial proportion of new bike purchases: 11% of all bicycles sold in Germany are e-bikes (Schleinitz et al in press). E-bikes are increasingly popular in England and if we succeeded in growing cycling in hilly areas, this seems likely to continue. Fishman and Cherry (2016), reviewing a decade of e-bike research, note that e-bikes represent one of the fastest growing segments of the transport market. Over 31 million e-bikes were sold in 2012. E-bikes increase cycle use and have health and CO2 benefits, with the largest market currently being China, followed by The Netherlands and Germany (Fishman and Cherry 2016). In four years, sales in Europe have doubled and in the United States have almost quadrupled (Fishman and Cherry 2016). Potentially, e-bikes could also contribute to improved age and/or gender balance, as well as enabling more cycling by disabled people. Dill and Rose (2012) identify key demographic markets for e-bikes within the United States as including ‘women, older adults, and people with physical limitations’. Reporting a Norwegian study, Fyhri and Fearnley (2015) found that giving e-bikes to study participants led to an increase both in number of trips cycled and cycled distances, with the effect larger for female than for male cyclists. Literature and data on e-bikes, while still limited, suggests that if cycling takes off, e-bikes will be increasingly popular and should help grow cycling further. For hilly counties such as Cornwall and Kent, our e-bike scenario shows substantial growth compared with Go Dutch, highlighting the additional contribution e-bikes can make when infrastructural and cultural barriers to cycling are overcome. In Kent, while 14.1% cycle to work under Go Dutch, the figure rises to 21.5% in the e-bike scenario (compared to 1.8% in the 2011 Census). 5.1 E-bike mode shift in Tunbridge Wells The figure below shows the change in Tunbridge main-mode commuting under our e-bike scenario, compared to current levels of cycling.

12
TUNBRIDGE WELLS PROPENSITY TO CYCLE CASE STUDY
Figure 7: change in Tunbridge Wells commuting, based on e-bike scenario In Tunbridge Wells, the e-bike scenario sees car commutes fall by 5139 trips, or 18% of the current level – a reduction similar to the levels of drop-off in car traffic typically seen in England during school holidays. Indeed, in Tunbridge Wells most of the increase in cycling comes from a decline in car trips, because these trips are relatively short and conducive to cycling, compared with rail trips (making up around two-thirds of the ‘other’ mode commutes). Walking mode share declines by 2,573 trips as some people choose the faster mode of cycling. The e-bike scenario mode share illustrates Tunbridge Wells having normalised cycling, with its mode share close to that for ‘other’ mode commutes and above that of walking. As in the Netherlands, car trips still account for a substantial share of commutes, here just under half of all commutes. It is possible that some of these trips might be switched to multi-modal trips as cycling becomes normalised; either car + (e-)bike or rail + (e-)bike. This is outside the scope of the model but worth highlighting as an additional source of cycling potential.
0
5,000
10,000
15,000
20,000
25,000
30,000
Walking Cycling Car Other
Tunbridge main-mode commuting
2011 Census E-bike scenario
13
TUNBRIDGE WELLS PROPENSITY TO CYCLE CASE STUDY
6. Area-based cycling potential 6.1 Kent
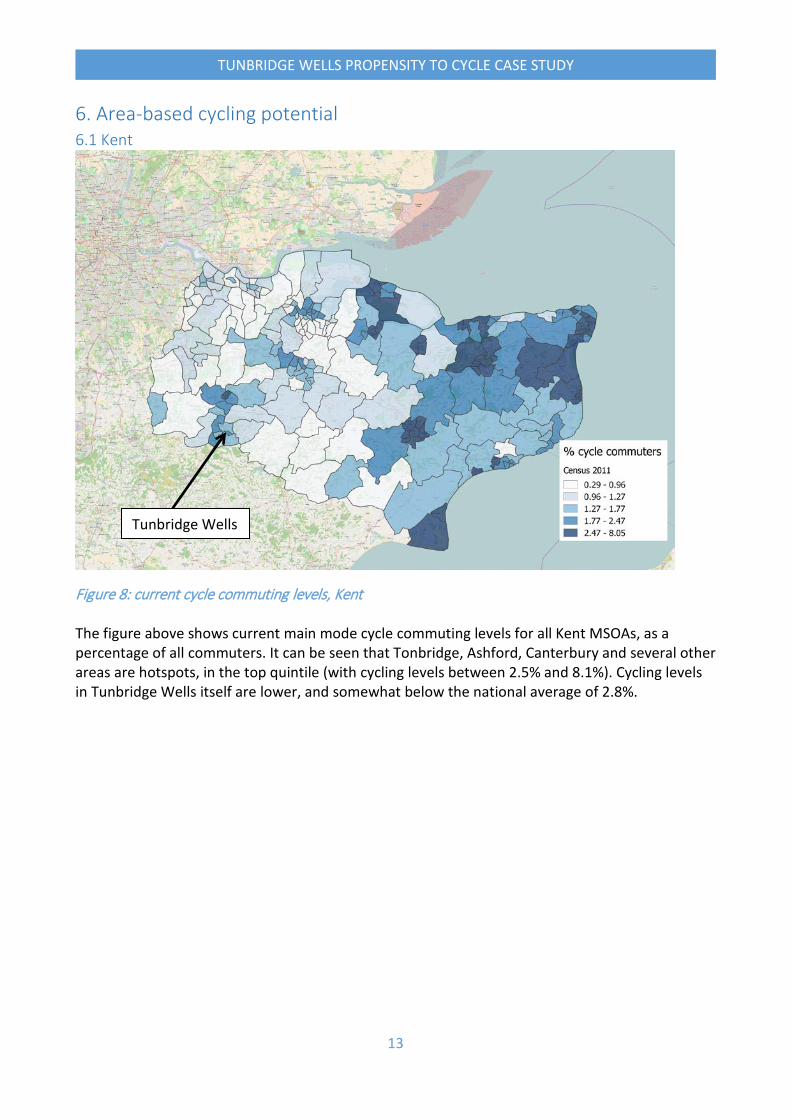
Figure 8: current cycle commuting levels, Kent The figure above shows current main mode cycle commuting levels for all Kent MSOAs, as a percentage of all commuters. It can be seen that Tonbridge, Ashford, Canterbury and several other areas are hotspots, in the top quintile (with cycling levels between 2.5% and 8.1%). Cycling levels in Tunbridge Wells itself are lower, and somewhat below the national average of 2.8%.
Tunbridge Wells

14
TUNBRIDGE WELLS PROPENSITY TO CYCLE CASE STUDY
Figure 9: Kent cycle commuters, 'Go Dutch' scenario The figure above illustrates the distribution of cycling in Kent under the ‘Go Dutch’ scenario. It can be seen that Tunbridge Wells is again not showing the very highest potential, but still has levels of around 15% of all commutes. The flatter areas to the East of the region, and Ashford in the centre, by contrast have levels of around 20-25%.
15
TUNBRIDGE WELLS PROPENSITY TO CYCLE CASE STUDY
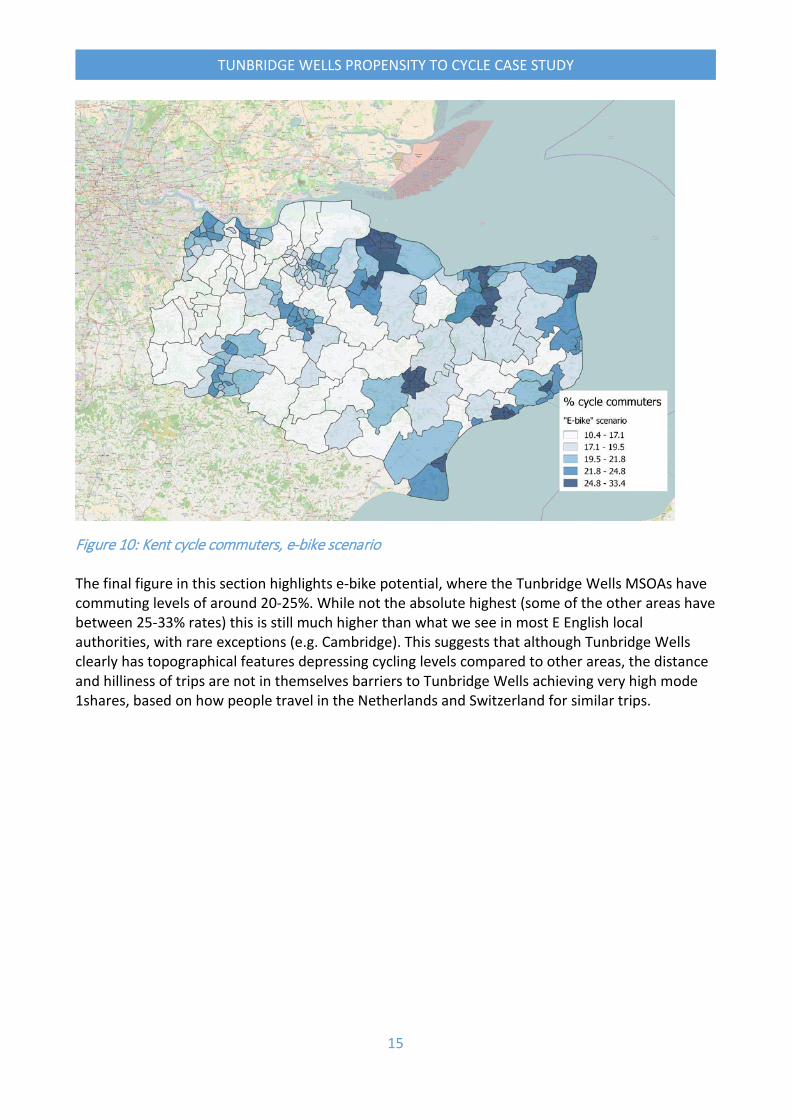
Figure 10: Kent cycle commuters, e-bike scenario The final figure in this section highlights e-bike potential, where the Tunbridge Wells MSOAs have commuting levels of around 20-25%. While not the absolute highest (some of the other areas have between 25-33% rates) this is still much higher than what we see in most E English local authorities, with rare exceptions (e.g. Cambridge). This suggests that although Tunbridge Wells clearly has topographical features depressing cycling levels compared to other areas, the distance and hilliness of trips are not in themselves barriers to Tunbridge Wells achieving very high mode 1shares, based on how people travel in the Netherlands and Switzerland for similar trips.
16
TUNBRIDGE WELLS PROPENSITY TO CYCLE CASE STUDY
6.2 Tunbridge Wells
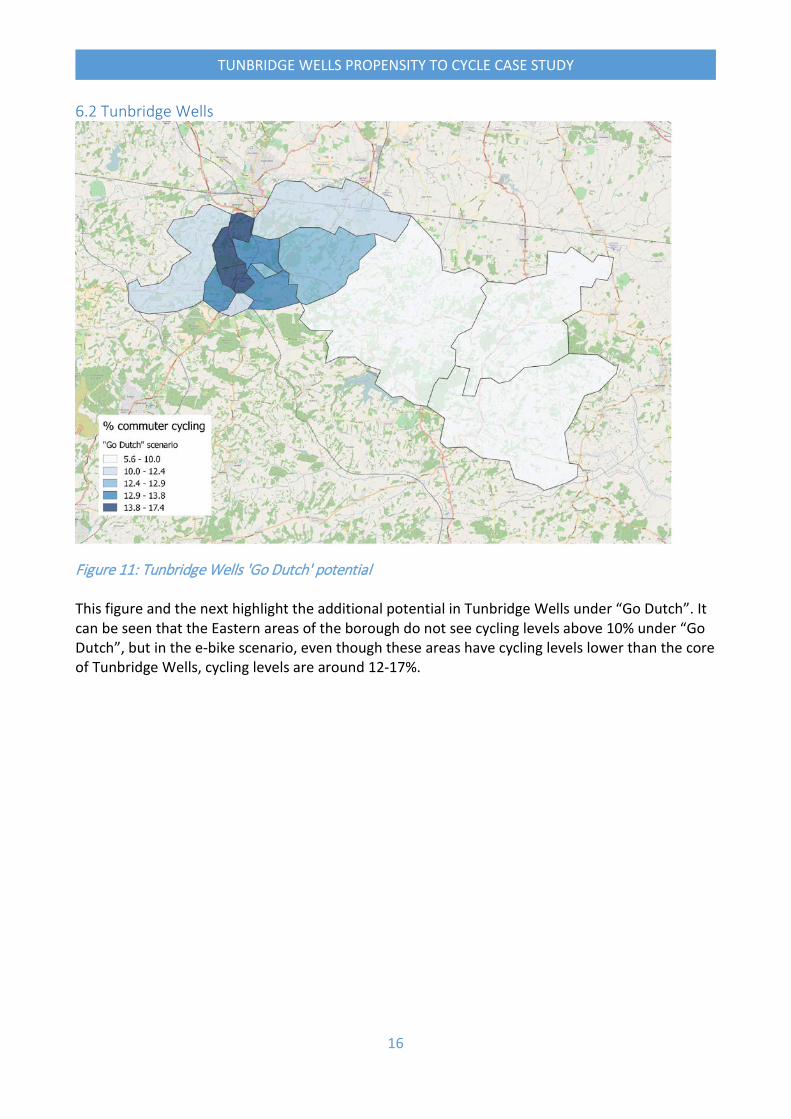
Figure 11: Tunbridge Wells 'Go Dutch' potential This figure and the next highlight the additional potential in Tunbridge Wells under “Go Dutch”. It can be seen that the Eastern areas of the borough do not see cycling levels above 10% under “Go Dutch”, but in the e-bike scenario, even though these areas have cycling levels lower than the core of Tunbridge Wells, cycling levels are around 12-17%.
17
TUNBRIDGE WELLS PROPENSITY TO CYCLE CASE STUDY
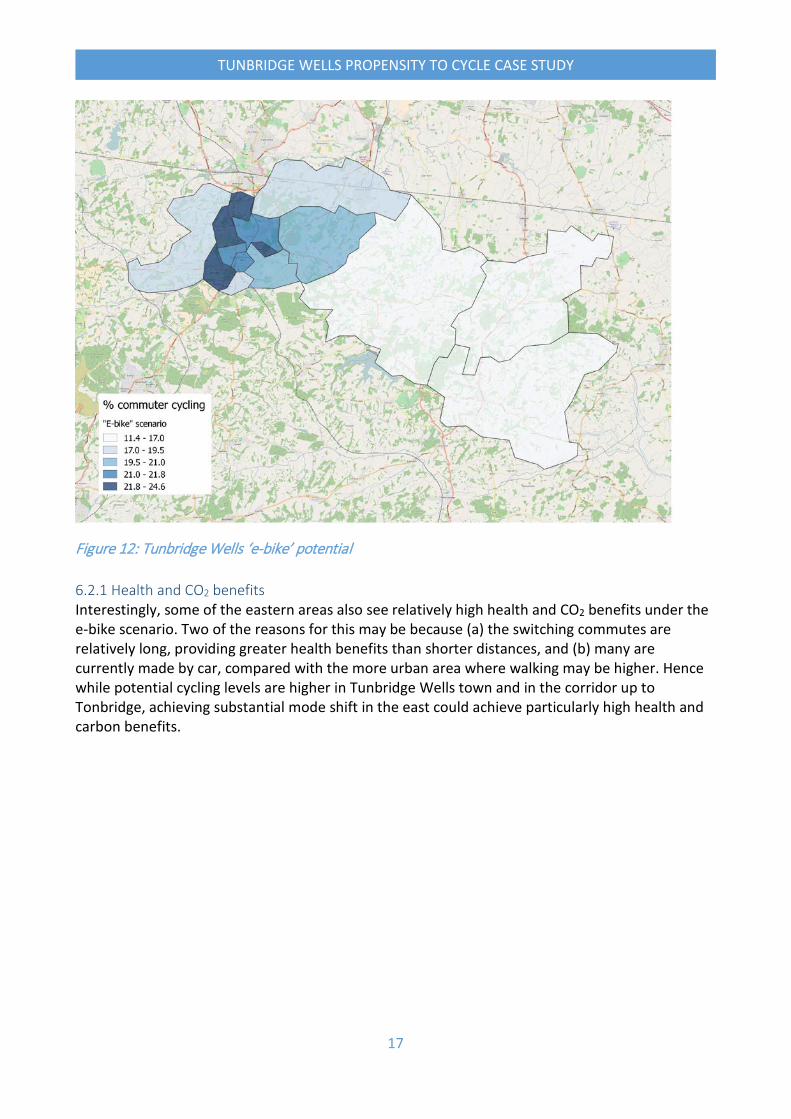
Figure 12: Tunbridge Wells ‘e-bike’ potential 6.2.1 Health and CO2 benefits Interestingly, some of the eastern areas also see relatively high health and CO2 benefits under the e-bike scenario. Two of the reasons for this may be because (a) the switching commutes are relatively long, providing greater health benefits than shorter distances, and (b) many are currently made by car, compared with the more urban area where walking may be higher. Hence while potential cycling levels are higher in Tunbridge Wells town and in the corridor up to Tonbridge, achieving substantial mode shift in the east could achieve particularly high health and carbon benefits.

18
TUNBRIDGE WELLS PROPENSITY TO CYCLE CASE STUDY
Figure 13: health benefits, £, e-bike scenario
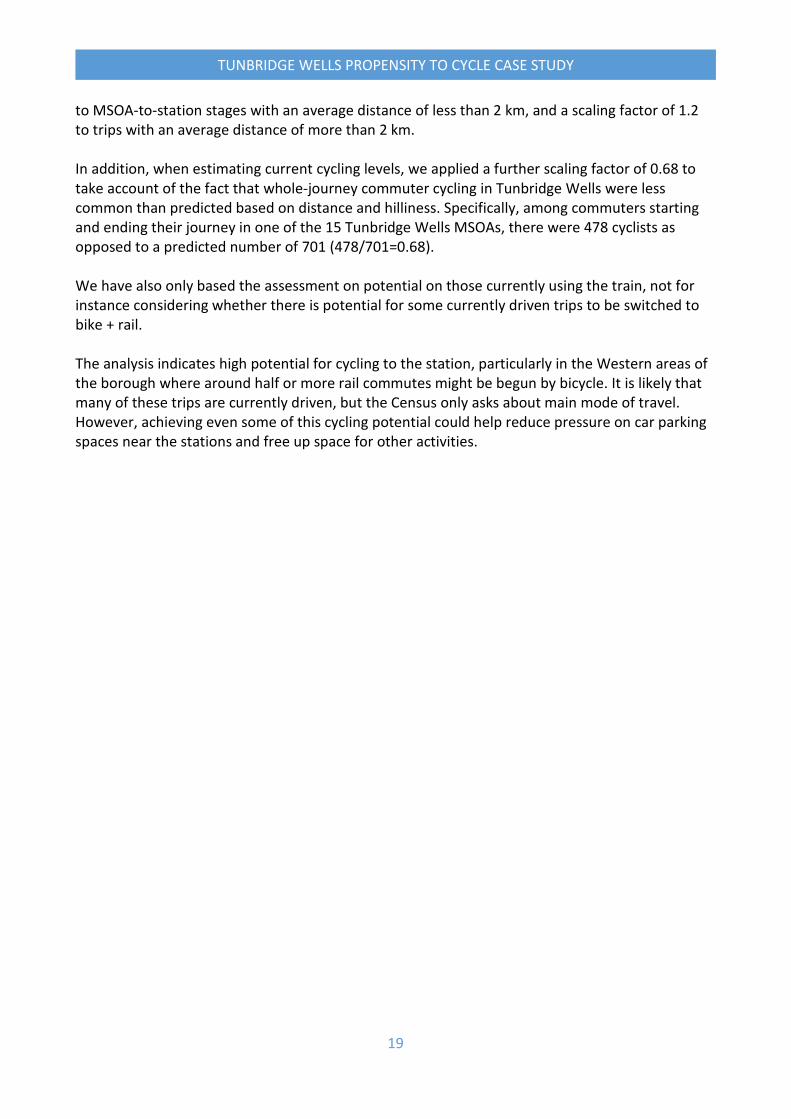
Figure 14: darker areas represent higher CO2 savings from e-bike scenario 6.2.2 Additional rail-cycle commute potential in Tunbridge Wells Bespoke analysis conducted to look at Tunbridge Wells has considered the additional potential of cycle-rail commuting. We have used modified distance-decay equations based on Dutch data suggesting lower rates of cycling to the station for shorter trips and higher rates for longer trips, compared with whole-journey cycling. Specifically, we took into account evidence from the Dutch National Travel Survey (2010-2014) indicating that trips less than 2 km are half as likely to be cycled if they are part of a multi-stage train journey compared to a whole-journey cycling. The same trend was also observed in the UK national travel survey 2000-2014, albeit with more uncertainty as cycling is less common. Conversely, in the same Dutch dataset, cycling to the station was 1.2 times more likely for multi-stage train journeys than for single-stage trips. We therefore applied a scaling factor of 0.5 applied
19
TUNBRIDGE WELLS PROPENSITY TO CYCLE CASE STUDY
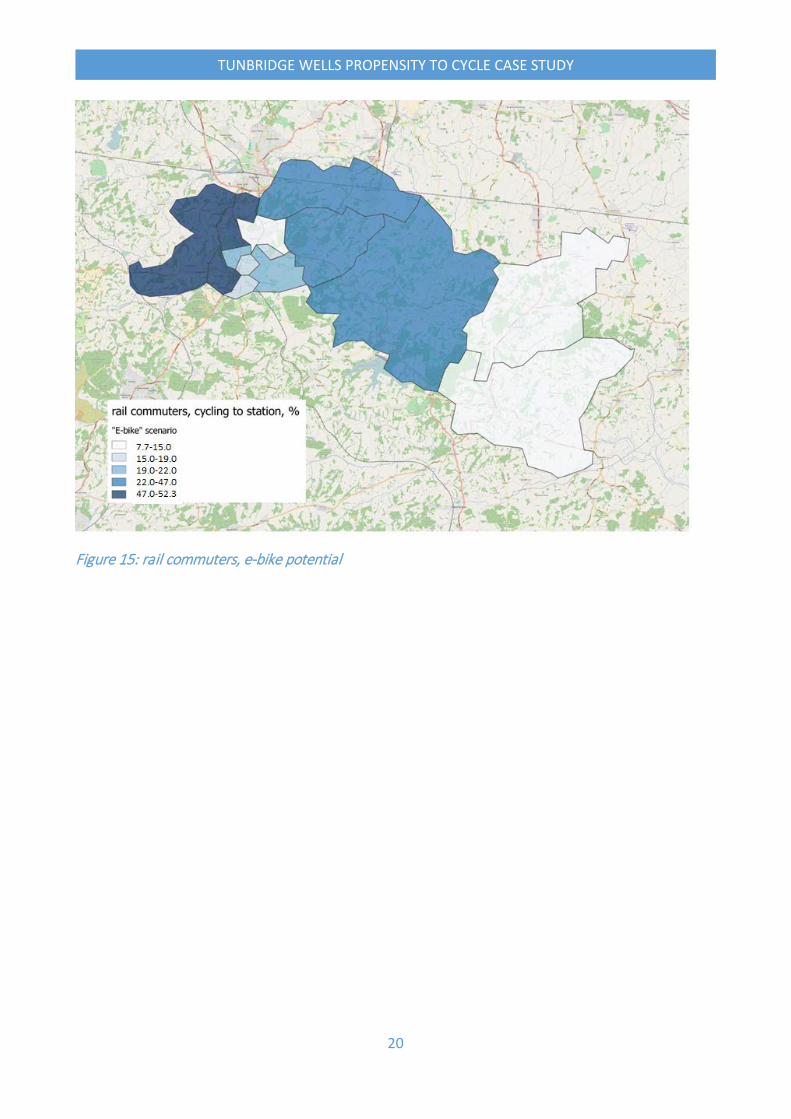
to MSOA-to-station stages with an average distance of less than 2 km, and a scaling factor of 1.2 to trips with an average distance of more than 2 km. In addition, when estimating current cycling levels, we applied a further scaling factor of 0.68 to take account of the fact that whole-journey commuter cycling in Tunbridge Wells were less common than predicted based on distance and hilliness. Specifically, among commuters starting and ending their journey in one of the 15 Tunbridge Wells MSOAs, there were 478 cyclists as opposed to a predicted number of 701 (478/701=0.68). We have also only based the assessment on potential on those currently using the train, not for instance considering whether there is potential for some currently driven trips to be switched to bike + rail. The analysis indicates high potential for cycling to the station, particularly in the Western areas of the borough where around half or more rail commutes might be begun by bicycle. It is likely that many of these trips are currently driven, but the Census only asks about main mode of travel. However, achieving even some of this cycling potential could help reduce pressure on car parking spaces near the stations and free up space for other activities.
20
TUNBRIDGE WELLS PROPENSITY TO CYCLE CASE STUDY
Figure 15: rail commuters, e-bike potential

21
TUNBRIDGE WELLS PROPENSITY TO CYCLE CASE STUDY
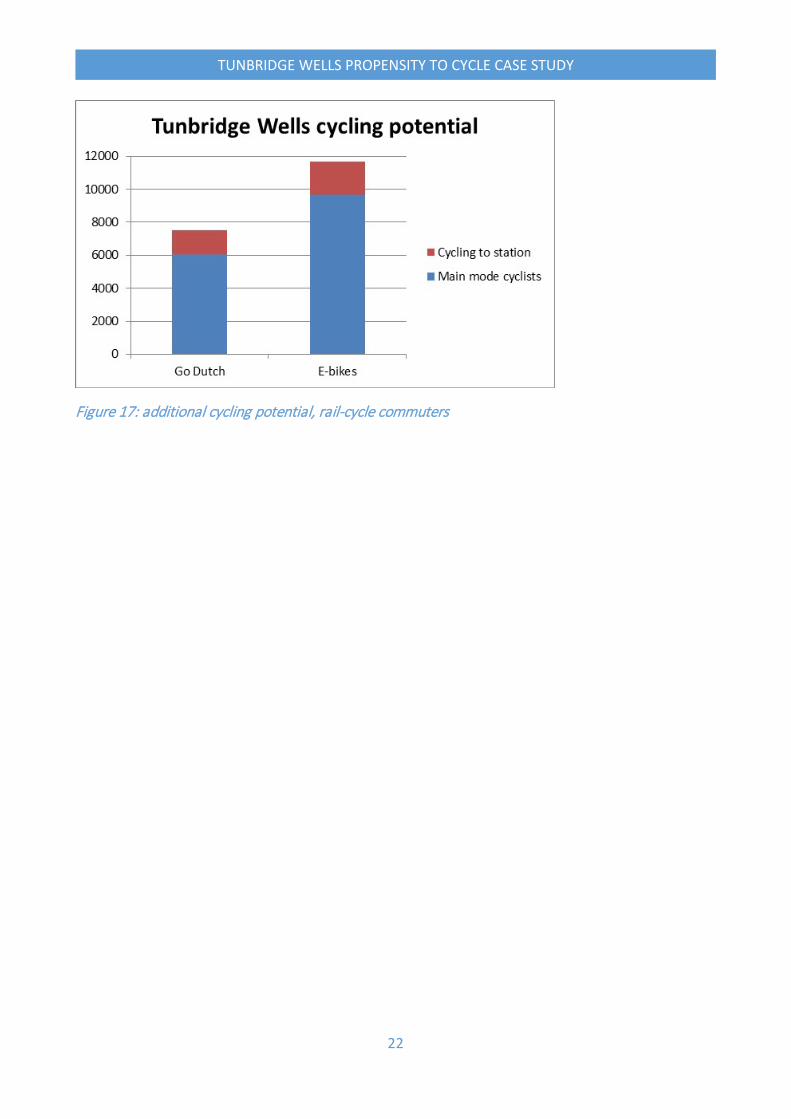
Figure 16: current modelled cycling to station This can be compared with our modelling of what is likely to be the current picture, where even in the high-potential areas, we estimate that only 2-4% of rail commuters are currently cycling to the station, less than a tenth of the cycling potential under the e-bike scenario. The image below illustrates the additional cyclists that might be added were existing rail commuters to cycle as per the e-bike scenario. It can be seen that the main PCT results for Tunbridge Wells are conservative, because a relatively high proportion of commutes are by rail (16.4%, as opposed to a national average of 5.7% percent) and we do not currently account for the potential for multi-modal commuting.
22
TUNBRIDGE WELLS PROPENSITY TO CYCLE CASE STUDY
Figure 17: additional cycling potential, rail-cycle commuters
23
TUNBRIDGE WELLS PROPENSITY TO CYCLE CASE STUDY
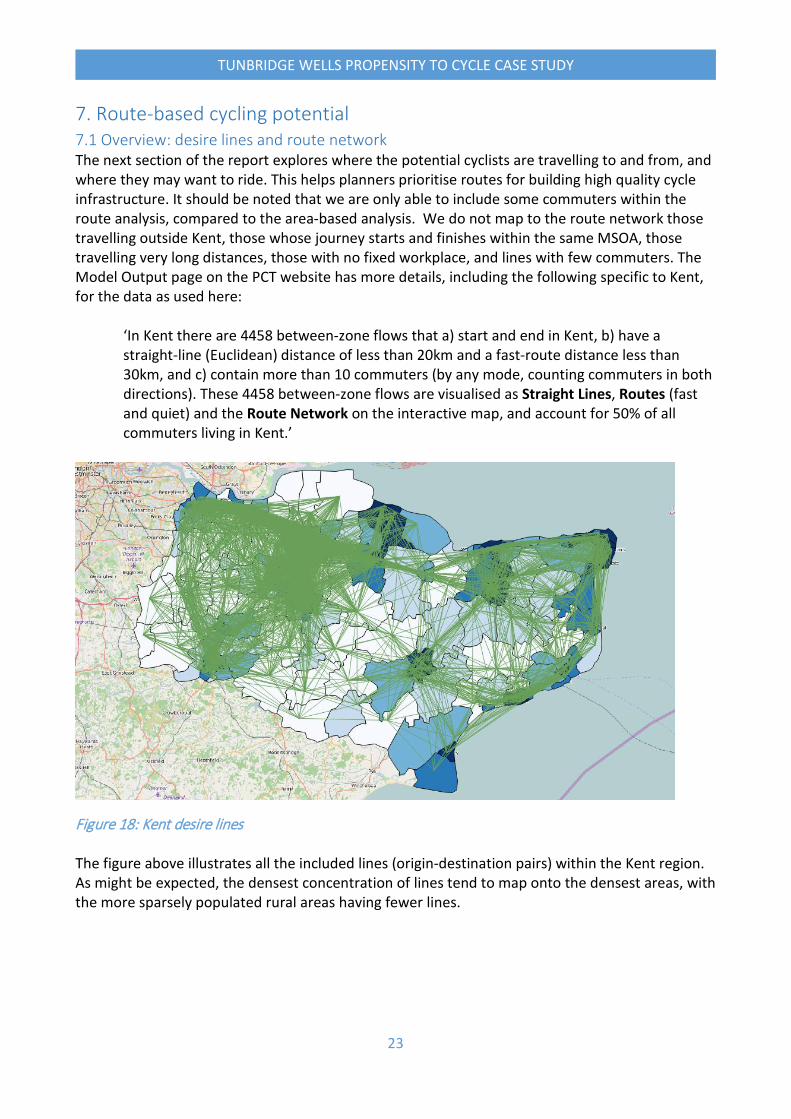
7. Route-based cycling potential 7.1 Overview: desire lines and route network The next section of the report explores where the potential cyclists are travelling to and from, and where they may want to ride. This helps planners prioritise routes for building high quality cycle infrastructure. It should be noted that we are only able to include some commuters within the route analysis, compared to the area-based analysis. We do not map to the route network those travelling outside Kent, those whose journey starts and finishes within the same MSOA, those travelling very long distances, those with no fixed workplace, and lines with few commuters. The Model Output page on the PCT website has more details, including the following specific to Kent, for the data as used here:
‘In Kent there are 4458 between-zone flows that a) start and end in Kent, b) have a straight-line (Euclidean) distance of less than 20km and a fast-route distance less than 30km, and c) contain more than 10 commuters (by any mode, counting commuters in both directions). These 4458 between-zone flows are visualised as Straight Lines, Routes (fast and quiet) and the Route Network on the interactive map, and account for 50% of all commuters living in Kent.’
Figure 18: Kent desire lines The figure above illustrates all the included lines (origin-destination pairs) within the Kent region. As might be expected, the densest concentration of lines tend to map onto the densest areas, with the more sparsely populated rural areas having fewer lines.
24
TUNBRIDGE WELLS PROPENSITY TO CYCLE CASE STUDY
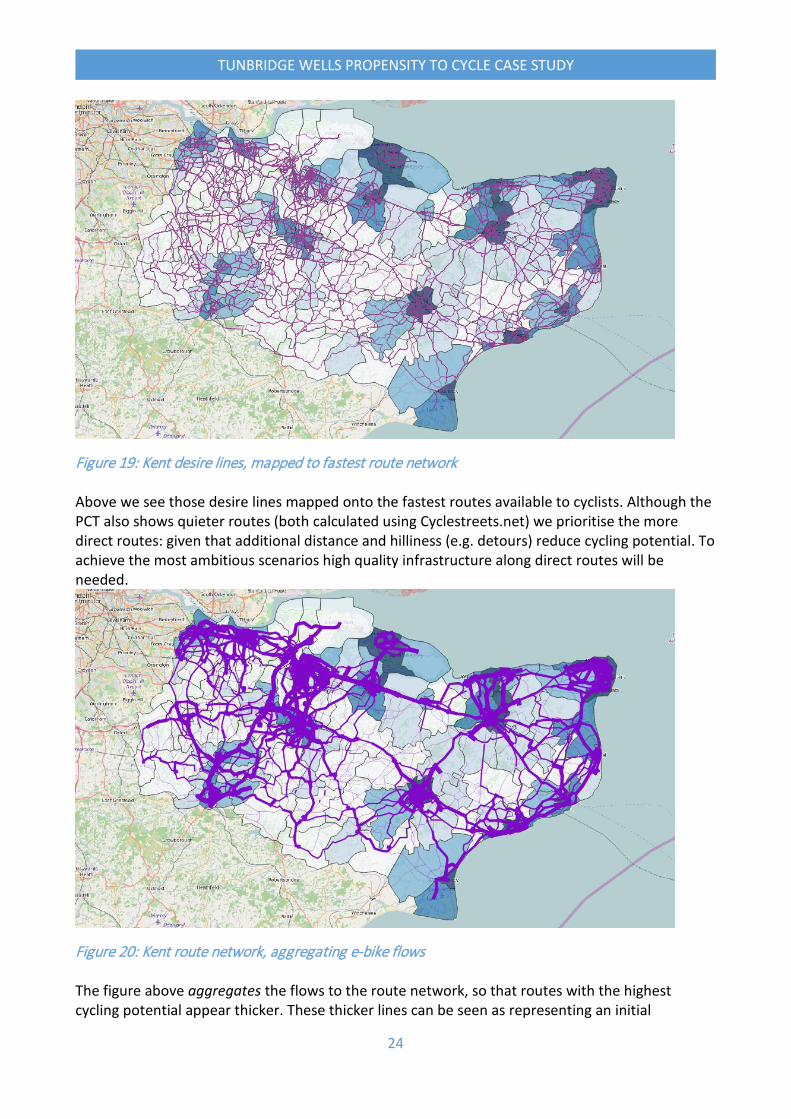
Figure 19: Kent desire lines, mapped to fastest route network Above we see those desire lines mapped onto the fastest routes available to cyclists. Although the PCT also shows quieter routes (both calculated using Cyclestreets.net) we prioritise the more direct routes: given that additional distance and hilliness (e.g. detours) reduce cycling potential. To achieve the most ambitious scenarios high quality infrastructure along direct routes will be needed.
Figure 20: Kent route network, aggregating e-bike flows The figure above aggregates the flows to the route network, so that routes with the highest cycling potential appear thicker. These thicker lines can be seen as representing an initial
25
TUNBRIDGE WELLS PROPENSITY TO CYCLE CASE STUDY
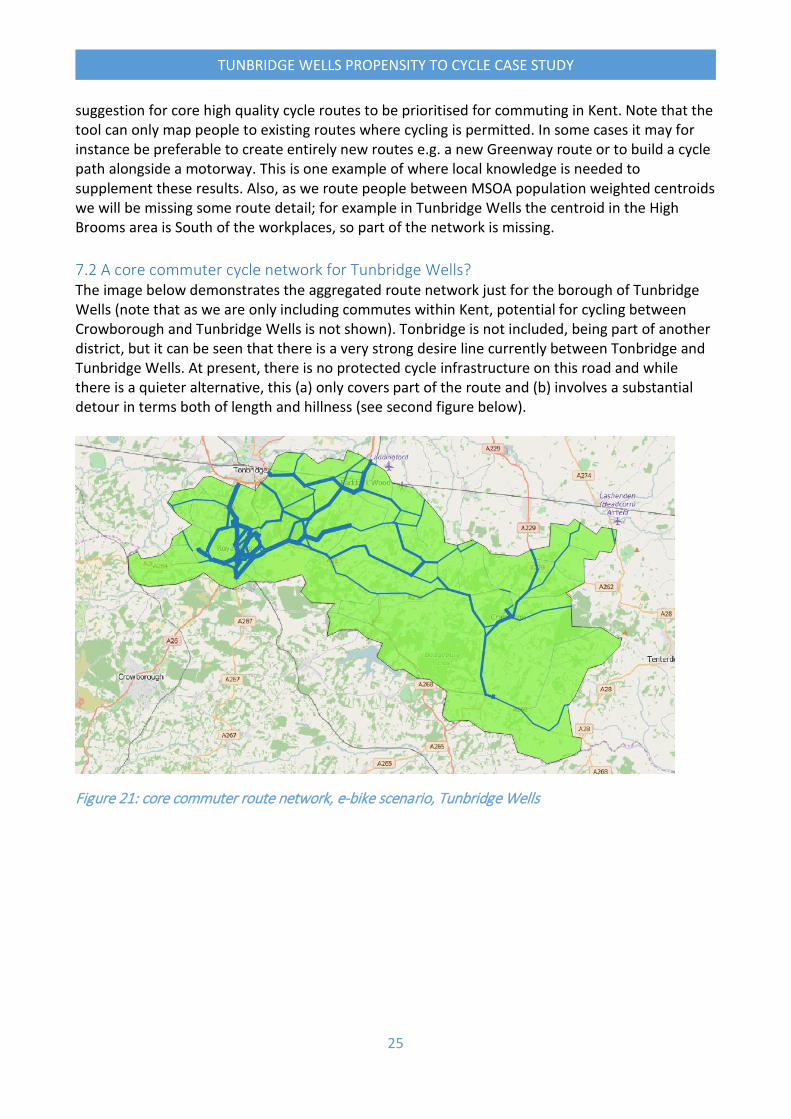
suggestion for core high quality cycle routes to be prioritised for commuting in Kent. Note that the tool can only map people to existing routes where cycling is permitted. In some cases it may for instance be preferable to create entirely new routes e.g. a new Greenway route or to build a cycle path alongside a motorway. This is one example of where local knowledge is needed to supplement these results. Also, as we route people between MSOA population weighted centroids we will be missing some route detail; for example in Tunbridge Wells the centroid in the High Brooms area is South of the workplaces, so part of the network is missing. 7.2 A core commuter cycle network for Tunbridge Wells? The image below demonstrates the aggregated route network just for the borough of Tunbridge Wells (note that as we are only including commutes within Kent, potential for cycling between Crowborough and Tunbridge Wells is not shown). Tonbridge is not included, being part of another district, but it can be seen that there is a very strong desire line currently between Tonbridge and Tunbridge Wells. At present, there is no protected cycle infrastructure on this road and while there is a quieter alternative, this (a) only covers part of the route and (b) involves a substantial detour in terms both of length and hillness (see second figure below).
Figure 21: core commuter route network, e-bike scenario, Tunbridge Wells
26
TUNBRIDGE WELLS PROPENSITY TO CYCLE CASE STUDY
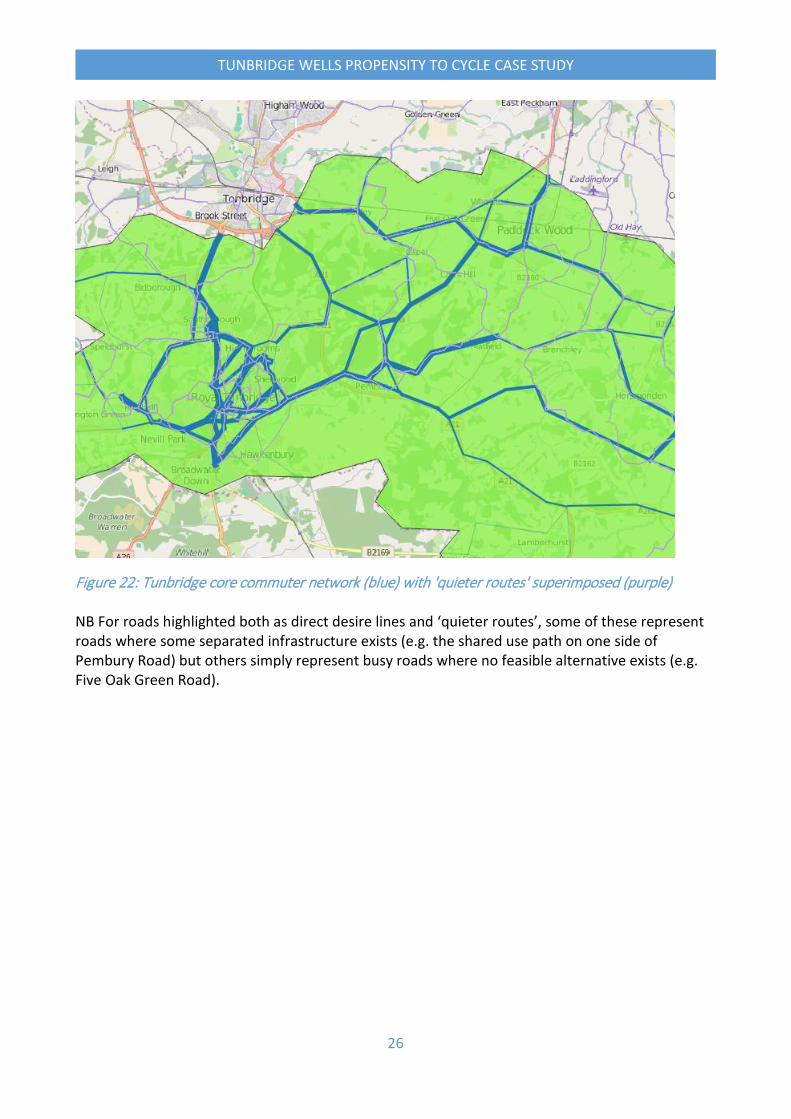
Figure 22: Tunbridge core commuter network (blue) with 'quieter routes' superimposed (purple) NB For roads highlighted both as direct desire lines and ‘quieter routes’, some of these represent roads where some separated infrastructure exists (e.g. the shared use path on one side of Pembury Road) but others simply represent busy roads where no feasible alternative exists (e.g. Five Oak Green Road).
27
TUNBRIDGE WELLS PROPENSITY TO CYCLE CASE STUDY
7.3 Time penalties and detours
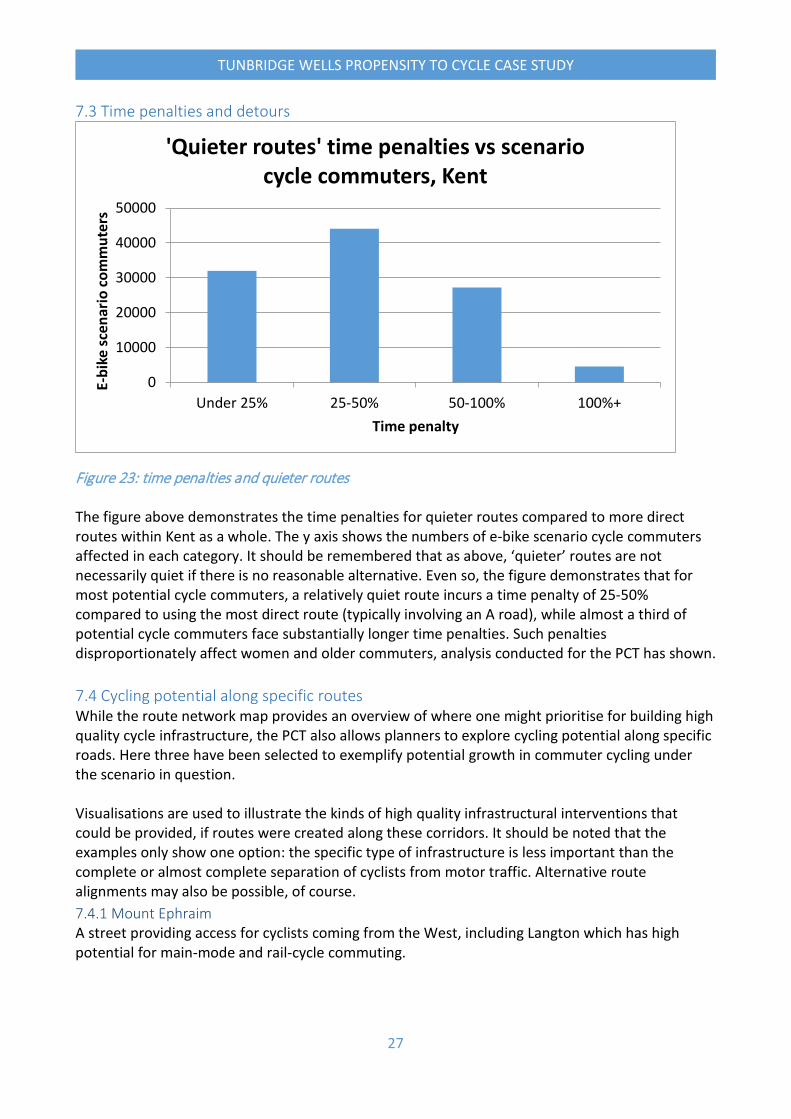
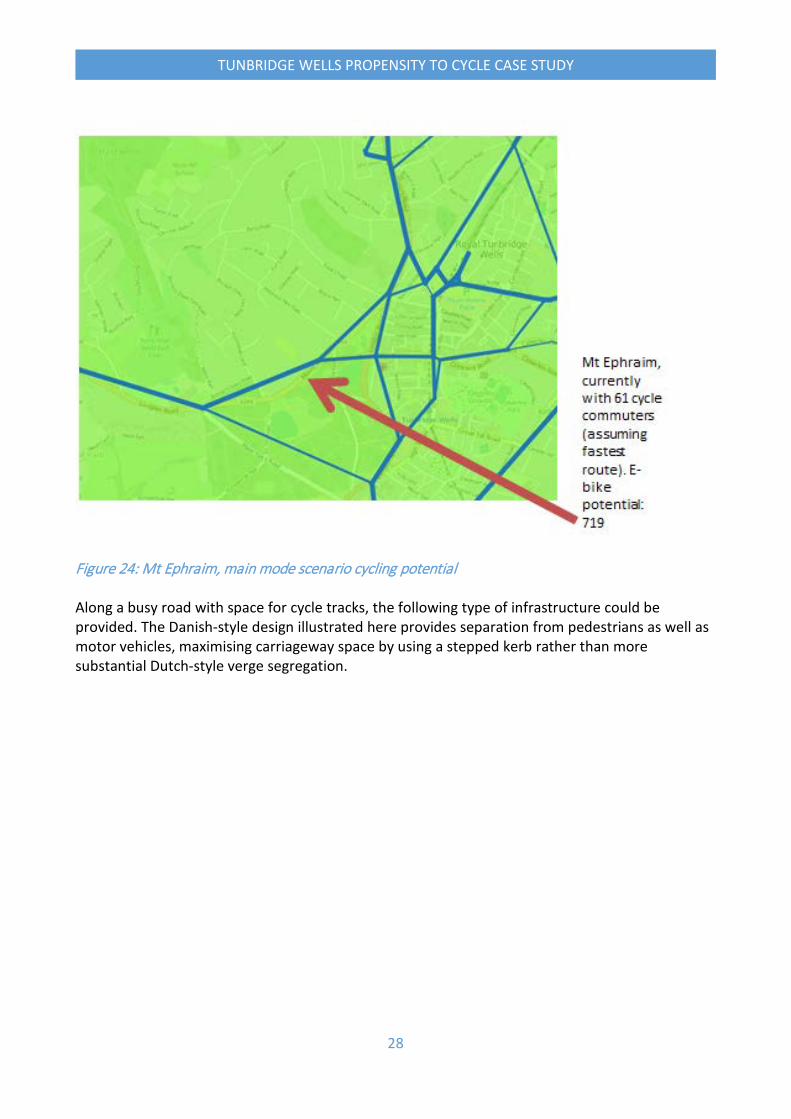
Figure 23: time penalties and quieter routes The figure above demonstrates the time penalties for quieter routes compared to more direct routes within Kent as a whole. The y axis shows the numbers of e-bike scenario cycle commuters affected in each category. It should be remembered that as above, ‘quieter’ routes are not necessarily quiet if there is no reasonable alternative. Even so, the figure demonstrates that for most potential cycle commuters, a relatively quiet route incurs a time penalty of 25-50% compared to using the most direct route (typically involving an A road), while almost a third of potential cycle commuters face substantially longer time penalties. Such penalties disproportionately affect women and older commuters, analysis conducted for the PCT has shown. 7.4 Cycling potential along specific routes While the route network map provides an overview of where one might prioritise for building high quality cycle infrastructure, the PCT also allows planners to explore cycling potential along specific roads. Here three have been selected to exemplify potential growth in commuter cycling under the scenario in question. Visualisations are used to illustrate the kinds of high quality infrastructural interventions that could be provided, if routes were created along these corridors. It should be noted that the examples only show one option: the specific type of infrastructure is less important than the complete or almost complete separation of cyclists from motor traffic. Alternative route alignments may also be possible, of course. 7.4.1 Mount Ephraim A street providing access for cyclists coming from the West, including Langton which has high potential for main-mode and rail-cycle commuting.
0
10000
20000
30000
40000
50000
Under 25% 25-50% 50-100% 100%+
E-bi
ke sc
enar
io co
mm
uter
s
Time penalty
'Quieter routes' time penalties vs scenario cycle commuters, Kent
28
TUNBRIDGE WELLS PROPENSITY TO CYCLE CASE STUDY
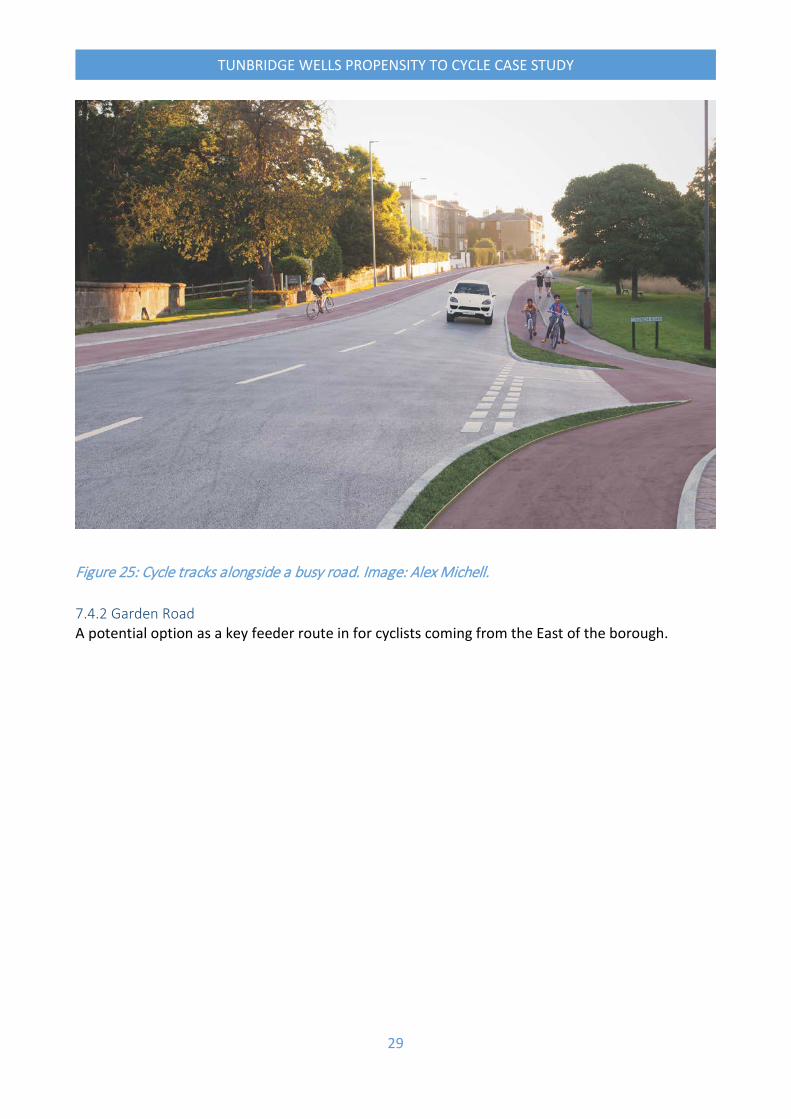
Figure 24: Mt Ephraim, main mode scenario cycling potential Along a busy road with space for cycle tracks, the following type of infrastructure could be provided. The Danish-style design illustrated here provides separation from pedestrians as well as motor vehicles, maximising carriageway space by using a stepped kerb rather than more substantial Dutch-style verge segregation.
29
TUNBRIDGE WELLS PROPENSITY TO CYCLE CASE STUDY
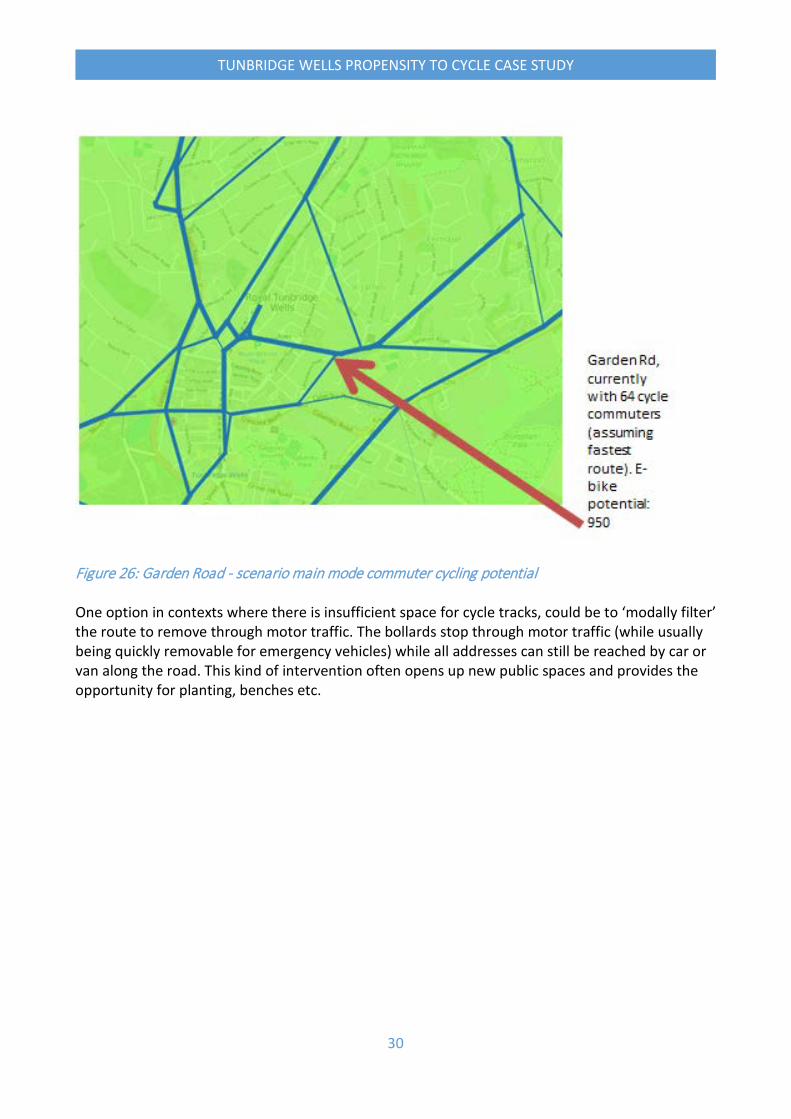
Figure 25: Cycle tracks alongside a busy road. Image: Alex Michell. 7.4.2 Garden Road A potential option as a key feeder route in for cyclists coming from the East of the borough.
30
TUNBRIDGE WELLS PROPENSITY TO CYCLE CASE STUDY
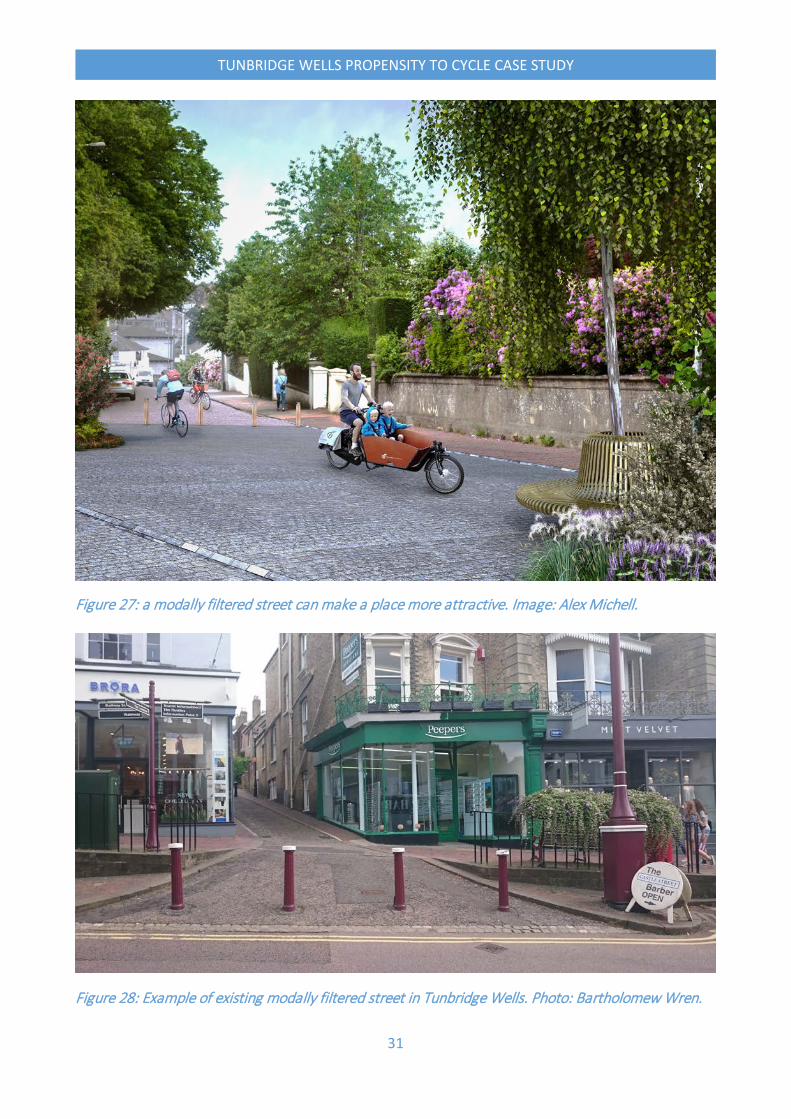
Figure 26: Garden Road - scenario main mode commuter cycling potential One option in contexts where there is insufficient space for cycle tracks, could be to ‘modally filter’ the route to remove through motor traffic. The bollards stop through motor traffic (while usually being quickly removable for emergency vehicles) while all addresses can still be reached by car or van along the road. This kind of intervention often opens up new public spaces and provides the opportunity for planting, benches etc.
31
TUNBRIDGE WELLS PROPENSITY TO CYCLE CASE STUDY
Figure 27: a modally filtered street can make a place more attractive. Image: Alex Michell.
Figure 28: Example of existing modally filtered street in Tunbridge Wells. Photo: Bartholomew Wren.
32
TUNBRIDGE WELLS PROPENSITY TO CYCLE CASE STUDY
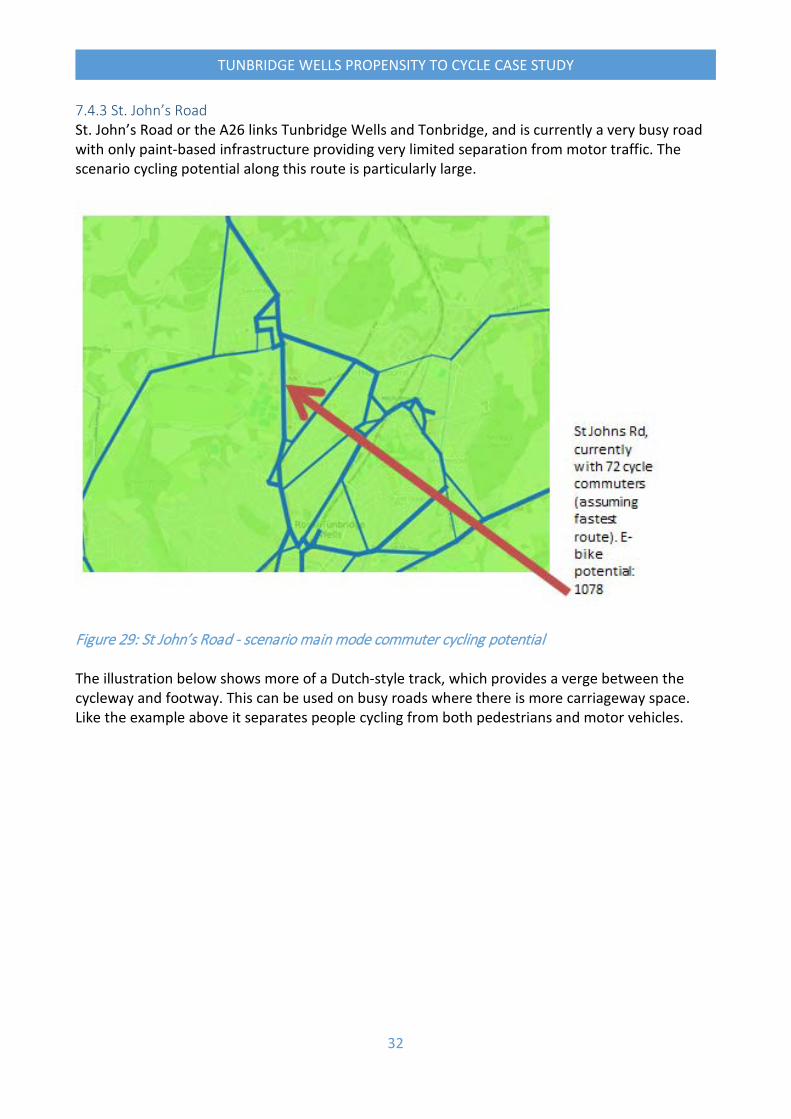
7.4.3 St. John’s Road St. John’s Road or the A26 links Tunbridge Wells and Tonbridge, and is currently a very busy road with only paint-based infrastructure providing very limited separation from motor traffic. The scenario cycling potential along this route is particularly large.
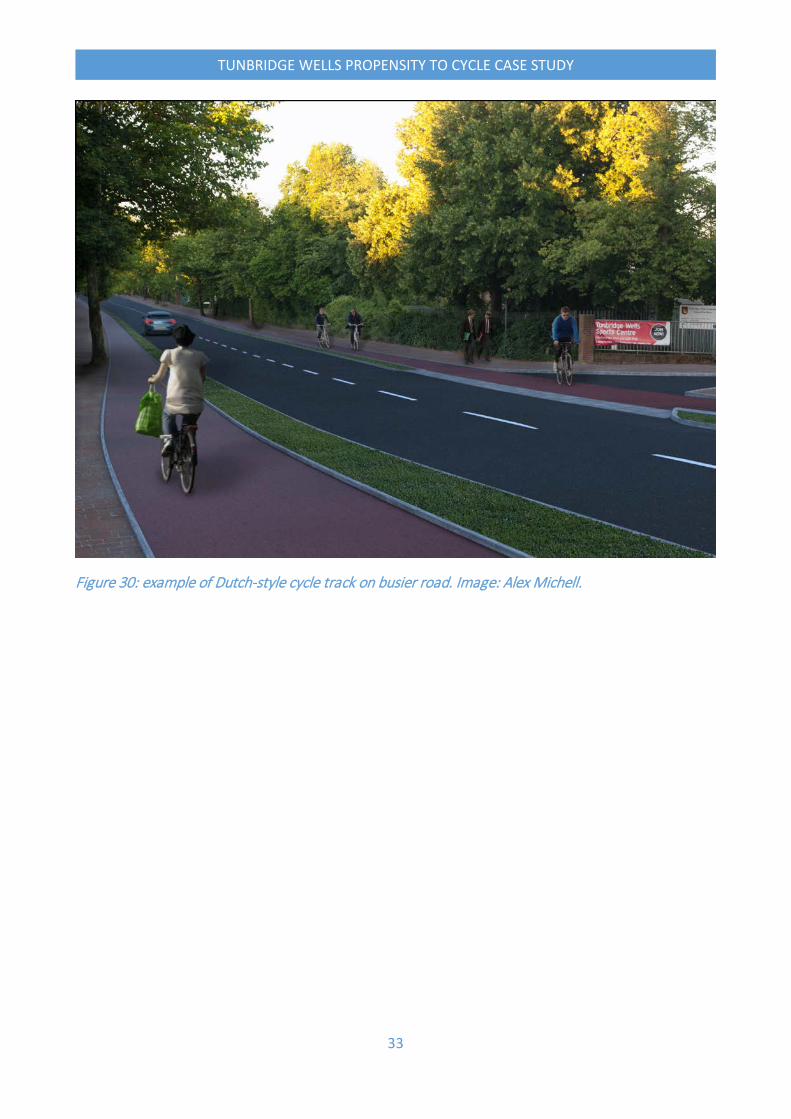
Figure 29: St John’s Road - scenario main mode commuter cycling potential The illustration below shows more of a Dutch-style track, which provides a verge between the cycleway and footway. This can be used on busy roads where there is more carriageway space. Like the example above it separates people cycling from both pedestrians and motor vehicles.
33
TUNBRIDGE WELLS PROPENSITY TO CYCLE CASE STUDY
Figure 30: example of Dutch-style cycle track on busier road. Image: Alex Michell.
34
TUNBRIDGE WELLS PROPENSITY TO CYCLE CASE STUDY
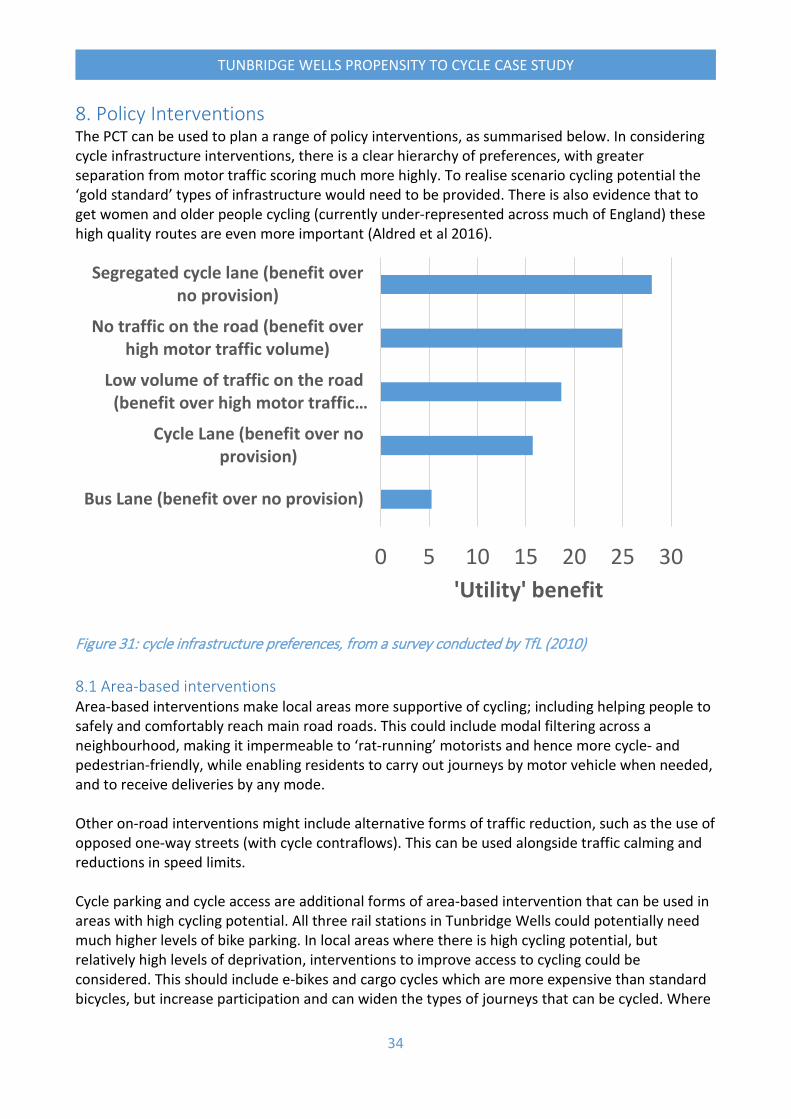
8. Policy Interventions The PCT can be used to plan a range of policy interventions, as summarised below. In considering cycle infrastructure interventions, there is a clear hierarchy of preferences, with greater separation from motor traffic scoring much more highly. To realise scenario cycling potential the ‘gold standard’ types of infrastructure would need to be provided. There is also evidence that to get women and older people cycling (currently under-represented across much of England) these high quality routes are even more important (Aldred et al 2016).
Figure 31: cycle infrastructure preferences, from a survey conducted by TfL (2010) 8.1 Area-based interventions Area-based interventions make local areas more supportive of cycling; including helping people to safely and comfortably reach main road roads. This could include modal filtering across a neighbourhood, making it impermeable to ‘rat-running’ motorists and hence more cycle- and pedestrian-friendly, while enabling residents to carry out journeys by motor vehicle when needed, and to receive deliveries by any mode. Other on-road interventions might include alternative forms of traffic reduction, such as the use of opposed one-way streets (with cycle contraflows). This can be used alongside traffic calming and reductions in speed limits. Cycle parking and cycle access are additional forms of area-based intervention that can be used in areas with high cycling potential. All three rail stations in Tunbridge Wells could potentially need much higher levels of bike parking. In local areas where there is high cycling potential, but relatively high levels of deprivation, interventions to improve access to cycling could be considered. This should include e-bikes and cargo cycles which are more expensive than standard bicycles, but increase participation and can widen the types of journeys that can be cycled. Where
0 5 10 15 20 25 30
Bus Lane (benefit over no provision)
Cycle Lane (benefit over noprovision)
Low volume of traffic on the road(benefit over high motor traffic…
No traffic on the road (benefit overhigh motor traffic volume)
Segregated cycle lane (benefit overno provision)
'Utility' benefit
35
TUNBRIDGE WELLS PROPENSITY TO CYCLE CASE STUDY
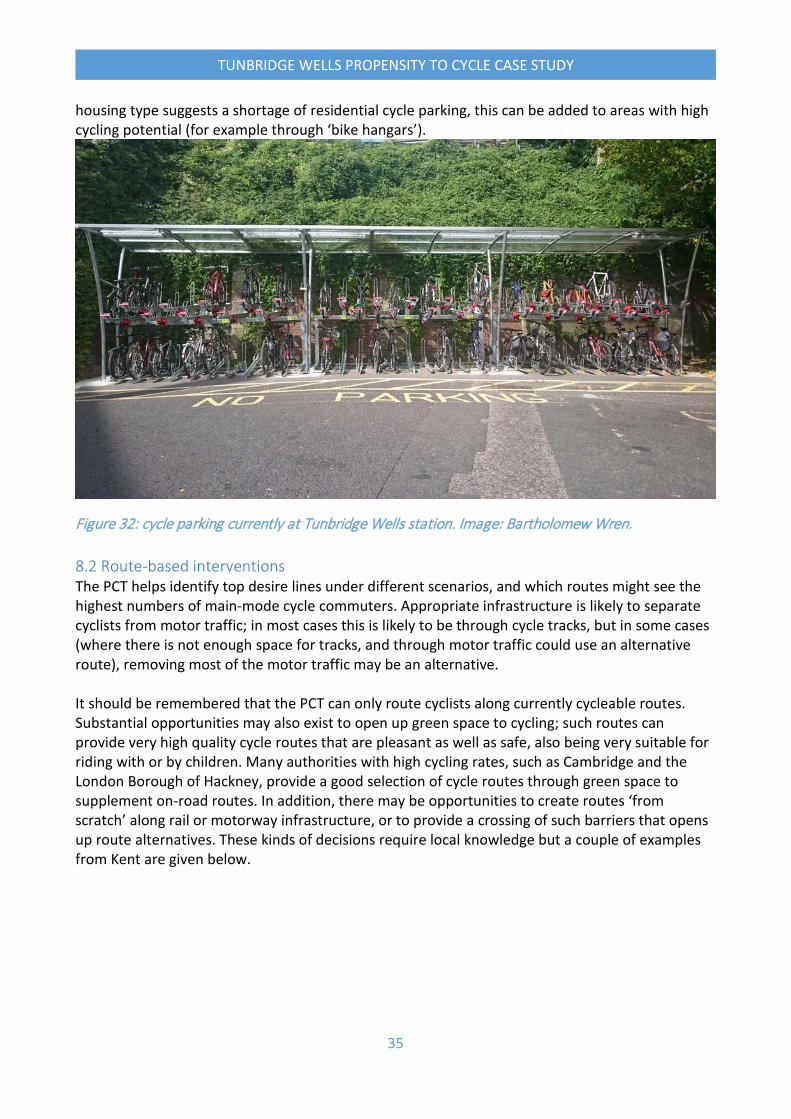
housing type suggests a shortage of residential cycle parking, this can be added to areas with high cycling potential (for example through ‘bike hangars’).
Figure 32: cycle parking currently at Tunbridge Wells station. Image: Bartholomew Wren. 8.2 Route-based interventions The PCT helps identify top desire lines under different scenarios, and which routes might see the highest numbers of main-mode cycle commuters. Appropriate infrastructure is likely to separate cyclists from motor traffic; in most cases this is likely to be through cycle tracks, but in some cases (where there is not enough space for tracks, and through motor traffic could use an alternative route), removing most of the motor traffic may be an alternative. It should be remembered that the PCT can only route cyclists along currently cycleable routes. Substantial opportunities may also exist to open up green space to cycling; such routes can provide very high quality cycle routes that are pleasant as well as safe, also being very suitable for riding with or by children. Many authorities with high cycling rates, such as Cambridge and the London Borough of Hackney, provide a good selection of cycle routes through green space to supplement on-road routes. In addition, there may be opportunities to create routes ‘from scratch’ along rail or motorway infrastructure, or to provide a crossing of such barriers that opens up route alternatives. These kinds of decisions require local knowledge but a couple of examples from Kent are given below.
36
TUNBRIDGE WELLS PROPENSITY TO CYCLE CASE STUDY
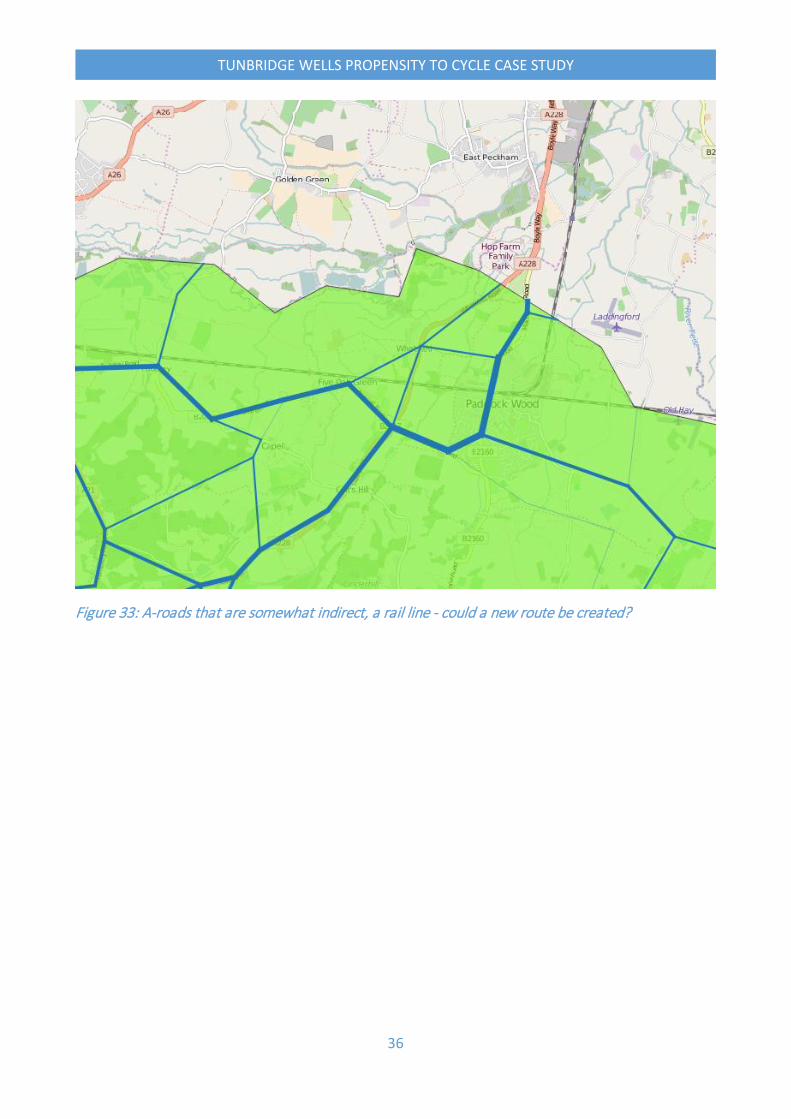
Figure 33: A-roads that are somewhat indirect, a rail line - could a new route be created?
37
TUNBRIDGE WELLS PROPENSITY TO CYCLE CASE STUDY
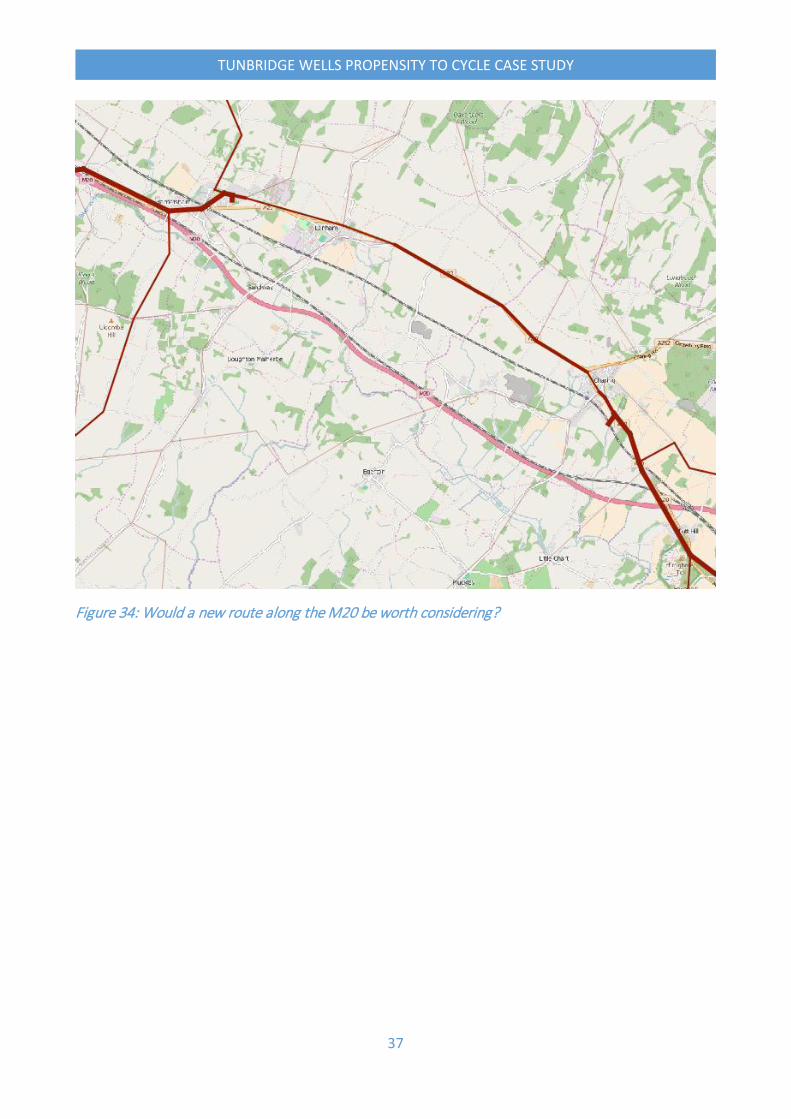
Figure 34: Would a new route along the M20 be worth considering?
38
TUNBRIDGE WELLS PROPENSITY TO CYCLE CASE STUDY
9. Limitations of the PCT Finally, the limitations of the tool must be remembered. The tool currently only includes main-mode commuter cycling, which represents a small proportion of cycling potential (and as explained above, the route-based analysis does not include all main-mode commuter cycling potential). In high-cycling countries such as the Netherlands, people are as likely or more so to cycle non-commute trips; which in England represent over four-fifths of all trips. Hence when considering potential numbers of cyclists along specific roads, while the e-bike scenario is ambitious it also only covers around 15% of all cycling potential. If such a scenario were really achieved, numbers of cyclists along the roads in question might well be six or seven times higher. A related point is that even if we are only considering commute trips, some trips are ‘chained’ and so enabling commuter cycling along may not be sufficient to generate mode shift. The most obvious example is cycling to school, where it has been shown that very high quality infrastructure is needed (Aldred 2015). If a corridor provides ‘good-enough’ infrastructure for adult cycling, but not for child cycling, any adults who need to take children to school en route (disproportionately women) will also be unable to use it. In terms of routes, where the PCT is being used to help plan a network, this currently requires additional consideration of non-commute destinations, such as shops, schools, services and leisure destinations, to ensure that all trips people might want to cycle are facilitated, not only commutes. As health benefits of cycling are most important at older ages (where commutes are less common) this will also be important for health.
39
TUNBRIDGE WELLS PROPENSITY TO CYCLE CASE STUDY
10. Bibliography Aldred, R. (2015) Adults’ attitudes towards child cycling: a study of the impact of infrastructure. European Journal of Transport and Infrastructure Research 15, 92-115. Aldred, R., Elliott, B., Woodcock, J. and Goodman, A. 2016, Cycling provision separated from motor traffic: a systematic review exploring whether stated preferences vary by gender and age, Transport Reviews, 1-27, in press Dill, J. and Rose, G., 2012, “E-bikes and Transportation Policy: Insights from Early Adopters,” Transportation Research Record: Journal of the Transportation Research Board, http://trrjournalonline.trb.org/doi/abs/10.3141/2314-01 Fishman, E. and Cherry, C., 2016, E-bikes in the Mainstream: Reviewing a Decade of Research, Transport Reviews, 36:1, 72-91 Fyhru, A. and Fearnley, N. 2015. Effects of e-bikes on bicycle use and mode share, Transportation Research Part D 36, 45–52 Schleinitz, K., Petzoldt, T., Franke-Bartholdt, L., Krems, J.F., & Gehlert, T. (in press). The German Naturalistic Cycling Study – Comparing cycling speed of riders of different e-bikes and conventional bicycles. Safety Science. Transport for London. 2010. Cycling Behaviour Survey (three reports). London: TfL.