Embed Size (px)
Citation preview
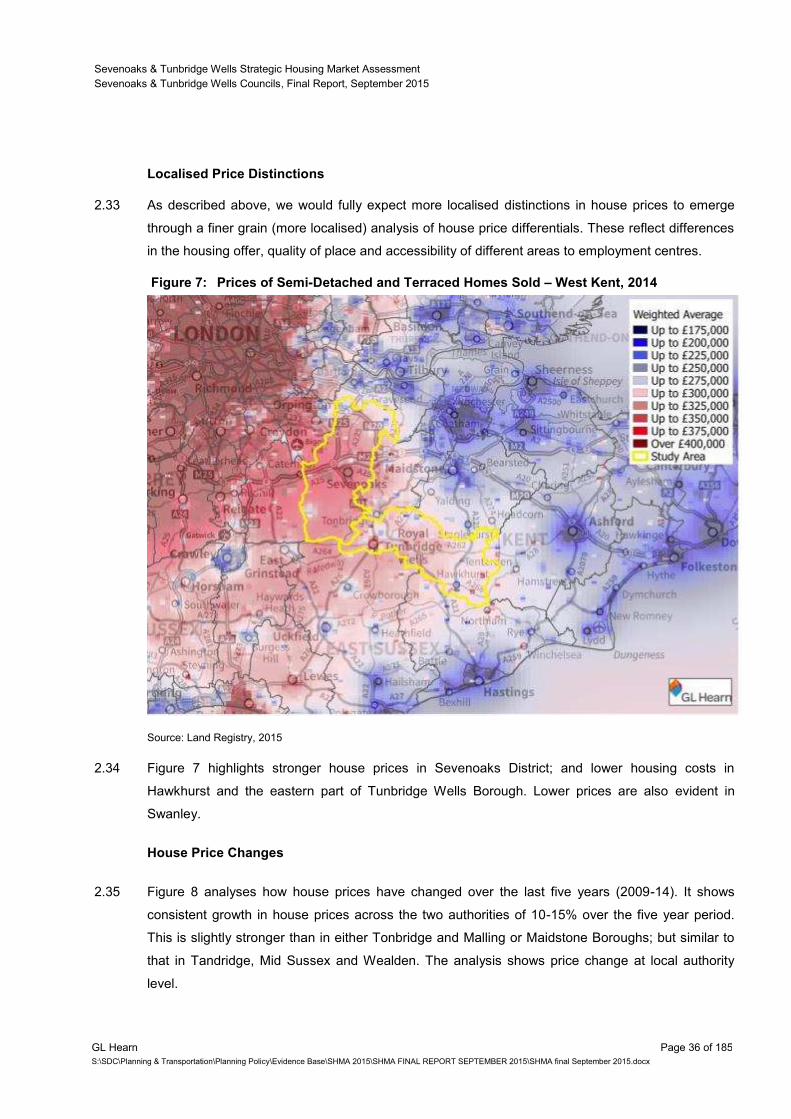
Sevenoaks & Tunbridge Wells Strategic Housing Market Assessment
Sevenoaks & Tunbridge Wells Councils
Final Report
September 2015
Prepared by
GL Hearn Limited
280 High Holborn
London WC1V 7EE
T +44 (0)20 7851 4900
glhearn.com

Sevenoaks & Tunbridge Wells Strategic Housing Market Assessment
Sevenoaks & Tunbridge Wells Councils, Final Report, September 2015
GL Hearn Page 2 of 185
S:\SDC\Planning & Transportation\Planning Policy\Evidence Base\SHMA 2015\SHMA FINAL REPORT SEPTEMBER 2015\SHMA final September 2015.docx
Sevenoaks & Tunbridge Wells Strategic Housing Market Assessment
Sevenoaks & Tunbridge Wells Councils, Final Report, September 2015
GL Hearn Page 3 of 185
S:\SDC\Planning & Transportation\Planning Policy\Evidence Base\SHMA 2015\SHMA FINAL REPORT SEPTEMBER 2015\SHMA final September 2015.docx
Contents
Section Page
EXECUTIVE SUMMARY 13
1 INTRODUCTION 22
2 DEFINING THE HOUSING MARKET AREA 28
3 DEMOGRAPHIC AND ECONOMIC-LED PROJECTIONS 47
4 AFFORDABLE HOUSING NEED 81
5 MARKET SIGNALS 97
6 NEED FOR DIFFERENT SIZES OF HOMES 115
7 HOUSING NEEDS OF PARTICULAR GROUPS 129
8 CONCLUSIONS 167
LIST OF FIGURES
FIGURE 1: OBJECTIVELY-ASSESSED HOUSING NEED, 2013-33 17
FIGURE 2: OVERVIEW OF APPROACH 27
FIGURE 3: CURDS FRAMEWORK HOUSING MARKET AREAS 31
FIGURE 4: CURDS-DEFINED LOCAL HOUSING MARKET AREAS 32
FIGURE 5: HOUSING MARKET AREAS IN THE SOUTH EAST 34
FIGURE 6: PRICES OF SEMI-DETACHED AND TERRACED HOMES SOLD, 2014 35
FIGURE 7: PRICES OF SEMI-DETACHED AND TERRACED HOMES SOLD – WEST
KENT, 2014 36
FIGURE 8: CHANGE IN HOUSE PRICES (ALL PROPERTIES), 2009-14 37
FIGURE 9: GROSS MIGRATION FLOWS BETWEEN LOCAL AUTHORITIES, 2010-11 39
FIGURE 10: NET MIGRATION FLOWS BETWEEN LOCAL AUTHORITIES, 2010-11 40
FIGURE 11: 2001 TRAVEL TO WORK AREAS 42
FIGURE 12: LONDON COMMUTING CATCHMENT (2011) 43
FIGURE 13: ONS 2011 TRAVEL TO WORK AREAS 44
Sevenoaks & Tunbridge Wells Strategic Housing Market Assessment
Sevenoaks & Tunbridge Wells Councils, Final Report, September 2015
GL Hearn Page 4 of 185
S:\SDC\Planning & Transportation\Planning Policy\Evidence Base\SHMA 2015\SHMA FINAL REPORT SEPTEMBER 2015\SHMA final September 2015.docx
FIGURE 14: INDEXED POPULATION GROWTH, 1981-2013 48
FIGURE 15: INDEXED POPULATION GROWTH (1981-2013) – BY DISTRICT 49
FIGURE 16: COMPONENTS OF POPULATION CHANGE, MID-2001 TO MID-2013 –
SEVENOAKS AND TUNBRIDGE WELLS 50
FIGURE 17: POPULATION AGE PROFILE (2013) 52
FIGURE 18: PAST AND PROJECTED POPULATION GROWTH – SEVENOAKS AND
TUNBRIDGE WELLS 55
FIGURE 19: PAST AND PROJECTED POPULATION GROWTH – BY LOCAL AUTHORITY 55
FIGURE 20: COMPONENTS OF POPULATION CHANGE, MID-2001 TO MID-2033 –
SEVENOAKS AND TUNBRIDGE WELLS 56
FIGURE 21: MIGRATION FLOWS TO- AND FROM- LONDON AND THE SEVENOAKS AND
TUNBRIDGE WELLS AREA 58
FIGURE 22: INDEXED HOUSEHOLD GROWTH (1991-2033) 61
FIGURE 23: INDEXED HOUSEHOLD GROWTH (1991-2033) 62
FIGURE 24: PAST AND PROJECTED TRENDS IN AVERAGE HOUSEHOLD SIZE –
SEVENOAKS AND TUNBRIDGE WELLS 63
FIGURE 25: PROJECTED HOUSEHOLD FORMATION RATES BY AGE OF HEAD OF
HOUSEHOLD - SEVENOAKS 64
FIGURE 26: PROJECTED HOUSEHOLD FORMATION RATES BY AGE OF HEAD OF
HOUSEHOLD – TUNBRIDGE WELLS 65
FIGURE 27: EMPLOYMENT TRENDS, 1991-2013 72
FIGURE 28: PAST AND PROJECTED NUMBER OF JOBS – SEVENOAKS & TUNBRIDGE
WELLS 74
FIGURE 29: PAST AND PROJECTED CHANGE IN EMPLOYMENT RATE – SEVENOAKS
AND TUNBRIDGE WELLS (2004-2031) 78
FIGURE 30: INDICATIVE INCOME REQUIRED TO PURCHASE/RENT WITHOUT
ADDITIONAL SUBSIDY 82
FIGURE 31: DISTRIBUTION OF HOUSEHOLD INCOME IN SEVENOAKS & TUNBRIDGE
WELLS 83
FIGURE 32: OVERVIEW OF THE BASIC NEEDS ASSESSMENT MODEL 84
FIGURE 33: OVERLAP BETWEEN AFFORDABLE HOUSING TENURES 95
FIGURE 34: UNDERSTANDING HOUSING DEMAND DRIVERS 97
FIGURE 35: MEDIAN HOUSE PRICE (1998-2007) 99
Sevenoaks & Tunbridge Wells Strategic Housing Market Assessment
Sevenoaks & Tunbridge Wells Councils, Final Report, September 2015
GL Hearn Page 5 of 185
S:\SDC\Planning & Transportation\Planning Policy\Evidence Base\SHMA 2015\SHMA FINAL REPORT SEPTEMBER 2015\SHMA final September 2015.docx
FIGURE 36: MEDIAN HOUSE PRICE (2008-2013) 100
FIGURE 37: MEDIAN HOUSE PRICES (2013-2014) 100
FIGURE 38: INDEXED ANALYSIS OF SALES TRENDS (1998 – 2014) 101
FIGURE 39: MEDIAN HOUSE PRICES (JAN 2013 – DEC 2014) 102
FIGURE 40: BENCHMARKED TREND IN MEDIAN PRIVATE RENTAL VALUES (SEP 2011
– SEP 2014) 103
FIGURE 41: TREND IN PRIVATE RENTAL TRANSACTIONS (SEP 2011 – SEP 2014) 104
FIGURE 42: LOWER QUARTILE AFFORDABILITY TREND (1997-2013) 105
FIGURE 43: ANNUAL EARNINGS (GROSS) OF FULL TIME WORKERS BY PLACE OF
RESIDENCE (2014) 106
FIGURE 44: CHANGE IN HOUSEHOLDS BY TENURE (2001-11) 107
FIGURE 45: SEVENOAKS – HOUSING SUPPLY VS TARGET (2006/07 – 2013/14) 107
FIGURE 46: TUNBRIDGE WELLS – HOUSING SUPPLY VS TARGET (2006/07 – 2013/14) 108
FIGURE 47: PROJECTED HOUSEHOLD FORMATION RATES FOR THOSE AGED 25-34 –
SEVENOAKS 112
FIGURE 48: PROJECTED HOUSEHOLD FORMATION RATES FOR THOSE AGED 25-34 –
TUNBRIDGE WELLS 112
FIGURE 49: STAGES IN THE HOUSING MARKET MODEL 116
FIGURE 50: AVERAGE BEDROOMS BY AGE, SEX AND TENURE – SEVENOAKS 117
FIGURE 51: AVERAGE BEDROOMS BY AGE, SEX AND TENURE – TUNBRIDGE WELLS 118
FIGURE 52: IMPACT OF DEMOGRAPHIC TRENDS ON MARKET HOUSING
REQUIREMENTS BY HOUSE SIZE, 2013 TO 2033 – SEVENOAKS 121
FIGURE 53: IMPACT OF DEMOGRAPHIC TRENDS ON MARKET HOUSING
REQUIREMENTS BY HOUSE SIZE, 2013 TO 2033 – TUNBRIDGE WELLS 122
FIGURE 54: IMPACT OF DEMOGRAPHIC TRENDS ON AFFORDABLE HOUSING
REQUIREMENTS BY HOUSE SIZE, 2013 TO 2033 – SEVENOAKS 124
FIGURE 55: IMPACT OF DEMOGRAPHIC TRENDS ON AFFORDABLE HOUSING
REQUIREMENTS BY HOUSE SIZE, 2013 TO 2033 – TUNBRIDGE WELLS 124
FIGURE 56: SIZE OF HOUSING REQUIRED 2013 TO 2033 – SEVENOAKS 125
FIGURE 57: SIZE OF HOUSING REQUIRED 2013 TO 2033 – TUNBRIDGE WELLS 125
FIGURE 58: TENURE OF OLDER PERSON HOUSEHOLDS – SEVENOAKS AND
TUNBRIDGE WELLS 132
Sevenoaks & Tunbridge Wells Strategic Housing Market Assessment
Sevenoaks & Tunbridge Wells Councils, Final Report, September 2015
GL Hearn Page 6 of 185
S:\SDC\Planning & Transportation\Planning Policy\Evidence Base\SHMA 2015\SHMA FINAL REPORT SEPTEMBER 2015\SHMA final September 2015.docx
FIGURE 59: TENURE OF OLDER PERSON HOUSEHOLDS – BY LOCAL AUTHORITY
AND OTHER AREAS 133
FIGURE 60: OCCUPANCY RATING OF OLDER PERSON HOUSEHOLDS – SEVENOAKS
AND TUNBRIDGE WELLS 134
FIGURE 61: OCCUPANCY RATING OF OLDER PERSON HOUSEHOLDS – BY LOCAL
AUTHORITY AND OTHER AREAS 134
FIGURE 62: POPULATION WITH LONG-TERM HEALTH PROBLEM OR DISABILITY IN
EACH AGE BAND 142
FIGURE 63: TENURE OF PEOPLE WITH LTHPD – SEVENOAKS AND TUNBRIDGE
WELLS 143
FIGURE 64: TENURE OF PEOPLE WITH LTHPD – BY LOCAL AUTHORITY 143
FIGURE 65: POPULATION AGE PROFILE (2011) – SEVENOAKS 148
FIGURE 66: POPULATION AGE PROFILE (2011) – TUNBRIDGE WELLS 148
FIGURE 67: TENURE BY ETHNIC GROUP – SEVENOAKS AND TUNBRIDGE WELLS 149
FIGURE 68: TENURE OF BME HOUSEHOLDS – BY DISTRICT AND COMPARATOR
AREAS 150
FIGURE 69: OCCUPANCY RATING BY ETHNIC GROUP – SEVENOAKS AND
TUNBRIDGE WELLS 151
FIGURE 70: OCCUPANCY RATING OF BME HOUSEHOLDS – BY LOCAL AUTHORITY 152
FIGURE 71: TENURE OF HOUSEHOLDS WITH DEPENDENT CHILDREN – SEVENOAKS
AND TUNBRIDGE WELLS 154
FIGURE 72: TENURE OF HOUSEHOLDS WITH DEPENDENT CHILDREN – BY LOCAL
AUTHORITY 155
FIGURE 73: OCCUPANCY RATING AND HOUSEHOLDS WITH DEPENDENT CHILDREN –
SEVENOAKS AND TUNBRIDGE WELLS 156
FIGURE 74: OCCUPANCY RATING AND HOUSEHOLDS WITH DEPENDENT CHILDREN –
BY LOCAL AUTHORITY 157
FIGURE 75: TENURE BY AGE OF HRP – SEVENOAKS AND TUNBRIDGE WELLS 159
FIGURE 76: TENURE OF HOUSEHOLDS AGED UNDER 35 – BY LOCAL AUTHORITY 160
FIGURE 77: ECONOMIC ACTIVITY BY AGE – SEVENOAKS AND TUNBRIDGE WELLS 161
FIGURE 78: ECONOMIC ACTIVITY BY LOCATION (PEOPLE AGED 16-34) 161
FIGURE 79: DEMOGRAPHIC-LED ASSESSMENT OF HOUSING NEED, HOMES PER
YEAR 2013-33 169
Sevenoaks & Tunbridge Wells Strategic Housing Market Assessment
Sevenoaks & Tunbridge Wells Councils, Final Report, September 2015
GL Hearn Page 7 of 185
S:\SDC\Planning & Transportation\Planning Policy\Evidence Base\SHMA 2015\SHMA FINAL REPORT SEPTEMBER 2015\SHMA final September 2015.docx
FIGURE 80: OBJECTIVELY-ASSESSED HOUSING NEED, 2013-33 172
LIST OF TABLES
TABLE 1: CONCLUSIONS ON FULL OBJECTIVELY-ASSESSED HOUSING NEED 16
TABLE 2: RECOMMENDED HOUSING MIX – SEVENOAKS DISTRICT 17
TABLE 3: RECOMMENDED HOUSING MIX – TUNBRIDGE WELLS BOROUGH 17
TABLE 4: NEED FOR DIFFERENT FORMS OF AFFORDABLE HOUSING 18
TABLE 5: NEED FOR SPECIALIST HOUSING FOR OLDER PERSONS, 2013-33 19
TABLE 6: NEED FOR RESIDENTIAL/ NURSING CARE BEDSPACES 19
TABLE 7: REGISTERED INTEREST IN SELF AND CUSTOM-BUILD HOMES, SEPT 2015 20
TABLE 8: SELF-CONTAINMENT OF MIGRATION FLOWS WITHIN INDIVIDUAL
AUTHORITIES, 2010-11 38
TABLE 9: COMMUTING SELF-CONTAINMENT, EXCLUDING LONDON, 2011 41
TABLE 10: COMPONENTS OF POPULATION CHANGE (2001-13) – SEVENOAKS AND
TUNBRIDGE WELLS 51
TABLE 11: CHANGE IN AGE STRUCTURE 2001 TO 2013 – SEVENOAKS AND
TUNBRIDGE WELLS 52
TABLE 12: CHANGE IN AGE STRUCTURE 2001 TO 2013 53
TABLE 13: PROJECTED POPULATION GROWTH (2013-2033) 54
TABLE 14: POPULATION CHANGE 2013 TO 2033 BY FIFTEEN YEAR AGE BANDS
(2012-BASED SNPP) 57
TABLE 15: MIGRATION TO- AND FROM- LONDON AND THE SEVENOAKS AND
TUNBRIDGE WELLS AREAS – INDIVIDUAL LOCAL AUTHORITY ANALYSIS 59
TABLE 16: PROJECTED POPULATION GROWTH (2013-2033) – WITH LONDON
ADJUSTMENT 60
TABLE 17: PROJECTED HOUSEHOLD GROWTH (2013-2033) 61
TABLE 18: PROJECTED HOUSEHOLD GROWTH 2013-33 – 2012-BASED SNPP AND
2012-BASED HEADSHIP RATES 67
TABLE 19: PROJECTED HOUSEHOLD GROWTH 2013-33 – 2012-BASED SNPP
(LONDON ADJUSTED) AND 2012-BASED HEADSHIP RATES 67
Sevenoaks & Tunbridge Wells Strategic Housing Market Assessment
Sevenoaks & Tunbridge Wells Councils, Final Report, September 2015
GL Hearn Page 8 of 185
S:\SDC\Planning & Transportation\Planning Policy\Evidence Base\SHMA 2015\SHMA FINAL REPORT SEPTEMBER 2015\SHMA final September 2015.docx
TABLE 20: PROJECTED HOUSEHOLD GROWTH 2013-33 – 10-YEAR MIGRATION
TRENDS AND 2012-BASED HEADSHIP RATES 70
TABLE 21: PROJECTED HOUSEHOLD GROWTH 2013-33 – 2012-BASED SNPP WITH
UPC ADJUSTMENT AND 2012-BASED HEADSHIP RATES 70
TABLE 22: COMPARING THE DEMOGRAPHIC-LED PROJECTIONS 70
TABLE 23: CHANGE IN NUMBER OF JOBS (2013-33) 73
TABLE 24: EEFM ECONOMIC FORECASTS, WINTER 2014/15 73
TABLE 25: COMMUTING PATTERNS IN SEVENOAKS AND TUNBRIDGE WELLS (2011) 75
TABLE 26: JOBS GROWTH AND CHANGE IN RESIDENT WORKFORCE (2013-33) – 2013
EEFM 76
TABLE 27: JOBS GROWTH AND CHANGE IN RESIDENT WORKFORCE (2013-33) – 2014
EEFM 76
TABLE 28: EMPLOYMENT RATES BY AGE AND SEX – SEVENOAKS AND TUNBRIDGE
WELLS 77
TABLE 29: PROJECTED HOUSEHOLD GROWTH 2013-33 – EEFM (2013) AND 2012-
BASED HEADSHIP RATES 78
TABLE 30: PROJECTED HOUSEHOLD GROWTH 2013-33 – EEFM (2014) AND 2012-
BASED HEADSHIP RATES 79
TABLE 31: INCOME LEVELS BY LOCAL AUTHORITY 83
TABLE 32: ESTIMATED NUMBER OF HOUSEHOLDS IN UNSUITABLE HOUSING 85
TABLE 33: ESTIMATED CURRENT NEED 86
TABLE 34: ESTIMATED LEVEL OF AFFORDABLE HOUSING NEED FROM NEWLY
FORMING HOUSEHOLDS (PER ANNUM) 87
TABLE 35: ESTIMATED LEVEL OF HOUSING NEED FROM EXISTING HOUSEHOLDS
(PER ANNUM) 88
TABLE 36: CURRENT AFFORDABLE HOUSING SUPPLY 88
TABLE 37: ANALYSIS OF PAST SOCIAL/AFFORDABLE RENTED HOUSING SUPPLY
(PER ANNUM – PAST 2 YEARS) 89
TABLE 38: SUPPLY OF AFFORDABLE HOUSING 90
TABLE 39: ESTIMATED LEVEL OF AFFORDABLE HOUSING NEED PER ANNUM 90
TABLE 40: ESTIMATED LEVEL OF AFFORDABLE HOUSING NEED (PER ANNUM) AT
VARIANT INCOME THRESHOLDS 91
Sevenoaks & Tunbridge Wells Strategic Housing Market Assessment
Sevenoaks & Tunbridge Wells Councils, Final Report, September 2015
GL Hearn Page 9 of 185
S:\SDC\Planning & Transportation\Planning Policy\Evidence Base\SHMA 2015\SHMA FINAL REPORT SEPTEMBER 2015\SHMA final September 2015.docx
TABLE 41: COMPARING THE AFFORDABLE HOUSING NEED AND DEMOGRAPHIC
PROJECTIONS 92
TABLE 42: ESTIMATED LEVEL OF AFFORDABLE HOUSING NEED (PER ANNUM) BY
TYPE OF AFFORDABLE HOUSING, 2013-33 96
TABLE 43: COMPARISON OF LOWER QUARTILE AND MEDIAN AFFORDABILITY (2013) 105
TABLE 44: CHANGES IN OVER OCCUPIED AND HOUSES IN MULTIPLE OCCUPATION
(2001-2011) 109
TABLE 45: PROJECTED HOUSEHOLD GROWTH 2013-33 – 2012-BASED SNPP
(ADJUSTED) AND 2012-BASED HEADSHIP RATES – WITH AFFORDABILITY
ADJUSTMENT 113
TABLE 46: IMPACT OF AFFORDABILITY ADJUSTMENTS – HOUSING NEED PER
ANNUM, 2013-33 114
TABLE 47: ESTIMATED PROFILE OF DWELLINGS IN 2013 BY SIZE – SEVENOAKS 119
TABLE 48: ESTIMATED PROFILE OF DWELLINGS IN 2013 BY SIZE – TUNBRIDGE
WELLS 119
TABLE 49: ESTIMATED SIZE OF DWELLINGS NEEDED 2013 TO 2033 – MARKET
HOUSING – SEVENOAKS 120
TABLE 50: ESTIMATED SIZE OF DWELLINGS NEEDED 2013 TO 2033 – MARKET
HOUSING – TUNBRIDGE WELLS 121
TABLE 51: ESTIMATED SIZE OF DWELLINGS REQUIRED 2013 TO 2033 –
AFFORDABLE HOUSING – SEVENOAKS 123
TABLE 52: ESTIMATED SIZE OF DWELLINGS REQUIRED 2013 TO 2033 –
AFFORDABLE HOUSING – TUNBRIDGE WELLS 123
TABLE 53: NEED FOR DIFFERENT SIZES OF HOMES, SEVENOAKS 127
TABLE 54: NEED FOR DIFFERENT SIZES OF HOMES, TUNBRIDGE WELLS 127
TABLE 55: OLDER PERSON POPULATION (2013) 130
TABLE 56: PROJECTED CHANGE IN POPULATION OF OLDER PERSONS (2013 TO
2033) 131
TABLE 57: OLDER PERSON HOUSEHOLDS (CENSUS 2011) 131
TABLE 58: OLDER PERSON HOUSEHOLDS WITH OCCUPANCY RATING OF +1 AND +2
OR MORE BY TENURE – SEVENOAKS 135
TABLE 59: OLDER PERSON HOUSEHOLDS WITH OCCUPANCY RATING OF +1 AND +2
OR MORE BY TENURE – TUNBRIDGE WELLS 135
TABLE 60: ESTIMATED POPULATION CHANGE FOR RANGE OF HEALTH ISSUES
(2013 TO 2033) 136
Sevenoaks & Tunbridge Wells Strategic Housing Market Assessment
Sevenoaks & Tunbridge Wells Councils, Final Report, September 2015
GL Hearn Page 10 of 185
S:\SDC\Planning & Transportation\Planning Policy\Evidence Base\SHMA 2015\SHMA FINAL REPORT SEPTEMBER 2015\SHMA final September 2015.docx
TABLE 61: CURRENT SUPPLY OF SPECIALIST HOUSING FOR OLDER PEOPLE 137
TABLE 62: PROJECTED NEED FOR SPECIALIST HOUSING FOR OLDER PEOPLE
(2013-33) 139
TABLE 63: POTENTIAL NEED FOR RESIDENTIAL CARE HOUSING 141
TABLE 64: HOUSEHOLDS AND PEOPLE WITH LONG-TERM HEALTH PROBLEM OR
DISABILITY (2011) 141
TABLE 65: ESTIMATED CHANGE IN POPULATION WITH LTHPD (2013-33) 143
TABLE 66: BLACK AND MINORITY ETHNIC POPULATION (2011) 145
TABLE 67: CHANGE IN BME GROUPS 2001 TO 2011 – SEVENOAKS 146
TABLE 68: CHANGE IN BME GROUPS 2001 TO 2011 – TUNBRIDGE WELLS 146
TABLE 69: CHANGE IN NON-WHITE (BRITISH/IRISH) POPULATION – 2001-11 147
TABLE 70: HOUSEHOLDS WITH DEPENDENT CHILDREN (2011) 153
TABLE 71: ESTIMATED CHANGE IN POPULATION AGED 15 AND UNDER (2013-33) 153
TABLE 72: ESTIMATED CHANGE IN HOUSEHOLDS HEADED BY SOMEONE AGED
UNDER 35 (2013-33) – USING 2012-BASED CLG HOUSEHOLD FORMATION
RATES 157
TABLE 73: ESTIMATED CHANGE IN HOUSEHOLDS HEADED BY SOMEONE AGED
UNDER 35 (2013-33) – USING 2012-BASED CLG HOUSEHOLD FORMATION
RATES AND A ‘MARKET SIGNALS’ UPLIFT 158
TABLE 74: HOUSEHOLDS WITH NON-DEPENDENT CHILDREN (2011) 158
TABLE 75: INTEREST IN SELF- AND CUSTOM-BUILD, SEPT 2015 164
TABLE 76: EEFM ECONOMIC FORECASTS 170
TABLE 77: RECOMMENDED HOUSING MIX – SEVENOAKS DISTRICT 173
TABLE 78: RECOMMENDED HOUSING MIX – TUNBRIDGE WELLS BOROUGH 173
TABLE 79: NEED FOR DIFFERENT FORMS OF AFFORDABLE HOUSING 174
TABLE 80: NEED FOR SPECIALIST HOUSING FOR OLDER PERSONS, 2013-33 175
TABLE 81: NEED FOR RESIDENTIAL/ NURSING CARE BEDSPACES 176
TABLE 82: REGISTERED INTEREST IN SELF AND CUSTOM-BUILD HOMES, SEPT 2015 176
TABLE 83: LOWER QUARTILE SALES PRICES BY TYPE (2014) 181
TABLE 84: LOWER QUARTILE PRIVATE RENTS BY SIZE AND LOCATION (YEAR TO
SEPTEMBER 2014) – PER MONTH 181
Sevenoaks & Tunbridge Wells Strategic Housing Market Assessment
Sevenoaks & Tunbridge Wells Councils, Final Report, September 2015
GL Hearn Page 11 of 185
S:\SDC\Planning & Transportation\Planning Policy\Evidence Base\SHMA 2015\SHMA FINAL REPORT SEPTEMBER 2015\SHMA final September 2015.docx
TABLE 85: MAXIMUM LHA PAYMENTS BY SIZE AND BRMA (PER MONTH) 182
TABLE 86: MONTHLY SOCIAL RENT LEVELS 183
TABLE 87: RESULTS OF PROJECTIONS – SEVENOAKS 185
TABLE 88: RESULTS OF PROJECTIONS - TUNBRIDGE WELLS 185
Appendices
APPENDIX A: GLOSSARY AND DEFINITIONS 178
APPENDIX B: ANALYSIS OF LOCAL PRICES AND RENTS 181
APPENDIX C: EXTENDING PROJECTIONS TO 2035 184

Sevenoaks & Tunbridge Wells Strategic Housing Market Assessment
Sevenoaks & Tunbridge Wells Councils, Final Report, September 2015
GL Hearn Page 12 of 185
S:\SDC\Planning & Transportation\Planning Policy\Evidence Base\SHMA 2015\SHMA FINAL REPORT SEPTEMBER 2015\SHMA final September 2015.docx
Quality Standards Control
The signatories below verify that this document has been prepared in accordance with our quality control
requirements. These procedures do not affect the content and views expressed by the originator.
This document must only be treated as a draft unless it is has been signed by the Originators and approved
by a Business or Associate Director.
DATE ORIGINATORS APPROVED
September 2015 Aled Barcroft, Planner Nick Ireland
Justin Gardner, JGC Planning Director
Limitations
This document has been prepared for the stated objective and should not be used for any other purpose
without the prior written authority of GL Hearn; we accept no responsibility or liability for the consequences of
this document being used for a purpose other than for which it was commissioned.
Sevenoaks & Tunbridge Wells Strategic Housing Market Assessment
Sevenoaks & Tunbridge Wells Councils, Final Report, September 2015
GL Hearn Page 13 of 185
S:\SDC\Planning & Transportation\Planning Policy\Evidence Base\SHMA 2015\SHMA FINAL REPORT SEPTEMBER 2015\SHMA final September 2015.docx
EXECUTIVE SUMMARY
Introduction
This Strategic Housing Market Assessment (SHMA) considers housing need in Sevenoaks District
and Tunbridge Wells Borough. It considers:
Overall housing need;
Need for different sizes of homes;
Need for different types of homes, particularly from a growing older population.
The SHMA does not set housing targets. The Councils will bring together evidence of housing need,
with information regarding available land, environmental and policy constraints, including Green
Belt, and issues related to delivering infrastructure, through the plan-making process to set housing
targets.
The SHMA has been prepared for the Councils by GL Hearn and Justin Gardner Consulting. It
addresses the requirements of the National Planning Policy Framework (NPPF) and the
methodology prescribed by Government for assessments such as this in Planning Practice
Guidance1.
Housing Market Geography
The SHMA identifies that Sevenoaks and Tunbridge Wells fall within a West Kent Housing Market
Area (HMA) which includes Sevenoaks, Tonbridge and Tunbridge Wells and extends to include
Crowborough, Hawkhurst and Heathfield.
Whilst recognising inter-relationships across administrative boundaries, for practical purposes it is
appropriate to consider the ‘best fit’ to local authority boundaries – not least as official demographic
projections are not produced below this level. The two authorities would provide the best fit to the
Housing Market Area.
The SHMA however identifies cross-boundary interactions with the northern parts of Rother and
Wealden in East Sussex; between Swanley and Dartford; and with London. Recognising these
links, the Councils will need to engage with neighbouring authorities through the Duty to Cooperate.
Objectively-Assessed Housing Need
The SHMA builds up a picture of overall housing need by starting with trend-based demographic
projections, based on the latest official (2012-based) population and households projections;
considering movement to/from London and the impact of the recession on this; and then
considering whether adjustments need to be made to in-migration to support economic growth; or to
1 http://planningguidance.planningportal.gov.uk/blog/guidance/housing-and-economic-development-needs-assessments/
Sevenoaks & Tunbridge Wells Strategic Housing Market Assessment
Sevenoaks & Tunbridge Wells Councils, Final Report, September 2015
GL Hearn Page 14 of 185
S:\SDC\Planning & Transportation\Planning Policy\Evidence Base\SHMA 2015\SHMA FINAL REPORT SEPTEMBER 2015\SHMA final September 2015.docx
improve affordability, taking account of evidence of affordable housing need and market signals
which provide evidence that the ability of younger households to form has been restricted. This
process is used to define the full need for market and affordable housing, “leaving aside” supply-
side considerations and constraints to development.
1. Trend-based Demographic Projections
The ONS 2012-based Sub-National Population Projections and CLG 2012-based Household
Projections provide the starting point for assessing housing need. The SHMA rebases these trend-
based demographic projections to take account of ONS 2013 Mid-Year Population Estimates.
The population projections are based on trends between 2006/7 and 2012, a period which included
an economic recession. The SHMA analysis suggests that housing market circumstances during
this period may have influenced net migration from London, and that a moderate increase in
migration from London might be expected moving forwards. The potential impact of this has been
modelled using assumptions consistent with those adopted by the Greater London Authority (GLA)
in Further Alternations to the London Plan (FALP).
The SHMA concludes that an appropriate trend-based demographic projection would see
population growth of 19,900 (17.0%) in Sevenoaks District and 19,200 (16.6%) in Tunbridge Wells
Borough over the 2013-33 period.
The report applies (age-specific) assumptions on household formation to the population projections,
and includes an allowance for vacant and second homes within the housing stock (based on levels
shown by the 2011 Census). This results in a demographic-led need for 524 homes per year (2013-
33) in Sevenoaks, and 631 homes per year in Tunbridge Wells.
2. Supporting Economic Growth
The SHMA then considers whether in the future higher net migration might be required relative to
past trends, taking account of how the age structure of the population might change (including
people moving into retirement) and the potential scale of growth in employment.
Over the 1993-2010 period (which is equivalent to the last economic cycle), employment in
Sevenoaks District grew by an average of 1.0% per annum. In Tunbridge Wells Borough,
employment levels were static (0.0% growth). Economic forecasts from the East of England
Forecasting Model (EEFM) suggest employment could grow by between 8.9 – 16.5% in Sevenoaks;
and by between 9.1 – 16.8% in Tunbridge Wells in the period 2013-33. The latest (Winter 2014)
forecasts are the higher.
Sevenoaks & Tunbridge Wells Strategic Housing Market Assessment
Sevenoaks & Tunbridge Wells Councils, Final Report, September 2015
GL Hearn Page 15 of 185
S:\SDC\Planning & Transportation\Planning Policy\Evidence Base\SHMA 2015\SHMA FINAL REPORT SEPTEMBER 2015\SHMA final September 2015.docx
The SHMA concludes that the forecasts for Tunbridge Wells look overly optimistic set against
historical employment trends. For Sevenoaks District, the latest forecasts are closer to the historical
rate of employment growth; and taking account of wider macro-economic factors the SHMA
concludes that these forecasts, for 0.8% annual growth in employment, look reasonable. On this
basis the SHMA models the implications of higher economic-led migration to Sevenoaks relative to
past trends. In relating jobs and homes, the SHMA takes account of trends in age-specific
employment rates and changes to state pension age; and assumes that the “commuting ratio2”
shown in the 2011 Census stays constant. The higher, economic-driven migration to Sevenoaks
results in housing need 8% higher than in the initial trend-based demographic projections.
3. Affordability Issues
Government’s Planning Practice Guidance indicates that “the housing need number suggested by
household projections (the starting point) should be adjusted to reflect appropriate market signals,
as well as other market indicators of the balance between the demand for and supply of dwellings.”
It identifies that where market signals point to poor and worsening affordability and an imbalance
between supply and demand, an appropriate adjustment should be made to future housing
provision.
The median house price in Sevenoaks is £302,000, and in Tunbridge Wells £260,000 at the time of
the Assessment; both of which are above those across the wider housing market area and Kent
(where the average is £210,000). The mapping of house prices undertaken however clearly shows
that prices are similar to other areas close to London. Whilst house price increases over the period
since 2008 have been modest, particularly in real terms (taking account of inflation); growth in rents
in both areas has been above inflation.
The evidence points to notable affordability pressures, with the lower quartile (entry level) house
prices 11 times earnings of younger households in Sevenoaks; and 9.7 times earnings in Tunbridge
Wells. This compares to a ratio of 6.5 nationally.
The analysis also suggests some real impacts arising from high housing costs. Over the 2001-11
period, home ownership fell (with increasing numbers of households renting privately). Levels of
over-occupied households and those in shared housing increased, albeit that levels of both remain
below Kent and national averages.
As we might expect, the high housing costs have contributed to levels of households who require
financial support in meeting their housing needs, and would be eligible for affordable housing. The
report identifies a net need from 422 households per annum for affordable housing in Sevenoaks;
2 The commuting ratio is the ratio of people working in the District to the number of employed residents. This is a “policy off” assumption
Sevenoaks & Tunbridge Wells Strategic Housing Market Assessment
Sevenoaks & Tunbridge Wells Councils, Final Report, September 2015
GL Hearn Page 16 of 185
S:\SDC\Planning & Transportation\Planning Policy\Evidence Base\SHMA 2015\SHMA FINAL REPORT SEPTEMBER 2015\SHMA final September 2015.docx
and from 341 households per annum in Tunbridge Wells. This includes need arising from
concealed and homeless households – who will require additional housing – as well as from
overcrowded households, or those who seek an alternative tenure of accommodation, but would
release a home for other households should a new affordable home be provided.
The evidence from market signals, and from the affordable housing needs assessment, point to
affordability pressures. The report provides evidence that deteriorating affordability (coupled with
the credit crunch) resulted in a fall in household formation amongst households in their late 20s and
early 30s over the 2001-11 period. An improvement in affordability can be expected to see a rise in
household formation amongst these households.
Taking account of market conditions, where sales volumes remain below pre-2008 levels and
market capacity issues, coupled with the tightening of lending criteria for accessing mortgage
finance, it is reasonable to expect household formation for younger households to improve
gradually over time (if supply-side considerations such as land availability are left aside).
The report models an improvement in household formation rates amongst households aged 25-34,
returning to 2001 levels by 2033. This adjustment is applied to the demographic and/or economic-
led projections to derive conclusions on the objectively-assessed housing need.
4. Conclusions on Objectively-Assessed Housing Need
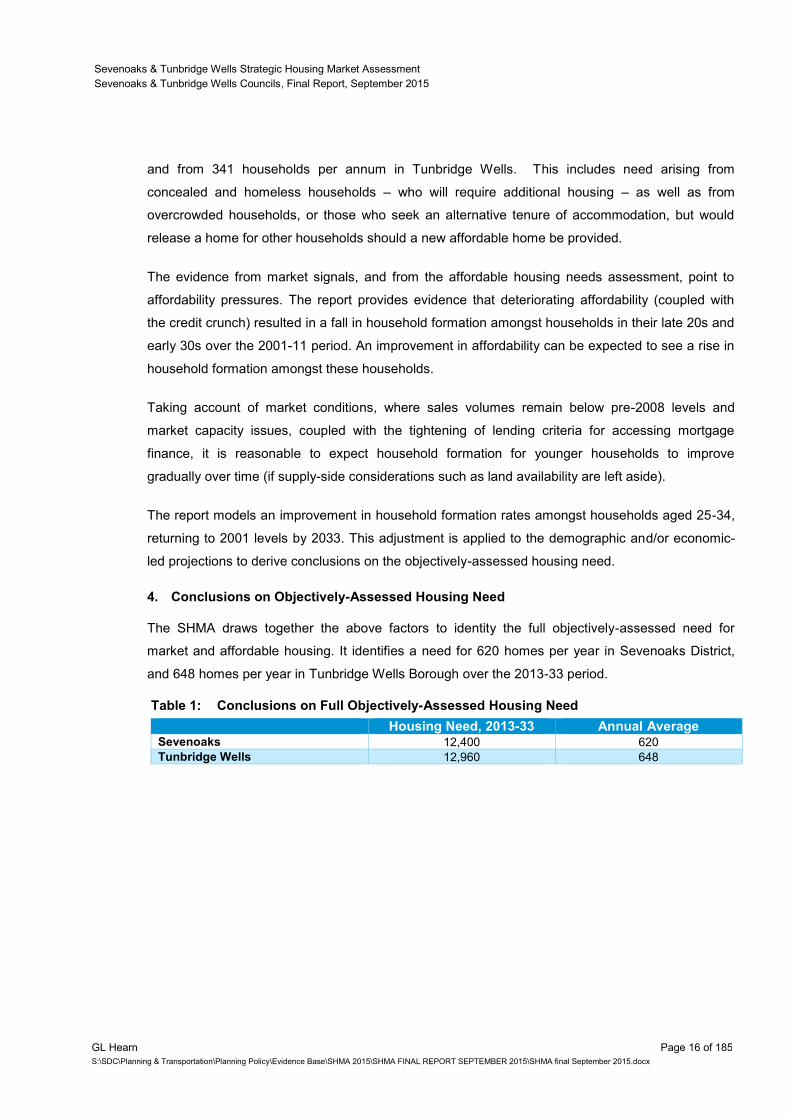
The SHMA draws together the above factors to identity the full objectively-assessed need for
market and affordable housing. It identifies a need for 620 homes per year in Sevenoaks District,
and 648 homes per year in Tunbridge Wells Borough over the 2013-33 period.
Table 1: Conclusions on Full Objectively-Assessed Housing Need
Housing Need, 2013-33 Annual Average Sevenoaks 12,400 620 Tunbridge Wells 12,960 648
Sevenoaks & Tunbridge Wells Strategic Housing Market Assessment
Sevenoaks & Tunbridge Wells Councils, Final Report, September 2015
GL Hearn Page 17 of 185
S:\SDC\Planning & Transportation\Planning Policy\Evidence Base\SHMA 2015\SHMA FINAL REPORT SEPTEMBER 2015\SHMA final September 2015.docx
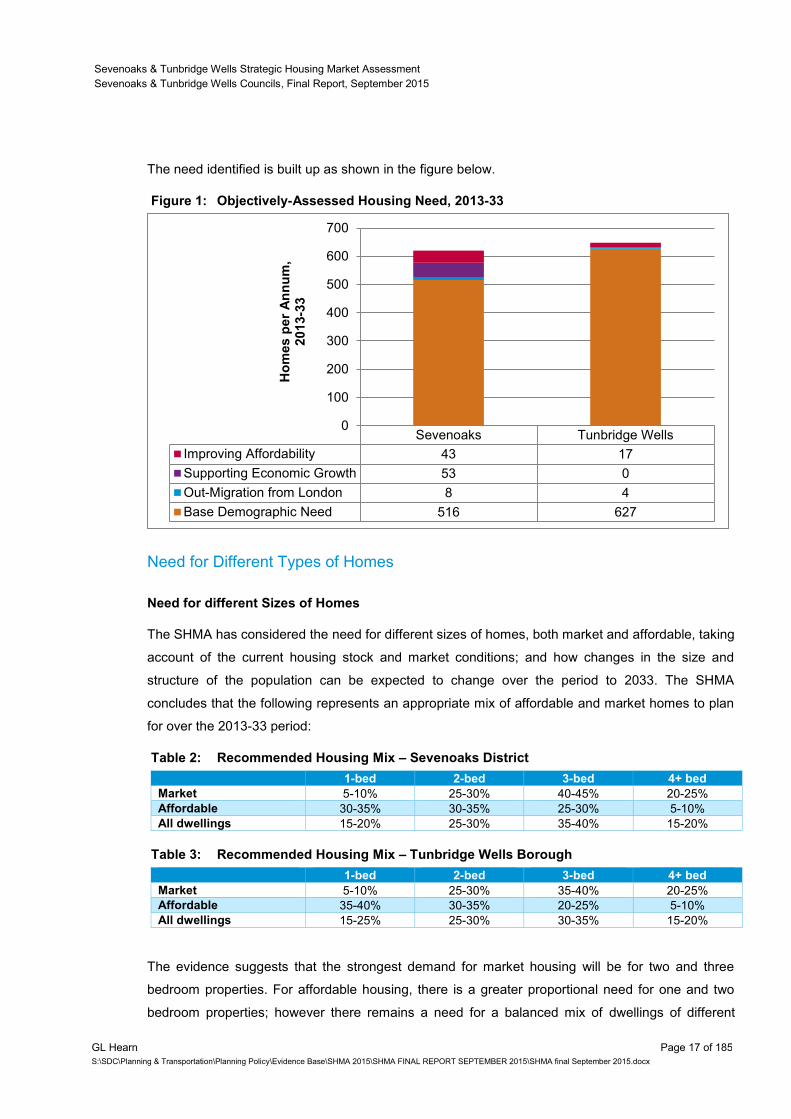
The need identified is built up as shown in the figure below.
Figure 1: Objectively-Assessed Housing Need, 2013-33
Need for Different Types of Homes
Need for different Sizes of Homes
The SHMA has considered the need for different sizes of homes, both market and affordable, taking
account of the current housing stock and market conditions; and how changes in the size and
structure of the population can be expected to change over the period to 2033. The SHMA
concludes that the following represents an appropriate mix of affordable and market homes to plan
for over the 2013-33 period:
Table 2: Recommended Housing Mix – Sevenoaks District
1-bed 2-bed 3-bed 4+ bed
Market 5-10% 25-30% 40-45% 20-25%
Affordable 30-35% 30-35% 25-30% 5-10%
All dwellings 15-20% 25-30% 35-40% 15-20%
Table 3: Recommended Housing Mix – Tunbridge Wells Borough
1-bed 2-bed 3-bed 4+ bed
Market 5-10% 25-30% 35-40% 20-25%
Affordable 35-40% 30-35% 20-25% 5-10%
All dwellings 15-25% 25-30% 30-35% 15-20%
The evidence suggests that the strongest demand for market housing will be for two and three
bedroom properties. For affordable housing, there is a greater proportional need for one and two
bedroom properties; however there remains a need for a balanced mix of dwellings of different
Sevenoaks Tunbridge Wells
Improving Affordability 43 17
Supporting Economic Growth 53 0
Out-Migration from London 8 4
Base Demographic Need 516 627
0
100
200
300
400
500
600
700
Ho
mes p
er
An
nu
m,
2013-3
3
Sevenoaks & Tunbridge Wells Strategic Housing Market Assessment
Sevenoaks & Tunbridge Wells Councils, Final Report, September 2015
GL Hearn Page 18 of 185
S:\SDC\Planning & Transportation\Planning Policy\Evidence Base\SHMA 2015\SHMA FINAL REPORT SEPTEMBER 2015\SHMA final September 2015.docx
sizes to come forward with delivery of larger properties being important in meeting the needs of
households with an acute housing need, and releasing existing properties for other households.
In applying policies on housing mix to individual development sites, the SHMA recommends that
regard should be had to the nature of the development site and character of the area, and to up-to-
date evidence of need as well as the existing mix and turnover of properties at the local level.
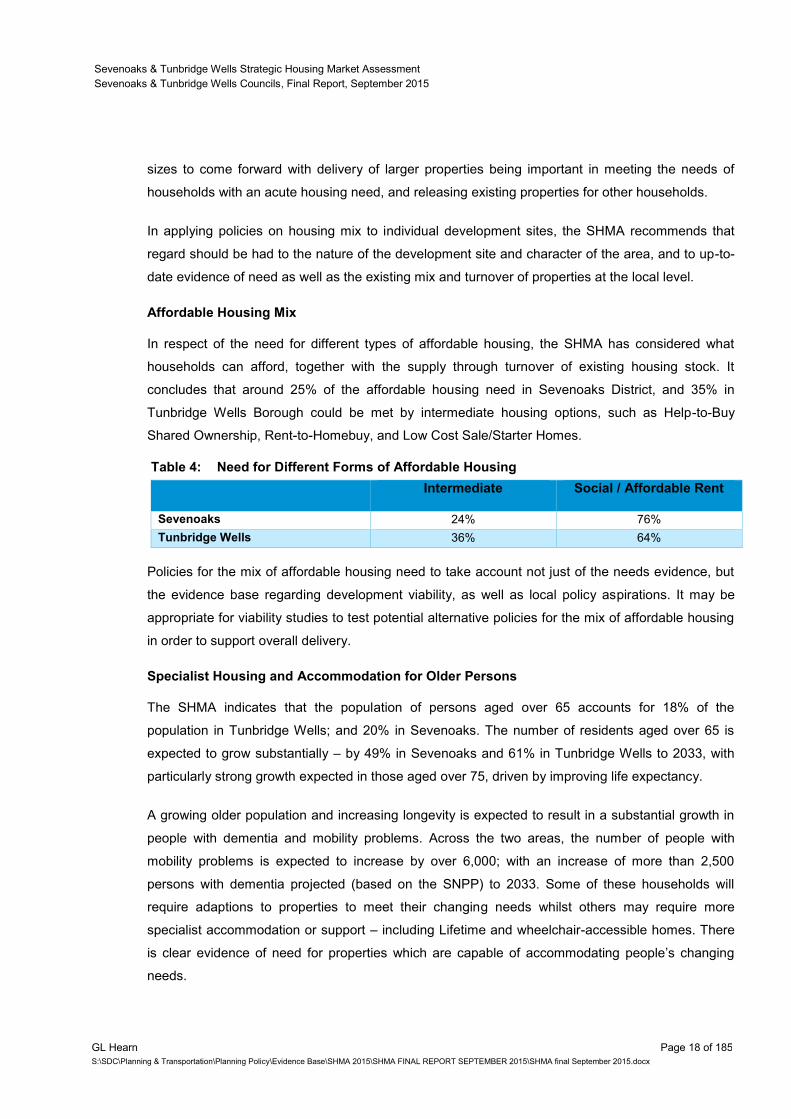
Affordable Housing Mix
In respect of the need for different types of affordable housing, the SHMA has considered what
households can afford, together with the supply through turnover of existing housing stock. It
concludes that around 25% of the affordable housing need in Sevenoaks District, and 35% in
Tunbridge Wells Borough could be met by intermediate housing options, such as Help-to-Buy
Shared Ownership, Rent-to-Homebuy, and Low Cost Sale/Starter Homes.
Table 4: Need for Different Forms of Affordable Housing
Intermediate Social / Affordable Rent
Sevenoaks 24% 76%
Tunbridge Wells 36% 64%
Policies for the mix of affordable housing need to take account not just of the needs evidence, but
the evidence base regarding development viability, as well as local policy aspirations. It may be
appropriate for viability studies to test potential alternative policies for the mix of affordable housing
in order to support overall delivery.
Specialist Housing and Accommodation for Older Persons
The SHMA indicates that the population of persons aged over 65 accounts for 18% of the
population in Tunbridge Wells; and 20% in Sevenoaks. The number of residents aged over 65 is
expected to grow substantially – by 49% in Sevenoaks and 61% in Tunbridge Wells to 2033, with
particularly strong growth expected in those aged over 75, driven by improving life expectancy.
A growing older population and increasing longevity is expected to result in a substantial growth in
people with dementia and mobility problems. Across the two areas, the number of people with
mobility problems is expected to increase by over 6,000; with an increase of more than 2,500
persons with dementia projected (based on the SNPP) to 2033. Some of these households will
require adaptions to properties to meet their changing needs whilst others may require more
specialist accommodation or support – including Lifetime and wheelchair-accessible homes. There
is clear evidence of need for properties which are capable of accommodating people’s changing
needs.
Sevenoaks & Tunbridge Wells Strategic Housing Market Assessment
Sevenoaks & Tunbridge Wells Councils, Final Report, September 2015
GL Hearn Page 19 of 185
S:\SDC\Planning & Transportation\Planning Policy\Evidence Base\SHMA 2015\SHMA FINAL REPORT SEPTEMBER 2015\SHMA final September 2015.docx
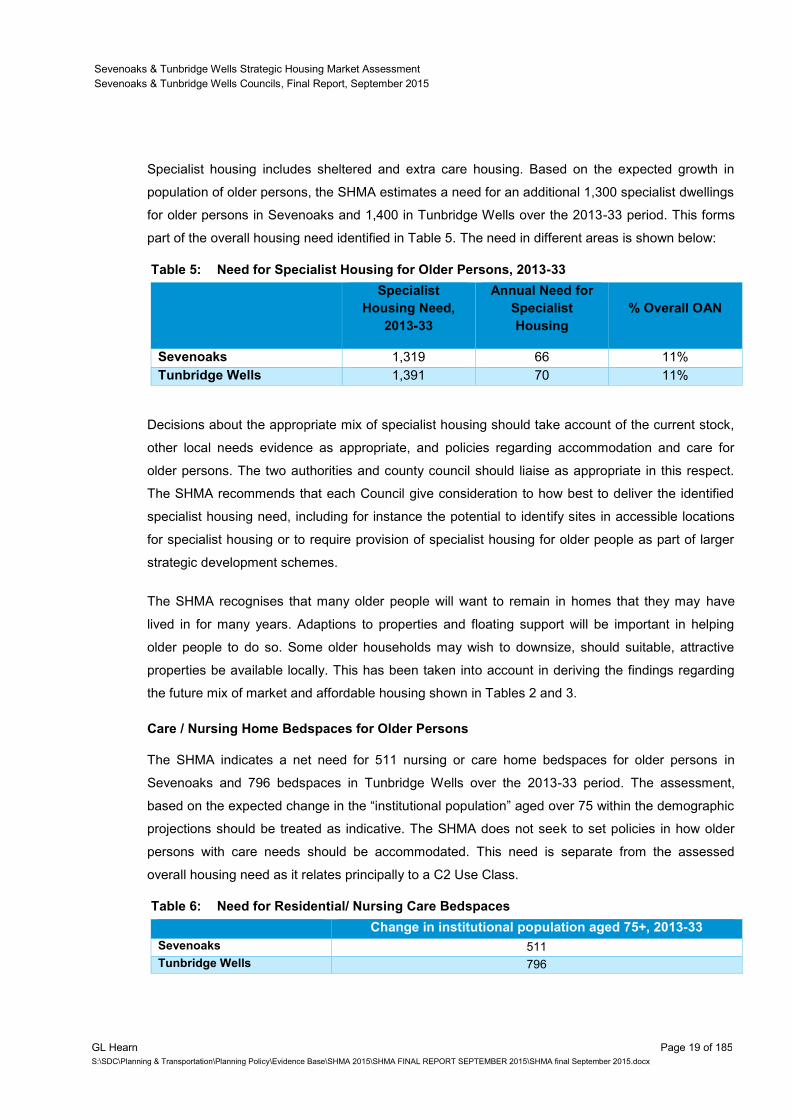
Specialist housing includes sheltered and extra care housing. Based on the expected growth in
population of older persons, the SHMA estimates a need for an additional 1,300 specialist dwellings
for older persons in Sevenoaks and 1,400 in Tunbridge Wells over the 2013-33 period. This forms
part of the overall housing need identified in Table 5. The need in different areas is shown below:
Table 5: Need for Specialist Housing for Older Persons, 2013-33
Specialist
Housing Need,
2013-33
Annual Need for
Specialist
Housing
% Overall OAN
Sevenoaks 1,319 66 11%
Tunbridge Wells 1,391 70 11%
Decisions about the appropriate mix of specialist housing should take account of the current stock,
other local needs evidence as appropriate, and policies regarding accommodation and care for
older persons. The two authorities and county council should liaise as appropriate in this respect.
The SHMA recommends that each Council give consideration to how best to deliver the identified
specialist housing need, including for instance the potential to identify sites in accessible locations
for specialist housing or to require provision of specialist housing for older people as part of larger
strategic development schemes.
The SHMA recognises that many older people will want to remain in homes that they may have
lived in for many years. Adaptions to properties and floating support will be important in helping
older people to do so. Some older households may wish to downsize, should suitable, attractive
properties be available locally. This has been taken into account in deriving the findings regarding
the future mix of market and affordable housing shown in Tables 2 and 3.
Care / Nursing Home Bedspaces for Older Persons
The SHMA indicates a net need for 511 nursing or care home bedspaces for older persons in
Sevenoaks and 796 bedspaces in Tunbridge Wells over the 2013-33 period. The assessment,
based on the expected change in the “institutional population” aged over 75 within the demographic
projections should be treated as indicative. The SHMA does not seek to set policies in how older
persons with care needs should be accommodated. This need is separate from the assessed
overall housing need as it relates principally to a C2 Use Class.
Table 6: Need for Residential/ Nursing Care Bedspaces
Change in institutional population aged 75+, 2013-33
Sevenoaks 511
Tunbridge Wells 796
Sevenoaks & Tunbridge Wells Strategic Housing Market Assessment
Sevenoaks & Tunbridge Wells Councils, Final Report, September 2015
GL Hearn Page 20 of 185
S:\SDC\Planning & Transportation\Planning Policy\Evidence Base\SHMA 2015\SHMA FINAL REPORT SEPTEMBER 2015\SHMA final September 2015.docx
Self-Build Housing
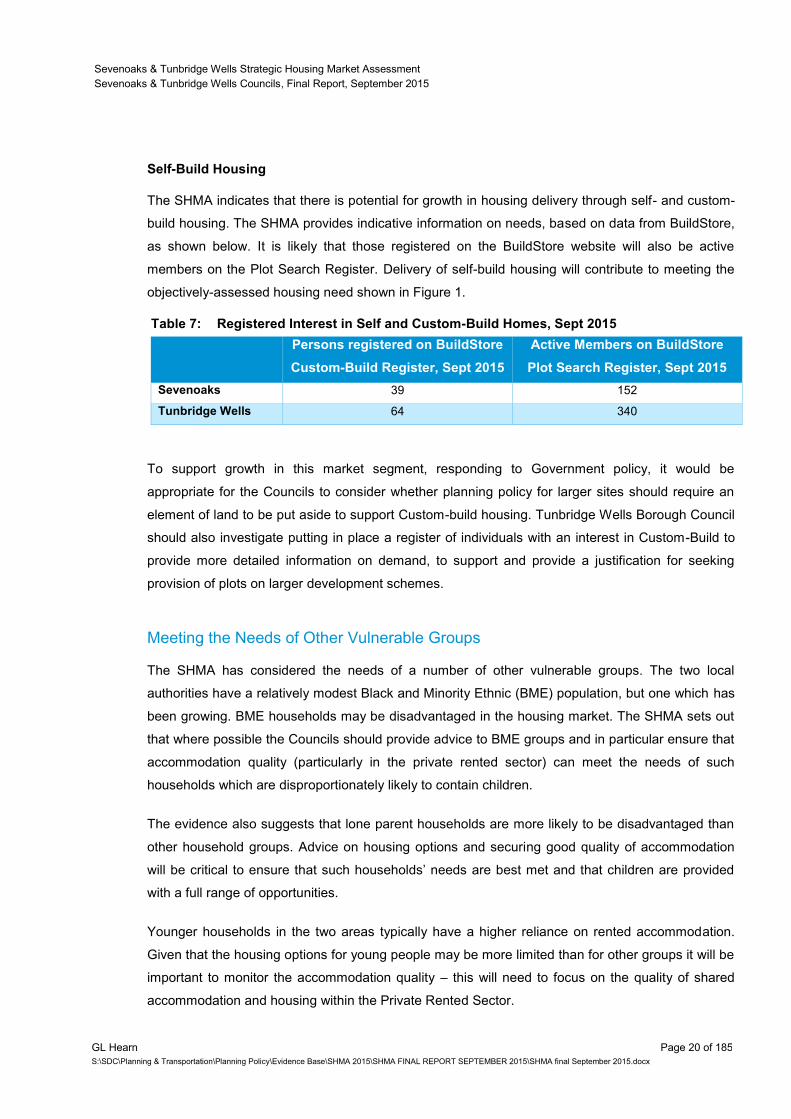
The SHMA indicates that there is potential for growth in housing delivery through self- and custom-
build housing. The SHMA provides indicative information on needs, based on data from BuildStore,
as shown below. It is likely that those registered on the BuildStore website will also be active
members on the Plot Search Register. Delivery of self-build housing will contribute to meeting the
objectively-assessed housing need shown in Figure 1.
Table 7: Registered Interest in Self and Custom-Build Homes, Sept 2015
Persons registered on BuildStore
Custom-Build Register, Sept 2015
Active Members on BuildStore
Plot Search Register, Sept 2015
Sevenoaks 39 152
Tunbridge Wells 64 340
To support growth in this market segment, responding to Government policy, it would be
appropriate for the Councils to consider whether planning policy for larger sites should require an
element of land to be put aside to support Custom-build housing. Tunbridge Wells Borough Council
should also investigate putting in place a register of individuals with an interest in Custom-Build to
provide more detailed information on demand, to support and provide a justification for seeking
provision of plots on larger development schemes.
Meeting the Needs of Other Vulnerable Groups
The SHMA has considered the needs of a number of other vulnerable groups. The two local
authorities have a relatively modest Black and Minority Ethnic (BME) population, but one which has
been growing. BME households may be disadvantaged in the housing market. The SHMA sets out
that where possible the Councils should provide advice to BME groups and in particular ensure that
accommodation quality (particularly in the private rented sector) can meet the needs of such
households which are disproportionately likely to contain children.
The evidence also suggests that lone parent households are more likely to be disadvantaged than
other household groups. Advice on housing options and securing good quality of accommodation
will be critical to ensure that such households’ needs are best met and that children are provided
with a full range of opportunities.
Younger households in the two areas typically have a higher reliance on rented accommodation.
Given that the housing options for young people may be more limited than for other groups it will be
important to monitor the accommodation quality – this will need to focus on the quality of shared
accommodation and housing within the Private Rented Sector.

Sevenoaks & Tunbridge Wells Strategic Housing Market Assessment
Sevenoaks & Tunbridge Wells Councils, Final Report, September 2015
GL Hearn Page 21 of 185
S:\SDC\Planning & Transportation\Planning Policy\Evidence Base\SHMA 2015\SHMA FINAL REPORT SEPTEMBER 2015\SHMA final September 2015.docx
The Private Rented Sector has grown over the 2001-11 period. There is potential, moving forwards,
for institutional investment in ‘Build-to-Rent’ housing schemes. This may contribute positively to
overall housing delivery, however the Councils may need to consider how affordable housing
policies are applied to this Private Rented Sector housing, given that the viability of such schemes
is very different to those of more ‘traditional’ market or mixed-tenure developments.
Sevenoaks & Tunbridge Wells Strategic Housing Market Assessment
Sevenoaks & Tunbridge Wells Councils, Final Report, September 2015
GL Hearn Page 22 of 185
S:\SDC\Planning & Transportation\Planning Policy\Evidence Base\SHMA 2015\SHMA FINAL REPORT SEPTEMBER 2015\SHMA final September 2015.docx
1 INTRODUCTION
1.1 GL Hearn (GLH) and Justin Gardner Consulting (JGC) have been commissioned by Sevenoaks
District Council and Tunbridge Wells Borough Council to prepare a Strategic Housing Market
Assessment (SHMA). The purpose of the SHMA is to develop a robust understanding of housing
market dynamics, to provide an assessment of future needs for both market and affordable housing
and the housing needs of different groups within the population.
1.2 The SHMA does not set housing targets. It provides an objective assessment of the need for
housing, making no judgements regarding future policy decisions which the Councils may
take. Housing targets will be set in the Councils respective local plans. These will need to be
informed by the SHMA but will also take into account other factors and evidence through the plan-
making process.
1.3 The SHMA responds to and is compliant with the requirements of both the National Planning Policy
Framework (the NPPF)3
and the National Planning Practice Guidance (PPG)4
. It provides
assessment of the future need for housing, with the intention that this will inform future development
of planning policies. According to the PPG, housing need:
“refers to the scale and mix of housing and the range of tenures that is likely to be needed in
the housing market area over the plan period – and should cater for the housing demand of
the area and identify the scale of housing supply necessary to meet that demand.”
1.4 The Planning Practice Guidance is clear that the SHMA should not apply constraints to the
assessment of need, such as those relating to land supply, environmental constraints or
infrastructure provision, although it is clear that these are relevant considerations in bringing
together the range of evidence in the preparation of a local plan.
1.5 The SHMA provides specific evidence and analysis of the need for different sizes of homes, to
inform policies on the mix of homes (both market and affordable). The SHMA also analyses the
needs of specific groups, such as older people.
1.6 A best-fit of local authority boundaries to the Housing Market Area would include Sevenoaks,
Tunbridge Wells and Tonbridge and Malling.
1.7 The SHMA provides an assessment of housing need in Sevenoaks District and Tunbridge Wells
Borough. It has been prepared using a consistent methodology to that in similar assessments
3 CLG (March 2012) National Planning Policy Framework
4 CLG (March 2014) Planning Practice Guidance – Assessment of Housing and Economic Development Needs
Sevenoaks & Tunbridge Wells Strategic Housing Market Assessment
Sevenoaks & Tunbridge Wells Councils, Final Report, September 2015
GL Hearn Page 23 of 185
S:\SDC\Planning & Transportation\Planning Policy\Evidence Base\SHMA 2015\SHMA FINAL REPORT SEPTEMBER 2015\SHMA final September 2015.docx
prepared by GL Hearn for Tonbridge and Malling Borough; as well as Maidstone and Ashford
Boroughs.
1.8 Findings from this report regarding housing need can be aggregated with those for Tonbridge and
Malling Borough as set out in the SHMA Update – Implications of 2012-based Household
Projections report5 (GL Hearn, June 2015) to provide a composite picture of housing needs across
the three authorities. Both reports adopt a consistent methodology and use the same data.
1.9 Thus to provide an objective assessment of need across the HMA, conclusions in this report would
need to be brought together with those in GL Hearn’s recent SHMA Update Report dealing with
housing need in Tonbridge and Malling (together with Ashford and Maidstone).
National Planning Policy Framework and Guidance
1.10 National planning policies are set out in the National Planning Policy Framework (NPPF). This sets
out a framework for how evidence-based studies regarding housing provision should be prepared;
and policies against which development plans will be assessed at examination and with which they
must comply. Local authorities are required to collaborate on assessments such as this, recognising
that housing markets can cut across local authority boundaries.
1.11 The primary legislation to support this is the 2011 Localism Act which now imposes a ‘duty to
cooperate’ on local authorities, requiring them to “engage constructively, actively and on an on-
going basis” with the other authorities and relevant bodies. The Duty to Cooperate is applied as
both a legal and soundness test to which development plans must comply.
National Planning Policy Framework (NPPF)
1.12 The NPPF was published in March 2012. The Framework sets a presumption in favour of
sustainable development whereby Local Plans should meet objectively assessed development
needs, with sufficient flexibility to respond to rapid change, unless the adverse impacts of doing so
would significantly or demonstrably outweigh the benefits or policies within the Framework indicate
that development should be restricted.
1.13 Paragraph 47 in the NPPF outlines that to significantly boost the supply of housing, local planning
authorities (amongst other things) should use their evidence base to ensure that their Local Plan
meets the full, objectively-assessed needs for market and affordable housing in the housing market
area, as far as is consistent with the policies set out in the NPPF.
5 This deals with housing need in Tonbridge and Malling, together with Maidstone and Ashford
Sevenoaks & Tunbridge Wells Strategic Housing Market Assessment
Sevenoaks & Tunbridge Wells Councils, Final Report, September 2015
GL Hearn Page 24 of 185
S:\SDC\Planning & Transportation\Planning Policy\Evidence Base\SHMA 2015\SHMA FINAL REPORT SEPTEMBER 2015\SHMA final September 2015.docx
1.14 The NPPF highlights the SHMA as a key piece of evidence in determining housing needs.
Paragraph 159 in the Framework outlines that this should identify the scale and mix of housing and
the range of tenures which the local population is likely to need over the plan period which:
Meets household and population projections, taking account of migration and demographic
change;
Addresses the need for all types of housing, including affordable housing and the needs of
different groups in the community; and
Caters for housing demand and the scale of housing supply necessary to meet this demand.
1.15 The SHMA is intended to be prepared for the housing market area, and include work and dialogue
with neighbouring authorities where the Housing Market Area (HMA) crosses administrative
boundaries.
1.16 Paragraph 181 sets out that Local Planning Authorities (LPAs) will be expected to demonstrate
evidence of having effectively cooperated to plan for issues with cross-boundary impacts when their
Local Plans are submitted for examination. This highlights the importance of collaborative working
and engaging constructively with neighbouring authorities, as required by Section 33A of the 2004
Planning and Compulsory Purchase Act, and ensuring that there is a robust audit trail showing joint
working to meet the requirements of paragraph 181 of the NPPF.
1.17 Paragraph 158 of the NPPF emphasises the alignment of the housing and economic evidence base
and policy. Paragraph 17 in the NPPF reaffirms this, and outlines that planning should also take
account of market signals, such as land prices and housing affordability. However it also makes
clear that plans must be deliverable. The Councils’ economic development aspirations align with the
findings identified in this report.
1.18 In regard to housing mix, the NPPF sets out that local authorities should plan for a mix of housing
based on current and future demographic trends, market trends and the needs of different groups in
the community. Planning authorities should identify the size, type, tenure and range of housing that
is required in particular locations reflecting local demand. Where a need for affordable housing is
identified, authorities should set policies for meeting this need on site.
1.19 In setting affordable housing targets, the NPPF states that to ensure a plan is deliverable, the sites
and the scale of development identified in the plan should not be subject to a scale of obligations
and policy burdens such that their ability to be developed is threatened and should support
development throughout the economic cycle. The costs of requirements likely to be applied to
development, including affordable housing requirements, contributions to infrastructure and other
policies in the Plan, should not compromise the viability of development schemes. To address this,
affordable housing policies would need to be considered alongside other factors including
infrastructure contributions – a ‘whole plan’ approach to viability. Where possible the NPPF
Sevenoaks & Tunbridge Wells Strategic Housing Market Assessment
Sevenoaks & Tunbridge Wells Councils, Final Report, September 2015
GL Hearn Page 25 of 185
S:\SDC\Planning & Transportation\Planning Policy\Evidence Base\SHMA 2015\SHMA FINAL REPORT SEPTEMBER 2015\SHMA final September 2015.docx
encourages local authorities to work up Community Infrastructure Levy (CIL) charges alongside the
local plan.
1.20 The SHMA is intended to be brought together with evidence of land availability, from Strategic
Housing Land Availability Assessments (SHLAAs). To increase housing supply, the NPPF proposes
that local authorities should be required to maintain a 5 year supply of specific deliverable sites, and
to bring forward an allowance of 5% to ensure choice and competition in the market for land (unless
there is a persistent track record of under-delivery in which case a 20% buffer is to be included).
National Planning Practice Guidance
1.21 Planning Practice Guidance (PPG) was issued by Government in March 2014 as an online
resource. Elements of this are updated periodically. The PPG includes Guidance on ‘Assessment of
Housing and Economic Development Needs’. This SHMA takes account of the Guidance set out at
the time of publication.
1.22 The PPG is relevant to this SHMA in that it provides clarity on how key elements of the NPPF
should be interpreted, including the approach to deriving an objective assessment of the need for
housing. The approach in this report takes account of this Guidance.
1.23 The Guidance defines “need” as referring to ‘the scale and mix of housing and the range of tenures
that is likely to be needed in the housing market area over the plan period – and should cater for the
housing demand of the area and identify the scale of housing supply necessary to meet this need.”
1.24 It sets out that the assessment of need should be realistic in taking account of the particular nature
of that area (for example geographical constraints and the nature of the market area), and should
be based on future scenarios that could be reasonably expected to occur. It should not take
account of supply-side factors or development constraints. Specifically the Guidance sets out that:
“plan makers should not apply constraints to the overall assessment of need, such as
limitations imposed by the supply of land for new development, historical under performance,
infrastructure or environmental constraints. However these considerations will need to be
addressed when bringing evidence bases together to identify specific policies within
development plans.”
1.25 The Guidance outlines that estimating future need is not an exact science and that there is no one
methodological approach or dataset which will provide a definitive assessment of need. However,
the starting point for establishing the need for housing should be the latest household projections
published by the Department for Communities and Local Government (CLG). At the time of
preparation of this report the latest projections are the CLG 2012-based Household Projections. It
also outlines that the latest population projections and Mid-Year Population Estimates should be
Sevenoaks & Tunbridge Wells Strategic Housing Market Assessment
Sevenoaks & Tunbridge Wells Councils, Final Report, September 2015
GL Hearn Page 26 of 185
S:\SDC\Planning & Transportation\Planning Policy\Evidence Base\SHMA 2015\SHMA FINAL REPORT SEPTEMBER 2015\SHMA final September 2015.docx
considered. The latest Mid-Year Population Estimates available at the time of preparation of the
report were for mid-20136.
1.26 The PPG sets out that there may be instances where these national projections require adjustment
to take account of factors affecting local demography or household formation rates, in particular
where there is evidence that household formation rates are or have been constrained by supply. It
suggests that proportional adjustments should be made where the market signals point to supply
being constrained relative to long-term trends or to other areas in order to improve affordability.
1.27 Evidence of affordable housing needs is also relevant, with the Guidance suggesting that the total
affordable housing need should be considered in the context of its likely delivery as a proportion of
mixed market and affordable housing. In some instances it suggests this may provide a case for
increasing the level of overall housing provision.
1.28 In regard to employment trends, the Guidance indicates that job growth trends and/or economic
forecasts should be considered having regard to the growth in working-age population in the
housing market area. It sets out that:
“ where the supply of working age population that is economically active (labour force supply)
is less than the projected job growth, this could result in unsustainable commuting patterns
(depending on public transport accessibility and other sustainable options such as walking
and cycling) and could reduce the resilience of local businesses. In such circumstances, plan
makers will need to consider how the location of new housing and infrastructure development
could help to address these problems.”
1.29 The Guidance indicates that the assessment should consider the need for different types of housing
and the needs of different groups, including family housing, housing for older people, and
households with specific needs and those looking to build their own home. It sets out that the need
for older persons’ housing should be broken down by tenure and type, and should include an
assessment of need for residential institutions (falling within a C2 use class).
Overview of the Approach to Deriving OAN
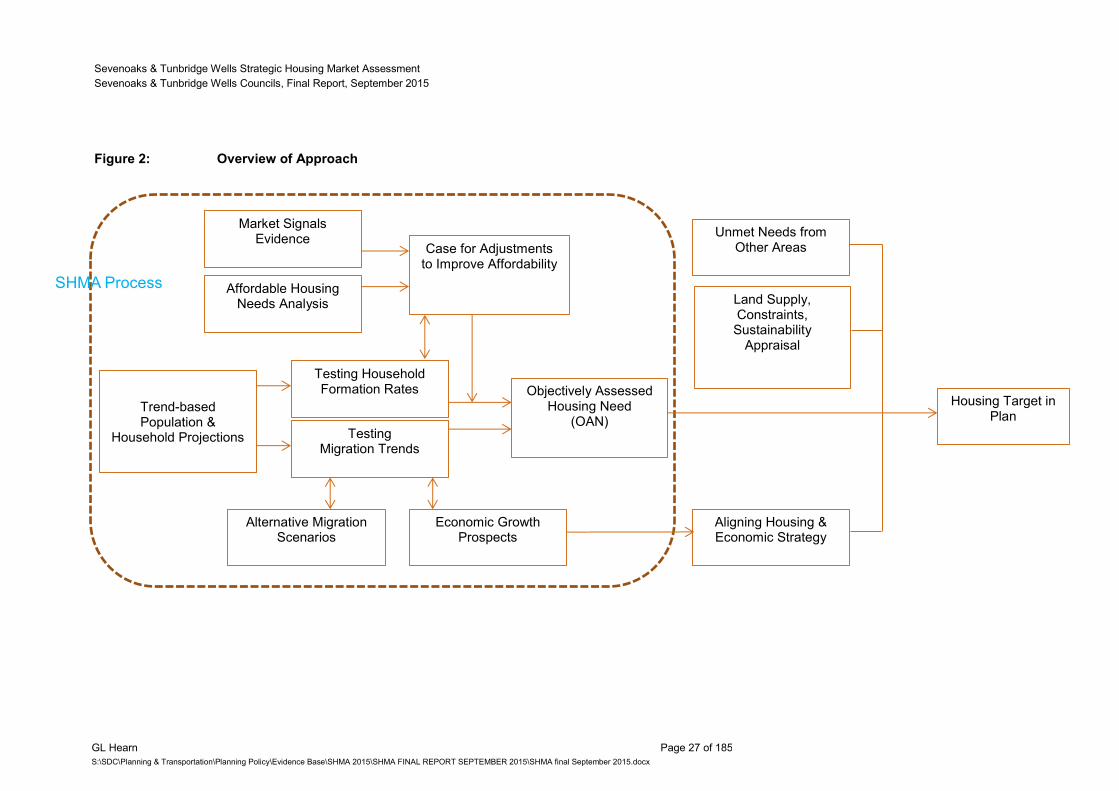
1.30 Based on the above, the diagram below summarises the approach we have used to deriving
conclusions regarding the Objectively-Assessed Need (OAN) for Housing.
6 The demographic modelling herein was undertaken in advance of release of ONS 2014 Mid-Year Population Estimates. The impact of
these on the assessed housing need over a 20 year period could be expected to be minimal.
Sevenoaks & Tunbridge Wells Strategic Housing Market Assessment
Sevenoaks & Tunbridge Wells Councils, Final Report, September 2015
GL Hearn Page 27 of 185
S:\SDC\Planning & Transportation\Planning Policy\Evidence Base\SHMA 2015\SHMA FINAL REPORT SEPTEMBER 2015\SHMA final September 2015.docx
Figure 2: Overview of Approach
Trend-based Population &
Household Projections Testing Migration Trends
Testing Household Formation Rates
Market Signals Evidence
Affordable Housing Needs Analysis
Case for Adjustments to Improve Affordability
Economic Growth Prospects
Alternative Migration Scenarios
Objectively Assessed Housing Need
(OAN)
Aligning Housing & Economic Strategy
Land Supply, Constraints, Sustainability
Appraisal
Unmet Needs from Other Areas
Housing Target in Plan
SHMA Process
Sevenoaks & Tunbridge Wells Strategic Housing Market Assessment
Sevenoaks & Tunbridge Wells Councils, Final Report, September 2015
GL Hearn Page 28 of 185
S:\SDC\Planning & Transportation\Planning Policy\Evidence Base\SHMA 2015\SHMA FINAL REPORT SEPTEMBER 2015\SHMA final September 2015.docx
2 DEFINING THE HOUSING MARKET AREA
2.1 The National Planning Policy Framework (NPPF) states that local planning authorities should use
their evidence base to ensure Local Plans meet the full, objectively assessed needs for market and
affordable housing in their Housing Market Area (HMA).
2.2 In simple terms, the HMA is a geographical area in which the majority of people, who move, will
move within. It also reflects functional relationships between where people live and work. However,
defining housing market areas is an inexact science and there is no single source of information
that will clearly identify housing market areas.
2.3 The NPPF makes clear that in planning for housing provision, it is important to consider housing
needs and dynamics across a HMA, with each HMA seeking to meet needs within it where it is
sustainable to do so and consistent with national planning policies. The Planning Practice Guidance
(PPG) similarly highlights that needs should be assessed across the relevant housing market area.
The first question for the SHMA is therefore, what housing market area(s) do Sevenoaks District
and Tunbridge Wells Borough fall within.
Approach to Defining Housing Market Areas
2.4 The PPG defines a housing market area, setting out:
A housing market area is a geographical area defined by household demand and
preferences for all types of housing, reflecting the key functional linkages between places
where people live and work. It might be the case that housing market areas overlap.
The extent of the housing market areas identified will vary, and many will in practice cut
across various local planning authority administrative boundaries. Local planning authorities
should work with all the other constituent authorities under the duty to cooperate7.
2.5 The PPG sets out that housing market areas can broadly be defined using three different sources of
information:
House prices and rates of change in house prices – providing a market-based definition
based on areas with similar house price characteristics;
Household migration and search patterns – considering the extent to which people move
house within an area, with a housing market area considered to be that in which typically 70% or
more of local moves are contained within (excluding long-distance moves);
Contextual data - such as travel to work areas, retail and school catchments – with travel to
work areas providing information regarding commuting.
2.6 The three strands of information look at different aspects of household behaviour, and there is no
right or wrong answer regarding what weight should be applied to different factors. What the PPG
says is that:
7 ID: 2a-011-20140306
Sevenoaks & Tunbridge Wells Strategic Housing Market Assessment
Sevenoaks & Tunbridge Wells Councils, Final Report, September 2015
GL Hearn Page 29 of 185
S:\SDC\Planning & Transportation\Planning Policy\Evidence Base\SHMA 2015\SHMA FINAL REPORT SEPTEMBER 2015\SHMA final September 2015.docx
No single source of information on needs will be comprehensive in identifying the appropriate
assessment area; careful consideration should be given to the appropriateness of each
source of information and how they relate to one another. For example, for housing, where
there are issues of affordability or low demand, house price or rental level analyses will be
particularly important in identifying the assessment area. Where there are relatively high or
volatile rates of household movement, migration data will be particularly important. Plan
makers will need to consider the usefulness of each source of information and approach for
their purposes.8
Practical Issues
2.7 The PPG largely reiterates previous guidance on defining HMAs set out within the CLG’s 2007
Advice Note on Identifying Sub-Regional Housing Market Areas. There has been effectively no
change in guidance, which continues to emphasise that there is no right or wrong answer as to how
an HMA should be defined and that the approach should, in effect, reflect local market
characteristics and circumstances.
2.8 There is a range of previous work which has been undertaken to define HMAs over the last decade,
at national, regional and local levels. It is now however appropriate to review this, not least given
that a significant proportion of the past work is informed by 2001 Census data regarding commuting
and migration patterns. 2011 Census flow data was issued in late July 2014.
2.9 There are some further practical issues which are dealt with in the Planning Advisory Service (PAS)
Technical Advice Note on Objectively Assessed Need and Housing Targets.9 This outlines that in
practice, the main indicators used to define HMAs are migration and commuting flows, but goes on
to point out that:
One problem in drawing boundaries is that if each local planning authority were to draw an
HMA centred on its area, there would be almost as many HMAs as local authorities. This is
because the largest migration flows in and out of any individual authority are usually those
linking it with immediately adjacent authorities. But each of these adjacent authorities will
probably find that their largest migration flows link them to their immediate neighbours, and
the chain continues indefinitely.
Thus if each authority works independently to define an optimal HMA each authority may
draw a different map, centred on its own area.
2.10 The PAS Note argues that to address this issue, it is useful to start with a “top down analysis” which
looks at the whole country. This is provided by a research study led by the Centre for Urban and
Regional Development Studies (CURDS) at Newcastle University to define HMAs across England,
which was published by Government in November 201010
. This has defined a consistent set of
HMAs across England based on migration and commuting data from the 2001 Census.
8 ID 2a-009-20140306
9 Peter Brett Associates (PBA) for PAS (June 2014) Objectively Assessed Need and Housing Targets
10 C Jones, M Coombe and C Wong for CLG (Nov 2010) Geography of Housing Markets, Final Report
Sevenoaks & Tunbridge Wells Strategic Housing Market Assessment
Sevenoaks & Tunbridge Wells Councils, Final Report, September 2015
GL Hearn Page 30 of 185
S:\SDC\Planning & Transportation\Planning Policy\Evidence Base\SHMA 2015\SHMA FINAL REPORT SEPTEMBER 2015\SHMA final September 2015.docx
2.11 Peter Brett Associates (PBA) emphasises that this should be considered ‘only a starting point’ and
should be sense-checked against local knowledge and more recent data, especially on migration
and commuting – concluding that more recent data ‘should always trump’ the national research. GL
Hearn agrees with the report’s conclusions in this respect.
2.12 A further practical issue regards the geographical building blocks that housing market areas are
built up from. A key purpose of a SHMA is to define the Objectively Assessed Need (OAN) for
housing. The PPG is clear that the starting point for doing so is the official population and
household projections. These are published at a national level, and for local authorities. They are
not published below local authority level, nor is the data available (regarding migration and trends in
household formation which are key drivers within the projections) to allow this to be undertaken
below local authority level. On this basis we consider that Housing Market Areas should be
based on the ‘best fit’ to local authority boundaries; albeit that SHMAs can (and should)
recognise cross-boundary influences and interactions. The PAS Report supports this, concluding
that:
It is best if HMA boundaries do not cut across local authority areas. Dealing with areas
smaller than local authorities causes major difficulties in analysing evidence and drafting
policy. For such small areas data availability is poor and analysis is complex. These
complications are not offset by the benefit of greater accuracy.
2.13 This approach seems widely accepted and is a practical response to data availability and one we
would wish to adopt. In practical terms, we are of the view that towards the edges of most housing
markets there are likely to be influences in two directions.
2.14 Following this approach, we first of all therefore review existing research which has sought to
consider the definition of the HMAs; before going on to consider more recent data.
CLG/ CURDS Study (2009/10)
2.15 National research undertaken for Government by a consortium of academics led by the Centre for
Urban and Regional Development Studies (CURDS) at Newcastle University has sought to define
housing markets across England. As the PAS Technical Advice Note recommends, we have used
this as a ‘starting point’ for considering the HMA geography.
2.16 The CURDS Study for CLG considers commuting and migration dynamics (based on 2001 Census
data) and house prices (standardised to account for differences in housing mix and neighborhood
characteristics). This information was brought together to define a three tiered structure of housing
markets, as follows:
Strategic (Framework) Housing Markets – based on 77.5% commuting self-containment;
Local Housing Market Areas – based on 50% migration self-containment; and
Sevenoaks & Tunbridge Wells Strategic Housing Market Assessment
Sevenoaks & Tunbridge Wells Councils, Final Report, September 2015
GL Hearn Page 31 of 185
S:\SDC\Planning & Transportation\Planning Policy\Evidence Base\SHMA 2015\SHMA FINAL REPORT SEPTEMBER 2015\SHMA final September 2015.docx
Sub-Markets – which would be defined based on neighbourhood factors and house types.
2.17 The Strategic and Local HMAs are mapped across England, with the Local HMAs embedded within
the wider Strategic HMAs. Both are defined based on wards at a “gold standard” and based on local
authorities for the “silver standard” geographies defined.
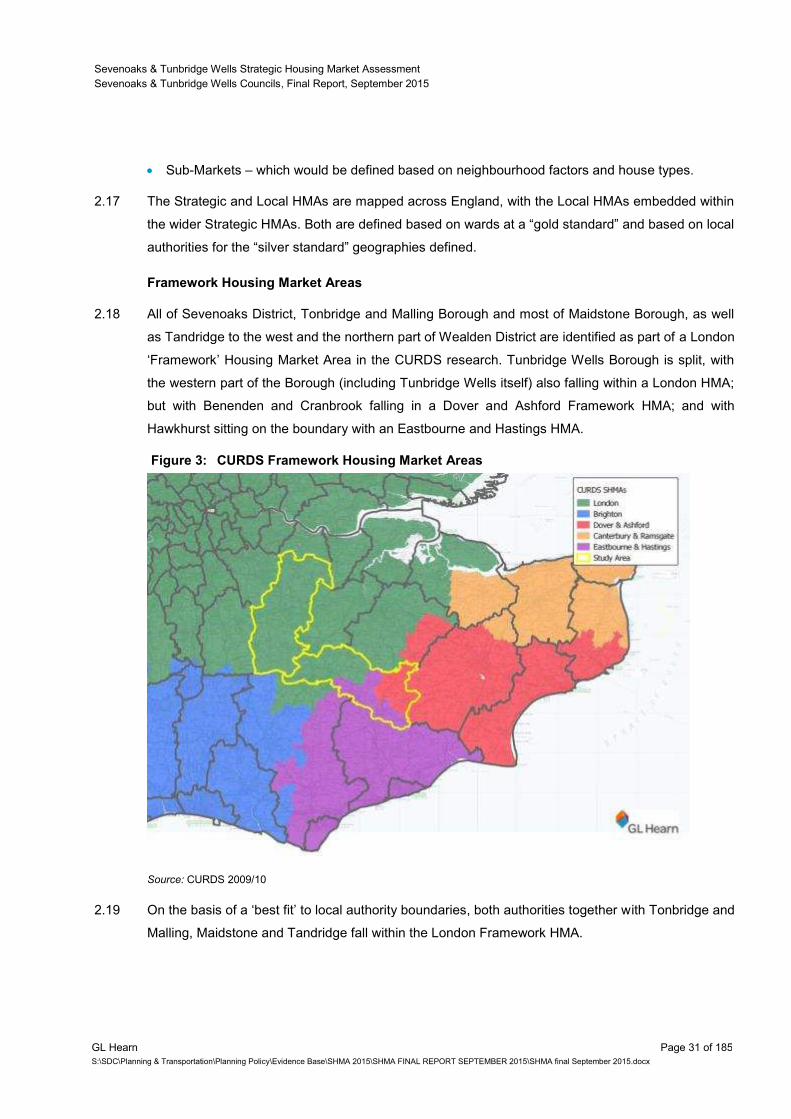
Framework Housing Market Areas
2.18 All of Sevenoaks District, Tonbridge and Malling Borough and most of Maidstone Borough, as well
as Tandridge to the west and the northern part of Wealden District are identified as part of a London
‘Framework’ Housing Market Area in the CURDS research. Tunbridge Wells Borough is split, with
the western part of the Borough (including Tunbridge Wells itself) also falling within a London HMA;
but with Benenden and Cranbrook falling in a Dover and Ashford Framework HMA; and with
Hawkhurst sitting on the boundary with an Eastbourne and Hastings HMA.
Figure 3: CURDS Framework Housing Market Areas
Source: CURDS 2009/10
2.19 On the basis of a ‘best fit’ to local authority boundaries, both authorities together with Tonbridge and
Malling, Maidstone and Tandridge fall within the London Framework HMA.
Sevenoaks & Tunbridge Wells Strategic Housing Market Assessment
Sevenoaks & Tunbridge Wells Councils, Final Report, September 2015
GL Hearn Page 32 of 185
S:\SDC\Planning & Transportation\Planning Policy\Evidence Base\SHMA 2015\SHMA FINAL REPORT SEPTEMBER 2015\SHMA final September 2015.docx
Local Housing Market Areas
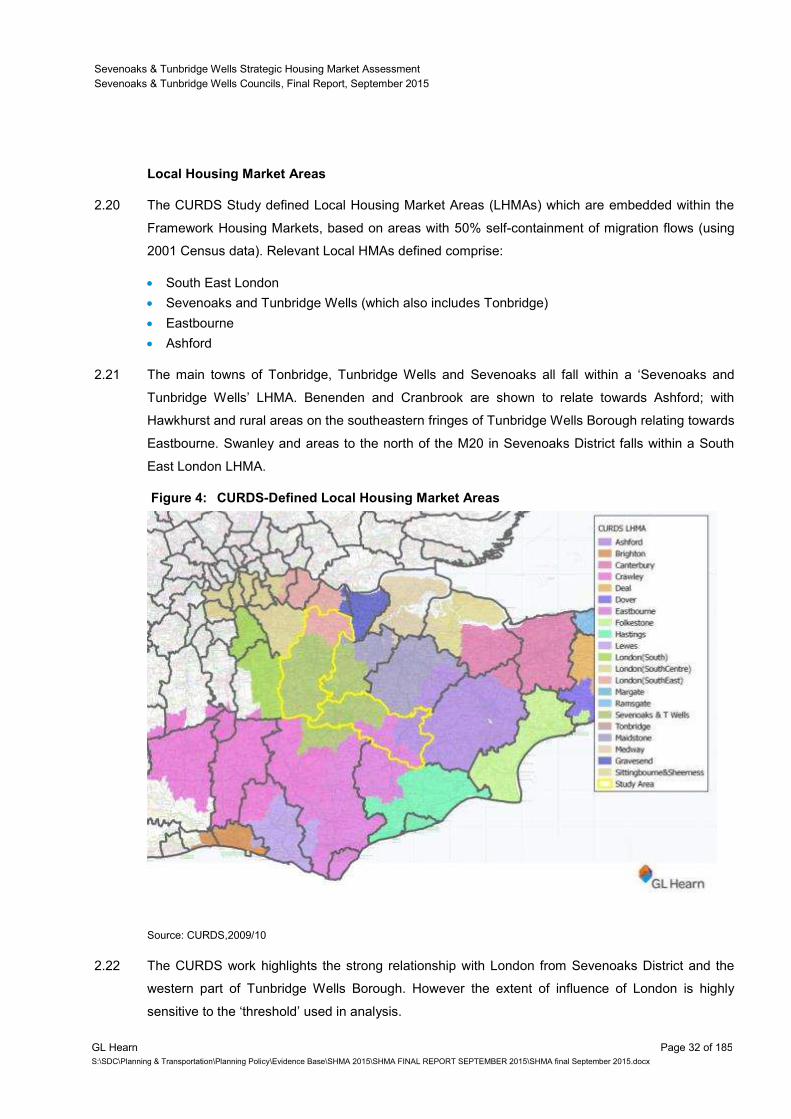
2.20 The CURDS Study defined Local Housing Market Areas (LHMAs) which are embedded within the
Framework Housing Markets, based on areas with 50% self-containment of migration flows (using
2001 Census data). Relevant Local HMAs defined comprise:
South East London
Sevenoaks and Tunbridge Wells (which also includes Tonbridge)
Eastbourne
Ashford
2.21 The main towns of Tonbridge, Tunbridge Wells and Sevenoaks all fall within a ‘Sevenoaks and
Tunbridge Wells’ LHMA. Benenden and Cranbrook are shown to relate towards Ashford; with
Hawkhurst and rural areas on the southeastern fringes of Tunbridge Wells Borough relating towards
Eastbourne. Swanley and areas to the north of the M20 in Sevenoaks District falls within a South
East London LHMA.
Figure 4: CURDS-Defined Local Housing Market Areas
Source: CURDS,2009/10
2.22 The CURDS work highlights the strong relationship with London from Sevenoaks District and the
western part of Tunbridge Wells Borough. However the extent of influence of London is highly
sensitive to the ‘threshold’ used in analysis.
Sevenoaks & Tunbridge Wells Strategic Housing Market Assessment
Sevenoaks & Tunbridge Wells Councils, Final Report, September 2015
GL Hearn Page 33 of 185
S:\SDC\Planning & Transportation\Planning Policy\Evidence Base\SHMA 2015\SHMA FINAL REPORT SEPTEMBER 2015\SHMA final September 2015.docx
2.23 It must be borne in mind that the CURDS work is based on 2001 data, which is now 14 years old.
2011 Census commuting and migration flow data has been released in Summer 2014 which
provides a basis for reconsidering housing market geographies using more recent information. This
is considered later in this section.
Other Strategic Studies considering HMA Geographies
London SHMA (2013)
2.24 The GLA’s 2013 SHMA looks at the Greater London area, but recognises links beyond this setting
out that ‘its urban area extends beyond this boundary and encompasses a substantial hinterland’
but sets out that there is no universally accepted way of measuring this, noting that boundaries
based on analysis of commuting and migration “are highly sensitive to the specific level of
containment uses” based on reference to the CURDS Study.
2.25 The examination of Further Alternations to the London Plan took place in September 2014. This
included consideration of whether London can be described as a single Housing Market Area. The
report from the Planning Inspector, Anthony Thickett, following the Examination in Public was
published in December 2014. In Paragraph 22 the Inspector did not challenge the GLA’s contention
that London represents a single Housing Market area, commenting that:
The Mayor points to the acceptance by previous EiP Panels that London constitutes a single
housing market area with sub markets which span Borough boundaries. The Mayor also
points to the findings of the High Court, following a challenge to the Revised Early Minor
Alterations to the London Plan, within which in his (undisputed) opinion, the Court accepted
that although local variations exist, this did not compromise the view that London constitutes
a single housing market area.
2.26 The implications of this for studies such as this is that local authorities must seek to define HMAs
which exclude parts of London; but need to recognise that there is an inter-relationship with London
which is relevant in housing market terms.
South East Plan Evidence
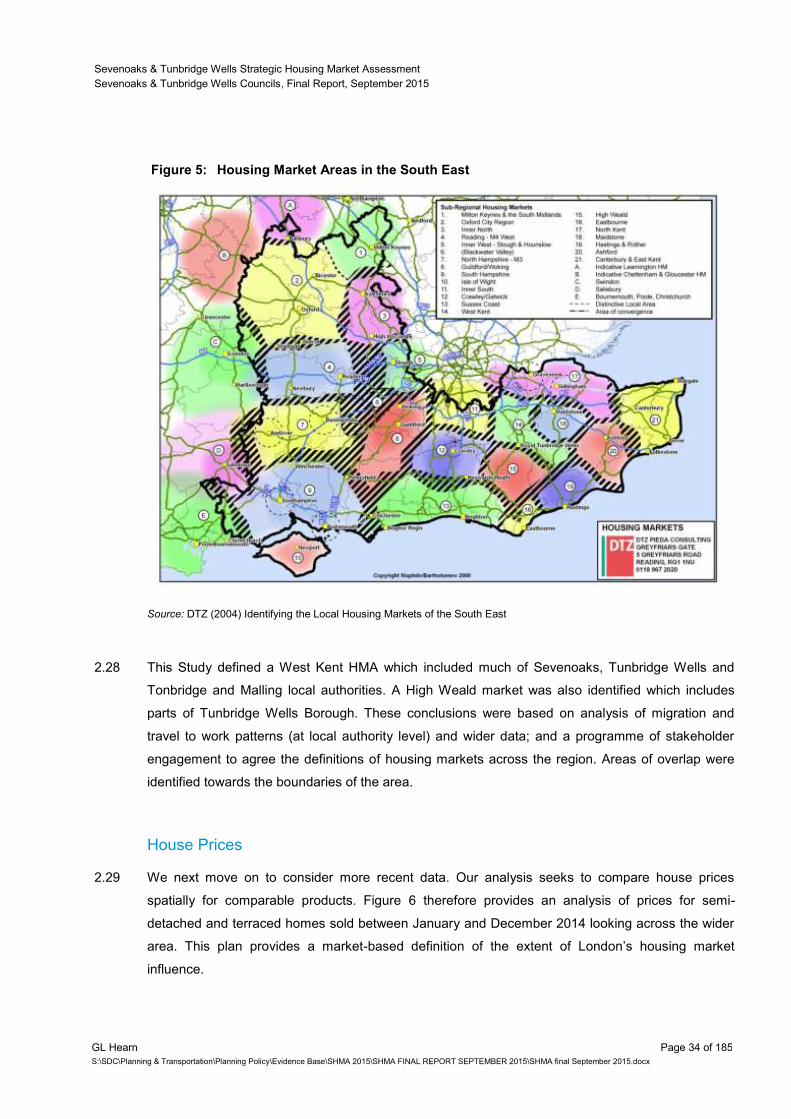
2.27 Sub-regional housing markets within the South East of England were defined in the South East
Plan based on a regional study undertaken by DTZ for the South East of England Regional
Assembly and Homes and Communities Agency in 200411
to define housing market areas across
the South East. DTZ identified 21 housing market areas across the region, as shown in Figure 5.
11
DTZ (2004) Identifying the Local Housing Markets of the South East
Sevenoaks & Tunbridge Wells Strategic Housing Market Assessment
Sevenoaks & Tunbridge Wells Councils, Final Report, September 2015
GL Hearn Page 34 of 185
S:\SDC\Planning & Transportation\Planning Policy\Evidence Base\SHMA 2015\SHMA FINAL REPORT SEPTEMBER 2015\SHMA final September 2015.docx
Figure 5: Housing Market Areas in the South East
Source: DTZ (2004) Identifying the Local Housing Markets of the South East
2.28 This Study defined a West Kent HMA which included much of Sevenoaks, Tunbridge Wells and
Tonbridge and Malling local authorities. A High Weald market was also identified which includes
parts of Tunbridge Wells Borough. These conclusions were based on analysis of migration and
travel to work patterns (at local authority level) and wider data; and a programme of stakeholder
engagement to agree the definitions of housing markets across the region. Areas of overlap were
identified towards the boundaries of the area.
House Prices
2.29 We next move on to consider more recent data. Our analysis seeks to compare house prices
spatially for comparable products. Figure 6 therefore provides an analysis of prices for semi-
detached and terraced homes sold between January and December 2014 looking across the wider
area. This plan provides a market-based definition of the extent of London’s housing market
influence.
Sevenoaks & Tunbridge Wells Strategic Housing Market Assessment
Sevenoaks & Tunbridge Wells Councils, Final Report, September 2015
GL Hearn Page 35 of 185
S:\SDC\Planning & Transportation\Planning Policy\Evidence Base\SHMA 2015\SHMA FINAL REPORT SEPTEMBER 2015\SHMA final September 2015.docx
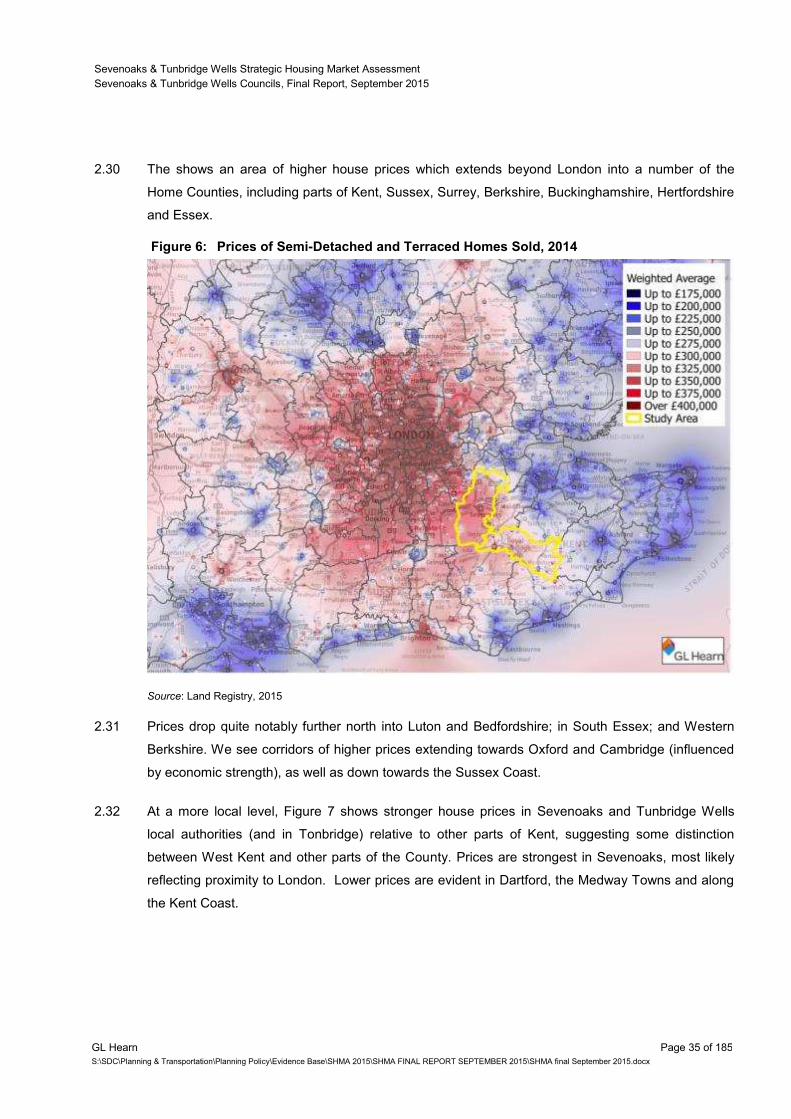
2.30 The shows an area of higher house prices which extends beyond London into a number of the
Home Counties, including parts of Kent, Sussex, Surrey, Berkshire, Buckinghamshire, Hertfordshire
and Essex.
Figure 6: Prices of Semi-Detached and Terraced Homes Sold, 2014
Source: Land Registry, 2015
2.31 Prices drop quite notably further north into Luton and Bedfordshire; in South Essex; and Western
Berkshire. We see corridors of higher prices extending towards Oxford and Cambridge (influenced
by economic strength), as well as down towards the Sussex Coast.
2.32 At a more local level, Figure 7 shows stronger house prices in Sevenoaks and Tunbridge Wells
local authorities (and in Tonbridge) relative to other parts of Kent, suggesting some distinction
between West Kent and other parts of the County. Prices are strongest in Sevenoaks, most likely
reflecting proximity to London. Lower prices are evident in Dartford, the Medway Towns and along
the Kent Coast.
Sevenoaks & Tunbridge Wells Strategic Housing Market Assessment
Sevenoaks & Tunbridge Wells Councils, Final Report, September 2015
GL Hearn Page 36 of 185
S:\SDC\Planning & Transportation\Planning Policy\Evidence Base\SHMA 2015\SHMA FINAL REPORT SEPTEMBER 2015\SHMA final September 2015.docx
Localised Price Distinctions
2.33 As described above, we would fully expect more localised distinctions in house prices to emerge
through a finer grain (more localised) analysis of house price differentials. These reflect differences
in the housing offer, quality of place and accessibility of different areas to employment centres.
Figure 7: Prices of Semi-Detached and Terraced Homes Sold – West Kent, 2014
Source: Land Registry, 2015
2.34 Figure 7 highlights stronger house prices in Sevenoaks District; and lower housing costs in
Hawkhurst and the eastern part of Tunbridge Wells Borough. Lower prices are also evident in
Swanley.
House Price Changes
2.35 Figure 8 analyses how house prices have changed over the last five years (2009-14). It shows
consistent growth in house prices across the two authorities of 10-15% over the five year period.
This is slightly stronger than in either Tonbridge and Malling or Maidstone Boroughs; but similar to
that in Tandridge, Mid Sussex and Wealden. The analysis shows price change at local authority
level.
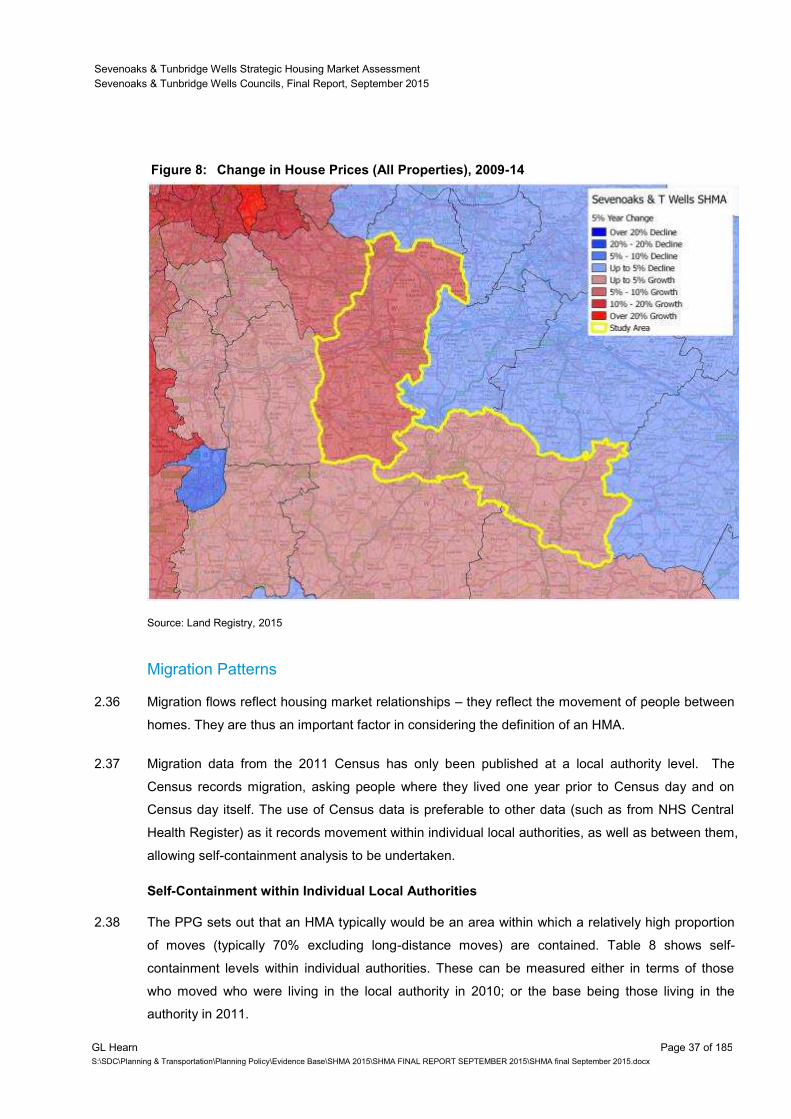
Sevenoaks & Tunbridge Wells Strategic Housing Market Assessment
Sevenoaks & Tunbridge Wells Councils, Final Report, September 2015
GL Hearn Page 37 of 185
S:\SDC\Planning & Transportation\Planning Policy\Evidence Base\SHMA 2015\SHMA FINAL REPORT SEPTEMBER 2015\SHMA final September 2015.docx
Figure 8: Change in House Prices (All Properties), 2009-14
Source: Land Registry, 2015
Migration Patterns
2.36 Migration flows reflect housing market relationships – they reflect the movement of people between
homes. They are thus an important factor in considering the definition of an HMA.
2.37 Migration data from the 2011 Census has only been published at a local authority level. The
Census records migration, asking people where they lived one year prior to Census day and on
Census day itself. The use of Census data is preferable to other data (such as from NHS Central
Health Register) as it records movement within individual local authorities, as well as between them,
allowing self-containment analysis to be undertaken.
Self-Containment within Individual Local Authorities
2.38 The PPG sets out that an HMA typically would be an area within which a relatively high proportion
of moves (typically 70% excluding long-distance moves) are contained. Table 8 shows self-
containment levels within individual authorities. These can be measured either in terms of those
who moved who were living in the local authority in 2010; or the base being those living in the
authority in 2011.
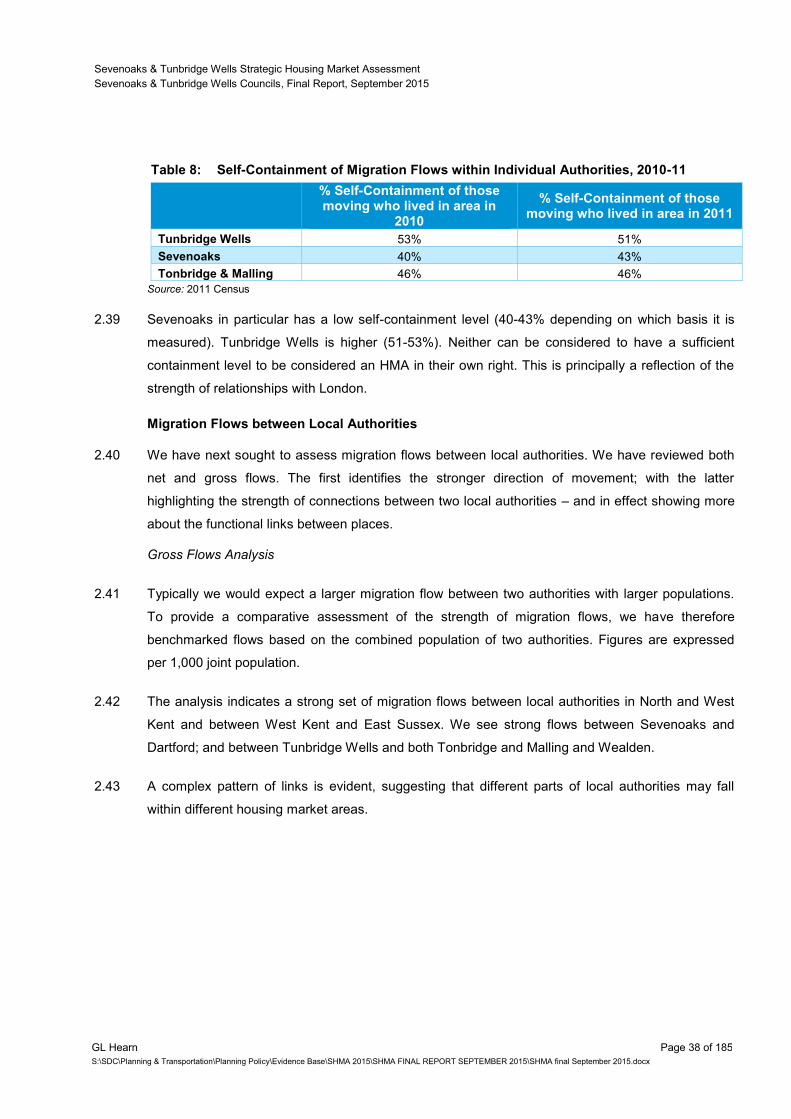
Sevenoaks & Tunbridge Wells Strategic Housing Market Assessment
Sevenoaks & Tunbridge Wells Councils, Final Report, September 2015
GL Hearn Page 38 of 185
S:\SDC\Planning & Transportation\Planning Policy\Evidence Base\SHMA 2015\SHMA FINAL REPORT SEPTEMBER 2015\SHMA final September 2015.docx
Table 8: Self-Containment of Migration Flows within Individual Authorities, 2010-11
% Self-Containment of those moving who lived in area in
2010
% Self-Containment of those moving who lived in area in 2011
Tunbridge Wells 53% 51%
Sevenoaks 40% 43%
Tonbridge & Malling 46% 46%
Source: 2011 Census
2.39 Sevenoaks in particular has a low self-containment level (40-43% depending on which basis it is
measured). Tunbridge Wells is higher (51-53%). Neither can be considered to have a sufficient
containment level to be considered an HMA in their own right. This is principally a reflection of the
strength of relationships with London.
Migration Flows between Local Authorities
2.40 We have next sought to assess migration flows between local authorities. We have reviewed both
net and gross flows. The first identifies the stronger direction of movement; with the latter
highlighting the strength of connections between two local authorities – and in effect showing more
about the functional links between places.
Gross Flows Analysis
2.41 Typically we would expect a larger migration flow between two authorities with larger populations.
To provide a comparative assessment of the strength of migration flows, we have therefore
benchmarked flows based on the combined population of two authorities. Figures are expressed
per 1,000 joint population.
2.42 The analysis indicates a strong set of migration flows between local authorities in North and West
Kent and between West Kent and East Sussex. We see strong flows between Sevenoaks and
Dartford; and between Tunbridge Wells and both Tonbridge and Malling and Wealden.
2.43 A complex pattern of links is evident, suggesting that different parts of local authorities may fall
within different housing market areas.
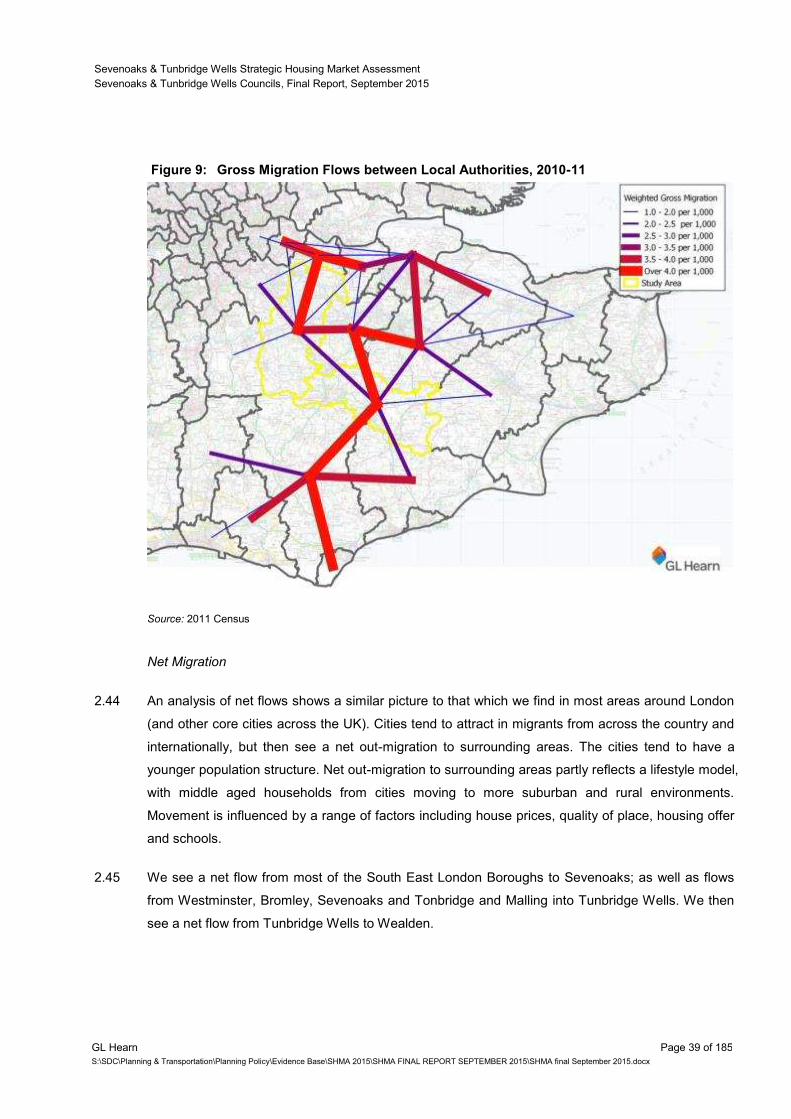
Sevenoaks & Tunbridge Wells Strategic Housing Market Assessment
Sevenoaks & Tunbridge Wells Councils, Final Report, September 2015
GL Hearn Page 39 of 185
S:\SDC\Planning & Transportation\Planning Policy\Evidence Base\SHMA 2015\SHMA FINAL REPORT SEPTEMBER 2015\SHMA final September 2015.docx
Figure 9: Gross Migration Flows between Local Authorities, 2010-11
Source: 2011 Census
Net Migration
2.44 An analysis of net flows shows a similar picture to that which we find in most areas around London
(and other core cities across the UK). Cities tend to attract in migrants from across the country and
internationally, but then see a net out-migration to surrounding areas. The cities tend to have a
younger population structure. Net out-migration to surrounding areas partly reflects a lifestyle model,
with middle aged households from cities moving to more suburban and rural environments.
Movement is influenced by a range of factors including house prices, quality of place, housing offer
and schools.
2.45 We see a net flow from most of the South East London Boroughs to Sevenoaks; as well as flows
from Westminster, Bromley, Sevenoaks and Tonbridge and Malling into Tunbridge Wells. We then
see a net flow from Tunbridge Wells to Wealden.
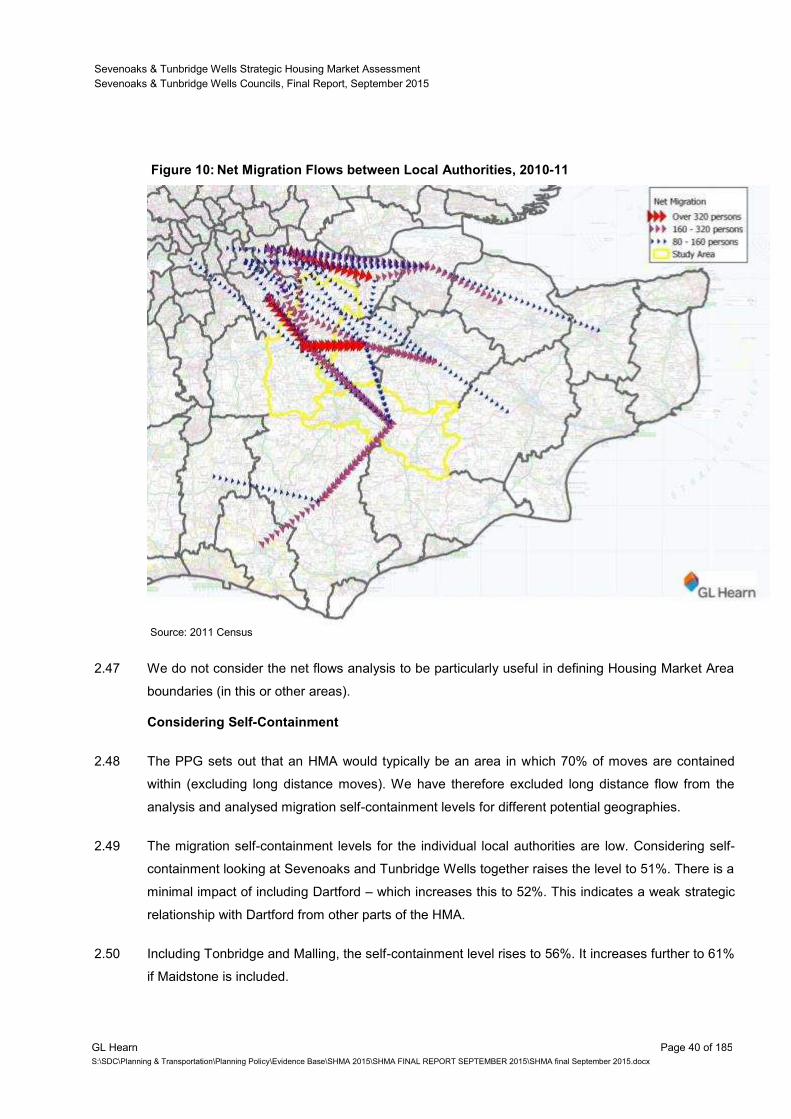
Sevenoaks & Tunbridge Wells Strategic Housing Market Assessment
Sevenoaks & Tunbridge Wells Councils, Final Report, September 2015
GL Hearn Page 40 of 185
S:\SDC\Planning & Transportation\Planning Policy\Evidence Base\SHMA 2015\SHMA FINAL REPORT SEPTEMBER 2015\SHMA final September 2015.docx
Figure 10: Net Migration Flows between Local Authorities, 2010-11
Source: 2011 Census
2.47 We do not consider the net flows analysis to be particularly useful in defining Housing Market Area
boundaries (in this or other areas).
Considering Self-Containment
2.48 The PPG sets out that an HMA would typically be an area in which 70% of moves are contained
within (excluding long distance moves). We have therefore excluded long distance flow from the
analysis and analysed migration self-containment levels for different potential geographies.
2.49 The migration self-containment levels for the individual local authorities are low. Considering self-
containment looking at Sevenoaks and Tunbridge Wells together raises the level to 51%. There is a
minimal impact of including Dartford – which increases this to 52%. This indicates a weak strategic
relationship with Dartford from other parts of the HMA.
2.50 Including Tonbridge and Malling, the self-containment level rises to 56%. It increases further to 61%
if Maidstone is included.
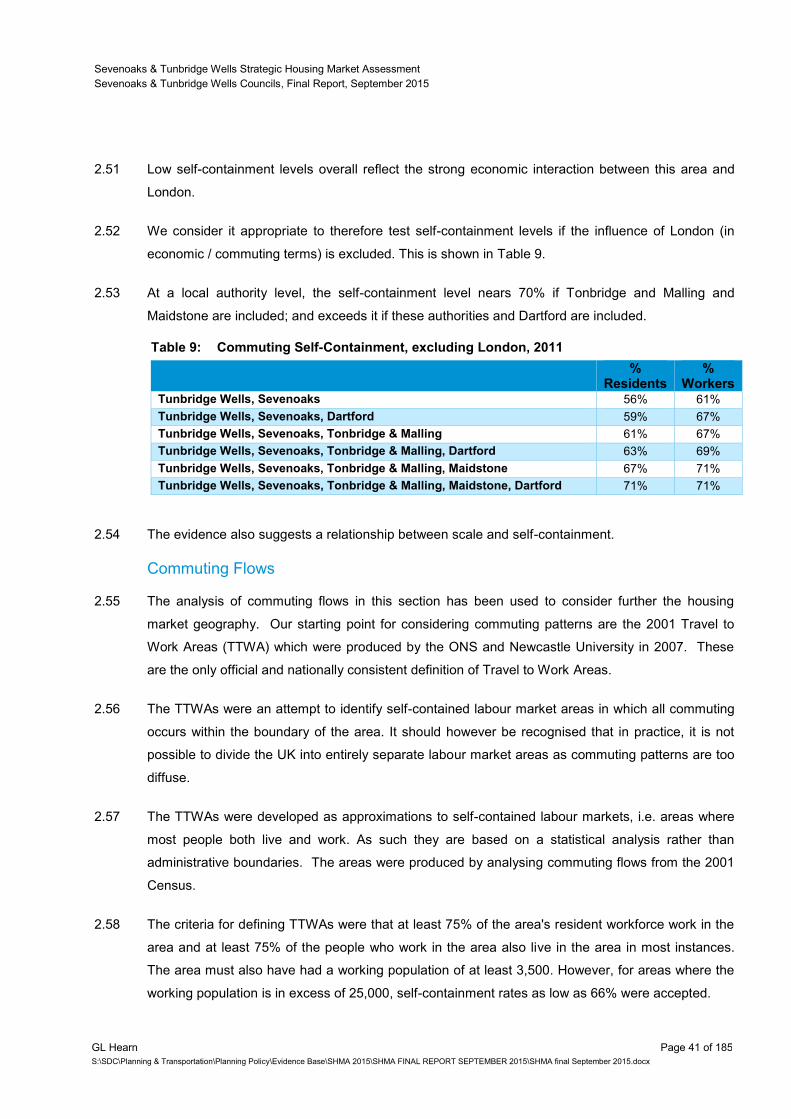
Sevenoaks & Tunbridge Wells Strategic Housing Market Assessment
Sevenoaks & Tunbridge Wells Councils, Final Report, September 2015
GL Hearn Page 41 of 185
S:\SDC\Planning & Transportation\Planning Policy\Evidence Base\SHMA 2015\SHMA FINAL REPORT SEPTEMBER 2015\SHMA final September 2015.docx
2.51 Low self-containment levels overall reflect the strong economic interaction between this area and
London.
2.52 We consider it appropriate to therefore test self-containment levels if the influence of London (in
economic / commuting terms) is excluded. This is shown in Table 9.
2.53 At a local authority level, the self-containment level nears 70% if Tonbridge and Malling and
Maidstone are included; and exceeds it if these authorities and Dartford are included.
Table 9: Commuting Self-Containment, excluding London, 2011
%
Residents %
Workers Tunbridge Wells, Sevenoaks 56% 61%
Tunbridge Wells, Sevenoaks, Dartford 59% 67%
Tunbridge Wells, Sevenoaks, Tonbridge & Malling 61% 67%
Tunbridge Wells, Sevenoaks, Tonbridge & Malling, Dartford 63% 69%
Tunbridge Wells, Sevenoaks, Tonbridge & Malling, Maidstone 67% 71%
Tunbridge Wells, Sevenoaks, Tonbridge & Malling, Maidstone, Dartford 71% 71%
2.54 The evidence also suggests a relationship between scale and self-containment.
Commuting Flows
2.55 The analysis of commuting flows in this section has been used to consider further the housing
market geography. Our starting point for considering commuting patterns are the 2001 Travel to
Work Areas (TTWA) which were produced by the ONS and Newcastle University in 2007. These
are the only official and nationally consistent definition of Travel to Work Areas.
2.56 The TTWAs were an attempt to identify self-contained labour market areas in which all commuting
occurs within the boundary of the area. It should however be recognised that in practice, it is not
possible to divide the UK into entirely separate labour market areas as commuting patterns are too
diffuse.
2.57 The TTWAs were developed as approximations to self-contained labour markets, i.e. areas where
most people both live and work. As such they are based on a statistical analysis rather than
administrative boundaries. The areas were produced by analysing commuting flows from the 2001
Census.
2.58 The criteria for defining TTWAs were that at least 75% of the area's resident workforce work in the
area and at least 75% of the people who work in the area also live in the area in most instances.
The area must also have had a working population of at least 3,500. However, for areas where the
working population is in excess of 25,000, self-containment rates as low as 66% were accepted.

Sevenoaks & Tunbridge Wells Strategic Housing Market Assessment
Sevenoaks & Tunbridge Wells Councils, Final Report, September 2015
GL Hearn Page 42 of 185
S:\SDC\Planning & Transportation\Planning Policy\Evidence Base\SHMA 2015\SHMA FINAL REPORT SEPTEMBER 2015\SHMA final September 2015.docx
Figure 11: 2001 Travel to Work Areas
Source: ONS, 2007
2.59 The majority of the two authorities, together with Tonbridge and the northern parts of Wealden and
north-west part of Rother District were defined as forming collectively a Tunbridge Wells TTWA by
ONS. Swanley was defined as within a London TTWA.
2.60 Figure 12 illustrates the influence of London as an employment destination. The map shows that
some Middle-Level Super Output Areas (MSOA)12
as far as Brighton, Winchester and Suffolk from
which there is notable commuting to London. It highlights the extensive influence of London on
commuting from areas within the South East and East of England. This demonstrates the Capital’s
extensive economic influence.
12
This is an ONS geography which is larger than wards, but below local authority level
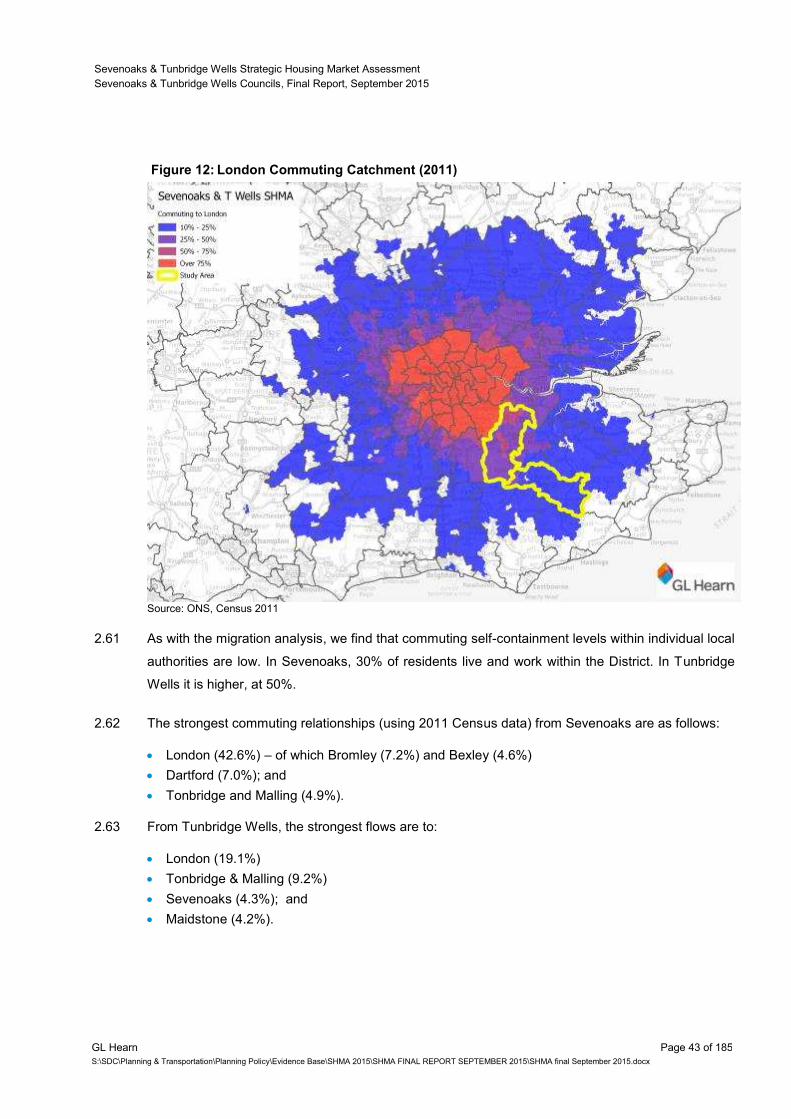
Sevenoaks & Tunbridge Wells Strategic Housing Market Assessment
Sevenoaks & Tunbridge Wells Councils, Final Report, September 2015
GL Hearn Page 43 of 185
S:\SDC\Planning & Transportation\Planning Policy\Evidence Base\SHMA 2015\SHMA FINAL REPORT SEPTEMBER 2015\SHMA final September 2015.docx
Figure 12: London Commuting Catchment (2011)
Source: ONS, Census 2011
2.61 As with the migration analysis, we find that commuting self-containment levels within individual local
authorities are low. In Sevenoaks, 30% of residents live and work within the District. In Tunbridge
Wells it is higher, at 50%.
2.62 The strongest commuting relationships (using 2011 Census data) from Sevenoaks are as follows:
London (42.6%) – of which Bromley (7.2%) and Bexley (4.6%)
Dartford (7.0%); and
Tonbridge and Malling (4.9%).
2.63 From Tunbridge Wells, the strongest flows are to:
London (19.1%)
Tonbridge & Malling (9.2%)
Sevenoaks (4.3%); and
Maidstone (4.2%).

Sevenoaks & Tunbridge Wells Strategic Housing Market Assessment
Sevenoaks & Tunbridge Wells Councils, Final Report, September 2015
GL Hearn Page 44 of 185
S:\SDC\Planning & Transportation\Planning Policy\Evidence Base\SHMA 2015\SHMA FINAL REPORT SEPTEMBER 2015\SHMA final September 2015.docx
2.64 From Tonbridge and Malling, the strongest relationships are with London (20.3%); Maidstone
(11.4%); and Sevenoaks (7.0%). There is a strong relationship between Tunbridge Wells and
Tonbridge.
2.65 In August 2015, ONS released updated Travel to Work Areas (TTWAs) based on 2011 Census
data. Their criteria for defining TTWAs is that generally at least 75% of an area's resident workforce
work in the area and at least 75% of the people who work in the area also live in the area. The area
must also have a working population of at least 3,500. However, for areas with a working population
in excess of 25,000, self-containment rates as low as 66.7% are accepted. TTWA boundaries are
non-overlapping, are contiguous and cover the whole of the UK.
2.66 The ONS defines a Tunbridge Wells TTWA which includes Sevenoaks, Tonbridge and Tunbridge
Wells; together with Hawkhurst as well as Crowborough and Heathfield in the northern part of
Wealden and Rother respectively. Swanley is identified as part of a London TTWA.
Figure 13: ONS 2011 Travel to Work Areas
Source: ONS
Sevenoaks & Tunbridge Wells Strategic Housing Market Assessment
Sevenoaks & Tunbridge Wells Councils, Final Report, September 2015
GL Hearn Page 45 of 185
S:\SDC\Planning & Transportation\Planning Policy\Evidence Base\SHMA 2015\SHMA FINAL REPORT SEPTEMBER 2015\SHMA final September 2015.docx
Summary and Implications – HMA Geography
2.67 As the CURDS analysis sets out there is a close set of interactions between the towns of
Sevenoaks, Tonbridge and Tunbridge Wells which reflect their geographical proximity. There is also
a relationship into the northern part of Wealden. There are cross-boundary interactions between
Swanley and Dartford and a stronger commuting relationship to London. Links from Tandridge are
stronger to other authorities in Surrey and West Sussex. Flows between Dartford and Swanley are
relatively localised.
2.68 An appropriate definition of the Housing Market Area would include Sevenoaks, Tonbridge,
Tunbridge Wells and Crowborough. This includes the main population centres in Sevenoaks and
Tunbridge Wells local authorities. GL Hearn would consider that the 2011 Tunbridge Wells TTWA
provides an appropriate HMA geography. This is not substantially different to that shown from the
CURDS Local Housing Market Area.
2.69 However for practical purposes it is useful to consider the ‘best fit’ of local authorities to housing
market areas, not least as demographic projections are developed on this basis. There is a strong
basis for considering Sevenoaks and Tunbridge Wells together. Tonbridge and Malling is effectively
split, with part of the Borough relating to this HMA (Tonbridge); and part (Malling) towards
Maidstone.
2.70 There are some relationships with adjoining areas, including between Swanley and Dartford; and
between Tunbridge Wells and the northern parts of Wealden and Rother Districts. The evidence
also points towards a significant functional relationship with London, in respect of both commuting
and migration flows. Like many areas close to the M25, there is a strong functional relationship with
the Capital. However the GLA define a London HMA which is contained within the Greater London
boundaries; whilst recognising relationships across a wider hinterland.
2.71 For the purposes of local plan preparation, a recent High Court judgement has confirmed that
(interpreting the NPPF) the primary duty of a Local Planning Authority is to assess the needs of the
LPA area, but in assessing these needs it is required to prepare a SHMA which may cross
administrative boundaries.13
Against this context this report has been prepared for the
commissioning authorities of Sevenoaks and Tunbridge Wells, but uses a consistent methodology
to that covering Tonbridge and Malling (as well as Maidstone and Ashford).
2.72 The principal cross-boundary issue of relevance relates to any potential issues regarding unmet
housing needs. If an unmet housing need arises from either of the commissioning authorities, it
would be appropriate for them to approach other authorities with which they share an HMA to
13
Satnam Millenium Ltd vs. Warrington MBC [EWHC 370 (Admin) Para 25]

Sevenoaks & Tunbridge Wells Strategic Housing Market Assessment
Sevenoaks & Tunbridge Wells Councils, Final Report, September 2015
GL Hearn Page 46 of 185
S:\SDC\Planning & Transportation\Planning Policy\Evidence Base\SHMA 2015\SHMA FINAL REPORT SEPTEMBER 2015\SHMA final September 2015.docx
consider if needs can be met in these areas. The principal adjoining authorities with a strong
relationship would be Tonbridge & Malling, Wealden and Rother. Equally the commissioning
authorities would need to engage with these authorities in respect of any unmet housing needs
arising from these other authorities’ areas. We would also advise the Councils to engage with the
Greater London Authority and London Boroughs in respect of any unmet needs arising from London.
Sevenoaks & Tunbridge Wells Strategic Housing Market Assessment
Sevenoaks & Tunbridge Wells Councils, Final Report, September 2015
GL Hearn Page 47 of 185
S:\SDC\Planning & Transportation\Planning Policy\Evidence Base\SHMA 2015\SHMA FINAL REPORT SEPTEMBER 2015\SHMA final September 2015.docx
3 DEMOGRAPHIC AND ECONOMIC-LED PROJECTIONS
3.1 The Planning Practice Guidance (PPG) outlines that the latest official population and household
projections should be considered as the ‘starting point’ in defining the Objectively Assessed
Housing Need. It outlines that plan makers may consider sensitivity testing, considering alternative
assumptions on population growth and household formation rates, but that any local changes made
to projections need to be clearly explained and justified based on established sources of robust
evidence.
3.2 The PPG also sets out that employment trends should be taken into account, with an assessment
made of likely changes in job numbers based on past trends and/or economic forecasts as
appropriate, having regard to the growth in the working-age population across the housing market
area. Where labour force supply is less than projected jobs growth, plan makers are advised to
consider how the level or location of housing provision, or infrastructure development could help to
address this.
3.3 In this section consideration is given to demographic evidence of housing need. The analysis
begins by considering the most recent population and household projections published by
ONS/CLG. A sensitivity analysis is then provided considering alternative projections of population
growth and housing need based on demographic trends.
3.4 A sensitivity analysis includes consideration of the inter-relationship between each of the two local
authorities and London, and considers how migration to/ from London might change in the future.
This takes account of evidence and the modelling approach which underpins the current version of
the London Plan, which is based on the Greater London Authority (GLA) 2013-based Demographic
Projections. It should however be noted that the London Plan is being reviewed, and that this
evidence and situation may change over time.
3.5 The section also considers the overlay between population growth and job growth to consider if
there will be a sufficient workforce moving forward to support projected growth in employment,
following the approach in the PPG.
3.6 The core projections in this section look at housing needs in the period from 2013 to 2033. The
starting point reflects a base position for which a reasonable amount of data is available (the ONS
mid-2013 population estimates) with the end date selected to provide a reasonable (20-year) period
for analysis.
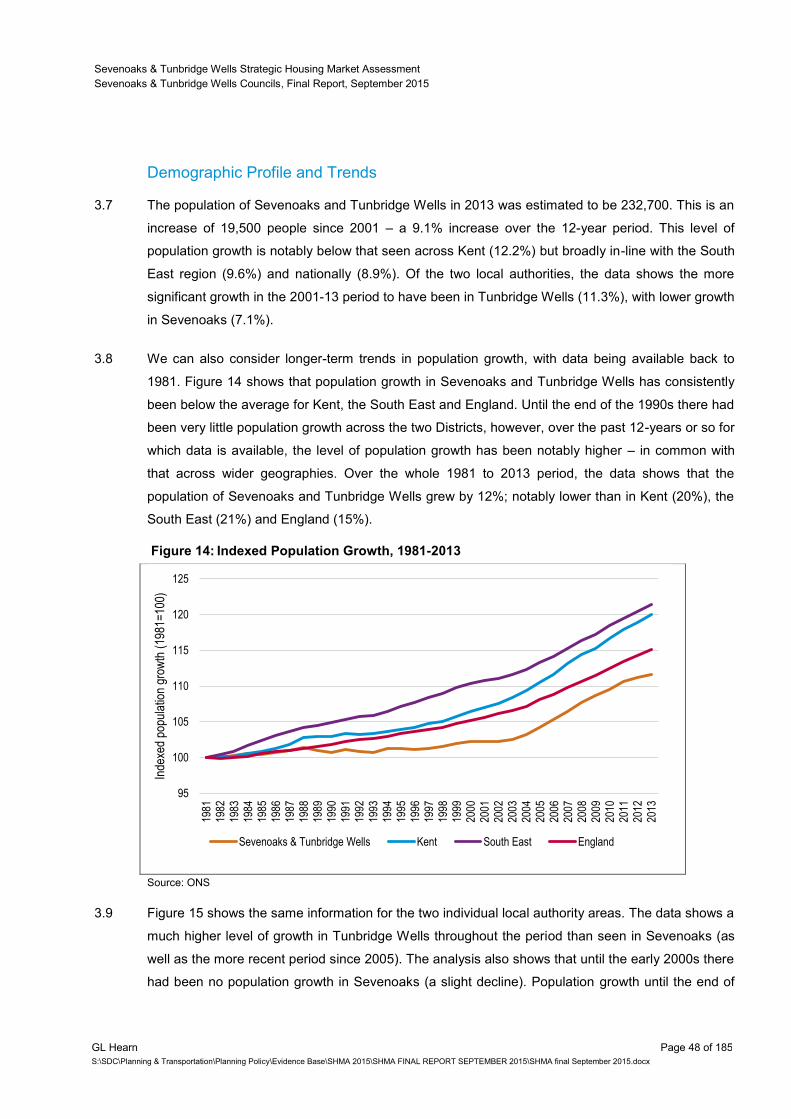
Sevenoaks & Tunbridge Wells Strategic Housing Market Assessment
Sevenoaks & Tunbridge Wells Councils, Final Report, September 2015
GL Hearn Page 48 of 185
S:\SDC\Planning & Transportation\Planning Policy\Evidence Base\SHMA 2015\SHMA FINAL REPORT SEPTEMBER 2015\SHMA final September 2015.docx
Demographic Profile and Trends
3.7 The population of Sevenoaks and Tunbridge Wells in 2013 was estimated to be 232,700. This is an
increase of 19,500 people since 2001 – a 9.1% increase over the 12-year period. This level of
population growth is notably below that seen across Kent (12.2%) but broadly in-line with the South
East region (9.6%) and nationally (8.9%). Of the two local authorities, the data shows the more
significant growth in the 2001-13 period to have been in Tunbridge Wells (11.3%), with lower growth
in Sevenoaks (7.1%).
3.8 We can also consider longer-term trends in population growth, with data being available back to
1981. Figure 14 shows that population growth in Sevenoaks and Tunbridge Wells has consistently
been below the average for Kent, the South East and England. Until the end of the 1990s there had
been very little population growth across the two Districts, however, over the past 12-years or so for
which data is available, the level of population growth has been notably higher – in common with
that across wider geographies. Over the whole 1981 to 2013 period, the data shows that the
population of Sevenoaks and Tunbridge Wells grew by 12%; notably lower than in Kent (20%), the
South East (21%) and England (15%).
Figure 14: Indexed Population Growth, 1981-2013
Source: ONS
3.9 Figure 15 shows the same information for the two individual local authority areas. The data shows a
much higher level of growth in Tunbridge Wells throughout the period than seen in Sevenoaks (as
well as the more recent period since 2005). The analysis also shows that until the early 2000s there
had been no population growth in Sevenoaks (a slight decline). Population growth until the end of
95
100
105
110
115
120
125
1981
1982
1983
1984
1985
1986
1987
1988
1989
1990
1991
1992
1993
1994
1995
1996
1997
1998
1999
2000
2001
2002
2003
2004
2005
2006
2007
2008
2009
2010
2011
2012
2013
Inde
xed
popu
latio
n gr
owth
(19
81=
100)
Sevenoaks & Tunbridge Wells Kent South East England
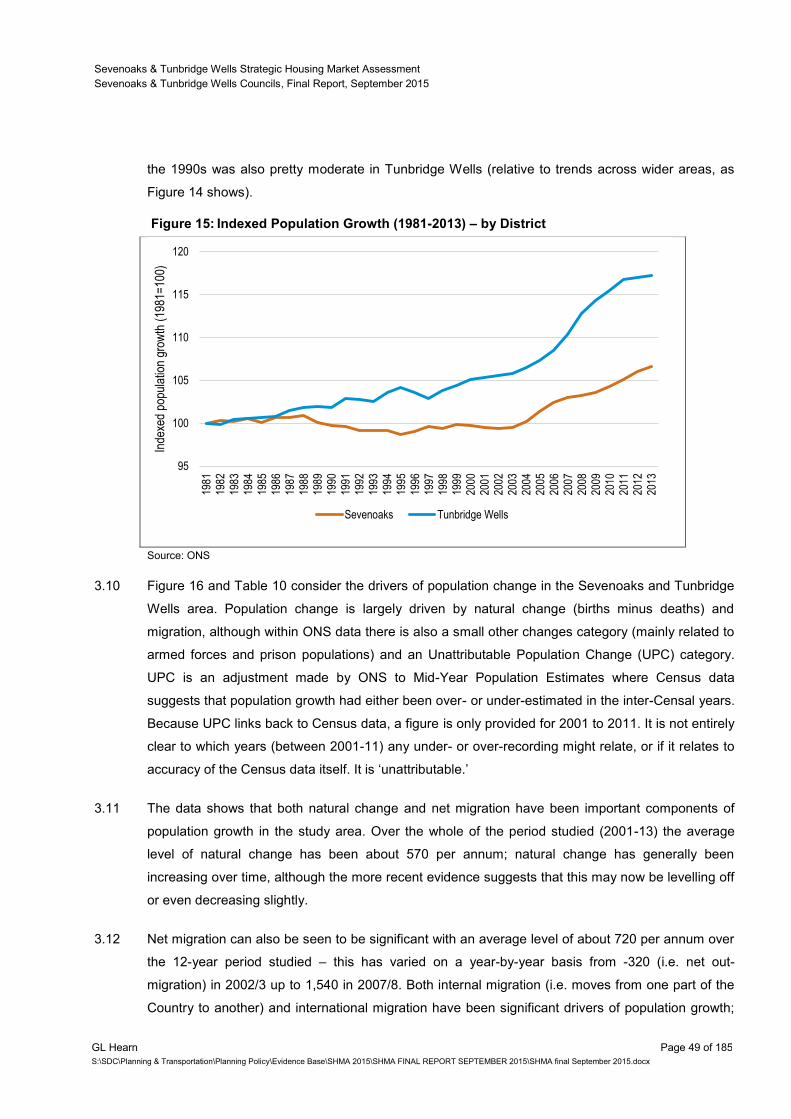
Sevenoaks & Tunbridge Wells Strategic Housing Market Assessment
Sevenoaks & Tunbridge Wells Councils, Final Report, September 2015
GL Hearn Page 49 of 185
S:\SDC\Planning & Transportation\Planning Policy\Evidence Base\SHMA 2015\SHMA FINAL REPORT SEPTEMBER 2015\SHMA final September 2015.docx
the 1990s was also pretty moderate in Tunbridge Wells (relative to trends across wider areas, as
Figure 14 shows).
Figure 15: Indexed Population Growth (1981-2013) – by District
Source: ONS
3.10 Figure 16 and Table 10 consider the drivers of population change in the Sevenoaks and Tunbridge
Wells area. Population change is largely driven by natural change (births minus deaths) and
migration, although within ONS data there is also a small other changes category (mainly related to
armed forces and prison populations) and an Unattributable Population Change (UPC) category.
UPC is an adjustment made by ONS to Mid-Year Population Estimates where Census data
suggests that population growth had either been over- or under-estimated in the inter-Censal years.
Because UPC links back to Census data, a figure is only provided for 2001 to 2011. It is not entirely
clear to which years (between 2001-11) any under- or over-recording might relate, or if it relates to
accuracy of the Census data itself. It is ‘unattributable.’
3.11 The data shows that both natural change and net migration have been important components of
population growth in the study area. Over the whole of the period studied (2001-13) the average
level of natural change has been about 570 per annum; natural change has generally been
increasing over time, although the more recent evidence suggests that this may now be levelling off
or even decreasing slightly.
3.12 Net migration can also be seen to be significant with an average level of about 720 per annum over
the 12-year period studied – this has varied on a year-by-year basis from -320 (i.e. net out-
migration) in 2002/3 up to 1,540 in 2007/8. Both internal migration (i.e. moves from one part of the
Country to another) and international migration have been significant drivers of population growth;
95
100
105
110
115
120
1981
1982
1983
1984
1985
1986
1987
1988
1989
1990
1991
1992
1993
1994
1995
1996
1997
1998
1999
2000
2001
2002
2003
2004
2005
2006
2007
2008
2009
2010
2011
2012
2013
Inde
xed
popu
latio
n gr
owth
(19
81=
100)
Sevenoaks Tunbridge Wells
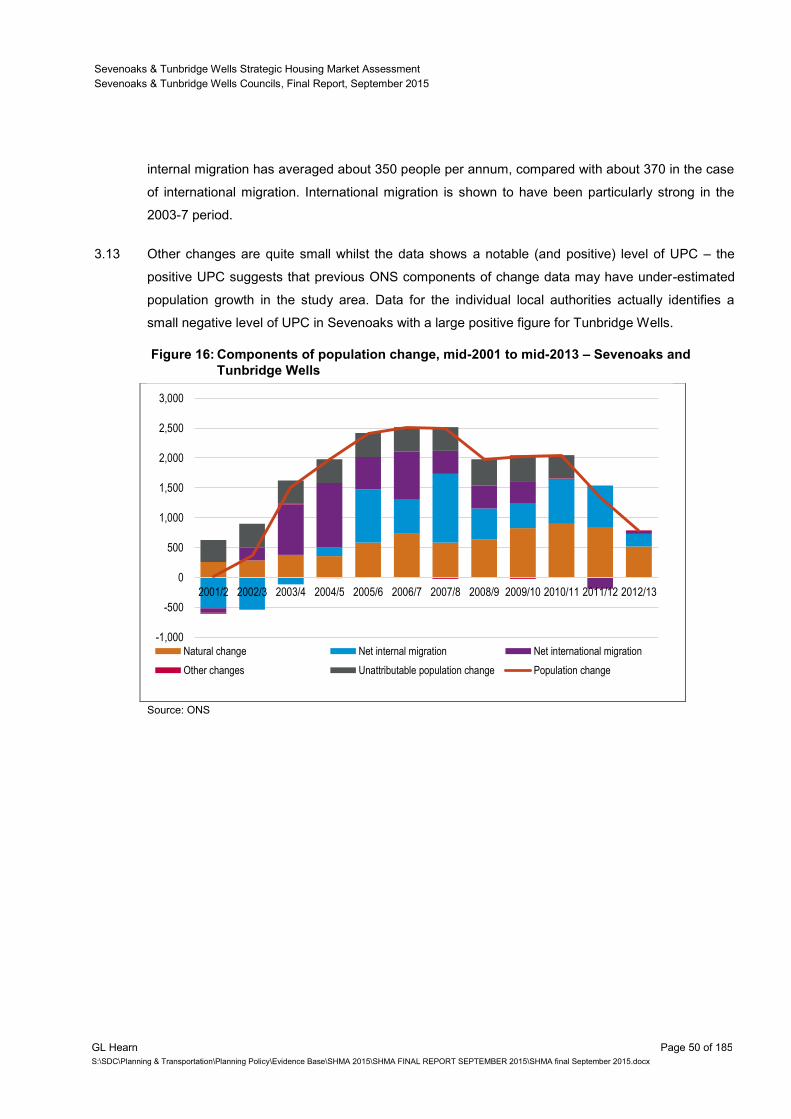
Sevenoaks & Tunbridge Wells Strategic Housing Market Assessment
Sevenoaks & Tunbridge Wells Councils, Final Report, September 2015
GL Hearn Page 50 of 185
S:\SDC\Planning & Transportation\Planning Policy\Evidence Base\SHMA 2015\SHMA FINAL REPORT SEPTEMBER 2015\SHMA final September 2015.docx
internal migration has averaged about 350 people per annum, compared with about 370 in the case
of international migration. International migration is shown to have been particularly strong in the
2003-7 period.
3.13 Other changes are quite small whilst the data shows a notable (and positive) level of UPC – the
positive UPC suggests that previous ONS components of change data may have under-estimated
population growth in the study area. Data for the individual local authorities actually identifies a
small negative level of UPC in Sevenoaks with a large positive figure for Tunbridge Wells.
Figure 16: Components of population change, mid-2001 to mid-2013 – Sevenoaks and
Tunbridge Wells
Source: ONS
-1,000
-500
0
500
1,000
1,500
2,000
2,500
3,000
2001/2 2002/3 2003/4 2004/5 2005/6 2006/7 2007/8 2008/9 2009/10 2010/11 2011/12 2012/13
Natural change Net internal migration Net international migration
Other changes Unattributable population change Population change
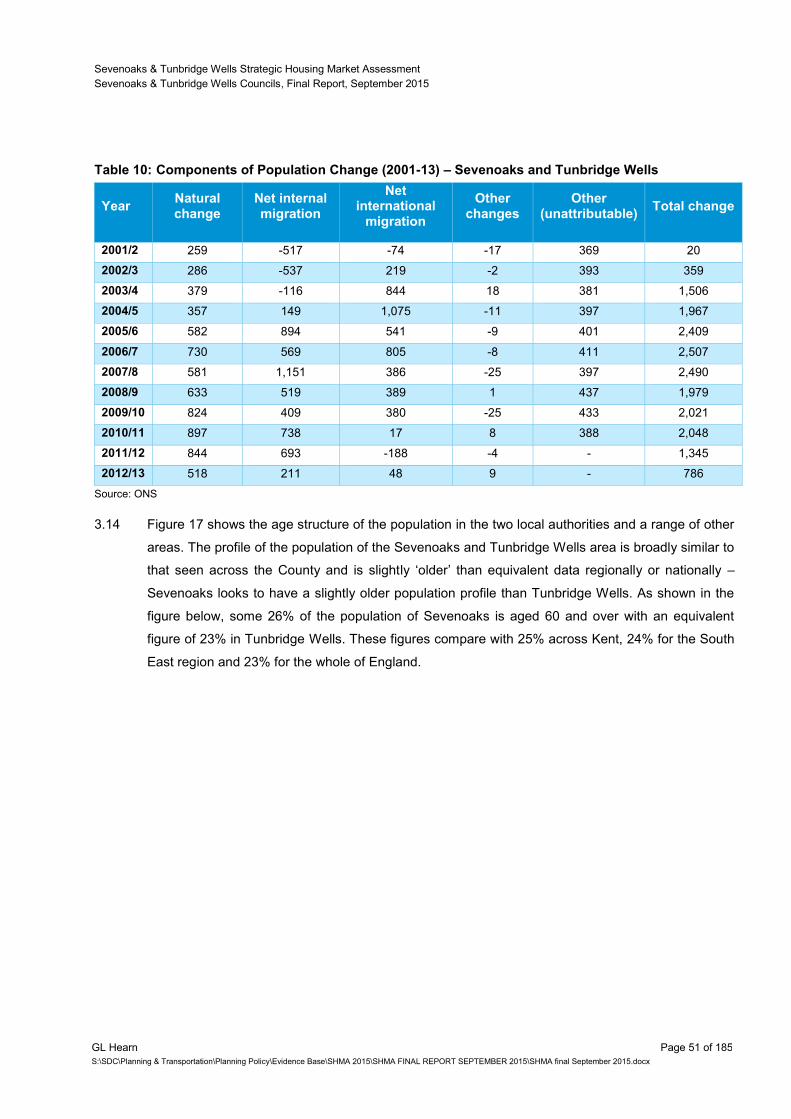
Sevenoaks & Tunbridge Wells Strategic Housing Market Assessment
Sevenoaks & Tunbridge Wells Councils, Final Report, September 2015
GL Hearn Page 51 of 185
S:\SDC\Planning & Transportation\Planning Policy\Evidence Base\SHMA 2015\SHMA FINAL REPORT SEPTEMBER 2015\SHMA final September 2015.docx
Table 10: Components of Population Change (2001-13) – Sevenoaks and Tunbridge Wells
Year Natural change
Net internal migration
Net international
migration
Other changes
Other (unattributable)
Total change
2001/2 259 -517 -74 -17 369 20
2002/3 286 -537 219 -2 393 359
2003/4 379 -116 844 18 381 1,506
2004/5 357 149 1,075 -11 397 1,967
2005/6 582 894 541 -9 401 2,409
2006/7 730 569 805 -8 411 2,507
2007/8 581 1,151 386 -25 397 2,490
2008/9 633 519 389 1 437 1,979
2009/10 824 409 380 -25 433 2,021
2010/11 897 738 17 8 388 2,048
2011/12 844 693 -188 -4 - 1,345
2012/13 518 211 48 9 - 786
Source: ONS
3.14 Figure 17 shows the age structure of the population in the two local authorities and a range of other
areas. The profile of the population of the Sevenoaks and Tunbridge Wells area is broadly similar to
that seen across the County and is slightly ‘older’ than equivalent data regionally or nationally –
Sevenoaks looks to have a slightly older population profile than Tunbridge Wells. As shown in the
figure below, some 26% of the population of Sevenoaks is aged 60 and over with an equivalent
figure of 23% in Tunbridge Wells. These figures compare with 25% across Kent, 24% for the South
East region and 23% for the whole of England.
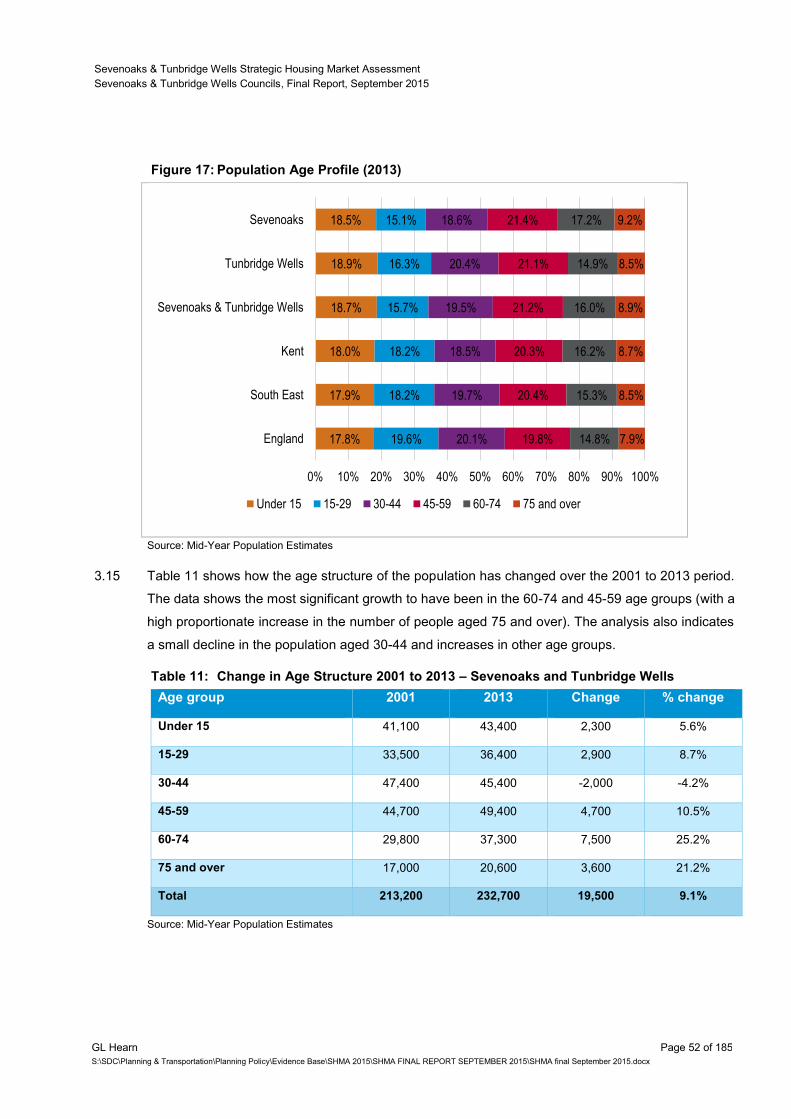
Sevenoaks & Tunbridge Wells Strategic Housing Market Assessment
Sevenoaks & Tunbridge Wells Councils, Final Report, September 2015
GL Hearn Page 52 of 185
S:\SDC\Planning & Transportation\Planning Policy\Evidence Base\SHMA 2015\SHMA FINAL REPORT SEPTEMBER 2015\SHMA final September 2015.docx
Figure 17: Population Age Profile (2013)
Source: Mid-Year Population Estimates
3.15 Table 11 shows how the age structure of the population has changed over the 2001 to 2013 period.
The data shows the most significant growth to have been in the 60-74 and 45-59 age groups (with a
high proportionate increase in the number of people aged 75 and over). The analysis also indicates
a small decline in the population aged 30-44 and increases in other age groups.
Table 11: Change in Age Structure 2001 to 2013 – Sevenoaks and Tunbridge Wells
Age group 2001 2013 Change % change
Under 15 41,100 43,400 2,300 5.6%
15-29 33,500 36,400 2,900 8.7%
30-44 47,400 45,400 -2,000 -4.2%
45-59 44,700 49,400 4,700 10.5%
60-74 29,800 37,300 7,500 25.2%
75 and over 17,000 20,600 3,600 21.2%
Total 213,200 232,700 19,500 9.1%
Source: Mid-Year Population Estimates
17.8%
17.9%
18.0%
18.7%
18.9%
18.5%
19.6%
18.2%
18.2%
15.7%
16.3%
15.1%
20.1%
19.7%
18.5%
19.5%
20.4%
18.6%
19.8%
20.4%
20.3%
21.2%
21.1%
21.4%
14.8%
15.3%
16.2%
16.0%
14.9%
17.2%
7.9%
8.5%
8.7%
8.9%
8.5%
9.2%
0% 10% 20% 30% 40% 50% 60% 70% 80% 90% 100%
England
South East
Kent
Sevenoaks & Tunbridge Wells
Tunbridge Wells
Sevenoaks
Under 15 15-29 30-44 45-59 60-74 75 and over
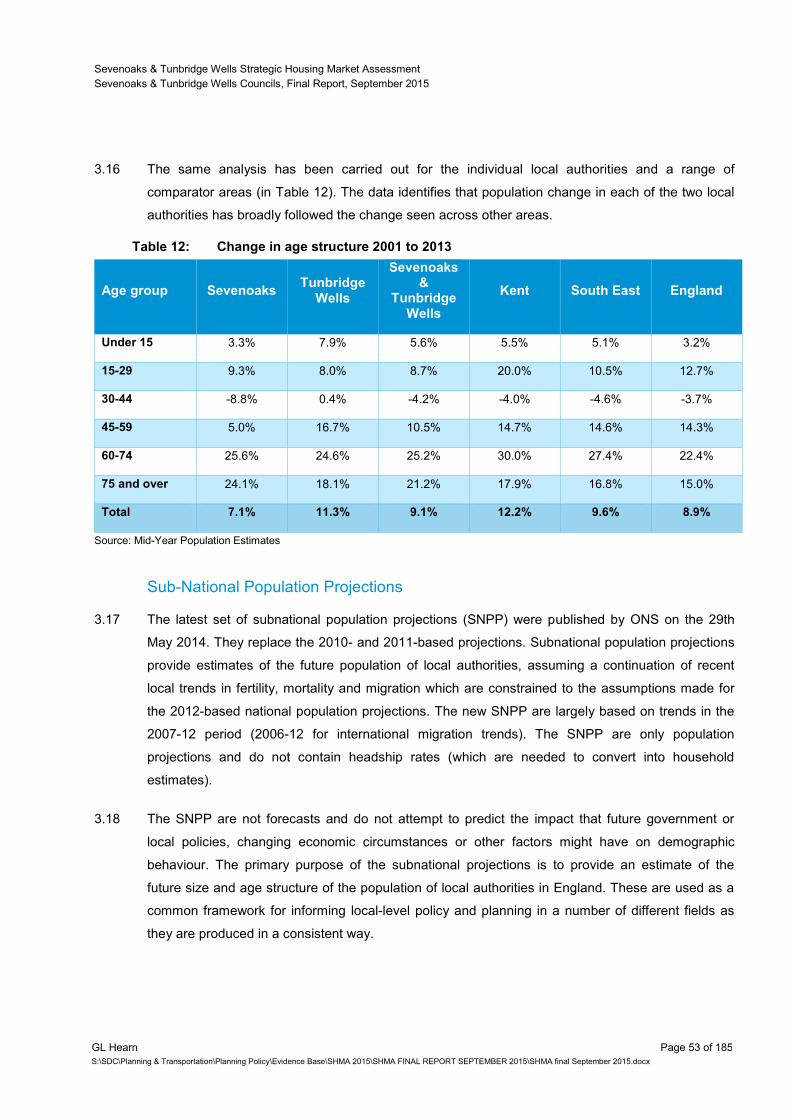
Sevenoaks & Tunbridge Wells Strategic Housing Market Assessment
Sevenoaks & Tunbridge Wells Councils, Final Report, September 2015
GL Hearn Page 53 of 185
S:\SDC\Planning & Transportation\Planning Policy\Evidence Base\SHMA 2015\SHMA FINAL REPORT SEPTEMBER 2015\SHMA final September 2015.docx
3.16 The same analysis has been carried out for the individual local authorities and a range of
comparator areas (in Table 12). The data identifies that population change in each of the two local
authorities has broadly followed the change seen across other areas.
Table 12: Change in age structure 2001 to 2013
Age group Sevenoaks Tunbridge
Wells
Sevenoaks &
Tunbridge Wells
Kent South East England
Under 15 3.3% 7.9% 5.6% 5.5% 5.1% 3.2%
15-29 9.3% 8.0% 8.7% 20.0% 10.5% 12.7%
30-44 -8.8% 0.4% -4.2% -4.0% -4.6% -3.7%
45-59 5.0% 16.7% 10.5% 14.7% 14.6% 14.3%
60-74 25.6% 24.6% 25.2% 30.0% 27.4% 22.4%
75 and over 24.1% 18.1% 21.2% 17.9% 16.8% 15.0%
Total 7.1% 11.3% 9.1% 12.2% 9.6% 8.9%
Source: Mid-Year Population Estimates
Sub-National Population Projections
3.17 The latest set of subnational population projections (SNPP) were published by ONS on the 29th
May 2014. They replace the 2010- and 2011-based projections. Subnational population projections
provide estimates of the future population of local authorities, assuming a continuation of recent
local trends in fertility, mortality and migration which are constrained to the assumptions made for
the 2012-based national population projections. The new SNPP are largely based on trends in the
2007-12 period (2006-12 for international migration trends). The SNPP are only population
projections and do not contain headship rates (which are needed to convert into household
estimates).
3.18 The SNPP are not forecasts and do not attempt to predict the impact that future government or
local policies, changing economic circumstances or other factors might have on demographic
behaviour. The primary purpose of the subnational projections is to provide an estimate of the
future size and age structure of the population of local authorities in England. These are used as a
common framework for informing local-level policy and planning in a number of different fields as
they are produced in a consistent way.
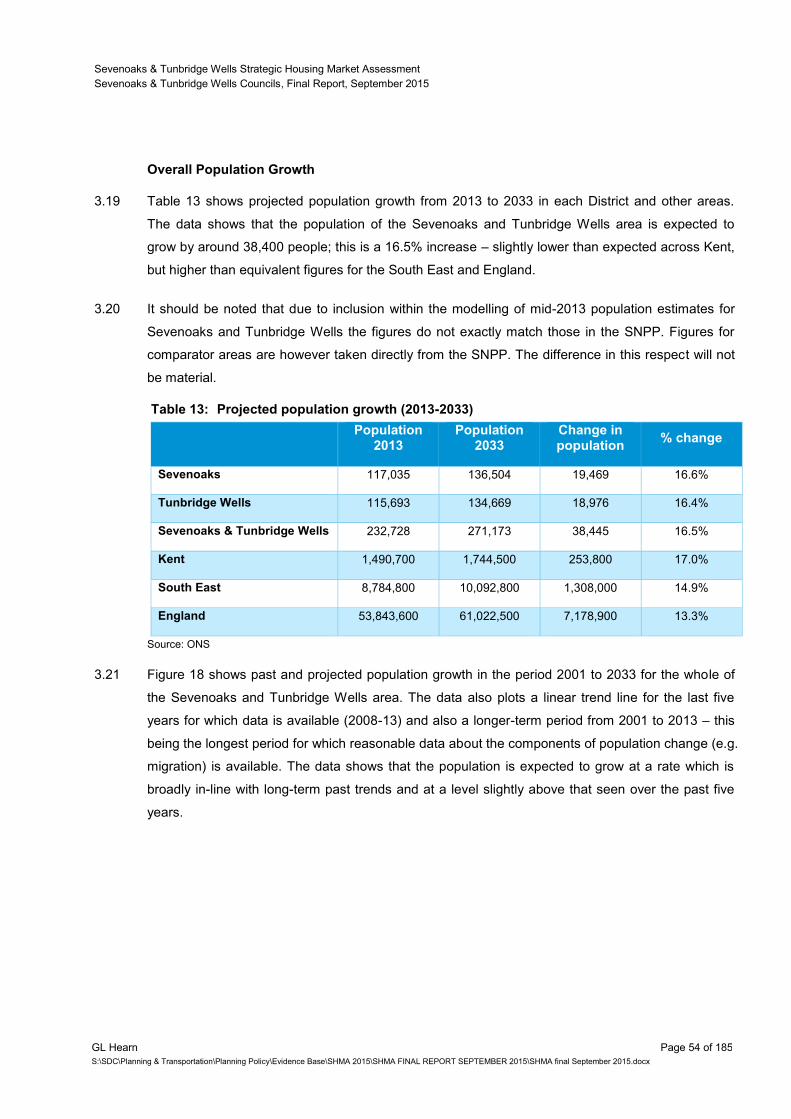
Sevenoaks & Tunbridge Wells Strategic Housing Market Assessment
Sevenoaks & Tunbridge Wells Councils, Final Report, September 2015
GL Hearn Page 54 of 185
S:\SDC\Planning & Transportation\Planning Policy\Evidence Base\SHMA 2015\SHMA FINAL REPORT SEPTEMBER 2015\SHMA final September 2015.docx
Overall Population Growth
3.19 Table 13 shows projected population growth from 2013 to 2033 in each District and other areas.
The data shows that the population of the Sevenoaks and Tunbridge Wells area is expected to
grow by around 38,400 people; this is a 16.5% increase – slightly lower than expected across Kent,
but higher than equivalent figures for the South East and England.
3.20 It should be noted that due to inclusion within the modelling of mid-2013 population estimates for
Sevenoaks and Tunbridge Wells the figures do not exactly match those in the SNPP. Figures for
comparator areas are however taken directly from the SNPP. The difference in this respect will not
be material.
Table 13: Projected population growth (2013-2033)
Population
2013 Population
2033 Change in population
% change
Sevenoaks 117,035 136,504 19,469 16.6%
Tunbridge Wells 115,693 134,669 18,976 16.4%
Sevenoaks & Tunbridge Wells 232,728 271,173 38,445 16.5%
Kent 1,490,700 1,744,500 253,800 17.0%
South East 8,784,800 10,092,800 1,308,000 14.9%
England 53,843,600 61,022,500 7,178,900 13.3%
Source: ONS
3.21 Figure 18 shows past and projected population growth in the period 2001 to 2033 for the whole of
the Sevenoaks and Tunbridge Wells area. The data also plots a linear trend line for the last five
years for which data is available (2008-13) and also a longer-term period from 2001 to 2013 – this
being the longest period for which reasonable data about the components of population change (e.g.
migration) is available. The data shows that the population is expected to grow at a rate which is
broadly in-line with long-term past trends and at a level slightly above that seen over the past five
years.
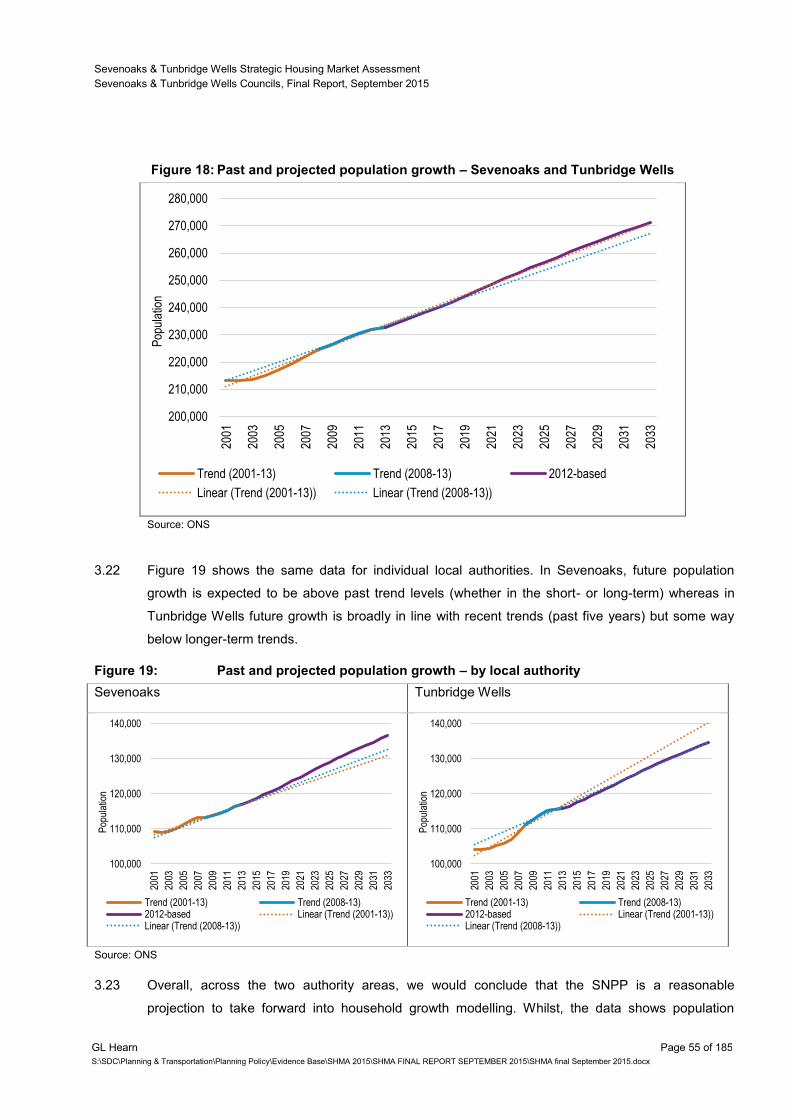
Sevenoaks & Tunbridge Wells Strategic Housing Market Assessment
Sevenoaks & Tunbridge Wells Councils, Final Report, September 2015
GL Hearn Page 55 of 185
S:\SDC\Planning & Transportation\Planning Policy\Evidence Base\SHMA 2015\SHMA FINAL REPORT SEPTEMBER 2015\SHMA final September 2015.docx
Figure 18: Past and projected population growth – Sevenoaks and Tunbridge Wells
Source: ONS
3.22 Figure 19 shows the same data for individual local authorities. In Sevenoaks, future population
growth is expected to be above past trend levels (whether in the short- or long-term) whereas in
Tunbridge Wells future growth is broadly in line with recent trends (past five years) but some way
below longer-term trends.
Figure 19: Past and projected population growth – by local authority
Sevenoaks Tunbridge Wells
Source: ONS
3.23 Overall, across the two authority areas, we would conclude that the SNPP is a reasonable
projection to take forward into household growth modelling. Whilst, the data shows population
200,000
210,000
220,000
230,000
240,000
250,000
260,000
270,000
280,000
2001
2003
2005
2007
2009
2011
2013
2015
2017
2019
2021
2023
2025
2027
2029
2031
2033
Pop
ulat
ion
Trend (2001-13) Trend (2008-13) 2012-based
Linear (Trend (2001-13)) Linear (Trend (2008-13))
100,000
110,000
120,000
130,000
140,000
2001
2003
2005
2007
2009
2011
2013
2015
2017
2019
2021
2023
2025
2027
2029
2031
2033
Pop
ulat
ion
Trend (2001-13) Trend (2008-13)2012-based Linear (Trend (2001-13))Linear (Trend (2008-13))
100,000
110,000
120,000
130,000
140,000
2001
2003
2005
2007
2009
2011
2013
2015
2017
2019
2021
2023
2025
2027
2029
2031
2033
Pop
ulat
ion
Trend (2001-13) Trend (2008-13)2012-based Linear (Trend (2001-13))Linear (Trend (2008-13))
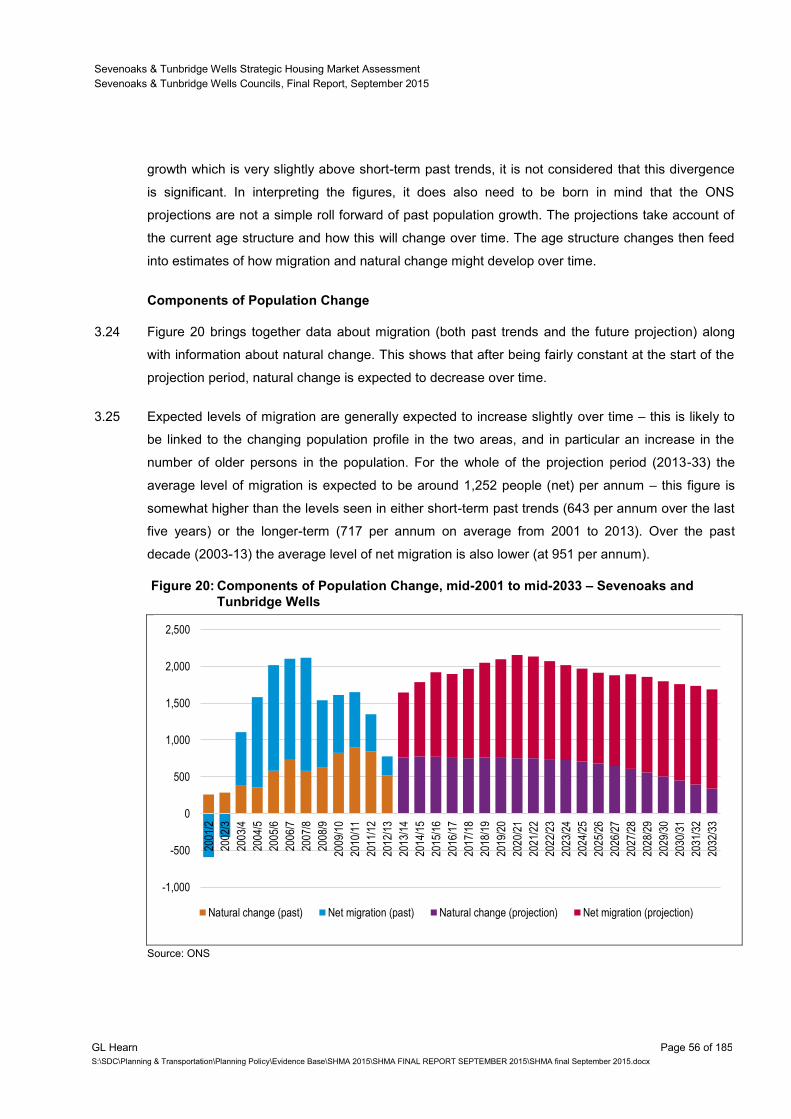
Sevenoaks & Tunbridge Wells Strategic Housing Market Assessment
Sevenoaks & Tunbridge Wells Councils, Final Report, September 2015
GL Hearn Page 56 of 185
S:\SDC\Planning & Transportation\Planning Policy\Evidence Base\SHMA 2015\SHMA FINAL REPORT SEPTEMBER 2015\SHMA final September 2015.docx
growth which is very slightly above short-term past trends, it is not considered that this divergence
is significant. In interpreting the figures, it does also need to be born in mind that the ONS
projections are not a simple roll forward of past population growth. The projections take account of
the current age structure and how this will change over time. The age structure changes then feed
into estimates of how migration and natural change might develop over time.
Components of Population Change
3.24 Figure 20 brings together data about migration (both past trends and the future projection) along
with information about natural change. This shows that after being fairly constant at the start of the
projection period, natural change is expected to decrease over time.
3.25 Expected levels of migration are generally expected to increase slightly over time – this is likely to
be linked to the changing population profile in the two areas, and in particular an increase in the
number of older persons in the population. For the whole of the projection period (2013-33) the
average level of migration is expected to be around 1,252 people (net) per annum – this figure is
somewhat higher than the levels seen in either short-term past trends (643 per annum over the last
five years) or the longer-term (717 per annum on average from 2001 to 2013). Over the past
decade (2003-13) the average level of net migration is also lower (at 951 per annum).
Figure 20: Components of Population Change, mid-2001 to mid-2033 – Sevenoaks and
Tunbridge Wells
Source: ONS
-1,000
-500
0
500
1,000
1,500
2,000
2,500
2001
/2
2002
/3
2003
/4
2004
/5
2005
/6
2006
/7
2007
/8
2008
/9
2009
/10
2010
/11
2011
/12
2012
/13
2013
/14
2014
/15
2015
/16
2016
/17
2017
/18
2018
/19
2019
/20
2020
/21
2021
/22
2022
/23
2023
/24
2024
/25
2025
/26
2026
/27
2027
/28
2028
/29
2029
/30
2030
/31
2031
/32
2032
/33
Natural change (past) Net migration (past) Natural change (projection) Net migration (projection)
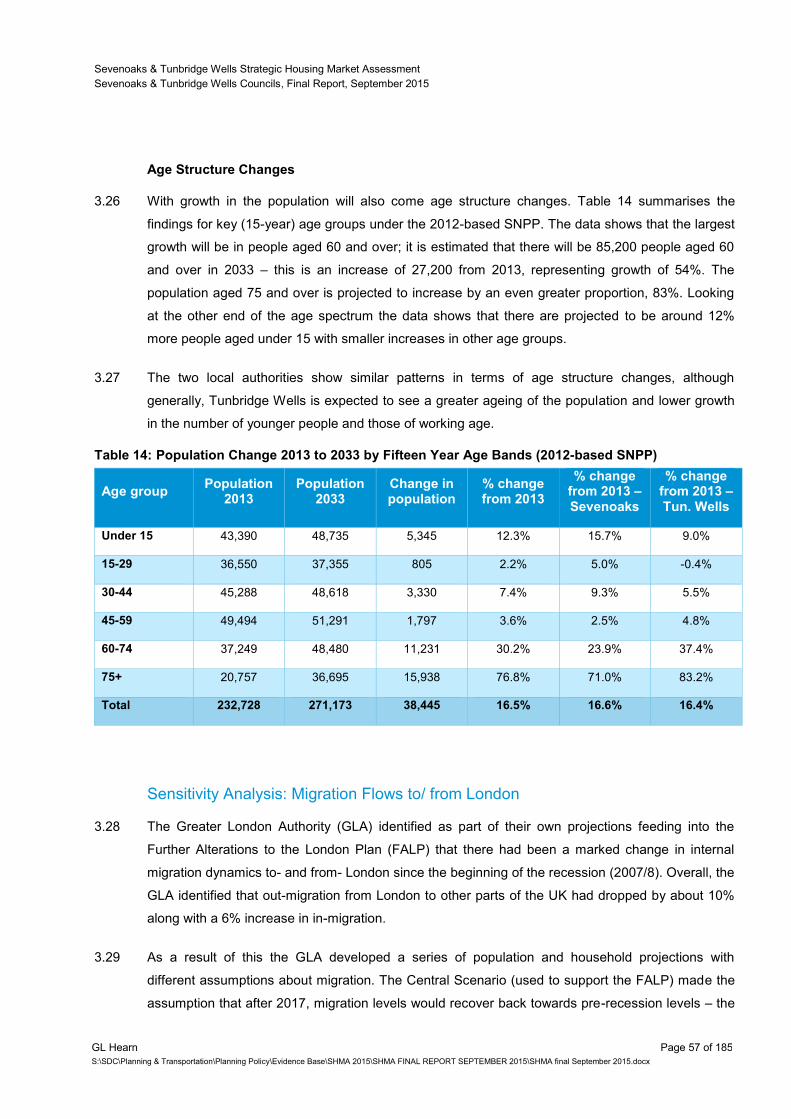
Sevenoaks & Tunbridge Wells Strategic Housing Market Assessment
Sevenoaks & Tunbridge Wells Councils, Final Report, September 2015
GL Hearn Page 57 of 185
S:\SDC\Planning & Transportation\Planning Policy\Evidence Base\SHMA 2015\SHMA FINAL REPORT SEPTEMBER 2015\SHMA final September 2015.docx
Age Structure Changes
3.26 With growth in the population will also come age structure changes. Table 14 summarises the
findings for key (15-year) age groups under the 2012-based SNPP. The data shows that the largest
growth will be in people aged 60 and over; it is estimated that there will be 85,200 people aged 60
and over in 2033 – this is an increase of 27,200 from 2013, representing growth of 54%. The
population aged 75 and over is projected to increase by an even greater proportion, 83%. Looking
at the other end of the age spectrum the data shows that there are projected to be around 12%
more people aged under 15 with smaller increases in other age groups.
3.27 The two local authorities show similar patterns in terms of age structure changes, although
generally, Tunbridge Wells is expected to see a greater ageing of the population and lower growth
in the number of younger people and those of working age.
Table 14: Population Change 2013 to 2033 by Fifteen Year Age Bands (2012-based SNPP)
Age group Population
2013 Population
2033 Change in population
% change from 2013
% change from 2013 – Sevenoaks
% change from 2013 – Tun. Wells
Under 15 43,390 48,735 5,345 12.3% 15.7% 9.0%
15-29 36,550 37,355 805 2.2% 5.0% -0.4%
30-44 45,288 48,618 3,330 7.4% 9.3% 5.5%
45-59 49,494 51,291 1,797 3.6% 2.5% 4.8%
60-74 37,249 48,480 11,231 30.2% 23.9% 37.4%
75+ 20,757 36,695 15,938 76.8% 71.0% 83.2%
Total 232,728 271,173 38,445 16.5% 16.6% 16.4%
Sensitivity Analysis: Migration Flows to/ from London
3.28 The Greater London Authority (GLA) identified as part of their own projections feeding into the
Further Alterations to the London Plan (FALP) that there had been a marked change in internal
migration dynamics to- and from- London since the beginning of the recession (2007/8). Overall, the
GLA identified that out-migration from London to other parts of the UK had dropped by about 10%
along with a 6% increase in in-migration.
3.29 As a result of this the GLA developed a series of population and household projections with
different assumptions about migration. The Central Scenario (used to support the FALP) made the
assumption that after 2017, migration levels would recover back towards pre-recession levels – the
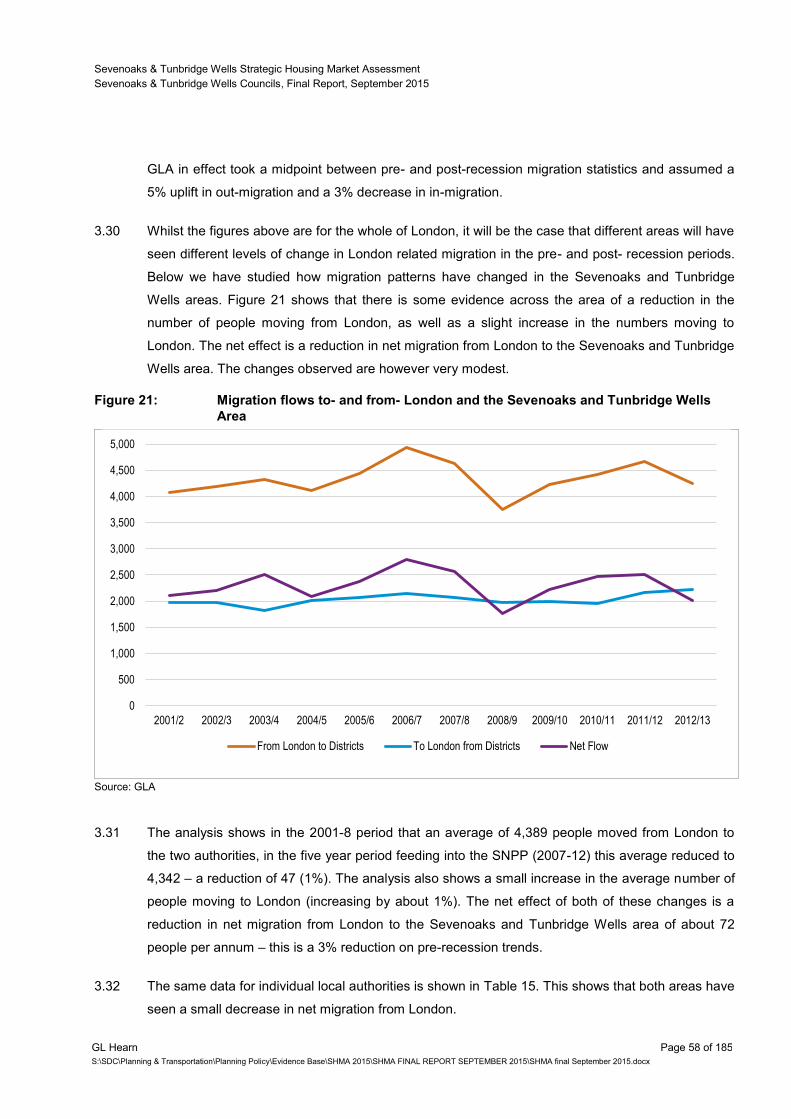
Sevenoaks & Tunbridge Wells Strategic Housing Market Assessment
Sevenoaks & Tunbridge Wells Councils, Final Report, September 2015
GL Hearn Page 58 of 185
S:\SDC\Planning & Transportation\Planning Policy\Evidence Base\SHMA 2015\SHMA FINAL REPORT SEPTEMBER 2015\SHMA final September 2015.docx
GLA in effect took a midpoint between pre- and post-recession migration statistics and assumed a
5% uplift in out-migration and a 3% decrease in in-migration.
3.30 Whilst the figures above are for the whole of London, it will be the case that different areas will have
seen different levels of change in London related migration in the pre- and post- recession periods.
Below we have studied how migration patterns have changed in the Sevenoaks and Tunbridge
Wells areas. Figure 21 shows that there is some evidence across the area of a reduction in the
number of people moving from London, as well as a slight increase in the numbers moving to
London. The net effect is a reduction in net migration from London to the Sevenoaks and Tunbridge
Wells area. The changes observed are however very modest.
Figure 21: Migration flows to- and from- London and the Sevenoaks and Tunbridge Wells
Area
Source: GLA
3.31 The analysis shows in the 2001-8 period that an average of 4,389 people moved from London to
the two authorities, in the five year period feeding into the SNPP (2007-12) this average reduced to
4,342 – a reduction of 47 (1%). The analysis also shows a small increase in the average number of
people moving to London (increasing by about 1%). The net effect of both of these changes is a
reduction in net migration from London to the Sevenoaks and Tunbridge Wells area of about 72
people per annum – this is a 3% reduction on pre-recession trends.
3.32 The same data for individual local authorities is shown in Table 15. This shows that both areas have
seen a small decrease in net migration from London.
0
500
1,000
1,500
2,000
2,500
3,000
3,500
4,000
4,500
5,000
2001/2 2002/3 2003/4 2004/5 2005/6 2006/7 2007/8 2008/9 2009/10 2010/11 2011/12 2012/13
From London to Districts To London from Districts Net Flow

Sevenoaks & Tunbridge Wells Strategic Housing Market Assessment
Sevenoaks & Tunbridge Wells Councils, Final Report, September 2015
GL Hearn Page 59 of 185
S:\SDC\Planning & Transportation\Planning Policy\Evidence Base\SHMA 2015\SHMA FINAL REPORT SEPTEMBER 2015\SHMA final September 2015.docx
Table 15: Migration to- and from- London and the Sevenoaks and Tunbridge Wells areas –
individual local authority analysis
Sevenoaks Tunbridge Wells
From
London to
district
To London
from district
Net flow From
London to
district
To London
from district
Net flow
2001/2 2,730 1,270 1,460 1,350 700 650
2002/3 2,870 1,280 1,590 1,310 690 620
2003/4 2,780 1,180 1,600 1,550 650 900
2004/5 2,770 1,230 1,540 1,340 790 550
2005/6 2,930 1,260 1,670 1,510 800 710
2006/7 3,160 1,380 1,780 1,780 760 1,020
2007/8 2,940 1,260 1,680 1,700 810 890
2008/9 2,460 1,190 1,270 1,290 790 500
2009/10 2,750 1,200 1,550 1,480 800 680
2010/11 2,822 1,120 1,703 1,600 831 769
2011/12 2,912 1,263 1,649 1,756 905 851
2012/13 2,784 1,346 1,438 1,455 883 572
Pre-2008 average 2,883 1,266 1,617 1,506 743 763
SNPP average 2,777 1,207 1,570 1,565 827 738
Difference 106 59 47 -60 -84 25
Source: GLA
3.33 On the basis of the information above, we have developed an alternative population projection to
provide a sensitivity analysis to the SNPP. This projection uses a similar assumption to the GLA
modelling; i.e. for an adjustment to be made to migration levels post-2017 at a level which is half of
the difference seen between pre-recession trends and the trends feeding into the SNPP.
3.34 Table 16 shows overall population growth from this alternative projection. For the whole Sevenoaks
and Tunbridge Wells area this projection suggests population growth of 16.8% in the 2013-33
period; this compares with growth of 16.5% in the SNPP. The overall level of population growth is
39,108, which is about 663 more than the SNPP (38,445) – the projection with a London adjustment
is therefore about 2% higher than the SNPP.
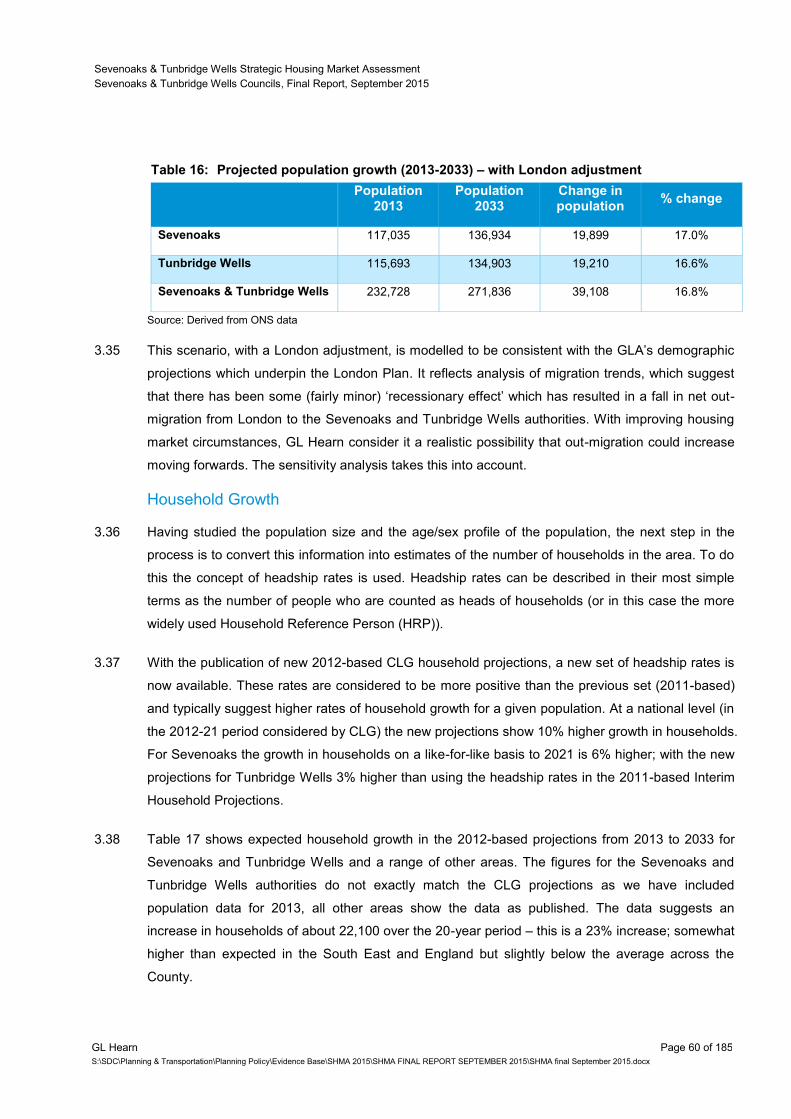
Sevenoaks & Tunbridge Wells Strategic Housing Market Assessment
Sevenoaks & Tunbridge Wells Councils, Final Report, September 2015
GL Hearn Page 60 of 185
S:\SDC\Planning & Transportation\Planning Policy\Evidence Base\SHMA 2015\SHMA FINAL REPORT SEPTEMBER 2015\SHMA final September 2015.docx
Table 16: Projected population growth (2013-2033) – with London adjustment
Population
2013 Population
2033 Change in population
% change
Sevenoaks 117,035 136,934 19,899 17.0%
Tunbridge Wells 115,693 134,903 19,210 16.6%
Sevenoaks & Tunbridge Wells 232,728 271,836 39,108 16.8%
Source: Derived from ONS data
3.35 This scenario, with a London adjustment, is modelled to be consistent with the GLA’s demographic
projections which underpin the London Plan. It reflects analysis of migration trends, which suggest
that there has been some (fairly minor) ‘recessionary effect’ which has resulted in a fall in net out-
migration from London to the Sevenoaks and Tunbridge Wells authorities. With improving housing
market circumstances, GL Hearn consider it a realistic possibility that out-migration could increase
moving forwards. The sensitivity analysis takes this into account.
Household Growth
3.36 Having studied the population size and the age/sex profile of the population, the next step in the
process is to convert this information into estimates of the number of households in the area. To do
this the concept of headship rates is used. Headship rates can be described in their most simple
terms as the number of people who are counted as heads of households (or in this case the more
widely used Household Reference Person (HRP)).
3.37 With the publication of new 2012-based CLG household projections, a new set of headship rates is
now available. These rates are considered to be more positive than the previous set (2011-based)
and typically suggest higher rates of household growth for a given population. At a national level (in
the 2012-21 period considered by CLG) the new projections show 10% higher growth in households.
For Sevenoaks the growth in households on a like-for-like basis to 2021 is 6% higher; with the new
projections for Tunbridge Wells 3% higher than using the headship rates in the 2011-based Interim
Household Projections.
3.38 Table 17 shows expected household growth in the 2012-based projections from 2013 to 2033 for
Sevenoaks and Tunbridge Wells and a range of other areas. The figures for the Sevenoaks and
Tunbridge Wells authorities do not exactly match the CLG projections as we have included
population data for 2013, all other areas show the data as published. The data suggests an
increase in households of about 22,100 over the 20-year period – this is a 23% increase; somewhat
higher than expected in the South East and England but slightly below the average across the
County.
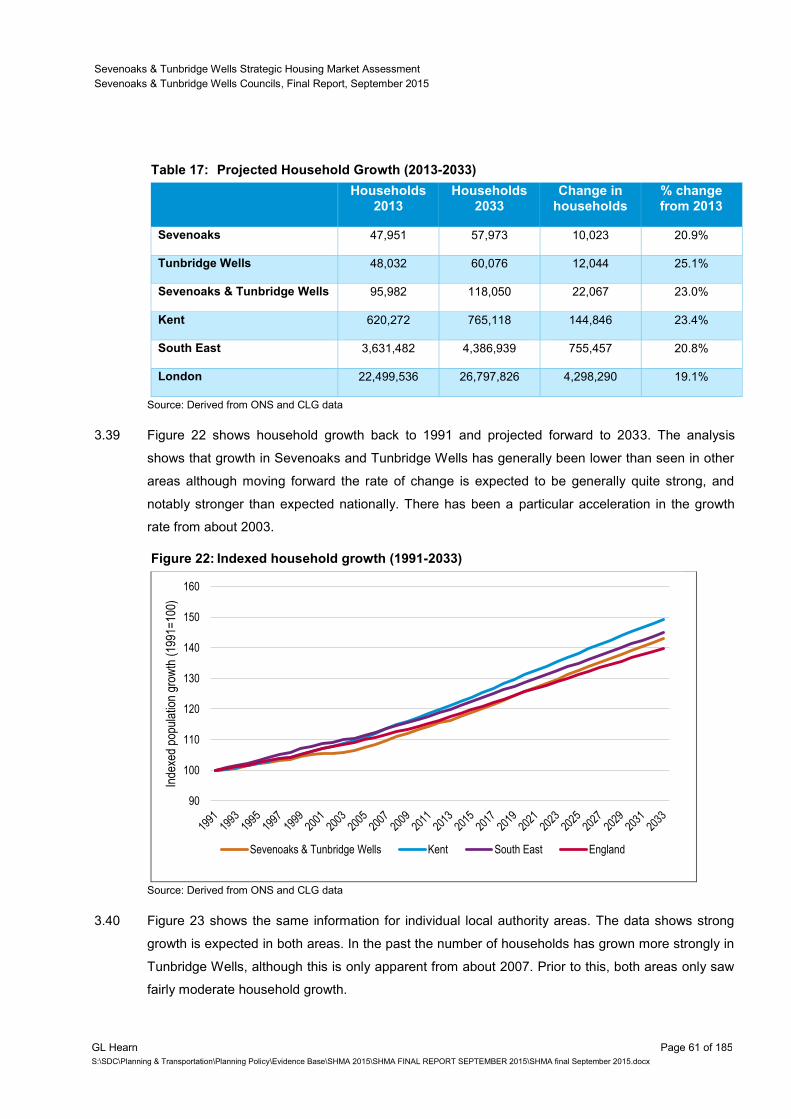
Sevenoaks & Tunbridge Wells Strategic Housing Market Assessment
Sevenoaks & Tunbridge Wells Councils, Final Report, September 2015
GL Hearn Page 61 of 185
S:\SDC\Planning & Transportation\Planning Policy\Evidence Base\SHMA 2015\SHMA FINAL REPORT SEPTEMBER 2015\SHMA final September 2015.docx
Table 17: Projected Household Growth (2013-2033)
Households
2013 Households
2033 Change in
households % change from 2013
Sevenoaks 47,951 57,973 10,023 20.9%
Tunbridge Wells 48,032 60,076 12,044 25.1%
Sevenoaks & Tunbridge Wells 95,982 118,050 22,067 23.0%
Kent 620,272 765,118 144,846 23.4%
South East 3,631,482 4,386,939 755,457 20.8%
London 22,499,536 26,797,826 4,298,290 19.1%
Source: Derived from ONS and CLG data
3.39 Figure 22 shows household growth back to 1991 and projected forward to 2033. The analysis
shows that growth in Sevenoaks and Tunbridge Wells has generally been lower than seen in other
areas although moving forward the rate of change is expected to be generally quite strong, and
notably stronger than expected nationally. There has been a particular acceleration in the growth
rate from about 2003.
Figure 22: Indexed household growth (1991-2033)
Source: Derived from ONS and CLG data
3.40 Figure 23 shows the same information for individual local authority areas. The data shows strong
growth is expected in both areas. In the past the number of households has grown more strongly in
Tunbridge Wells, although this is only apparent from about 2007. Prior to this, both areas only saw
fairly moderate household growth.
90
100
110
120
130
140
150
160
Inde
xed
popu
latio
n gr
owth
(19
91=
100)
Sevenoaks & Tunbridge Wells Kent South East England
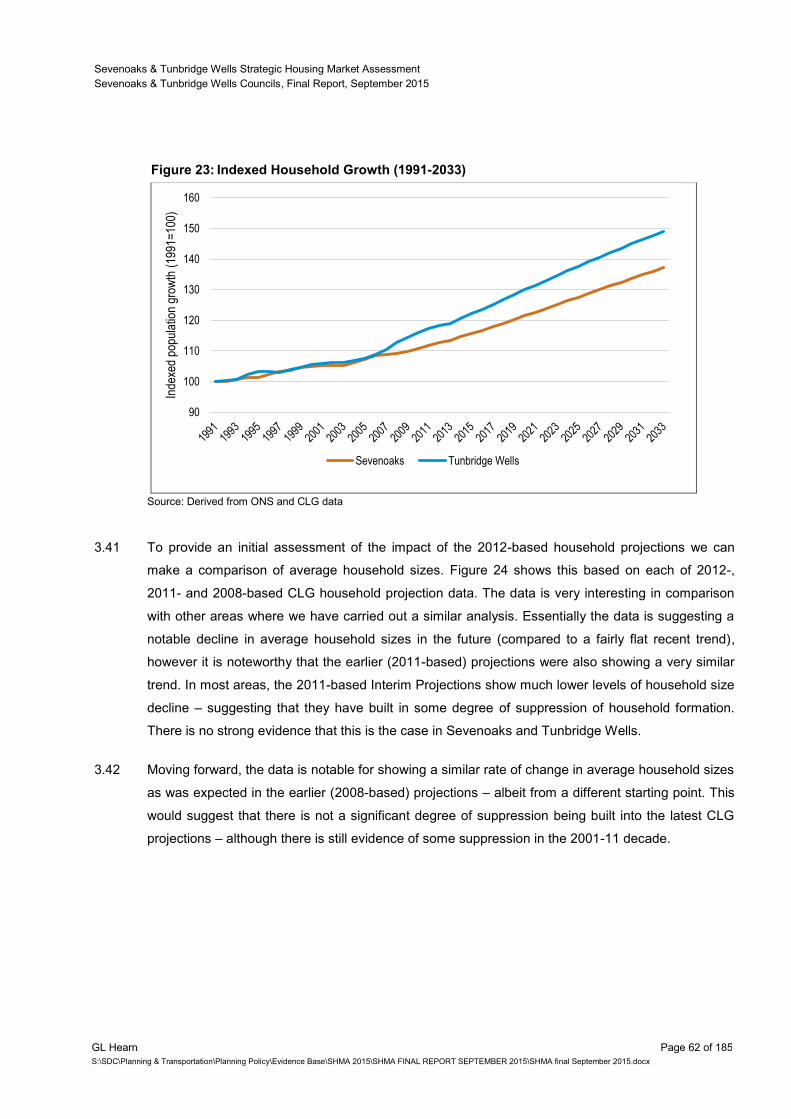
Sevenoaks & Tunbridge Wells Strategic Housing Market Assessment
Sevenoaks & Tunbridge Wells Councils, Final Report, September 2015
GL Hearn Page 62 of 185
S:\SDC\Planning & Transportation\Planning Policy\Evidence Base\SHMA 2015\SHMA FINAL REPORT SEPTEMBER 2015\SHMA final September 2015.docx
Figure 23: Indexed Household Growth (1991-2033)
Source: Derived from ONS and CLG data
3.41 To provide an initial assessment of the impact of the 2012-based household projections we can
make a comparison of average household sizes. Figure 24 shows this based on each of 2012-,
2011- and 2008-based CLG household projection data. The data is very interesting in comparison
with other areas where we have carried out a similar analysis. Essentially the data is suggesting a
notable decline in average household sizes in the future (compared to a fairly flat recent trend),
however it is noteworthy that the earlier (2011-based) projections were also showing a very similar
trend. In most areas, the 2011-based Interim Projections show much lower levels of household size
decline – suggesting that they have built in some degree of suppression of household formation.
There is no strong evidence that this is the case in Sevenoaks and Tunbridge Wells.
3.42 Moving forward, the data is notable for showing a similar rate of change in average household sizes
as was expected in the earlier (2008-based) projections – albeit from a different starting point. This
would suggest that there is not a significant degree of suppression being built into the latest CLG
projections – although there is still evidence of some suppression in the 2001-11 decade.
90
100
110
120
130
140
150
160
Inde
xed
popu
latio
n gr
owth
(19
91=
100)
Sevenoaks Tunbridge Wells
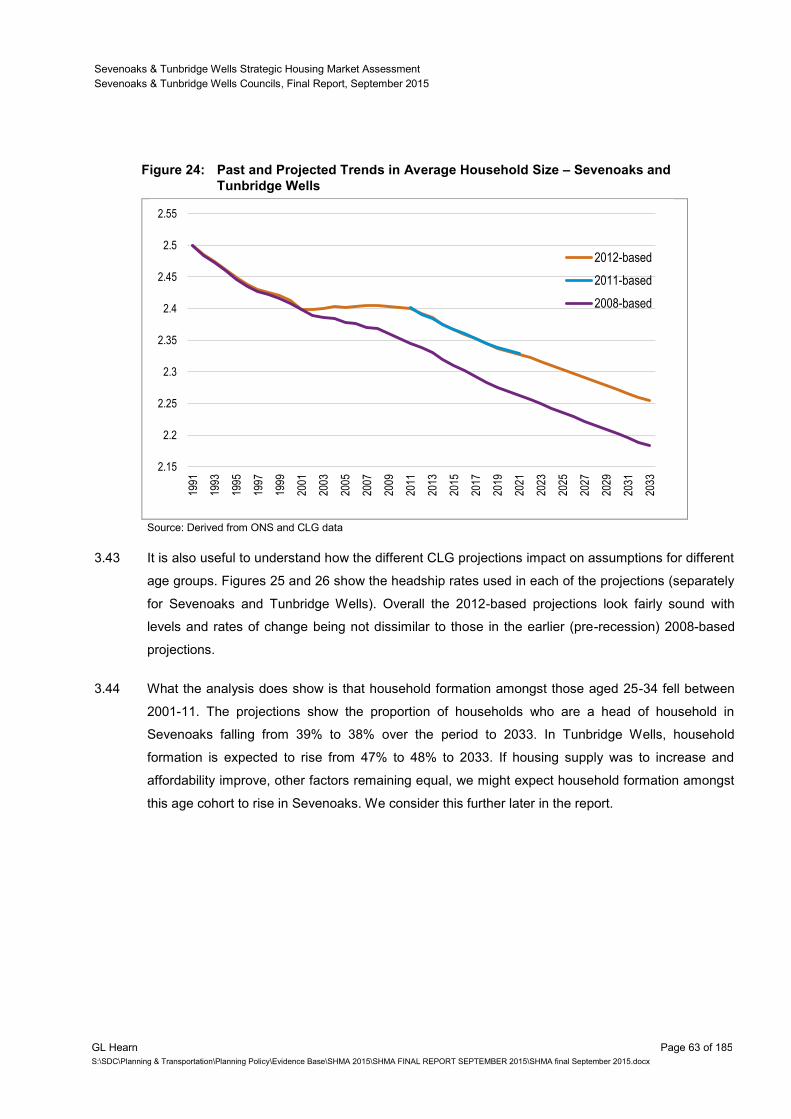
Sevenoaks & Tunbridge Wells Strategic Housing Market Assessment
Sevenoaks & Tunbridge Wells Councils, Final Report, September 2015
GL Hearn Page 63 of 185
S:\SDC\Planning & Transportation\Planning Policy\Evidence Base\SHMA 2015\SHMA FINAL REPORT SEPTEMBER 2015\SHMA final September 2015.docx
Figure 24: Past and Projected Trends in Average Household Size – Sevenoaks and
Tunbridge Wells
Source: Derived from ONS and CLG data
3.43 It is also useful to understand how the different CLG projections impact on assumptions for different
age groups. Figures 25 and 26 show the headship rates used in each of the projections (separately
for Sevenoaks and Tunbridge Wells). Overall the 2012-based projections look fairly sound with
levels and rates of change being not dissimilar to those in the earlier (pre-recession) 2008-based
projections.
3.44 What the analysis does show is that household formation amongst those aged 25-34 fell between
2001-11. The projections show the proportion of households who are a head of household in
Sevenoaks falling from 39% to 38% over the period to 2033. In Tunbridge Wells, household
formation is expected to rise from 47% to 48% to 2033. If housing supply was to increase and
affordability improve, other factors remaining equal, we might expect household formation amongst
this age cohort to rise in Sevenoaks. We consider this further later in the report.
2.15
2.2
2.25
2.3
2.35
2.4
2.45
2.5
2.55
1991
1993
1995
1997
1999
2001
2003
2005
2007
2009
2011
2013
2015
2017
2019
2021
2023
2025
2027
2029
2031
2033
2012-based
2011-based
2008-based
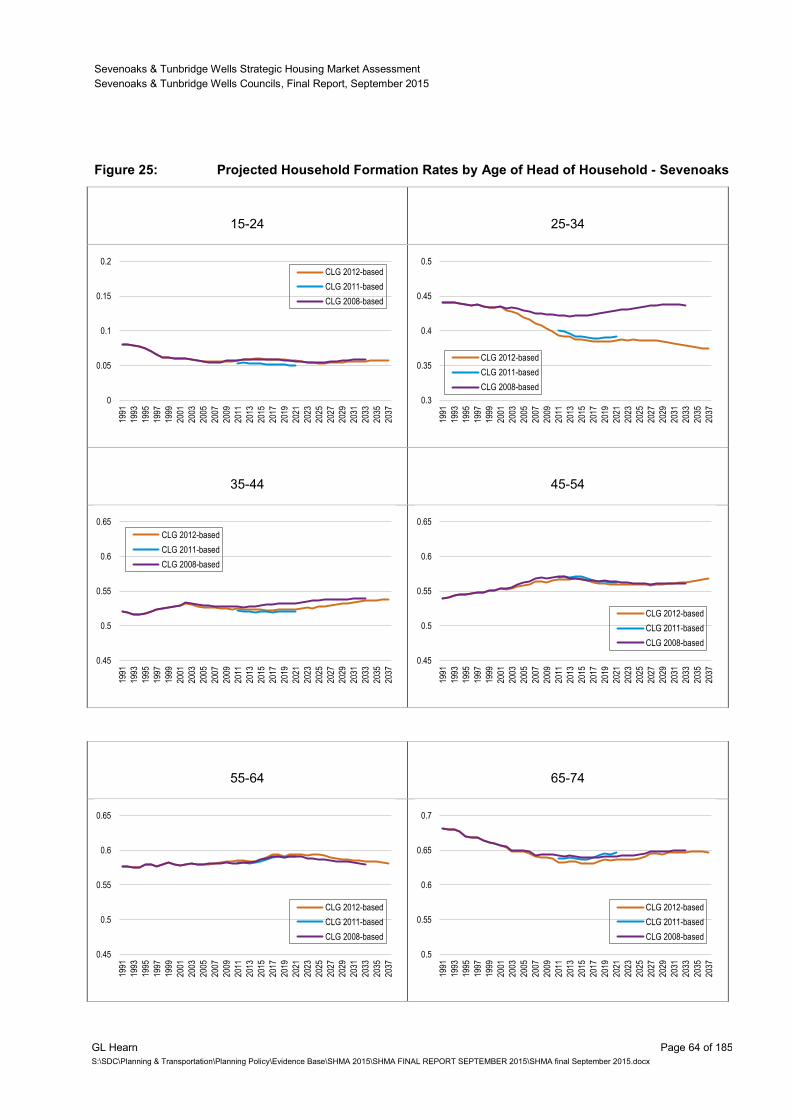
Sevenoaks & Tunbridge Wells Strategic Housing Market Assessment
Sevenoaks & Tunbridge Wells Councils, Final Report, September 2015
GL Hearn Page 64 of 185
S:\SDC\Planning & Transportation\Planning Policy\Evidence Base\SHMA 2015\SHMA FINAL REPORT SEPTEMBER 2015\SHMA final September 2015.docx
Figure 25: Projected Household Formation Rates by Age of Head of Household - Sevenoaks
15-24
25-34
35-44
45-54
55-64
65-74
0
0.05
0.1
0.15
0.2
1991
1993
1995
1997
1999
2001
2003
2005
2007
2009
2011
2013
2015
2017
2019
2021
2023
2025
2027
2029
2031
2033
2035
2037
CLG 2012-based
CLG 2011-based
CLG 2008-based
0.3
0.35
0.4
0.45
0.5
1991
1993
1995
1997
1999
2001
2003
2005
2007
2009
2011
2013
2015
2017
2019
2021
2023
2025
2027
2029
2031
2033
2035
2037
CLG 2012-based
CLG 2011-based
CLG 2008-based
0.45
0.5
0.55
0.6
0.65
1991
1993
1995
1997
1999
2001
2003
2005
2007
2009
2011
2013
2015
2017
2019
2021
2023
2025
2027
2029
2031
2033
2035
2037
CLG 2012-based
CLG 2011-based
CLG 2008-based
0.45
0.5
0.55
0.6
0.65
1991
1993
1995
1997
1999
2001
2003
2005
2007
2009
2011
2013
2015
2017
2019
2021
2023
2025
2027
2029
2031
2033
2035
2037
CLG 2012-based
CLG 2011-based
CLG 2008-based
0.45
0.5
0.55
0.6
0.65
1991
1993
1995
1997
1999
2001
2003
2005
2007
2009
2011
2013
2015
2017
2019
2021
2023
2025
2027
2029
2031
2033
2035
2037
CLG 2012-based
CLG 2011-based
CLG 2008-based
0.5
0.55
0.6
0.65
0.7
1991
1993
1995
1997
1999
2001
2003
2005
2007
2009
2011
2013
2015
2017
2019
2021
2023
2025
2027
2029
2031
2033
2035
2037
CLG 2012-based
CLG 2011-based
CLG 2008-based
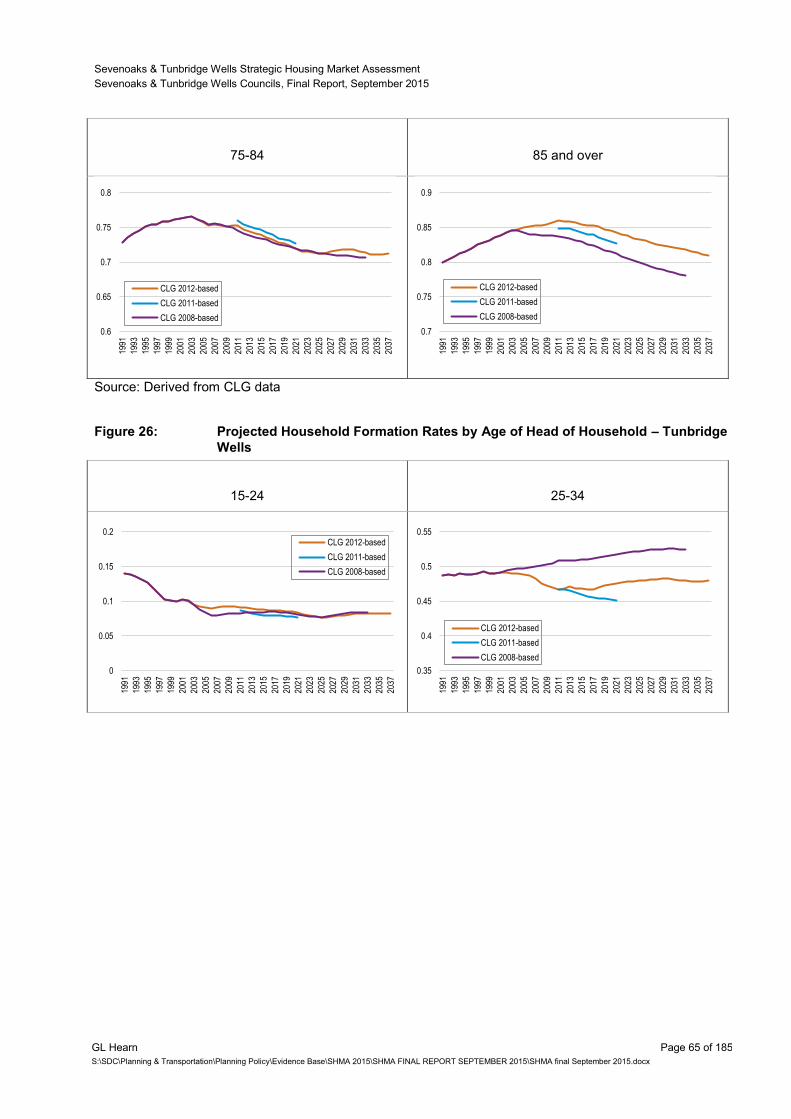
Sevenoaks & Tunbridge Wells Strategic Housing Market Assessment
Sevenoaks & Tunbridge Wells Councils, Final Report, September 2015
GL Hearn Page 65 of 185
S:\SDC\Planning & Transportation\Planning Policy\Evidence Base\SHMA 2015\SHMA FINAL REPORT SEPTEMBER 2015\SHMA final September 2015.docx
Source: Derived from CLG data
Figure 26: Projected Household Formation Rates by Age of Head of Household – Tunbridge
Wells
15-24
25-34
0
0.05
0.1
0.15
0.2
1991
1993
1995
1997
1999
2001
2003
2005
2007
2009
2011
2013
2015
2017
2019
2021
2023
2025
2027
2029
2031
2033
2035
2037
CLG 2012-based
CLG 2011-based
CLG 2008-based
0.35
0.4
0.45
0.5
0.55
1991
1993
1995
1997
1999
2001
2003
2005
2007
2009
2011
2013
2015
2017
2019
2021
2023
2025
2027
2029
2031
2033
2035
2037
CLG 2012-based
CLG 2011-based
CLG 2008-based
75-84
85 and over
0.6
0.65
0.7
0.75
0.8
1991
1993
1995
1997
1999
2001
2003
2005
2007
2009
2011
2013
2015
2017
2019
2021
2023
2025
2027
2029
2031
2033
2035
2037
CLG 2012-based
CLG 2011-based
CLG 2008-based
0.7
0.75
0.8
0.85
0.9
1991
1993
1995
1997
1999
2001
2003
2005
2007
2009
2011
2013
2015
2017
2019
2021
2023
2025
2027
2029
2031
2033
2035
2037
CLG 2012-based
CLG 2011-based
CLG 2008-based
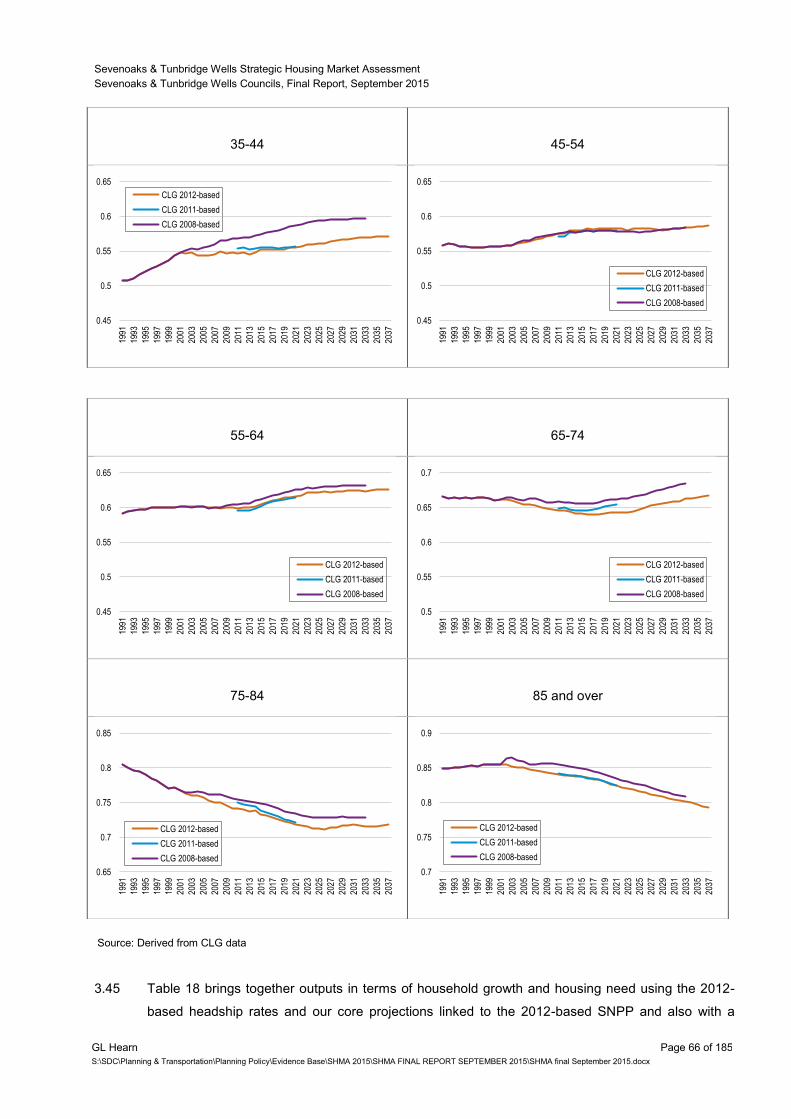
Sevenoaks & Tunbridge Wells Strategic Housing Market Assessment
Sevenoaks & Tunbridge Wells Councils, Final Report, September 2015
GL Hearn Page 66 of 185
S:\SDC\Planning & Transportation\Planning Policy\Evidence Base\SHMA 2015\SHMA FINAL REPORT SEPTEMBER 2015\SHMA final September 2015.docx
Source: Derived from CLG data
3.45 Table 18 brings together outputs in terms of household growth and housing need using the 2012-
based headship rates and our core projections linked to the 2012-based SNPP and also with a
35-44
45-54
55-64
65-74
75-84
85 and over
0.45
0.5
0.55
0.6
0.65
1991
1993
1995
1997
1999
2001
2003
2005
2007
2009
2011
2013
2015
2017
2019
2021
2023
2025
2027
2029
2031
2033
2035
2037
CLG 2012-based
CLG 2011-based
CLG 2008-based
0.45
0.5
0.55
0.6
0.65
1991
1993
1995
1997
1999
2001
2003
2005
2007
2009
2011
2013
2015
2017
2019
2021
2023
2025
2027
2029
2031
2033
2035
2037
CLG 2012-based
CLG 2011-based
CLG 2008-based
0.45
0.5
0.55
0.6
0.65
1991
1993
1995
1997
1999
2001
2003
2005
2007
2009
2011
2013
2015
2017
2019
2021
2023
2025
2027
2029
2031
2033
2035
2037
CLG 2012-based
CLG 2011-based
CLG 2008-based
0.5
0.55
0.6
0.65
0.7
1991
1993
1995
1997
1999
2001
2003
2005
2007
2009
2011
2013
2015
2017
2019
2021
2023
2025
2027
2029
2031
2033
2035
2037
CLG 2012-based
CLG 2011-based
CLG 2008-based
0.65
0.7
0.75
0.8
0.85
1991
1993
1995
1997
1999
2001
2003
2005
2007
2009
2011
2013
2015
2017
2019
2021
2023
2025
2027
2029
2031
2033
2035
2037
CLG 2012-based
CLG 2011-based
CLG 2008-based
0.7
0.75
0.8
0.85
0.9
1991
1993
1995
1997
1999
2001
2003
2005
2007
2009
2011
2013
2015
2017
2019
2021
2023
2025
2027
2029
2031
2033
2035
2037
CLG 2012-based
CLG 2011-based
CLG 2008-based
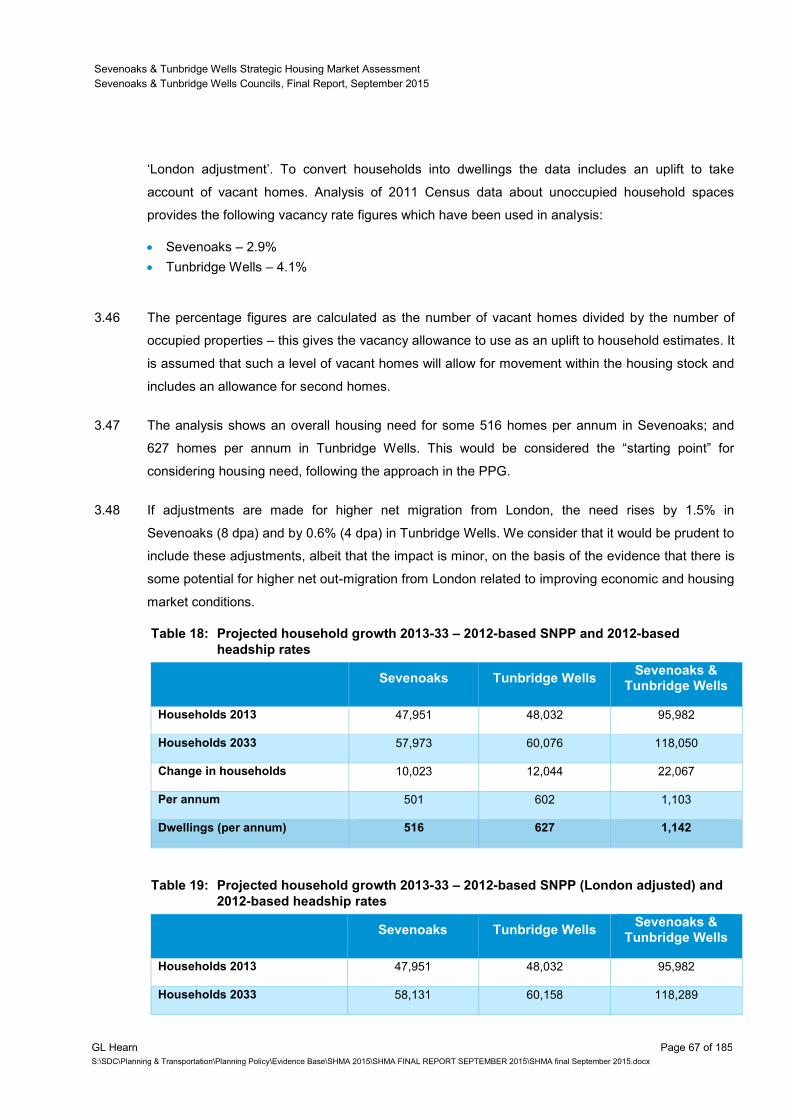
Sevenoaks & Tunbridge Wells Strategic Housing Market Assessment
Sevenoaks & Tunbridge Wells Councils, Final Report, September 2015
GL Hearn Page 67 of 185
S:\SDC\Planning & Transportation\Planning Policy\Evidence Base\SHMA 2015\SHMA FINAL REPORT SEPTEMBER 2015\SHMA final September 2015.docx
‘London adjustment’. To convert households into dwellings the data includes an uplift to take
account of vacant homes. Analysis of 2011 Census data about unoccupied household spaces
provides the following vacancy rate figures which have been used in analysis:
Sevenoaks – 2.9%
Tunbridge Wells – 4.1%
3.46 The percentage figures are calculated as the number of vacant homes divided by the number of
occupied properties – this gives the vacancy allowance to use as an uplift to household estimates. It
is assumed that such a level of vacant homes will allow for movement within the housing stock and
includes an allowance for second homes.
3.47 The analysis shows an overall housing need for some 516 homes per annum in Sevenoaks; and
627 homes per annum in Tunbridge Wells. This would be considered the “starting point” for
considering housing need, following the approach in the PPG.
3.48 If adjustments are made for higher net migration from London, the need rises by 1.5% in
Sevenoaks (8 dpa) and by 0.6% (4 dpa) in Tunbridge Wells. We consider that it would be prudent to
include these adjustments, albeit that the impact is minor, on the basis of the evidence that there is
some potential for higher net out-migration from London related to improving economic and housing
market conditions.
Table 18: Projected household growth 2013-33 – 2012-based SNPP and 2012-based
headship rates
Sevenoaks Tunbridge Wells Sevenoaks &
Tunbridge Wells
Households 2013 47,951 48,032 95,982
Households 2033 57,973 60,076 118,050
Change in households 10,023 12,044 22,067
Per annum 501 602 1,103
Dwellings (per annum) 516 627 1,142
Table 19: Projected household growth 2013-33 – 2012-based SNPP (London adjusted) and
2012-based headship rates
Sevenoaks Tunbridge Wells Sevenoaks &
Tunbridge Wells
Households 2013 47,951 48,032 95,982
Households 2033 58,131 60,158 118,289
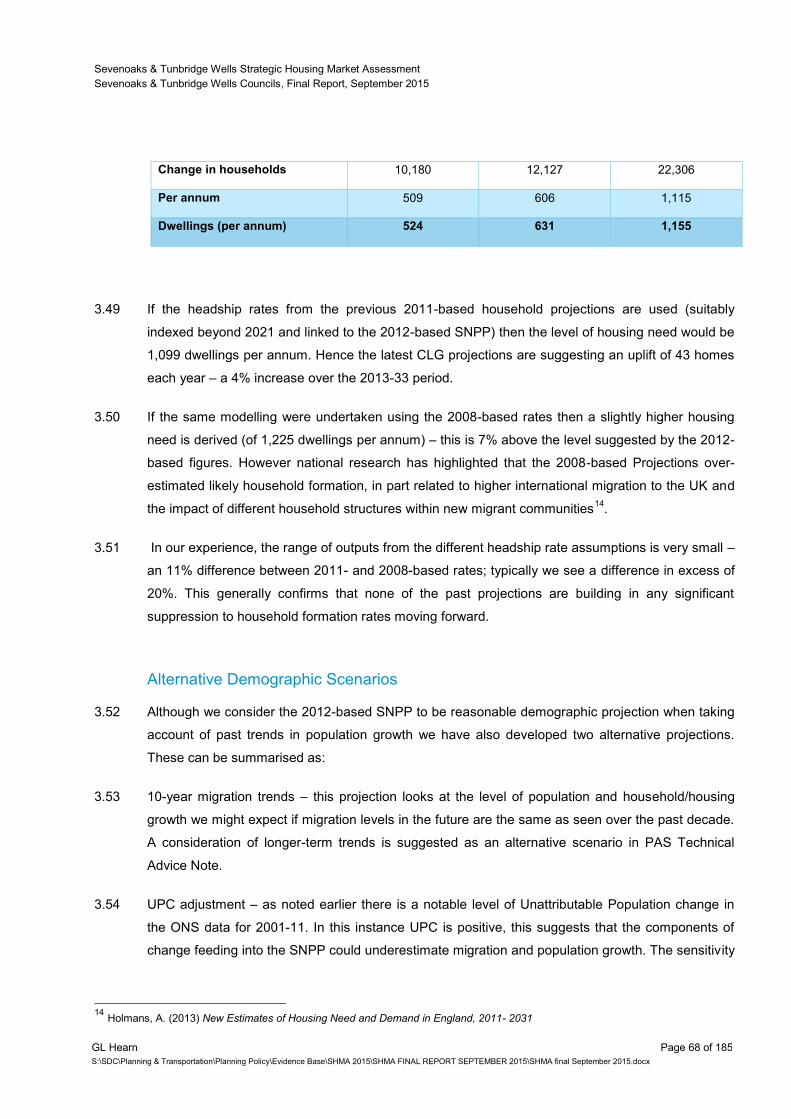
Sevenoaks & Tunbridge Wells Strategic Housing Market Assessment
Sevenoaks & Tunbridge Wells Councils, Final Report, September 2015
GL Hearn Page 68 of 185
S:\SDC\Planning & Transportation\Planning Policy\Evidence Base\SHMA 2015\SHMA FINAL REPORT SEPTEMBER 2015\SHMA final September 2015.docx
Change in households 10,180 12,127 22,306
Per annum 509 606 1,115
Dwellings (per annum) 524 631 1,155
3.49 If the headship rates from the previous 2011-based household projections are used (suitably
indexed beyond 2021 and linked to the 2012-based SNPP) then the level of housing need would be
1,099 dwellings per annum. Hence the latest CLG projections are suggesting an uplift of 43 homes
each year – a 4% increase over the 2013-33 period.
3.50 If the same modelling were undertaken using the 2008-based rates then a slightly higher housing
need is derived (of 1,225 dwellings per annum) – this is 7% above the level suggested by the 2012-
based figures. However national research has highlighted that the 2008-based Projections over-
estimated likely household formation, in part related to higher international migration to the UK and
the impact of different household structures within new migrant communities14
.
3.51 In our experience, the range of outputs from the different headship rate assumptions is very small –
an 11% difference between 2011- and 2008-based rates; typically we see a difference in excess of
20%. This generally confirms that none of the past projections are building in any significant
suppression to household formation rates moving forward.
Alternative Demographic Scenarios
3.52 Although we consider the 2012-based SNPP to be reasonable demographic projection when taking
account of past trends in population growth we have also developed two alternative projections.
These can be summarised as:
3.53 10-year migration trends – this projection looks at the level of population and household/housing
growth we might expect if migration levels in the future are the same as seen over the past decade.
A consideration of longer-term trends is suggested as an alternative scenario in PAS Technical
Advice Note.
3.54 UPC adjustment – as noted earlier there is a notable level of Unattributable Population change in
the ONS data for 2001-11. In this instance UPC is positive, this suggests that the components of
change feeding into the SNPP could underestimate migration and population growth. The sensitivity
14
Holmans, A. (2013) New Estimates of Housing Need and Demand in England, 2011- 2031
Sevenoaks & Tunbridge Wells Strategic Housing Market Assessment
Sevenoaks & Tunbridge Wells Councils, Final Report, September 2015
GL Hearn Page 69 of 185
S:\SDC\Planning & Transportation\Planning Policy\Evidence Base\SHMA 2015\SHMA FINAL REPORT SEPTEMBER 2015\SHMA final September 2015.docx
analysis here assumes that UPC relates entirely to under- or over-estimation of migration, and
considers the impact which this could have.
3.55 Tables 20 and 21 show the outputs of the two alternative demographic projections developed.
3.56 The 10 year linear migration scenario results in a lower housing need in Sevenoaks and Tunbridge
Wells relative to the SNPP. This projection shows a level of need in Sevenoaks which is 7% below
that shown in the SNPP; and 11% below it in Tunbridge Wells. It is however a relatively crude
projection which projects forward average annual net migration. The SNPP is a more advanced
demographic projection which takes account of how the age structure of the population in the local
authority is expected to change and how the population in other areas from which people typically
move to the area is expected to change; and how this may influence the propensity of people to
migrate. This is a more advanced projection for population growth, which is likely to be more
realistic than simply projecting forward average net migration figures. The SNPP projects some
growth in net migration which we would expect to occur given our understanding of dynamics of
population growth in London and the wider South East.
3.57 The UPC scenario assumes that UPC can be allocated in full to an over or under-estimate of
migration. This results in 4% lower housing need in Sevenoaks; but a notably higher housing need
in Tunbridge Wells. Whilst UPC may relate to migration, it cannot be definitively determined the
extent to which this is the case, or whether it reflects errors in Census data; or indeed over what
period during the 2001-11 decade it relates. ONS undertook a consultation on whether adjustments
should be made to the 2012-based SNPP to take account of UPC. This concluded that it would not
be appropriate to include adjustments for UPC in the SNPP because:
It is unclear what proportion of the UPC is due to sampling error in the 2001 Census,
adjustments made to Mid-Year Population Estimates (MYEs) post the 2001 Census, sampling
error in the 2011 Census and/or error in the intercensal components (mainly migration);
If it is due to either 2001 Census or 2011 Census then the components of population change will
be unaffected; and
If it is due to international migration, it is likely that the biggest impacts will be seen earlier in the
decade and will have less of an impact in the later years, because of improvements introduced
to migration estimates in the majority of these years.
3.58 It is not possible to attribute UPC accurately to specific years. ONS has improved its methodology
for modelling migration, and data collection – including in taking account of Higher Education
Statistics Agency data regarding student moves. On this basis, migration estimates for the latter
years over the 2001-11 decade should be better than those in earlier years. Overall, we would
consider the evidence insufficient to warrant adjustments to the 2012-based SNPP Projections.
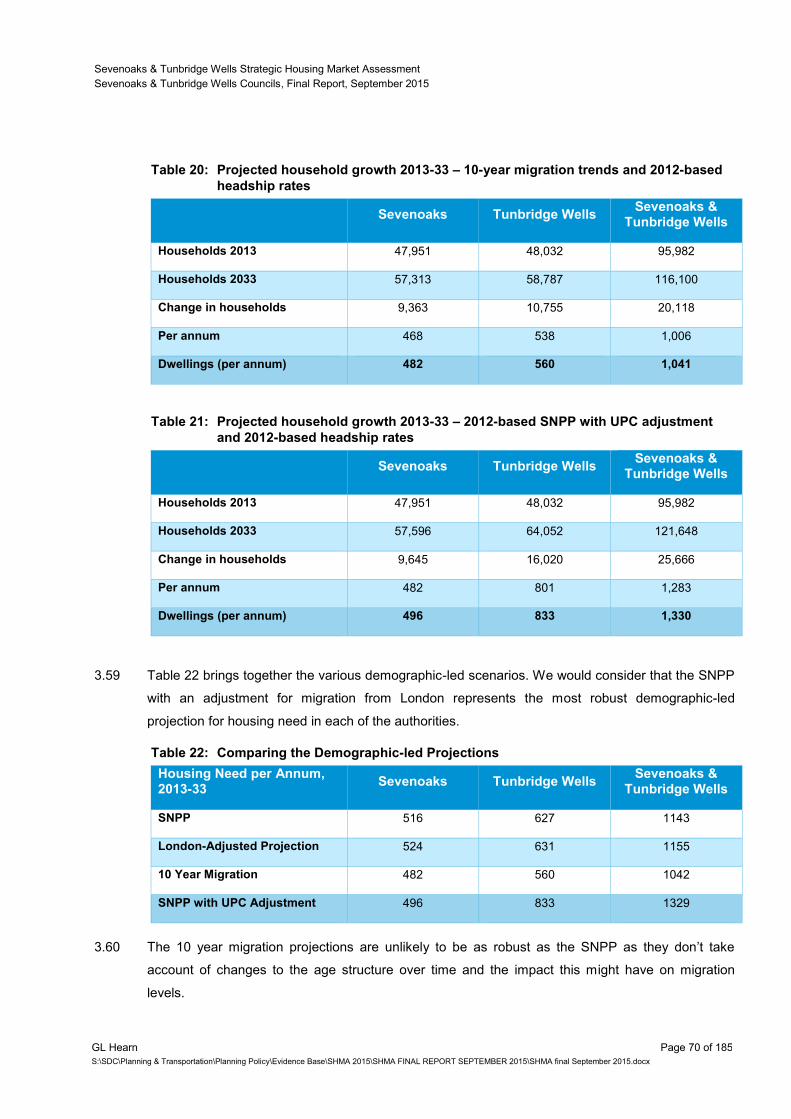
Sevenoaks & Tunbridge Wells Strategic Housing Market Assessment
Sevenoaks & Tunbridge Wells Councils, Final Report, September 2015
GL Hearn Page 70 of 185
S:\SDC\Planning & Transportation\Planning Policy\Evidence Base\SHMA 2015\SHMA FINAL REPORT SEPTEMBER 2015\SHMA final September 2015.docx
Table 20: Projected household growth 2013-33 – 10-year migration trends and 2012-based
headship rates
Sevenoaks Tunbridge Wells Sevenoaks &
Tunbridge Wells
Households 2013 47,951 48,032 95,982
Households 2033 57,313 58,787 116,100
Change in households 9,363 10,755 20,118
Per annum 468 538 1,006
Dwellings (per annum) 482 560 1,041
Table 21: Projected household growth 2013-33 – 2012-based SNPP with UPC adjustment
and 2012-based headship rates
Sevenoaks Tunbridge Wells Sevenoaks &
Tunbridge Wells
Households 2013 47,951 48,032 95,982
Households 2033 57,596 64,052 121,648
Change in households 9,645 16,020 25,666
Per annum 482 801 1,283
Dwellings (per annum) 496 833 1,330
3.59 Table 22 brings together the various demographic-led scenarios. We would consider that the SNPP
with an adjustment for migration from London represents the most robust demographic-led
projection for housing need in each of the authorities.
Table 22: Comparing the Demographic-led Projections
Housing Need per Annum, 2013-33
Sevenoaks Tunbridge Wells Sevenoaks &
Tunbridge Wells
SNPP 516 627 1143
London-Adjusted Projection 524 631 1155
10 Year Migration 482 560 1042
SNPP with UPC Adjustment 496 833 1329
3.60 The 10 year migration projections are unlikely to be as robust as the SNPP as they don’t take
account of changes to the age structure over time and the impact this might have on migration
levels.
Sevenoaks & Tunbridge Wells Strategic Housing Market Assessment
Sevenoaks & Tunbridge Wells Councils, Final Report, September 2015
GL Hearn Page 71 of 185
S:\SDC\Planning & Transportation\Planning Policy\Evidence Base\SHMA 2015\SHMA FINAL REPORT SEPTEMBER 2015\SHMA final September 2015.docx
3.61 The UPC scenario is a useful scenario to consider (again it is one suggested in the PAS guidance)
however we do not consider it to be a robust alternative to the SNPP. The main reasons for this are
that it is unclear if UPC is related to migration and more importantly, due to changes in the methods
used by ONS to measure migration it is most probable that any errors are focussed on earlier
periods (notably 2001-6) and therefore a UPC adjustment for more recent data would not be
appropriate.
Relationship to Economic Growth
3.62 Planning Practice Guidance sets out that consideration should be given to future economic
performance in drawing conclusions on the overall need for housing. Where the evidence suggests
that higher migration might be needed than seen in past trends in order to support economic growth,
consideration should be given to adjusting the assessed housing need. Specifically the Guidance
outlines that:
‘Plan makers should make an assessment of the likely growth in job numbers based on
past trends and/or economic forecasts as appropriate and also having regard to the
growth of the working age population’
And that:
‘Where the supply of working age population that is economically active (labour force
supply) is less than the projected job growth, this could result in unsustainable
commuting patterns (depending on public transport accessibility or other sustainable
options such as walking or cycling) and could reduce the resilience of local businesses.
In such circumstances, plan makers will need to consider how the location of new
housing or infrastructure development could help address these problems’.
3.63 Both Councils in due course are intending to prepare Employment Land Studies, which will include
consideration of economic dynamics and growth potential. This more detailed work considering
economic growth potential may result in the need to consider adjustments to conclusions on OAN
or to housing targets. This report, following the approach in the PPG, considers trends and
forecasts in employment growth.
3.64 Figure 27 considers past trends over the period since 1991, based on data in the East of England
Forecasting Model (EEFM). These are estimates of (workplace-based) total employment, based on
aggregating data from official data sources such as the Business Register and Employment Survey
(BRES), Annual Population Survey (APS) and ONS Workforce Jobs series.
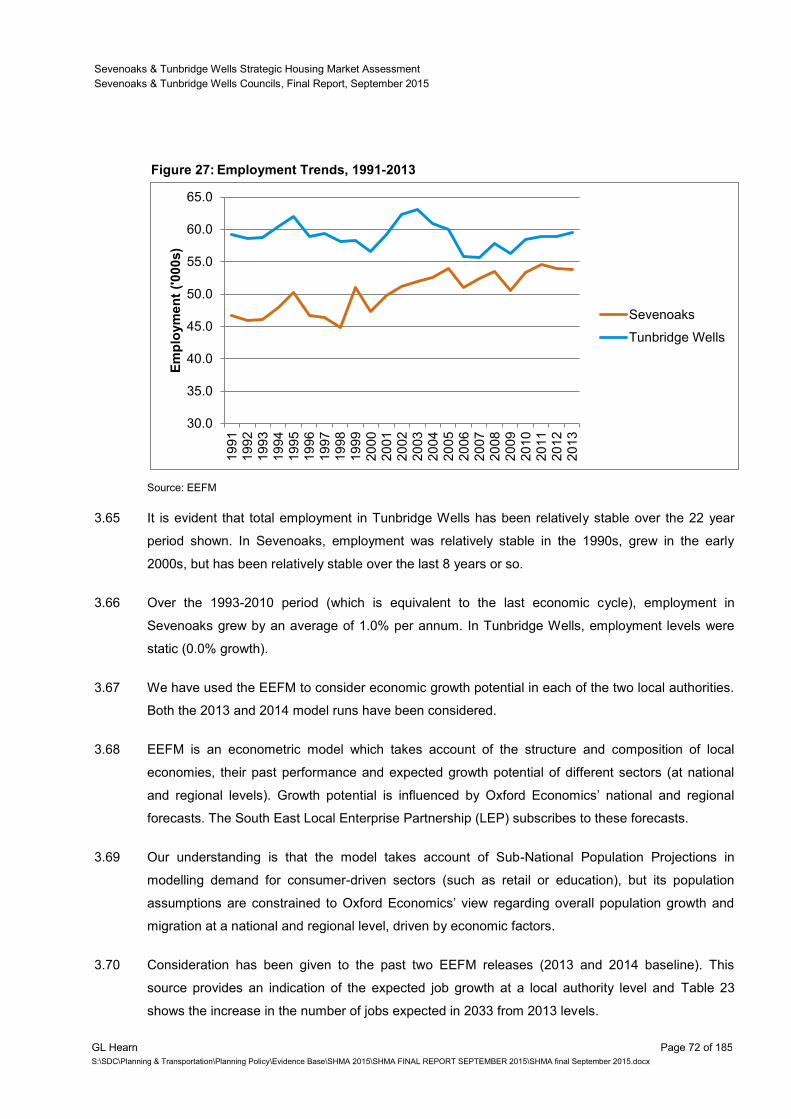
Sevenoaks & Tunbridge Wells Strategic Housing Market Assessment
Sevenoaks & Tunbridge Wells Councils, Final Report, September 2015
GL Hearn Page 72 of 185
S:\SDC\Planning & Transportation\Planning Policy\Evidence Base\SHMA 2015\SHMA FINAL REPORT SEPTEMBER 2015\SHMA final September 2015.docx
Figure 27: Employment Trends, 1991-2013
Source: EEFM
3.65 It is evident that total employment in Tunbridge Wells has been relatively stable over the 22 year
period shown. In Sevenoaks, employment was relatively stable in the 1990s, grew in the early
2000s, but has been relatively stable over the last 8 years or so.
3.66 Over the 1993-2010 period (which is equivalent to the last economic cycle), employment in
Sevenoaks grew by an average of 1.0% per annum. In Tunbridge Wells, employment levels were
static (0.0% growth).
3.67 We have used the EEFM to consider economic growth potential in each of the two local authorities.
Both the 2013 and 2014 model runs have been considered.
3.68 EEFM is an econometric model which takes account of the structure and composition of local
economies, their past performance and expected growth potential of different sectors (at national
and regional levels). Growth potential is influenced by Oxford Economics’ national and regional
forecasts. The South East Local Enterprise Partnership (LEP) subscribes to these forecasts.
3.69 Our understanding is that the model takes account of Sub-National Population Projections in
modelling demand for consumer-driven sectors (such as retail or education), but its population
assumptions are constrained to Oxford Economics’ view regarding overall population growth and
migration at a national and regional level, driven by economic factors.
3.70 Consideration has been given to the past two EEFM releases (2013 and 2014 baseline). This
source provides an indication of the expected job growth at a local authority level and Table 23
shows the increase in the number of jobs expected in 2033 from 2013 levels.
30.0
35.0
40.0
45.0
50.0
55.0
60.0
65.0
19
91
19
92
19
93
19
94
19
95
19
96
19
97
19
98
19
99
20
00
20
01
20
02
20
03
20
04
20
05
20
06
20
07
20
08
20
09
20
10
20
11
20
12
20
13
Em
plo
ym
en
t ('
000s)
Sevenoaks
Tunbridge Wells
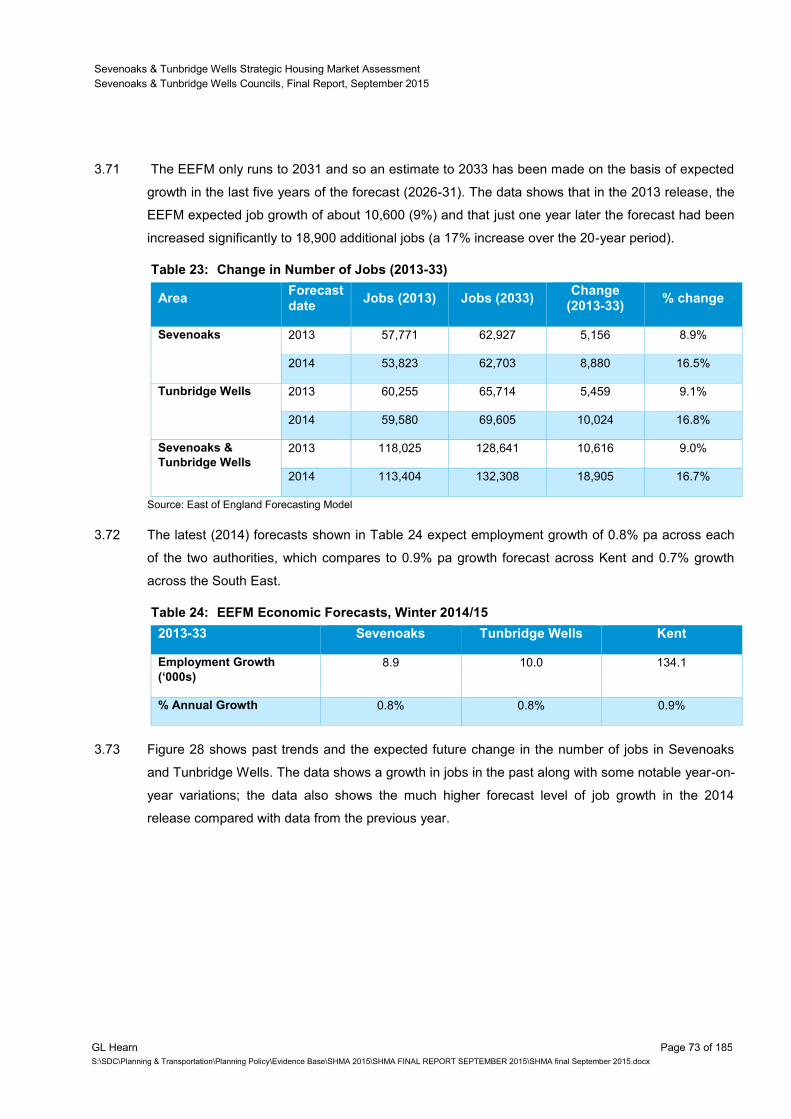
Sevenoaks & Tunbridge Wells Strategic Housing Market Assessment
Sevenoaks & Tunbridge Wells Councils, Final Report, September 2015
GL Hearn Page 73 of 185
S:\SDC\Planning & Transportation\Planning Policy\Evidence Base\SHMA 2015\SHMA FINAL REPORT SEPTEMBER 2015\SHMA final September 2015.docx
3.71 The EEFM only runs to 2031 and so an estimate to 2033 has been made on the basis of expected
growth in the last five years of the forecast (2026-31). The data shows that in the 2013 release, the
EEFM expected job growth of about 10,600 (9%) and that just one year later the forecast had been
increased significantly to 18,900 additional jobs (a 17% increase over the 20-year period).
Table 23: Change in Number of Jobs (2013-33)
Area Forecast date
Jobs (2013) Jobs (2033) Change
(2013-33) % change
Sevenoaks 2013 57,771 62,927 5,156 8.9%
2014 53,823 62,703 8,880 16.5%
Tunbridge Wells 2013 60,255 65,714 5,459 9.1%
2014 59,580 69,605 10,024 16.8%
Sevenoaks &
Tunbridge Wells
2013 118,025 128,641 10,616 9.0%
2014 113,404 132,308 18,905 16.7%
Source: East of England Forecasting Model
3.72 The latest (2014) forecasts shown in Table 24 expect employment growth of 0.8% pa across each
of the two authorities, which compares to 0.9% pa growth forecast across Kent and 0.7% growth
across the South East.
Table 24: EEFM Economic Forecasts, Winter 2014/15
2013-33 Sevenoaks Tunbridge Wells Kent
Employment Growth
(‘000s)
8.9 10.0 134.1
% Annual Growth 0.8% 0.8% 0.9%
3.73 Figure 28 shows past trends and the expected future change in the number of jobs in Sevenoaks
and Tunbridge Wells. The data shows a growth in jobs in the past along with some notable year-on-
year variations; the data also shows the much higher forecast level of job growth in the 2014
release compared with data from the previous year.
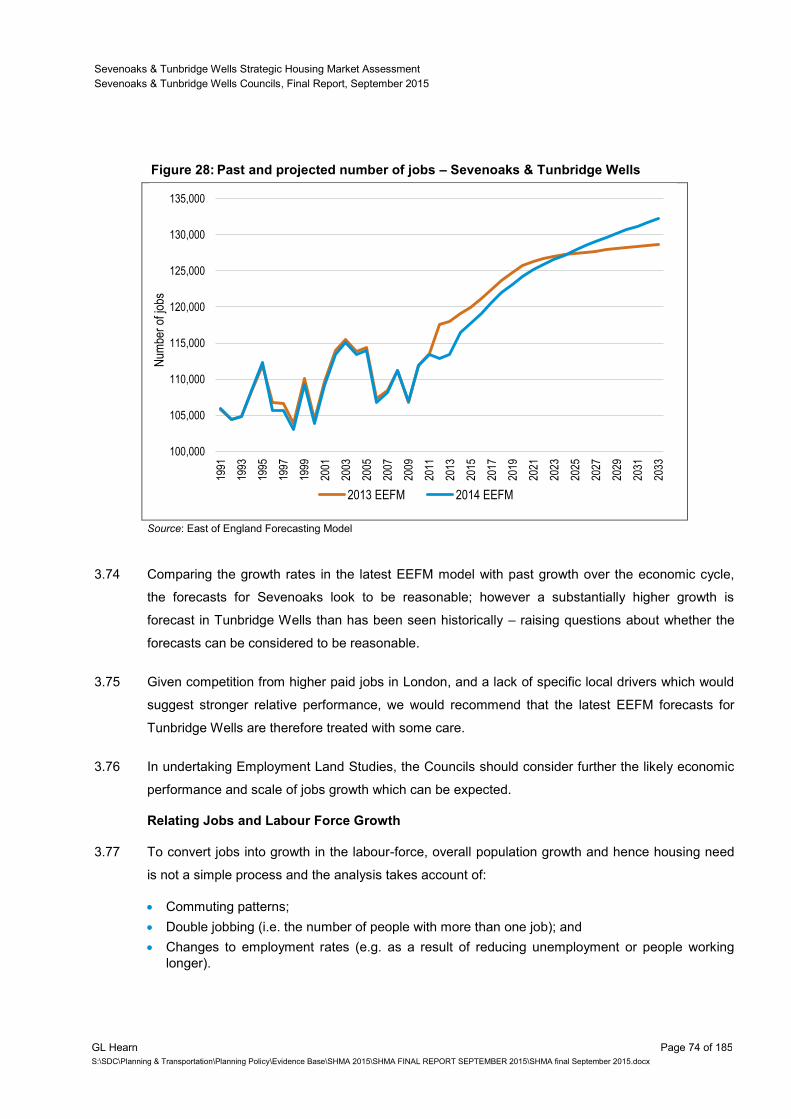
Sevenoaks & Tunbridge Wells Strategic Housing Market Assessment
Sevenoaks & Tunbridge Wells Councils, Final Report, September 2015
GL Hearn Page 74 of 185
S:\SDC\Planning & Transportation\Planning Policy\Evidence Base\SHMA 2015\SHMA FINAL REPORT SEPTEMBER 2015\SHMA final September 2015.docx
Figure 28: Past and projected number of jobs – Sevenoaks & Tunbridge Wells
Source: East of England Forecasting Model
3.74 Comparing the growth rates in the latest EEFM model with past growth over the economic cycle,
the forecasts for Sevenoaks look to be reasonable; however a substantially higher growth is
forecast in Tunbridge Wells than has been seen historically – raising questions about whether the
forecasts can be considered to be reasonable.
3.75 Given competition from higher paid jobs in London, and a lack of specific local drivers which would
suggest stronger relative performance, we would recommend that the latest EEFM forecasts for
Tunbridge Wells are therefore treated with some care.
3.76 In undertaking Employment Land Studies, the Councils should consider further the likely economic
performance and scale of jobs growth which can be expected.
Relating Jobs and Labour Force Growth
3.77 To convert jobs into growth in the labour-force, overall population growth and hence housing need
is not a simple process and the analysis takes account of:
Commuting patterns;
Double jobbing (i.e. the number of people with more than one job); and
Changes to employment rates (e.g. as a result of reducing unemployment or people working
longer).
100,000
105,000
110,000
115,000
120,000
125,000
130,000
135,000
1991
1993
1995
1997
1999
2001
2003
2005
2007
2009
2011
2013
2015
2017
2019
2021
2023
2025
2027
2029
2031
2033
Num
ber
of jo
bs
2013 EEFM 2014 EEFM
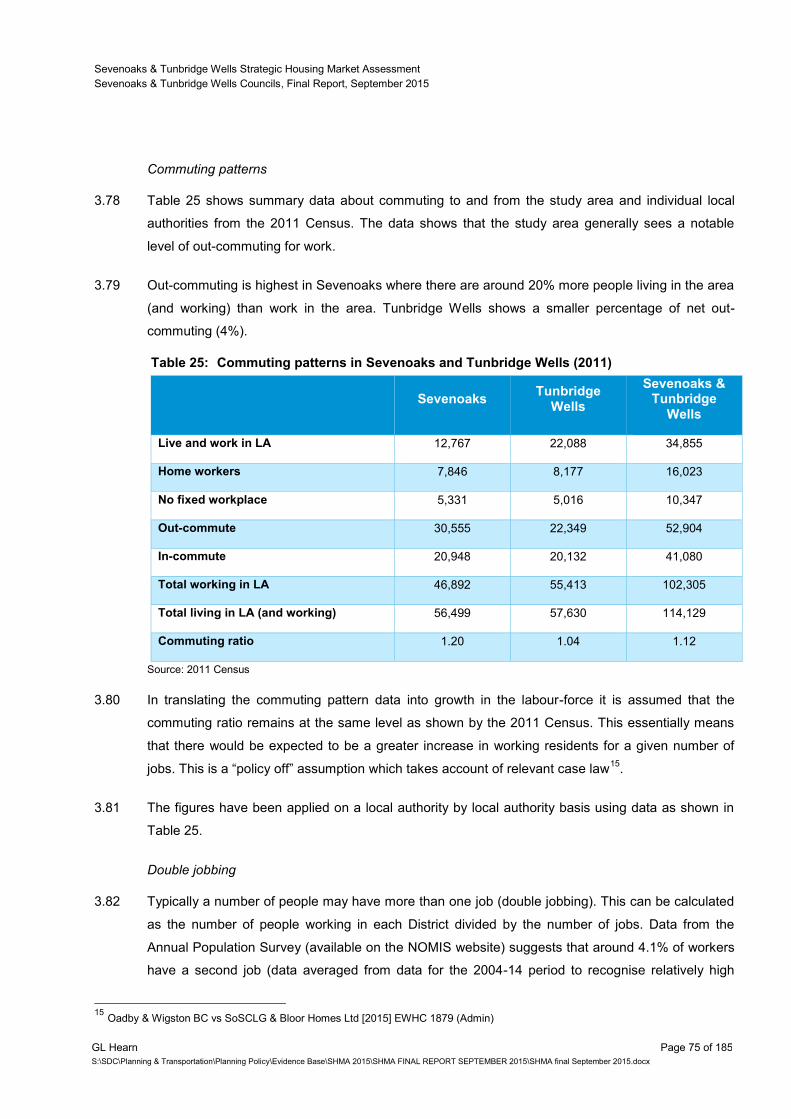
Sevenoaks & Tunbridge Wells Strategic Housing Market Assessment
Sevenoaks & Tunbridge Wells Councils, Final Report, September 2015
GL Hearn Page 75 of 185
S:\SDC\Planning & Transportation\Planning Policy\Evidence Base\SHMA 2015\SHMA FINAL REPORT SEPTEMBER 2015\SHMA final September 2015.docx
Commuting patterns
3.78 Table 25 shows summary data about commuting to and from the study area and individual local
authorities from the 2011 Census. The data shows that the study area generally sees a notable
level of out-commuting for work.
3.79 Out-commuting is highest in Sevenoaks where there are around 20% more people living in the area
(and working) than work in the area. Tunbridge Wells shows a smaller percentage of net out-
commuting (4%).
Table 25: Commuting patterns in Sevenoaks and Tunbridge Wells (2011)
Sevenoaks Tunbridge
Wells
Sevenoaks & Tunbridge
Wells
Live and work in LA 12,767 22,088 34,855
Home workers 7,846 8,177 16,023
No fixed workplace 5,331 5,016 10,347
Out-commute 30,555 22,349 52,904
In-commute 20,948 20,132 41,080
Total working in LA 46,892 55,413 102,305
Total living in LA (and working) 56,499 57,630 114,129
Commuting ratio 1.20 1.04 1.12
Source: 2011 Census
3.80 In translating the commuting pattern data into growth in the labour-force it is assumed that the
commuting ratio remains at the same level as shown by the 2011 Census. This essentially means
that there would be expected to be a greater increase in working residents for a given number of
jobs. This is a “policy off” assumption which takes account of relevant case law15
.
3.81 The figures have been applied on a local authority by local authority basis using data as shown in
Table 25.
Double jobbing
3.82 Typically a number of people may have more than one job (double jobbing). This can be calculated
as the number of people working in each District divided by the number of jobs. Data from the
Annual Population Survey (available on the NOMIS website) suggests that around 4.1% of workers
have a second job (data averaged from data for the 2004-14 period to recognise relatively high
15
Oadby & Wigston BC vs SoSCLG & Bloor Homes Ltd [2015] EWHC 1879 (Admin)
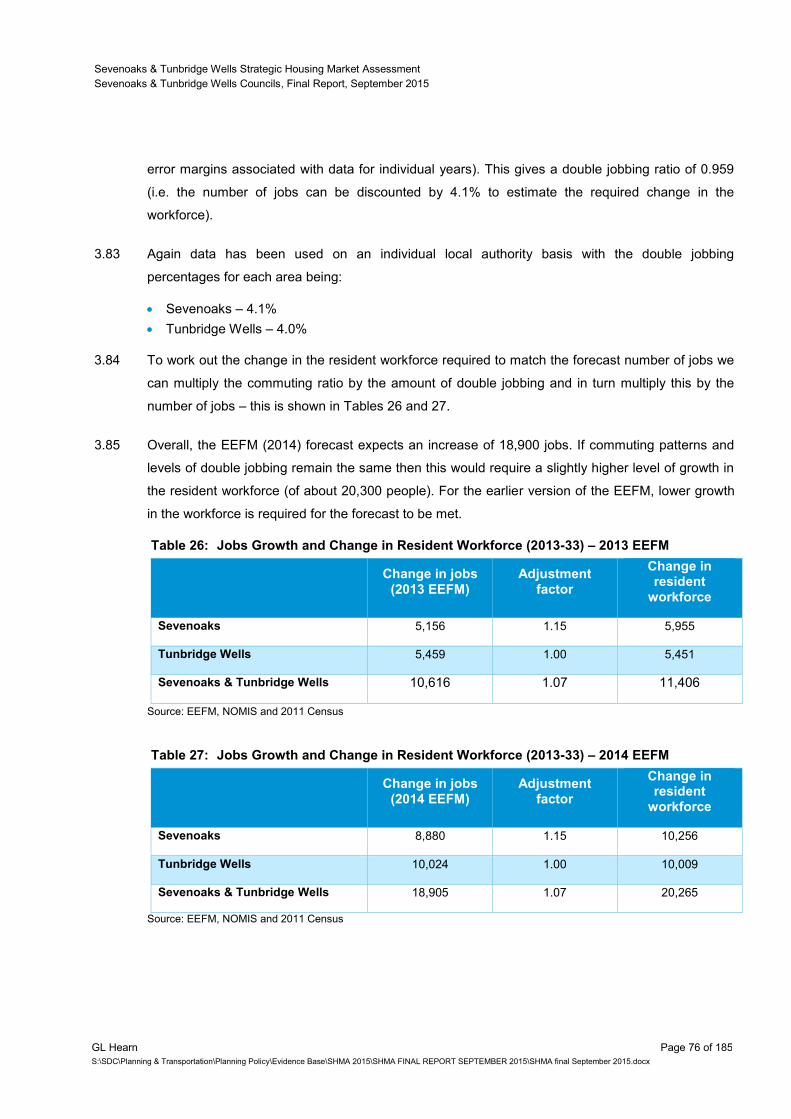
Sevenoaks & Tunbridge Wells Strategic Housing Market Assessment
Sevenoaks & Tunbridge Wells Councils, Final Report, September 2015
GL Hearn Page 76 of 185
S:\SDC\Planning & Transportation\Planning Policy\Evidence Base\SHMA 2015\SHMA FINAL REPORT SEPTEMBER 2015\SHMA final September 2015.docx
error margins associated with data for individual years). This gives a double jobbing ratio of 0.959
(i.e. the number of jobs can be discounted by 4.1% to estimate the required change in the
workforce).
3.83 Again data has been used on an individual local authority basis with the double jobbing
percentages for each area being:
Sevenoaks – 4.1%
Tunbridge Wells – 4.0%
3.84 To work out the change in the resident workforce required to match the forecast number of jobs we
can multiply the commuting ratio by the amount of double jobbing and in turn multiply this by the
number of jobs – this is shown in Tables 26 and 27.
3.85 Overall, the EEFM (2014) forecast expects an increase of 18,900 jobs. If commuting patterns and
levels of double jobbing remain the same then this would require a slightly higher level of growth in
the resident workforce (of about 20,300 people). For the earlier version of the EEFM, lower growth
in the workforce is required for the forecast to be met.
Table 26: Jobs Growth and Change in Resident Workforce (2013-33) – 2013 EEFM
Change in jobs
(2013 EEFM) Adjustment
factor
Change in resident
workforce
Sevenoaks 5,156 1.15 5,955
Tunbridge Wells 5,459 1.00 5,451
Sevenoaks & Tunbridge Wells 10,616 1.07 11,406
Source: EEFM, NOMIS and 2011 Census
Table 27: Jobs Growth and Change in Resident Workforce (2013-33) – 2014 EEFM
Change in jobs
(2014 EEFM) Adjustment
factor
Change in resident
workforce
Sevenoaks 8,880 1.15 10,256
Tunbridge Wells 10,024 1.00 10,009
Sevenoaks & Tunbridge Wells 18,905 1.07 20,265
Source: EEFM, NOMIS and 2011 Census
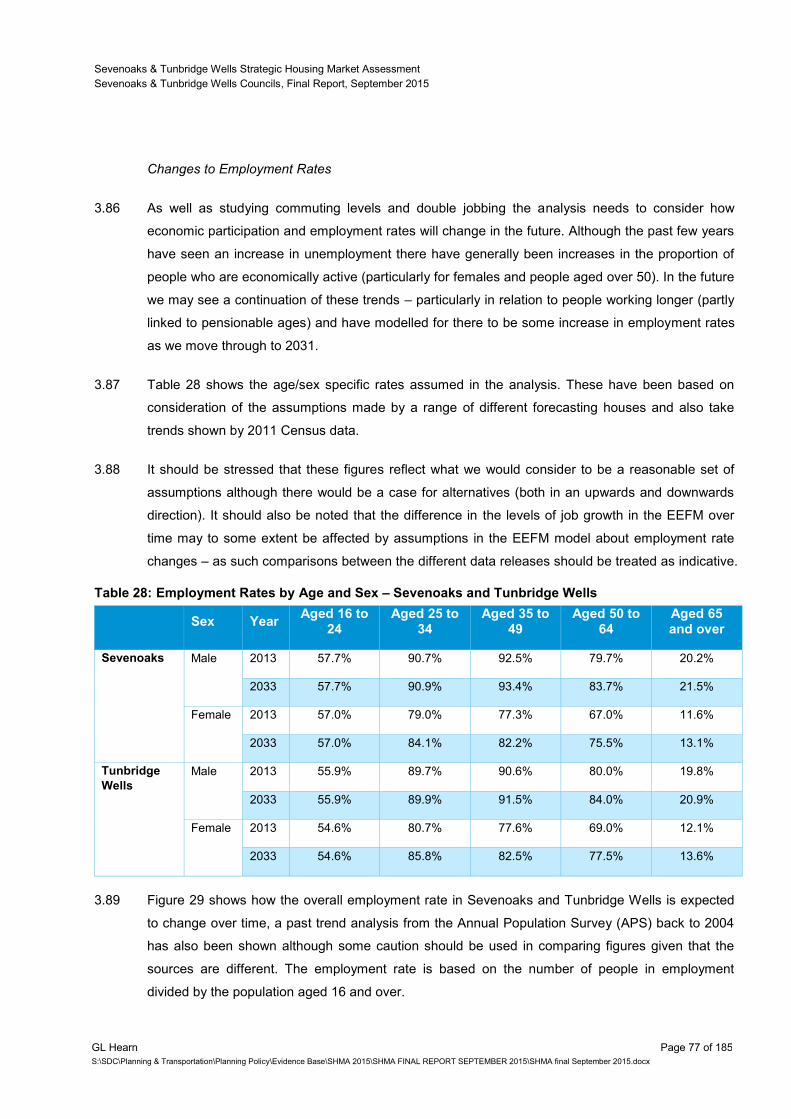
Sevenoaks & Tunbridge Wells Strategic Housing Market Assessment
Sevenoaks & Tunbridge Wells Councils, Final Report, September 2015
GL Hearn Page 77 of 185
S:\SDC\Planning & Transportation\Planning Policy\Evidence Base\SHMA 2015\SHMA FINAL REPORT SEPTEMBER 2015\SHMA final September 2015.docx
Changes to Employment Rates
3.86 As well as studying commuting levels and double jobbing the analysis needs to consider how
economic participation and employment rates will change in the future. Although the past few years
have seen an increase in unemployment there have generally been increases in the proportion of
people who are economically active (particularly for females and people aged over 50). In the future
we may see a continuation of these trends – particularly in relation to people working longer (partly
linked to pensionable ages) and have modelled for there to be some increase in employment rates
as we move through to 2031.
3.87 Table 28 shows the age/sex specific rates assumed in the analysis. These have been based on
consideration of the assumptions made by a range of different forecasting houses and also take
trends shown by 2011 Census data.
3.88 It should be stressed that these figures reflect what we would consider to be a reasonable set of
assumptions although there would be a case for alternatives (both in an upwards and downwards
direction). It should also be noted that the difference in the levels of job growth in the EEFM over
time may to some extent be affected by assumptions in the EEFM model about employment rate
changes – as such comparisons between the different data releases should be treated as indicative.
Table 28: Employment Rates by Age and Sex – Sevenoaks and Tunbridge Wells
Sex Year Aged 16 to
24 Aged 25 to
34 Aged 35 to
49 Aged 50 to
64 Aged 65 and over
Sevenoaks Male 2013 57.7% 90.7% 92.5% 79.7% 20.2%
2033 57.7% 90.9% 93.4% 83.7% 21.5%
Female 2013 57.0% 79.0% 77.3% 67.0% 11.6%
2033 57.0% 84.1% 82.2% 75.5% 13.1%
Tunbridge
Wells
Male 2013 55.9% 89.7% 90.6% 80.0% 19.8%
2033 55.9% 89.9% 91.5% 84.0% 20.9%
Female 2013 54.6% 80.7% 77.6% 69.0% 12.1%
2033 54.6% 85.8% 82.5% 77.5% 13.6%
3.89 Figure 29 shows how the overall employment rate in Sevenoaks and Tunbridge Wells is expected
to change over time, a past trend analysis from the Annual Population Survey (APS) back to 2004
has also been shown although some caution should be used in comparing figures given that the
sources are different. The employment rate is based on the number of people in employment
divided by the population aged 16 and over.
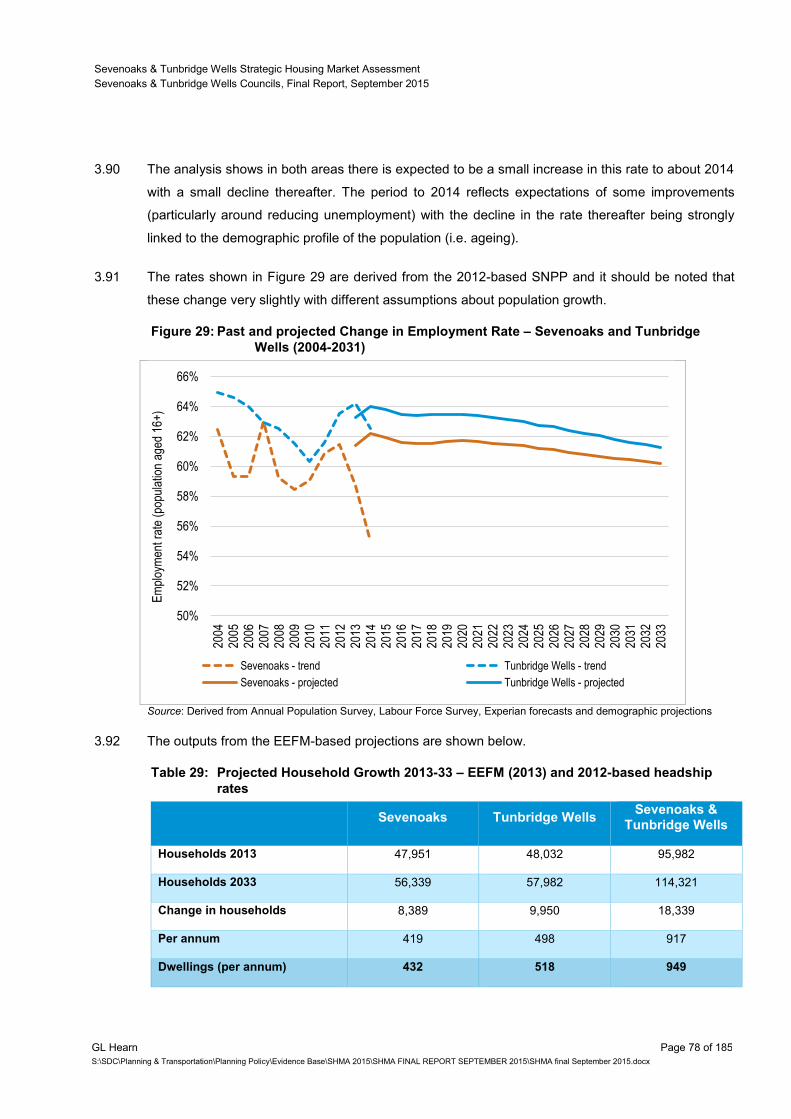
Sevenoaks & Tunbridge Wells Strategic Housing Market Assessment
Sevenoaks & Tunbridge Wells Councils, Final Report, September 2015
GL Hearn Page 78 of 185
S:\SDC\Planning & Transportation\Planning Policy\Evidence Base\SHMA 2015\SHMA FINAL REPORT SEPTEMBER 2015\SHMA final September 2015.docx
3.90 The analysis shows in both areas there is expected to be a small increase in this rate to about 2014
with a small decline thereafter. The period to 2014 reflects expectations of some improvements
(particularly around reducing unemployment) with the decline in the rate thereafter being strongly
linked to the demographic profile of the population (i.e. ageing).
3.91 The rates shown in Figure 29 are derived from the 2012-based SNPP and it should be noted that
these change very slightly with different assumptions about population growth.
Figure 29: Past and projected Change in Employment Rate – Sevenoaks and Tunbridge
Wells (2004-2031)
Source: Derived from Annual Population Survey, Labour Force Survey, Experian forecasts and demographic projections
3.92 The outputs from the EEFM-based projections are shown below.
Table 29: Projected Household Growth 2013-33 – EEFM (2013) and 2012-based headship
rates
Sevenoaks Tunbridge Wells Sevenoaks &
Tunbridge Wells
Households 2013 47,951 48,032 95,982
Households 2033 56,339 57,982 114,321
Change in households 8,389 9,950 18,339
Per annum 419 498 917
Dwellings (per annum) 432 518 949
50%
52%
54%
56%
58%
60%
62%
64%
66%
2004
2005
2006
2007
2008
2009
2010
2011
2012
2013
2014
2015
2016
2017
2018
2019
2020
2021
2022
2023
2024
2025
2026
2027
2028
2029
2030
2031
2032
2033
Em
ploy
men
t rat
e (p
opul
atio
n ag
ed 1
6+)
Sevenoaks - trend Tunbridge Wells - trend
Sevenoaks - projected Tunbridge Wells - projected
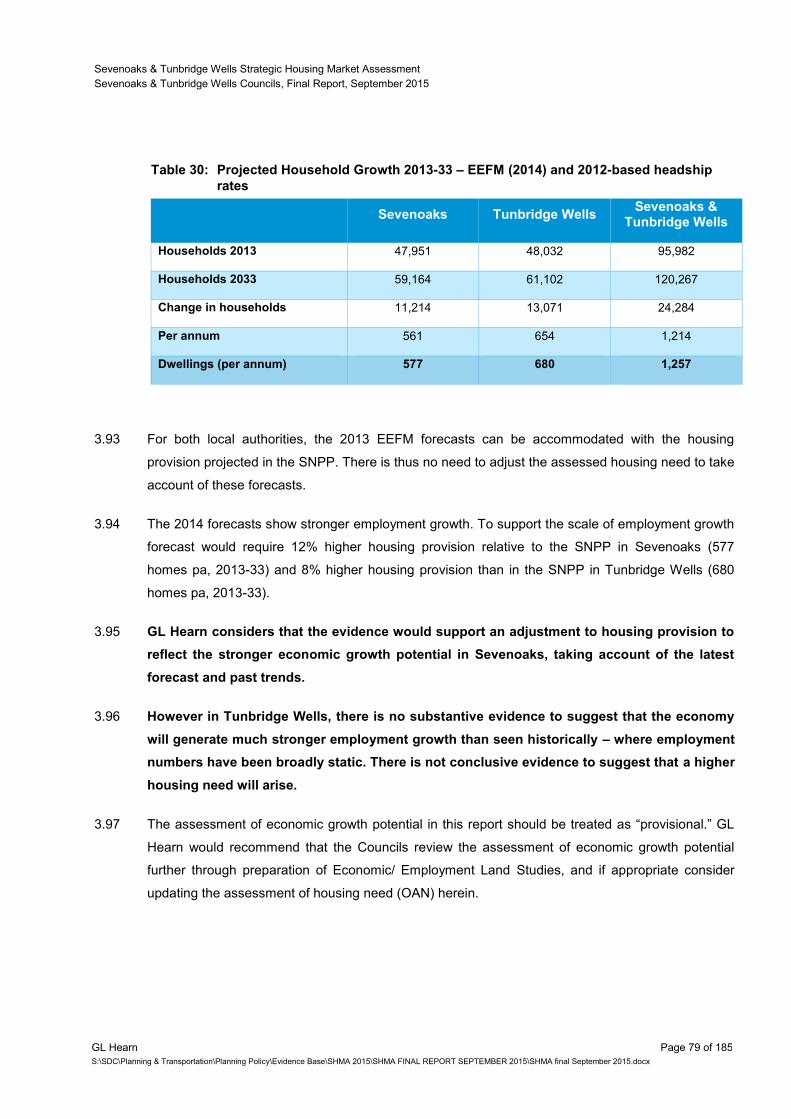
Sevenoaks & Tunbridge Wells Strategic Housing Market Assessment
Sevenoaks & Tunbridge Wells Councils, Final Report, September 2015
GL Hearn Page 79 of 185
S:\SDC\Planning & Transportation\Planning Policy\Evidence Base\SHMA 2015\SHMA FINAL REPORT SEPTEMBER 2015\SHMA final September 2015.docx
Table 30: Projected Household Growth 2013-33 – EEFM (2014) and 2012-based headship
rates
Sevenoaks Tunbridge Wells Sevenoaks &
Tunbridge Wells
Households 2013 47,951 48,032 95,982
Households 2033 59,164 61,102 120,267
Change in households 11,214 13,071 24,284
Per annum 561 654 1,214
Dwellings (per annum) 577 680 1,257
3.93 For both local authorities, the 2013 EEFM forecasts can be accommodated with the housing
provision projected in the SNPP. There is thus no need to adjust the assessed housing need to take
account of these forecasts.
3.94 The 2014 forecasts show stronger employment growth. To support the scale of employment growth
forecast would require 12% higher housing provision relative to the SNPP in Sevenoaks (577
homes pa, 2013-33) and 8% higher housing provision than in the SNPP in Tunbridge Wells (680
homes pa, 2013-33).
3.95 GL Hearn considers that the evidence would support an adjustment to housing provision to
reflect the stronger economic growth potential in Sevenoaks, taking account of the latest
forecast and past trends.
3.96 However in Tunbridge Wells, there is no substantive evidence to suggest that the economy
will generate much stronger employment growth than seen historically – where employment
numbers have been broadly static. There is not conclusive evidence to suggest that a higher
housing need will arise.
3.97 The assessment of economic growth potential in this report should be treated as “provisional.” GL
Hearn would recommend that the Councils review the assessment of economic growth potential
further through preparation of Economic/ Employment Land Studies, and if appropriate consider
updating the assessment of housing need (OAN) herein.
Sevenoaks & Tunbridge Wells Strategic Housing Market Assessment
Sevenoaks & Tunbridge Wells Councils, Final Report, September 2015
GL Hearn Page 80 of 185
S:\SDC\Planning & Transportation\Planning Policy\Evidence Base\SHMA 2015\SHMA FINAL REPORT SEPTEMBER 2015\SHMA final September 2015.docx
Summary and Implications – Demographic & Economic-led Projections
3.98 Official (2012-based) trend-based population projections indicate that Sevenoaks population can be
expected to grow by 16.3% between 2013-33; with 16.4% growth expected in Tunbridge Wells’
population. However the evidence suggests that as the economy recovers from recession, it would
be reasonable to expect slightly higher net out-migration from London – increasing population
growth between 2013-33 to 17.0% in Sevenoaks and 16.6% in Tunbridge Wells. Taking account of
age-specific headship rates, and including an allowance for vacant and second homes, this results
in a need for 524 homes per year in Sevenoaks Borough; and 631 in Tunbridge Wells District. This
represents the “starting point” for considering housing provision, following the approach in Planning
Practice Guidance.
3.99 Consideration is then given to economic performance, and whether taking account of age structure
changes, employment growth may lead to an increase in net migration relative to past trends.
3.100 Employment in Tunbridge Wells has been relatively static, and there is no clear evidence that
economic performance would drive higher housing need moving forwards. The Council will consider
this issue further in preparing Employment Land Studies.
3.101 For Sevenoaks, economic trends and forecasts suggest that 0.8% employment growth per annum
can be expected. This is equivalent to a growth in employment of 8,900 between 2013-33. This
would result in housing need for 577 homes per annum.
Sevenoaks & Tunbridge Wells Strategic Housing Market Assessment
Sevenoaks & Tunbridge Wells Councils, Final Report, September 2015
GL Hearn Page 81 of 185
S:\SDC\Planning & Transportation\Planning Policy\Evidence Base\SHMA 2015\SHMA FINAL REPORT SEPTEMBER 2015\SHMA final September 2015.docx
4 AFFORDABLE HOUSING NEED
4.1 In this section we discuss levels of affordable housing need in Sevenoaks and Tunbridge Wells.
The analysis is intended to assess need arising from “those households who lack their own housing
or live in unsuitable housing and who cannot afford to meet their housing needs in the market” as
the Planning Practice Guidance sets out. Such households will be eligible for affordable housing.
Affordable housing is defined as:
Social rented, affordable rented and intermediate housing, provided to eligible
households whose needs are not met by the market. Eligibility is determined with regard
to local incomes and local house prices. Affordable housing should include provisions to
remain at an affordable price for future eligible households or for the subsidy to be
recycled for alternative affordable housing provision.
4.2 The Practice Guidance sets out a standard approach for assessing affordable housing need -
consistent with the methodology advocated in the 2007 SHMA Guidance - which we adopt for this
study. This is known as the Basic Needs Assessment Model.
4.3 The analysis is based on secondary data sources. It draws on a number of sources of information
including 2011 Census data, demographic projections, house prices/rents and income information.
Key definitions used are outlined in Appendix A.
4.4 The housing needs model is based largely on housing market conditions (and particularly the
relationship of housing costs and incomes) at a particular point in time – the time of the assessment
– as well as the existing supply of affordable housing which can be used to meet housing need. The
base date for analysis (e.g. data about housing costs and incomes) is 2014.
Housing Affordability
4.5 In preparing this report we have undertaken a survey of housing costs for different sizes of
properties by tenure category. This is presented in Appendix B.
4.6 Figure 30 estimates how current prices and rents in the two local authorities might equate to income
levels required to afford such housing. The figures are based on the figures derived in the analysis
above and include four different tenures (buying, private rent, affordable rent and social rent) and
are taken as the lower quartile price/rent across the whole stock of housing available (i.e. including
all property sizes).
4.7 For illustrative purposes the calculations are based on 3.5 times household income for house
purchase and 30% of income to be spent on housing for rented properties. The figures for house
purchase are based on a 100% mortgage for the purposes of comparing the different types of
housing.
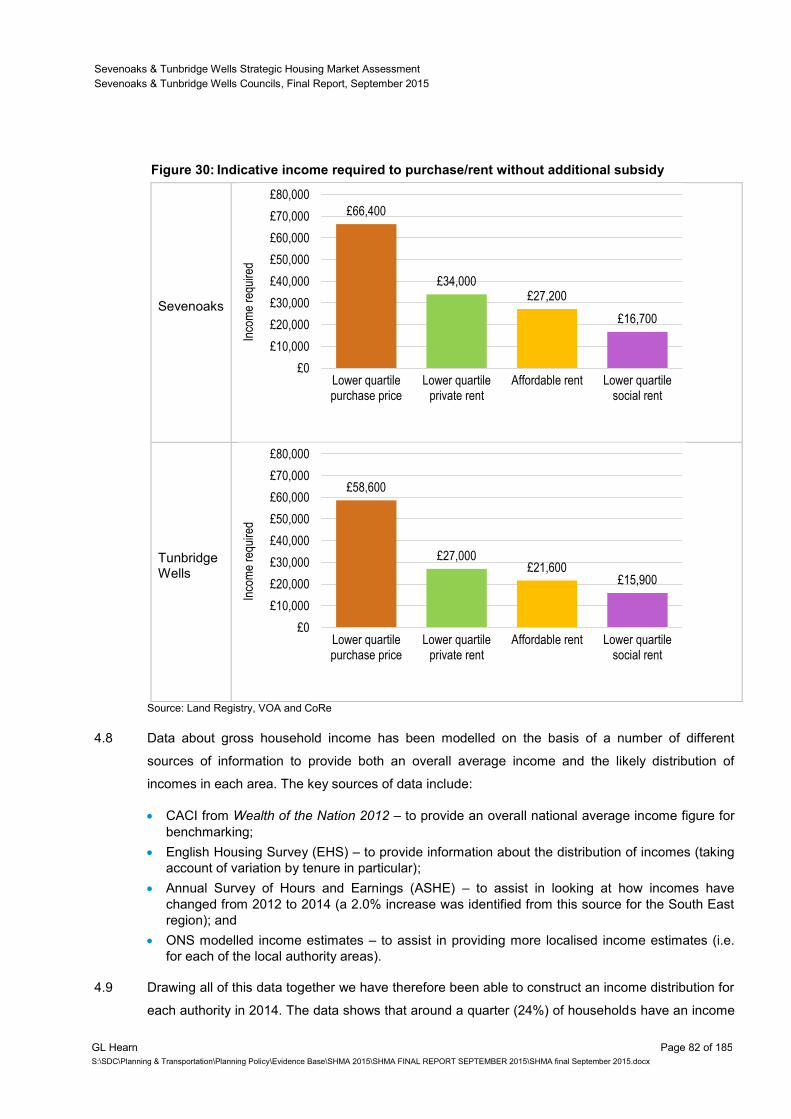
Sevenoaks & Tunbridge Wells Strategic Housing Market Assessment
Sevenoaks & Tunbridge Wells Councils, Final Report, September 2015
GL Hearn Page 82 of 185
S:\SDC\Planning & Transportation\Planning Policy\Evidence Base\SHMA 2015\SHMA FINAL REPORT SEPTEMBER 2015\SHMA final September 2015.docx
Figure 30: Indicative income required to purchase/rent without additional subsidy
Sevenoaks
Tunbridge Wells
Source: Land Registry, VOA and CoRe
4.8 Data about gross household income has been modelled on the basis of a number of different
sources of information to provide both an overall average income and the likely distribution of
incomes in each area. The key sources of data include:
CACI from Wealth of the Nation 2012 – to provide an overall national average income figure for
benchmarking;
English Housing Survey (EHS) – to provide information about the distribution of incomes (taking
account of variation by tenure in particular);
Annual Survey of Hours and Earnings (ASHE) – to assist in looking at how incomes have
changed from 2012 to 2014 (a 2.0% increase was identified from this source for the South East
region); and
ONS modelled income estimates – to assist in providing more localised income estimates (i.e.
for each of the local authority areas).
4.9 Drawing all of this data together we have therefore been able to construct an income distribution for
each authority in 2014. The data shows that around a quarter (24%) of households have an income
£66,400
£34,000 £27,200
£16,700
£0
£10,000
£20,000
£30,000
£40,000
£50,000
£60,000
£70,000
£80,000
Lower quartilepurchase price
Lower quartileprivate rent
Affordable rent Lower quartilesocial rent
Inco
me
requ
ired
£58,600
£27,000 £21,600
£15,900
£0
£10,000
£20,000
£30,000
£40,000
£50,000
£60,000
£70,000
£80,000
Lower quartilepurchase price
Lower quartileprivate rent
Affordable rent Lower quartilesocial rent
Inco
me
requ
ired
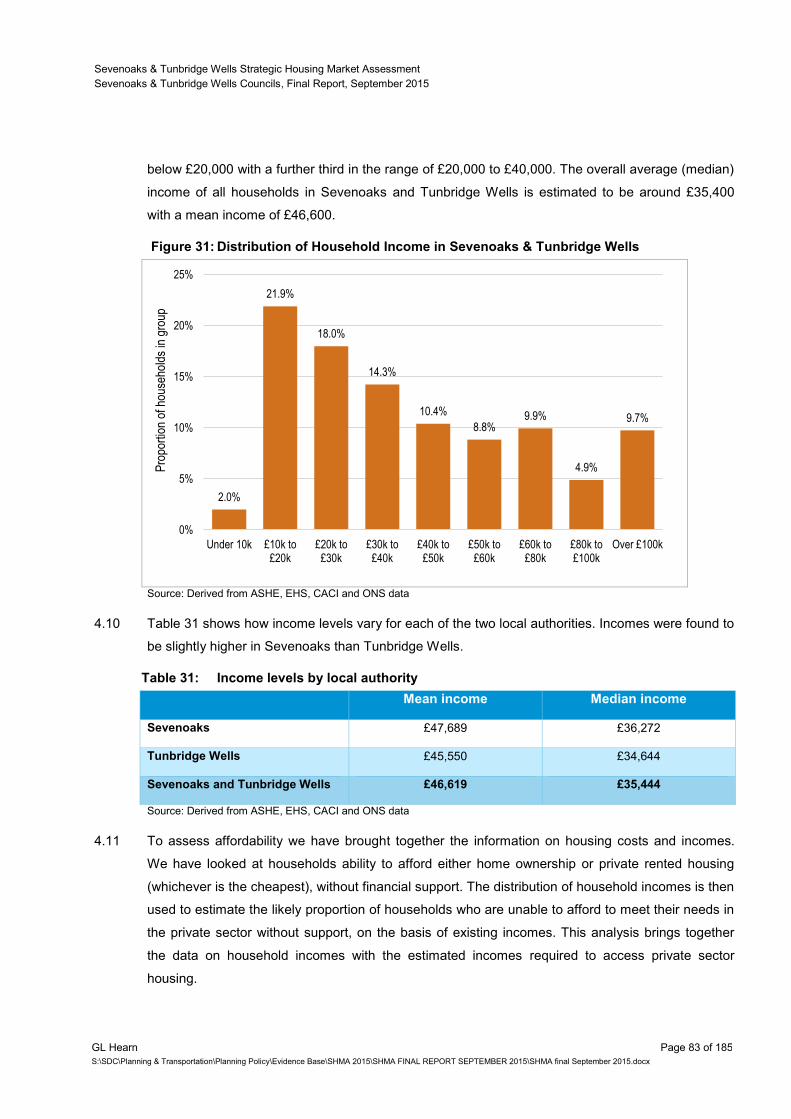
Sevenoaks & Tunbridge Wells Strategic Housing Market Assessment
Sevenoaks & Tunbridge Wells Councils, Final Report, September 2015
GL Hearn Page 83 of 185
S:\SDC\Planning & Transportation\Planning Policy\Evidence Base\SHMA 2015\SHMA FINAL REPORT SEPTEMBER 2015\SHMA final September 2015.docx
below £20,000 with a further third in the range of £20,000 to £40,000. The overall average (median)
income of all households in Sevenoaks and Tunbridge Wells is estimated to be around £35,400
with a mean income of £46,600.
Figure 31: Distribution of Household Income in Sevenoaks & Tunbridge Wells
Source: Derived from ASHE, EHS, CACI and ONS data
4.10 Table 31 shows how income levels vary for each of the two local authorities. Incomes were found to
be slightly higher in Sevenoaks than Tunbridge Wells.
Table 31: Income levels by local authority
Mean income Median income
Sevenoaks £47,689 £36,272
Tunbridge Wells £45,550 £34,644
Sevenoaks and Tunbridge Wells £46,619 £35,444
Source: Derived from ASHE, EHS, CACI and ONS data
4.11 To assess affordability we have brought together the information on housing costs and incomes.
We have looked at households ability to afford either home ownership or private rented housing
(whichever is the cheapest), without financial support. The distribution of household incomes is then
used to estimate the likely proportion of households who are unable to afford to meet their needs in
the private sector without support, on the basis of existing incomes. This analysis brings together
the data on household incomes with the estimated incomes required to access private sector
housing.
2.0%
21.9%
18.0%
14.3%
10.4%
8.8% 9.9%
4.9%
9.7%
0%
5%
10%
15%
20%
25%
Under 10k £10k to£20k
£20k to£30k
£30k to£40k
£40k to£50k
£50k to£60k
£60k to£80k
£80k to£100k
Over £100k
Pro
port
ion
of h
ouse
hold
s in
gro
up
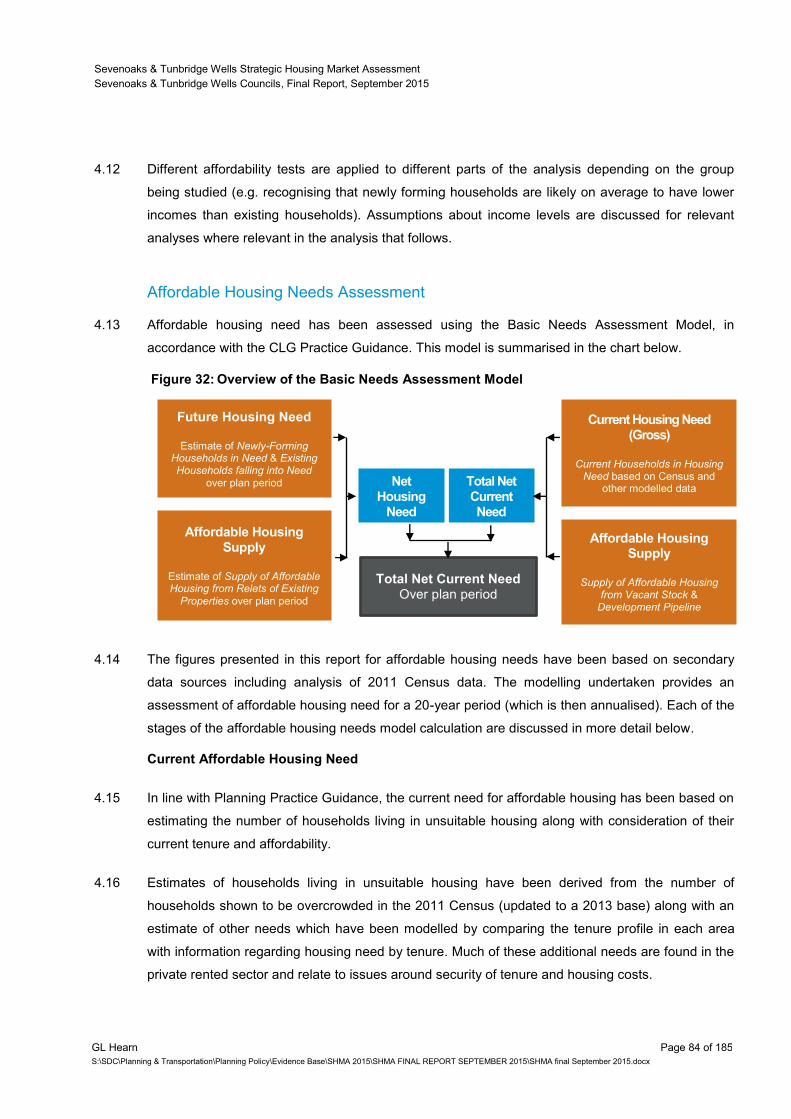
Sevenoaks & Tunbridge Wells Strategic Housing Market Assessment
Sevenoaks & Tunbridge Wells Councils, Final Report, September 2015
GL Hearn Page 84 of 185
S:\SDC\Planning & Transportation\Planning Policy\Evidence Base\SHMA 2015\SHMA FINAL REPORT SEPTEMBER 2015\SHMA final September 2015.docx
4.12 Different affordability tests are applied to different parts of the analysis depending on the group
being studied (e.g. recognising that newly forming households are likely on average to have lower
incomes than existing households). Assumptions about income levels are discussed for relevant
analyses where relevant in the analysis that follows.
Affordable Housing Needs Assessment
4.13 Affordable housing need has been assessed using the Basic Needs Assessment Model, in
accordance with the CLG Practice Guidance. This model is summarised in the chart below.
Figure 32: Overview of the Basic Needs Assessment Model
4.14 The figures presented in this report for affordable housing needs have been based on secondary
data sources including analysis of 2011 Census data. The modelling undertaken provides an
assessment of affordable housing need for a 20-year period (which is then annualised). Each of the
stages of the affordable housing needs model calculation are discussed in more detail below.
Current Affordable Housing Need
4.15 In line with Planning Practice Guidance, the current need for affordable housing has been based on
estimating the number of households living in unsuitable housing along with consideration of their
current tenure and affordability.
4.16 Estimates of households living in unsuitable housing have been derived from the number of
households shown to be overcrowded in the 2011 Census (updated to a 2013 base) along with an
estimate of other needs which have been modelled by comparing the tenure profile in each area
with information regarding housing need by tenure. Much of these additional needs are found in the
private rented sector and relate to issues around security of tenure and housing costs.
Future Housing Need
Estimate of Newly-Forming Households in Need & Existing Households falling into Need
over plan period
Affordable Housing Supply
Estimate of Supply of Affordable Housing from Relets of Existing
Properties over plan period
Affordable Housing Supply
Supply of Affordable Housing
from Vacant Stock & Development Pipeline
Current Housing Need (Gross)
Current Households in Housing
Need based on Census and other modelled data
Total Net Current Need
Net Housing
Need Arising
Total Net Current Need Over plan period
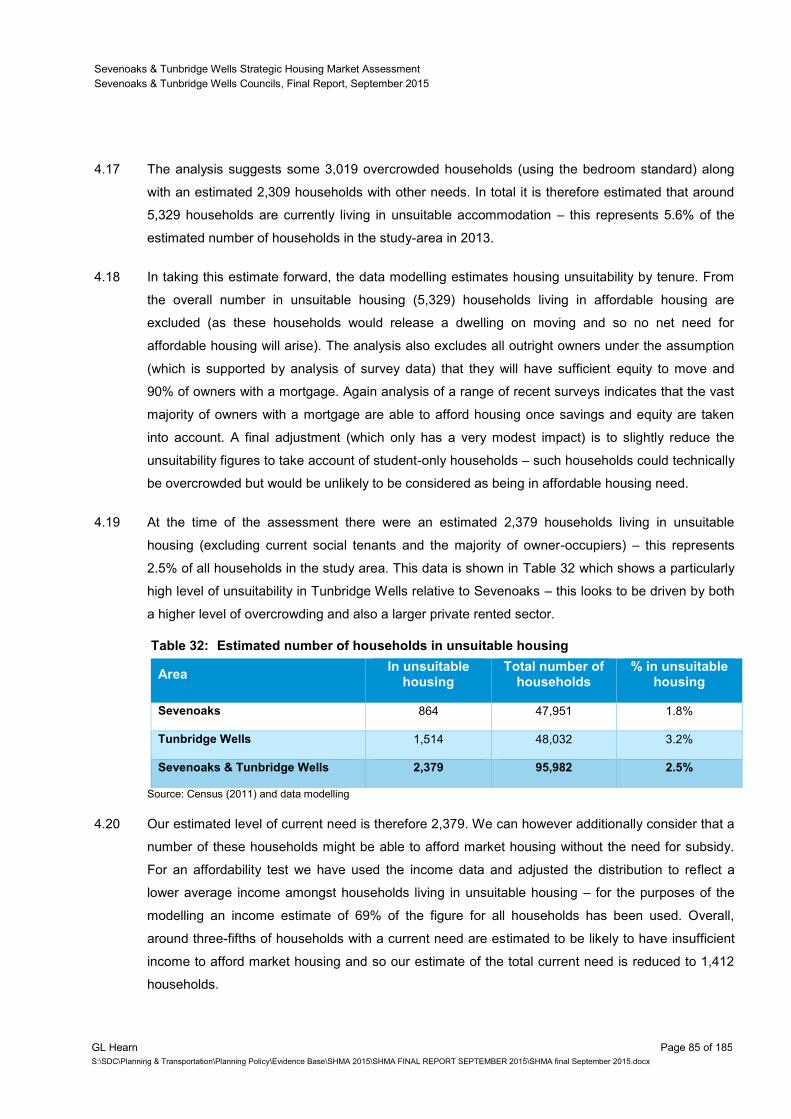
Sevenoaks & Tunbridge Wells Strategic Housing Market Assessment
Sevenoaks & Tunbridge Wells Councils, Final Report, September 2015
GL Hearn Page 85 of 185
S:\SDC\Planning & Transportation\Planning Policy\Evidence Base\SHMA 2015\SHMA FINAL REPORT SEPTEMBER 2015\SHMA final September 2015.docx
4.17 The analysis suggests some 3,019 overcrowded households (using the bedroom standard) along
with an estimated 2,309 households with other needs. In total it is therefore estimated that around
5,329 households are currently living in unsuitable accommodation – this represents 5.6% of the
estimated number of households in the study-area in 2013.
4.18 In taking this estimate forward, the data modelling estimates housing unsuitability by tenure. From
the overall number in unsuitable housing (5,329) households living in affordable housing are
excluded (as these households would release a dwelling on moving and so no net need for
affordable housing will arise). The analysis also excludes all outright owners under the assumption
(which is supported by analysis of survey data) that they will have sufficient equity to move and
90% of owners with a mortgage. Again analysis of a range of recent surveys indicates that the vast
majority of owners with a mortgage are able to afford housing once savings and equity are taken
into account. A final adjustment (which only has a very modest impact) is to slightly reduce the
unsuitability figures to take account of student-only households – such households could technically
be overcrowded but would be unlikely to be considered as being in affordable housing need.
4.19 At the time of the assessment there were an estimated 2,379 households living in unsuitable
housing (excluding current social tenants and the majority of owner-occupiers) – this represents
2.5% of all households in the study area. This data is shown in Table 32 which shows a particularly
high level of unsuitability in Tunbridge Wells relative to Sevenoaks – this looks to be driven by both
a higher level of overcrowding and also a larger private rented sector.
Table 32: Estimated number of households in unsuitable housing
Area In unsuitable
housing Total number of
households % in unsuitable
housing
Sevenoaks 864 47,951 1.8%
Tunbridge Wells 1,514 48,032 3.2%
Sevenoaks & Tunbridge Wells 2,379 95,982 2.5%
Source: Census (2011) and data modelling
4.20 Our estimated level of current need is therefore 2,379. We can however additionally consider that a
number of these households might be able to afford market housing without the need for subsidy.
For an affordability test we have used the income data and adjusted the distribution to reflect a
lower average income amongst households living in unsuitable housing – for the purposes of the
modelling an income estimate of 69% of the figure for all households has been used. Overall,
around three-fifths of households with a current need are estimated to be likely to have insufficient
income to afford market housing and so our estimate of the total current need is reduced to 1,412
households.
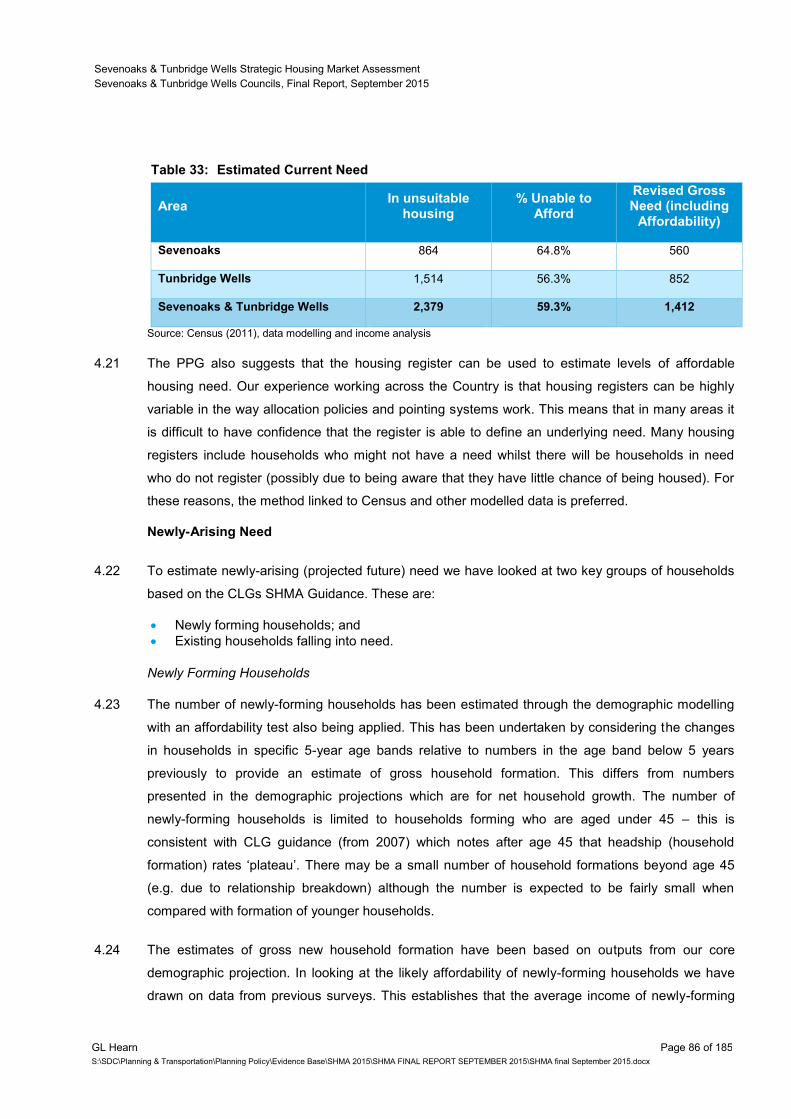
Sevenoaks & Tunbridge Wells Strategic Housing Market Assessment
Sevenoaks & Tunbridge Wells Councils, Final Report, September 2015
GL Hearn Page 86 of 185
S:\SDC\Planning & Transportation\Planning Policy\Evidence Base\SHMA 2015\SHMA FINAL REPORT SEPTEMBER 2015\SHMA final September 2015.docx
Table 33: Estimated Current Need
Area In unsuitable
housing % Unable to
Afford
Revised Gross Need (including
Affordability)
Sevenoaks 864 64.8% 560
Tunbridge Wells 1,514 56.3% 852
Sevenoaks & Tunbridge Wells 2,379 59.3% 1,412
Source: Census (2011), data modelling and income analysis
4.21 The PPG also suggests that the housing register can be used to estimate levels of affordable
housing need. Our experience working across the Country is that housing registers can be highly
variable in the way allocation policies and pointing systems work. This means that in many areas it
is difficult to have confidence that the register is able to define an underlying need. Many housing
registers include households who might not have a need whilst there will be households in need
who do not register (possibly due to being aware that they have little chance of being housed). For
these reasons, the method linked to Census and other modelled data is preferred.
Newly-Arising Need
4.22 To estimate newly-arising (projected future) need we have looked at two key groups of households
based on the CLGs SHMA Guidance. These are:
Newly forming households; and
Existing households falling into need.
Newly Forming Households
4.23 The number of newly-forming households has been estimated through the demographic modelling
with an affordability test also being applied. This has been undertaken by considering the changes
in households in specific 5-year age bands relative to numbers in the age band below 5 years
previously to provide an estimate of gross household formation. This differs from numbers
presented in the demographic projections which are for net household growth. The number of
newly-forming households is limited to households forming who are aged under 45 – this is
consistent with CLG guidance (from 2007) which notes after age 45 that headship (household
formation) rates ‘plateau’. There may be a small number of household formations beyond age 45
(e.g. due to relationship breakdown) although the number is expected to be fairly small when
compared with formation of younger households.
4.24 The estimates of gross new household formation have been based on outputs from our core
demographic projection. In looking at the likely affordability of newly-forming households we have
drawn on data from previous surveys. This establishes that the average income of newly-forming
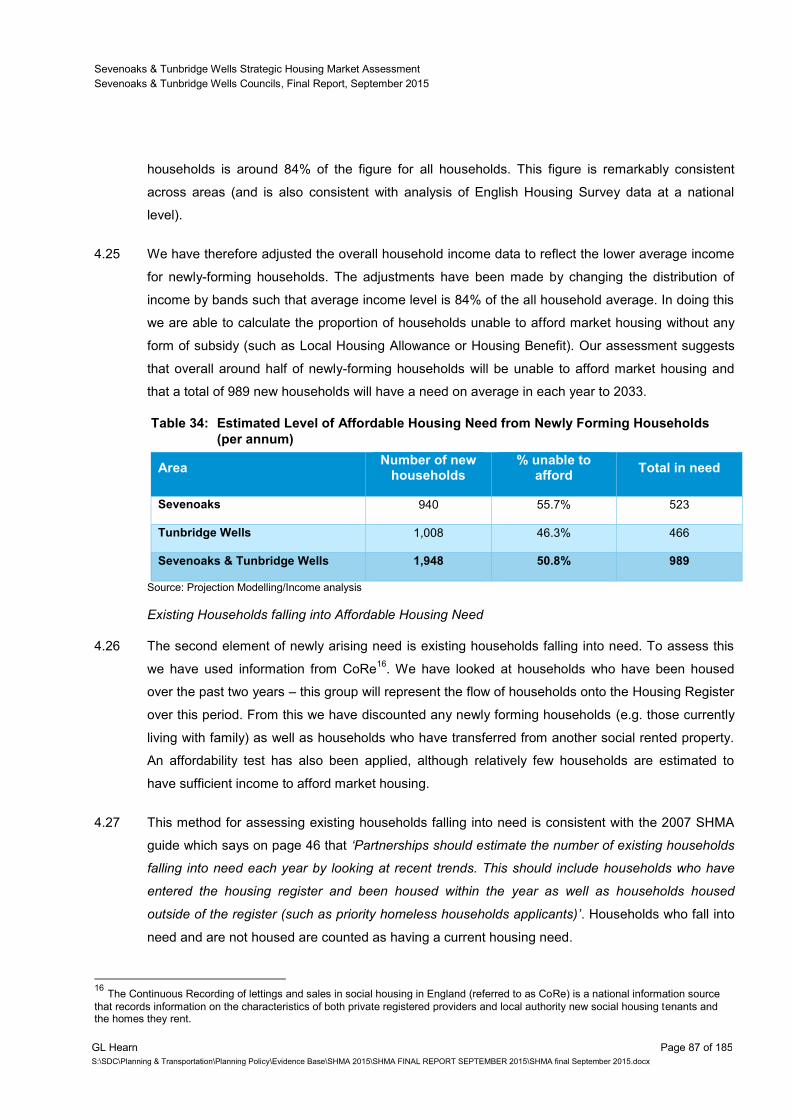
Sevenoaks & Tunbridge Wells Strategic Housing Market Assessment
Sevenoaks & Tunbridge Wells Councils, Final Report, September 2015
GL Hearn Page 87 of 185
S:\SDC\Planning & Transportation\Planning Policy\Evidence Base\SHMA 2015\SHMA FINAL REPORT SEPTEMBER 2015\SHMA final September 2015.docx
households is around 84% of the figure for all households. This figure is remarkably consistent
across areas (and is also consistent with analysis of English Housing Survey data at a national
level).
4.25 We have therefore adjusted the overall household income data to reflect the lower average income
for newly-forming households. The adjustments have been made by changing the distribution of
income by bands such that average income level is 84% of the all household average. In doing this
we are able to calculate the proportion of households unable to afford market housing without any
form of subsidy (such as Local Housing Allowance or Housing Benefit). Our assessment suggests
that overall around half of newly-forming households will be unable to afford market housing and
that a total of 989 new households will have a need on average in each year to 2033.
Table 34: Estimated Level of Affordable Housing Need from Newly Forming Households
(per annum)
Area Number of new
households % unable to
afford Total in need
Sevenoaks 940 55.7% 523
Tunbridge Wells 1,008 46.3% 466
Sevenoaks & Tunbridge Wells 1,948 50.8% 989
Source: Projection Modelling/Income analysis
Existing Households falling into Affordable Housing Need
4.26 The second element of newly arising need is existing households falling into need. To assess this
we have used information from CoRe16
. We have looked at households who have been housed
over the past two years – this group will represent the flow of households onto the Housing Register
over this period. From this we have discounted any newly forming households (e.g. those currently
living with family) as well as households who have transferred from another social rented property.
An affordability test has also been applied, although relatively few households are estimated to
have sufficient income to afford market housing.
4.27 This method for assessing existing households falling into need is consistent with the 2007 SHMA
guide which says on page 46 that ‘Partnerships should estimate the number of existing households
falling into need each year by looking at recent trends. This should include households who have
entered the housing register and been housed within the year as well as households housed
outside of the register (such as priority homeless households applicants)’. Households who fall into
need and are not housed are counted as having a current housing need.
16
The Continuous Recording of lettings and sales in social housing in England (referred to as CoRe) is a national information source
that records information on the characteristics of both private registered providers and local authority new social housing tenants and the homes they rent.
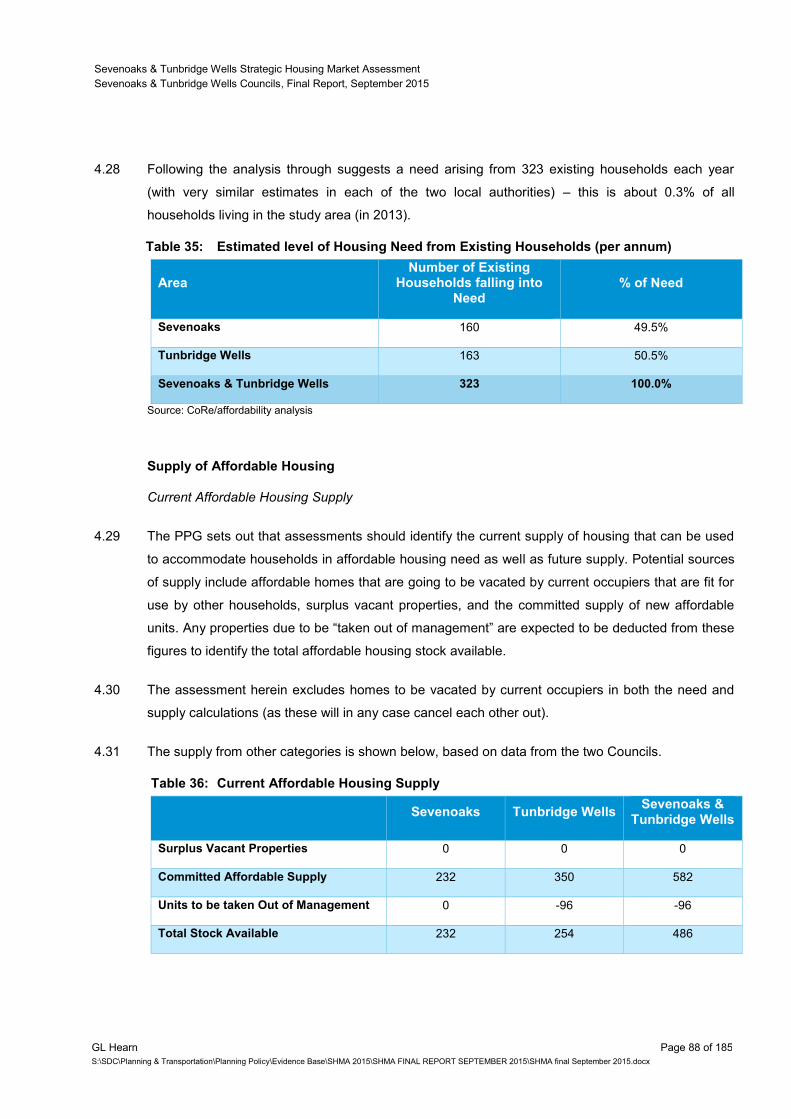
Sevenoaks & Tunbridge Wells Strategic Housing Market Assessment
Sevenoaks & Tunbridge Wells Councils, Final Report, September 2015
GL Hearn Page 88 of 185
S:\SDC\Planning & Transportation\Planning Policy\Evidence Base\SHMA 2015\SHMA FINAL REPORT SEPTEMBER 2015\SHMA final September 2015.docx
4.28 Following the analysis through suggests a need arising from 323 existing households each year
(with very similar estimates in each of the two local authorities) – this is about 0.3% of all
households living in the study area (in 2013).
Table 35: Estimated level of Housing Need from Existing Households (per annum)
Area Number of Existing
Households falling into Need
% of Need
Sevenoaks 160 49.5%
Tunbridge Wells 163 50.5%
Sevenoaks & Tunbridge Wells 323 100.0%
Source: CoRe/affordability analysis
Supply of Affordable Housing
Current Affordable Housing Supply
4.29 The PPG sets out that assessments should identify the current supply of housing that can be used
to accommodate households in affordable housing need as well as future supply. Potential sources
of supply include affordable homes that are going to be vacated by current occupiers that are fit for
use by other households, surplus vacant properties, and the committed supply of new affordable
units. Any properties due to be “taken out of management” are expected to be deducted from these
figures to identify the total affordable housing stock available.
4.30 The assessment herein excludes homes to be vacated by current occupiers in both the need and
supply calculations (as these will in any case cancel each other out).
4.31 The supply from other categories is shown below, based on data from the two Councils.
Table 36: Current Affordable Housing Supply
Sevenoaks Tunbridge Wells
Sevenoaks & Tunbridge Wells
Surplus Vacant Properties 0 0 0
Committed Affordable Supply 232 350 582
Units to be taken Out of Management 0 -96 -96
Total Stock Available 232 254 486
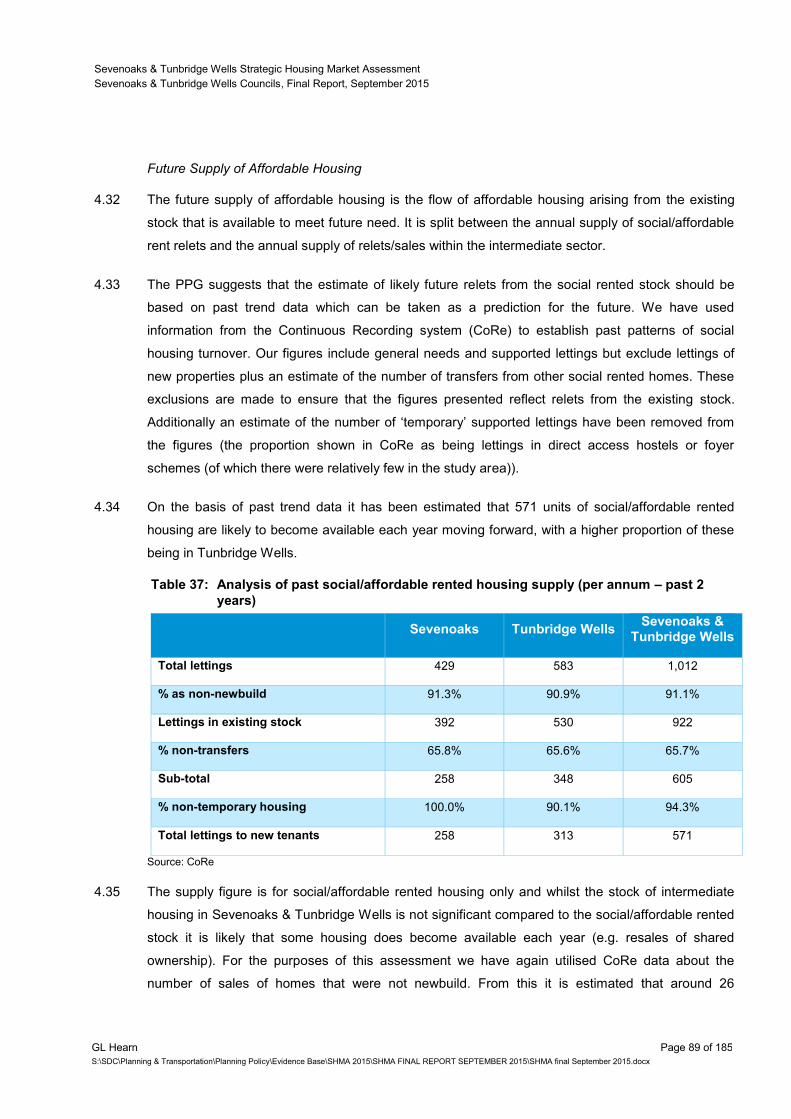
Sevenoaks & Tunbridge Wells Strategic Housing Market Assessment
Sevenoaks & Tunbridge Wells Councils, Final Report, September 2015
GL Hearn Page 89 of 185
S:\SDC\Planning & Transportation\Planning Policy\Evidence Base\SHMA 2015\SHMA FINAL REPORT SEPTEMBER 2015\SHMA final September 2015.docx
Future Supply of Affordable Housing
4.32 The future supply of affordable housing is the flow of affordable housing arising from the existing
stock that is available to meet future need. It is split between the annual supply of social/affordable
rent relets and the annual supply of relets/sales within the intermediate sector.
4.33 The PPG suggests that the estimate of likely future relets from the social rented stock should be
based on past trend data which can be taken as a prediction for the future. We have used
information from the Continuous Recording system (CoRe) to establish past patterns of social
housing turnover. Our figures include general needs and supported lettings but exclude lettings of
new properties plus an estimate of the number of transfers from other social rented homes. These
exclusions are made to ensure that the figures presented reflect relets from the existing stock.
Additionally an estimate of the number of ‘temporary’ supported lettings have been removed from
the figures (the proportion shown in CoRe as being lettings in direct access hostels or foyer
schemes (of which there were relatively few in the study area)).
4.34 On the basis of past trend data it has been estimated that 571 units of social/affordable rented
housing are likely to become available each year moving forward, with a higher proportion of these
being in Tunbridge Wells.
Table 37: Analysis of past social/affordable rented housing supply (per annum – past 2
years)
Sevenoaks Tunbridge Wells Sevenoaks &
Tunbridge Wells
Total lettings 429 583 1,012
% as non-newbuild 91.3% 90.9% 91.1%
Lettings in existing stock 392 530 922
% non-transfers 65.8% 65.6% 65.7%
Sub-total 258 348 605
% non-temporary housing 100.0% 90.1% 94.3%
Total lettings to new tenants 258 313 571
Source: CoRe
4.35 The supply figure is for social/affordable rented housing only and whilst the stock of intermediate
housing in Sevenoaks & Tunbridge Wells is not significant compared to the social/affordable rented
stock it is likely that some housing does become available each year (e.g. resales of shared
ownership). For the purposes of this assessment we have again utilised CoRe data about the
number of sales of homes that were not newbuild. From this it is estimated that around 26
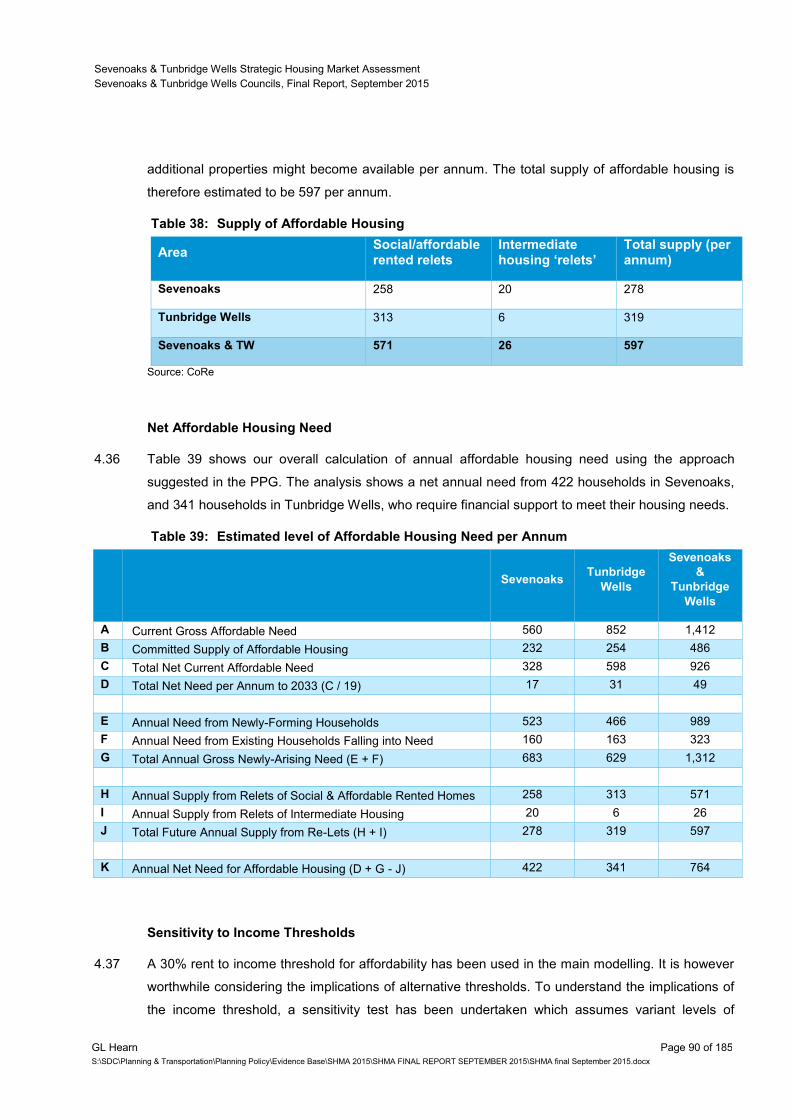
Sevenoaks & Tunbridge Wells Strategic Housing Market Assessment
Sevenoaks & Tunbridge Wells Councils, Final Report, September 2015
GL Hearn Page 90 of 185
S:\SDC\Planning & Transportation\Planning Policy\Evidence Base\SHMA 2015\SHMA FINAL REPORT SEPTEMBER 2015\SHMA final September 2015.docx
additional properties might become available per annum. The total supply of affordable housing is
therefore estimated to be 597 per annum.
Table 38: Supply of Affordable Housing
Area Social/affordable rented relets
Intermediate housing ‘relets’
Total supply (per annum)
Sevenoaks 258 20 278
Tunbridge Wells 313 6 319
Sevenoaks & TW 571 26 597
Source: CoRe
Net Affordable Housing Need
4.36 Table 39 shows our overall calculation of annual affordable housing need using the approach
suggested in the PPG. The analysis shows a net annual need from 422 households in Sevenoaks,
and 341 households in Tunbridge Wells, who require financial support to meet their housing needs.
Table 39: Estimated level of Affordable Housing Need per Annum
Sevenoaks Tunbridge
Wells
Sevenoaks
&
Tunbridge
Wells
A Current Gross Affordable Need 560 852 1,412
B Committed Supply of Affordable Housing 232 254 486
C Total Net Current Affordable Need 328 598 926
D Total Net Need per Annum to 2033 (C / 19) 17 31 49
E Annual Need from Newly-Forming Households 523 466 989
F Annual Need from Existing Households Falling into Need 160 163 323
G Total Annual Gross Newly-Arising Need (E + F) 683 629 1,312
H Annual Supply from Relets of Social & Affordable Rented Homes 258 313 571
I Annual Supply from Relets of Intermediate Housing 20 6 26
J Total Future Annual Supply from Re-Lets (H + I) 278 319 597
K Annual Net Need for Affordable Housing (D + G - J) 422 341 764
Sensitivity to Income Thresholds
4.37 A 30% rent to income threshold for affordability has been used in the main modelling. It is however
worthwhile considering the implications of alternative thresholds. To understand the implications of
the income threshold, a sensitivity test has been undertaken which assumes variant levels of
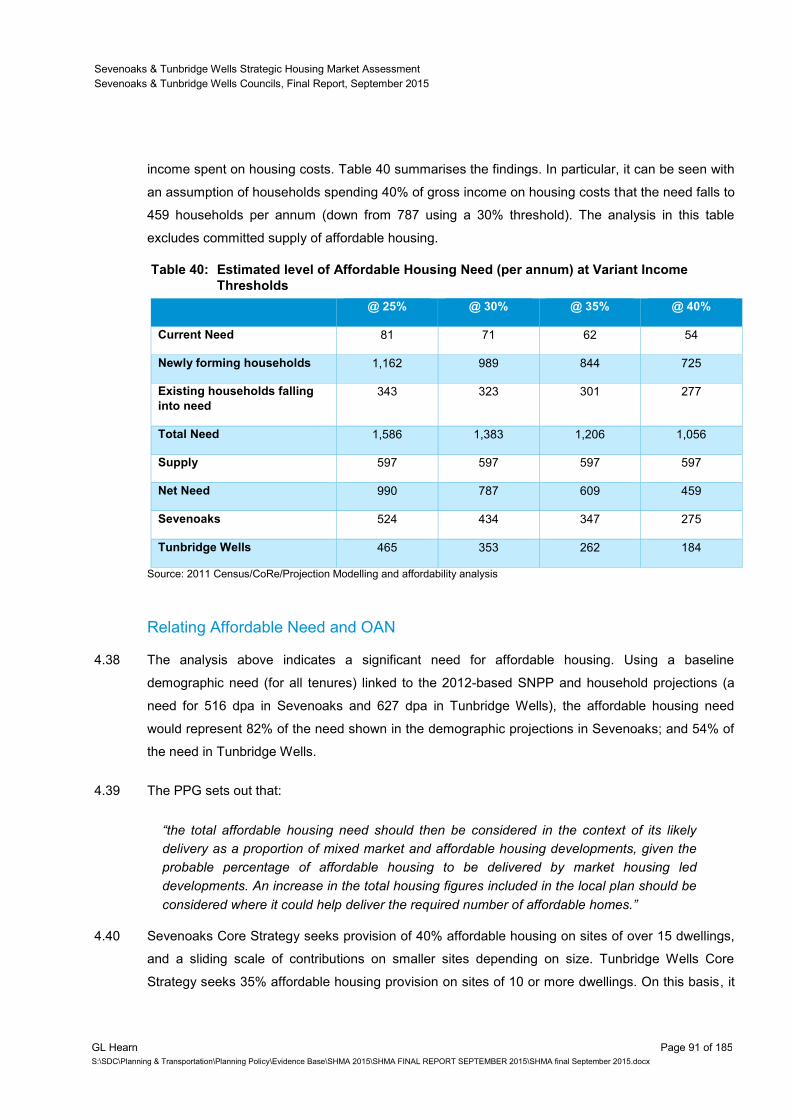
Sevenoaks & Tunbridge Wells Strategic Housing Market Assessment
Sevenoaks & Tunbridge Wells Councils, Final Report, September 2015
GL Hearn Page 91 of 185
S:\SDC\Planning & Transportation\Planning Policy\Evidence Base\SHMA 2015\SHMA FINAL REPORT SEPTEMBER 2015\SHMA final September 2015.docx
income spent on housing costs. Table 40 summarises the findings. In particular, it can be seen with
an assumption of households spending 40% of gross income on housing costs that the need falls to
459 households per annum (down from 787 using a 30% threshold). The analysis in this table
excludes committed supply of affordable housing.
Table 40: Estimated level of Affordable Housing Need (per annum) at Variant Income
Thresholds
@ 25% @ 30% @ 35% @ 40%
Current Need 81 71 62 54
Newly forming households 1,162 989 844 725
Existing households falling
into need
343 323 301 277
Total Need 1,586 1,383 1,206 1,056
Supply 597 597 597 597
Net Need 990 787 609 459
Sevenoaks 524 434 347 275
Tunbridge Wells 465 353 262 184
Source: 2011 Census/CoRe/Projection Modelling and affordability analysis
Relating Affordable Need and OAN
4.38 The analysis above indicates a significant need for affordable housing. Using a baseline
demographic need (for all tenures) linked to the 2012-based SNPP and household projections (a
need for 516 dpa in Sevenoaks and 627 dpa in Tunbridge Wells), the affordable housing need
would represent 82% of the need shown in the demographic projections in Sevenoaks; and 54% of
the need in Tunbridge Wells.
4.39 The PPG sets out that:
“the total affordable housing need should then be considered in the context of its likely
delivery as a proportion of mixed market and affordable housing developments, given the
probable percentage of affordable housing to be delivered by market housing led
developments. An increase in the total housing figures included in the local plan should be
considered where it could help deliver the required number of affordable homes.”
4.40 Sevenoaks Core Strategy seeks provision of 40% affordable housing on sites of over 15 dwellings,
and a sliding scale of contributions on smaller sites depending on size. Tunbridge Wells Core
Strategy seeks 35% affordable housing provision on sites of 10 or more dwellings. On this basis, it
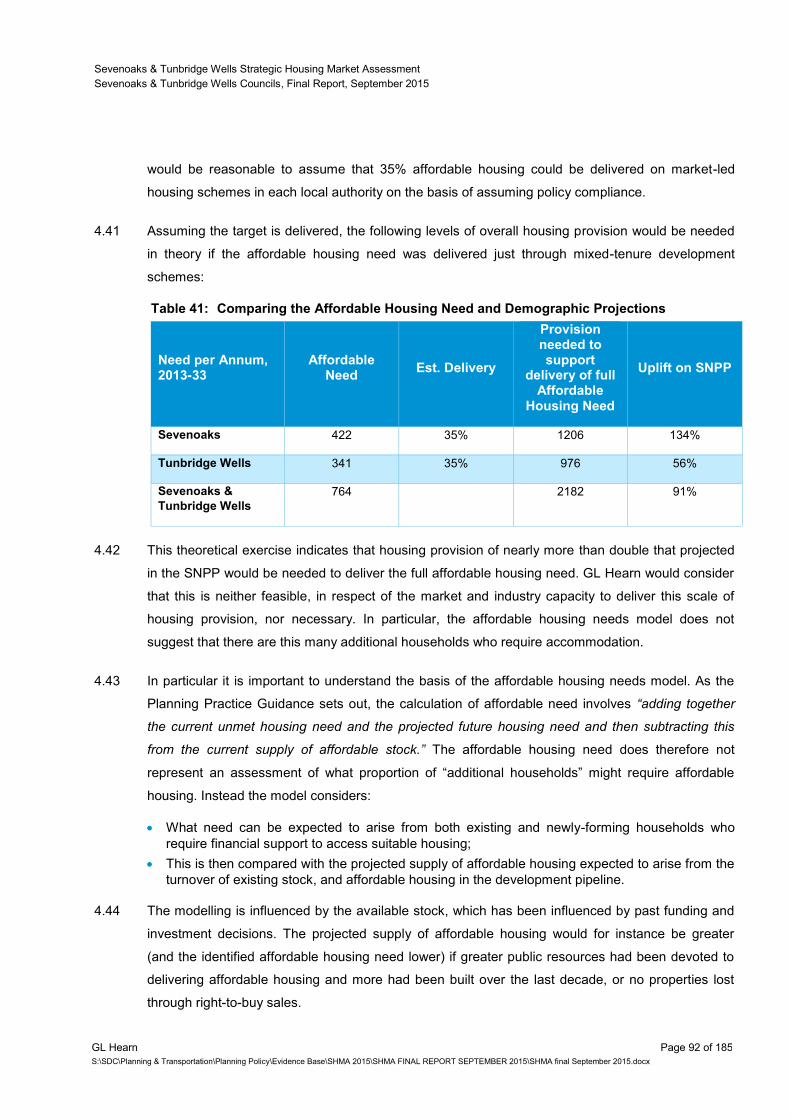
Sevenoaks & Tunbridge Wells Strategic Housing Market Assessment
Sevenoaks & Tunbridge Wells Councils, Final Report, September 2015
GL Hearn Page 92 of 185
S:\SDC\Planning & Transportation\Planning Policy\Evidence Base\SHMA 2015\SHMA FINAL REPORT SEPTEMBER 2015\SHMA final September 2015.docx
would be reasonable to assume that 35% affordable housing could be delivered on market-led
housing schemes in each local authority on the basis of assuming policy compliance.
4.41 Assuming the target is delivered, the following levels of overall housing provision would be needed
in theory if the affordable housing need was delivered just through mixed-tenure development
schemes:
Table 41: Comparing the Affordable Housing Need and Demographic Projections
Need per Annum, 2013-33
Affordable Need
Est. Delivery
Provision needed to support
delivery of full Affordable
Housing Need
Uplift on SNPP
Sevenoaks 422 35% 1206 134%
Tunbridge Wells 341 35% 976 56%
Sevenoaks &
Tunbridge Wells
764 2182 91%
4.42 This theoretical exercise indicates that housing provision of nearly more than double that projected
in the SNPP would be needed to deliver the full affordable housing need. GL Hearn would consider
that this is neither feasible, in respect of the market and industry capacity to deliver this scale of
housing provision, nor necessary. In particular, the affordable housing needs model does not
suggest that there are this many additional households who require accommodation.
4.43 In particular it is important to understand the basis of the affordable housing needs model. As the
Planning Practice Guidance sets out, the calculation of affordable need involves “adding together
the current unmet housing need and the projected future housing need and then subtracting this
from the current supply of affordable stock.” The affordable housing need does therefore not
represent an assessment of what proportion of “additional households” might require affordable
housing. Instead the model considers:
What need can be expected to arise from both existing and newly-forming households who
require financial support to access suitable housing;
This is then compared with the projected supply of affordable housing expected to arise from the
turnover of existing stock, and affordable housing in the development pipeline.
4.44 The modelling is influenced by the available stock, which has been influenced by past funding and
investment decisions. The projected supply of affordable housing would for instance be greater
(and the identified affordable housing need lower) if greater public resources had been devoted to
delivering affordable housing and more had been built over the last decade, or no properties lost
through right-to-buy sales.
Sevenoaks & Tunbridge Wells Strategic Housing Market Assessment
Sevenoaks & Tunbridge Wells Councils, Final Report, September 2015
GL Hearn Page 93 of 185
S:\SDC\Planning & Transportation\Planning Policy\Evidence Base\SHMA 2015\SHMA FINAL REPORT SEPTEMBER 2015\SHMA final September 2015.docx
4.45 The model also looks at needs arising from both new households and existing households. Part of
the needs included are from households who might require an additional home, such as:
Newly-forming households;
Those in temporary accommodation;
Concealed households; and
Homeless households.
4.46 But the figures also include needs arising from households who will require a different form of home,
but who – by moving to another property – would release an existing property for another
household. These households do not generate a need for more dwellings overall. They include
households who need to move as they are:
Overcrowded;
Coming to the end of a tenancy;
Living in unsuitable housing; or
Cannot afford to remain in their current home.
4.47 These elements of the affordable housing need are not directly relevant to considering overall
housing need and housing targets (which are typically measured in terms of net dwellings). On this
basis the annual delivery to meet full need in Table 41 will over-estimate the scale of overall need
for market and affordable housing.
4.48 A need for net additions to the overall housing stock could arise from newly-forming households,
concealed households and homeless households/ those in temporary accommodation. The need
arising from newly-forming households is calculated from the demographic projections. Any
additional need (over and above the demographic projections) would thus potentially come from
concealed and homeless households – although these cannot simply be “added on” to the
demographically-assessed need, as for instance modelled improvements in the projections in
household formation rates would reduce levels of concealed households. To address the needs
from concealed and homeless households, it may however be appropriate to consider adjustments
to household formation rates – particularly for younger households. We consider these issues
further in the next section.
4.49 We would also point out that delivery of affordable housing through market-led development
schemes (for instance as secured through Section 106 Agreements) shouldn’t be considered in
isolation from other mechanisms for increasing affordable housing supply. There are a range of
other mechanisms which deliver affordable housing, including:
Schemes brought forward by Registered Providers – including those funded through the HCA’s
Affordable Housing Programme;
Building Council Homes – following reform of the HRA funding system, Councils can bring
forward affordable housing themselves;
Sevenoaks & Tunbridge Wells Strategic Housing Market Assessment
Sevenoaks & Tunbridge Wells Councils, Final Report, September 2015
GL Hearn Page 94 of 185
S:\SDC\Planning & Transportation\Planning Policy\Evidence Base\SHMA 2015\SHMA FINAL REPORT SEPTEMBER 2015\SHMA final September 2015.docx
Empty Homes Programmes – where local authorities can bring properties back into use as
affordable housing;
Rural Exception Site Development – where the emphasis is on delivering affordable housing to
meet local needs.
4.50 Funding for specialist forms of affordable housing, such as extra care provision, may also be
available from other sources; whilst other niche agents, such as Community Land Trusts, may
deliver new affordable housing. Government in December 2014 also announced a Starter Homes
Initiative providing support for first-time buyers to get onto the housing market. Councils are also
able to bring empty properties back into use as affordable housing, and Government funding is
available to support this.
Need for Different Types of Affordable Housing
4.51 Having studied housing costs, incomes and affordable housing need the next step is to make an
estimate of the proportion of affordable housing need that should be met through provision of
different housing products. We therefore use the income information presented earlier in this
section to estimate the proportion of households who are likely to be able to afford intermediate
housing and the number for whom only social or affordable rented housing will be affordable. There
are three main types of affordable housing that can be studied in this analysis:
Intermediate
Affordable rent
Social rent
4.52 Whilst the process of separating households into different income bands for analytical purposes is
quite straightforward, this does not necessarily tell us what sort of affordable housing they might be
able to afford or occupy.
4.53 For example a household with an income close to being able to afford market housing might be
able to afford intermediate or affordable rent but may be prevented from accessing certain
intermediate products (such as shared ownership) as they have insufficient savings to cover a
deposit. Such a household might therefore be allocated to affordable rented or intermediate rented
housing as the most suitable solution. However we would expect that few Registered Providers
would build intermediate rented homes, given that the level of potential occupants for affordable
rented homes is greater (as it includes households who could claim housing benefit to supplement
their incomes).
4.54 The distinction between social and affordable rented housing is also complex. Whilst rents for
affordable rented housing would be expected to be higher than social rents, this does not
necessarily mean that such a product would be reserved for households with a higher income. In
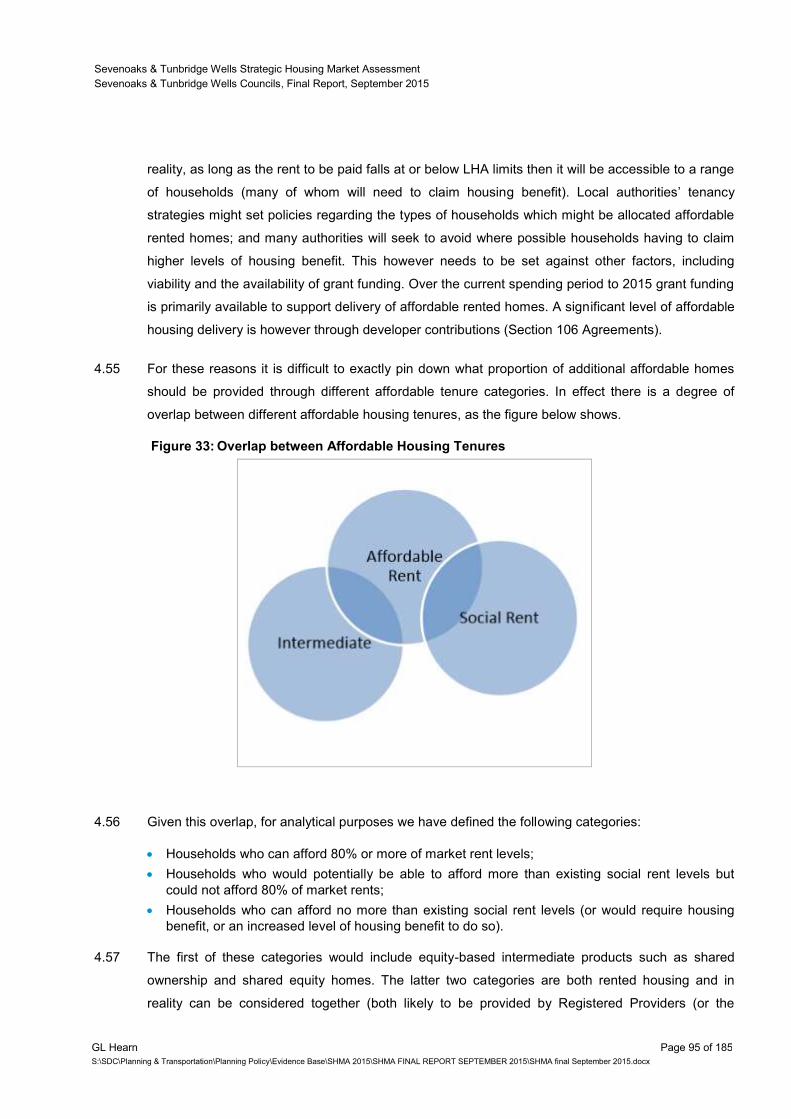
Sevenoaks & Tunbridge Wells Strategic Housing Market Assessment
Sevenoaks & Tunbridge Wells Councils, Final Report, September 2015
GL Hearn Page 95 of 185
S:\SDC\Planning & Transportation\Planning Policy\Evidence Base\SHMA 2015\SHMA FINAL REPORT SEPTEMBER 2015\SHMA final September 2015.docx
reality, as long as the rent to be paid falls at or below LHA limits then it will be accessible to a range
of households (many of whom will need to claim housing benefit). Local authorities’ tenancy
strategies might set policies regarding the types of households which might be allocated affordable
rented homes; and many authorities will seek to avoid where possible households having to claim
higher levels of housing benefit. This however needs to be set against other factors, including
viability and the availability of grant funding. Over the current spending period to 2015 grant funding
is primarily available to support delivery of affordable rented homes. A significant level of affordable
housing delivery is however through developer contributions (Section 106 Agreements).
4.55 For these reasons it is difficult to exactly pin down what proportion of additional affordable homes
should be provided through different affordable tenure categories. In effect there is a degree of
overlap between different affordable housing tenures, as the figure below shows.
Figure 33: Overlap between Affordable Housing Tenures
4.56 Given this overlap, for analytical purposes we have defined the following categories:
Households who can afford 80% or more of market rent levels;
Households who would potentially be able to afford more than existing social rent levels but
could not afford 80% of market rents;
Households who can afford no more than existing social rent levels (or would require housing
benefit, or an increased level of housing benefit to do so).
4.57 The first of these categories would include equity-based intermediate products such as shared
ownership and shared equity homes. The latter two categories are both rented housing and in
reality can be considered together (both likely to be provided by Registered Providers (or the
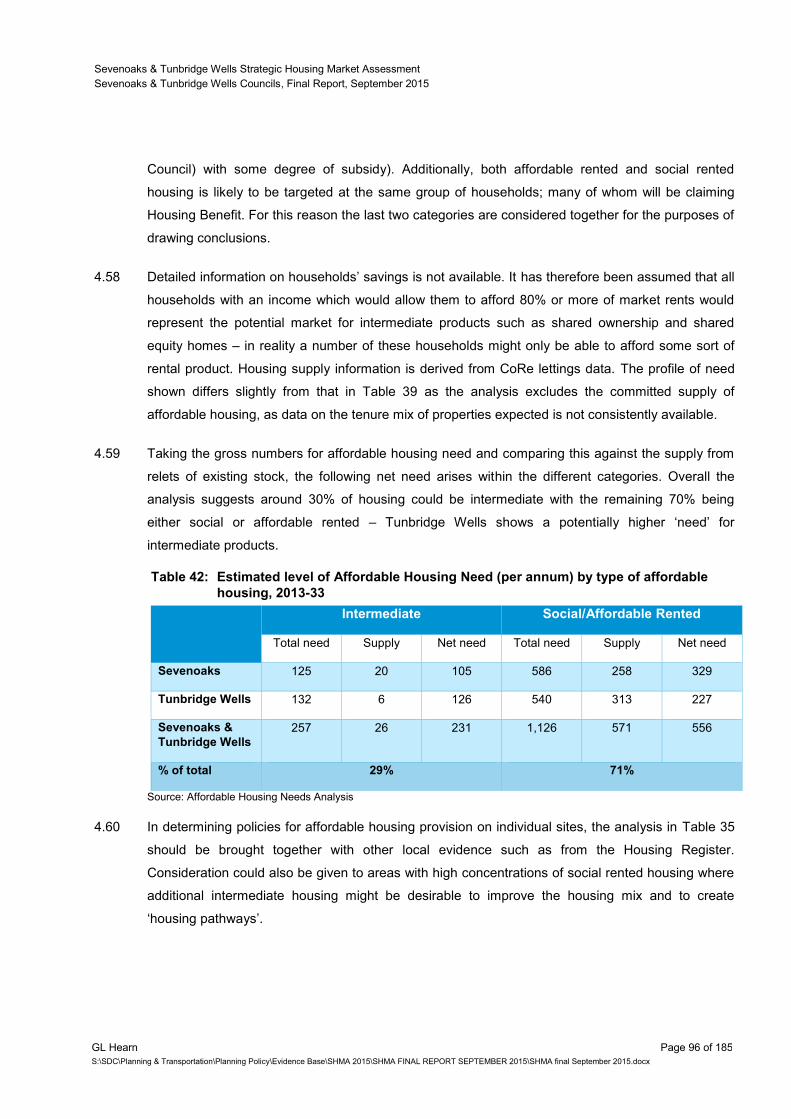
Sevenoaks & Tunbridge Wells Strategic Housing Market Assessment
Sevenoaks & Tunbridge Wells Councils, Final Report, September 2015
GL Hearn Page 96 of 185
S:\SDC\Planning & Transportation\Planning Policy\Evidence Base\SHMA 2015\SHMA FINAL REPORT SEPTEMBER 2015\SHMA final September 2015.docx
Council) with some degree of subsidy). Additionally, both affordable rented and social rented
housing is likely to be targeted at the same group of households; many of whom will be claiming
Housing Benefit. For this reason the last two categories are considered together for the purposes of
drawing conclusions.
4.58 Detailed information on households’ savings is not available. It has therefore been assumed that all
households with an income which would allow them to afford 80% or more of market rents would
represent the potential market for intermediate products such as shared ownership and shared
equity homes – in reality a number of these households might only be able to afford some sort of
rental product. Housing supply information is derived from CoRe lettings data. The profile of need
shown differs slightly from that in Table 39 as the analysis excludes the committed supply of
affordable housing, as data on the tenure mix of properties expected is not consistently available.
4.59 Taking the gross numbers for affordable housing need and comparing this against the supply from
relets of existing stock, the following net need arises within the different categories. Overall the
analysis suggests around 30% of housing could be intermediate with the remaining 70% being
either social or affordable rented – Tunbridge Wells shows a potentially higher ‘need’ for
intermediate products.
Table 42: Estimated level of Affordable Housing Need (per annum) by type of affordable
housing, 2013-33
Intermediate Social/Affordable Rented
Total need Supply Net need Total need Supply Net need
Sevenoaks 125 20 105 586 258 329
Tunbridge Wells 132 6 126 540 313 227
Sevenoaks &
Tunbridge Wells
257 26 231 1,126 571 556
% of total 29% 71%
Source: Affordable Housing Needs Analysis
4.60 In determining policies for affordable housing provision on individual sites, the analysis in Table 35
should be brought together with other local evidence such as from the Housing Register.
Consideration could also be given to areas with high concentrations of social rented housing where
additional intermediate housing might be desirable to improve the housing mix and to create
‘housing pathways’.
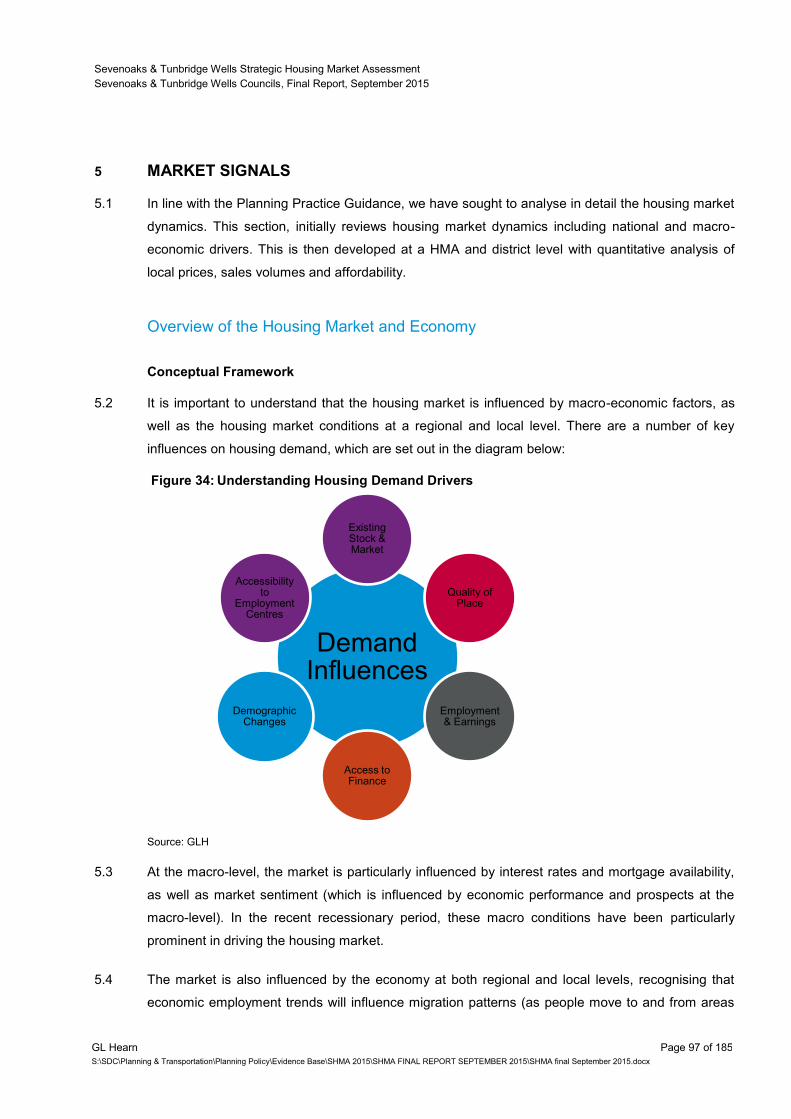
Sevenoaks & Tunbridge Wells Strategic Housing Market Assessment
Sevenoaks & Tunbridge Wells Councils, Final Report, September 2015
GL Hearn Page 97 of 185
S:\SDC\Planning & Transportation\Planning Policy\Evidence Base\SHMA 2015\SHMA FINAL REPORT SEPTEMBER 2015\SHMA final September 2015.docx
5 MARKET SIGNALS
5.1 In line with the Planning Practice Guidance, we have sought to analyse in detail the housing market
dynamics. This section, initially reviews housing market dynamics including national and macro-
economic drivers. This is then developed at a HMA and district level with quantitative analysis of
local prices, sales volumes and affordability.
Overview of the Housing Market and Economy
Conceptual Framework
5.2 It is important to understand that the housing market is influenced by macro-economic factors, as
well as the housing market conditions at a regional and local level. There are a number of key
influences on housing demand, which are set out in the diagram below:
Figure 34: Understanding Housing Demand Drivers
Source: GLH
5.3 At the macro-level, the market is particularly influenced by interest rates and mortgage availability,
as well as market sentiment (which is influenced by economic performance and prospects at the
macro-level). In the recent recessionary period, these macro conditions have been particularly
prominent in driving the housing market.
5.4 The market is also influenced by the economy at both regional and local levels, recognising that
economic employment trends will influence migration patterns (as people move to and from areas
Demand Influences
Existing Stock & Market
Quality of Place
Employment & Earnings
Access to Finance
Demographic Changes
Accessibility to
Employment Centres
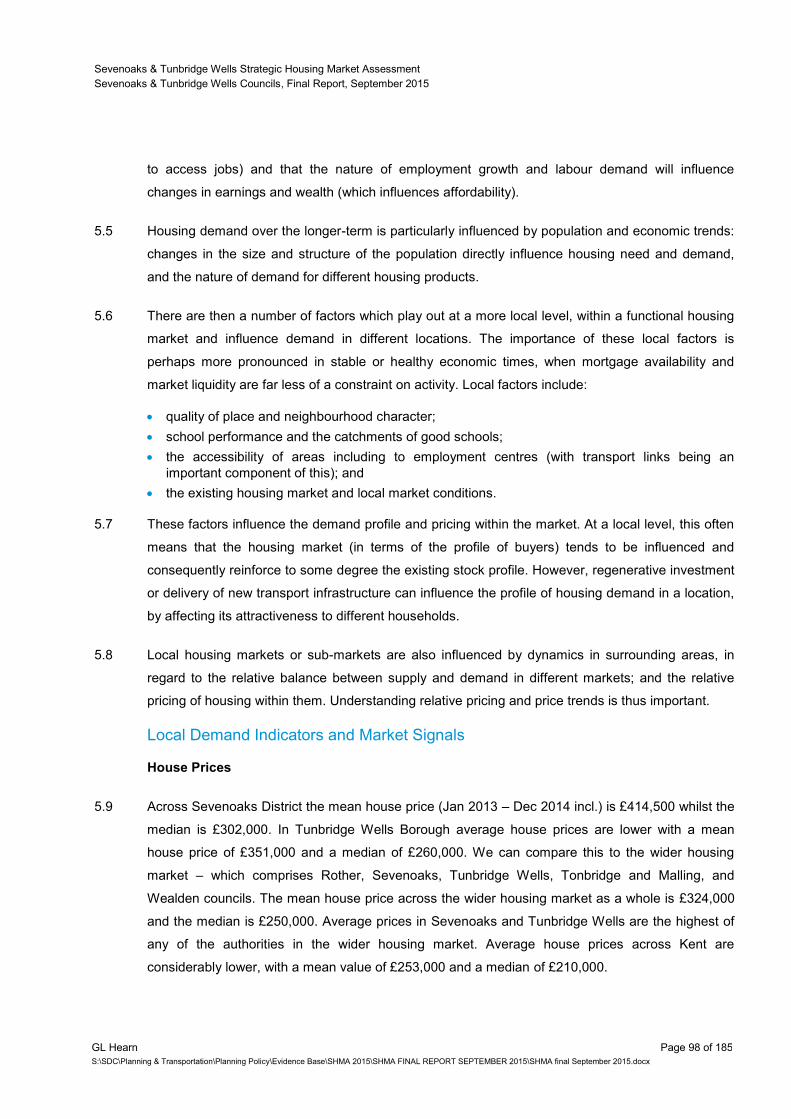
Sevenoaks & Tunbridge Wells Strategic Housing Market Assessment
Sevenoaks & Tunbridge Wells Councils, Final Report, September 2015
GL Hearn Page 98 of 185
S:\SDC\Planning & Transportation\Planning Policy\Evidence Base\SHMA 2015\SHMA FINAL REPORT SEPTEMBER 2015\SHMA final September 2015.docx
to access jobs) and that the nature of employment growth and labour demand will influence
changes in earnings and wealth (which influences affordability).
5.5 Housing demand over the longer-term is particularly influenced by population and economic trends:
changes in the size and structure of the population directly influence housing need and demand,
and the nature of demand for different housing products.
5.6 There are then a number of factors which play out at a more local level, within a functional housing
market and influence demand in different locations. The importance of these local factors is
perhaps more pronounced in stable or healthy economic times, when mortgage availability and
market liquidity are far less of a constraint on activity. Local factors include:
quality of place and neighbourhood character;
school performance and the catchments of good schools;
the accessibility of areas including to employment centres (with transport links being an
important component of this); and
the existing housing market and local market conditions.
5.7 These factors influence the demand profile and pricing within the market. At a local level, this often
means that the housing market (in terms of the profile of buyers) tends to be influenced and
consequently reinforce to some degree the existing stock profile. However, regenerative investment
or delivery of new transport infrastructure can influence the profile of housing demand in a location,
by affecting its attractiveness to different households.
5.8 Local housing markets or sub-markets are also influenced by dynamics in surrounding areas, in
regard to the relative balance between supply and demand in different markets; and the relative
pricing of housing within them. Understanding relative pricing and price trends is thus important.
Local Demand Indicators and Market Signals
House Prices
5.9 Across Sevenoaks District the mean house price (Jan 2013 – Dec 2014 incl.) is £414,500 whilst the
median is £302,000. In Tunbridge Wells Borough average house prices are lower with a mean
house price of £351,000 and a median of £260,000. We can compare this to the wider housing
market – which comprises Rother, Sevenoaks, Tunbridge Wells, Tonbridge and Malling, and
Wealden councils. The mean house price across the wider housing market as a whole is £324,000
and the median is £250,000. Average prices in Sevenoaks and Tunbridge Wells are the highest of
any of the authorities in the wider housing market. Average house prices across Kent are
considerably lower, with a mean value of £253,000 and a median of £210,000.
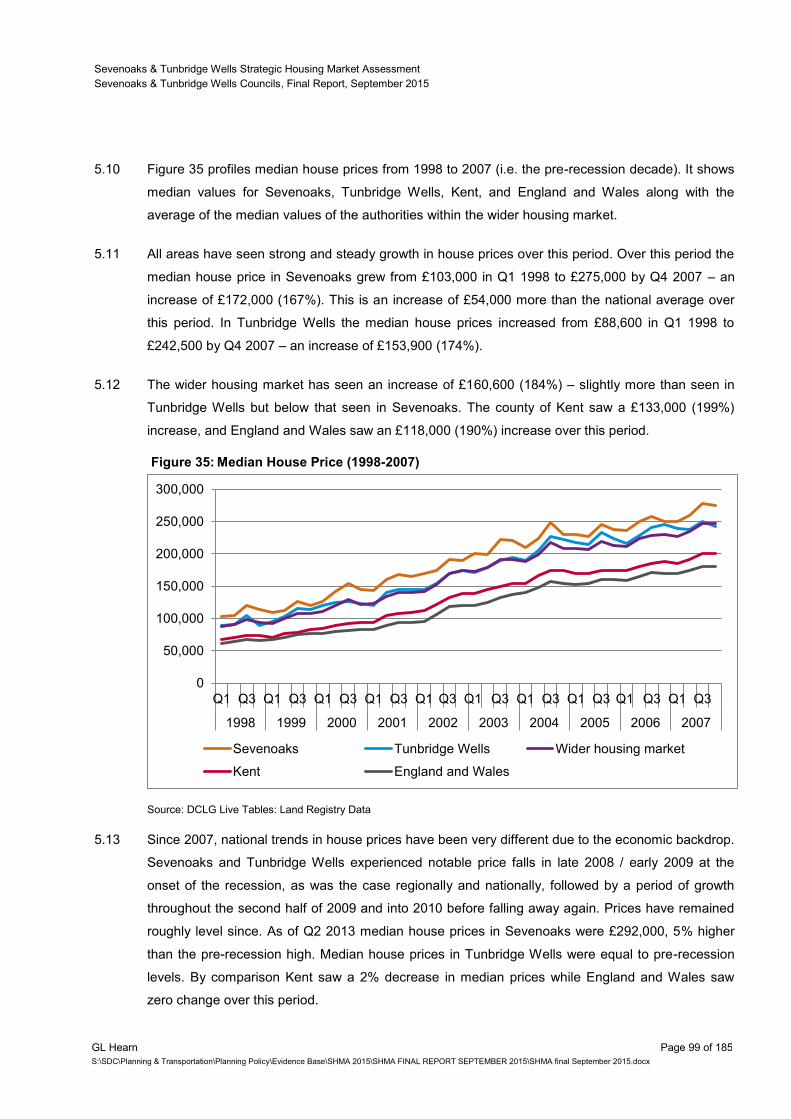
Sevenoaks & Tunbridge Wells Strategic Housing Market Assessment
Sevenoaks & Tunbridge Wells Councils, Final Report, September 2015
GL Hearn Page 99 of 185
S:\SDC\Planning & Transportation\Planning Policy\Evidence Base\SHMA 2015\SHMA FINAL REPORT SEPTEMBER 2015\SHMA final September 2015.docx
5.10 Figure 35 profiles median house prices from 1998 to 2007 (i.e. the pre-recession decade). It shows
median values for Sevenoaks, Tunbridge Wells, Kent, and England and Wales along with the
average of the median values of the authorities within the wider housing market.
5.11 All areas have seen strong and steady growth in house prices over this period. Over this period the
median house price in Sevenoaks grew from £103,000 in Q1 1998 to £275,000 by Q4 2007 – an
increase of £172,000 (167%). This is an increase of £54,000 more than the national average over
this period. In Tunbridge Wells the median house prices increased from £88,600 in Q1 1998 to
£242,500 by Q4 2007 – an increase of £153,900 (174%).
5.12 The wider housing market has seen an increase of £160,600 (184%) – slightly more than seen in
Tunbridge Wells but below that seen in Sevenoaks. The county of Kent saw a £133,000 (199%)
increase, and England and Wales saw an £118,000 (190%) increase over this period.
Figure 35: Median House Price (1998-2007)
Source: DCLG Live Tables: Land Registry Data
5.13 Since 2007, national trends in house prices have been very different due to the economic backdrop.
Sevenoaks and Tunbridge Wells experienced notable price falls in late 2008 / early 2009 at the
onset of the recession, as was the case regionally and nationally, followed by a period of growth
throughout the second half of 2009 and into 2010 before falling away again. Prices have remained
roughly level since. As of Q2 2013 median house prices in Sevenoaks were £292,000, 5% higher
than the pre-recession high. Median house prices in Tunbridge Wells were equal to pre-recession
levels. By comparison Kent saw a 2% decrease in median prices while England and Wales saw
zero change over this period.
0
50,000
100,000
150,000
200,000
250,000
300,000
Q1 Q3 Q1 Q3 Q1 Q3 Q1 Q3 Q1 Q3 Q1 Q3 Q1 Q3 Q1 Q3 Q1 Q3 Q1 Q3
1998 1999 2000 2001 2002 2003 2004 2005 2006 2007
Sevenoaks Tunbridge Wells Wider housing market
Kent England and Wales
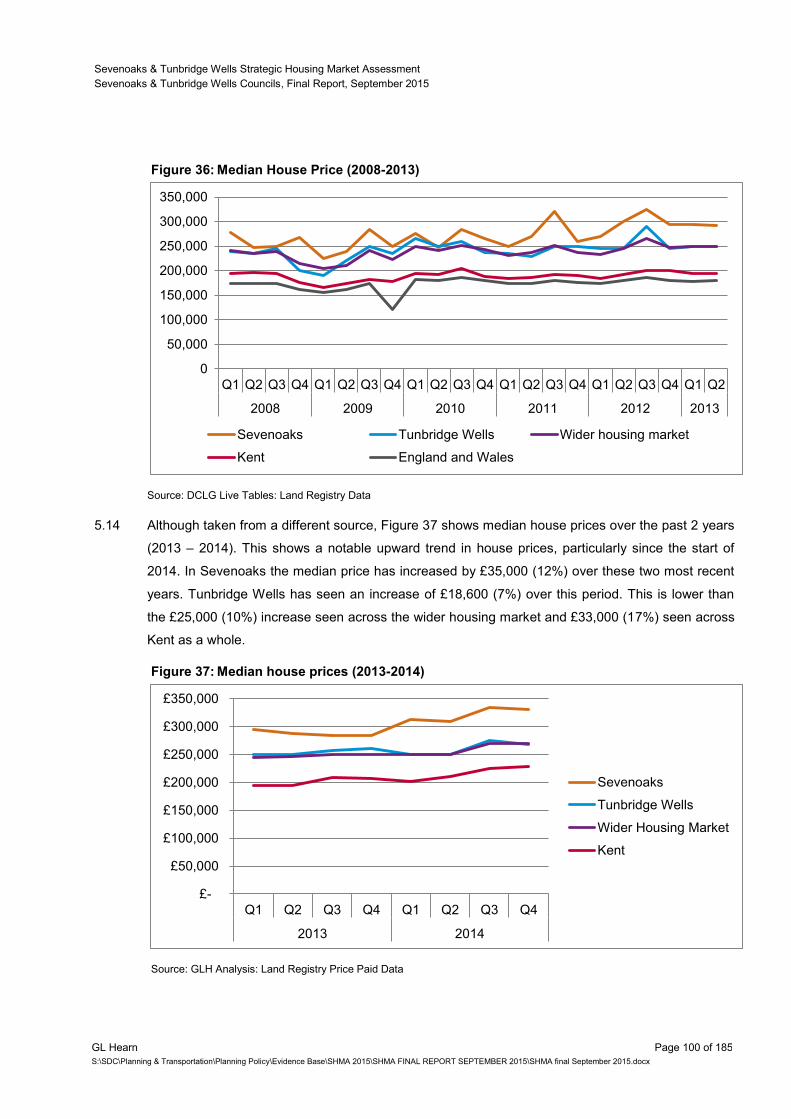
Sevenoaks & Tunbridge Wells Strategic Housing Market Assessment
Sevenoaks & Tunbridge Wells Councils, Final Report, September 2015
GL Hearn Page 100 of 185
S:\SDC\Planning & Transportation\Planning Policy\Evidence Base\SHMA 2015\SHMA FINAL REPORT SEPTEMBER 2015\SHMA final September 2015.docx
Figure 36: Median House Price (2008-2013)
Source: DCLG Live Tables: Land Registry Data
5.14 Although taken from a different source, Figure 37 shows median house prices over the past 2 years
(2013 – 2014). This shows a notable upward trend in house prices, particularly since the start of
2014. In Sevenoaks the median price has increased by £35,000 (12%) over these two most recent
years. Tunbridge Wells has seen an increase of £18,600 (7%) over this period. This is lower than
the £25,000 (10%) increase seen across the wider housing market and £33,000 (17%) seen across
Kent as a whole.
Figure 37: Median house prices (2013-2014)
Source: GLH Analysis: Land Registry Price Paid Data
0
50,000
100,000
150,000
200,000
250,000
300,000
350,000
Q1 Q2 Q3 Q4 Q1 Q2 Q3 Q4 Q1 Q2 Q3 Q4 Q1 Q2 Q3 Q4 Q1 Q2 Q3 Q4 Q1 Q2
2008 2009 2010 2011 2012 2013
Sevenoaks Tunbridge Wells Wider housing market
Kent England and Wales
£-
£50,000
£100,000
£150,000
£200,000
£250,000
£300,000
£350,000
Q1 Q2 Q3 Q4 Q1 Q2 Q3 Q4
2013 2014
Sevenoaks
Tunbridge Wells
Wider Housing Market
Kent
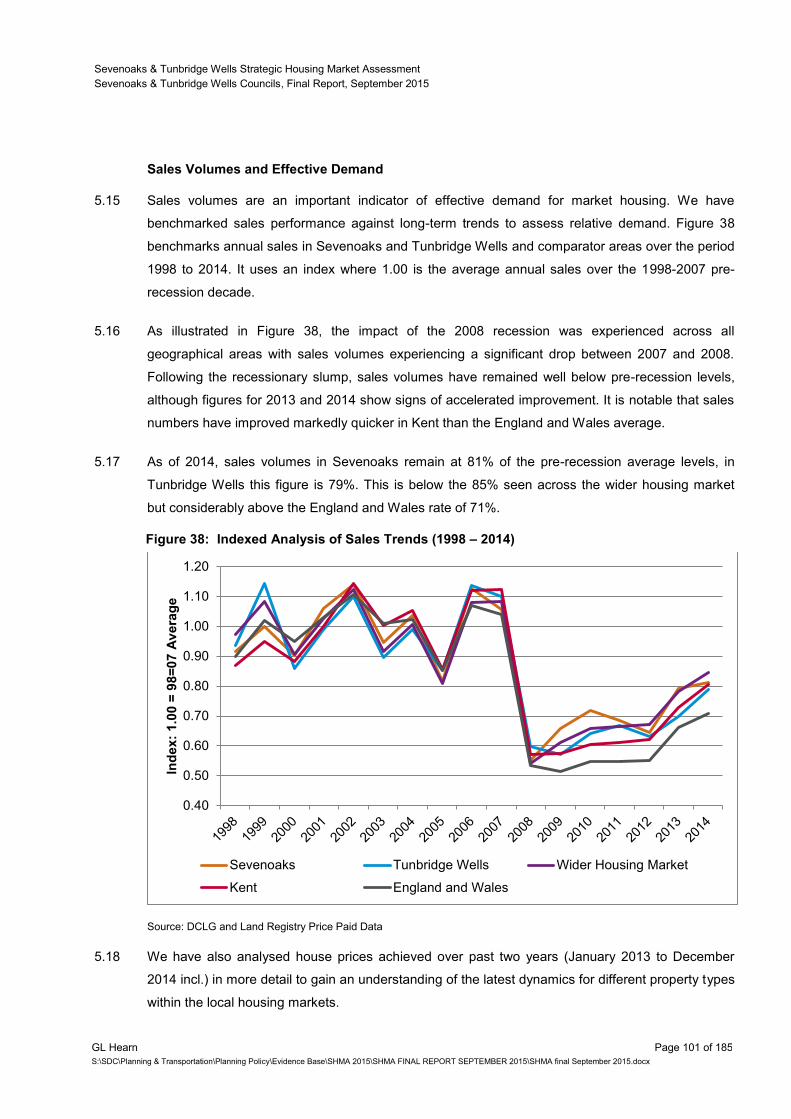
Sevenoaks & Tunbridge Wells Strategic Housing Market Assessment
Sevenoaks & Tunbridge Wells Councils, Final Report, September 2015
GL Hearn Page 101 of 185
S:\SDC\Planning & Transportation\Planning Policy\Evidence Base\SHMA 2015\SHMA FINAL REPORT SEPTEMBER 2015\SHMA final September 2015.docx
Sales Volumes and Effective Demand
5.15 Sales volumes are an important indicator of effective demand for market housing. We have
benchmarked sales performance against long-term trends to assess relative demand. Figure 38
benchmarks annual sales in Sevenoaks and Tunbridge Wells and comparator areas over the period
1998 to 2014. It uses an index where 1.00 is the average annual sales over the 1998-2007 pre-
recession decade.
5.16 As illustrated in Figure 38, the impact of the 2008 recession was experienced across all
geographical areas with sales volumes experiencing a significant drop between 2007 and 2008.
Following the recessionary slump, sales volumes have remained well below pre-recession levels,
although figures for 2013 and 2014 show signs of accelerated improvement. It is notable that sales
numbers have improved markedly quicker in Kent than the England and Wales average.
5.17 As of 2014, sales volumes in Sevenoaks remain at 81% of the pre-recession average levels, in
Tunbridge Wells this figure is 79%. This is below the 85% seen across the wider housing market
but considerably above the England and Wales rate of 71%.
Figure 38: Indexed Analysis of Sales Trends (1998 – 2014)
Source: DCLG and Land Registry Price Paid Data
5.18 We have also analysed house prices achieved over past two years (January 2013 to December
2014 incl.) in more detail to gain an understanding of the latest dynamics for different property types
within the local housing markets.
0.40
0.50
0.60
0.70
0.80
0.90
1.00
1.10
1.20
Ind
ex:
1.0
0 =
98=
07 A
vera
ge
Sevenoaks Tunbridge Wells Wider Housing Market
Kent England and Wales
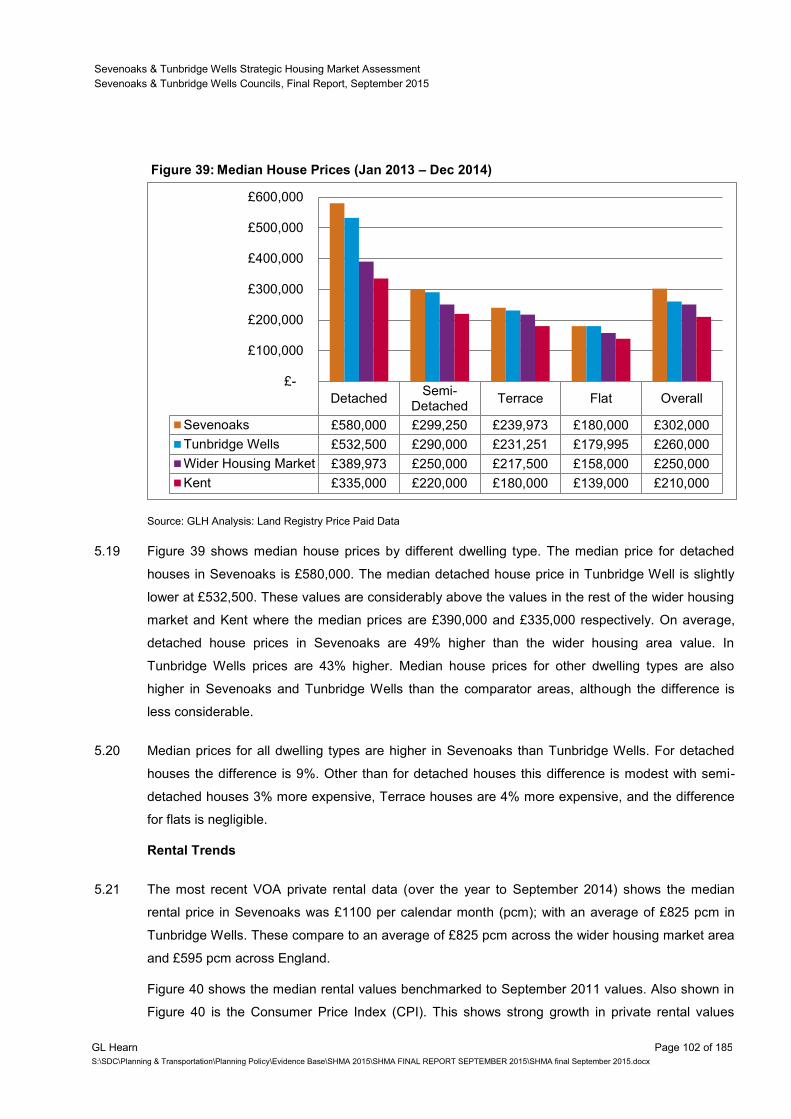
Sevenoaks & Tunbridge Wells Strategic Housing Market Assessment
Sevenoaks & Tunbridge Wells Councils, Final Report, September 2015
GL Hearn Page 102 of 185
S:\SDC\Planning & Transportation\Planning Policy\Evidence Base\SHMA 2015\SHMA FINAL REPORT SEPTEMBER 2015\SHMA final September 2015.docx
Figure 39: Median House Prices (Jan 2013 – Dec 2014)
Source: GLH Analysis: Land Registry Price Paid Data
5.19 Figure 39 shows median house prices by different dwelling type. The median price for detached
houses in Sevenoaks is £580,000. The median detached house price in Tunbridge Well is slightly
lower at £532,500. These values are considerably above the values in the rest of the wider housing
market and Kent where the median prices are £390,000 and £335,000 respectively. On average,
detached house prices in Sevenoaks are 49% higher than the wider housing area value. In
Tunbridge Wells prices are 43% higher. Median house prices for other dwelling types are also
higher in Sevenoaks and Tunbridge Wells than the comparator areas, although the difference is
less considerable.
5.20 Median prices for all dwelling types are higher in Sevenoaks than Tunbridge Wells. For detached
houses the difference is 9%. Other than for detached houses this difference is modest with semi-
detached houses 3% more expensive, Terrace houses are 4% more expensive, and the difference
for flats is negligible.
Rental Trends
5.21 The most recent VOA private rental data (over the year to September 2014) shows the median
rental price in Sevenoaks was £1100 per calendar month (pcm); with an average of £825 pcm in
Tunbridge Wells. These compare to an average of £825 pcm across the wider housing market area
and £595 pcm across England.
Figure 40 shows the median rental values benchmarked to September 2011 values. Also shown in
Figure 40 is the Consumer Price Index (CPI). This shows strong growth in private rental values
DetachedSemi-
DetachedTerrace Flat Overall
Sevenoaks £580,000 £299,250 £239,973 £180,000 £302,000
Tunbridge Wells £532,500 £290,000 £231,251 £179,995 £260,000
Wider Housing Market £389,973 £250,000 £217,500 £158,000 £250,000
Kent £335,000 £220,000 £180,000 £139,000 £210,000
£-
£100,000
£200,000
£300,000
£400,000
£500,000
£600,000
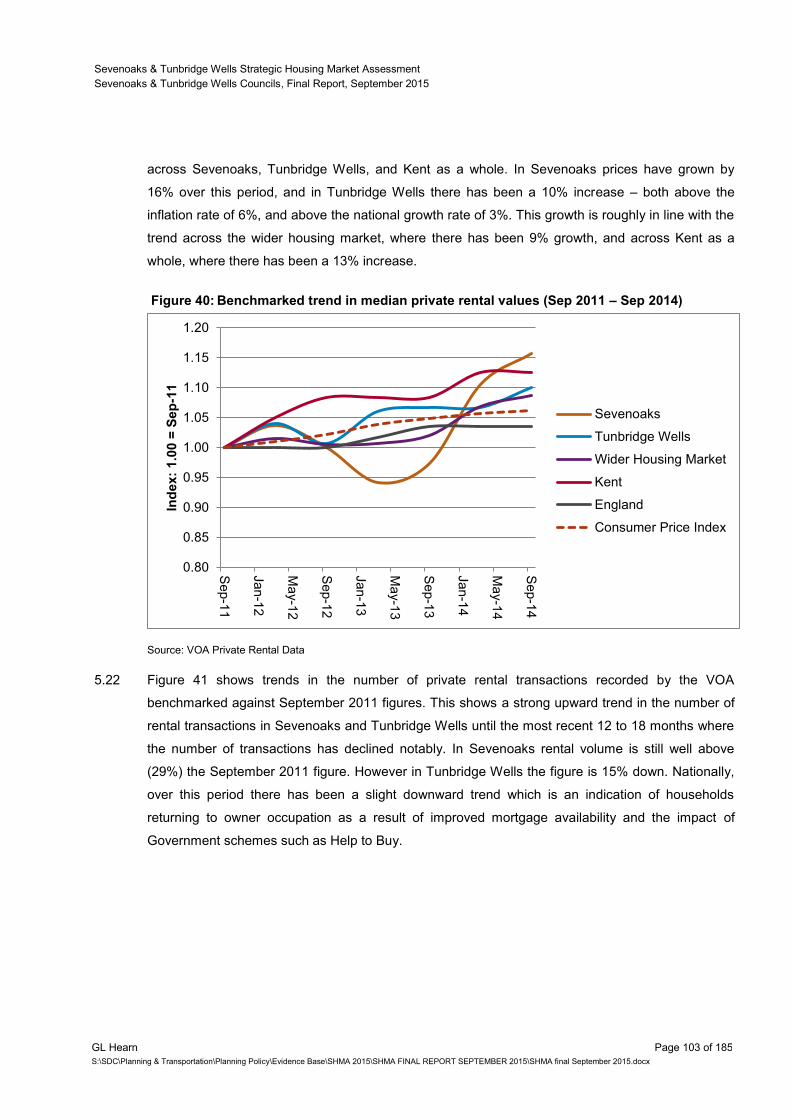
Sevenoaks & Tunbridge Wells Strategic Housing Market Assessment
Sevenoaks & Tunbridge Wells Councils, Final Report, September 2015
GL Hearn Page 103 of 185
S:\SDC\Planning & Transportation\Planning Policy\Evidence Base\SHMA 2015\SHMA FINAL REPORT SEPTEMBER 2015\SHMA final September 2015.docx
across Sevenoaks, Tunbridge Wells, and Kent as a whole. In Sevenoaks prices have grown by
16% over this period, and in Tunbridge Wells there has been a 10% increase – both above the
inflation rate of 6%, and above the national growth rate of 3%. This growth is roughly in line with the
trend across the wider housing market, where there has been 9% growth, and across Kent as a
whole, where there has been a 13% increase.
Figure 40: Benchmarked trend in median private rental values (Sep 2011 – Sep 2014)
Source: VOA Private Rental Data
5.22 Figure 41 shows trends in the number of private rental transactions recorded by the VOA
benchmarked against September 2011 figures. This shows a strong upward trend in the number of
rental transactions in Sevenoaks and Tunbridge Wells until the most recent 12 to 18 months where
the number of transactions has declined notably. In Sevenoaks rental volume is still well above
(29%) the September 2011 figure. However in Tunbridge Wells the figure is 15% down. Nationally,
over this period there has been a slight downward trend which is an indication of households
returning to owner occupation as a result of improved mortgage availability and the impact of
Government schemes such as Help to Buy.
0.80
0.85
0.90
0.95
1.00
1.05
1.10
1.15
1.20
Sep-1
1
Jan-1
2
Ma
y-1
2
Sep-1
2
Jan-1
3
Ma
y-1
3
Sep-1
3
Jan-1
4
Ma
y-1
4
Sep-1
4
Ind
ex:
1.0
0 =
Sep
-11
Sevenoaks
Tunbridge Wells
Wider Housing Market
Kent
England
Consumer Price Index
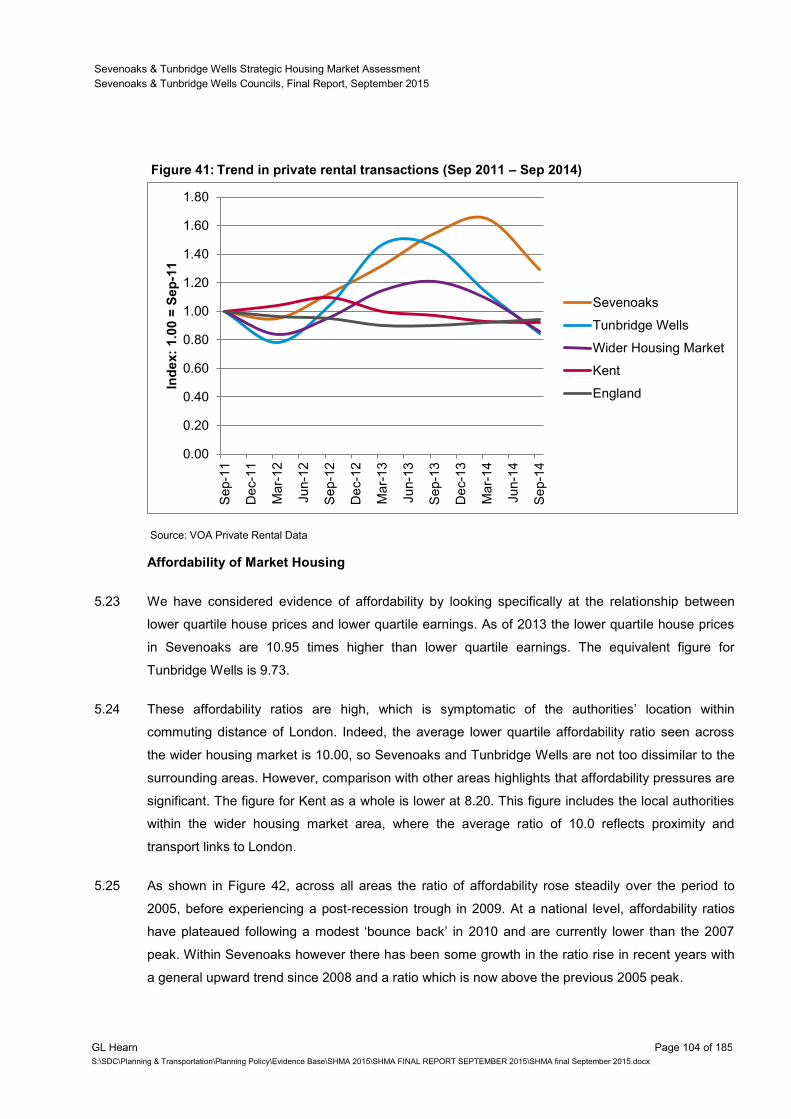
Sevenoaks & Tunbridge Wells Strategic Housing Market Assessment
Sevenoaks & Tunbridge Wells Councils, Final Report, September 2015
GL Hearn Page 104 of 185
S:\SDC\Planning & Transportation\Planning Policy\Evidence Base\SHMA 2015\SHMA FINAL REPORT SEPTEMBER 2015\SHMA final September 2015.docx
Figure 41: Trend in private rental transactions (Sep 2011 – Sep 2014)
Source: VOA Private Rental Data
Affordability of Market Housing
5.23 We have considered evidence of affordability by looking specifically at the relationship between
lower quartile house prices and lower quartile earnings. As of 2013 the lower quartile house prices
in Sevenoaks are 10.95 times higher than lower quartile earnings. The equivalent figure for
Tunbridge Wells is 9.73.
5.24 These affordability ratios are high, which is symptomatic of the authorities’ location within
commuting distance of London. Indeed, the average lower quartile affordability ratio seen across
the wider housing market is 10.00, so Sevenoaks and Tunbridge Wells are not too dissimilar to the
surrounding areas. However, comparison with other areas highlights that affordability pressures are
significant. The figure for Kent as a whole is lower at 8.20. This figure includes the local authorities
within the wider housing market area, where the average ratio of 10.0 reflects proximity and
transport links to London.
5.25 As shown in Figure 42, across all areas the ratio of affordability rose steadily over the period to
2005, before experiencing a post-recession trough in 2009. At a national level, affordability ratios
have plateaued following a modest ‘bounce back’ in 2010 and are currently lower than the 2007
peak. Within Sevenoaks however there has been some growth in the ratio rise in recent years with
a general upward trend since 2008 and a ratio which is now above the previous 2005 peak.
0.00
0.20
0.40
0.60
0.80
1.00
1.20
1.40
1.60
1.80
Sep-1
1
De
c-1
1
Ma
r-1
2
Jun-1
2
Sep-1
2
De
c-1
2
Ma
r-1
3
Jun-1
3
Sep-1
3
De
c-1
3
Ma
r-1
4
Jun-1
4
Sep-1
4
Ind
ex:
1.0
0 =
Sep
-11
Sevenoaks
Tunbridge Wells
Wider Housing Market
Kent
England
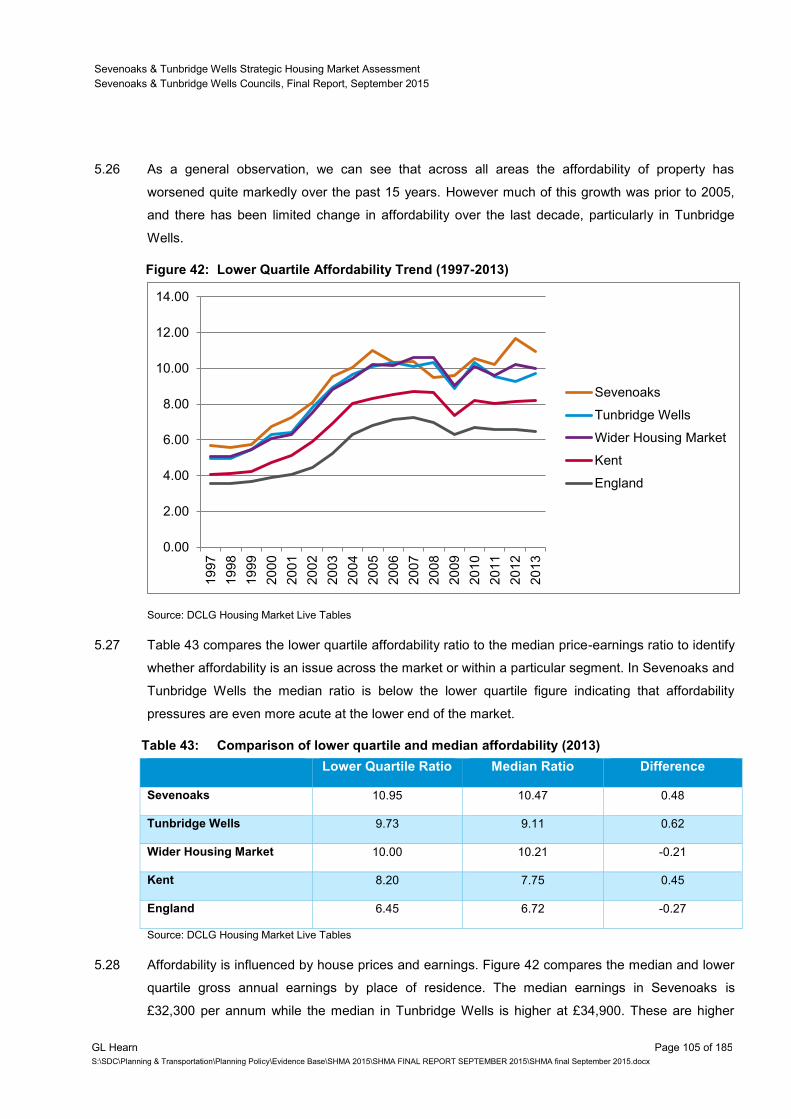
Sevenoaks & Tunbridge Wells Strategic Housing Market Assessment
Sevenoaks & Tunbridge Wells Councils, Final Report, September 2015
GL Hearn Page 105 of 185
S:\SDC\Planning & Transportation\Planning Policy\Evidence Base\SHMA 2015\SHMA FINAL REPORT SEPTEMBER 2015\SHMA final September 2015.docx
5.26 As a general observation, we can see that across all areas the affordability of property has
worsened quite markedly over the past 15 years. However much of this growth was prior to 2005,
and there has been limited change in affordability over the last decade, particularly in Tunbridge
Wells.
Figure 42: Lower Quartile Affordability Trend (1997-2013)
Source: DCLG Housing Market Live Tables
5.27 Table 43 compares the lower quartile affordability ratio to the median price-earnings ratio to identify
whether affordability is an issue across the market or within a particular segment. In Sevenoaks and
Tunbridge Wells the median ratio is below the lower quartile figure indicating that affordability
pressures are even more acute at the lower end of the market.
Table 43: Comparison of lower quartile and median affordability (2013)
Lower Quartile Ratio Median Ratio Difference
Sevenoaks 10.95 10.47 0.48
Tunbridge Wells 9.73 9.11 0.62
Wider Housing Market 10.00 10.21 -0.21
Kent 8.20 7.75 0.45
England 6.45 6.72 -0.27
Source: DCLG Housing Market Live Tables
5.28 Affordability is influenced by house prices and earnings. Figure 42 compares the median and lower
quartile gross annual earnings by place of residence. The median earnings in Sevenoaks is
£32,300 per annum while the median in Tunbridge Wells is higher at £34,900. These are higher
0.00
2.00
4.00
6.00
8.00
10.00
12.00
14.00
19
97
19
98
19
99
20
00
20
01
20
02
20
03
20
04
20
05
20
06
20
07
20
08
20
09
20
10
20
11
20
12
20
13
Sevenoaks
Tunbridge Wells
Wider Housing Market
Kent
England
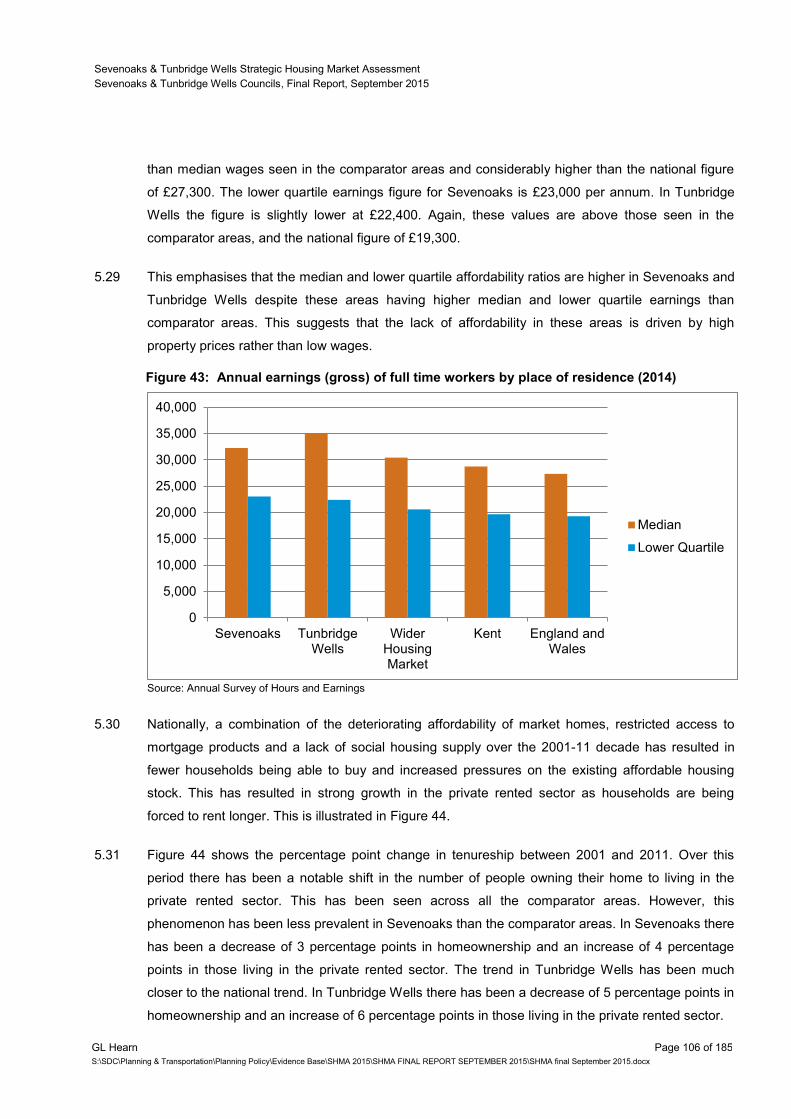
Sevenoaks & Tunbridge Wells Strategic Housing Market Assessment
Sevenoaks & Tunbridge Wells Councils, Final Report, September 2015
GL Hearn Page 106 of 185
S:\SDC\Planning & Transportation\Planning Policy\Evidence Base\SHMA 2015\SHMA FINAL REPORT SEPTEMBER 2015\SHMA final September 2015.docx
than median wages seen in the comparator areas and considerably higher than the national figure
of £27,300. The lower quartile earnings figure for Sevenoaks is £23,000 per annum. In Tunbridge
Wells the figure is slightly lower at £22,400. Again, these values are above those seen in the
comparator areas, and the national figure of £19,300.
5.29 This emphasises that the median and lower quartile affordability ratios are higher in Sevenoaks and
Tunbridge Wells despite these areas having higher median and lower quartile earnings than
comparator areas. This suggests that the lack of affordability in these areas is driven by high
property prices rather than low wages.
Figure 43: Annual earnings (gross) of full time workers by place of residence (2014)
Source: Annual Survey of Hours and Earnings
5.30 Nationally, a combination of the deteriorating affordability of market homes, restricted access to
mortgage products and a lack of social housing supply over the 2001-11 decade has resulted in
fewer households being able to buy and increased pressures on the existing affordable housing
stock. This has resulted in strong growth in the private rented sector as households are being
forced to rent longer. This is illustrated in Figure 44.
5.31 Figure 44 shows the percentage point change in tenureship between 2001 and 2011. Over this
period there has been a notable shift in the number of people owning their home to living in the
private rented sector. This has been seen across all the comparator areas. However, this
phenomenon has been less prevalent in Sevenoaks than the comparator areas. In Sevenoaks there
has been a decrease of 3 percentage points in homeownership and an increase of 4 percentage
points in those living in the private rented sector. The trend in Tunbridge Wells has been much
closer to the national trend. In Tunbridge Wells there has been a decrease of 5 percentage points in
homeownership and an increase of 6 percentage points in those living in the private rented sector.
0
5,000
10,000
15,000
20,000
25,000
30,000
35,000
40,000
Sevenoaks TunbridgeWells
WiderHousingMarket
Kent England andWales
Median
Lower Quartile
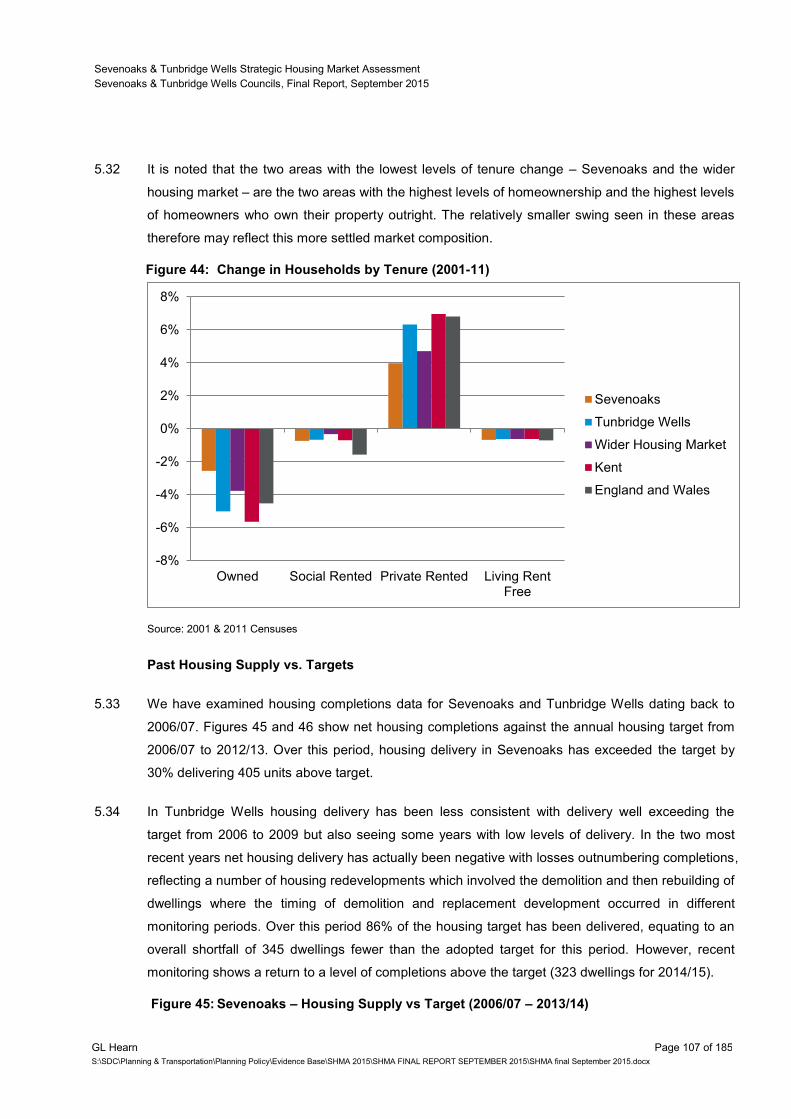
Sevenoaks & Tunbridge Wells Strategic Housing Market Assessment
Sevenoaks & Tunbridge Wells Councils, Final Report, September 2015
GL Hearn Page 107 of 185
S:\SDC\Planning & Transportation\Planning Policy\Evidence Base\SHMA 2015\SHMA FINAL REPORT SEPTEMBER 2015\SHMA final September 2015.docx
5.32 It is noted that the two areas with the lowest levels of tenure change – Sevenoaks and the wider
housing market – are the two areas with the highest levels of homeownership and the highest levels
of homeowners who own their property outright. The relatively smaller swing seen in these areas
therefore may reflect this more settled market composition.
Figure 44: Change in Households by Tenure (2001-11)
Source: 2001 & 2011 Censuses
Past Housing Supply vs. Targets
5.33 We have examined housing completions data for Sevenoaks and Tunbridge Wells dating back to
2006/07. Figures 45 and 46 show net housing completions against the annual housing target from
2006/07 to 2012/13. Over this period, housing delivery in Sevenoaks has exceeded the target by
30% delivering 405 units above target.
5.34 In Tunbridge Wells housing delivery has been less consistent with delivery well exceeding the
target from 2006 to 2009 but also seeing some years with low levels of delivery. In the two most
recent years net housing delivery has actually been negative with losses outnumbering completions,
reflecting a number of housing redevelopments which involved the demolition and then rebuilding of
dwellings where the timing of demolition and replacement development occurred in different
monitoring periods. Over this period 86% of the housing target has been delivered, equating to an
overall shortfall of 345 dwellings fewer than the adopted target for this period. However, recent
monitoring shows a return to a level of completions above the target (323 dwellings for 2014/15).
Figure 45: Sevenoaks – Housing Supply vs Target (2006/07 – 2013/14)
-8%
-6%
-4%
-2%
0%
2%
4%
6%
8%
Owned Social Rented Private Rented Living RentFree
Sevenoaks
Tunbridge Wells
Wider Housing Market
Kent
England and Wales
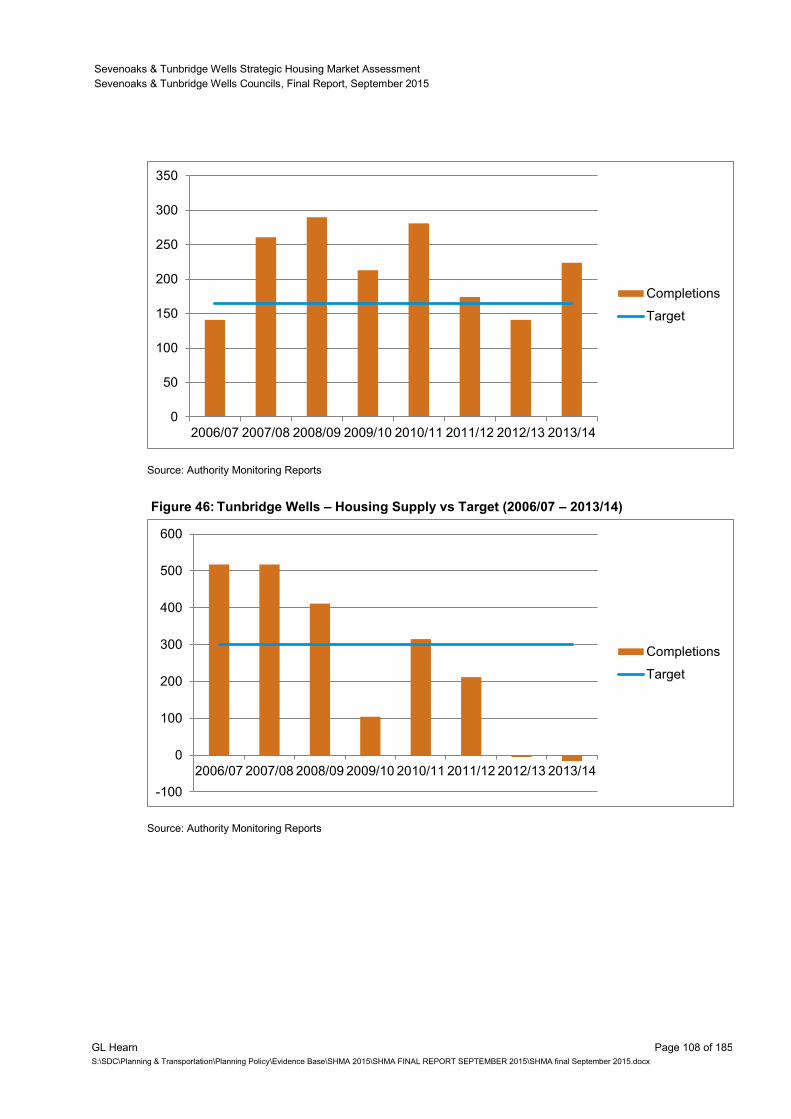
Sevenoaks & Tunbridge Wells Strategic Housing Market Assessment
Sevenoaks & Tunbridge Wells Councils, Final Report, September 2015
GL Hearn Page 108 of 185
S:\SDC\Planning & Transportation\Planning Policy\Evidence Base\SHMA 2015\SHMA FINAL REPORT SEPTEMBER 2015\SHMA final September 2015.docx
Source: Authority Monitoring Reports
Figure 46: Tunbridge Wells – Housing Supply vs Target (2006/07 – 2013/14)
Source: Authority Monitoring Reports
0
50
100
150
200
250
300
350
2006/07 2007/08 2008/09 2009/10 2010/11 2011/12 2012/13 2013/14
Completions
Target
-100
0
100
200
300
400
500
600
2006/07 2007/08 2008/09 2009/10 2010/11 2011/12 2012/13 2013/14
Completions
Target
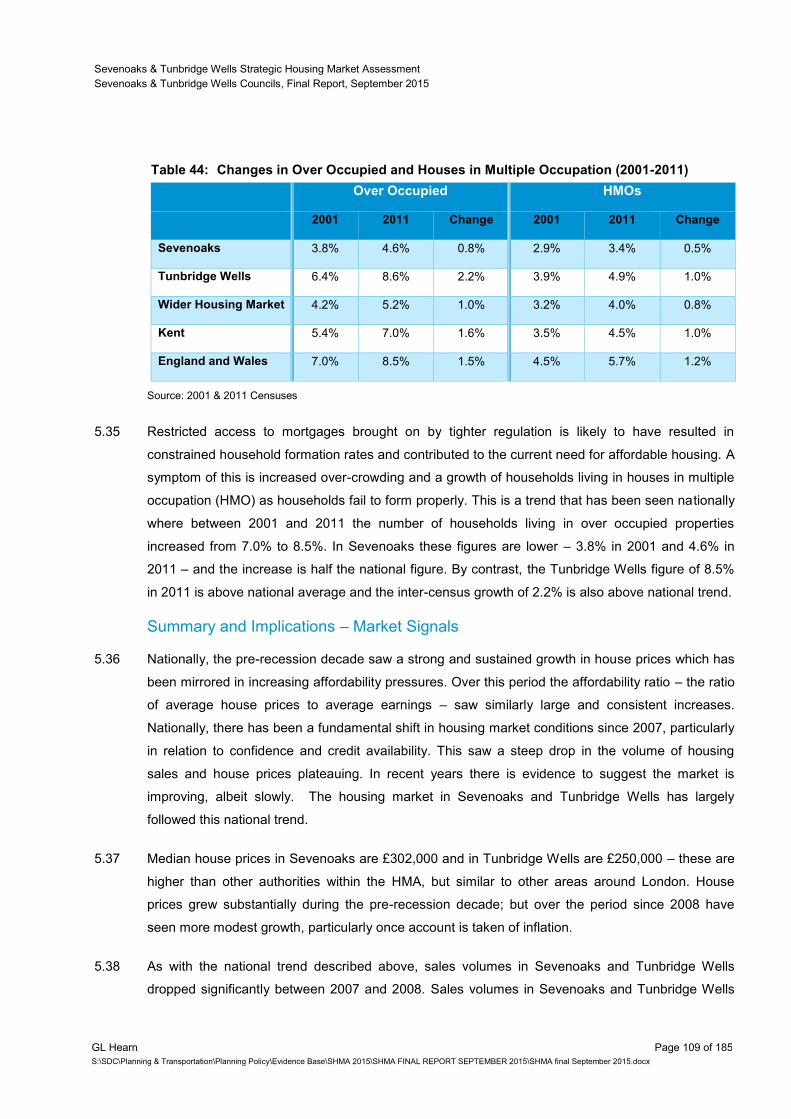
Sevenoaks & Tunbridge Wells Strategic Housing Market Assessment
Sevenoaks & Tunbridge Wells Councils, Final Report, September 2015
GL Hearn Page 109 of 185
S:\SDC\Planning & Transportation\Planning Policy\Evidence Base\SHMA 2015\SHMA FINAL REPORT SEPTEMBER 2015\SHMA final September 2015.docx
Table 44: Changes in Over Occupied and Houses in Multiple Occupation (2001-2011)
Over Occupied HMOs
2001 2011 Change 2001 2011 Change
Sevenoaks 3.8% 4.6% 0.8% 2.9% 3.4% 0.5%
Tunbridge Wells 6.4% 8.6% 2.2% 3.9% 4.9% 1.0%
Wider Housing Market 4.2% 5.2% 1.0% 3.2% 4.0% 0.8%
Kent 5.4% 7.0% 1.6% 3.5% 4.5% 1.0%
England and Wales 7.0% 8.5% 1.5% 4.5% 5.7% 1.2%
Source: 2001 & 2011 Censuses
5.35 Restricted access to mortgages brought on by tighter regulation is likely to have resulted in
constrained household formation rates and contributed to the current need for affordable housing. A
symptom of this is increased over-crowding and a growth of households living in houses in multiple
occupation (HMO) as households fail to form properly. This is a trend that has been seen nationally
where between 2001 and 2011 the number of households living in over occupied properties
increased from 7.0% to 8.5%. In Sevenoaks these figures are lower – 3.8% in 2001 and 4.6% in
2011 – and the increase is half the national figure. By contrast, the Tunbridge Wells figure of 8.5%
in 2011 is above national average and the inter-census growth of 2.2% is also above national trend.
Summary and Implications – Market Signals
5.36 Nationally, the pre-recession decade saw a strong and sustained growth in house prices which has
been mirrored in increasing affordability pressures. Over this period the affordability ratio – the ratio
of average house prices to average earnings – saw similarly large and consistent increases.
Nationally, there has been a fundamental shift in housing market conditions since 2007, particularly
in relation to confidence and credit availability. This saw a steep drop in the volume of housing
sales and house prices plateauing. In recent years there is evidence to suggest the market is
improving, albeit slowly. The housing market in Sevenoaks and Tunbridge Wells has largely
followed this national trend.
5.37 Median house prices in Sevenoaks are £302,000 and in Tunbridge Wells are £250,000 – these are
higher than other authorities within the HMA, but similar to other areas around London. House
prices grew substantially during the pre-recession decade; but over the period since 2008 have
seen more modest growth, particularly once account is taken of inflation.
5.38 As with the national trend described above, sales volumes in Sevenoaks and Tunbridge Wells
dropped significantly between 2007 and 2008. Sales volumes in Sevenoaks and Tunbridge Wells
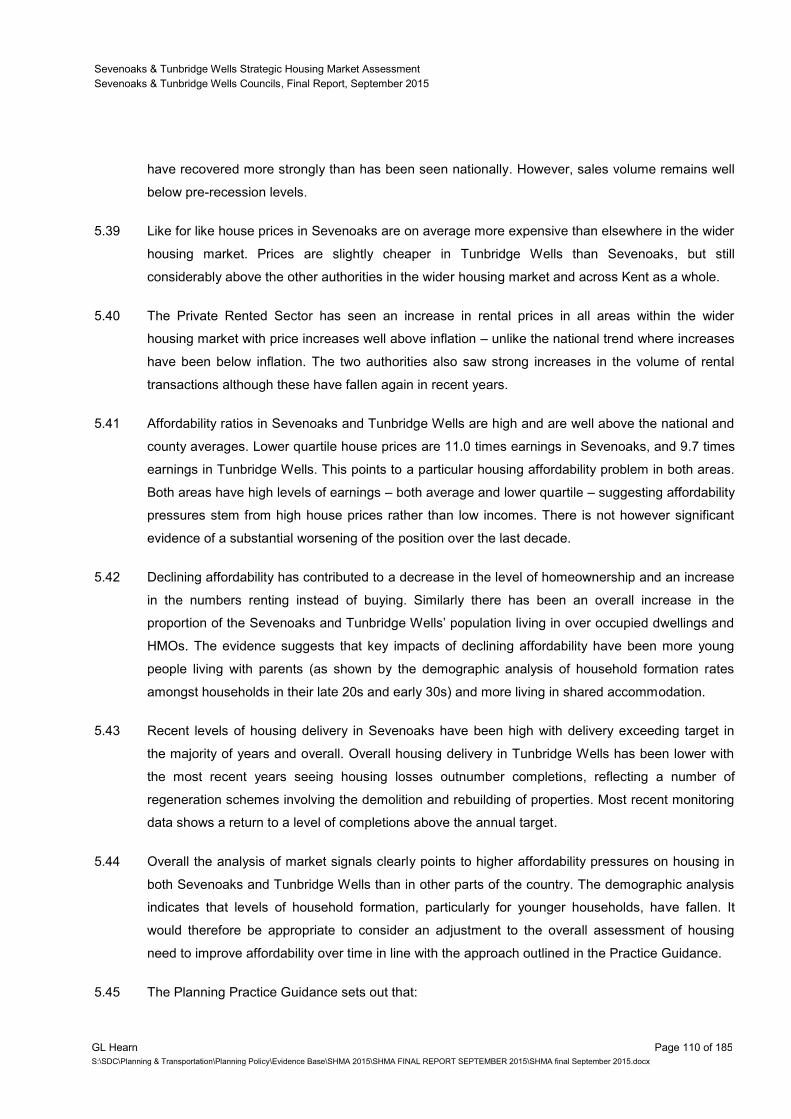
Sevenoaks & Tunbridge Wells Strategic Housing Market Assessment
Sevenoaks & Tunbridge Wells Councils, Final Report, September 2015
GL Hearn Page 110 of 185
S:\SDC\Planning & Transportation\Planning Policy\Evidence Base\SHMA 2015\SHMA FINAL REPORT SEPTEMBER 2015\SHMA final September 2015.docx
have recovered more strongly than has been seen nationally. However, sales volume remains well
below pre-recession levels.
5.39 Like for like house prices in Sevenoaks are on average more expensive than elsewhere in the wider
housing market. Prices are slightly cheaper in Tunbridge Wells than Sevenoaks, but still
considerably above the other authorities in the wider housing market and across Kent as a whole.
5.40 The Private Rented Sector has seen an increase in rental prices in all areas within the wider
housing market with price increases well above inflation – unlike the national trend where increases
have been below inflation. The two authorities also saw strong increases in the volume of rental
transactions although these have fallen again in recent years.
5.41 Affordability ratios in Sevenoaks and Tunbridge Wells are high and are well above the national and
county averages. Lower quartile house prices are 11.0 times earnings in Sevenoaks, and 9.7 times
earnings in Tunbridge Wells. This points to a particular housing affordability problem in both areas.
Both areas have high levels of earnings – both average and lower quartile – suggesting affordability
pressures stem from high house prices rather than low incomes. There is not however significant
evidence of a substantial worsening of the position over the last decade.
5.42 Declining affordability has contributed to a decrease in the level of homeownership and an increase
in the numbers renting instead of buying. Similarly there has been an overall increase in the
proportion of the Sevenoaks and Tunbridge Wells’ population living in over occupied dwellings and
HMOs. The evidence suggests that key impacts of declining affordability have been more young
people living with parents (as shown by the demographic analysis of household formation rates
amongst households in their late 20s and early 30s) and more living in shared accommodation.
5.43 Recent levels of housing delivery in Sevenoaks have been high with delivery exceeding target in
the majority of years and overall. Overall housing delivery in Tunbridge Wells has been lower with
the most recent years seeing housing losses outnumber completions, reflecting a number of
regeneration schemes involving the demolition and rebuilding of properties. Most recent monitoring
data shows a return to a level of completions above the annual target.
5.44 Overall the analysis of market signals clearly points to higher affordability pressures on housing in
both Sevenoaks and Tunbridge Wells than in other parts of the country. The demographic analysis
indicates that levels of household formation, particularly for younger households, have fallen. It
would therefore be appropriate to consider an adjustment to the overall assessment of housing
need to improve affordability over time in line with the approach outlined in the Practice Guidance.
5.45 The Planning Practice Guidance sets out that:
Sevenoaks & Tunbridge Wells Strategic Housing Market Assessment
Sevenoaks & Tunbridge Wells Councils, Final Report, September 2015
GL Hearn Page 111 of 185
S:\SDC\Planning & Transportation\Planning Policy\Evidence Base\SHMA 2015\SHMA FINAL REPORT SEPTEMBER 2015\SHMA final September 2015.docx
“In areas where an upward adjustment [to the assessment of housing need] is
required, plan makers should set this adjustment at a level that is reasonable. The
more significant the affordability constraints (as reflected in rising prices and rents,
and worsening affordability ratio) and the stronger other indicators of high demand (eg
the differential between land prices), the larger the improvement in affordability
needed and, therefore, the larger the additional supply response should be.”
5.46 The Guidance does not however set out how such an adjustment should be quantified. It simply
sets out that it should be ‘reasonable.’
5.47 To consider this issue further we have sought to use the demographic analysis to assess the
degree to which household formation levels have been constrained for younger age groups, and
what scale of adjustment to housing provision would be necessary for these to improve. The key
premise is that as a decline in affordability in demographic terms has been manifest in a reduction
in household formation for younger households, the reverse would also be true.
5.48 A detailed interrogation of demographic dynamics in Sevenoaks and Tunbridge Wells indicates that
in demographic terms, the deterioration in affordability of market housing and the economic
recession over the 2001-11 decade is likely to have influenced – at least in part – a decline in
household formation rates in younger people, particularly amongst those aged between 25 and 34.
This is the key age group in which the data shows that household formation rates have fallen.
5.49 When we consider age-specific data it is notable that those aged 25-34 have lower headship rates
than was expected in the 2008-based projections and that the rates have dropped considerably
from 2001 to 2011 – the 2012-based projections do however show some improvement from 2011
onwards (an improvement in the case of Tunbridge Wells and a slowing down of the rate of change
in Sevenoaks). We have therefore run a sensitivity analysis which considers and seeks to quantify
the implication of returning the household formation rates of the 25-34 age group back to 2001
levels (i.e. before the rate started to decrease) by 2033.
5.50 The figures below show how this adjustment impacts on the formation rates of people aged 25-34.
The analysis shows that the adjustment is particularly notable in Sevenoaks, with Tunbridge Wells
seeing a smaller uplift. This is consistent with observations earlier in the report that the CLG
household projections are not expecting any recovery in formation rates for this age group in
Sevenoaks but are projecting some modest increases in Tunbridge Wells.
5.51 Household formation rates for younger households in Tunbridge Wells are higher than in
Sevenoaks, and than in a range of other areas within the South East region. This is a relevant
factor in determining the scale of additional adjustment which might be considered appropriate.
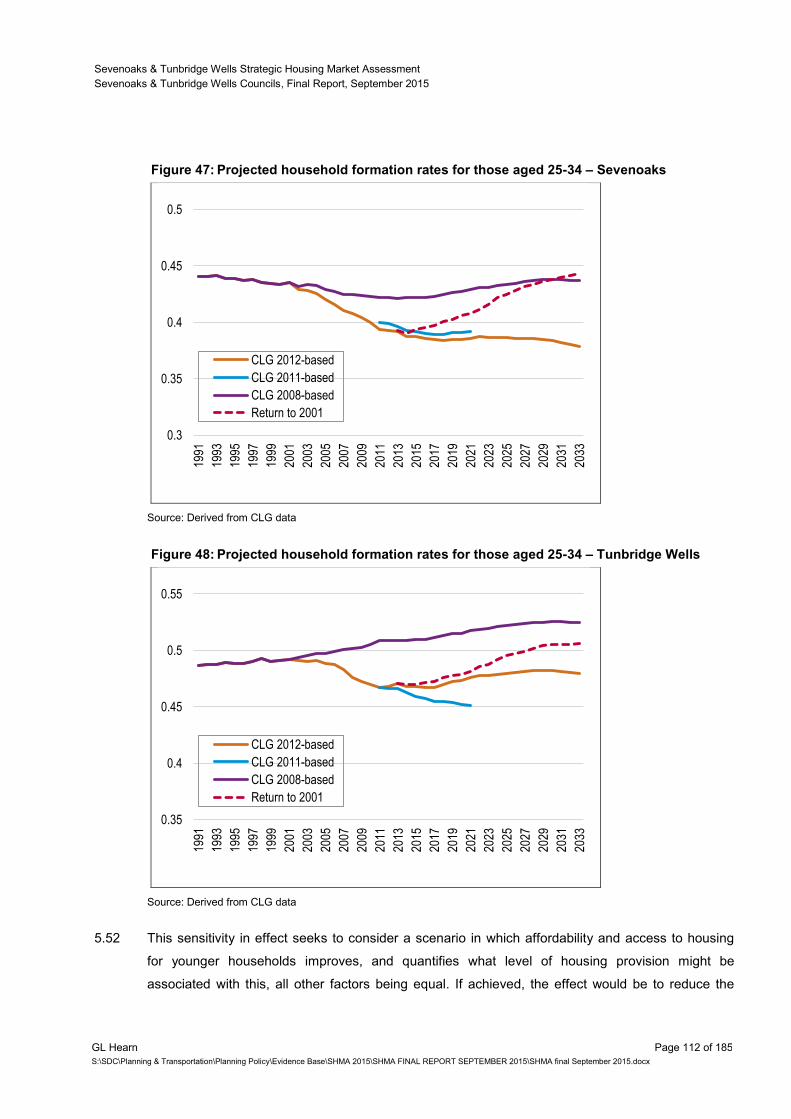
Sevenoaks & Tunbridge Wells Strategic Housing Market Assessment
Sevenoaks & Tunbridge Wells Councils, Final Report, September 2015
GL Hearn Page 112 of 185
S:\SDC\Planning & Transportation\Planning Policy\Evidence Base\SHMA 2015\SHMA FINAL REPORT SEPTEMBER 2015\SHMA final September 2015.docx
Figure 47: Projected household formation rates for those aged 25-34 – Sevenoaks
Source: Derived from CLG data
Figure 48: Projected household formation rates for those aged 25-34 – Tunbridge Wells
Source: Derived from CLG data
5.52 This sensitivity in effect seeks to consider a scenario in which affordability and access to housing
for younger households improves, and quantifies what level of housing provision might be
associated with this, all other factors being equal. If achieved, the effect would be to reduce the
0.3
0.35
0.4
0.45
0.519
91
1993
1995
1997
1999
2001
2003
2005
2007
2009
2011
2013
2015
2017
2019
2021
2023
2025
2027
2029
2031
2033
CLG 2012-based
CLG 2011-based
CLG 2008-based
Return to 2001
0.35
0.4
0.45
0.5
0.55
1991
1993
1995
1997
1999
2001
2003
2005
2007
2009
2011
2013
2015
2017
2019
2021
2023
2025
2027
2029
2031
2033
CLG 2012-based
CLG 2011-based
CLG 2008-based
Return to 2001
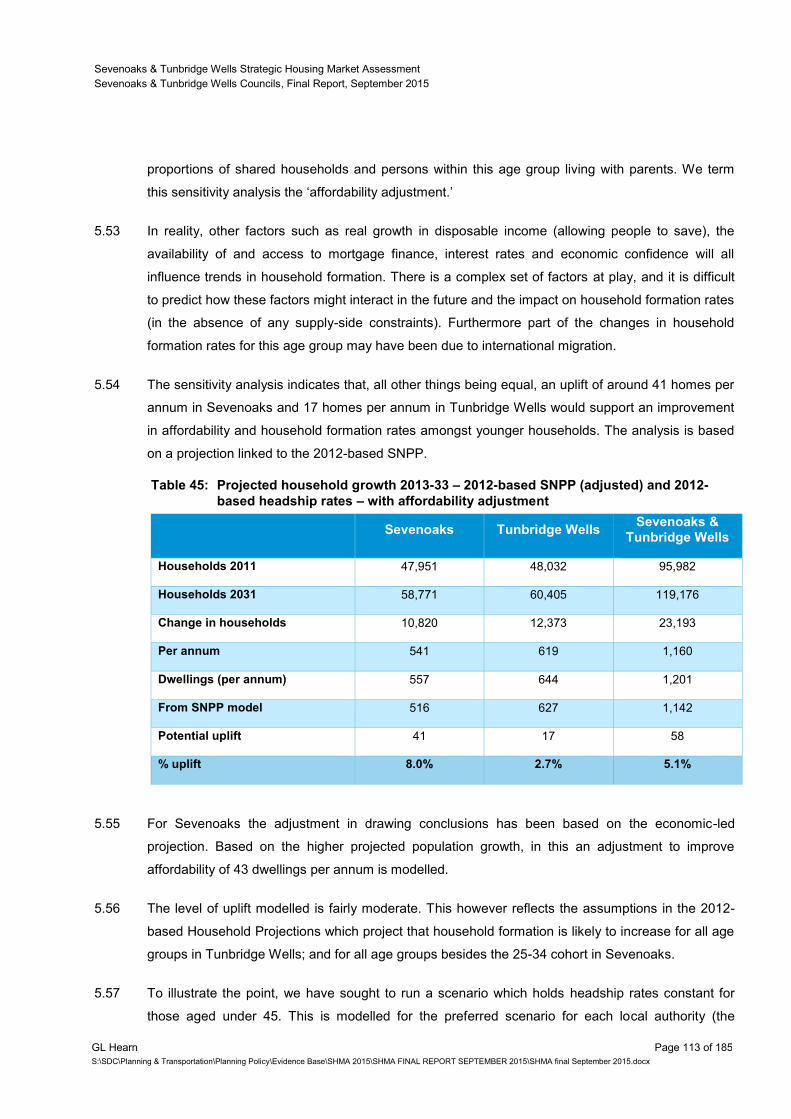
Sevenoaks & Tunbridge Wells Strategic Housing Market Assessment
Sevenoaks & Tunbridge Wells Councils, Final Report, September 2015
GL Hearn Page 113 of 185
S:\SDC\Planning & Transportation\Planning Policy\Evidence Base\SHMA 2015\SHMA FINAL REPORT SEPTEMBER 2015\SHMA final September 2015.docx
proportions of shared households and persons within this age group living with parents. We term
this sensitivity analysis the ‘affordability adjustment.’
5.53 In reality, other factors such as real growth in disposable income (allowing people to save), the
availability of and access to mortgage finance, interest rates and economic confidence will all
influence trends in household formation. There is a complex set of factors at play, and it is difficult
to predict how these factors might interact in the future and the impact on household formation rates
(in the absence of any supply-side constraints). Furthermore part of the changes in household
formation rates for this age group may have been due to international migration.
5.54 The sensitivity analysis indicates that, all other things being equal, an uplift of around 41 homes per
annum in Sevenoaks and 17 homes per annum in Tunbridge Wells would support an improvement
in affordability and household formation rates amongst younger households. The analysis is based
on a projection linked to the 2012-based SNPP.
Table 45: Projected household growth 2013-33 – 2012-based SNPP (adjusted) and 2012-
based headship rates – with affordability adjustment
Sevenoaks Tunbridge Wells Sevenoaks &
Tunbridge Wells
Households 2011 47,951 48,032 95,982
Households 2031 58,771 60,405 119,176
Change in households 10,820 12,373 23,193
Per annum 541 619 1,160
Dwellings (per annum) 557 644 1,201
From SNPP model 516 627 1,142
Potential uplift 41 17 58
% uplift 8.0% 2.7% 5.1%
5.55 For Sevenoaks the adjustment in drawing conclusions has been based on the economic-led
projection. Based on the higher projected population growth, in this an adjustment to improve
affordability of 43 dwellings per annum is modelled.
5.56 The level of uplift modelled is fairly moderate. This however reflects the assumptions in the 2012-
based Household Projections which project that household formation is likely to increase for all age
groups in Tunbridge Wells; and for all age groups besides the 25-34 cohort in Sevenoaks.
5.57 To illustrate the point, we have sought to run a scenario which holds headship rates constant for
those aged under 45. This is modelled for the preferred scenario for each local authority (the

Sevenoaks & Tunbridge Wells Strategic Housing Market Assessment
Sevenoaks & Tunbridge Wells Councils, Final Report, September 2015
GL Hearn Page 114 of 185
S:\SDC\Planning & Transportation\Planning Policy\Evidence Base\SHMA 2015\SHMA FINAL REPORT SEPTEMBER 2015\SHMA final September 2015.docx
economic-led scenario for Sevenoaks, and preferred demographic-led scenario for Tunbridge
Wells).
Table 46: Impact of Affordability Adjustments – Housing Need per Annum, 2013-33
Sevenoaks Tunbridge Wells
Constant headship rates under 45 577 606
Scenario with affordability adjustment 620 648
% Difference 7% 7%
5.58 The improvements to headship rates for younger households in the projections thus result in a 7%
uplift in the assessed housing need across both authorities.
Sevenoaks & Tunbridge Wells Strategic Housing Market Assessment
Sevenoaks & Tunbridge Wells Councils, Final Report, September 2015
GL Hearn Page 115 of 185
S:\SDC\Planning & Transportation\Planning Policy\Evidence Base\SHMA 2015\SHMA FINAL REPORT SEPTEMBER 2015\SHMA final September 2015.docx
6 NEED FOR DIFFERENT SIZES OF HOMES
Introduction
6.1 As noted in Section 4, there are a range of factors which influence housing demand. These factors
play out at different spatial scales and influence both the level of housing demand (in terms of
aggregate household growth) and the nature of demand for different types, tenures and sizes of
homes. It is important to understand that the housing market is influenced by macro-economic
factors, as well as the housing market conditions at a regional and local level.
6.2 The analysis in this section seeks to use the information available about the size and structure of
the population and household structures; and consider what impact this may have on the sizes of
housing required in the future. For analysis purposes, the analysis assumes population and
household growth in line with the 2012-based Household Projections (as updated by mid-year
population estimate data for 2013), but with an “affordability adjustment” made to increase the
formation of younger households. These projections indicate a need 557 homes per annum in
Sevenoaks, and 644 per annum in Tunbridge Wells over the 2013-33 period.
6.3 It should be noted that this projection will not necessarily be translated into policy, once account is
taken of other factors including development constraints, but has been used to indicate the likely
need for different sizes of homes moving forward. Were a projection with a different housing figure
used then the outputs would be expected to be broadly similar.
Methodology
6.4 The figure below describes the broad methodology employed in the housing market model which is
used to consider the need for different sizes of market and affordable homes. Data is drawn from a
range of sources including the 2011 Census and demographic projections.
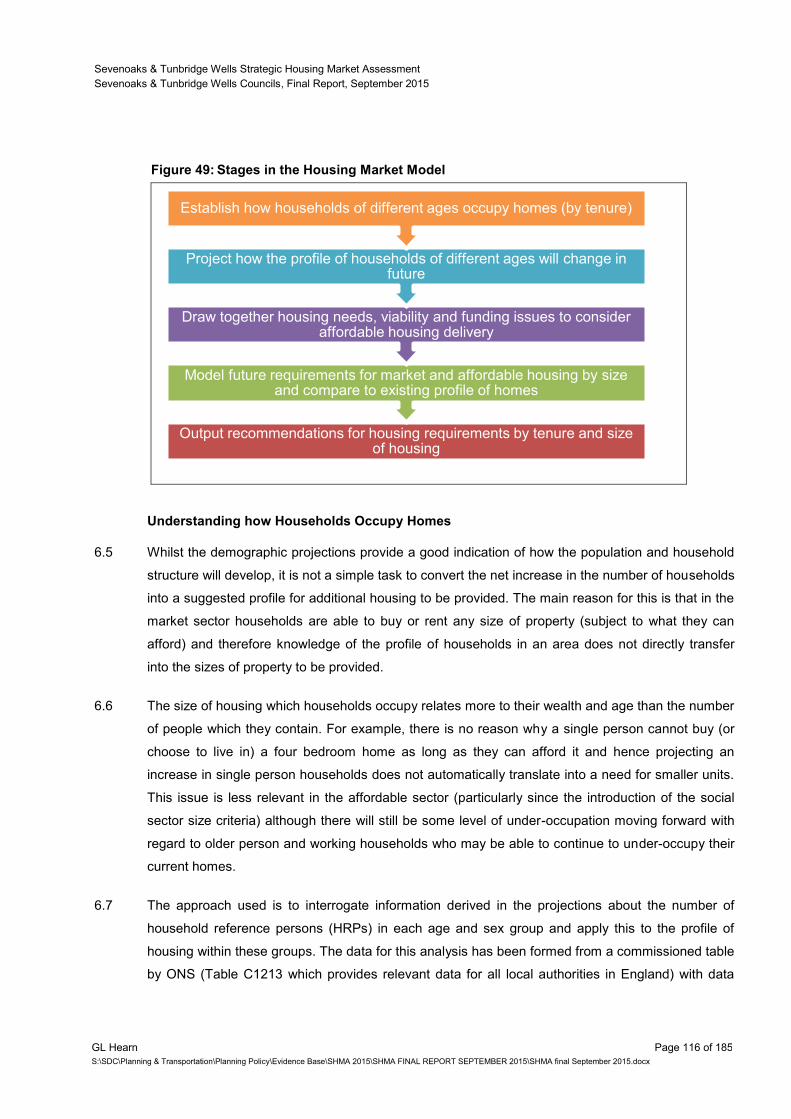
Sevenoaks & Tunbridge Wells Strategic Housing Market Assessment
Sevenoaks & Tunbridge Wells Councils, Final Report, September 2015
GL Hearn Page 116 of 185
S:\SDC\Planning & Transportation\Planning Policy\Evidence Base\SHMA 2015\SHMA FINAL REPORT SEPTEMBER 2015\SHMA final September 2015.docx
Figure 49: Stages in the Housing Market Model
Understanding how Households Occupy Homes
6.5 Whilst the demographic projections provide a good indication of how the population and household
structure will develop, it is not a simple task to convert the net increase in the number of households
into a suggested profile for additional housing to be provided. The main reason for this is that in the
market sector households are able to buy or rent any size of property (subject to what they can
afford) and therefore knowledge of the profile of households in an area does not directly transfer
into the sizes of property to be provided.
6.6 The size of housing which households occupy relates more to their wealth and age than the number
of people which they contain. For example, there is no reason why a single person cannot buy (or
choose to live in) a four bedroom home as long as they can afford it and hence projecting an
increase in single person households does not automatically translate into a need for smaller units.
This issue is less relevant in the affordable sector (particularly since the introduction of the social
sector size criteria) although there will still be some level of under-occupation moving forward with
regard to older person and working households who may be able to continue to under-occupy their
current homes.
6.7 The approach used is to interrogate information derived in the projections about the number of
household reference persons (HRPs) in each age and sex group and apply this to the profile of
housing within these groups. The data for this analysis has been formed from a commissioned table
by ONS (Table C1213 which provides relevant data for all local authorities in England) with data
Output recommendations for housing requirements by tenure and size of housing
Output recommendations for housing requirements by tenure and size of housing
Model future requirements for market and affordable housing by size and compare to existing profile of homes
Model future requirements for market and affordable housing by size and compare to existing profile of homes
Draw together housing needs, viability and funding issues to consider affordable housing delivery
Draw together housing needs, viability and funding issues to consider affordable housing delivery
Project how the profile of households of different ages will change in future
Project how the profile of households of different ages will change in future
Establish how households of different ages occupy homes (by tenure) Establish how households of different ages occupy homes (by tenure)
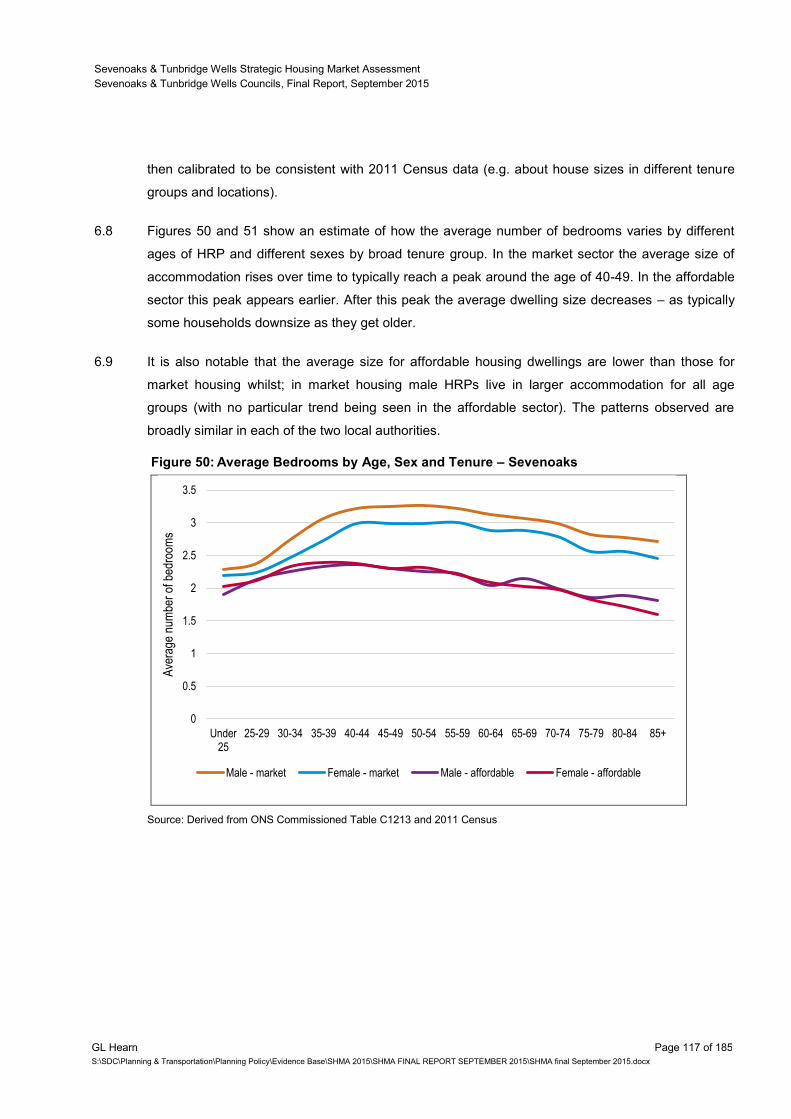
Sevenoaks & Tunbridge Wells Strategic Housing Market Assessment
Sevenoaks & Tunbridge Wells Councils, Final Report, September 2015
GL Hearn Page 117 of 185
S:\SDC\Planning & Transportation\Planning Policy\Evidence Base\SHMA 2015\SHMA FINAL REPORT SEPTEMBER 2015\SHMA final September 2015.docx
then calibrated to be consistent with 2011 Census data (e.g. about house sizes in different tenure
groups and locations).
6.8 Figures 50 and 51 show an estimate of how the average number of bedrooms varies by different
ages of HRP and different sexes by broad tenure group. In the market sector the average size of
accommodation rises over time to typically reach a peak around the age of 40-49. In the affordable
sector this peak appears earlier. After this peak the average dwelling size decreases – as typically
some households downsize as they get older.
6.9 It is also notable that the average size for affordable housing dwellings are lower than those for
market housing whilst; in market housing male HRPs live in larger accommodation for all age
groups (with no particular trend being seen in the affordable sector). The patterns observed are
broadly similar in each of the two local authorities.
Figure 50: Average Bedrooms by Age, Sex and Tenure – Sevenoaks
Source: Derived from ONS Commissioned Table C1213 and 2011 Census
0
0.5
1
1.5
2
2.5
3
3.5
Under25
25-29 30-34 35-39 40-44 45-49 50-54 55-59 60-64 65-69 70-74 75-79 80-84 85+
Ave
rage
num
ber
of b
edro
oms
Male - market Female - market Male - affordable Female - affordable
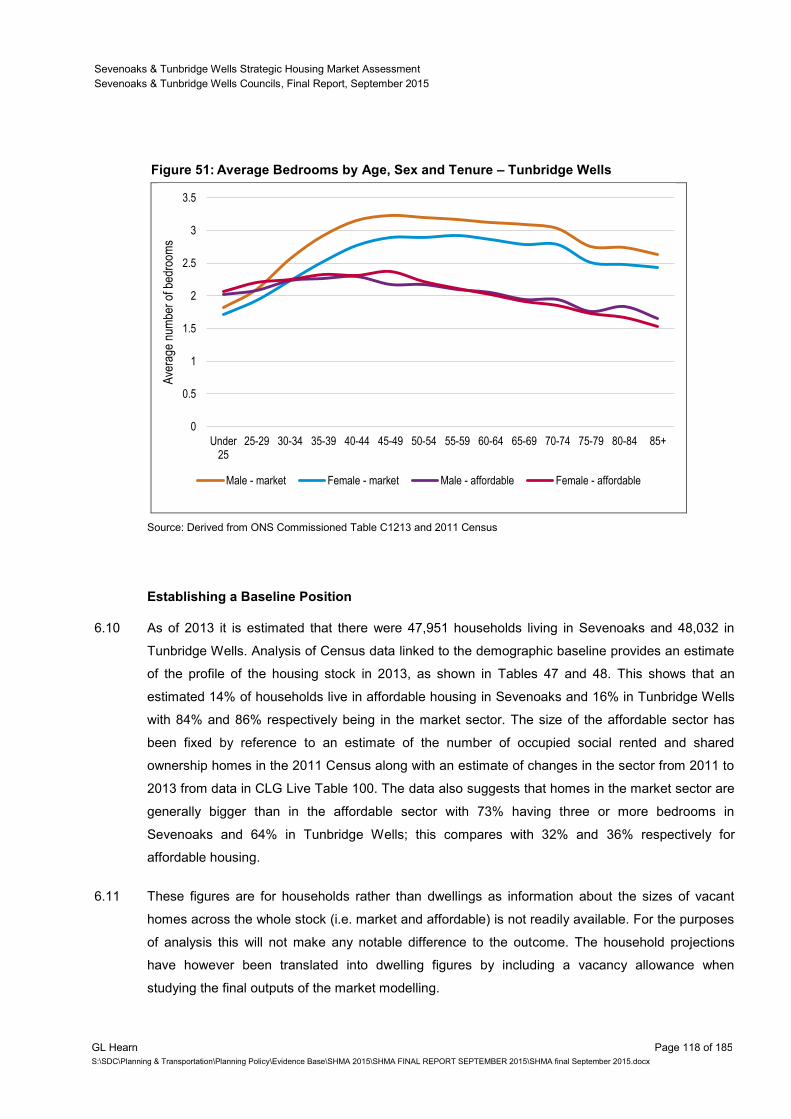
Sevenoaks & Tunbridge Wells Strategic Housing Market Assessment
Sevenoaks & Tunbridge Wells Councils, Final Report, September 2015
GL Hearn Page 118 of 185
S:\SDC\Planning & Transportation\Planning Policy\Evidence Base\SHMA 2015\SHMA FINAL REPORT SEPTEMBER 2015\SHMA final September 2015.docx
Figure 51: Average Bedrooms by Age, Sex and Tenure – Tunbridge Wells
Source: Derived from ONS Commissioned Table C1213 and 2011 Census
Establishing a Baseline Position
6.10 As of 2013 it is estimated that there were 47,951 households living in Sevenoaks and 48,032 in
Tunbridge Wells. Analysis of Census data linked to the demographic baseline provides an estimate
of the profile of the housing stock in 2013, as shown in Tables 47 and 48. This shows that an
estimated 14% of households live in affordable housing in Sevenoaks and 16% in Tunbridge Wells
with 84% and 86% respectively being in the market sector. The size of the affordable sector has
been fixed by reference to an estimate of the number of occupied social rented and shared
ownership homes in the 2011 Census along with an estimate of changes in the sector from 2011 to
2013 from data in CLG Live Table 100. The data also suggests that homes in the market sector are
generally bigger than in the affordable sector with 73% having three or more bedrooms in
Sevenoaks and 64% in Tunbridge Wells; this compares with 32% and 36% respectively for
affordable housing.
6.11 These figures are for households rather than dwellings as information about the sizes of vacant
homes across the whole stock (i.e. market and affordable) is not readily available. For the purposes
of analysis this will not make any notable difference to the outcome. The household projections
have however been translated into dwelling figures by including a vacancy allowance when
studying the final outputs of the market modelling.
0
0.5
1
1.5
2
2.5
3
3.5
Under25
25-29 30-34 35-39 40-44 45-49 50-54 55-59 60-64 65-69 70-74 75-79 80-84 85+
Ave
rage
num
ber
of b
edro
oms
Male - market Female - market Male - affordable Female - affordable
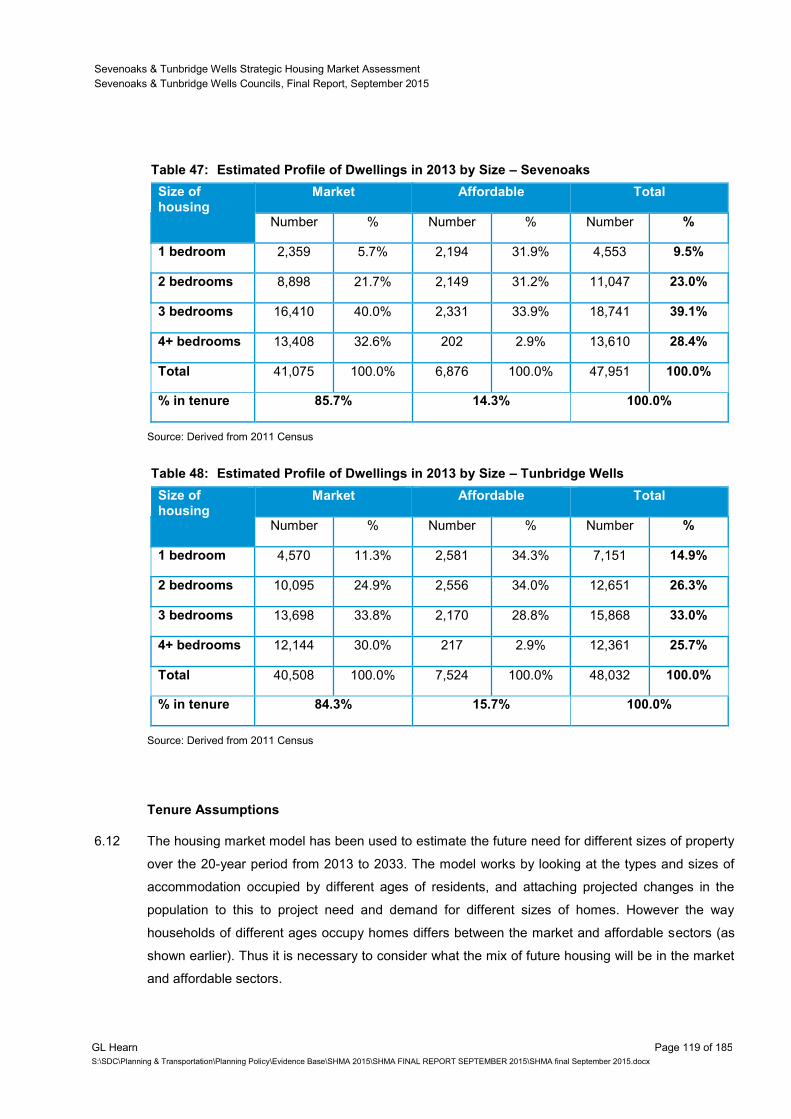
Sevenoaks & Tunbridge Wells Strategic Housing Market Assessment
Sevenoaks & Tunbridge Wells Councils, Final Report, September 2015
GL Hearn Page 119 of 185
S:\SDC\Planning & Transportation\Planning Policy\Evidence Base\SHMA 2015\SHMA FINAL REPORT SEPTEMBER 2015\SHMA final September 2015.docx
Table 47: Estimated Profile of Dwellings in 2013 by Size – Sevenoaks
Size of housing
Market Affordable Total
Number % Number % Number %
1 bedroom 2,359 5.7% 2,194 31.9% 4,553 9.5%
2 bedrooms 8,898 21.7% 2,149 31.2% 11,047 23.0%
3 bedrooms 16,410 40.0% 2,331 33.9% 18,741 39.1%
4+ bedrooms 13,408 32.6% 202 2.9% 13,610 28.4%
Total 41,075 100.0% 6,876 100.0% 47,951 100.0%
% in tenure 85.7% 14.3% 100.0%
Source: Derived from 2011 Census
Table 48: Estimated Profile of Dwellings in 2013 by Size – Tunbridge Wells
Size of housing
Market Affordable Total
Number % Number % Number %
1 bedroom 4,570 11.3% 2,581 34.3% 7,151 14.9%
2 bedrooms 10,095 24.9% 2,556 34.0% 12,651 26.3%
3 bedrooms 13,698 33.8% 2,170 28.8% 15,868 33.0%
4+ bedrooms 12,144 30.0% 217 2.9% 12,361 25.7%
Total 40,508 100.0% 7,524 100.0% 48,032 100.0%
% in tenure 84.3% 15.7% 100.0%
Source: Derived from 2011 Census
Tenure Assumptions
6.12 The housing market model has been used to estimate the future need for different sizes of property
over the 20-year period from 2013 to 2033. The model works by looking at the types and sizes of
accommodation occupied by different ages of residents, and attaching projected changes in the
population to this to project need and demand for different sizes of homes. However the way
households of different ages occupy homes differs between the market and affordable sectors (as
shown earlier). Thus it is necessary to consider what the mix of future housing will be in the market
and affordable sectors.
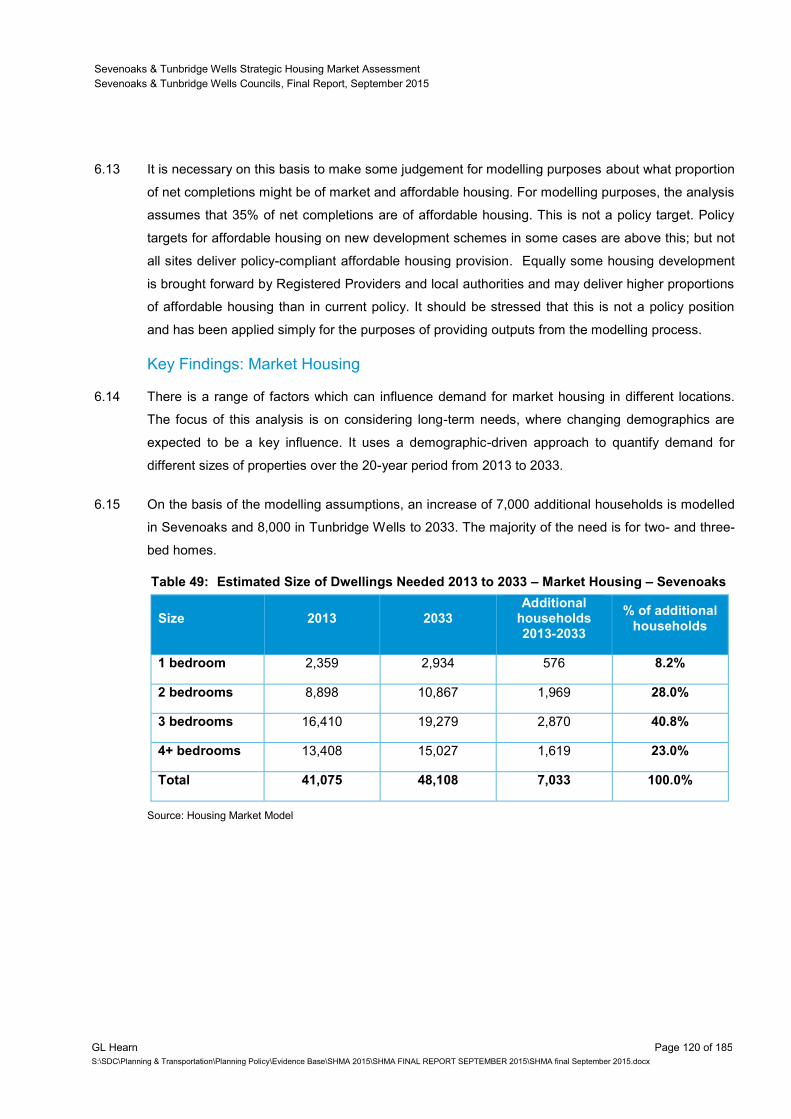
Sevenoaks & Tunbridge Wells Strategic Housing Market Assessment
Sevenoaks & Tunbridge Wells Councils, Final Report, September 2015
GL Hearn Page 120 of 185
S:\SDC\Planning & Transportation\Planning Policy\Evidence Base\SHMA 2015\SHMA FINAL REPORT SEPTEMBER 2015\SHMA final September 2015.docx
6.13 It is necessary on this basis to make some judgement for modelling purposes about what proportion
of net completions might be of market and affordable housing. For modelling purposes, the analysis
assumes that 35% of net completions are of affordable housing. This is not a policy target. Policy
targets for affordable housing on new development schemes in some cases are above this; but not
all sites deliver policy-compliant affordable housing provision. Equally some housing development
is brought forward by Registered Providers and local authorities and may deliver higher proportions
of affordable housing than in current policy. It should be stressed that this is not a policy position
and has been applied simply for the purposes of providing outputs from the modelling process.
Key Findings: Market Housing
6.14 There is a range of factors which can influence demand for market housing in different locations.
The focus of this analysis is on considering long-term needs, where changing demographics are
expected to be a key influence. It uses a demographic-driven approach to quantify demand for
different sizes of properties over the 20-year period from 2013 to 2033.
6.15 On the basis of the modelling assumptions, an increase of 7,000 additional households is modelled
in Sevenoaks and 8,000 in Tunbridge Wells to 2033. The majority of the need is for two- and three-
bed homes.
Table 49: Estimated Size of Dwellings Needed 2013 to 2033 – Market Housing – Sevenoaks
Size 2013 2033 Additional
households 2013-2033
% of additional households
1 bedroom 2,359 2,934 576 8.2%
2 bedrooms 8,898 10,867 1,969 28.0%
3 bedrooms 16,410 19,279 2,870 40.8%
4+ bedrooms 13,408 15,027 1,619 23.0%
Total 41,075 48,108 7,033 100.0%
Source: Housing Market Model
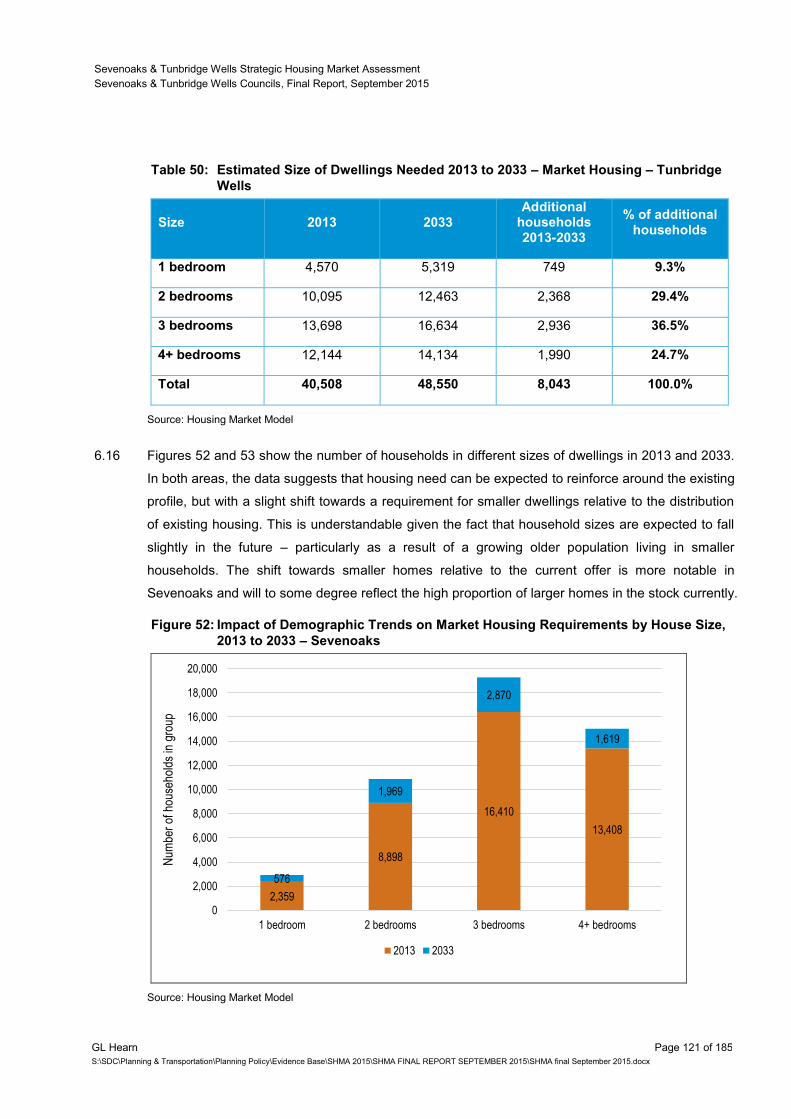
Sevenoaks & Tunbridge Wells Strategic Housing Market Assessment
Sevenoaks & Tunbridge Wells Councils, Final Report, September 2015
GL Hearn Page 121 of 185
S:\SDC\Planning & Transportation\Planning Policy\Evidence Base\SHMA 2015\SHMA FINAL REPORT SEPTEMBER 2015\SHMA final September 2015.docx
Table 50: Estimated Size of Dwellings Needed 2013 to 2033 – Market Housing – Tunbridge
Wells
Size 2013 2033 Additional
households 2013-2033
% of additional households
1 bedroom 4,570 5,319 749 9.3%
2 bedrooms 10,095 12,463 2,368 29.4%
3 bedrooms 13,698 16,634 2,936 36.5%
4+ bedrooms 12,144 14,134 1,990 24.7%
Total 40,508 48,550 8,043 100.0%
Source: Housing Market Model
6.16 Figures 52 and 53 show the number of households in different sizes of dwellings in 2013 and 2033.
In both areas, the data suggests that housing need can be expected to reinforce around the existing
profile, but with a slight shift towards a requirement for smaller dwellings relative to the distribution
of existing housing. This is understandable given the fact that household sizes are expected to fall
slightly in the future – particularly as a result of a growing older population living in smaller
households. The shift towards smaller homes relative to the current offer is more notable in
Sevenoaks and will to some degree reflect the high proportion of larger homes in the stock currently.
Figure 52: Impact of Demographic Trends on Market Housing Requirements by House Size,
2013 to 2033 – Sevenoaks
Source: Housing Market Model
2,359
8,898
16,410
13,408
576
1,969
2,870
1,619
0
2,000
4,000
6,000
8,000
10,000
12,000
14,000
16,000
18,000
20,000
1 bedroom 2 bedrooms 3 bedrooms 4+ bedrooms
Num
ber
of h
ouse
hold
s in
gro
up
2013 2033
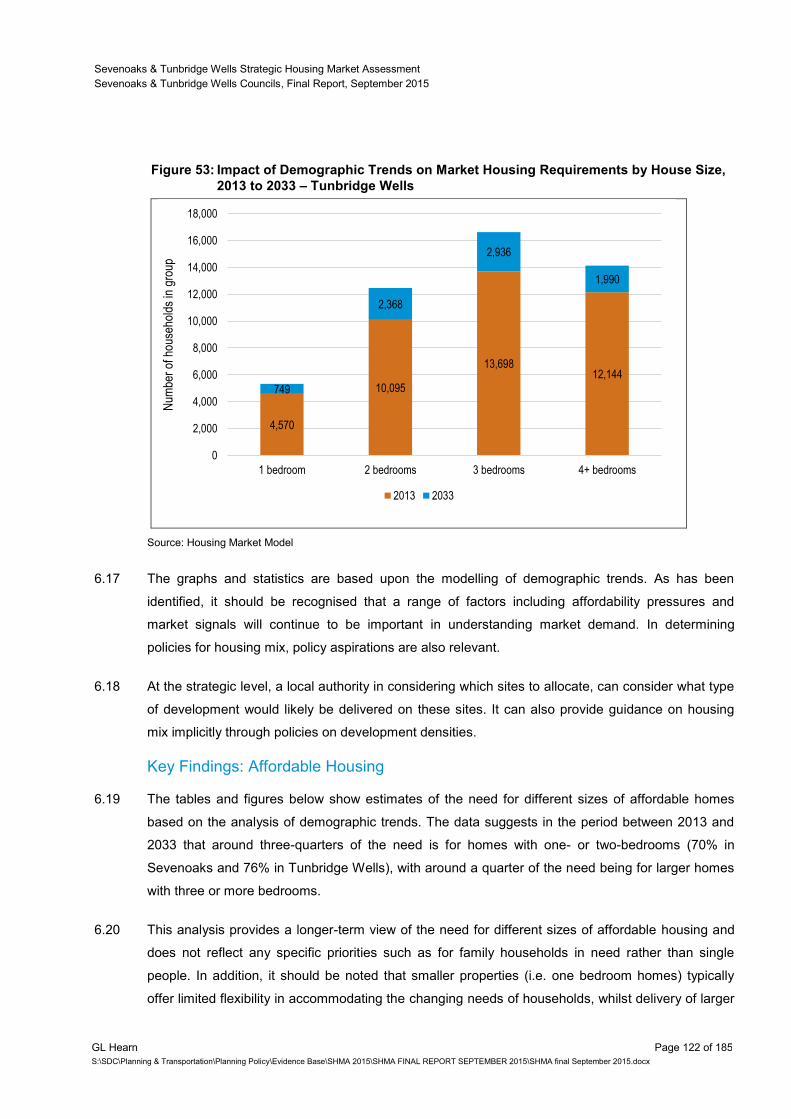
Sevenoaks & Tunbridge Wells Strategic Housing Market Assessment
Sevenoaks & Tunbridge Wells Councils, Final Report, September 2015
GL Hearn Page 122 of 185
S:\SDC\Planning & Transportation\Planning Policy\Evidence Base\SHMA 2015\SHMA FINAL REPORT SEPTEMBER 2015\SHMA final September 2015.docx
Figure 53: Impact of Demographic Trends on Market Housing Requirements by House Size,
2013 to 2033 – Tunbridge Wells
Source: Housing Market Model
6.17 The graphs and statistics are based upon the modelling of demographic trends. As has been
identified, it should be recognised that a range of factors including affordability pressures and
market signals will continue to be important in understanding market demand. In determining
policies for housing mix, policy aspirations are also relevant.
6.18 At the strategic level, a local authority in considering which sites to allocate, can consider what type
of development would likely be delivered on these sites. It can also provide guidance on housing
mix implicitly through policies on development densities.
Key Findings: Affordable Housing
6.19 The tables and figures below show estimates of the need for different sizes of affordable homes
based on the analysis of demographic trends. The data suggests in the period between 2013 and
2033 that around three-quarters of the need is for homes with one- or two-bedrooms (70% in
Sevenoaks and 76% in Tunbridge Wells), with around a quarter of the need being for larger homes
with three or more bedrooms.
6.20 This analysis provides a longer-term view of the need for different sizes of affordable housing and
does not reflect any specific priorities such as for family households in need rather than single
people. In addition, it should be noted that smaller properties (i.e. one bedroom homes) typically
offer limited flexibility in accommodating the changing needs of households, whilst delivery of larger
4,570
10,095
13,698 12,144
749
2,368
2,936
1,990
0
2,000
4,000
6,000
8,000
10,000
12,000
14,000
16,000
18,000
1 bedroom 2 bedrooms 3 bedrooms 4+ bedrooms
Num
ber
of h
ouse
hold
s in
gro
up
2013 2033
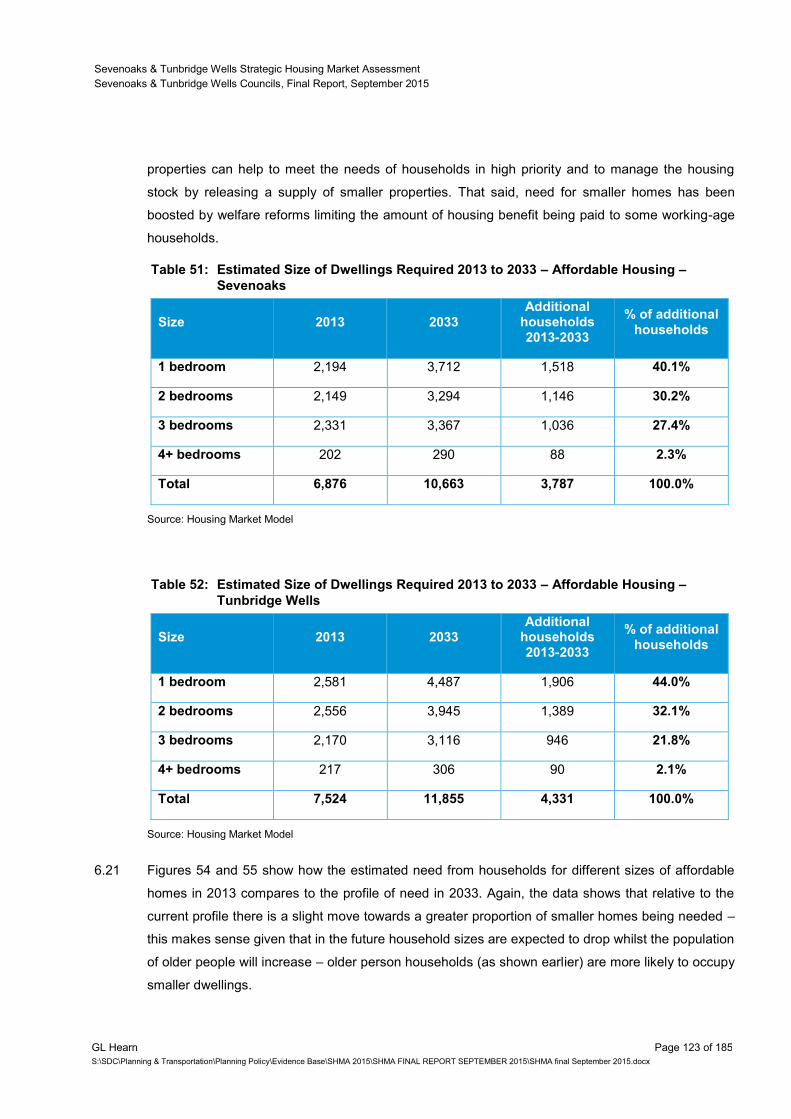
Sevenoaks & Tunbridge Wells Strategic Housing Market Assessment
Sevenoaks & Tunbridge Wells Councils, Final Report, September 2015
GL Hearn Page 123 of 185
S:\SDC\Planning & Transportation\Planning Policy\Evidence Base\SHMA 2015\SHMA FINAL REPORT SEPTEMBER 2015\SHMA final September 2015.docx
properties can help to meet the needs of households in high priority and to manage the housing
stock by releasing a supply of smaller properties. That said, need for smaller homes has been
boosted by welfare reforms limiting the amount of housing benefit being paid to some working-age
households.
Table 51: Estimated Size of Dwellings Required 2013 to 2033 – Affordable Housing –
Sevenoaks
Size 2013 2033 Additional
households 2013-2033
% of additional households
1 bedroom 2,194 3,712 1,518 40.1%
2 bedrooms 2,149 3,294 1,146 30.2%
3 bedrooms 2,331 3,367 1,036 27.4%
4+ bedrooms 202 290 88 2.3%
Total 6,876 10,663 3,787 100.0%
Source: Housing Market Model
Table 52: Estimated Size of Dwellings Required 2013 to 2033 – Affordable Housing –
Tunbridge Wells
Size 2013 2033 Additional
households 2013-2033
% of additional households
1 bedroom 2,581 4,487 1,906 44.0%
2 bedrooms 2,556 3,945 1,389 32.1%
3 bedrooms 2,170 3,116 946 21.8%
4+ bedrooms 217 306 90 2.1%
Total 7,524 11,855 4,331 100.0%
Source: Housing Market Model
6.21 Figures 54 and 55 show how the estimated need from households for different sizes of affordable
homes in 2013 compares to the profile of need in 2033. Again, the data shows that relative to the
current profile there is a slight move towards a greater proportion of smaller homes being needed –
this makes sense given that in the future household sizes are expected to drop whilst the population
of older people will increase – older person households (as shown earlier) are more likely to occupy
smaller dwellings.
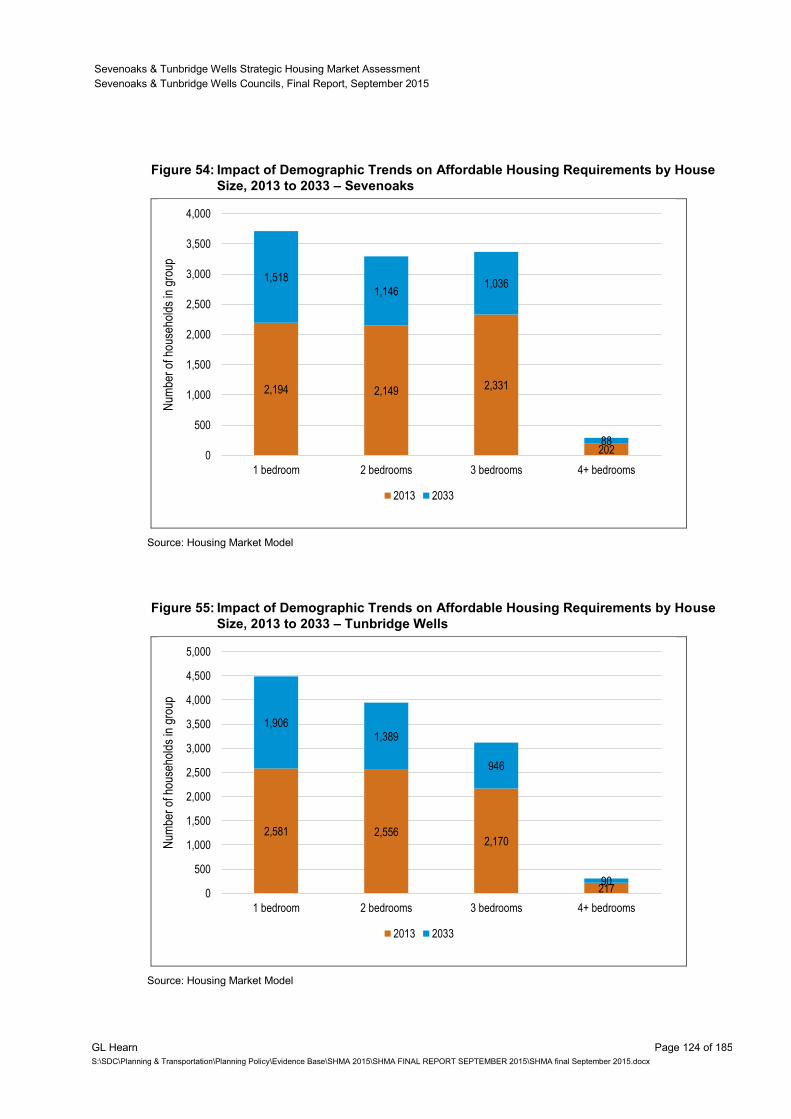
Sevenoaks & Tunbridge Wells Strategic Housing Market Assessment
Sevenoaks & Tunbridge Wells Councils, Final Report, September 2015
GL Hearn Page 124 of 185
S:\SDC\Planning & Transportation\Planning Policy\Evidence Base\SHMA 2015\SHMA FINAL REPORT SEPTEMBER 2015\SHMA final September 2015.docx
Figure 54: Impact of Demographic Trends on Affordable Housing Requirements by House
Size, 2013 to 2033 – Sevenoaks
Source: Housing Market Model
Figure 55: Impact of Demographic Trends on Affordable Housing Requirements by House
Size, 2013 to 2033 – Tunbridge Wells
Source: Housing Market Model
2,194 2,149 2,331
202
1,518 1,146
1,036
88
0
500
1,000
1,500
2,000
2,500
3,000
3,500
4,000
1 bedroom 2 bedrooms 3 bedrooms 4+ bedrooms
Num
ber
of h
ouse
hold
s in
gro
up
2013 2033
2,581 2,556 2,170
217
1,906 1,389
946
90 0
500
1,000
1,500
2,000
2,500
3,000
3,500
4,000
4,500
5,000
1 bedroom 2 bedrooms 3 bedrooms 4+ bedrooms
Num
ber
of h
ouse
hold
s in
gro
up
2013 2033
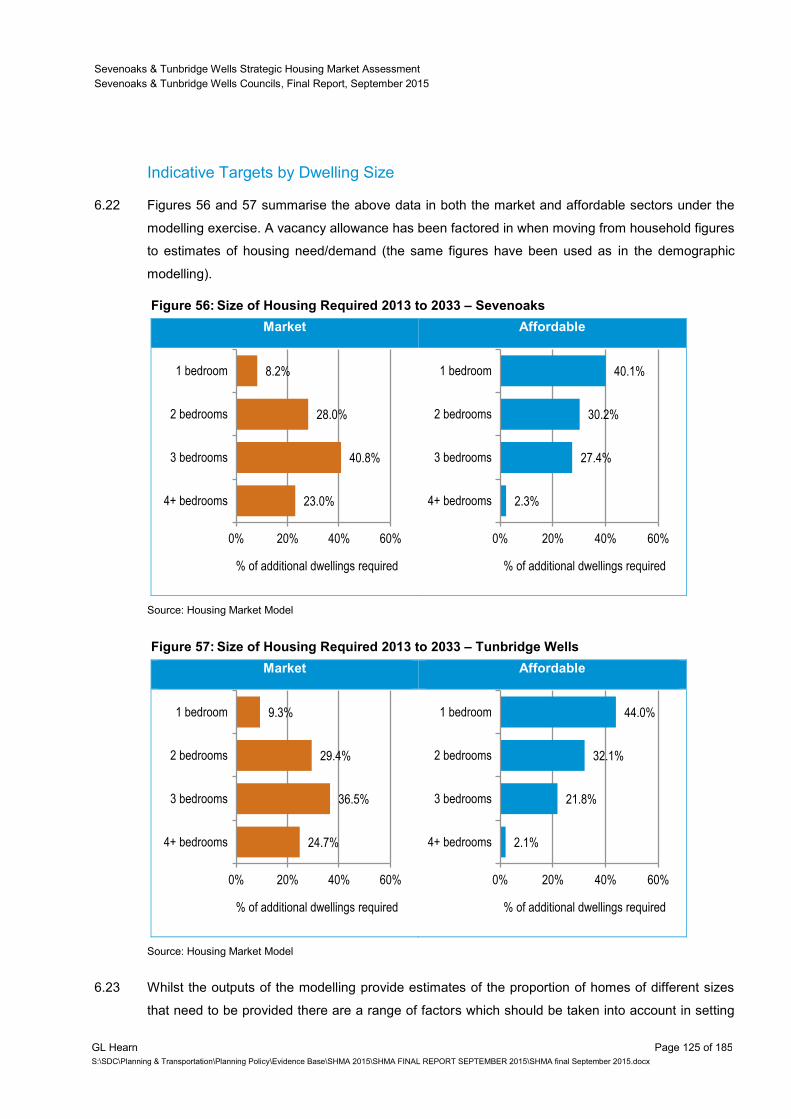
Sevenoaks & Tunbridge Wells Strategic Housing Market Assessment
Sevenoaks & Tunbridge Wells Councils, Final Report, September 2015
GL Hearn Page 125 of 185
S:\SDC\Planning & Transportation\Planning Policy\Evidence Base\SHMA 2015\SHMA FINAL REPORT SEPTEMBER 2015\SHMA final September 2015.docx
Indicative Targets by Dwelling Size
6.22 Figures 56 and 57 summarise the above data in both the market and affordable sectors under the
modelling exercise. A vacancy allowance has been factored in when moving from household figures
to estimates of housing need/demand (the same figures have been used as in the demographic
modelling).
Figure 56: Size of Housing Required 2013 to 2033 – Sevenoaks
Market Affordable
Source: Housing Market Model
Figure 57: Size of Housing Required 2013 to 2033 – Tunbridge Wells
Market Affordable
Source: Housing Market Model
6.23 Whilst the outputs of the modelling provide estimates of the proportion of homes of different sizes
that need to be provided there are a range of factors which should be taken into account in setting
23.0%
40.8%
28.0%
8.2%
0% 20% 40% 60%
4+ bedrooms
3 bedrooms
2 bedrooms
1 bedroom
% of additional dwellings required
2.3%
27.4%
30.2%
40.1%
0% 20% 40% 60%
4+ bedrooms
3 bedrooms
2 bedrooms
1 bedroom
% of additional dwellings required
24.7%
36.5%
29.4%
9.3%
0% 20% 40% 60%
4+ bedrooms
3 bedrooms
2 bedrooms
1 bedroom
% of additional dwellings required
2.1%
21.8%
32.1%
44.0%
0% 20% 40% 60%
4+ bedrooms
3 bedrooms
2 bedrooms
1 bedroom
% of additional dwellings required
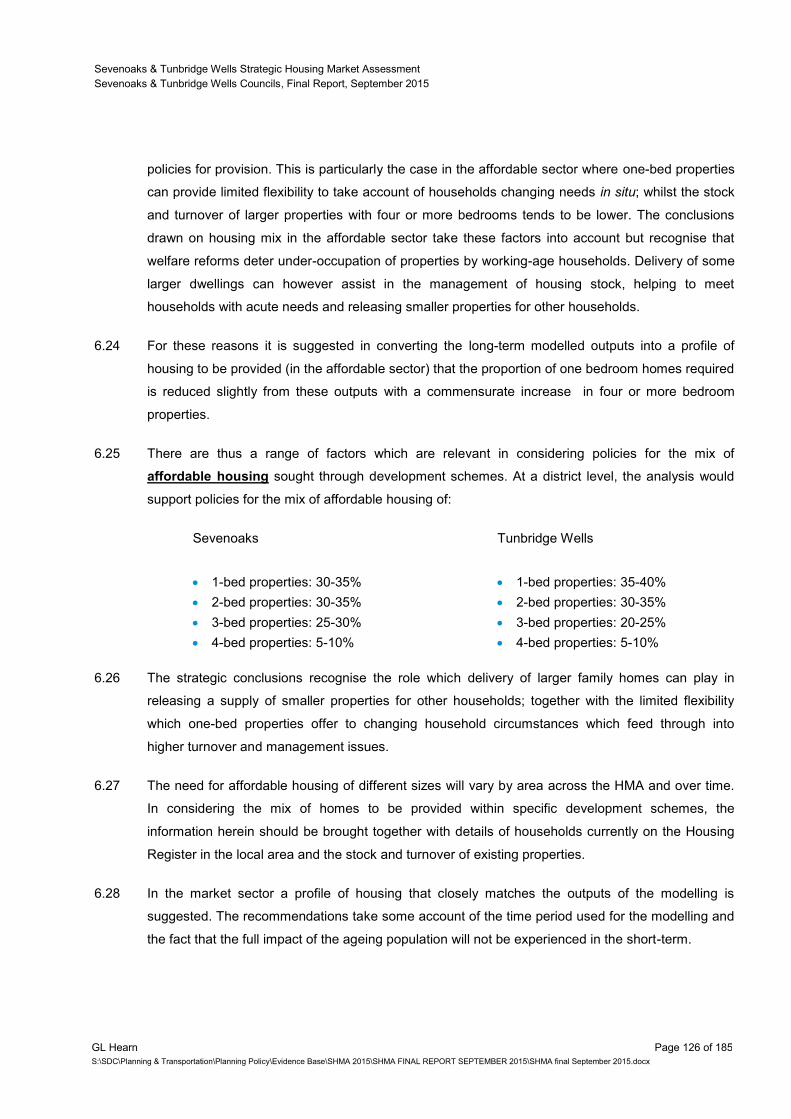
Sevenoaks & Tunbridge Wells Strategic Housing Market Assessment
Sevenoaks & Tunbridge Wells Councils, Final Report, September 2015
GL Hearn Page 126 of 185
S:\SDC\Planning & Transportation\Planning Policy\Evidence Base\SHMA 2015\SHMA FINAL REPORT SEPTEMBER 2015\SHMA final September 2015.docx
policies for provision. This is particularly the case in the affordable sector where one-bed properties
can provide limited flexibility to take account of households changing needs in situ; whilst the stock
and turnover of larger properties with four or more bedrooms tends to be lower. The conclusions
drawn on housing mix in the affordable sector take these factors into account but recognise that
welfare reforms deter under-occupation of properties by working-age households. Delivery of some
larger dwellings can however assist in the management of housing stock, helping to meet
households with acute needs and releasing smaller properties for other households.
6.24 For these reasons it is suggested in converting the long-term modelled outputs into a profile of
housing to be provided (in the affordable sector) that the proportion of one bedroom homes required
is reduced slightly from these outputs with a commensurate increase in four or more bedroom
properties.
6.25 There are thus a range of factors which are relevant in considering policies for the mix of
affordable housing sought through development schemes. At a district level, the analysis would
support policies for the mix of affordable housing of:
Sevenoaks Tunbridge Wells
1-bed properties: 30-35%
2-bed properties: 30-35%
3-bed properties: 25-30%
4-bed properties: 5-10%
1-bed properties: 35-40%
2-bed properties: 30-35%
3-bed properties: 20-25%
4-bed properties: 5-10%
6.26 The strategic conclusions recognise the role which delivery of larger family homes can play in
releasing a supply of smaller properties for other households; together with the limited flexibility
which one-bed properties offer to changing household circumstances which feed through into
higher turnover and management issues.
6.27 The need for affordable housing of different sizes will vary by area across the HMA and over time.
In considering the mix of homes to be provided within specific development schemes, the
information herein should be brought together with details of households currently on the Housing
Register in the local area and the stock and turnover of existing properties.
6.28 In the market sector a profile of housing that closely matches the outputs of the modelling is
suggested. The recommendations take some account of the time period used for the modelling and
the fact that the full impact of the ageing population will not be experienced in the short-term.
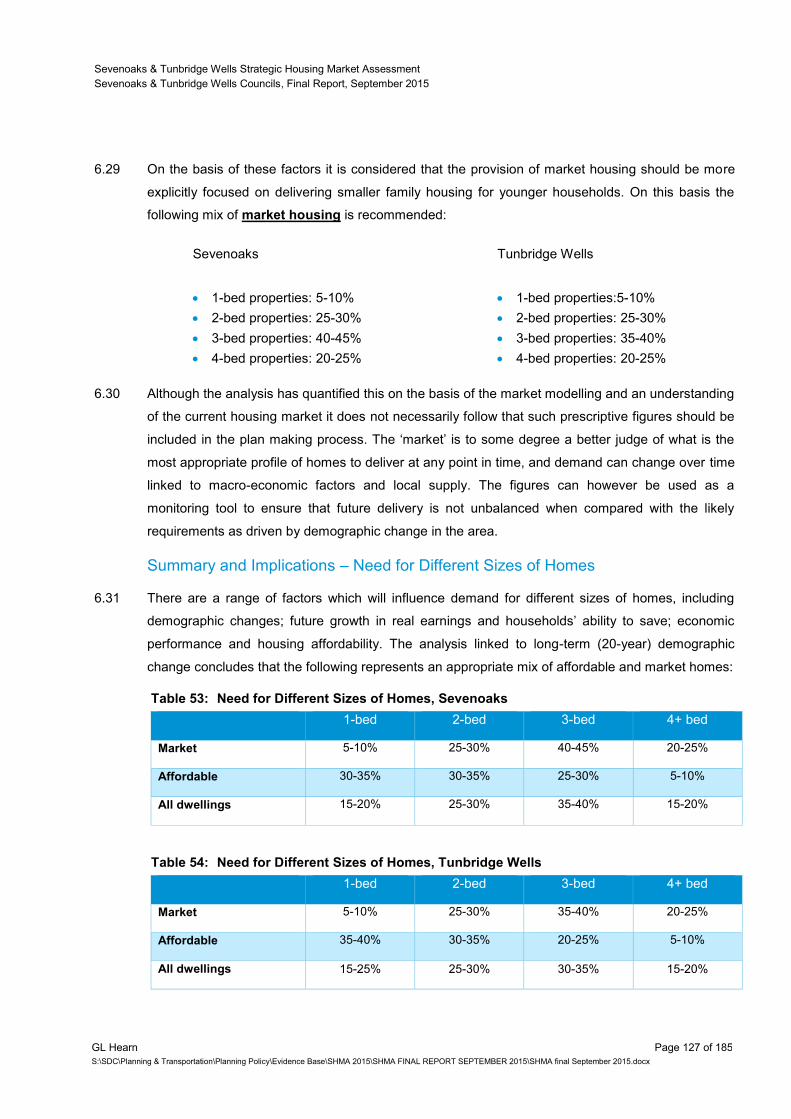
Sevenoaks & Tunbridge Wells Strategic Housing Market Assessment
Sevenoaks & Tunbridge Wells Councils, Final Report, September 2015
GL Hearn Page 127 of 185
S:\SDC\Planning & Transportation\Planning Policy\Evidence Base\SHMA 2015\SHMA FINAL REPORT SEPTEMBER 2015\SHMA final September 2015.docx
6.29 On the basis of these factors it is considered that the provision of market housing should be more
explicitly focused on delivering smaller family housing for younger households. On this basis the
following mix of market housing is recommended:
Sevenoaks Tunbridge Wells
1-bed properties: 5-10%
2-bed properties: 25-30%
3-bed properties: 40-45%
4-bed properties: 20-25%
1-bed properties:5-10%
2-bed properties: 25-30%
3-bed properties: 35-40%
4-bed properties: 20-25%
6.30 Although the analysis has quantified this on the basis of the market modelling and an understanding
of the current housing market it does not necessarily follow that such prescriptive figures should be
included in the plan making process. The ‘market’ is to some degree a better judge of what is the
most appropriate profile of homes to deliver at any point in time, and demand can change over time
linked to macro-economic factors and local supply. The figures can however be used as a
monitoring tool to ensure that future delivery is not unbalanced when compared with the likely
requirements as driven by demographic change in the area.
Summary and Implications – Need for Different Sizes of Homes
6.31 There are a range of factors which will influence demand for different sizes of homes, including
demographic changes; future growth in real earnings and households’ ability to save; economic
performance and housing affordability. The analysis linked to long-term (20-year) demographic
change concludes that the following represents an appropriate mix of affordable and market homes:
Table 53: Need for Different Sizes of Homes, Sevenoaks
1-bed 2-bed 3-bed 4+ bed
Market 5-10% 25-30% 40-45% 20-25%
Affordable 30-35% 30-35% 25-30% 5-10%
All dwellings 15-20% 25-30% 35-40% 15-20%
Table 54: Need for Different Sizes of Homes, Tunbridge Wells
1-bed 2-bed 3-bed 4+ bed
Market 5-10% 25-30% 35-40% 20-25%
Affordable 35-40% 30-35% 20-25% 5-10%
All dwellings 15-25% 25-30% 30-35% 15-20%
Sevenoaks & Tunbridge Wells Strategic Housing Market Assessment
Sevenoaks & Tunbridge Wells Councils, Final Report, September 2015
GL Hearn Page 128 of 185
S:\SDC\Planning & Transportation\Planning Policy\Evidence Base\SHMA 2015\SHMA FINAL REPORT SEPTEMBER 2015\SHMA final September 2015.docx
6.32 The strategic conclusions in the affordable sector recognise the role which delivery of larger family
homes can play in releasing supply of smaller properties for other households; together with the
limited flexibility which one-bed properties offer to changing household circumstances which feed
through into higher turnover and management issues.
6.33 The mix identified above should inform strategic District-wide policies. In applying these to
individual development sites regard should be had to the nature of the development site and
character of the area, and to up-to-date evidence of need as well as the existing mix and turnover of
properties at the local level.
6.34 Based on the evidence, it is expected that the focus of new market housing provision will be on two-
and three-bed properties. Continued demand for family housing can be expected from newly
forming households. There may also be some demand for medium-sized properties (2- and 3-beds)
from older households downsizing and looking to release equity in existing homes, but still retain
flexibility for friends and family to come and stay.
6.35 The analysis of an appropriate mix of dwellings should also inform the ‘portfolio’ of sites which are
considered by each local authority through its local plan process. Equally it will be of relevance to
affordable housing negotiations.
Sevenoaks & Tunbridge Wells Strategic Housing Market Assessment
Sevenoaks & Tunbridge Wells Councils, Final Report, September 2015
GL Hearn Page 129 of 185
S:\SDC\Planning & Transportation\Planning Policy\Evidence Base\SHMA 2015\SHMA FINAL REPORT SEPTEMBER 2015\SHMA final September 2015.docx
7 HOUSING NEEDS OF PARTICULAR GROUPS
Introduction
7.1 We have considered in the previous section the needs for different sizes of property. In this section
we move on to consider groups within the population who have specialist housing needs, or whose
housing needs differ from the wider population.
7.2 Estimates of household groups who have particular housing needs is a key output of the SHMA
guidance whilst the National Planning Policy Framework identifies that local planning authorities
should plan for a mix of housing which takes account of the needs of different groups in the
community.
7.3 The following key groups have been identified which may have housing needs which may differ
from those of the wider population:
Older Persons;
People with disabilities;
Black and Minority Ethnic (BME) households;
Households with children;
Young people; and
People wishing to build their own homes.
Housing Needs of Older People
7.4 The SHMA Guidance recognises the need to provide housing for older people as part of achieving
a good mix of housing. A key driver of change in the housing market over the next few years is
expected to be the growth in the population of older persons.
7.5 Indeed as the population projections in this report show, the number of older people is expected to
increase significantly over the next few years. In this section we draw on a range of sources
including our population projections, 2011 Census information and data from POPPI (Projecting
Older People Population Information).
7.6 In planning for a growing older population, it is important to recognise:
A need to provide housing for older people as part of achieving a good mix of housing, but
recognizing that many older people are able to exercise choice and control over housing
options – e.g. owner occupiers with equity in their homes;
Evidence of falling demand for residential care in some areas, and a rapidly rising average age
of people living in sheltered housing, requiring higher levels of support. However many local
authorities have struggled to contain expenditure on services for older people;
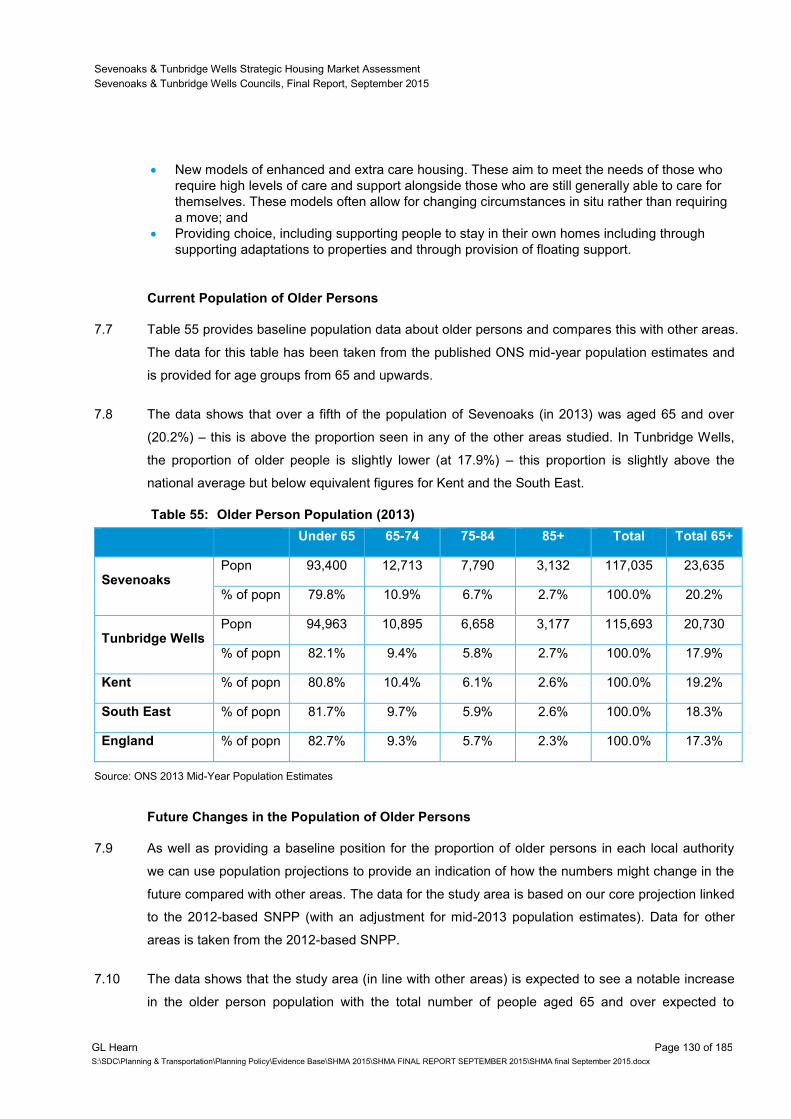
Sevenoaks & Tunbridge Wells Strategic Housing Market Assessment
Sevenoaks & Tunbridge Wells Councils, Final Report, September 2015
GL Hearn Page 130 of 185
S:\SDC\Planning & Transportation\Planning Policy\Evidence Base\SHMA 2015\SHMA FINAL REPORT SEPTEMBER 2015\SHMA final September 2015.docx
New models of enhanced and extra care housing. These aim to meet the needs of those who
require high levels of care and support alongside those who are still generally able to care for
themselves. These models often allow for changing circumstances in situ rather than requiring
a move; and
Providing choice, including supporting people to stay in their own homes including through
supporting adaptations to properties and through provision of floating support.
Current Population of Older Persons
7.7 Table 55 provides baseline population data about older persons and compares this with other areas.
The data for this table has been taken from the published ONS mid-year population estimates and
is provided for age groups from 65 and upwards.
7.8 The data shows that over a fifth of the population of Sevenoaks (in 2013) was aged 65 and over
(20.2%) – this is above the proportion seen in any of the other areas studied. In Tunbridge Wells,
the proportion of older people is slightly lower (at 17.9%) – this proportion is slightly above the
national average but below equivalent figures for Kent and the South East.
Table 55: Older Person Population (2013)
Under 65 65-74 75-84 85+ Total Total 65+
Sevenoaks Popn 93,400 12,713 7,790 3,132 117,035 23,635
% of popn 79.8% 10.9% 6.7% 2.7% 100.0% 20.2%
Tunbridge Wells Popn 94,963 10,895 6,658 3,177 115,693 20,730
% of popn 82.1% 9.4% 5.8% 2.7% 100.0% 17.9%
Kent % of popn 80.8% 10.4% 6.1% 2.6% 100.0% 19.2%
South East % of popn 81.7% 9.7% 5.9% 2.6% 100.0% 18.3%
England % of popn 82.7% 9.3% 5.7% 2.3% 100.0% 17.3%
Source: ONS 2013 Mid-Year Population Estimates
Future Changes in the Population of Older Persons
7.9 As well as providing a baseline position for the proportion of older persons in each local authority
we can use population projections to provide an indication of how the numbers might change in the
future compared with other areas. The data for the study area is based on our core projection linked
to the 2012-based SNPP (with an adjustment for mid-2013 population estimates). Data for other
areas is taken from the 2012-based SNPP.
7.10 The data shows that the study area (in line with other areas) is expected to see a notable increase
in the older person population with the total number of people aged 65 and over expected to
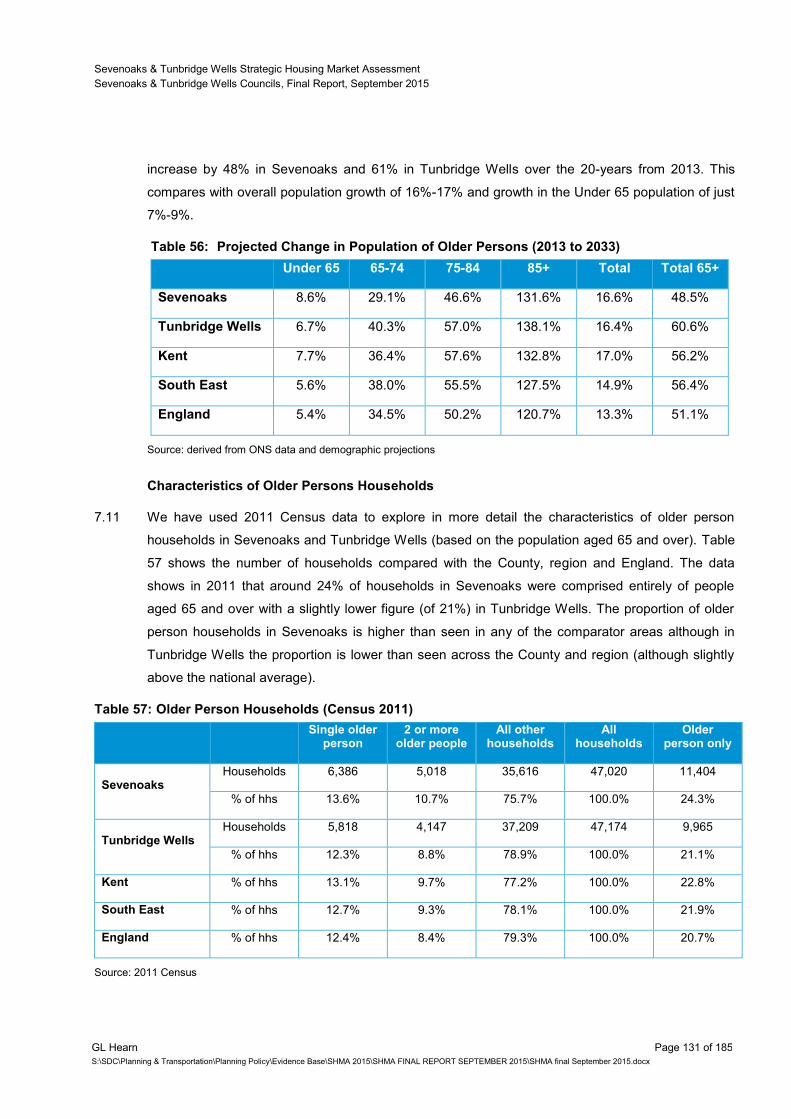
Sevenoaks & Tunbridge Wells Strategic Housing Market Assessment
Sevenoaks & Tunbridge Wells Councils, Final Report, September 2015
GL Hearn Page 131 of 185
S:\SDC\Planning & Transportation\Planning Policy\Evidence Base\SHMA 2015\SHMA FINAL REPORT SEPTEMBER 2015\SHMA final September 2015.docx
increase by 48% in Sevenoaks and 61% in Tunbridge Wells over the 20-years from 2013. This
compares with overall population growth of 16%-17% and growth in the Under 65 population of just
7%-9%.
Table 56: Projected Change in Population of Older Persons (2013 to 2033)
Under 65 65-74 75-84 85+ Total Total 65+
Sevenoaks 8.6% 29.1% 46.6% 131.6% 16.6% 48.5%
Tunbridge Wells 6.7% 40.3% 57.0% 138.1% 16.4% 60.6%
Kent 7.7% 36.4% 57.6% 132.8% 17.0% 56.2%
South East 5.6% 38.0% 55.5% 127.5% 14.9% 56.4%
England 5.4% 34.5% 50.2% 120.7% 13.3% 51.1%
Source: derived from ONS data and demographic projections
Characteristics of Older Persons Households
7.11 We have used 2011 Census data to explore in more detail the characteristics of older person
households in Sevenoaks and Tunbridge Wells (based on the population aged 65 and over). Table
57 shows the number of households compared with the County, region and England. The data
shows in 2011 that around 24% of households in Sevenoaks were comprised entirely of people
aged 65 and over with a slightly lower figure (of 21%) in Tunbridge Wells. The proportion of older
person households in Sevenoaks is higher than seen in any of the comparator areas although in
Tunbridge Wells the proportion is lower than seen across the County and region (although slightly
above the national average).
Table 57: Older Person Households (Census 2011)
Single older
person 2 or more
older people All other
households All
households Older
person only
Sevenoaks Households 6,386 5,018 35,616 47,020 11,404
% of hhs 13.6% 10.7% 75.7% 100.0% 24.3%
Tunbridge Wells Households 5,818 4,147 37,209 47,174 9,965
% of hhs 12.3% 8.8% 78.9% 100.0% 21.1%
Kent % of hhs 13.1% 9.7% 77.2% 100.0% 22.8%
South East % of hhs 12.7% 9.3% 78.1% 100.0% 21.9%
England % of hhs 12.4% 8.4% 79.3% 100.0% 20.7%
Source: 2011 Census
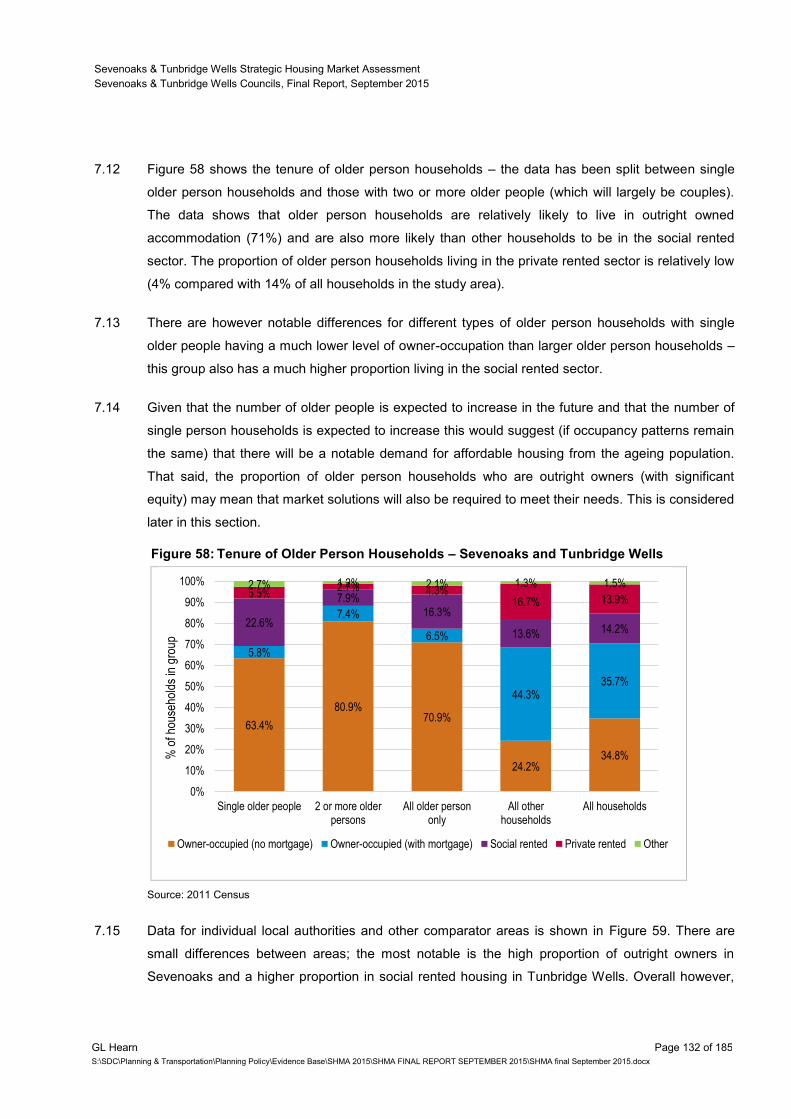
Sevenoaks & Tunbridge Wells Strategic Housing Market Assessment
Sevenoaks & Tunbridge Wells Councils, Final Report, September 2015
GL Hearn Page 132 of 185
S:\SDC\Planning & Transportation\Planning Policy\Evidence Base\SHMA 2015\SHMA FINAL REPORT SEPTEMBER 2015\SHMA final September 2015.docx
7.12 Figure 58 shows the tenure of older person households – the data has been split between single
older person households and those with two or more older people (which will largely be couples).
The data shows that older person households are relatively likely to live in outright owned
accommodation (71%) and are also more likely than other households to be in the social rented
sector. The proportion of older person households living in the private rented sector is relatively low
(4% compared with 14% of all households in the study area).
7.13 There are however notable differences for different types of older person households with single
older people having a much lower level of owner-occupation than larger older person households –
this group also has a much higher proportion living in the social rented sector.
7.14 Given that the number of older people is expected to increase in the future and that the number of
single person households is expected to increase this would suggest (if occupancy patterns remain
the same) that there will be a notable demand for affordable housing from the ageing population.
That said, the proportion of older person households who are outright owners (with significant
equity) may mean that market solutions will also be required to meet their needs. This is considered
later in this section.
Figure 58: Tenure of Older Person Households – Sevenoaks and Tunbridge Wells
Source: 2011 Census
7.15 Data for individual local authorities and other comparator areas is shown in Figure 59. There are
small differences between areas; the most notable is the high proportion of outright owners in
Sevenoaks and a higher proportion in social rented housing in Tunbridge Wells. Overall however,
63.4%
80.9% 70.9%
24.2% 34.8%
5.8%
7.4%
6.5%
44.3% 35.7%
22.6%
7.9%
16.3%
13.6% 14.2%
5.5% 2.7% 4.3%
16.7% 13.9%
2.7% 1.2% 2.1% 1.3% 1.5%
0%
10%
20%
30%
40%
50%
60%
70%
80%
90%
100%
Single older people 2 or more olderpersons
All older persononly
All otherhouseholds
All households
% o
f hou
seho
lds
in g
roup
Owner-occupied (no mortgage) Owner-occupied (with mortgage) Social rented Private rented Other
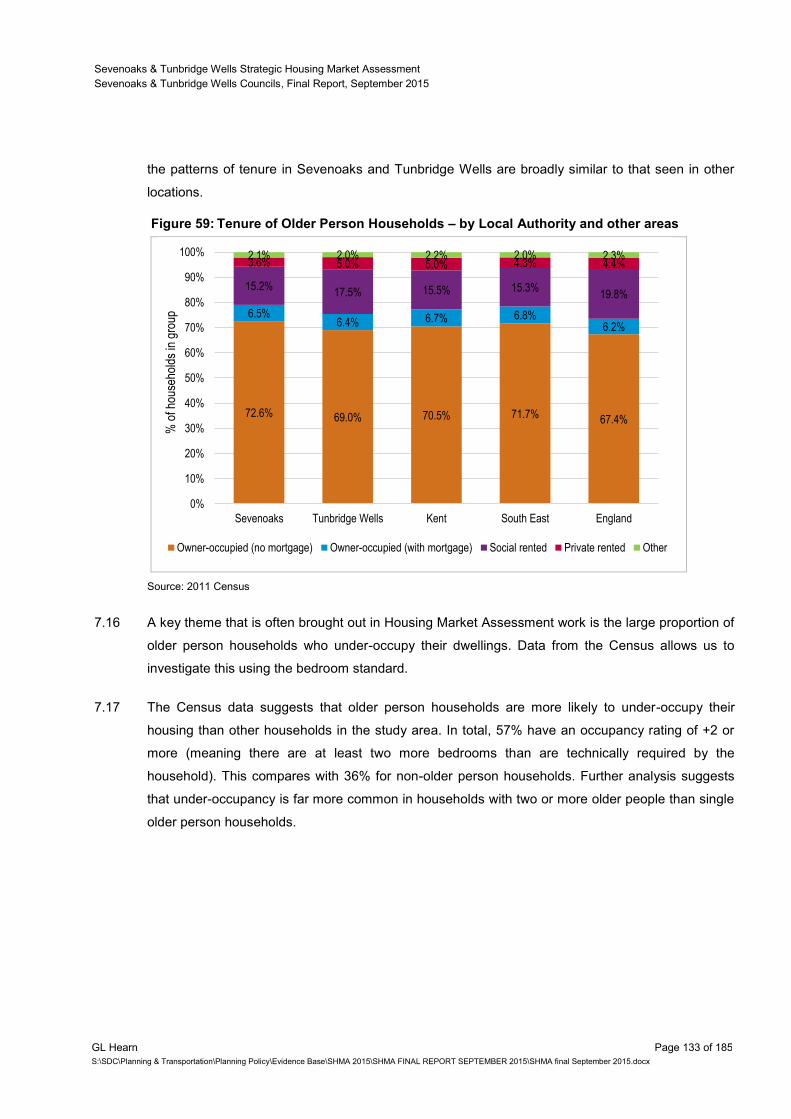
Sevenoaks & Tunbridge Wells Strategic Housing Market Assessment
Sevenoaks & Tunbridge Wells Councils, Final Report, September 2015
GL Hearn Page 133 of 185
S:\SDC\Planning & Transportation\Planning Policy\Evidence Base\SHMA 2015\SHMA FINAL REPORT SEPTEMBER 2015\SHMA final September 2015.docx
the patterns of tenure in Sevenoaks and Tunbridge Wells are broadly similar to that seen in other
locations.
Figure 59: Tenure of Older Person Households – by Local Authority and other areas
Source: 2011 Census
7.16 A key theme that is often brought out in Housing Market Assessment work is the large proportion of
older person households who under-occupy their dwellings. Data from the Census allows us to
investigate this using the bedroom standard.
7.17 The Census data suggests that older person households are more likely to under-occupy their
housing than other households in the study area. In total, 57% have an occupancy rating of +2 or
more (meaning there are at least two more bedrooms than are technically required by the
household). This compares with 36% for non-older person households. Further analysis suggests
that under-occupancy is far more common in households with two or more older people than single
older person households.
72.6% 69.0% 70.5% 71.7% 67.4%
6.5% 6.4% 6.7% 6.8%
6.2%
15.2% 17.5% 15.5% 15.3%
19.8%
3.6% 5.0% 5.0% 4.3% 4.4% 2.1% 2.0% 2.2% 2.0% 2.3%
0%
10%
20%
30%
40%
50%
60%
70%
80%
90%
100%
Sevenoaks Tunbridge Wells Kent South East England
% o
f hou
seho
lds
in g
roup
Owner-occupied (no mortgage) Owner-occupied (with mortgage) Social rented Private rented Other
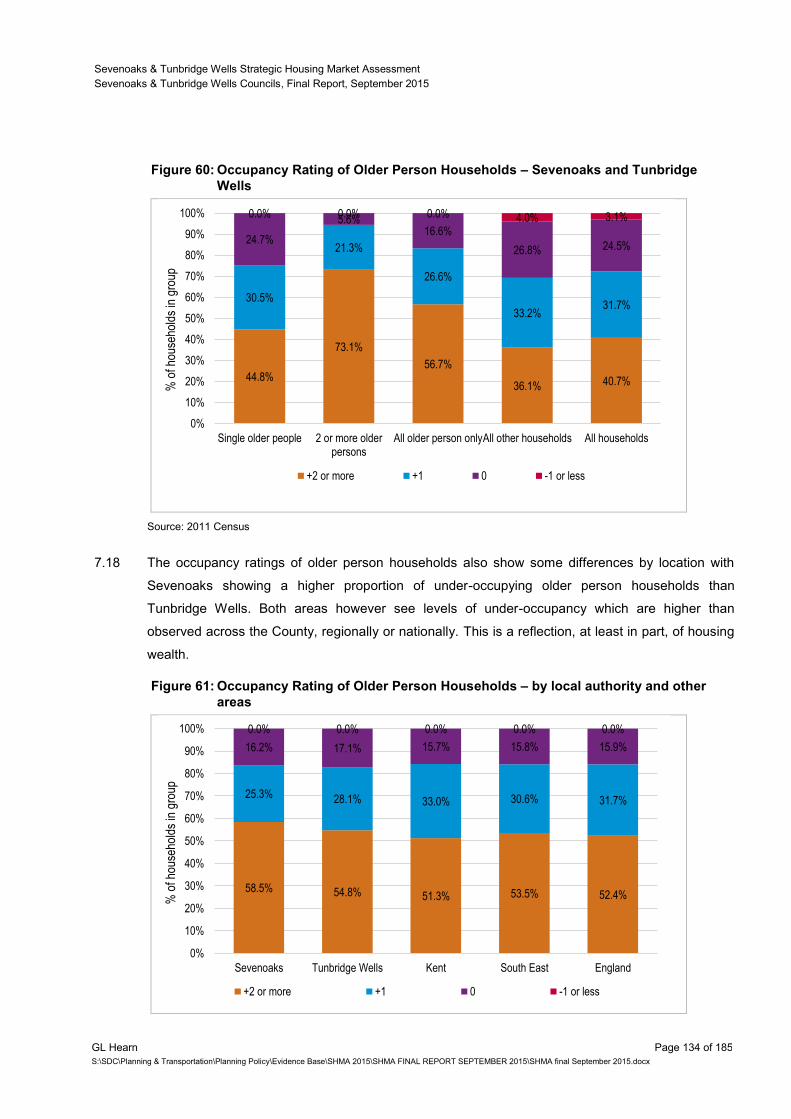
Sevenoaks & Tunbridge Wells Strategic Housing Market Assessment
Sevenoaks & Tunbridge Wells Councils, Final Report, September 2015
GL Hearn Page 134 of 185
S:\SDC\Planning & Transportation\Planning Policy\Evidence Base\SHMA 2015\SHMA FINAL REPORT SEPTEMBER 2015\SHMA final September 2015.docx
Figure 60: Occupancy Rating of Older Person Households – Sevenoaks and Tunbridge
Wells
Source: 2011 Census
7.18 The occupancy ratings of older person households also show some differences by location with
Sevenoaks showing a higher proportion of under-occupying older person households than
Tunbridge Wells. Both areas however see levels of under-occupancy which are higher than
observed across the County, regionally or nationally. This is a reflection, at least in part, of housing
wealth.
Figure 61: Occupancy Rating of Older Person Households – by local authority and other
areas
44.8%
73.1%
56.7%
36.1% 40.7%
30.5%
21.3%
26.6%
33.2% 31.7%
24.7%
5.6% 16.6%
26.8% 24.5%
0.0% 0.0% 0.0% 4.0% 3.1%
0%
10%
20%
30%
40%
50%
60%
70%
80%
90%
100%
Single older people 2 or more olderpersons
All older person onlyAll other households All households
% o
f hou
seho
lds
in g
roup
+2 or more +1 0 -1 or less
58.5% 54.8% 51.3% 53.5% 52.4%
25.3% 28.1% 33.0% 30.6% 31.7%
16.2% 17.1% 15.7% 15.8% 15.9%
0.0% 0.0% 0.0% 0.0% 0.0%
0%
10%
20%
30%
40%
50%
60%
70%
80%
90%
100%
Sevenoaks Tunbridge Wells Kent South East England
% o
f hou
seho
lds
in g
roup
+2 or more +1 0 -1 or less
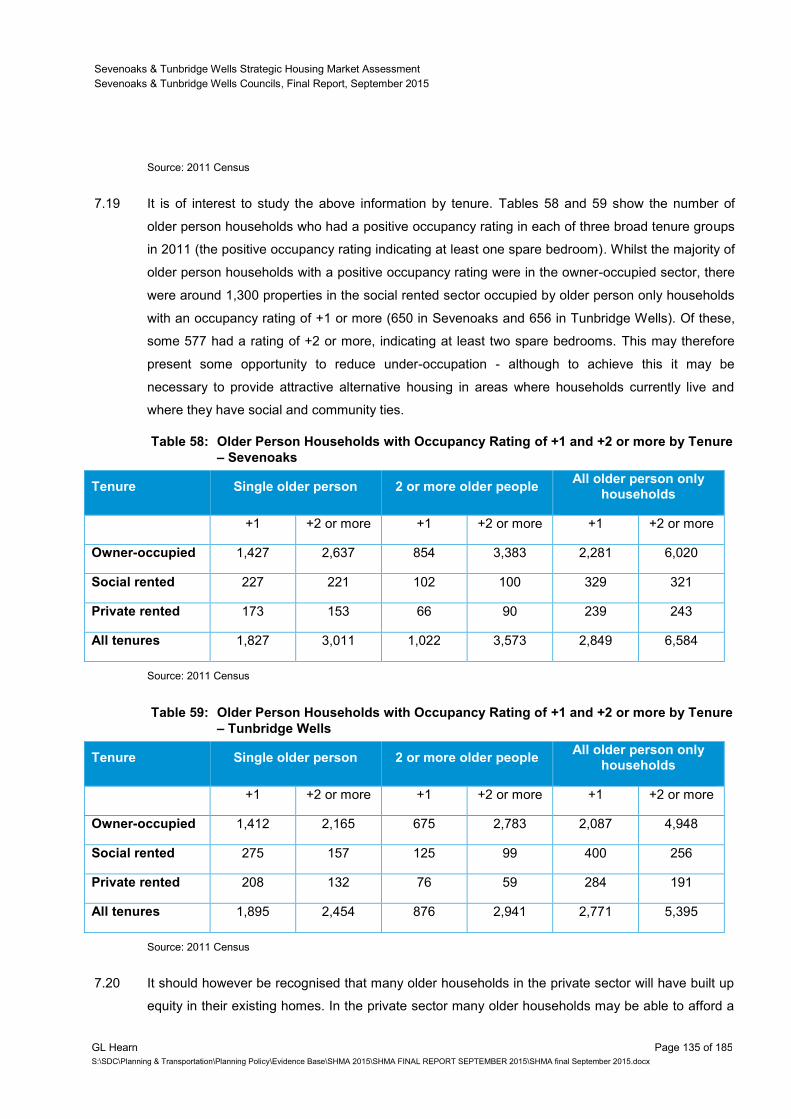
Sevenoaks & Tunbridge Wells Strategic Housing Market Assessment
Sevenoaks & Tunbridge Wells Councils, Final Report, September 2015
GL Hearn Page 135 of 185
S:\SDC\Planning & Transportation\Planning Policy\Evidence Base\SHMA 2015\SHMA FINAL REPORT SEPTEMBER 2015\SHMA final September 2015.docx
Source: 2011 Census
7.19 It is of interest to study the above information by tenure. Tables 58 and 59 show the number of
older person households who had a positive occupancy rating in each of three broad tenure groups
in 2011 (the positive occupancy rating indicating at least one spare bedroom). Whilst the majority of
older person households with a positive occupancy rating were in the owner-occupied sector, there
were around 1,300 properties in the social rented sector occupied by older person only households
with an occupancy rating of +1 or more (650 in Sevenoaks and 656 in Tunbridge Wells). Of these,
some 577 had a rating of +2 or more, indicating at least two spare bedrooms. This may therefore
present some opportunity to reduce under-occupation - although to achieve this it may be
necessary to provide attractive alternative housing in areas where households currently live and
where they have social and community ties.
Table 58: Older Person Households with Occupancy Rating of +1 and +2 or more by Tenure
– Sevenoaks
Tenure Single older person 2 or more older people All older person only
households
+1 +2 or more +1 +2 or more +1 +2 or more
Owner-occupied 1,427 2,637 854 3,383 2,281 6,020
Social rented 227 221 102 100 329 321
Private rented 173 153 66 90 239 243
All tenures 1,827 3,011 1,022 3,573 2,849 6,584
Source: 2011 Census
Table 59: Older Person Households with Occupancy Rating of +1 and +2 or more by Tenure
– Tunbridge Wells
Tenure Single older person 2 or more older people All older person only
households
+1 +2 or more +1 +2 or more +1 +2 or more
Owner-occupied 1,412 2,165 675 2,783 2,087 4,948
Social rented 275 157 125 99 400 256
Private rented 208 132 76 59 284 191
All tenures 1,895 2,454 876 2,941 2,771 5,395
Source: 2011 Census
7.20 It should however be recognised that many older households in the private sector will have built up
equity in their existing homes. In the private sector many older households may be able to afford a
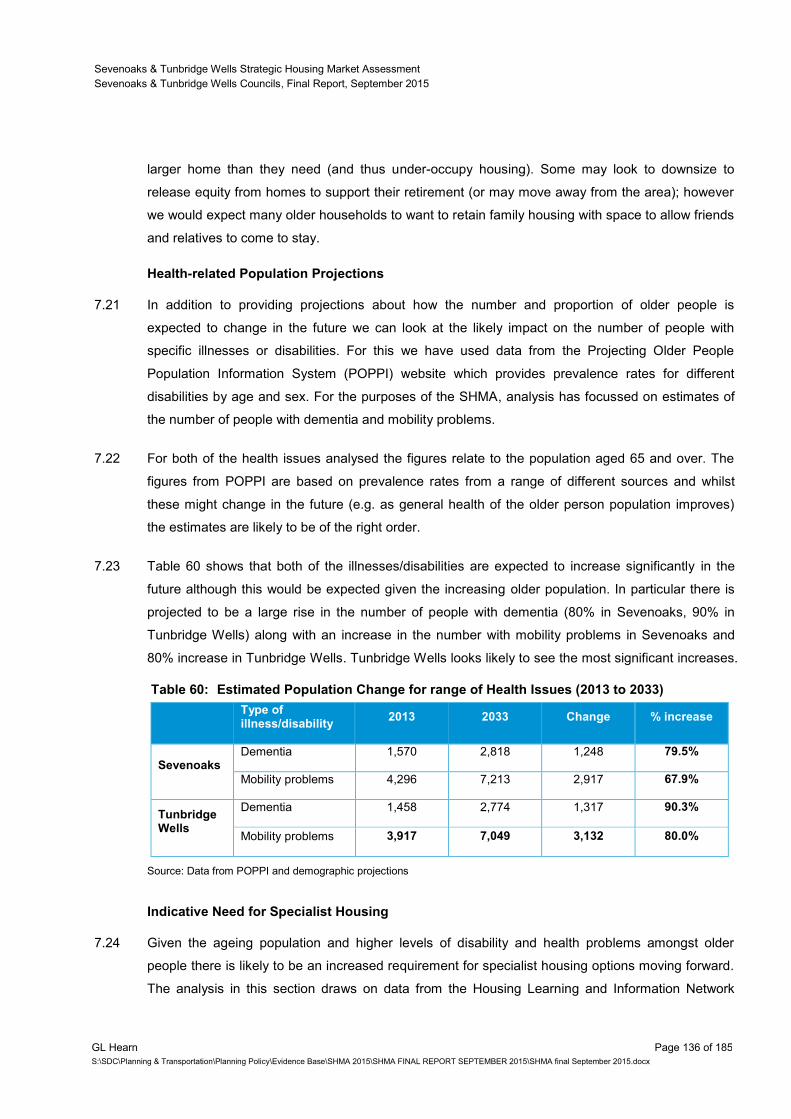
Sevenoaks & Tunbridge Wells Strategic Housing Market Assessment
Sevenoaks & Tunbridge Wells Councils, Final Report, September 2015
GL Hearn Page 136 of 185
S:\SDC\Planning & Transportation\Planning Policy\Evidence Base\SHMA 2015\SHMA FINAL REPORT SEPTEMBER 2015\SHMA final September 2015.docx
larger home than they need (and thus under-occupy housing). Some may look to downsize to
release equity from homes to support their retirement (or may move away from the area); however
we would expect many older households to want to retain family housing with space to allow friends
and relatives to come to stay.
Health-related Population Projections
7.21 In addition to providing projections about how the number and proportion of older people is
expected to change in the future we can look at the likely impact on the number of people with
specific illnesses or disabilities. For this we have used data from the Projecting Older People
Population Information System (POPPI) website which provides prevalence rates for different
disabilities by age and sex. For the purposes of the SHMA, analysis has focussed on estimates of
the number of people with dementia and mobility problems.
7.22 For both of the health issues analysed the figures relate to the population aged 65 and over. The
figures from POPPI are based on prevalence rates from a range of different sources and whilst
these might change in the future (e.g. as general health of the older person population improves)
the estimates are likely to be of the right order.
7.23 Table 60 shows that both of the illnesses/disabilities are expected to increase significantly in the
future although this would be expected given the increasing older population. In particular there is
projected to be a large rise in the number of people with dementia (80% in Sevenoaks, 90% in
Tunbridge Wells) along with an increase in the number with mobility problems in Sevenoaks and
80% increase in Tunbridge Wells. Tunbridge Wells looks likely to see the most significant increases.
Table 60: Estimated Population Change for range of Health Issues (2013 to 2033)
Type of illness/disability
2013 2033 Change % increase
Sevenoaks Dementia 1,570 2,818 1,248 79.5%
Mobility problems 4,296 7,213 2,917 67.9%
Tunbridge Wells
Dementia 1,458 2,774 1,317 90.3%
Mobility problems 3,917 7,049 3,132 80.0%
Source: Data from POPPI and demographic projections
Indicative Need for Specialist Housing
7.24 Given the ageing population and higher levels of disability and health problems amongst older
people there is likely to be an increased requirement for specialist housing options moving forward.
The analysis in this section draws on data from the Housing Learning and Information Network
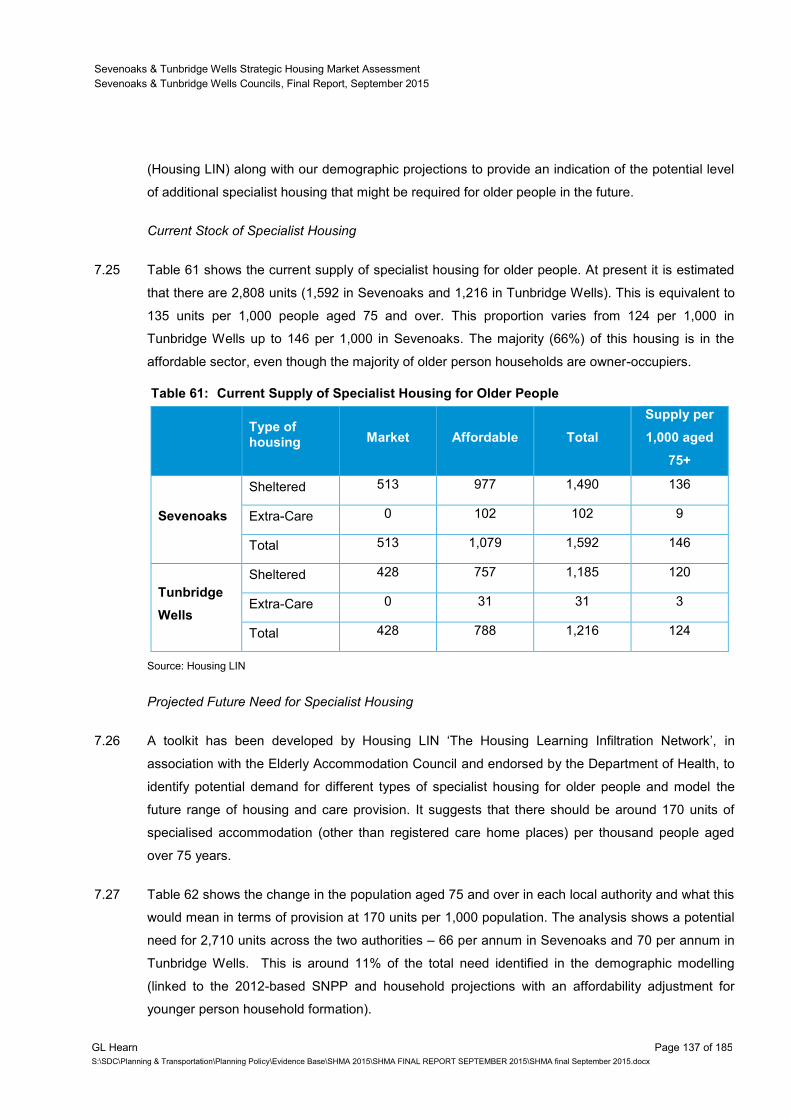
Sevenoaks & Tunbridge Wells Strategic Housing Market Assessment
Sevenoaks & Tunbridge Wells Councils, Final Report, September 2015
GL Hearn Page 137 of 185
S:\SDC\Planning & Transportation\Planning Policy\Evidence Base\SHMA 2015\SHMA FINAL REPORT SEPTEMBER 2015\SHMA final September 2015.docx
(Housing LIN) along with our demographic projections to provide an indication of the potential level
of additional specialist housing that might be required for older people in the future.
Current Stock of Specialist Housing
7.25 Table 61 shows the current supply of specialist housing for older people. At present it is estimated
that there are 2,808 units (1,592 in Sevenoaks and 1,216 in Tunbridge Wells). This is equivalent to
135 units per 1,000 people aged 75 and over. This proportion varies from 124 per 1,000 in
Tunbridge Wells up to 146 per 1,000 in Sevenoaks. The majority (66%) of this housing is in the
affordable sector, even though the majority of older person households are owner-occupiers.
Table 61: Current Supply of Specialist Housing for Older People
Type of housing Market Affordable Total
Supply per
1,000 aged
75+
Sevenoaks
Sheltered 513 977 1,490 136
Extra-Care 0 102 102 9
Total 513 1,079 1,592 146
Tunbridge
Wells
Sheltered 428 757 1,185 120
Extra-Care 0 31 31 3
Total 428 788 1,216 124
Source: Housing LIN
Projected Future Need for Specialist Housing
7.26 A toolkit has been developed by Housing LIN ‘The Housing Learning Infiltration Network’, in
association with the Elderly Accommodation Council and endorsed by the Department of Health, to
identify potential demand for different types of specialist housing for older people and model the
future range of housing and care provision. It suggests that there should be around 170 units of
specialised accommodation (other than registered care home places) per thousand people aged
over 75 years.
7.27 Table 62 shows the change in the population aged 75 and over in each local authority and what this
would mean in terms of provision at 170 units per 1,000 population. The analysis shows a potential
need for 2,710 units across the two authorities – 66 per annum in Sevenoaks and 70 per annum in
Tunbridge Wells. This is around 11% of the total need identified in the demographic modelling
(linked to the 2012-based SNPP and household projections with an affordability adjustment for
younger person household formation).

Sevenoaks & Tunbridge Wells Strategic Housing Market Assessment
Sevenoaks & Tunbridge Wells Councils, Final Report, September 2015
GL Hearn Page 138 of 185
S:\SDC\Planning & Transportation\Planning Policy\Evidence Base\SHMA 2015\SHMA FINAL REPORT SEPTEMBER 2015\SHMA final September 2015.docx
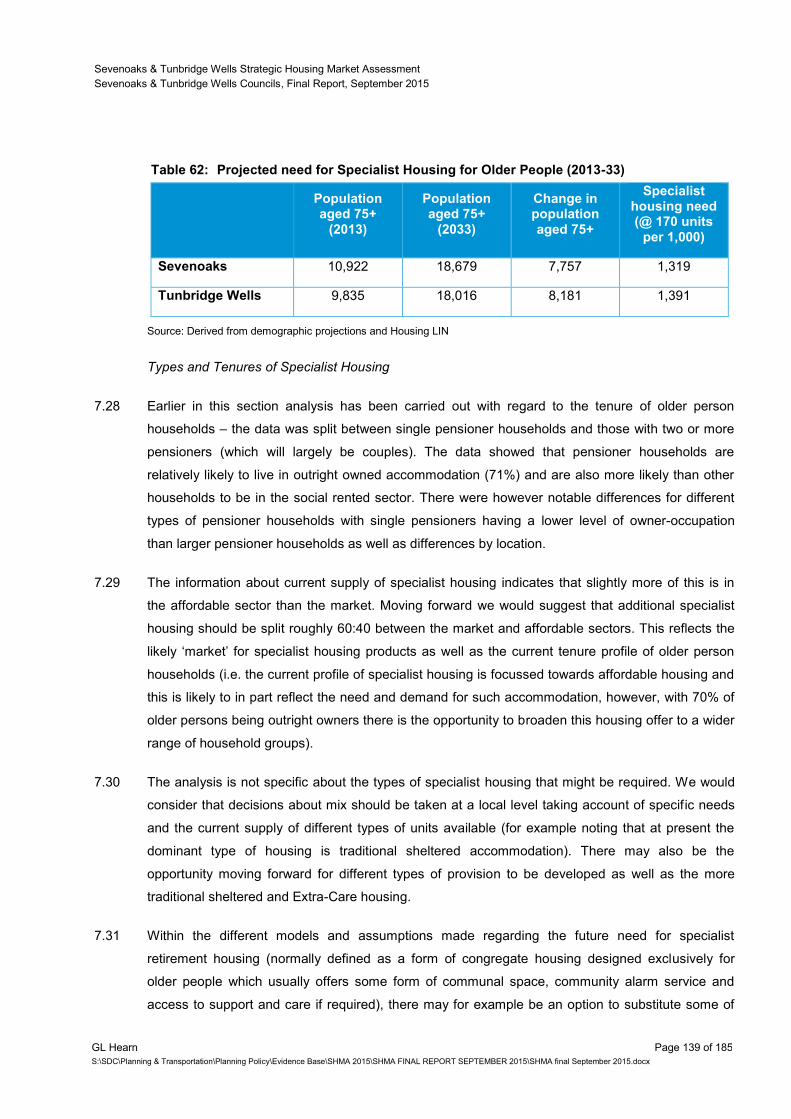
Sevenoaks & Tunbridge Wells Strategic Housing Market Assessment
Sevenoaks & Tunbridge Wells Councils, Final Report, September 2015
GL Hearn Page 139 of 185
S:\SDC\Planning & Transportation\Planning Policy\Evidence Base\SHMA 2015\SHMA FINAL REPORT SEPTEMBER 2015\SHMA final September 2015.docx
Table 62: Projected need for Specialist Housing for Older People (2013-33)
Population aged 75+
(2013)
Population aged 75+
(2033)
Change in population aged 75+
Specialist housing need (@ 170 units
per 1,000)
Sevenoaks 10,922 18,679 7,757 1,319
Tunbridge Wells 9,835 18,016 8,181 1,391
Source: Derived from demographic projections and Housing LIN
Types and Tenures of Specialist Housing
7.28 Earlier in this section analysis has been carried out with regard to the tenure of older person
households – the data was split between single pensioner households and those with two or more
pensioners (which will largely be couples). The data showed that pensioner households are
relatively likely to live in outright owned accommodation (71%) and are also more likely than other
households to be in the social rented sector. There were however notable differences for different
types of pensioner households with single pensioners having a lower level of owner-occupation
than larger pensioner households as well as differences by location.
7.29 The information about current supply of specialist housing indicates that slightly more of this is in
the affordable sector than the market. Moving forward we would suggest that additional specialist
housing should be split roughly 60:40 between the market and affordable sectors. This reflects the
likely ‘market’ for specialist housing products as well as the current tenure profile of older person
households (i.e. the current profile of specialist housing is focussed towards affordable housing and
this is likely to in part reflect the need and demand for such accommodation, however, with 70% of
older persons being outright owners there is the opportunity to broaden this housing offer to a wider
range of household groups).
7.30 The analysis is not specific about the types of specialist housing that might be required. We would
consider that decisions about mix should be taken at a local level taking account of specific needs
and the current supply of different types of units available (for example noting that at present the
dominant type of housing is traditional sheltered accommodation). There may also be the
opportunity moving forward for different types of provision to be developed as well as the more
traditional sheltered and Extra-Care housing.
7.31 Within the different models and assumptions made regarding the future need for specialist
retirement housing (normally defined as a form of congregate housing designed exclusively for
older people which usually offers some form of communal space, community alarm service and
access to support and care if required), there may for example be an option to substitute some of
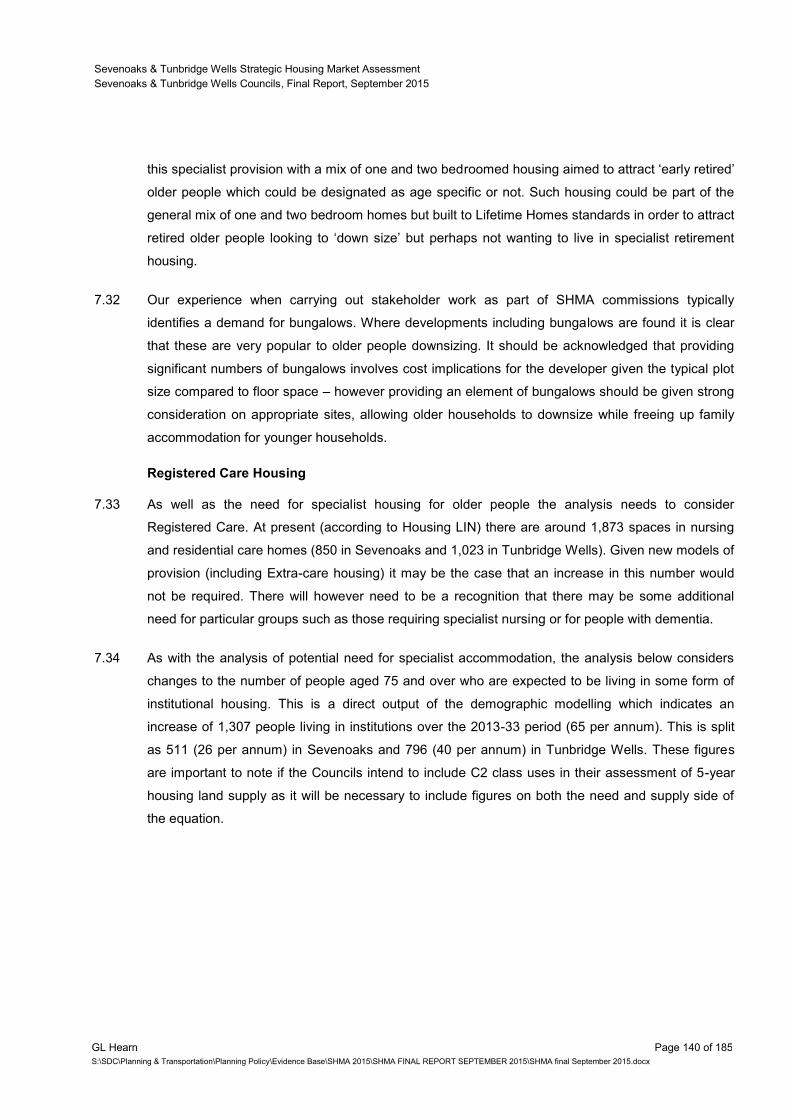
Sevenoaks & Tunbridge Wells Strategic Housing Market Assessment
Sevenoaks & Tunbridge Wells Councils, Final Report, September 2015
GL Hearn Page 140 of 185
S:\SDC\Planning & Transportation\Planning Policy\Evidence Base\SHMA 2015\SHMA FINAL REPORT SEPTEMBER 2015\SHMA final September 2015.docx
this specialist provision with a mix of one and two bedroomed housing aimed to attract ‘early retired’
older people which could be designated as age specific or not. Such housing could be part of the
general mix of one and two bedroom homes but built to Lifetime Homes standards in order to attract
retired older people looking to ‘down size’ but perhaps not wanting to live in specialist retirement
housing.
7.32 Our experience when carrying out stakeholder work as part of SHMA commissions typically
identifies a demand for bungalows. Where developments including bungalows are found it is clear
that these are very popular to older people downsizing. It should be acknowledged that providing
significant numbers of bungalows involves cost implications for the developer given the typical plot
size compared to floor space – however providing an element of bungalows should be given strong
consideration on appropriate sites, allowing older households to downsize while freeing up family
accommodation for younger households.
Registered Care Housing
7.33 As well as the need for specialist housing for older people the analysis needs to consider
Registered Care. At present (according to Housing LIN) there are around 1,873 spaces in nursing
and residential care homes (850 in Sevenoaks and 1,023 in Tunbridge Wells). Given new models of
provision (including Extra-care housing) it may be the case that an increase in this number would
not be required. There will however need to be a recognition that there may be some additional
need for particular groups such as those requiring specialist nursing or for people with dementia.
7.34 As with the analysis of potential need for specialist accommodation, the analysis below considers
changes to the number of people aged 75 and over who are expected to be living in some form of
institutional housing. This is a direct output of the demographic modelling which indicates an
increase of 1,307 people living in institutions over the 2013-33 period (65 per annum). This is split
as 511 (26 per annum) in Sevenoaks and 796 (40 per annum) in Tunbridge Wells. These figures
are important to note if the Councils intend to include C2 class uses in their assessment of 5-year
housing land supply as it will be necessary to include figures on both the need and supply side of
the equation.
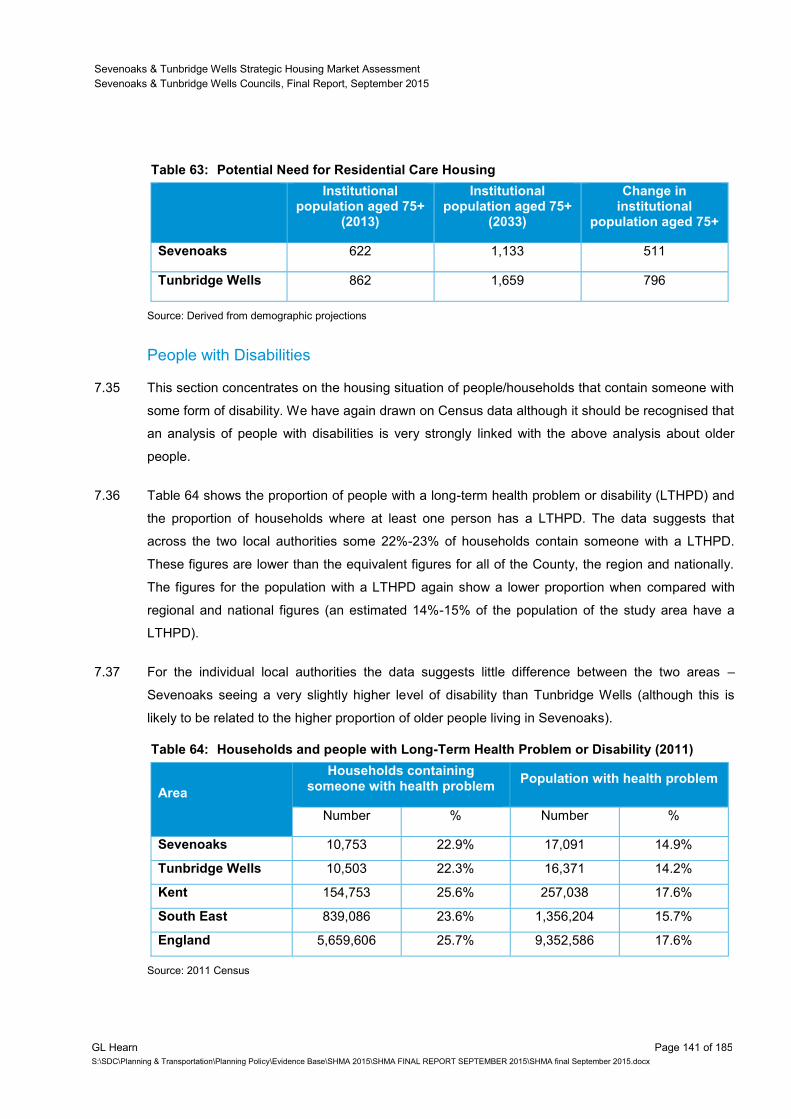
Sevenoaks & Tunbridge Wells Strategic Housing Market Assessment
Sevenoaks & Tunbridge Wells Councils, Final Report, September 2015
GL Hearn Page 141 of 185
S:\SDC\Planning & Transportation\Planning Policy\Evidence Base\SHMA 2015\SHMA FINAL REPORT SEPTEMBER 2015\SHMA final September 2015.docx
Table 63: Potential Need for Residential Care Housing
Institutional population aged 75+
(2013)
Institutional population aged 75+
(2033)
Change in institutional
population aged 75+
Sevenoaks 622 1,133 511
Tunbridge Wells 862 1,659 796
Source: Derived from demographic projections
People with Disabilities
7.35 This section concentrates on the housing situation of people/households that contain someone with
some form of disability. We have again drawn on Census data although it should be recognised that
an analysis of people with disabilities is very strongly linked with the above analysis about older
people.
7.36 Table 64 shows the proportion of people with a long-term health problem or disability (LTHPD) and
the proportion of households where at least one person has a LTHPD. The data suggests that
across the two local authorities some 22%-23% of households contain someone with a LTHPD.
These figures are lower than the equivalent figures for all of the County, the region and nationally.
The figures for the population with a LTHPD again show a lower proportion when compared with
regional and national figures (an estimated 14%-15% of the population of the study area have a
LTHPD).
7.37 For the individual local authorities the data suggests little difference between the two areas –
Sevenoaks seeing a very slightly higher level of disability than Tunbridge Wells (although this is
likely to be related to the higher proportion of older people living in Sevenoaks).
Table 64: Households and people with Long-Term Health Problem or Disability (2011)
Area
Households containing someone with health problem
Population with health problem
Number % Number %
Sevenoaks 10,753 22.9% 17,091 14.9%
Tunbridge Wells 10,503 22.3% 16,371 14.2%
Kent 154,753 25.6% 257,038 17.6%
South East 839,086 23.6% 1,356,204 15.7%
England 5,659,606 25.7% 9,352,586 17.6%
Source: 2011 Census
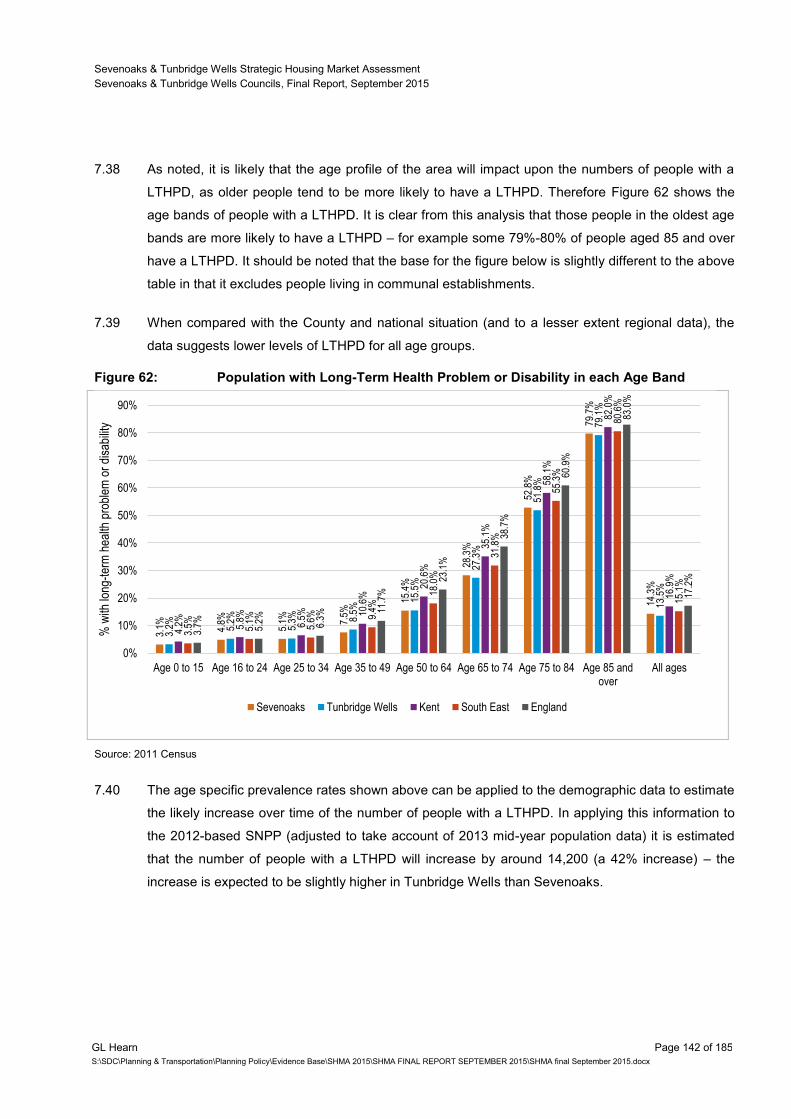
Sevenoaks & Tunbridge Wells Strategic Housing Market Assessment
Sevenoaks & Tunbridge Wells Councils, Final Report, September 2015
GL Hearn Page 142 of 185
S:\SDC\Planning & Transportation\Planning Policy\Evidence Base\SHMA 2015\SHMA FINAL REPORT SEPTEMBER 2015\SHMA final September 2015.docx
7.38 As noted, it is likely that the age profile of the area will impact upon the numbers of people with a
LTHPD, as older people tend to be more likely to have a LTHPD. Therefore Figure 62 shows the
age bands of people with a LTHPD. It is clear from this analysis that those people in the oldest age
bands are more likely to have a LTHPD – for example some 79%-80% of people aged 85 and over
have a LTHPD. It should be noted that the base for the figure below is slightly different to the above
table in that it excludes people living in communal establishments.
7.39 When compared with the County and national situation (and to a lesser extent regional data), the
data suggests lower levels of LTHPD for all age groups.
Figure 62: Population with Long-Term Health Problem or Disability in each Age Band
Source: 2011 Census
7.40 The age specific prevalence rates shown above can be applied to the demographic data to estimate
the likely increase over time of the number of people with a LTHPD. In applying this information to
the 2012-based SNPP (adjusted to take account of 2013 mid-year population data) it is estimated
that the number of people with a LTHPD will increase by around 14,200 (a 42% increase) – the
increase is expected to be slightly higher in Tunbridge Wells than Sevenoaks.
3.1%
4.8%
5.1%
7.5%
15.4
%
28.3
%
52.8
%
79.7
%
14.3
%
3.2%
5.2%
5.3%
8.5%
15.5
%
27.3
%
51.8
%
79.1
%
13.5
%
4.2%
5.8%
6.5%
10.6
% 20
.6%
35.1
%
58.1
%
82.0
%
16.9
%
3.5%
5.1%
5.6%
9.4%
18.0
%
31.8
%
55.3
%
80.6
%
15.1
%
3.7%
5.2%
6.3%
11.7
%
23.1
%
38.7
%
60.9
%
83.0
%
17.2
%
0%
10%
20%
30%
40%
50%
60%
70%
80%
90%
Age 0 to 15 Age 16 to 24 Age 25 to 34 Age 35 to 49 Age 50 to 64 Age 65 to 74 Age 75 to 84 Age 85 andover
All ages
% w
ith lo
ng-t
erm
hea
lth p
robl
em o
r di
sabi
lity
Sevenoaks Tunbridge Wells Kent South East England
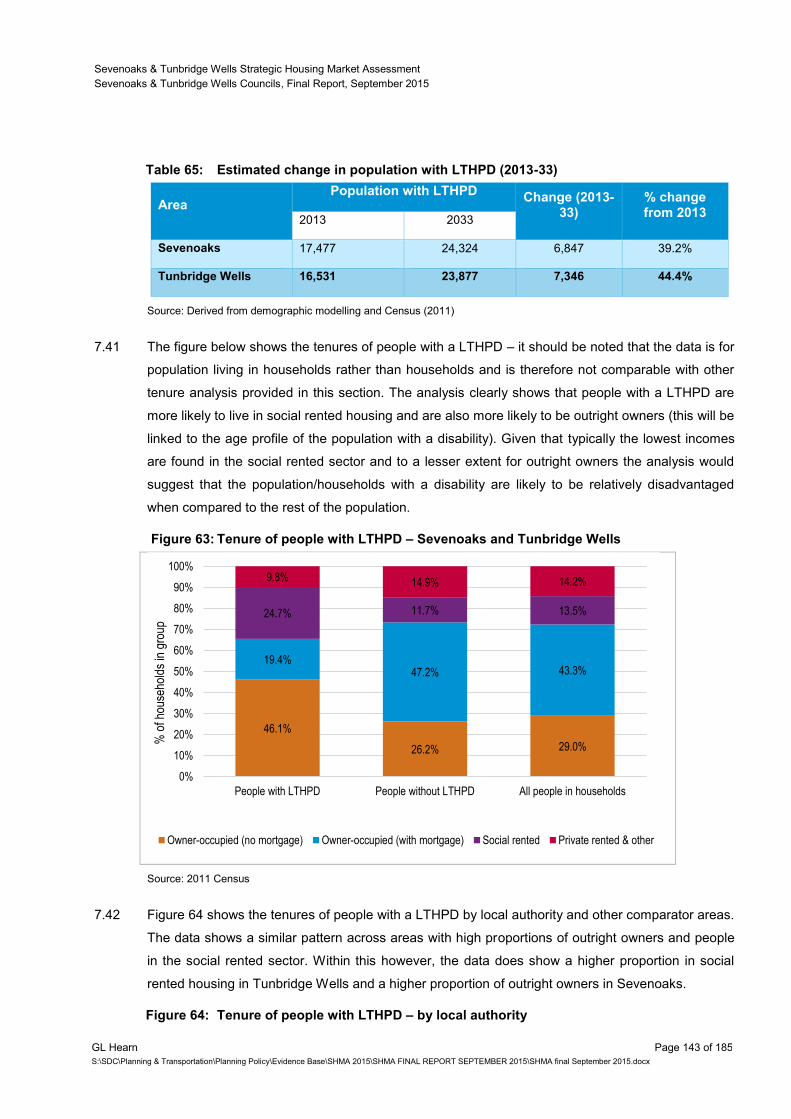
Sevenoaks & Tunbridge Wells Strategic Housing Market Assessment
Sevenoaks & Tunbridge Wells Councils, Final Report, September 2015
GL Hearn Page 143 of 185
S:\SDC\Planning & Transportation\Planning Policy\Evidence Base\SHMA 2015\SHMA FINAL REPORT SEPTEMBER 2015\SHMA final September 2015.docx
Table 65: Estimated change in population with LTHPD (2013-33)
Area Population with LTHPD
Change (2013-33)
% change from 2013
2013 2033
Sevenoaks 17,477 24,324 6,847 39.2%
Tunbridge Wells 16,531 23,877 7,346 44.4%
Source: Derived from demographic modelling and Census (2011)
7.41 The figure below shows the tenures of people with a LTHPD – it should be noted that the data is for
population living in households rather than households and is therefore not comparable with other
tenure analysis provided in this section. The analysis clearly shows that people with a LTHPD are
more likely to live in social rented housing and are also more likely to be outright owners (this will be
linked to the age profile of the population with a disability). Given that typically the lowest incomes
are found in the social rented sector and to a lesser extent for outright owners the analysis would
suggest that the population/households with a disability are likely to be relatively disadvantaged
when compared to the rest of the population.
Figure 63: Tenure of people with LTHPD – Sevenoaks and Tunbridge Wells
Source: 2011 Census
7.42 Figure 64 shows the tenures of people with a LTHPD by local authority and other comparator areas.
The data shows a similar pattern across areas with high proportions of outright owners and people
in the social rented sector. Within this however, the data does show a higher proportion in social
rented housing in Tunbridge Wells and a higher proportion of outright owners in Sevenoaks.
Figure 64: Tenure of people with LTHPD – by local authority
46.1%
26.2% 29.0%
19.4% 47.2% 43.3%
24.7% 11.7% 13.5%
9.8% 14.9% 14.2%
0%
10%
20%
30%
40%
50%
60%
70%
80%
90%
100%
People with LTHPD People without LTHPD All people in households
% o
f hou
seho
lds
in g
roup
Owner-occupied (no mortgage) Owner-occupied (with mortgage) Social rented Private rented & other
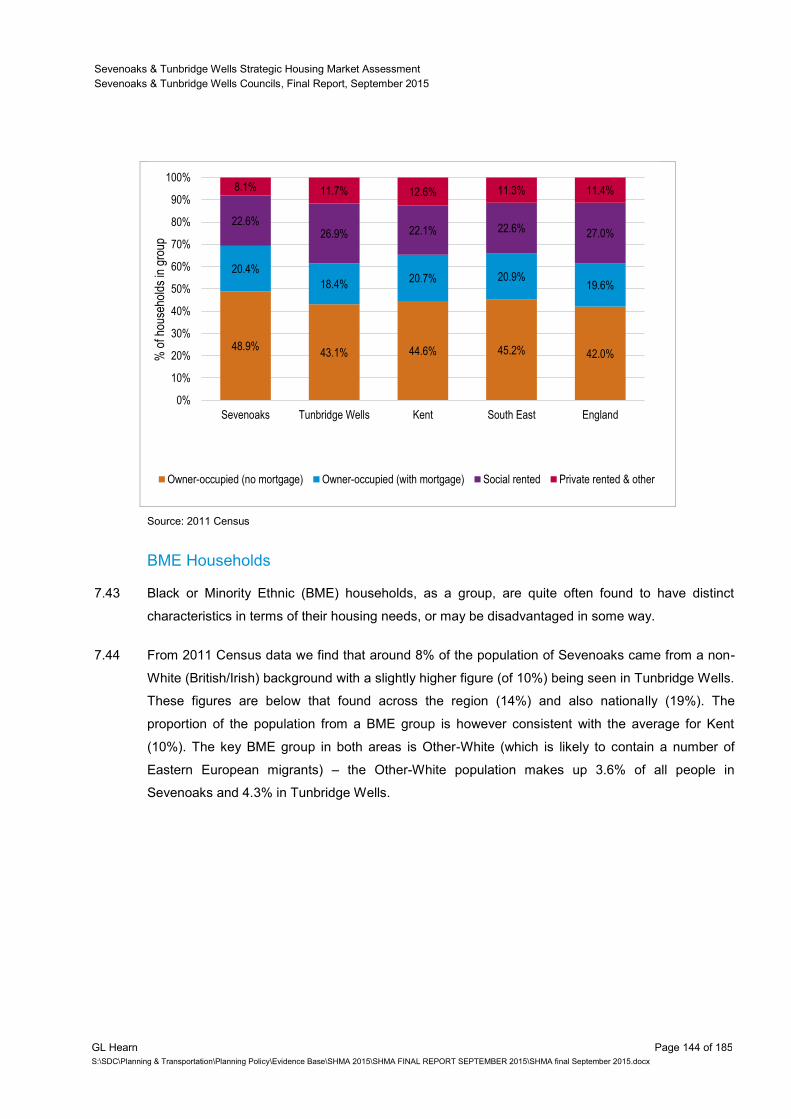
Sevenoaks & Tunbridge Wells Strategic Housing Market Assessment
Sevenoaks & Tunbridge Wells Councils, Final Report, September 2015
GL Hearn Page 144 of 185
S:\SDC\Planning & Transportation\Planning Policy\Evidence Base\SHMA 2015\SHMA FINAL REPORT SEPTEMBER 2015\SHMA final September 2015.docx
Source: 2011 Census
BME Households
7.43 Black or Minority Ethnic (BME) households, as a group, are quite often found to have distinct
characteristics in terms of their housing needs, or may be disadvantaged in some way.
7.44 From 2011 Census data we find that around 8% of the population of Sevenoaks came from a non-
White (British/Irish) background with a slightly higher figure (of 10%) being seen in Tunbridge Wells.
These figures are below that found across the region (14%) and also nationally (19%). The
proportion of the population from a BME group is however consistent with the average for Kent
(10%). The key BME group in both areas is Other-White (which is likely to contain a number of
Eastern European migrants) – the Other-White population makes up 3.6% of all people in
Sevenoaks and 4.3% in Tunbridge Wells.
48.9% 43.1% 44.6% 45.2% 42.0%
20.4%
18.4% 20.7% 20.9%
19.6%
22.6% 26.9% 22.1% 22.6% 27.0%
8.1% 11.7% 12.6% 11.3% 11.4%
0%
10%
20%
30%
40%
50%
60%
70%
80%
90%
100%
Sevenoaks Tunbridge Wells Kent South East England
% o
f hou
seho
lds
in g
roup
Owner-occupied (no mortgage) Owner-occupied (with mortgage) Social rented Private rented & other
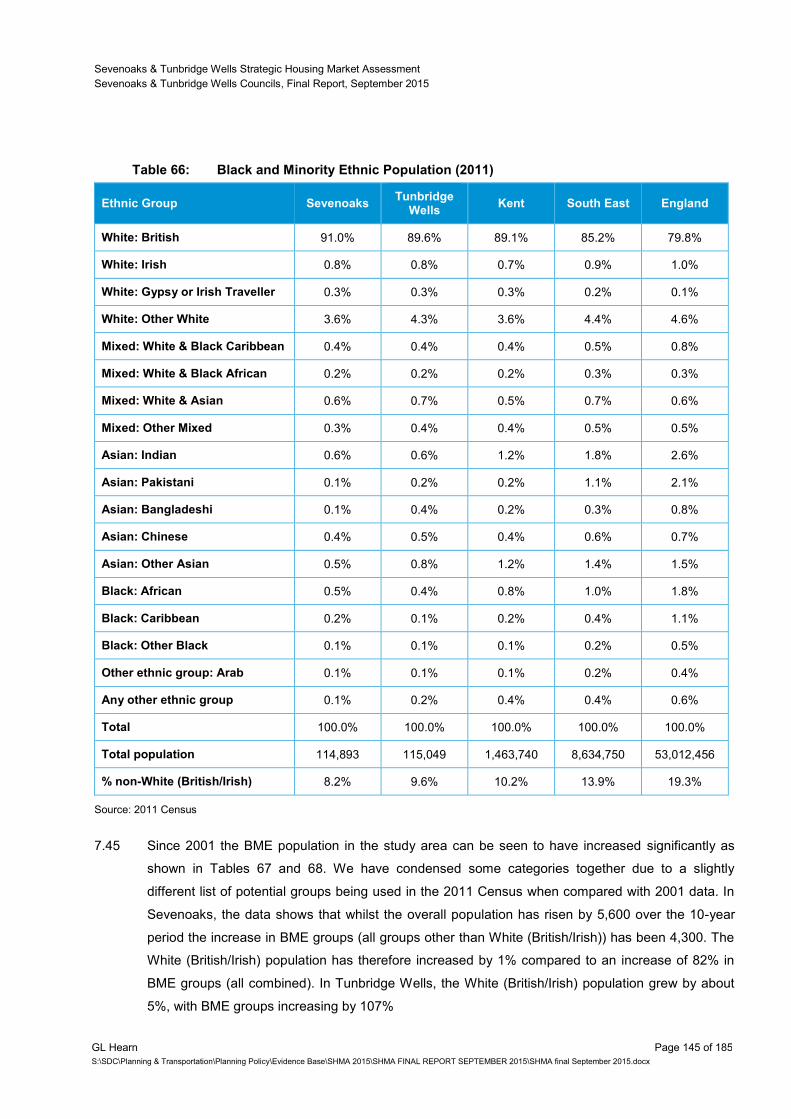
Sevenoaks & Tunbridge Wells Strategic Housing Market Assessment
Sevenoaks & Tunbridge Wells Councils, Final Report, September 2015
GL Hearn Page 145 of 185
S:\SDC\Planning & Transportation\Planning Policy\Evidence Base\SHMA 2015\SHMA FINAL REPORT SEPTEMBER 2015\SHMA final September 2015.docx
Table 66: Black and Minority Ethnic Population (2011)
Ethnic Group Sevenoaks Tunbridge
Wells Kent South East England
White: British 91.0% 89.6% 89.1% 85.2% 79.8%
White: Irish 0.8% 0.8% 0.7% 0.9% 1.0%
White: Gypsy or Irish Traveller 0.3% 0.3% 0.3% 0.2% 0.1%
White: Other White 3.6% 4.3% 3.6% 4.4% 4.6%
Mixed: White & Black Caribbean 0.4% 0.4% 0.4% 0.5% 0.8%
Mixed: White & Black African 0.2% 0.2% 0.2% 0.3% 0.3%
Mixed: White & Asian 0.6% 0.7% 0.5% 0.7% 0.6%
Mixed: Other Mixed 0.3% 0.4% 0.4% 0.5% 0.5%
Asian: Indian 0.6% 0.6% 1.2% 1.8% 2.6%
Asian: Pakistani 0.1% 0.2% 0.2% 1.1% 2.1%
Asian: Bangladeshi 0.1% 0.4% 0.2% 0.3% 0.8%
Asian: Chinese 0.4% 0.5% 0.4% 0.6% 0.7%
Asian: Other Asian 0.5% 0.8% 1.2% 1.4% 1.5%
Black: African 0.5% 0.4% 0.8% 1.0% 1.8%
Black: Caribbean 0.2% 0.1% 0.2% 0.4% 1.1%
Black: Other Black 0.1% 0.1% 0.1% 0.2% 0.5%
Other ethnic group: Arab 0.1% 0.1% 0.1% 0.2% 0.4%
Any other ethnic group 0.1% 0.2% 0.4% 0.4% 0.6%
Total 100.0% 100.0% 100.0% 100.0% 100.0%
Total population 114,893 115,049 1,463,740 8,634,750 53,012,456
% non-White (British/Irish) 8.2% 9.6% 10.2% 13.9% 19.3%
Source: 2011 Census
7.45 Since 2001 the BME population in the study area can be seen to have increased significantly as
shown in Tables 67 and 68. We have condensed some categories together due to a slightly
different list of potential groups being used in the 2011 Census when compared with 2001 data. In
Sevenoaks, the data shows that whilst the overall population has risen by 5,600 over the 10-year
period the increase in BME groups (all groups other than White (British/Irish)) has been 4,300. The
White (British/Irish) population has therefore increased by 1% compared to an increase of 82% in
BME groups (all combined). In Tunbridge Wells, the White (British/Irish) population grew by about
5%, with BME groups increasing by 107%
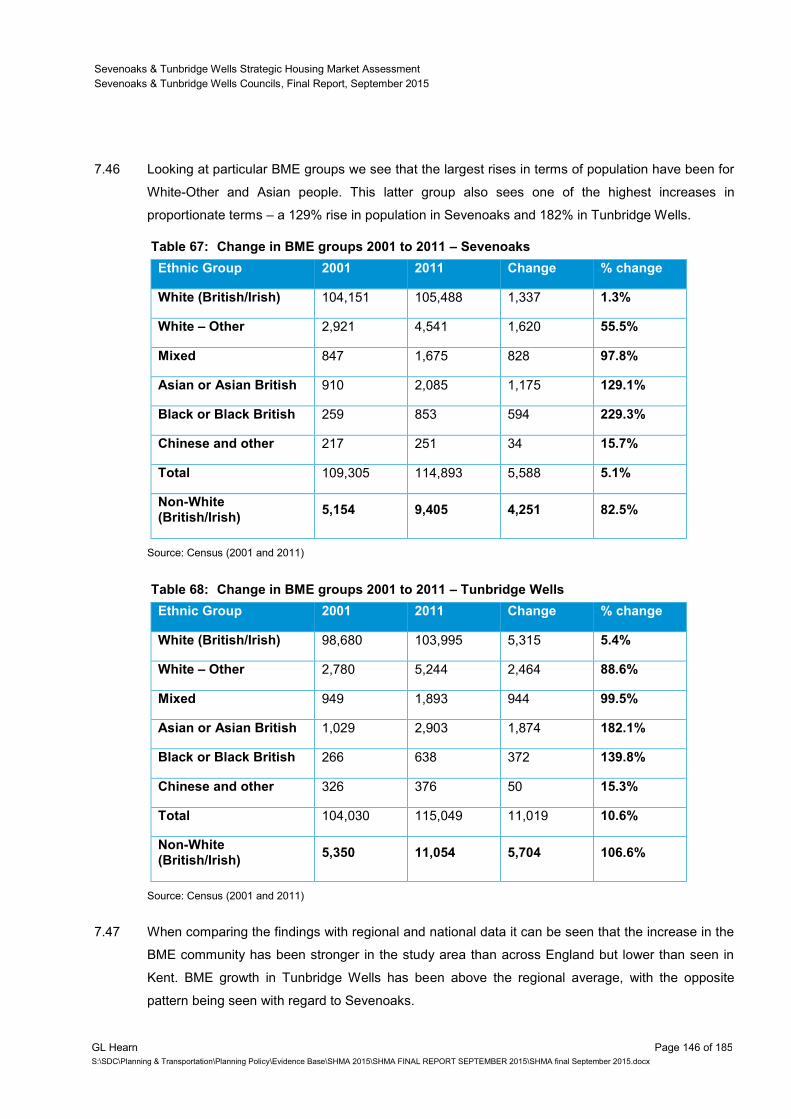
Sevenoaks & Tunbridge Wells Strategic Housing Market Assessment
Sevenoaks & Tunbridge Wells Councils, Final Report, September 2015
GL Hearn Page 146 of 185
S:\SDC\Planning & Transportation\Planning Policy\Evidence Base\SHMA 2015\SHMA FINAL REPORT SEPTEMBER 2015\SHMA final September 2015.docx
7.46 Looking at particular BME groups we see that the largest rises in terms of population have been for
White-Other and Asian people. This latter group also sees one of the highest increases in
proportionate terms – a 129% rise in population in Sevenoaks and 182% in Tunbridge Wells.
Table 67: Change in BME groups 2001 to 2011 – Sevenoaks
Ethnic Group 2001 2011 Change % change
White (British/Irish) 104,151 105,488 1,337 1.3%
White – Other 2,921 4,541 1,620 55.5%
Mixed 847 1,675 828 97.8%
Asian or Asian British 910 2,085 1,175 129.1%
Black or Black British 259 853 594 229.3%
Chinese and other 217 251 34 15.7%
Total 109,305 114,893 5,588 5.1%
Non-White (British/Irish)
5,154 9,405 4,251 82.5%
Source: Census (2001 and 2011)
Table 68: Change in BME groups 2001 to 2011 – Tunbridge Wells
Ethnic Group 2001 2011 Change % change
White (British/Irish) 98,680 103,995 5,315 5.4%
White – Other 2,780 5,244 2,464 88.6%
Mixed 949 1,893 944 99.5%
Asian or Asian British 1,029 2,903 1,874 182.1%
Black or Black British 266 638 372 139.8%
Chinese and other 326 376 50 15.3%
Total 104,030 115,049 11,019 10.6%
Non-White (British/Irish)
5,350 11,054 5,704 106.6%
Source: Census (2001 and 2011)
7.47 When comparing the findings with regional and national data it can be seen that the increase in the
BME community has been stronger in the study area than across England but lower than seen in
Kent. BME growth in Tunbridge Wells has been above the regional average, with the opposite
pattern being seen with regard to Sevenoaks.
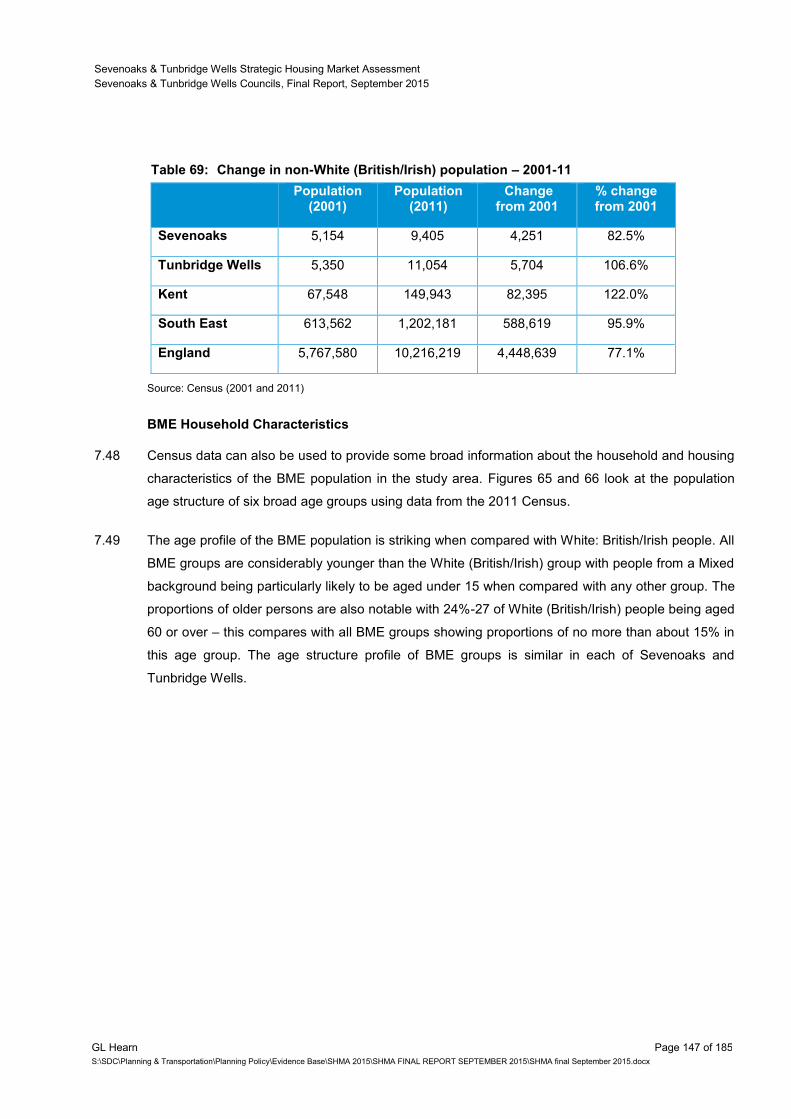
Sevenoaks & Tunbridge Wells Strategic Housing Market Assessment
Sevenoaks & Tunbridge Wells Councils, Final Report, September 2015
GL Hearn Page 147 of 185
S:\SDC\Planning & Transportation\Planning Policy\Evidence Base\SHMA 2015\SHMA FINAL REPORT SEPTEMBER 2015\SHMA final September 2015.docx
Table 69: Change in non-White (British/Irish) population – 2001-11
Population
(2001) Population
(2011) Change
from 2001 % change from 2001
Sevenoaks 5,154 9,405 4,251 82.5%
Tunbridge Wells 5,350 11,054 5,704 106.6%
Kent 67,548 149,943 82,395 122.0%
South East 613,562 1,202,181 588,619 95.9%
England 5,767,580 10,216,219 4,448,639 77.1%
Source: Census (2001 and 2011)
BME Household Characteristics
7.48 Census data can also be used to provide some broad information about the household and housing
characteristics of the BME population in the study area. Figures 65 and 66 look at the population
age structure of six broad age groups using data from the 2011 Census.
7.49 The age profile of the BME population is striking when compared with White: British/Irish people. All
BME groups are considerably younger than the White (British/Irish) group with people from a Mixed
background being particularly likely to be aged under 15 when compared with any other group. The
proportions of older persons are also notable with 24%-27 of White (British/Irish) people being aged
60 or over – this compares with all BME groups showing proportions of no more than about 15% in
this age group. The age structure profile of BME groups is similar in each of Sevenoaks and
Tunbridge Wells.
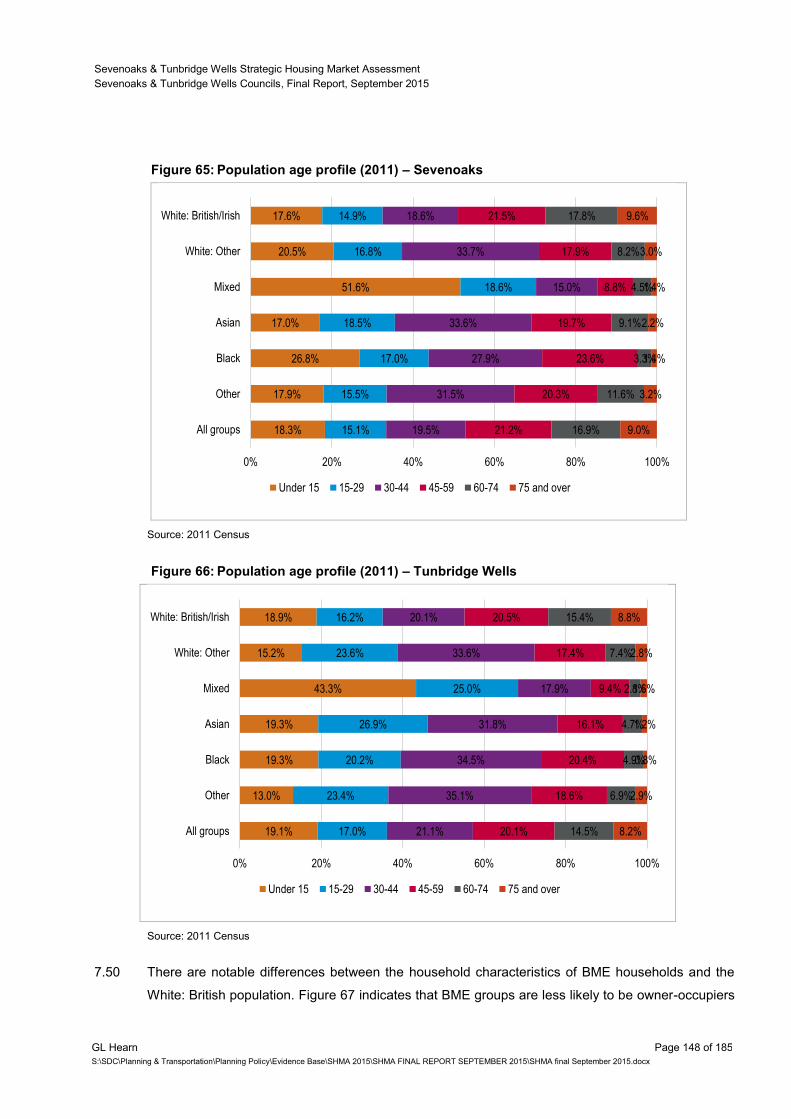
Sevenoaks & Tunbridge Wells Strategic Housing Market Assessment
Sevenoaks & Tunbridge Wells Councils, Final Report, September 2015
GL Hearn Page 148 of 185
S:\SDC\Planning & Transportation\Planning Policy\Evidence Base\SHMA 2015\SHMA FINAL REPORT SEPTEMBER 2015\SHMA final September 2015.docx
Figure 65: Population age profile (2011) – Sevenoaks
Source: 2011 Census
Figure 66: Population age profile (2011) – Tunbridge Wells
Source: 2011 Census
7.50 There are notable differences between the household characteristics of BME households and the
White: British population. Figure 67 indicates that BME groups are less likely to be owner-occupiers
18.3%
17.9%
26.8%
17.0%
51.6%
20.5%
17.6%
15.1%
15.5%
17.0%
18.5%
18.6%
16.8%
14.9%
19.5%
31.5%
27.9%
33.6%
15.0%
33.7%
18.6%
21.2%
20.3%
23.6%
19.7%
8.8%
17.9%
21.5%
16.9%
11.6%
3.3%
9.1%
4.5%
8.2%
17.8%
9.0%
3.2%
1.4%
2.2%
1.4%
3.0%
9.6%
0% 20% 40% 60% 80% 100%
All groups
Other
Black
Asian
Mixed
White: Other
White: British/Irish
Under 15 15-29 30-44 45-59 60-74 75 and over
19.1%
13.0%
19.3%
19.3%
43.3%
15.2%
18.9%
17.0%
23.4%
20.2%
26.9%
25.0%
23.6%
16.2%
21.1%
35.1%
34.5%
31.8%
17.9%
33.6%
20.1%
20.1%
18.6%
20.4%
16.1%
9.4%
17.4%
20.5%
14.5%
6.9%
4.9%
4.7%
2.8%
7.4%
15.4%
8.2%
2.9%
0.8%
1.2%
1.6%
2.8%
8.8%
0% 20% 40% 60% 80% 100%
All groups
Other
Black
Asian
Mixed
White: Other
White: British/Irish
Under 15 15-29 30-44 45-59 60-74 75 and over
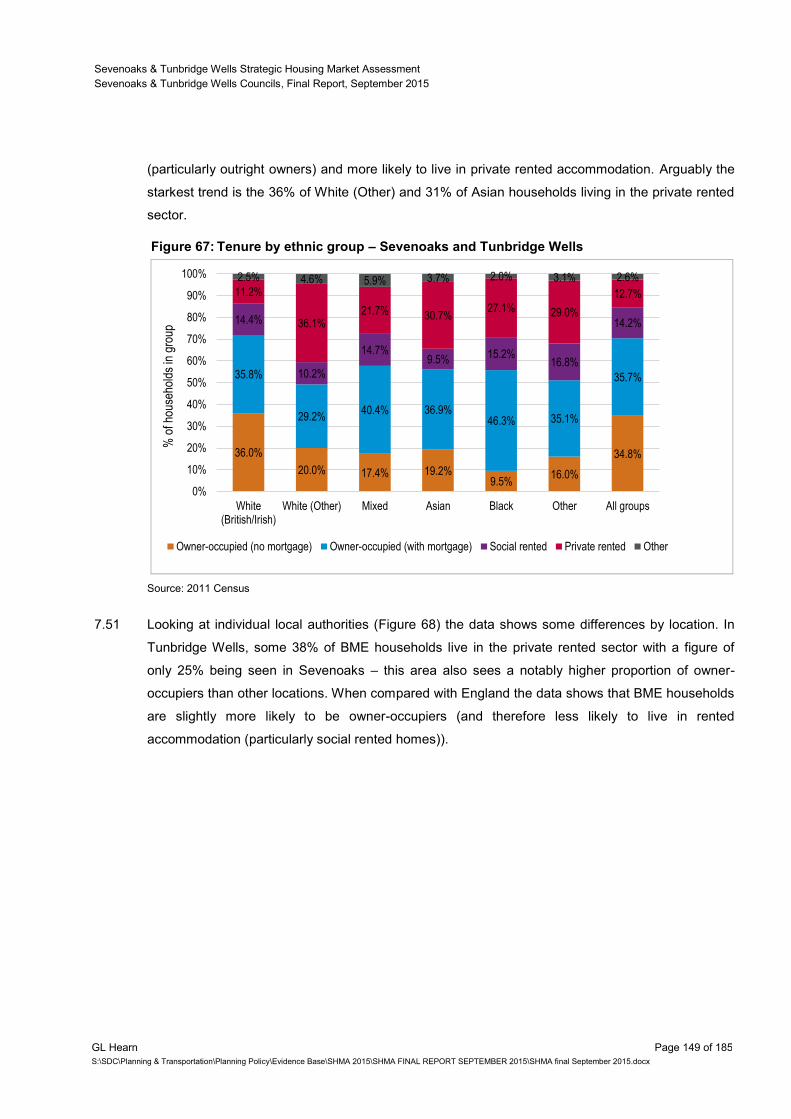
Sevenoaks & Tunbridge Wells Strategic Housing Market Assessment
Sevenoaks & Tunbridge Wells Councils, Final Report, September 2015
GL Hearn Page 149 of 185
S:\SDC\Planning & Transportation\Planning Policy\Evidence Base\SHMA 2015\SHMA FINAL REPORT SEPTEMBER 2015\SHMA final September 2015.docx
(particularly outright owners) and more likely to live in private rented accommodation. Arguably the
starkest trend is the 36% of White (Other) and 31% of Asian households living in the private rented
sector.
Figure 67: Tenure by ethnic group – Sevenoaks and Tunbridge Wells
Source: 2011 Census
7.51 Looking at individual local authorities (Figure 68) the data shows some differences by location. In
Tunbridge Wells, some 38% of BME households live in the private rented sector with a figure of
only 25% being seen in Sevenoaks – this area also sees a notably higher proportion of owner-
occupiers than other locations. When compared with England the data shows that BME households
are slightly more likely to be owner-occupiers (and therefore less likely to live in rented
accommodation (particularly social rented homes)).
36.0%
20.0% 17.4% 19.2% 9.5%
16.0%
34.8%
35.8%
29.2% 40.4% 36.9%
46.3% 35.1%
35.7%
14.4%
10.2%
14.7% 9.5% 15.2%
16.8%
14.2%
11.2%
36.1% 21.7% 30.7%
27.1% 29.0%
12.7%
2.5% 4.6% 5.9% 3.7% 2.0% 3.1% 2.6%
0%
10%
20%
30%
40%
50%
60%
70%
80%
90%
100%
White(British/Irish)
White (Other) Mixed Asian Black Other All groups
% o
f hou
seho
lds
in g
roup
Owner-occupied (no mortgage) Owner-occupied (with mortgage) Social rented Private rented Other
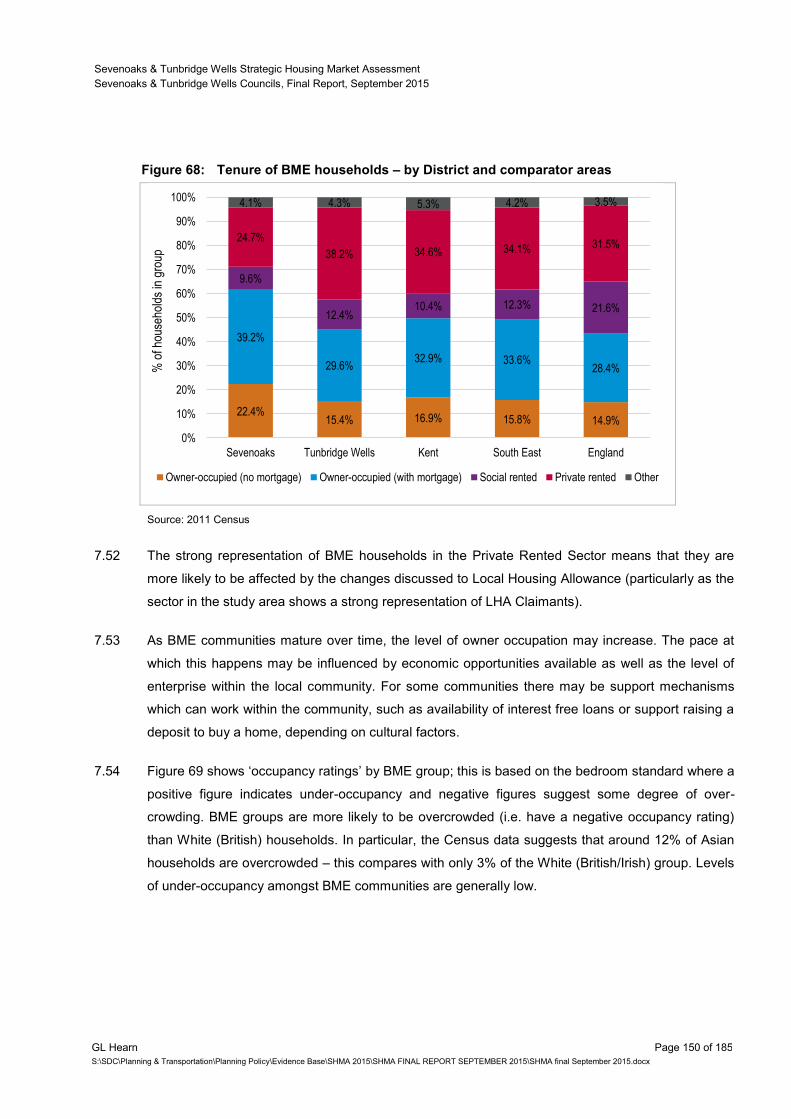
Sevenoaks & Tunbridge Wells Strategic Housing Market Assessment
Sevenoaks & Tunbridge Wells Councils, Final Report, September 2015
GL Hearn Page 150 of 185
S:\SDC\Planning & Transportation\Planning Policy\Evidence Base\SHMA 2015\SHMA FINAL REPORT SEPTEMBER 2015\SHMA final September 2015.docx
Figure 68: Tenure of BME households – by District and comparator areas
Source: 2011 Census
7.52 The strong representation of BME households in the Private Rented Sector means that they are
more likely to be affected by the changes discussed to Local Housing Allowance (particularly as the
sector in the study area shows a strong representation of LHA Claimants).
7.53 As BME communities mature over time, the level of owner occupation may increase. The pace at
which this happens may be influenced by economic opportunities available as well as the level of
enterprise within the local community. For some communities there may be support mechanisms
which can work within the community, such as availability of interest free loans or support raising a
deposit to buy a home, depending on cultural factors.
7.54 Figure 69 shows ‘occupancy ratings’ by BME group; this is based on the bedroom standard where a
positive figure indicates under-occupancy and negative figures suggest some degree of over-
crowding. BME groups are more likely to be overcrowded (i.e. have a negative occupancy rating)
than White (British) households. In particular, the Census data suggests that around 12% of Asian
households are overcrowded – this compares with only 3% of the White (British/Irish) group. Levels
of under-occupancy amongst BME communities are generally low.
22.4% 15.4% 16.9% 15.8% 14.9%
39.2%
29.6% 32.9% 33.6%
28.4%
9.6%
12.4% 10.4% 12.3% 21.6%
24.7%
38.2% 34.6% 34.1% 31.5%
4.1% 4.3% 5.3% 4.2% 3.5%
0%
10%
20%
30%
40%
50%
60%
70%
80%
90%
100%
Sevenoaks Tunbridge Wells Kent South East England
% o
f hou
seho
lds
in g
roup
Owner-occupied (no mortgage) Owner-occupied (with mortgage) Social rented Private rented Other
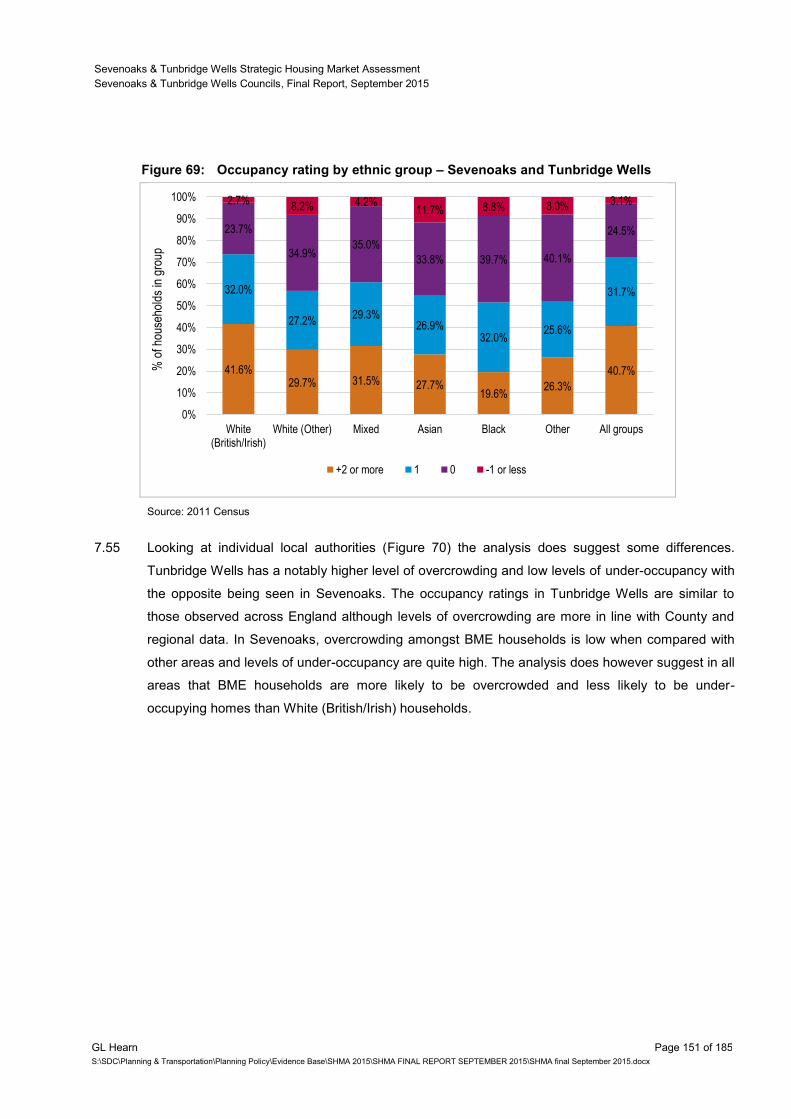
Sevenoaks & Tunbridge Wells Strategic Housing Market Assessment
Sevenoaks & Tunbridge Wells Councils, Final Report, September 2015
GL Hearn Page 151 of 185
S:\SDC\Planning & Transportation\Planning Policy\Evidence Base\SHMA 2015\SHMA FINAL REPORT SEPTEMBER 2015\SHMA final September 2015.docx
Figure 69: Occupancy rating by ethnic group – Sevenoaks and Tunbridge Wells
Source: 2011 Census
7.55 Looking at individual local authorities (Figure 70) the analysis does suggest some differences.
Tunbridge Wells has a notably higher level of overcrowding and low levels of under-occupancy with
the opposite being seen in Sevenoaks. The occupancy ratings in Tunbridge Wells are similar to
those observed across England although levels of overcrowding are more in line with County and
regional data. In Sevenoaks, overcrowding amongst BME households is low when compared with
other areas and levels of under-occupancy are quite high. The analysis does however suggest in all
areas that BME households are more likely to be overcrowded and less likely to be under-
occupying homes than White (British/Irish) households.
41.6% 29.7% 31.5% 27.7%
19.6% 26.3%
40.7%
32.0%
27.2% 29.3%
26.9% 32.0%
25.6%
31.7%
23.7%
34.9% 35.0%
33.8% 39.7% 40.1%
24.5%
2.7% 8.2% 4.2%
11.7% 8.8% 8.0% 3.1%
0%
10%
20%
30%
40%
50%
60%
70%
80%
90%
100%
White(British/Irish)
White (Other) Mixed Asian Black Other All groups
% o
f hou
seho
lds
in g
roup
+2 or more 1 0 -1 or less
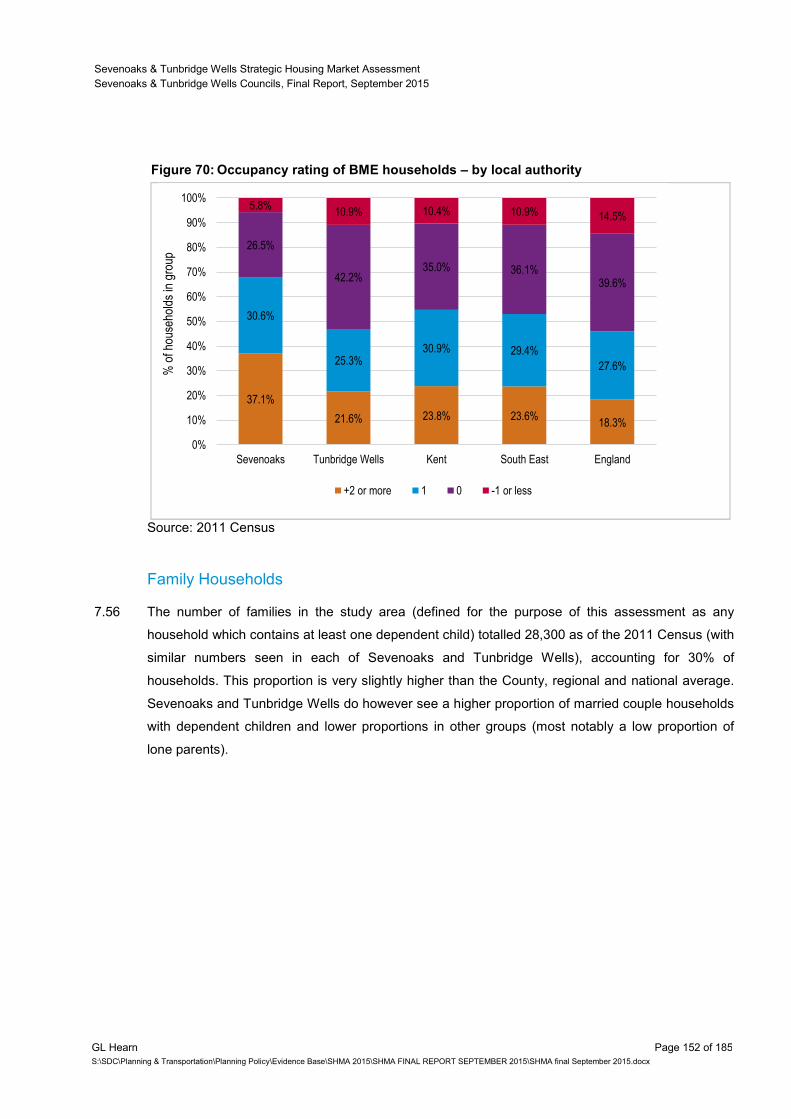
Sevenoaks & Tunbridge Wells Strategic Housing Market Assessment
Sevenoaks & Tunbridge Wells Councils, Final Report, September 2015
GL Hearn Page 152 of 185
S:\SDC\Planning & Transportation\Planning Policy\Evidence Base\SHMA 2015\SHMA FINAL REPORT SEPTEMBER 2015\SHMA final September 2015.docx
Figure 70: Occupancy rating of BME households – by local authority
Source: 2011 Census
Family Households
7.56 The number of families in the study area (defined for the purpose of this assessment as any
household which contains at least one dependent child) totalled 28,300 as of the 2011 Census (with
similar numbers seen in each of Sevenoaks and Tunbridge Wells), accounting for 30% of
households. This proportion is very slightly higher than the County, regional and national average.
Sevenoaks and Tunbridge Wells do however see a higher proportion of married couple households
with dependent children and lower proportions in other groups (most notably a low proportion of
lone parents).
37.1%
21.6% 23.8% 23.6% 18.3%
30.6%
25.3% 30.9% 29.4%
27.6%
26.5%
42.2% 35.0% 36.1%
39.6%
5.8% 10.9% 10.4% 10.9% 14.5%
0%
10%
20%
30%
40%
50%
60%
70%
80%
90%
100%
Sevenoaks Tunbridge Wells Kent South East England
% o
f hou
seho
lds
in g
roup
+2 or more 1 0 -1 or less
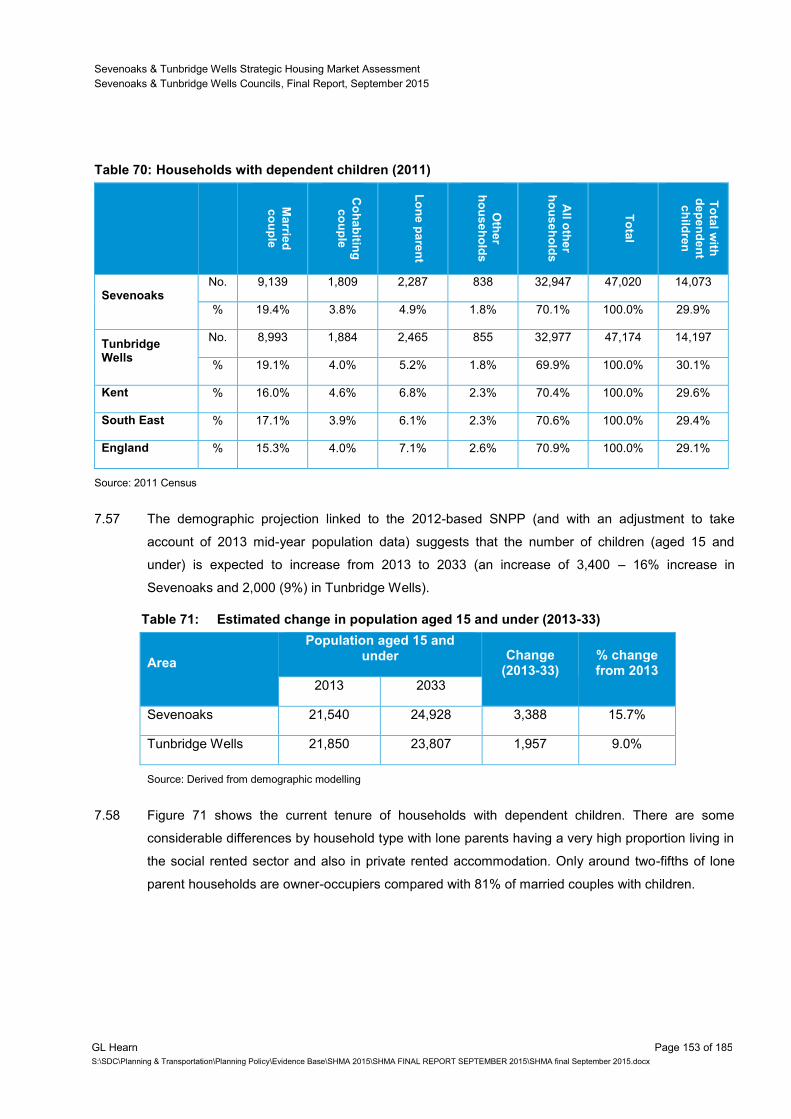
Sevenoaks & Tunbridge Wells Strategic Housing Market Assessment
Sevenoaks & Tunbridge Wells Councils, Final Report, September 2015
GL Hearn Page 153 of 185
S:\SDC\Planning & Transportation\Planning Policy\Evidence Base\SHMA 2015\SHMA FINAL REPORT SEPTEMBER 2015\SHMA final September 2015.docx
Table 70: Households with dependent children (2011)
Ma
rried
co
up
le
Co
ha
bitin
g
co
up
le
Lo
ne
pa
ren
t
Oth
er
ho
us
eh
old
s
All o
the
r
ho
us
eh
old
s
To
tal
To
tal w
ith
de
pe
nd
en
t
ch
ildre
n
Sevenoaks No. 9,139 1,809 2,287 838 32,947 47,020 14,073
% 19.4% 3.8% 4.9% 1.8% 70.1% 100.0% 29.9%
Tunbridge Wells
No. 8,993 1,884 2,465 855 32,977 47,174 14,197
% 19.1% 4.0% 5.2% 1.8% 69.9% 100.0% 30.1%
Kent % 16.0% 4.6% 6.8% 2.3% 70.4% 100.0% 29.6%
South East % 17.1% 3.9% 6.1% 2.3% 70.6% 100.0% 29.4%
England % 15.3% 4.0% 7.1% 2.6% 70.9% 100.0% 29.1%
Source: 2011 Census
7.57 The demographic projection linked to the 2012-based SNPP (and with an adjustment to take
account of 2013 mid-year population data) suggests that the number of children (aged 15 and
under) is expected to increase from 2013 to 2033 (an increase of 3,400 – 16% increase in
Sevenoaks and 2,000 (9%) in Tunbridge Wells).
Table 71: Estimated change in population aged 15 and under (2013-33)
Area
Population aged 15 and under Change
(2013-33) % change from 2013
2013 2033
Sevenoaks 21,540 24,928 3,388 15.7%
Tunbridge Wells 21,850 23,807 1,957 9.0%
Source: Derived from demographic modelling
7.58 Figure 71 shows the current tenure of households with dependent children. There are some
considerable differences by household type with lone parents having a very high proportion living in
the social rented sector and also in private rented accommodation. Only around two-fifths of lone
parent households are owner-occupiers compared with 81% of married couples with children.
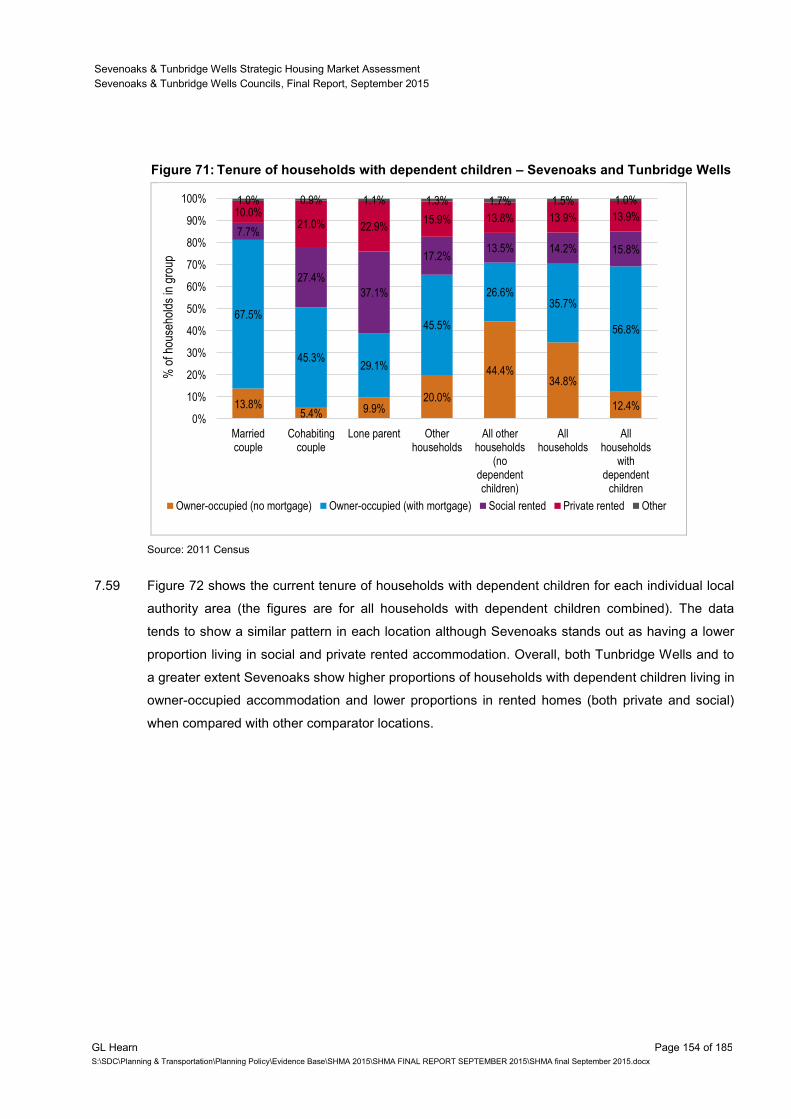
Sevenoaks & Tunbridge Wells Strategic Housing Market Assessment
Sevenoaks & Tunbridge Wells Councils, Final Report, September 2015
GL Hearn Page 154 of 185
S:\SDC\Planning & Transportation\Planning Policy\Evidence Base\SHMA 2015\SHMA FINAL REPORT SEPTEMBER 2015\SHMA final September 2015.docx
Figure 71: Tenure of households with dependent children – Sevenoaks and Tunbridge Wells
Source: 2011 Census
7.59 Figure 72 shows the current tenure of households with dependent children for each individual local
authority area (the figures are for all households with dependent children combined). The data
tends to show a similar pattern in each location although Sevenoaks stands out as having a lower
proportion living in social and private rented accommodation. Overall, both Tunbridge Wells and to
a greater extent Sevenoaks show higher proportions of households with dependent children living in
owner-occupied accommodation and lower proportions in rented homes (both private and social)
when compared with other comparator locations.
13.8% 5.4% 9.9%
20.0%
44.4% 34.8%
12.4%
67.5%
45.3% 29.1%
45.5%
26.6% 35.7%
56.8%
7.7%
27.4%
37.1%
17.2% 13.5% 14.2% 15.8%
10.0% 21.0% 22.9%
15.9% 13.8% 13.9% 13.9%
1.0% 0.9% 1.1% 1.3% 1.7% 1.5% 1.0%
0%
10%
20%
30%
40%
50%
60%
70%
80%
90%
100%
Marriedcouple
Cohabitingcouple
Lone parent Otherhouseholds
All otherhouseholds
(nodependentchildren)
Allhouseholds
Allhouseholds
withdependent
children
% o
f hou
seho
lds
in g
roup
Owner-occupied (no mortgage) Owner-occupied (with mortgage) Social rented Private rented Other
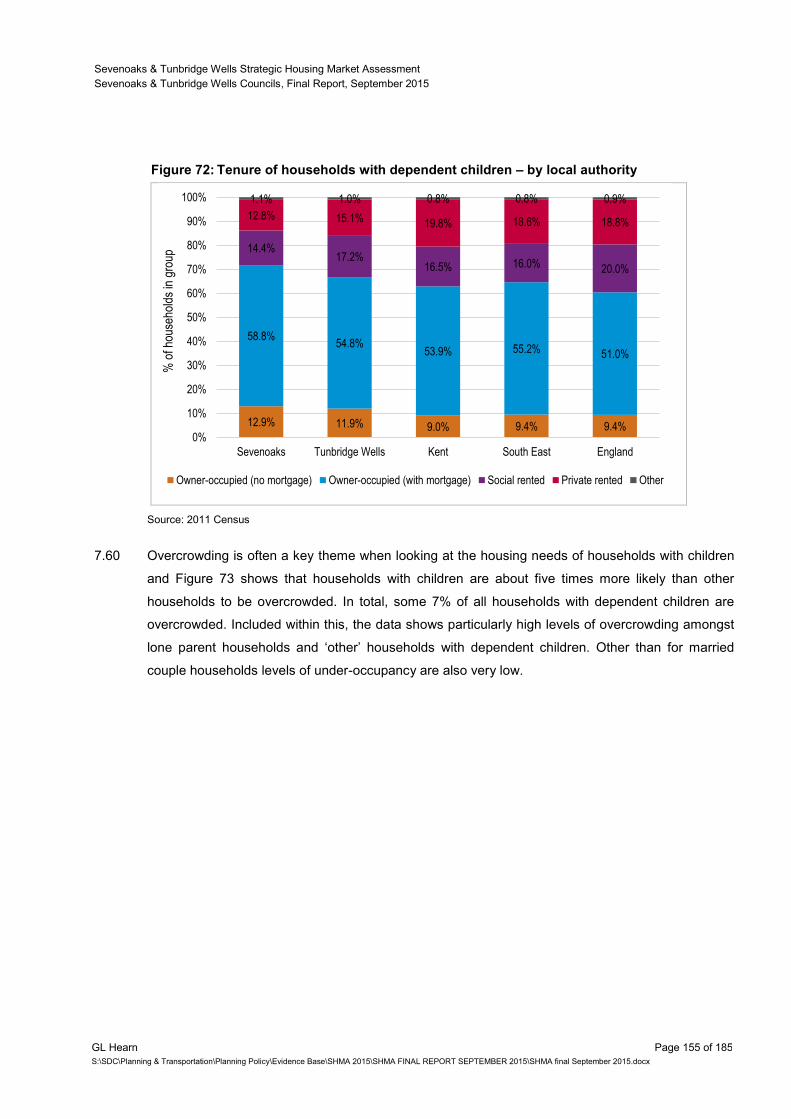
Sevenoaks & Tunbridge Wells Strategic Housing Market Assessment
Sevenoaks & Tunbridge Wells Councils, Final Report, September 2015
GL Hearn Page 155 of 185
S:\SDC\Planning & Transportation\Planning Policy\Evidence Base\SHMA 2015\SHMA FINAL REPORT SEPTEMBER 2015\SHMA final September 2015.docx
Figure 72: Tenure of households with dependent children – by local authority
Source: 2011 Census
7.60 Overcrowding is often a key theme when looking at the housing needs of households with children
and Figure 73 shows that households with children are about five times more likely than other
households to be overcrowded. In total, some 7% of all households with dependent children are
overcrowded. Included within this, the data shows particularly high levels of overcrowding amongst
lone parent households and ‘other’ households with dependent children. Other than for married
couple households levels of under-occupancy are also very low.
12.9% 11.9% 9.0% 9.4% 9.4%
58.8% 54.8%
53.9% 55.2% 51.0%
14.4% 17.2%
16.5% 16.0% 20.0%
12.8% 15.1% 19.8% 18.6% 18.8%
1.1% 1.0% 0.8% 0.8% 0.9%
0%
10%
20%
30%
40%
50%
60%
70%
80%
90%
100%
Sevenoaks Tunbridge Wells Kent South East England
% o
f hou
seho
lds
in g
roup
Owner-occupied (no mortgage) Owner-occupied (with mortgage) Social rented Private rented Other
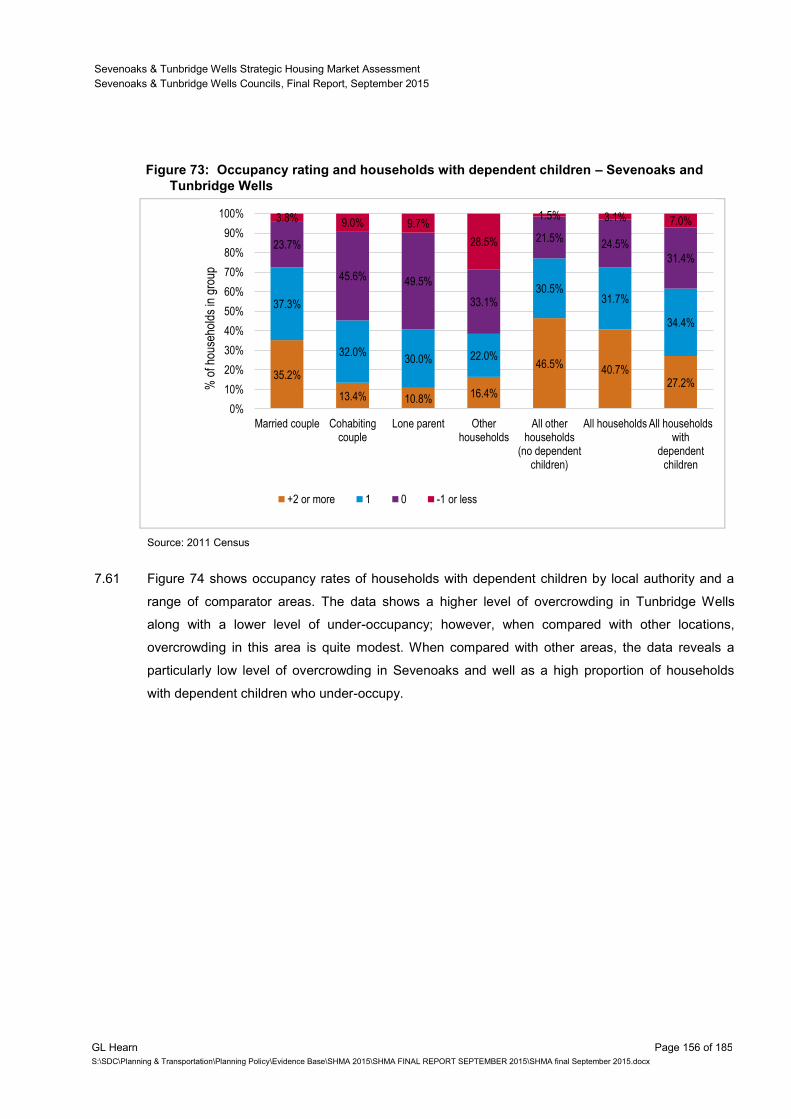
Sevenoaks & Tunbridge Wells Strategic Housing Market Assessment
Sevenoaks & Tunbridge Wells Councils, Final Report, September 2015
GL Hearn Page 156 of 185
S:\SDC\Planning & Transportation\Planning Policy\Evidence Base\SHMA 2015\SHMA FINAL REPORT SEPTEMBER 2015\SHMA final September 2015.docx
Figure 73: Occupancy rating and households with dependent children – Sevenoaks and
Tunbridge Wells
Source: 2011 Census
7.61 Figure 74 shows occupancy rates of households with dependent children by local authority and a
range of comparator areas. The data shows a higher level of overcrowding in Tunbridge Wells
along with a lower level of under-occupancy; however, when compared with other locations,
overcrowding in this area is quite modest. When compared with other areas, the data reveals a
particularly low level of overcrowding in Sevenoaks and well as a high proportion of households
with dependent children who under-occupy.
35.2%
13.4% 10.8% 16.4%
46.5% 40.7%
27.2%
37.3%
32.0% 30.0% 22.0%
30.5% 31.7%
34.4%
23.7%
45.6% 49.5%
33.1%
21.5% 24.5%
31.4%
3.8% 9.0% 9.7%
28.5%
1.5% 3.1% 7.0%
0%
10%
20%
30%
40%
50%
60%
70%
80%
90%
100%
Married couple Cohabitingcouple
Lone parent Otherhouseholds
All otherhouseholds
(no dependentchildren)
All households All householdswith
dependentchildren
% o
f hou
seho
lds
in g
roup
+2 or more 1 0 -1 or less
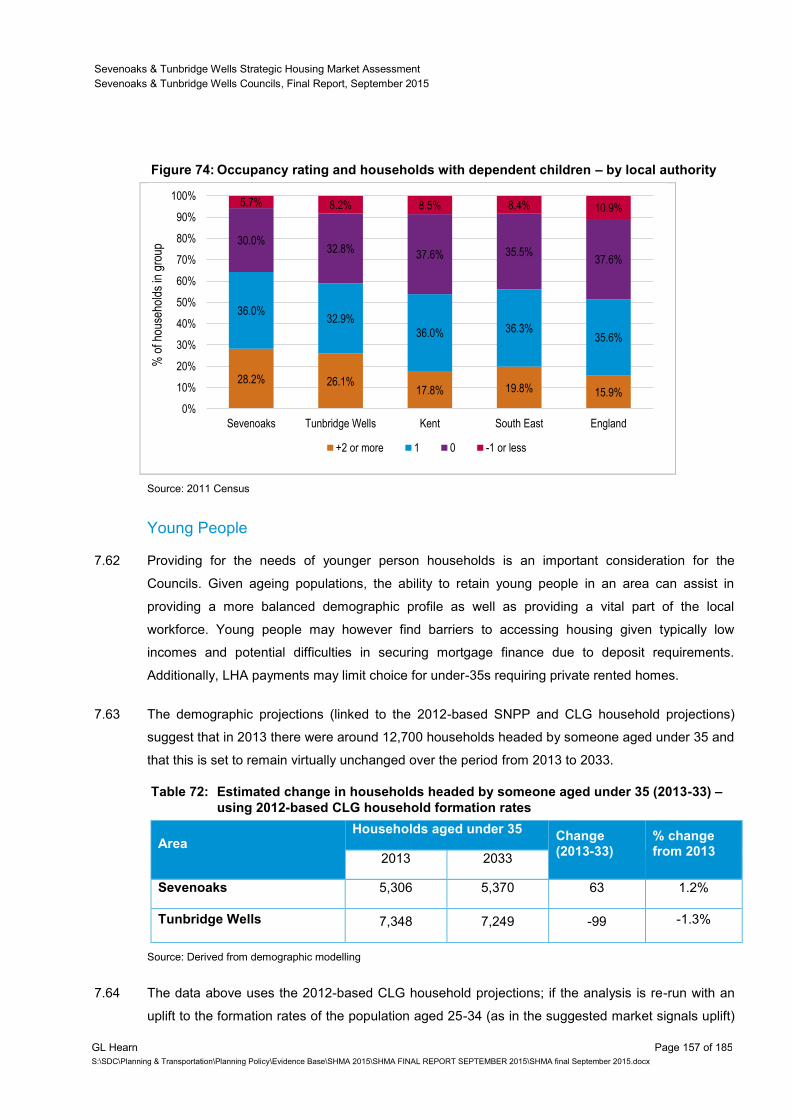
Sevenoaks & Tunbridge Wells Strategic Housing Market Assessment
Sevenoaks & Tunbridge Wells Councils, Final Report, September 2015
GL Hearn Page 157 of 185
S:\SDC\Planning & Transportation\Planning Policy\Evidence Base\SHMA 2015\SHMA FINAL REPORT SEPTEMBER 2015\SHMA final September 2015.docx
Figure 74: Occupancy rating and households with dependent children – by local authority
Source: 2011 Census
Young People
7.62 Providing for the needs of younger person households is an important consideration for the
Councils. Given ageing populations, the ability to retain young people in an area can assist in
providing a more balanced demographic profile as well as providing a vital part of the local
workforce. Young people may however find barriers to accessing housing given typically low
incomes and potential difficulties in securing mortgage finance due to deposit requirements.
Additionally, LHA payments may limit choice for under-35s requiring private rented homes.
7.63 The demographic projections (linked to the 2012-based SNPP and CLG household projections)
suggest that in 2013 there were around 12,700 households headed by someone aged under 35 and
that this is set to remain virtually unchanged over the period from 2013 to 2033.
Table 72: Estimated change in households headed by someone aged under 35 (2013-33) –
using 2012-based CLG household formation rates
Area Households aged under 35
Change (2013-33)
% change from 2013
2013 2033
Sevenoaks 5,306 5,370 63 1.2%
Tunbridge Wells 7,348 7,249 -99 -1.3%
Source: Derived from demographic modelling
7.64 The data above uses the 2012-based CLG household projections; if the analysis is re-run with an
uplift to the formation rates of the population aged 25-34 (as in the suggested market signals uplift)
28.2% 26.1% 17.8% 19.8% 15.9%
36.0% 32.9%
36.0% 36.3% 35.6%
30.0% 32.8%
37.6% 35.5% 37.6%
5.7% 8.2% 8.5% 8.4% 10.9%
0%
10%
20%
30%
40%
50%
60%
70%
80%
90%
100%
Sevenoaks Tunbridge Wells Kent South East England
% o
f hou
seho
lds
in g
roup
+2 or more 1 0 -1 or less
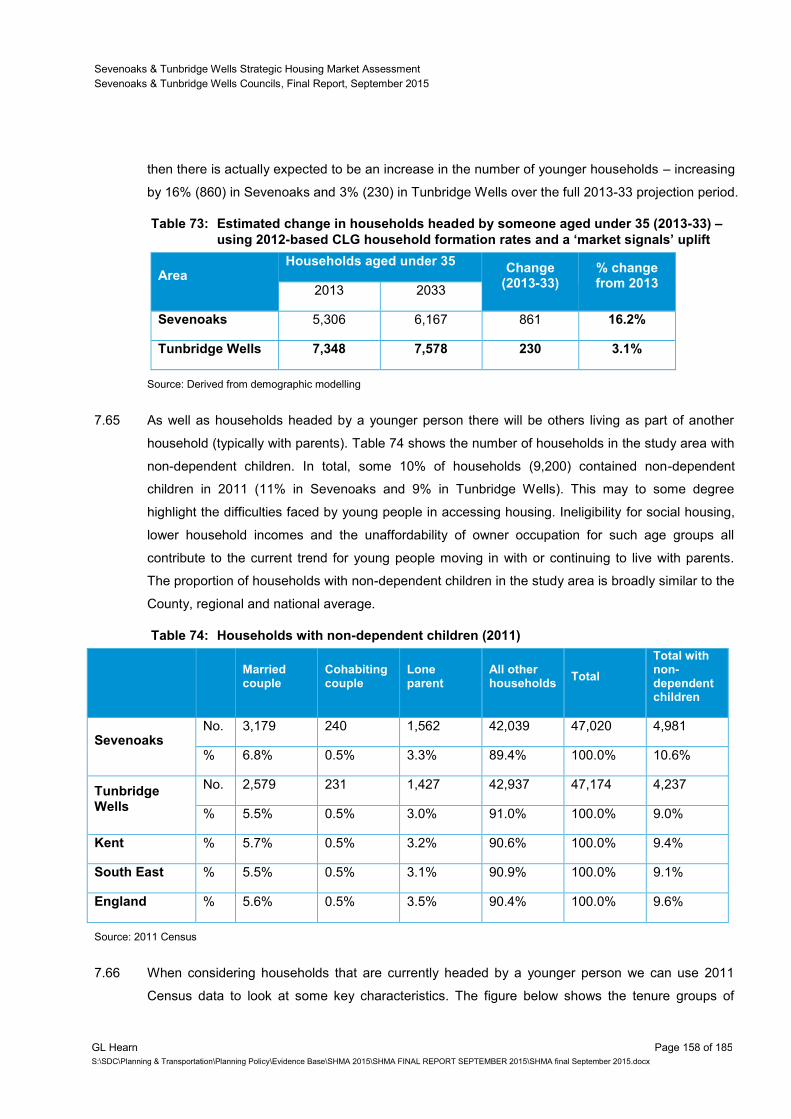
Sevenoaks & Tunbridge Wells Strategic Housing Market Assessment
Sevenoaks & Tunbridge Wells Councils, Final Report, September 2015
GL Hearn Page 158 of 185
S:\SDC\Planning & Transportation\Planning Policy\Evidence Base\SHMA 2015\SHMA FINAL REPORT SEPTEMBER 2015\SHMA final September 2015.docx
then there is actually expected to be an increase in the number of younger households – increasing
by 16% (860) in Sevenoaks and 3% (230) in Tunbridge Wells over the full 2013-33 projection period.
Table 73: Estimated change in households headed by someone aged under 35 (2013-33) –
using 2012-based CLG household formation rates and a ‘market signals’ uplift
Area Households aged under 35
Change (2013-33)
% change from 2013
2013 2033
Sevenoaks 5,306 6,167 861 16.2%
Tunbridge Wells 7,348 7,578 230 3.1%
Source: Derived from demographic modelling
7.65 As well as households headed by a younger person there will be others living as part of another
household (typically with parents). Table 74 shows the number of households in the study area with
non-dependent children. In total, some 10% of households (9,200) contained non-dependent
children in 2011 (11% in Sevenoaks and 9% in Tunbridge Wells). This may to some degree
highlight the difficulties faced by young people in accessing housing. Ineligibility for social housing,
lower household incomes and the unaffordability of owner occupation for such age groups all
contribute to the current trend for young people moving in with or continuing to live with parents.
The proportion of households with non-dependent children in the study area is broadly similar to the
County, regional and national average.
Table 74: Households with non-dependent children (2011)
Married couple
Cohabiting couple
Lone parent
All other households
Total
Total with non-dependent children
Sevenoaks No. 3,179 240 1,562 42,039 47,020 4,981
% 6.8% 0.5% 3.3% 89.4% 100.0% 10.6%
Tunbridge Wells
No. 2,579 231 1,427 42,937 47,174 4,237
% 5.5% 0.5% 3.0% 91.0% 100.0% 9.0%
Kent % 5.7% 0.5% 3.2% 90.6% 100.0% 9.4%
South East % 5.5% 0.5% 3.1% 90.9% 100.0% 9.1%
England % 5.6% 0.5% 3.5% 90.4% 100.0% 9.6%
Source: 2011 Census
7.66 When considering households that are currently headed by a younger person we can use 2011
Census data to look at some key characteristics. The figure below shows the tenure groups of
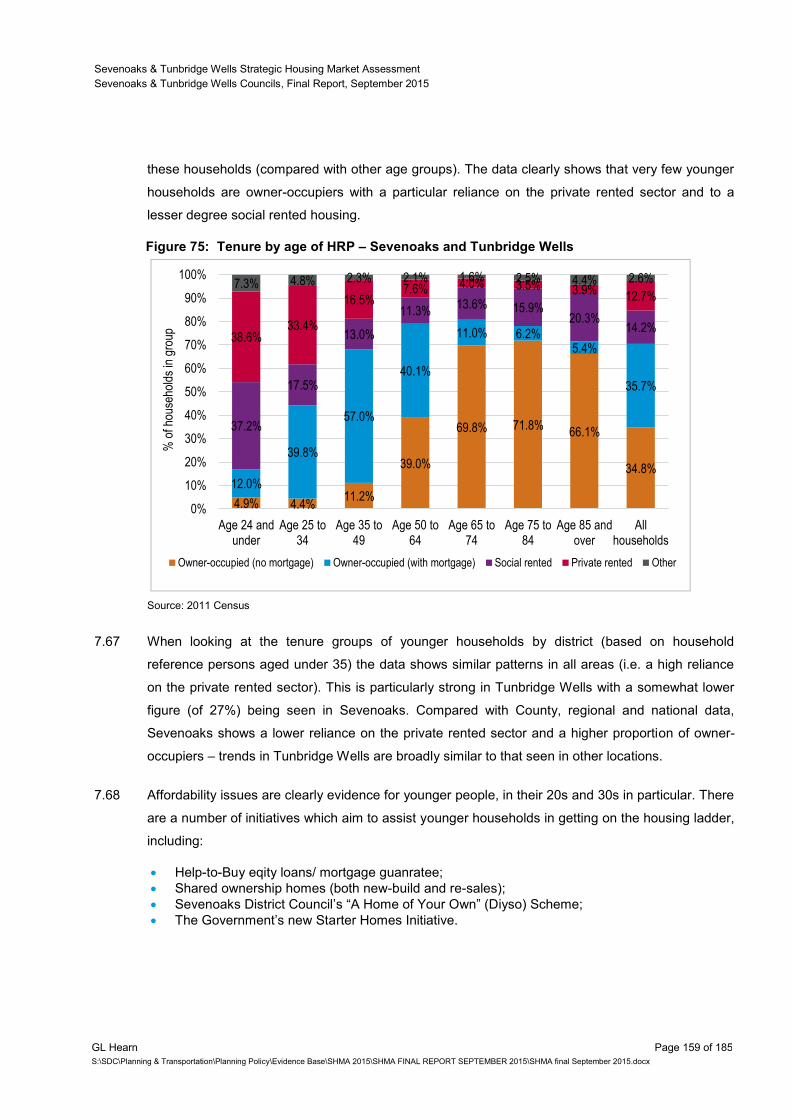
Sevenoaks & Tunbridge Wells Strategic Housing Market Assessment
Sevenoaks & Tunbridge Wells Councils, Final Report, September 2015
GL Hearn Page 159 of 185
S:\SDC\Planning & Transportation\Planning Policy\Evidence Base\SHMA 2015\SHMA FINAL REPORT SEPTEMBER 2015\SHMA final September 2015.docx
these households (compared with other age groups). The data clearly shows that very few younger
households are owner-occupiers with a particular reliance on the private rented sector and to a
lesser degree social rented housing.
Figure 75: Tenure by age of HRP – Sevenoaks and Tunbridge Wells
Source: 2011 Census
7.67 When looking at the tenure groups of younger households by district (based on household
reference persons aged under 35) the data shows similar patterns in all areas (i.e. a high reliance
on the private rented sector). This is particularly strong in Tunbridge Wells with a somewhat lower
figure (of 27%) being seen in Sevenoaks. Compared with County, regional and national data,
Sevenoaks shows a lower reliance on the private rented sector and a higher proportion of owner-
occupiers – trends in Tunbridge Wells are broadly similar to that seen in other locations.
7.68 Affordability issues are clearly evidence for younger people, in their 20s and 30s in particular. There
are a number of initiatives which aim to assist younger households in getting on the housing ladder,
including:
Help-to-Buy eqity loans/ mortgage guanratee;
Shared ownership homes (both new-build and re-sales);
Sevenoaks District Council’s “A Home of Your Own” (Diyso) Scheme;
The Government’s new Starter Homes Initiative.
4.9% 4.4% 11.2%
39.0%
69.8% 71.8% 66.1%
34.8% 12.0%
39.8%
57.0%
40.1%
11.0% 6.2% 5.4%
35.7%
37.2%
17.5%
13.0%
11.3% 13.6% 15.9%
20.3% 14.2%
38.6% 33.4%
16.5% 7.6% 4.0% 3.5% 3.9%
12.7% 7.3% 4.8% 2.3% 2.1% 1.6% 2.5% 4.4% 2.6%
0%
10%
20%
30%
40%
50%
60%
70%
80%
90%
100%
Age 24 andunder
Age 25 to34
Age 35 to49
Age 50 to64
Age 65 to74
Age 75 to84
Age 85 andover
Allhouseholds
% o
f hou
seho
lds
in g
roup
Owner-occupied (no mortgage) Owner-occupied (with mortgage) Social rented Private rented Other
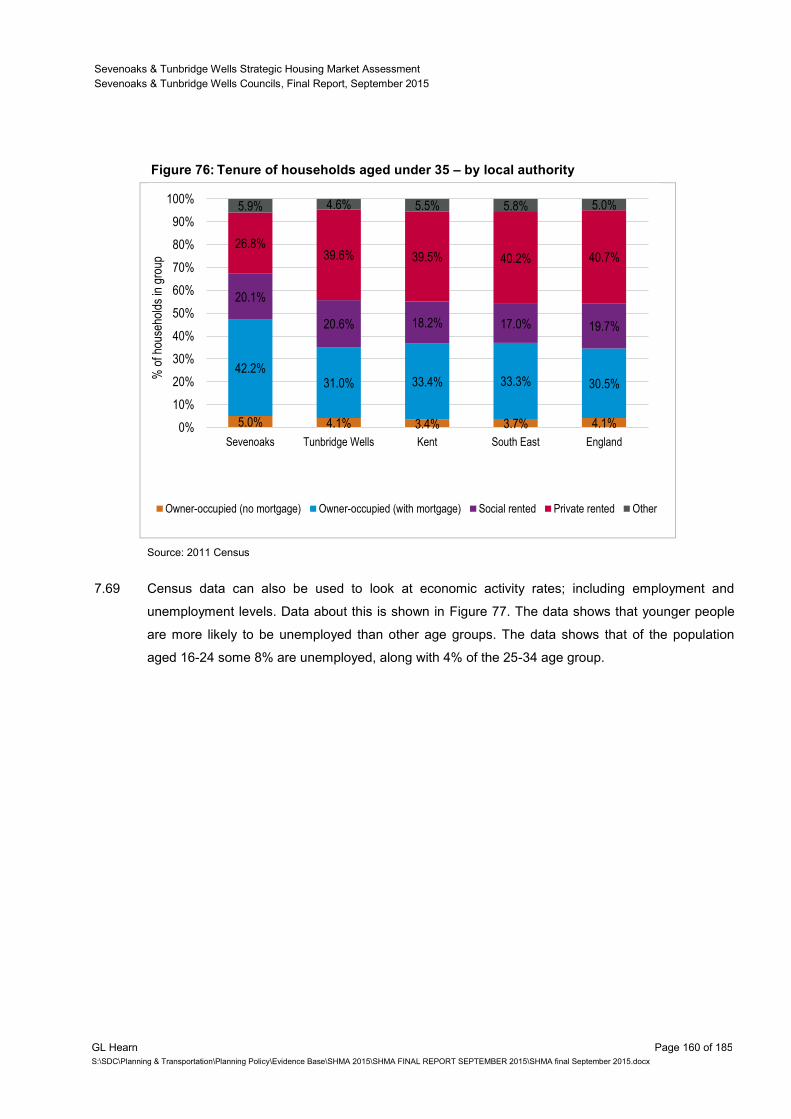
Sevenoaks & Tunbridge Wells Strategic Housing Market Assessment
Sevenoaks & Tunbridge Wells Councils, Final Report, September 2015
GL Hearn Page 160 of 185
S:\SDC\Planning & Transportation\Planning Policy\Evidence Base\SHMA 2015\SHMA FINAL REPORT SEPTEMBER 2015\SHMA final September 2015.docx
Figure 76: Tenure of households aged under 35 – by local authority
Source: 2011 Census
7.69 Census data can also be used to look at economic activity rates; including employment and
unemployment levels. Data about this is shown in Figure 77. The data shows that younger people
are more likely to be unemployed than other age groups. The data shows that of the population
aged 16-24 some 8% are unemployed, along with 4% of the 25-34 age group.
5.0% 4.1% 3.4% 3.7% 4.1%
42.2% 31.0% 33.4% 33.3% 30.5%
20.1%
20.6% 18.2% 17.0% 19.7%
26.8% 39.6% 39.5% 40.2% 40.7%
5.9% 4.6% 5.5% 5.8% 5.0%
0%
10%
20%
30%
40%
50%
60%
70%
80%
90%
100%
Sevenoaks Tunbridge Wells Kent South East England
% o
f hou
seho
lds
in g
roup
Owner-occupied (no mortgage) Owner-occupied (with mortgage) Social rented Private rented Other
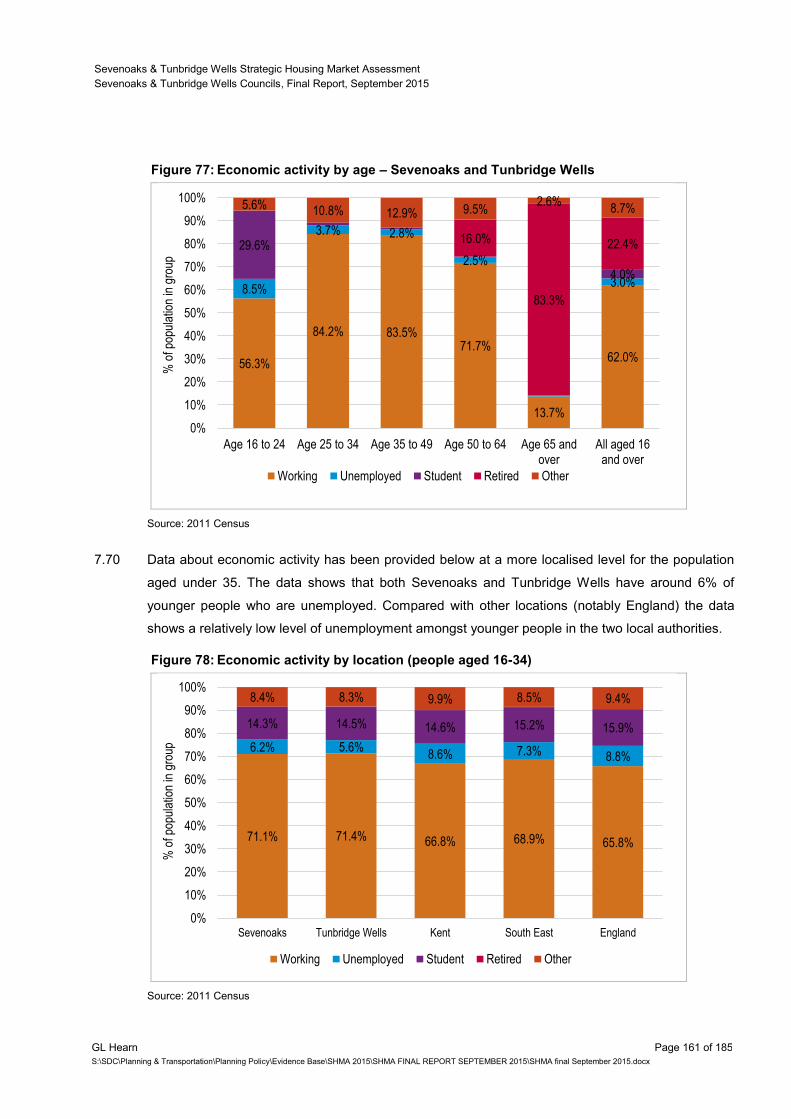
Sevenoaks & Tunbridge Wells Strategic Housing Market Assessment
Sevenoaks & Tunbridge Wells Councils, Final Report, September 2015
GL Hearn Page 161 of 185
S:\SDC\Planning & Transportation\Planning Policy\Evidence Base\SHMA 2015\SHMA FINAL REPORT SEPTEMBER 2015\SHMA final September 2015.docx
Figure 77: Economic activity by age – Sevenoaks and Tunbridge Wells
Source: 2011 Census
7.70 Data about economic activity has been provided below at a more localised level for the population
aged under 35. The data shows that both Sevenoaks and Tunbridge Wells have around 6% of
younger people who are unemployed. Compared with other locations (notably England) the data
shows a relatively low level of unemployment amongst younger people in the two local authorities.
Figure 78: Economic activity by location (people aged 16-34)
Source: 2011 Census
56.3%
84.2% 83.5% 71.7%
13.7%
62.0%
8.5%
3.7% 2.8%
2.5%
3.0%
29.6%
4.0%
16.0%
83.3%
22.4%
5.6% 10.8% 12.9% 9.5% 2.6%
8.7%
0%
10%
20%
30%
40%
50%
60%
70%
80%
90%
100%
Age 16 to 24 Age 25 to 34 Age 35 to 49 Age 50 to 64 Age 65 andover
All aged 16and over
% o
f pop
ulat
ion
in g
roup
Working Unemployed Student Retired Other
71.1% 71.4% 66.8% 68.9% 65.8%
6.2% 5.6% 8.6% 7.3% 8.8%
14.3% 14.5% 14.6% 15.2% 15.9%
8.4% 8.3% 9.9% 8.5% 9.4%
0%
10%
20%
30%
40%
50%
60%
70%
80%
90%
100%
Sevenoaks Tunbridge Wells Kent South East England
% o
f pop
ulat
ion
in g
roup
Working Unemployed Student Retired Other
Sevenoaks & Tunbridge Wells Strategic Housing Market Assessment
Sevenoaks & Tunbridge Wells Councils, Final Report, September 2015
GL Hearn Page 162 of 185
S:\SDC\Planning & Transportation\Planning Policy\Evidence Base\SHMA 2015\SHMA FINAL REPORT SEPTEMBER 2015\SHMA final September 2015.docx
Build-to-Rent
7.71 The size of the Private Rented Sector has grown in both Sevenoaks and Tunbridge Wells, and in
Tunbridge Wells in 2011 accommodated more households than social rented housing.
7.72 Between 2001-11, the number of households living in the Private Rented Sector grew by 2046 in
Sevenoaks, and 3460 in Tunbridge Wells; with the size of the sector increasing – from
accommodating 6.8% to 10.8% of households in Sevenoaks; and from 10.6% to 16.9% of
households in Tunbridge Wells. The evidence is clear that it has been the major growth sector in
the housing market.
7.73 Linked in part to this, there is an increased interest from developers in “Build to Rent” housing,
which is specifically built not for open market sale but for the Private Rented Sector. There is
evidence occupier demand, linked to high house prices and borrowing restrictions which have
resulted in a pool of young people in particular who are renting for longer.
7.74 The sector provides the opportunity for good quality, well-managed rental accommodation which is
purpose-build. In particular the sector provides the opportunity to boost overall housing delivery, as
it does not compete directly with traditional housing development schemes which are built for sale.
There are a number of active institutional investors and developers who are actively engaged in the
sector.
7.75 Government has been promoting Build-to-Rent housing. It has set up a Private Rented Sector
Taskforce; and supported delivery though other measures – including a Build to Rent Fund which
provides Government-backed loans to support new development.
7.76 The sector is currently relatively small, but is one with growth potential. To support development of
Build to Rent housing, the Council may well however need to be flexible in how affordable housing
policies are applied. The financing of development is different from that of market-led development
schemes where the properties are sold within a short-time of completion, generating a capital
receipt. For private rental development, the return on the investment is staggered over a number of
years. This impacts on finance costs and overall scheme viability.
7.77 We would expect potential sites suitable for this type of product to be focused in the main towns
and close to transport hubs.
Custom/Self-Build
7.78 SHMAs need to investigate the contribution that self-builds makes toward the local supply. Laying
the Foundations – a Housing Strategy for England 2010 sets out that only one in 10 new homes in

Sevenoaks & Tunbridge Wells Strategic Housing Market Assessment
Sevenoaks & Tunbridge Wells Councils, Final Report, September 2015
GL Hearn Page 163 of 185
S:\SDC\Planning & Transportation\Planning Policy\Evidence Base\SHMA 2015\SHMA FINAL REPORT SEPTEMBER 2015\SHMA final September 2015.docx
Britain was self-built in 2010 – a lower level than in other parts of Europe. It identifies barriers to self
or custom-build development as including:
A lack of land;
Limited finance and mortgage products;
Restrictive regulation; and
A lack of impartial information for potential custom home builders.
7.79 Government aspires to make self-build a ‘mainstream housing option’ and has thus sought to
address these issues.
7.80 There are now a number of websites which provide information on self- and custom-build housing,
including www.self-build.co.uk, www.selfbuildportal.org.uk and www.nacsba.org.uk. The level of
information and advice available is increasing. The Councils could signpost people to these.
7.81 Government is proposing to introduce a “Right-to-Build” whereby Councils are required to set up
and maintain a register of individuals who wish to build their own homes; and to use private sector
land to provide service plots for individuals who want to build their own homes. A number of
“vanguard” councils have been identified to test how this might work.
7.82 Government has also introduced a £150 million Custom Build Service Plots Loan Fund, through
which developers can bid for loan finance to bring forward serviced plots with planning permission
which can be sold to individuals for custom-build development. Government has also mooted an
extension of the Help-to-Buy Scheme to Custom Build, allowing potential self-builders to access
finance with a 5% deposit. These schemes aim to increase land supply, and address barriers
identified above.
7.83 The SHMA needs to consider potential demand for self- or custom-build development. Sevenoaks
District Council has set up a register of persons interested in self- or custom-build, but at the time of
writing this report only one person has registered. As yet, Tunbridge Wells Borough Council is still
to set up a register and wider information available is somewhat limited.
7.84 We have sought principally to use the Custom Build Register maintained by BuildStore to consider
potential demand. These are shown below, and should be treated as an indicative assessment as
at September 2015. It is likely that those registered on the BuildStore website will also be active
members on the Plot Search Register.
7.85 Delivery of self-build housing will contribute to meeting the objectively-assessed housing need for
housing identified in this report. .
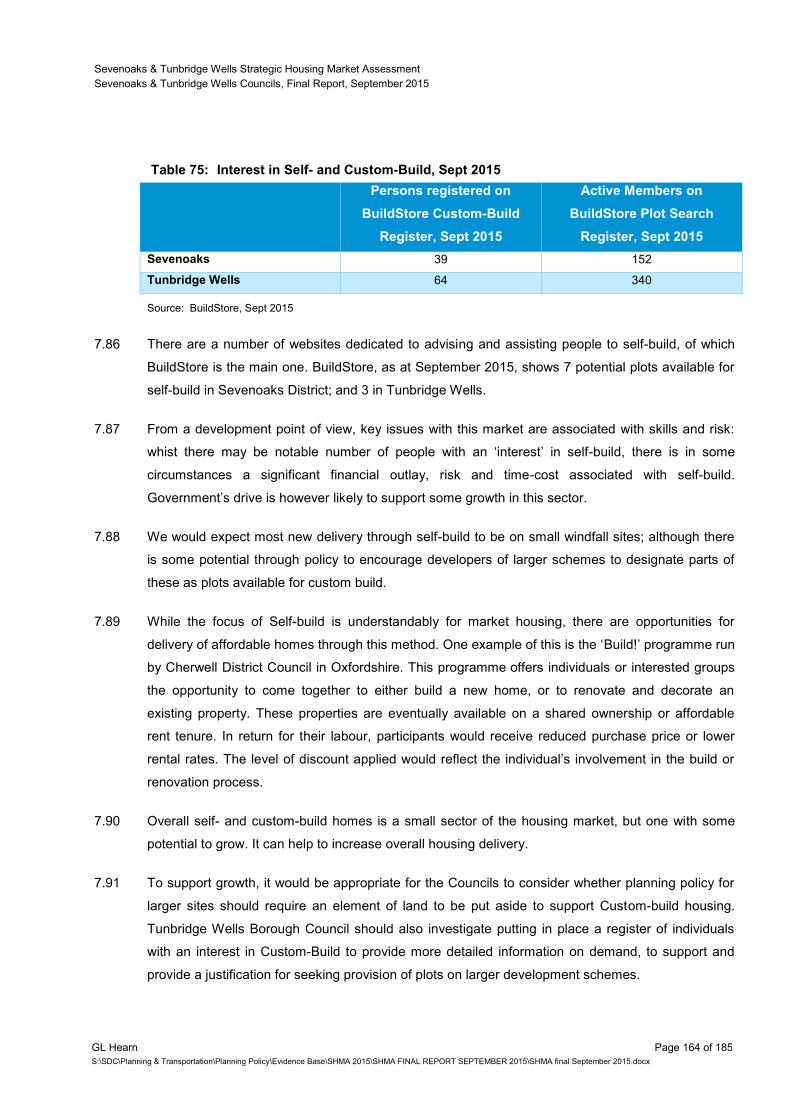
Sevenoaks & Tunbridge Wells Strategic Housing Market Assessment
Sevenoaks & Tunbridge Wells Councils, Final Report, September 2015
GL Hearn Page 164 of 185
S:\SDC\Planning & Transportation\Planning Policy\Evidence Base\SHMA 2015\SHMA FINAL REPORT SEPTEMBER 2015\SHMA final September 2015.docx
Table 75: Interest in Self- and Custom-Build, Sept 2015
Persons registered on
BuildStore Custom-Build
Register, Sept 2015
Active Members on
BuildStore Plot Search
Register, Sept 2015
Sevenoaks 39 152
Tunbridge Wells 64 340
Source: BuildStore, Sept 2015
7.86 There are a number of websites dedicated to advising and assisting people to self-build, of which
BuildStore is the main one. BuildStore, as at September 2015, shows 7 potential plots available for
self-build in Sevenoaks District; and 3 in Tunbridge Wells.
7.87 From a development point of view, key issues with this market are associated with skills and risk:
whist there may be notable number of people with an ‘interest’ in self-build, there is in some
circumstances a significant financial outlay, risk and time-cost associated with self-build.
Government’s drive is however likely to support some growth in this sector.
7.88 We would expect most new delivery through self-build to be on small windfall sites; although there
is some potential through policy to encourage developers of larger schemes to designate parts of
these as plots available for custom build.
7.89 While the focus of Self-build is understandably for market housing, there are opportunities for
delivery of affordable homes through this method. One example of this is the ‘Build!’ programme run
by Cherwell District Council in Oxfordshire. This programme offers individuals or interested groups
the opportunity to come together to either build a new home, or to renovate and decorate an
existing property. These properties are eventually available on a shared ownership or affordable
rent tenure. In return for their labour, participants would receive reduced purchase price or lower
rental rates. The level of discount applied would reflect the individual’s involvement in the build or
renovation process.
7.90 Overall self- and custom-build homes is a small sector of the housing market, but one with some
potential to grow. It can help to increase overall housing delivery.
7.91 To support growth, it would be appropriate for the Councils to consider whether planning policy for
larger sites should require an element of land to be put aside to support Custom-build housing.
Tunbridge Wells Borough Council should also investigate putting in place a register of individuals
with an interest in Custom-Build to provide more detailed information on demand, to support and
provide a justification for seeking provision of plots on larger development schemes.
Sevenoaks & Tunbridge Wells Strategic Housing Market Assessment
Sevenoaks & Tunbridge Wells Councils, Final Report, September 2015
GL Hearn Page 165 of 185
S:\SDC\Planning & Transportation\Planning Policy\Evidence Base\SHMA 2015\SHMA FINAL REPORT SEPTEMBER 2015\SHMA final September 2015.docx
Summary and Implications – Specific Groups of the Population
7.92 A key issue over the period to 2033 will be meeting the needs of a growing older population, driven
by demographic changes including increasing life expectancy. The number of people aged 65 and
above is expected to increase by 24,000 (54%) over the 20-years from 2013 to 2033. Demographic
change is likely to see a requirement for additional levels of care/support along with provision of
some specialist accommodation (particularly in the market sector).
7.93 A growing older population will generate a need for specialist housing, as well as potentially
nursing/ care home provision. It will also result in a need for properties suitable for those with
disabilities, and adaptions to existing homes to take account of people’s changing needs.
Demographic projections suggest a 135% increase in the population aged over 85 from 2013 to
2033 with Census data suggesting that around 80% of this age group have some level of disability.
7.94 The population from Black and Minority Ethnic (BME) groups in the two local authorities is
proportionally smaller than the regional and national average (and also slightly below equivalent
figures for Kent). The BME population has however grown significantly over the past decade.
Characteristics of BME groups (including tenure profiles and occupancy patterns) suggest that such
households may be disadvantaged in the housing market. Where possible the Councils should
provide advice to BME groups and in particular ensure that accommodation quality (particularly in
the private rented sector) can meet the needs of such households which are disproportionately
likely to contain children.
7.95 As we might expect, younger households have a greater reliance on rented accommodation than
other groups. Given that the housing options for young people may be more limited than for other
groups it will be important to monitor the accommodation quality – this will need to focus on HMOs
given general trends of an increase in house sharing over time.
7.96 The analysis also points to potential for growth in the Private Rented Sector, including Build to Rent;
but suggests that affordable housing policies may need to be applied somewhat flexibly given the
different economics of this form of development compared to traditional market-led housing
development schemes.
7.97 Lone parents are particularly disadvantaged in the housing market with a high reliance on rented
housing. Projections suggest an increase in the number of children in the two local authorities over
the next few years and if past trends are repeated this will also see an increase in the number of
lone parents. Again advice about housing options and maintaining a good quality of accommodation
will be critical to ensure that such households’ needs are best met and that children are provided
with a full range of opportunities (e.g. education) as they grow up.
Sevenoaks & Tunbridge Wells Strategic Housing Market Assessment
Sevenoaks & Tunbridge Wells Councils, Final Report, September 2015
GL Hearn Page 166 of 185
S:\SDC\Planning & Transportation\Planning Policy\Evidence Base\SHMA 2015\SHMA FINAL REPORT SEPTEMBER 2015\SHMA final September 2015.docx
7.98 Self- and Custom-Built Homes are identified as a further potential growth sector, with evidence of
demand in both authorities. This is a small sector, but one with growth potential; and the analysis
identifies a number of means through which the sector can be supported – including potentially
through identifying plots on larger development schemes.
Sevenoaks & Tunbridge Wells Strategic Housing Market Assessment
Sevenoaks & Tunbridge Wells Councils, Final Report, September 2015
GL Hearn Page 167 of 185
S:\SDC\Planning & Transportation\Planning Policy\Evidence Base\SHMA 2015\SHMA FINAL REPORT SEPTEMBER 2015\SHMA final September 2015.docx
8 CONCLUSIONS
8.1 This final section of the report draws together the preceding analysis to draw conclusions (leaving
aside supply-based considerations) on:
Overall housing need;
Need from different sizes of homes (both market and affordable); and
Needs for particular types of homes, particularly from the growing older population.
8.2 This report defines a West Kent Housing Market Area (HMA) which includes Sevenoaks, Tonbridge
and Tunbridge Wells and extends to include Crowborough, Hawkhurst and Heathfield. Use of a
‘best fit’ to local authority boundaries would include Sevenoaks and Tunbridge Wells; but there are
evident cross-boundary interactions with the northern parts of Rother and Wealden in East Sussex;
between Swanley and Dartford; and with London.
8.3 An assessment of housing need is undertaken following the approach set out in Planning Practice
Guidance (PPG). This is one whereby the latest population and household projections are a starting
point; and then consideration is given as to whether this needs to be adjusted to take account of
market signals, evidence of affordable housing need or to support expected economic growth. This
is a prescribed approach, which is clearly set out by Government, and against which the evidence
base is tested – such as at local plan examinations. This approach is used to define the full,
objectively assessed need (OAN) for housing on a ‘policy off’ basis. Housing need is defined for the
two local authorities of Sevenoaks and Tunbridge Wells as the NPPF requires (and as clarified by
the case law)17
.
8.4 As national policy requires, the SHMA findings purposely “leaves aside” supply-side considerations
and constraints to development – including land availability, infrastructure and Green Belt. These
considerations are applied in bringing together the evidence, and testing options for development
as part of the plan-making process. In effect, national policy sets out that development needs
should be assessed leaving aside constraints (Stage 1); and then brought together with evidence
related to land availability, development constraints, infrastructure and unmet housing needs from
other areas in deriving policy targets for housing provision through the development of local plans
(Stage 2). The requirement for this two stage approach is clearly outlined in the case law18
.
8.5 Whilst national policy sets the bar high in terms of seeking to meet housing need19
, and the ability to
do so needs to be tested as part of the plan-making process, the housing need identified in the
SHMA is not a housing target – and there may be sound reasons as to why the identified housing
need cannot be sustainably accommodated.
17
Satnam Millenium Ltd. V Warrington BC [2015] EWHC 370 (Admin) 18
City and District Council of St Albans vs. Hunston Properties Ltd [2013] EWCA Civ. 1610 19
The Hunston Case describes this as a “consideration of particular standing”
Sevenoaks & Tunbridge Wells Strategic Housing Market Assessment
Sevenoaks & Tunbridge Wells Councils, Final Report, September 2015
GL Hearn Page 168 of 185
S:\SDC\Planning & Transportation\Planning Policy\Evidence Base\SHMA 2015\SHMA FINAL REPORT SEPTEMBER 2015\SHMA final September 2015.docx
8.6 Housing targets will be set in local plans. The SHMA provides an important input into setting
targets for housing provision, but these will also take into account factors such as the supply of land
for new development, Green Belt and Areas of Outstanding Natural Beauty, local infrastructure
capacity and wider environmental constraints. These factors may limit the amount of development
which can be sustainably accommodated.
Demographic Projections – the Starting Point
8.7 Planning Practice Guidance sets out that “household projections published by the Department for
Communities and Local Government should provide the starting point estimate of overall housing
need.” The most up-to-date projections are the 2012-based CLG Household Projections published
in February 2015. These projections were underpinned by ONS (2012-based) Sub-National
Population Projections (SNPP) – published in May 2014.
8.8 The SNPP are based on trends in births, deaths and migration. Migration is projected based on
trends in domestic migration over the 2007-12 period; and international migration between 2006-12
constrained to ONS national population projections. The projections are dynamic, and take account
of how the age structure of the population in different areas is expected to change over time, and
how this can be expected to influence migration flows.
8.9 Given that the projections are influenced by trends between 2007-12, a period which included an
economic recession, the analysis suggests a moderate increase in migration from London might be
expected moving forwards. The potential impact of this has been modelled using assumptions
consistent with those adopted in Further Alternations to the London Plan (FALP).
8.10 The report concludes that an appropriate trend-based demographic projection would see population
growth of 19,900 (17.0%) in Sevenoaks District and 19,200 (16.6%) in Tunbridge Wells Borough
over the 2013-33 period.
8.11 The report applies (age-specific) assumptions on household formation to the population projections,
and includes an allowance for vacant and second homes within the housing stock (based on levels
shown by the 2011 Census). This results in a demographic-led need for 524 homes per year (2013-
33) in Sevenoaks, and 631 homes per year in Tunbridge Wells. These provide the ‘starting point’ for
assessing housing need, following the approach in the Planning Practice Guidance.
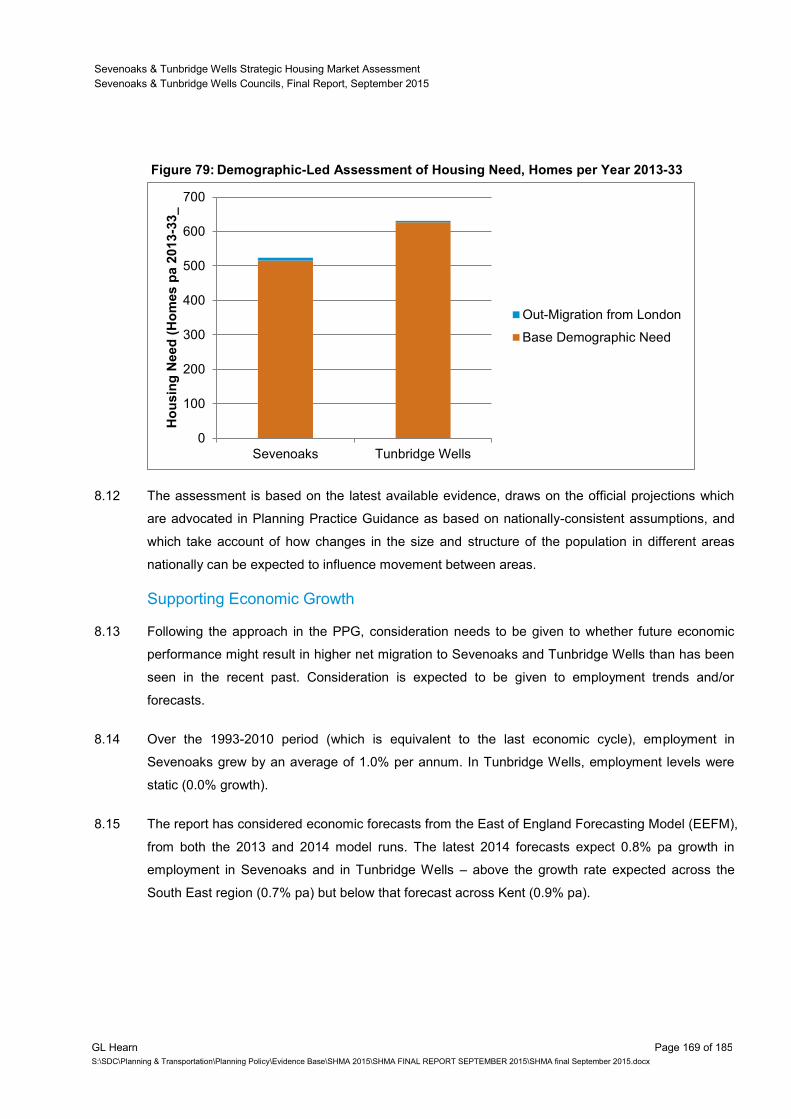
Sevenoaks & Tunbridge Wells Strategic Housing Market Assessment
Sevenoaks & Tunbridge Wells Councils, Final Report, September 2015
GL Hearn Page 169 of 185
S:\SDC\Planning & Transportation\Planning Policy\Evidence Base\SHMA 2015\SHMA FINAL REPORT SEPTEMBER 2015\SHMA final September 2015.docx
Figure 79: Demographic-Led Assessment of Housing Need, Homes per Year 2013-33
8.12 The assessment is based on the latest available evidence, draws on the official projections which
are advocated in Planning Practice Guidance as based on nationally-consistent assumptions, and
which take account of how changes in the size and structure of the population in different areas
nationally can be expected to influence movement between areas.
Supporting Economic Growth
8.13 Following the approach in the PPG, consideration needs to be given to whether future economic
performance might result in higher net migration to Sevenoaks and Tunbridge Wells than has been
seen in the recent past. Consideration is expected to be given to employment trends and/or
forecasts.
8.14 Over the 1993-2010 period (which is equivalent to the last economic cycle), employment in
Sevenoaks grew by an average of 1.0% per annum. In Tunbridge Wells, employment levels were
static (0.0% growth).
8.15 The report has considered economic forecasts from the East of England Forecasting Model (EEFM),
from both the 2013 and 2014 model runs. The latest 2014 forecasts expect 0.8% pa growth in
employment in Sevenoaks and in Tunbridge Wells – above the growth rate expected across the
South East region (0.7% pa) but below that forecast across Kent (0.9% pa).
0
100
200
300
400
500
600
700
Sevenoaks Tunbridge Wells
Ho
usin
g N
eed
(H
om
es p
a 2
013
-33_
Out-Migration from London
Base Demographic Need
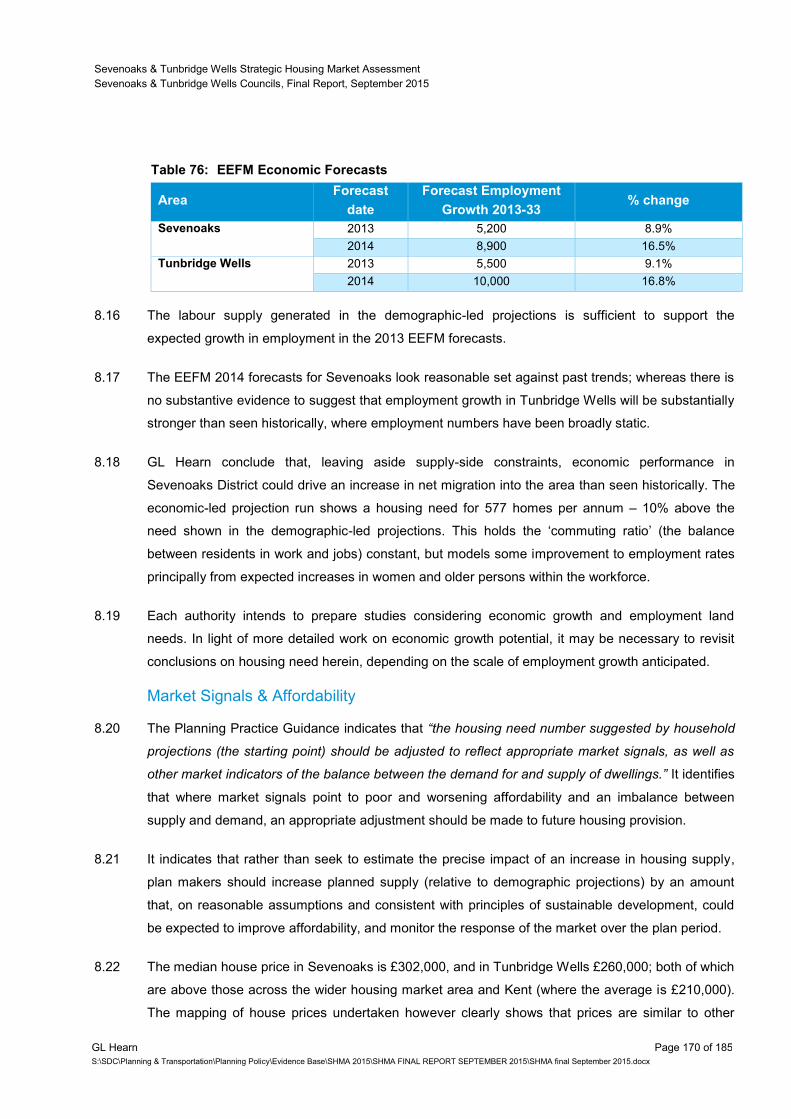
Sevenoaks & Tunbridge Wells Strategic Housing Market Assessment
Sevenoaks & Tunbridge Wells Councils, Final Report, September 2015
GL Hearn Page 170 of 185
S:\SDC\Planning & Transportation\Planning Policy\Evidence Base\SHMA 2015\SHMA FINAL REPORT SEPTEMBER 2015\SHMA final September 2015.docx
Table 76: EEFM Economic Forecasts
Area Forecast
date
Forecast Employment
Growth 2013-33 % change
Sevenoaks 2013 5,200 8.9%
2014 8,900 16.5%
Tunbridge Wells 2013 5,500 9.1%
2014 10,000 16.8%
8.16 The labour supply generated in the demographic-led projections is sufficient to support the
expected growth in employment in the 2013 EEFM forecasts.
8.17 The EEFM 2014 forecasts for Sevenoaks look reasonable set against past trends; whereas there is
no substantive evidence to suggest that employment growth in Tunbridge Wells will be substantially
stronger than seen historically, where employment numbers have been broadly static.
8.18 GL Hearn conclude that, leaving aside supply-side constraints, economic performance in
Sevenoaks District could drive an increase in net migration into the area than seen historically. The
economic-led projection run shows a housing need for 577 homes per annum – 10% above the
need shown in the demographic-led projections. This holds the ‘commuting ratio’ (the balance
between residents in work and jobs) constant, but models some improvement to employment rates
principally from expected increases in women and older persons within the workforce.
8.19 Each authority intends to prepare studies considering economic growth and employment land
needs. In light of more detailed work on economic growth potential, it may be necessary to revisit
conclusions on housing need herein, depending on the scale of employment growth anticipated.
Market Signals & Affordability
8.20 The Planning Practice Guidance indicates that “the housing need number suggested by household
projections (the starting point) should be adjusted to reflect appropriate market signals, as well as
other market indicators of the balance between the demand for and supply of dwellings.” It identifies
that where market signals point to poor and worsening affordability and an imbalance between
supply and demand, an appropriate adjustment should be made to future housing provision.
8.21 It indicates that rather than seek to estimate the precise impact of an increase in housing supply,
plan makers should increase planned supply (relative to demographic projections) by an amount
that, on reasonable assumptions and consistent with principles of sustainable development, could
be expected to improve affordability, and monitor the response of the market over the plan period.
8.22 The median house price in Sevenoaks is £302,000, and in Tunbridge Wells £260,000; both of which
are above those across the wider housing market area and Kent (where the average is £210,000).
The mapping of house prices undertaken however clearly shows that prices are similar to other
Sevenoaks & Tunbridge Wells Strategic Housing Market Assessment
Sevenoaks & Tunbridge Wells Councils, Final Report, September 2015
GL Hearn Page 171 of 185
S:\SDC\Planning & Transportation\Planning Policy\Evidence Base\SHMA 2015\SHMA FINAL REPORT SEPTEMBER 2015\SHMA final September 2015.docx
areas close to London. Whilst house price increases over the period since 2008 have been modest,
particularly in real terms (taking account of inflation); growth in rents in both areas has been above
inflation.
8.23 The evidence points to notable affordability pressures, with the lower quartile (entry level) house
prices 11 times earnings of younger households in Sevenoaks; and 9.7 times earnings in Tunbridge
Wells. This compares to a ratio of 6.5 nationally.
8.24 The analysis also suggests some real impacts of affordability pressures. Over the 2001-11 period,
home ownership fell (with increasing numbers of households renting privately). Levels of over-
occupied households and those in shared housing increased, albeit that levels of both remain below
Kent and national averages.
8.25 As we might expect, the high housing costs have contributed to levels of households who require
financial support in meeting their housing needs, and would be eligible for affordable housing. The
report identifies a net need from 422 households per annum for affordable housing in Sevenoaks;
and from 341 households per annum in Tunbridge Wells.
8.26 This includes need arising from concealed and homeless households – who will require additional
housing – as well as from overcrowded households, or those who seek an alternative tenure of
accommodation, but would release a home for other households should a new affordable home be
provided. Households in the former categories will generate a need for additional homes overall.
8.27 The evidence from market signals, and from the affordable housing needs assessment, point to
affordability pressures. The report provides evidence that deteriorating affordability (coupled with
the credit crunch) resulted in a fall in household formation amongst households in their late 20s and
early 30s over the 2001-11 period. An improvement in affordability can be expected to see a rise in
household formation amongst these households.
8.28 Taking account of market conditions, where sales volumes remain below pre-2008 levels and
market capacity issues, coupled with the tightening of lending criteria for accessing mortgage
finance, it is reasonable to expect household formation for younger households to improve
gradually over time (if supply-side considerations such as land availability are left aside). The report
models an improvement in household formation rates amongst households aged 25-34, returning to
2001 levels by 2033. This adjustment is applied to the demographic and/or economic-led
projections to derive conclusions on the objectively-assessed housing need.
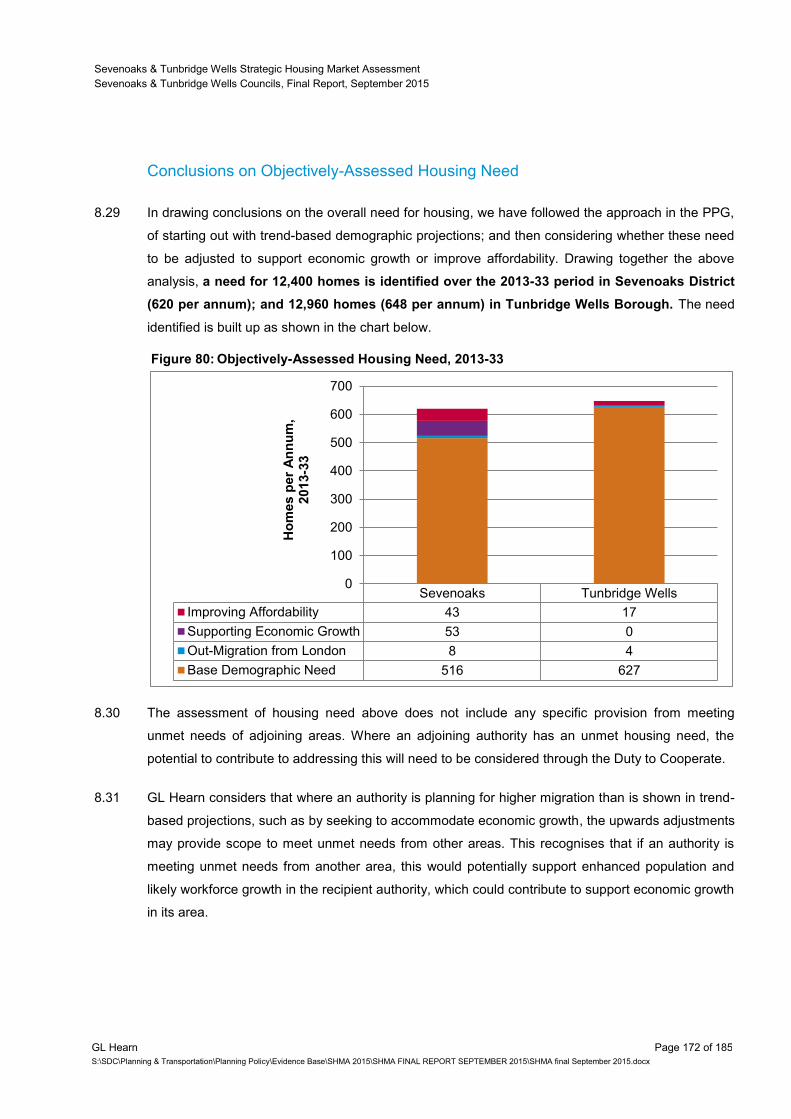
Sevenoaks & Tunbridge Wells Strategic Housing Market Assessment
Sevenoaks & Tunbridge Wells Councils, Final Report, September 2015
GL Hearn Page 172 of 185
S:\SDC\Planning & Transportation\Planning Policy\Evidence Base\SHMA 2015\SHMA FINAL REPORT SEPTEMBER 2015\SHMA final September 2015.docx
Conclusions on Objectively-Assessed Housing Need
8.29 In drawing conclusions on the overall need for housing, we have followed the approach in the PPG,
of starting out with trend-based demographic projections; and then considering whether these need
to be adjusted to support economic growth or improve affordability. Drawing together the above
analysis, a need for 12,400 homes is identified over the 2013-33 period in Sevenoaks District
(620 per annum); and 12,960 homes (648 per annum) in Tunbridge Wells Borough. The need
identified is built up as shown in the chart below.
Figure 80: Objectively-Assessed Housing Need, 2013-33
8.30 The assessment of housing need above does not include any specific provision from meeting
unmet needs of adjoining areas. Where an adjoining authority has an unmet housing need, the
potential to contribute to addressing this will need to be considered through the Duty to Cooperate.
8.31 GL Hearn considers that where an authority is planning for higher migration than is shown in trend-
based projections, such as by seeking to accommodate economic growth, the upwards adjustments
may provide scope to meet unmet needs from other areas. This recognises that if an authority is
meeting unmet needs from another area, this would potentially support enhanced population and
likely workforce growth in the recipient authority, which could contribute to support economic growth
in its area.
Sevenoaks Tunbridge Wells
Improving Affordability 43 17
Supporting Economic Growth 53 0
Out-Migration from London 8 4
Base Demographic Need 516 627
0
100
200
300
400
500
600
700
Ho
mes p
er
An
nu
m,
2013-3
3
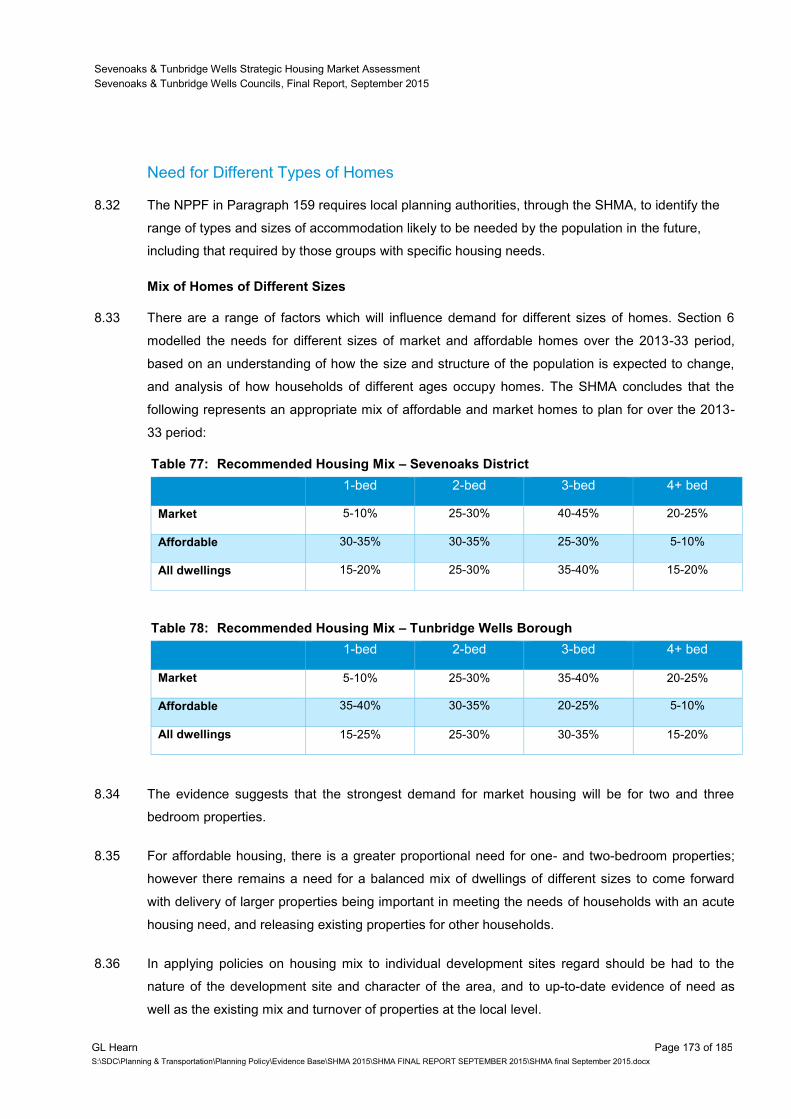
Sevenoaks & Tunbridge Wells Strategic Housing Market Assessment
Sevenoaks & Tunbridge Wells Councils, Final Report, September 2015
GL Hearn Page 173 of 185
S:\SDC\Planning & Transportation\Planning Policy\Evidence Base\SHMA 2015\SHMA FINAL REPORT SEPTEMBER 2015\SHMA final September 2015.docx
Need for Different Types of Homes
8.32 The NPPF in Paragraph 159 requires local planning authorities, through the SHMA, to identify the
range of types and sizes of accommodation likely to be needed by the population in the future,
including that required by those groups with specific housing needs.
Mix of Homes of Different Sizes
8.33 There are a range of factors which will influence demand for different sizes of homes. Section 6
modelled the needs for different sizes of market and affordable homes over the 2013-33 period,
based on an understanding of how the size and structure of the population is expected to change,
and analysis of how households of different ages occupy homes. The SHMA concludes that the
following represents an appropriate mix of affordable and market homes to plan for over the 2013-
33 period:
Table 77: Recommended Housing Mix – Sevenoaks District
1-bed 2-bed 3-bed 4+ bed
Market 5-10% 25-30% 40-45% 20-25%
Affordable 30-35% 30-35% 25-30% 5-10%
All dwellings 15-20% 25-30% 35-40% 15-20%
Table 78: Recommended Housing Mix – Tunbridge Wells Borough
1-bed 2-bed 3-bed 4+ bed
Market 5-10% 25-30% 35-40% 20-25%
Affordable 35-40% 30-35% 20-25% 5-10%
All dwellings 15-25% 25-30% 30-35% 15-20%
8.34 The evidence suggests that the strongest demand for market housing will be for two and three
bedroom properties.
8.35 For affordable housing, there is a greater proportional need for one- and two-bedroom properties;
however there remains a need for a balanced mix of dwellings of different sizes to come forward
with delivery of larger properties being important in meeting the needs of households with an acute
housing need, and releasing existing properties for other households.
8.36 In applying policies on housing mix to individual development sites regard should be had to the
nature of the development site and character of the area, and to up-to-date evidence of need as
well as the existing mix and turnover of properties at the local level.
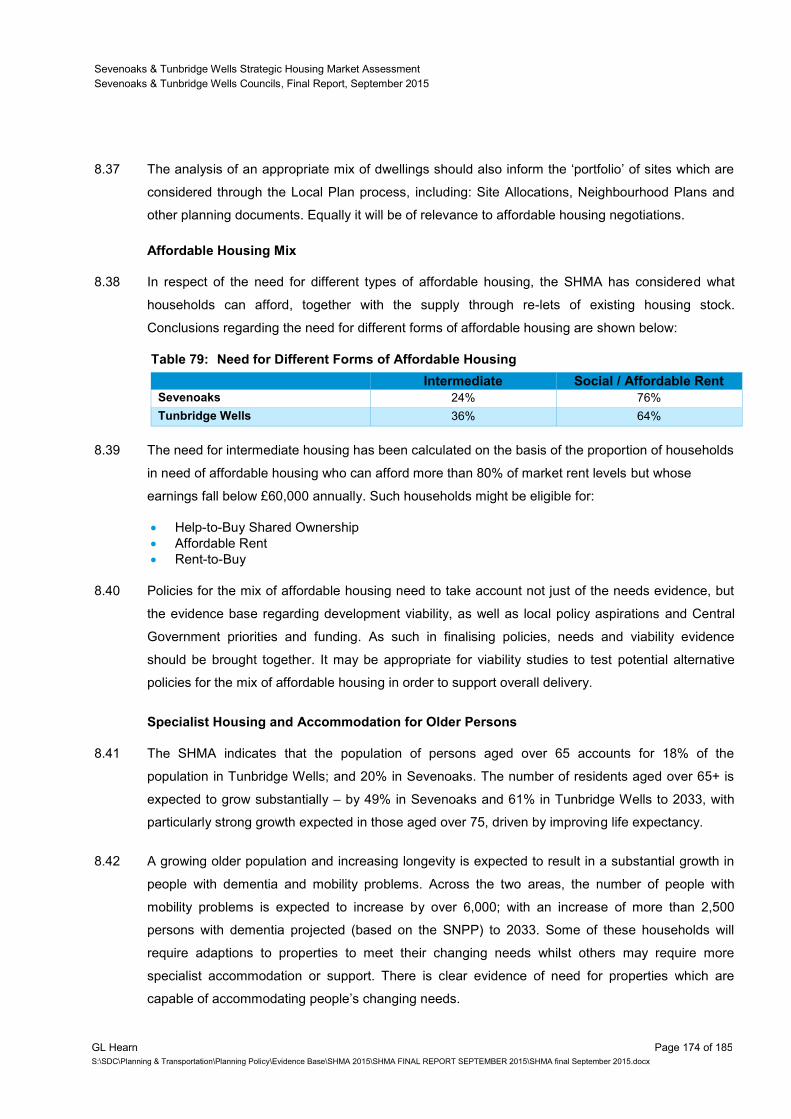
Sevenoaks & Tunbridge Wells Strategic Housing Market Assessment
Sevenoaks & Tunbridge Wells Councils, Final Report, September 2015
GL Hearn Page 174 of 185
S:\SDC\Planning & Transportation\Planning Policy\Evidence Base\SHMA 2015\SHMA FINAL REPORT SEPTEMBER 2015\SHMA final September 2015.docx
8.37 The analysis of an appropriate mix of dwellings should also inform the ‘portfolio’ of sites which are
considered through the Local Plan process, including: Site Allocations, Neighbourhood Plans and
other planning documents. Equally it will be of relevance to affordable housing negotiations.
Affordable Housing Mix
8.38 In respect of the need for different types of affordable housing, the SHMA has considered what
households can afford, together with the supply through re-lets of existing housing stock.
Conclusions regarding the need for different forms of affordable housing are shown below:
Table 79: Need for Different Forms of Affordable Housing
Intermediate Social / Affordable Rent
Sevenoaks 24% 76%
Tunbridge Wells 36% 64%
8.39 The need for intermediate housing has been calculated on the basis of the proportion of households
in need of affordable housing who can afford more than 80% of market rent levels but whose
earnings fall below £60,000 annually. Such households might be eligible for:
Help-to-Buy Shared Ownership
Affordable Rent
Rent-to-Buy
8.40 Policies for the mix of affordable housing need to take account not just of the needs evidence, but
the evidence base regarding development viability, as well as local policy aspirations and Central
Government priorities and funding. As such in finalising policies, needs and viability evidence
should be brought together. It may be appropriate for viability studies to test potential alternative
policies for the mix of affordable housing in order to support overall delivery.
Specialist Housing and Accommodation for Older Persons
8.41 The SHMA indicates that the population of persons aged over 65 accounts for 18% of the
population in Tunbridge Wells; and 20% in Sevenoaks. The number of residents aged over 65+ is
expected to grow substantially – by 49% in Sevenoaks and 61% in Tunbridge Wells to 2033, with
particularly strong growth expected in those aged over 75, driven by improving life expectancy.
8.42 A growing older population and increasing longevity is expected to result in a substantial growth in
people with dementia and mobility problems. Across the two areas, the number of people with
mobility problems is expected to increase by over 6,000; with an increase of more than 2,500
persons with dementia projected (based on the SNPP) to 2033. Some of these households will
require adaptions to properties to meet their changing needs whilst others may require more
specialist accommodation or support. There is clear evidence of need for properties which are
capable of accommodating people’s changing needs.
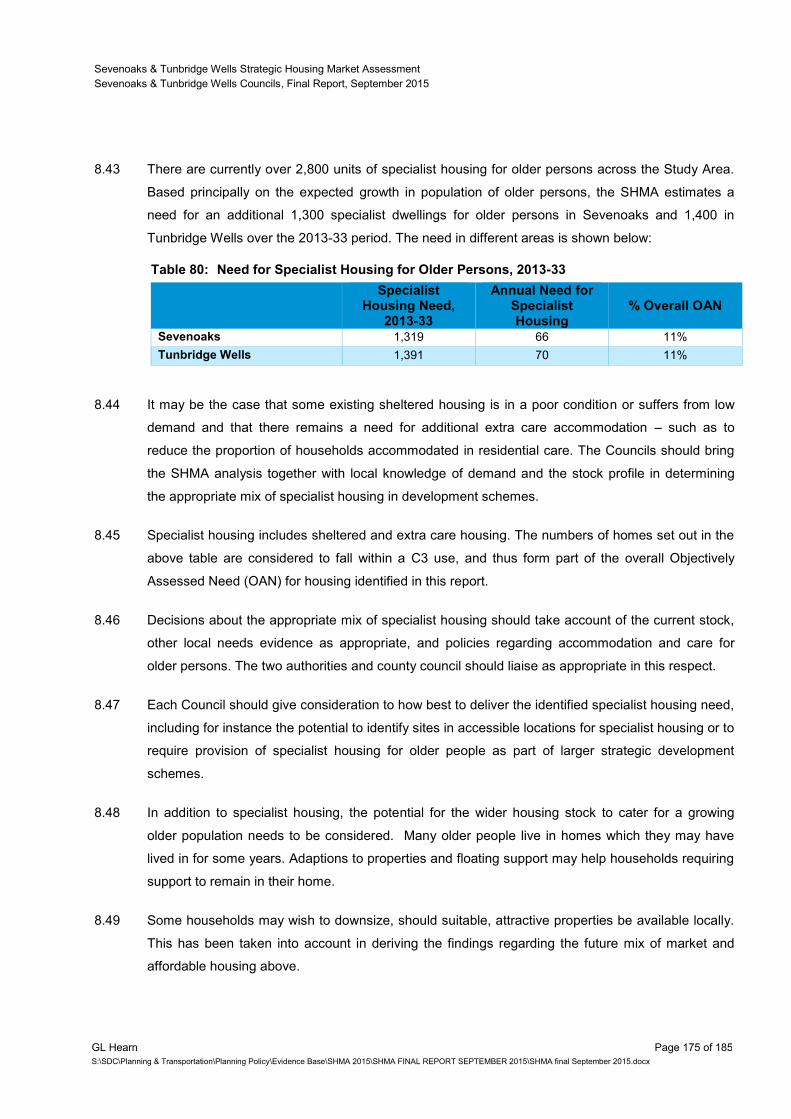
Sevenoaks & Tunbridge Wells Strategic Housing Market Assessment
Sevenoaks & Tunbridge Wells Councils, Final Report, September 2015
GL Hearn Page 175 of 185
S:\SDC\Planning & Transportation\Planning Policy\Evidence Base\SHMA 2015\SHMA FINAL REPORT SEPTEMBER 2015\SHMA final September 2015.docx
8.43 There are currently over 2,800 units of specialist housing for older persons across the Study Area.
Based principally on the expected growth in population of older persons, the SHMA estimates a
need for an additional 1,300 specialist dwellings for older persons in Sevenoaks and 1,400 in
Tunbridge Wells over the 2013-33 period. The need in different areas is shown below:
Table 80: Need for Specialist Housing for Older Persons, 2013-33
Specialist
Housing Need, 2013-33
Annual Need for Specialist Housing
% Overall OAN
Sevenoaks 1,319 66 11%
Tunbridge Wells 1,391 70 11%
8.44 It may be the case that some existing sheltered housing is in a poor condition or suffers from low
demand and that there remains a need for additional extra care accommodation – such as to
reduce the proportion of households accommodated in residential care. The Councils should bring
the SHMA analysis together with local knowledge of demand and the stock profile in determining
the appropriate mix of specialist housing in development schemes.
8.45 Specialist housing includes sheltered and extra care housing. The numbers of homes set out in the
above table are considered to fall within a C3 use, and thus form part of the overall Objectively
Assessed Need (OAN) for housing identified in this report.
8.46 Decisions about the appropriate mix of specialist housing should take account of the current stock,
other local needs evidence as appropriate, and policies regarding accommodation and care for
older persons. The two authorities and county council should liaise as appropriate in this respect.
8.47 Each Council should give consideration to how best to deliver the identified specialist housing need,
including for instance the potential to identify sites in accessible locations for specialist housing or to
require provision of specialist housing for older people as part of larger strategic development
schemes.
8.48 In addition to specialist housing, the potential for the wider housing stock to cater for a growing
older population needs to be considered. Many older people live in homes which they may have
lived in for some years. Adaptions to properties and floating support may help households requiring
support to remain in their home.
8.49 Some households may wish to downsize, should suitable, attractive properties be available locally.
This has been taken into account in deriving the findings regarding the future mix of market and
affordable housing above.
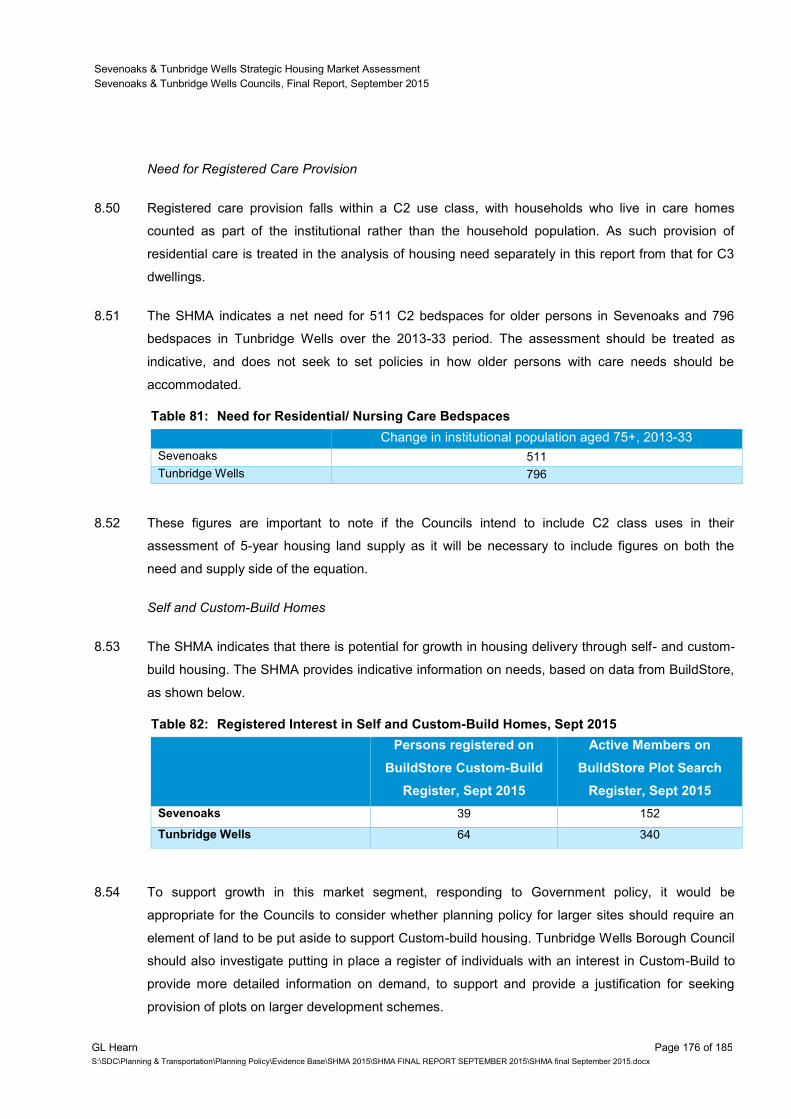
Sevenoaks & Tunbridge Wells Strategic Housing Market Assessment
Sevenoaks & Tunbridge Wells Councils, Final Report, September 2015
GL Hearn Page 176 of 185
S:\SDC\Planning & Transportation\Planning Policy\Evidence Base\SHMA 2015\SHMA FINAL REPORT SEPTEMBER 2015\SHMA final September 2015.docx
Need for Registered Care Provision
8.50 Registered care provision falls within a C2 use class, with households who live in care homes
counted as part of the institutional rather than the household population. As such provision of
residential care is treated in the analysis of housing need separately in this report from that for C3
dwellings.
8.51 The SHMA indicates a net need for 511 C2 bedspaces for older persons in Sevenoaks and 796
bedspaces in Tunbridge Wells over the 2013-33 period. The assessment should be treated as
indicative, and does not seek to set policies in how older persons with care needs should be
accommodated.
Table 81: Need for Residential/ Nursing Care Bedspaces
Change in institutional population aged 75+, 2013-33
Sevenoaks 511
Tunbridge Wells 796
8.52 These figures are important to note if the Councils intend to include C2 class uses in their
assessment of 5-year housing land supply as it will be necessary to include figures on both the
need and supply side of the equation.
Self and Custom-Build Homes
8.53 The SHMA indicates that there is potential for growth in housing delivery through self- and custom-
build housing. The SHMA provides indicative information on needs, based on data from BuildStore,
as shown below.
Table 82: Registered Interest in Self and Custom-Build Homes, Sept 2015
Persons registered on
BuildStore Custom-Build
Register, Sept 2015
Active Members on
BuildStore Plot Search
Register, Sept 2015
Sevenoaks 39 152
Tunbridge Wells 64 340
8.54 To support growth in this market segment, responding to Government policy, it would be
appropriate for the Councils to consider whether planning policy for larger sites should require an
element of land to be put aside to support Custom-build housing. Tunbridge Wells Borough Council
should also investigate putting in place a register of individuals with an interest in Custom-Build to
provide more detailed information on demand, to support and provide a justification for seeking
provision of plots on larger development schemes.
Sevenoaks & Tunbridge Wells Strategic Housing Market Assessment
Sevenoaks & Tunbridge Wells Councils, Final Report, September 2015
GL Hearn Page 177 of 185
S:\SDC\Planning & Transportation\Planning Policy\Evidence Base\SHMA 2015\SHMA FINAL REPORT SEPTEMBER 2015\SHMA final September 2015.docx
Build-to-Rent
8.55 The Private Rented Sector has grown significantly in size over the 2001-11 period in both
Sevenoaks and Tunbridge Wells. There is potential, moving forwards, for institutional investment in
‘Build-to-Rent’ housing schemes.
8.56 The Build-to-Rent sector is currently small but there is growth potential. It can contribute positively
to overall housing delivery, however the Councils may need to consider how affordable housing
policies are applied to this Private Rented Sector housing, given that the viability of such schemes
is very different to those of more ‘traditional’ market or mixed-tenure developments.
Meeting the Needs of Other Vulnerable Groups
8.57 The SHMA has considered the needs of a number of other vulnerable groups. The two local
authorities have a relatively modest Black and Minority Ethnic (BME) population, but one which has
been growing. BME households may be disadvantaged in the housing market. Where possible the
Councils should provide advice to BME groups and in particular ensure that accommodation quality
(particularly in the private rented sector) can meet the needs of such households which are
disproportionately likely to contain children.
8.58 The evidence also suggests that lone parent households are more likely to be disadvantaged than
other household groups. Advice on housing options and securing good quality of accommodation
will be critical to ensure that such households’ needs are best met and that children are provided
with a full range of opportunities.
8.59 Younger households in the two areas typically have a higher reliance on rented accommodation.
Given that the housing options for young people may be more limited than for other groups it will be
important to monitor the accommodation quality – this will need to focus on the quality of shared
accommodation and housing within the Private Rented Sector.
Sevenoaks & Tunbridge Wells Strategic Housing Market Assessment
Sevenoaks & Tunbridge Wells Councils, Final Report, September 2015
GL Hearn Page 178 of 185
S:\SDC\Planning & Transportation\Planning Policy\Evidence Base\SHMA 2015\SHMA FINAL REPORT SEPTEMBER 2015\SHMA final September 2015.docx
Appendices
APPENDIX A: GLOSSARY AND DEFINITIONS
Definitions used in this report are set out below.
Affordable Housing Need
1. Affordable housing need is defined as the number of households who lack their own housing or who live in unsuitable housing and who cannot afford to meet their housing needs in the market.
Newly-Arising Need
2. Newly-arising (or future) need is a measure of the number of households who are expected to have an affordable housing need at some point in the future. In this assessment we have used trend data from CoRe along with demographic projections about the number of new households forming (along with affordability) to estimate future needs.
Supply of Affordable Housing
3. An estimate of the likely future supply of affordable housing is also made (drawing on secondary data sources about past lettings). The future supply of affordable housing is subtracted from the newly-arising need to make an assessment of the net future need for affordable housing.
Assessment of Affordability
4. Affordability is assessed by comparing household incomes, based on income data modelled using a number of sources including CACI, ASHE, the English Housing Survey (EHS) and ONS data, against the cost of suitable market housing (to either buy or rent). Separate tests are applied for home ownership and private renting (in line with the SHMA Guidance) and are summarised below:
A. Assessing whether a household can afford home ownership: A household is considered able to afford to buy a home if it costs 3.5 times the gross household income – CLG guidance
suggests using different measures for households with multiple incomes (2.9) and those
with a single income (3.5), however (partly due to data availability) we have only used a 3.5 times multiplier for analysis. This ensures that affordable housing need figures are not over-estimated – in practical terms it makes little difference to the analysis due to the inclusion of a rental test (below) which tends to require lower incomes for households to be able to afford access to market housing;
B. Assessing whether a household can afford market renting: A household is considered able to afford market rented housing in cases where the rent payable would constitute no more than 30% of gross income. The choice of an appropriate threshold is an important aspect of the analysis, CLG guidance (of 2007) suggested that 25% of income is a reasonable start point but also notes that a different figure could be used. Analysis of current letting practice suggests that letting agents typically work on a multiple of 40% (although this can vary by area). Government policy (through Housing Benefit payment thresholds) would also suggest a figure of 40%+ (depending on household characteristics). Hence a pragmatic view has been taken in this assessment with a figure of 30% being adopted. Analysis has also been carried out to test the sensitivity of affordable need at different percentages (from 25% to 40%).
5. It should be recognised that a key challenge in assessing affordable housing need using secondary sources is the lack of information available regarding households’ existing savings. This is a key factor in affecting the ability of young households to purchase housing particularly in the current market context where a deposit of at least 10% is typically required for the more attractive mortgage
Sevenoaks & Tunbridge Wells Strategic Housing Market Assessment
Sevenoaks & Tunbridge Wells Councils, Final Report, September 2015
GL Hearn Page 179 of 185
S:\SDC\Planning & Transportation\Planning Policy\Evidence Base\SHMA 2015\SHMA FINAL REPORT SEPTEMBER 2015\SHMA final September 2015.docx
deals. The ‘help to buy’ scheme is likely to be making some improvements in access to the owner-occupied sector although at present this is likely to be limited (although the impact of recent extensions to this scheme to include the second-hand market should be monitored moving forward). In many cases households who do not have sufficient savings to purchase have sufficient income to rent housing privately without support, and thus the impact of deposit issues on the overall assessment of affordable housing need is limited.
Affordable Housing
6. The NPPF provides the definition of affordable housing (as used in this report). The following is taken from Annex 2 of NPPF.
“Affordable housing includes social rented, affordable rented and intermediate housing, provided to
specified eligible households whose needs are not met by the market. Affordable housing should:
Meet the needs of eligible households including availability at a cost low enough for them to afford, determined with regard to local incomes and local house prices;
Include provision for the home to remain at an affordable price for future eligible households or, if these restrictions are lifted, for the subsidy to be recycled for alternative affordable housing provision.”
7. Within the definition of affordable housing there is also the distinction between social rented affordable rented, and intermediate housing. Social rented housing is defined as:
“Rented housing owned and managed by local authorities and registered social landlords, for which guideline target rents are determined through the national rent regime. It may also include rented housing owned or managed by other persons and provided under equivalent rental arrangements to the above, as agreed with the local authority or with the Homes and Communities Agency as a
condition of grant.”
8. Affordable rented housing is defined as:
“Rented housing let by registered providers of social housing to households who are eligible for social rented housing. Affordable Rent is not subject to the national rent regime but is subject to other rent controls that require a rent of no more than 80 per cent of the local market rent.”
9. The definition of intermediate housing is shown below:
“Intermediate affordable housing is ‘Housing at prices and rents above those of social rent, but below market price or rents. These can include shared equity products (e.g. HomeBuy), other low cost homes for sale and intermediate rent but does not include affordable rented housing.”
Specialist Housing
10. This is housing that has been specifically designed to meet the needs of people with particular needs. It can refer to housing that has been purpose designed or designated for a particular client group to assist tenants to live independently.
Sheltered Housing
11. Sheltered Homes are self-contained properties designated for older people that are linked to and supported by sheltered housing support staff. The support staff provides housing support to tenants to assist them live independently
Sevenoaks & Tunbridge Wells Strategic Housing Market Assessment
Sevenoaks & Tunbridge Wells Councils, Final Report, September 2015
GL Hearn Page 180 of 185
S:\SDC\Planning & Transportation\Planning Policy\Evidence Base\SHMA 2015\SHMA FINAL REPORT SEPTEMBER 2015\SHMA final September 2015.docx
Extra Care Housing
12. Extra Care Housing is designed with the needs of frailer older people in mind and with varying levels of care and support available on site. Extra-care housing is sometimes called very sheltered housing.
Registered Care Provision
13. This is housing for people living in registered care homes which are managed and run by a care provider who is responsible for all aspects of their daily needs and wellbeing. Such housing is not self-contained and is often referred to as either residential or nursing care.
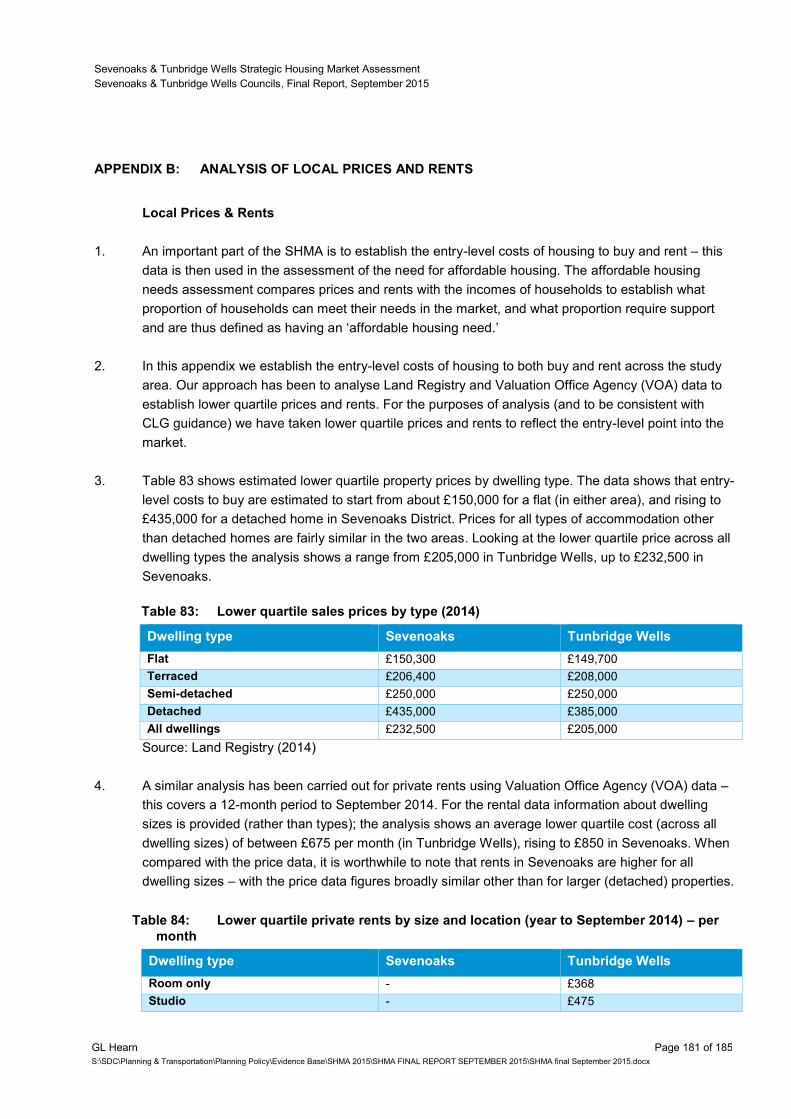
Sevenoaks & Tunbridge Wells Strategic Housing Market Assessment
Sevenoaks & Tunbridge Wells Councils, Final Report, September 2015
GL Hearn Page 181 of 185
S:\SDC\Planning & Transportation\Planning Policy\Evidence Base\SHMA 2015\SHMA FINAL REPORT SEPTEMBER 2015\SHMA final September 2015.docx
APPENDIX B: ANALYSIS OF LOCAL PRICES AND RENTS
Local Prices & Rents
1. An important part of the SHMA is to establish the entry-level costs of housing to buy and rent – this
data is then used in the assessment of the need for affordable housing. The affordable housing
needs assessment compares prices and rents with the incomes of households to establish what
proportion of households can meet their needs in the market, and what proportion require support
and are thus defined as having an ‘affordable housing need.’
2. In this appendix we establish the entry-level costs of housing to both buy and rent across the study
area. Our approach has been to analyse Land Registry and Valuation Office Agency (VOA) data to
establish lower quartile prices and rents. For the purposes of analysis (and to be consistent with
CLG guidance) we have taken lower quartile prices and rents to reflect the entry-level point into the
market.
3. Table 83 shows estimated lower quartile property prices by dwelling type. The data shows that entry-
level costs to buy are estimated to start from about £150,000 for a flat (in either area), and rising to
£435,000 for a detached home in Sevenoaks District. Prices for all types of accommodation other
than detached homes are fairly similar in the two areas. Looking at the lower quartile price across all
dwelling types the analysis shows a range from £205,000 in Tunbridge Wells, up to £232,500 in
Sevenoaks.
Table 83: Lower quartile sales prices by type (2014)
Dwelling type Sevenoaks Tunbridge Wells
Flat £150,300 £149,700
Terraced £206,400 £208,000
Semi-detached £250,000 £250,000
Detached £435,000 £385,000
All dwellings £232,500 £205,000
Source: Land Registry (2014)
4. A similar analysis has been carried out for private rents using Valuation Office Agency (VOA) data –
this covers a 12-month period to September 2014. For the rental data information about dwelling
sizes is provided (rather than types); the analysis shows an average lower quartile cost (across all
dwelling sizes) of between £675 per month (in Tunbridge Wells), rising to £850 in Sevenoaks. When
compared with the price data, it is worthwhile to note that rents in Sevenoaks are higher for all
dwelling sizes – with the price data figures broadly similar other than for larger (detached) properties.
Table 84: Lower quartile private rents by size and location (year to September 2014) – per
month
Dwelling type Sevenoaks Tunbridge Wells
Room only - £368
Studio - £475
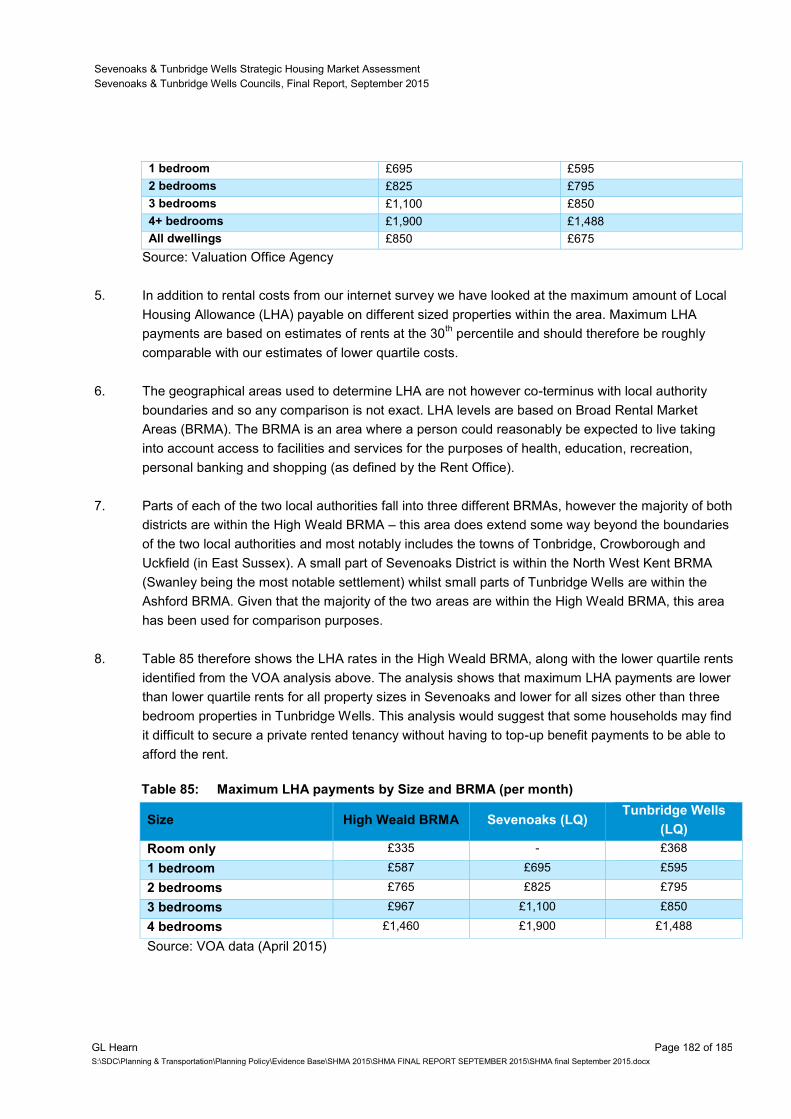
Sevenoaks & Tunbridge Wells Strategic Housing Market Assessment
Sevenoaks & Tunbridge Wells Councils, Final Report, September 2015
GL Hearn Page 182 of 185
S:\SDC\Planning & Transportation\Planning Policy\Evidence Base\SHMA 2015\SHMA FINAL REPORT SEPTEMBER 2015\SHMA final September 2015.docx
1 bedroom £695 £595
2 bedrooms £825 £795
3 bedrooms £1,100 £850
4+ bedrooms £1,900 £1,488
All dwellings £850 £675
Source: Valuation Office Agency
5. In addition to rental costs from our internet survey we have looked at the maximum amount of Local
Housing Allowance (LHA) payable on different sized properties within the area. Maximum LHA
payments are based on estimates of rents at the 30th percentile and should therefore be roughly
comparable with our estimates of lower quartile costs.
6. The geographical areas used to determine LHA are not however co-terminus with local authority
boundaries and so any comparison is not exact. LHA levels are based on Broad Rental Market
Areas (BRMA). The BRMA is an area where a person could reasonably be expected to live taking
into account access to facilities and services for the purposes of health, education, recreation,
personal banking and shopping (as defined by the Rent Office).
7. Parts of each of the two local authorities fall into three different BRMAs, however the majority of both
districts are within the High Weald BRMA – this area does extend some way beyond the boundaries
of the two local authorities and most notably includes the towns of Tonbridge, Crowborough and
Uckfield (in East Sussex). A small part of Sevenoaks District is within the North West Kent BRMA
(Swanley being the most notable settlement) whilst small parts of Tunbridge Wells are within the
Ashford BRMA. Given that the majority of the two areas are within the High Weald BRMA, this area
has been used for comparison purposes.
8. Table 85 therefore shows the LHA rates in the High Weald BRMA, along with the lower quartile rents
identified from the VOA analysis above. The analysis shows that maximum LHA payments are lower
than lower quartile rents for all property sizes in Sevenoaks and lower for all sizes other than three
bedroom properties in Tunbridge Wells. This analysis would suggest that some households may find
it difficult to secure a private rented tenancy without having to top-up benefit payments to be able to
afford the rent.
Table 85: Maximum LHA payments by Size and BRMA (per month)
Size High Weald BRMA Sevenoaks (LQ) Tunbridge Wells
(LQ)
Room only £335 - £368
1 bedroom £587 £695 £595
2 bedrooms £765 £825 £795
3 bedrooms £967 £1,100 £850
4 bedrooms £1,460 £1,900 £1,488
Source: VOA data (April 2015)
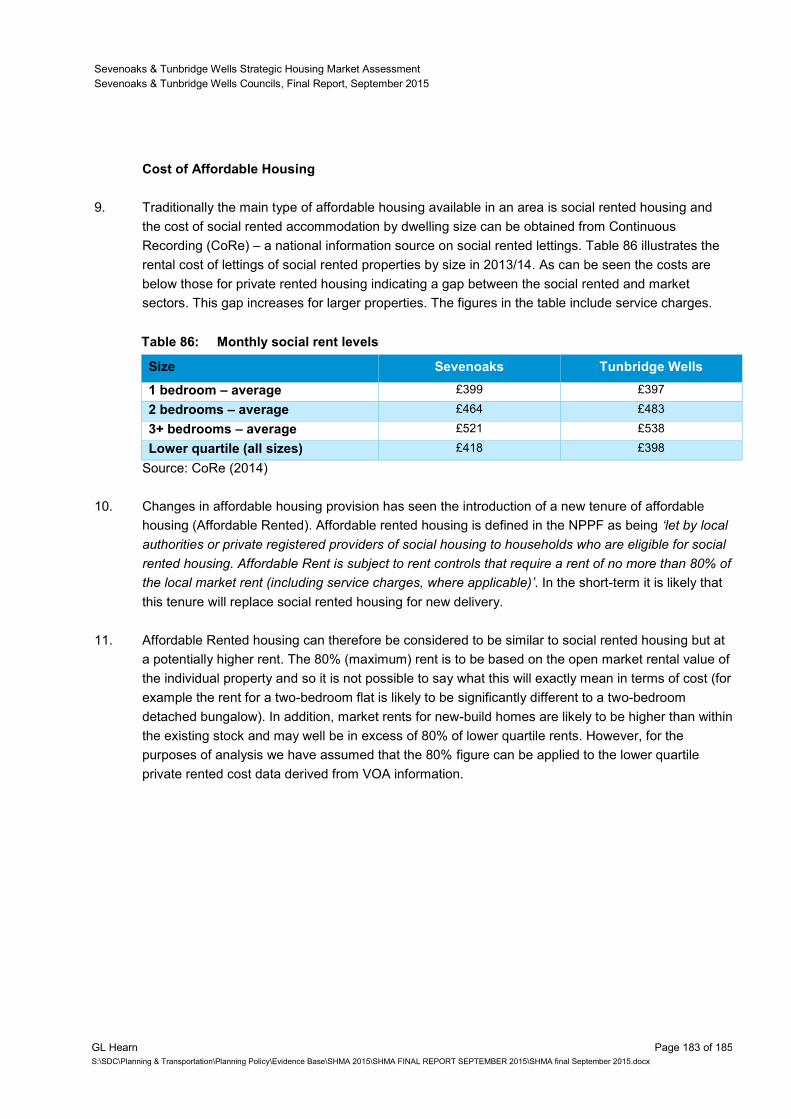
Sevenoaks & Tunbridge Wells Strategic Housing Market Assessment
Sevenoaks & Tunbridge Wells Councils, Final Report, September 2015
GL Hearn Page 183 of 185
S:\SDC\Planning & Transportation\Planning Policy\Evidence Base\SHMA 2015\SHMA FINAL REPORT SEPTEMBER 2015\SHMA final September 2015.docx
Cost of Affordable Housing
9. Traditionally the main type of affordable housing available in an area is social rented housing and
the cost of social rented accommodation by dwelling size can be obtained from Continuous
Recording (CoRe) – a national information source on social rented lettings. Table 86 illustrates the
rental cost of lettings of social rented properties by size in 2013/14. As can be seen the costs are
below those for private rented housing indicating a gap between the social rented and market
sectors. This gap increases for larger properties. The figures in the table include service charges.
Table 86: Monthly social rent levels
Size Sevenoaks Tunbridge Wells
1 bedroom – average £399 £397
2 bedrooms – average £464 £483
3+ bedrooms – average £521 £538
Lower quartile (all sizes) £418 £398
Source: CoRe (2014)
10. Changes in affordable housing provision has seen the introduction of a new tenure of affordable
housing (Affordable Rented). Affordable rented housing is defined in the NPPF as being ‘let by local
authorities or private registered providers of social housing to households who are eligible for social
rented housing. Affordable Rent is subject to rent controls that require a rent of no more than 80% of
the local market rent (including service charges, where applicable)’. In the short-term it is likely that
this tenure will replace social rented housing for new delivery.
11. Affordable Rented housing can therefore be considered to be similar to social rented housing but at
a potentially higher rent. The 80% (maximum) rent is to be based on the open market rental value of
the individual property and so it is not possible to say what this will exactly mean in terms of cost (for
example the rent for a two-bedroom flat is likely to be significantly different to a two-bedroom
detached bungalow). In addition, market rents for new-build homes are likely to be higher than within
the existing stock and may well be in excess of 80% of lower quartile rents. However, for the
purposes of analysis we have assumed that the 80% figure can be applied to the lower quartile
private rented cost data derived from VOA information.
Sevenoaks & Tunbridge Wells Strategic Housing Market Assessment
Sevenoaks & Tunbridge Wells Councils, Final Report, September 2015
GL Hearn Page 184 of 185
S:\SDC\Planning & Transportation\Planning Policy\Evidence Base\SHMA 2015\SHMA FINAL REPORT SEPTEMBER 2015\SHMA final September 2015.docx
APPENDIX C: EXTENDING PROJECTIONS TO 2035
1. The projections run in this report are summarised below:
SNPP – based on the 2012-based subnational population projections (SNPP) with an update
to include 2013 ONS mid-year population data (MYE). Household formation/headship rates
based on 2012-based CLG household projections (SNHP)
London Adjustment – the same assumptions as SNPP but with an uplift to population growth
post-2017 to take account of post-recession changes in migration patterns to/from London
10-year Migration Trends – a demographic projection based on levels of migration over the
past ten years (2003-13). Household formation/headship rates based on 2012-based SNHP
UPC Adjustment – a demographic projection linked to the SNPP but with an adjustment to
take account of Unattributable Population Change (UPC) within ONS components of change
data (headship again from the SNHP)
2013 EEFM – projection linked to estimates of population growth required to meet the job
growth forecasts in the 2013 East of England Forecasting Model (EEFM) - headship again from
the SNHP
2014 EEFM – projection linked to estimates of population growth required to meet the job
growth forecasts in the 2014 EEFM - headship again from the SNHP
SNPP with Affordability Adjustment – the same projection as SNPP but with an uplift to the
household formation/headship rates for people aged 25-34.
2014 EEFM with Affordability Adjustment – the same projection as 2014 EEFM but with an
uplift to the household formation/headship rates for people aged 25-34. This projection has
only been run for Sevenoaks.
London Adjustment with Affordability Adjustment – the same projection as London
adjustment but with an uplift to the household formation/headship rates for people aged 25-34.
This projection has only been run for Tunbridge Wells
2. The tables overleaf provide estimates of the housing need set against the range of projections set
out in the report. The figures in the tables below provide the overall need and annualised figures. As
well as the core projection period of 2013-33, the analysis has been expanded to provide outputs for
the 2013-35 period.
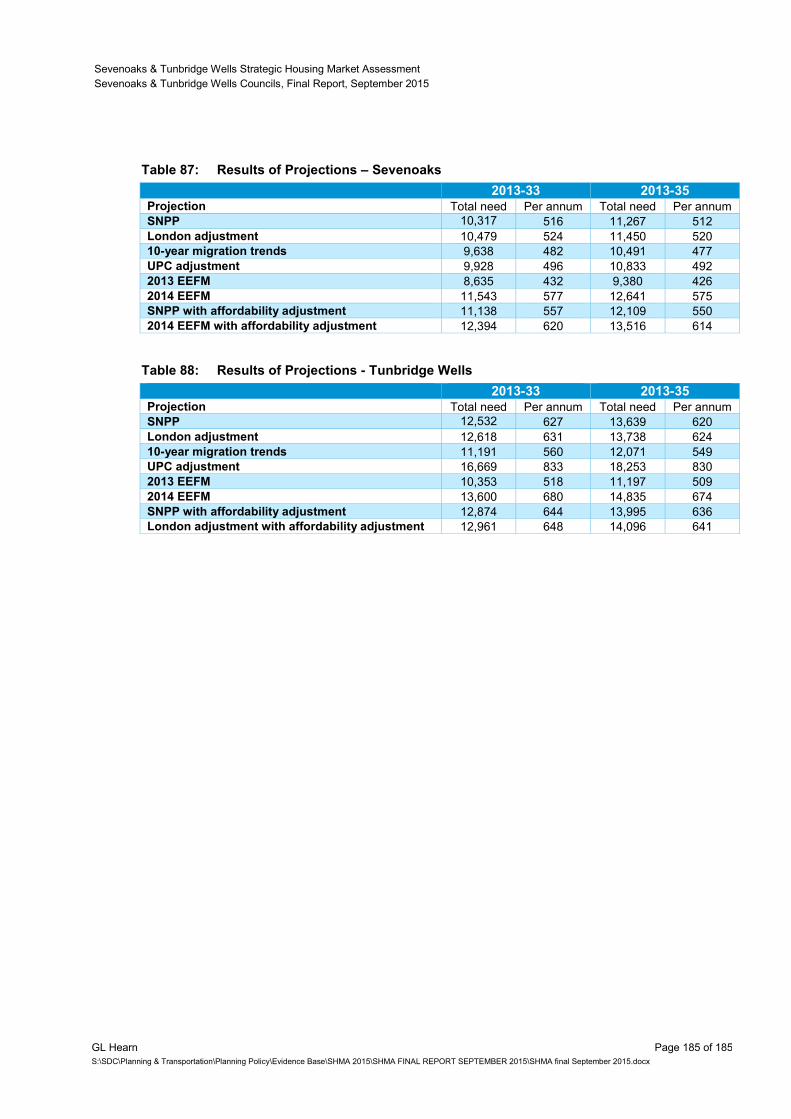
Sevenoaks & Tunbridge Wells Strategic Housing Market Assessment
Sevenoaks & Tunbridge Wells Councils, Final Report, September 2015
GL Hearn Page 185 of 185
S:\SDC\Planning & Transportation\Planning Policy\Evidence Base\SHMA 2015\SHMA FINAL REPORT SEPTEMBER 2015\SHMA final September 2015.docx
Table 87: Results of Projections – Sevenoaks
2013-33 2013-35 Projection Total need Per annum Total need Per annum
SNPP 10,317 516 11,267 512
London adjustment 10,479 524 11,450 520
10-year migration trends 9,638 482 10,491 477
UPC adjustment 9,928 496 10,833 492
2013 EEFM 8,635 432 9,380 426
2014 EEFM 11,543 577 12,641 575
SNPP with affordability adjustment 11,138 557 12,109 550
2014 EEFM with affordability adjustment 12,394 620 13,516 614
Table 88: Results of Projections - Tunbridge Wells
2013-33 2013-35 Projection Total need Per annum Total need Per annum
SNPP 12,532 627 13,639 620
London adjustment 12,618 631 13,738 624
10-year migration trends 11,191 560 12,071 549
UPC adjustment 16,669 833 18,253 830
2013 EEFM 10,353 518 11,197 509
2014 EEFM 13,600 680 14,835 674
SNPP with affordability adjustment 12,874 644 13,995 636
London adjustment with affordability adjustment 12,961 648 14,096 641