Embed Size (px)
Citation preview
Kim B. Blair PHD Vice President
[email protected] 8.5536+1 781.53
Cycling
Aerodynamics
Clearing the air
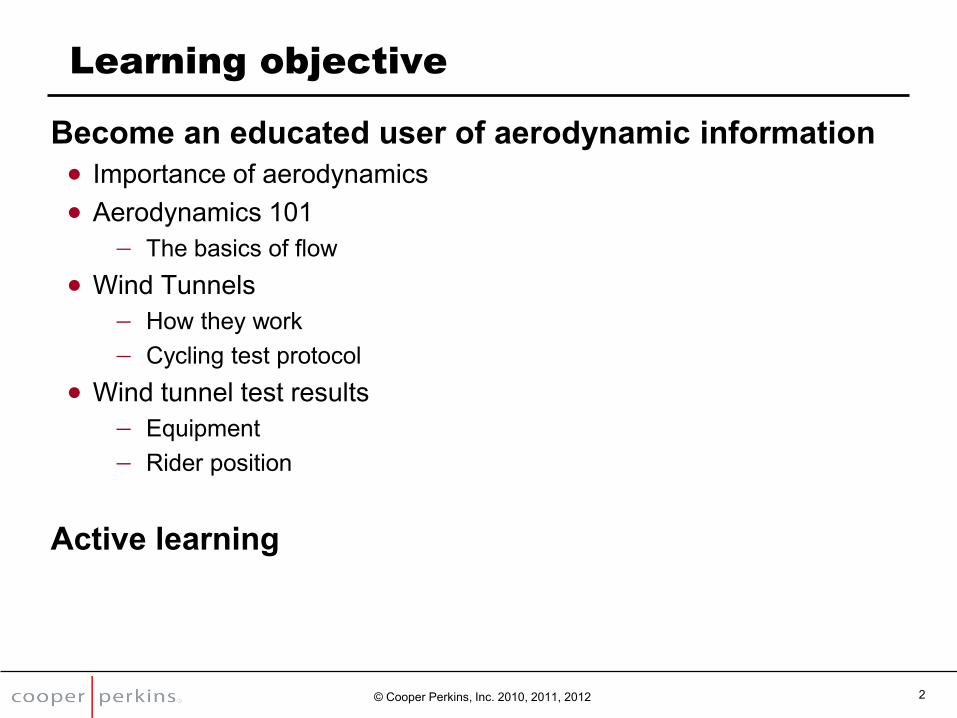
Learning objective
Become an educated user of aerodynamic information Importance of aerodynamics Aerodynamics 101
The basics of flow Wind Tunnels
How they work Cycling test protocol
Wind tunnel test results Equipment Rider position
Active learning
© Cooper Perkins, Inc. 2010, 2011, 2012 2
3 © Cooper Perkins, Inc. 2010, 2011, 2012
Quiz #1 – Energy cost of drag
Estimate the percentage of the cyclist’s energy used to overcome the air resistance at racing speed (48 kph or 30 mph). Assume the wind isn’t blowing.
0 – 25%
26 – 50%
51 – 75%
76 – 100% Viktor Rapinski, Team Saturn
Quiz #1 – Energy cost of drag
0 – 25%
26 – 50% 51 – 75%
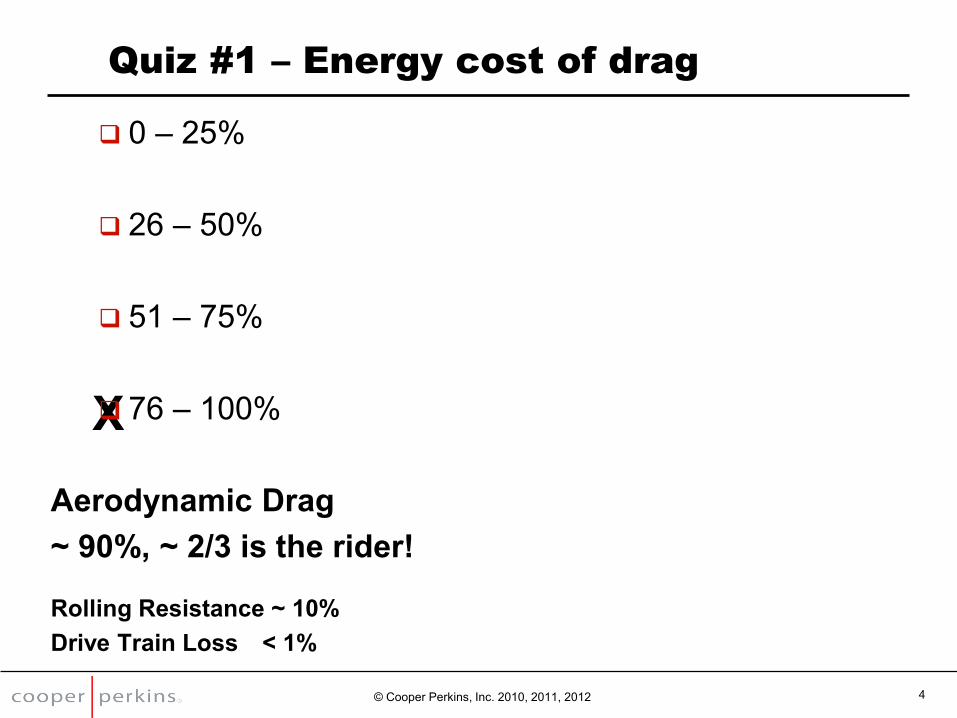
X 76 – 100%
Aerodynamic Drag Viktor Rapinski, Team Saturn
~ 90%, ~ 2/3 is the rider!
Rolling Resistance ~ 10% Drive Train Loss < 1%
© Cooper Perkins, Inc. 2010, 2011, 2012 4
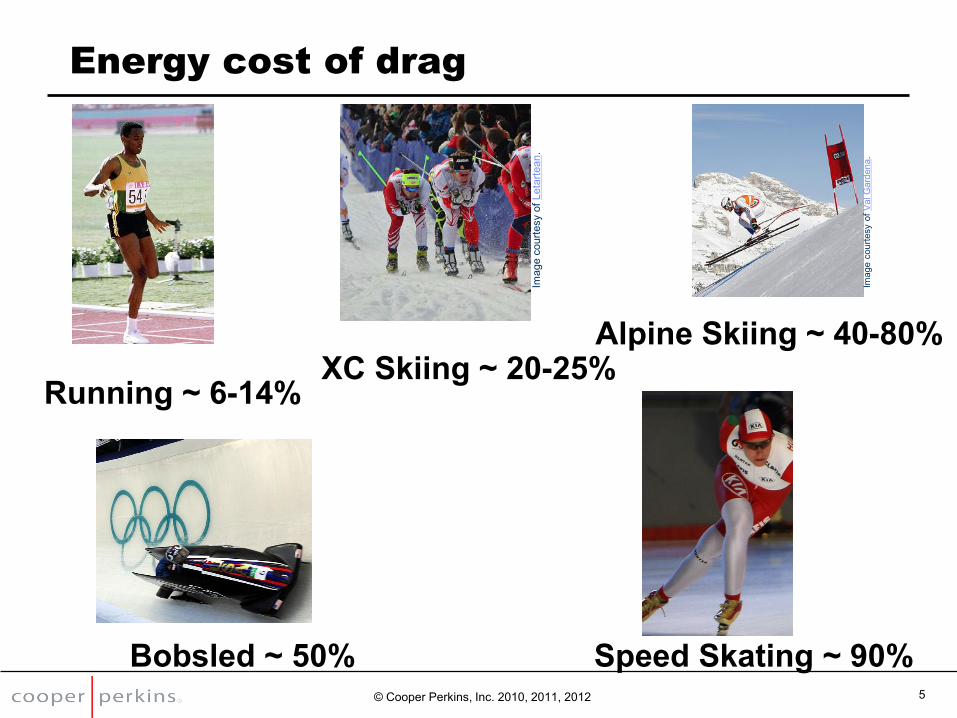
Energy cost of drag
Alpine Skiing ~ 40-80%XC Skiing ~ 20-25%
Running ~ 6-14%
Bobsled ~ 50% Speed Skating ~ 90% © Cooper Perkins, Inc. 2010, 2011, 2012 5
Imag
e co
urte
sy o
f Let
arte
an.
Imag
e co
urte
sy o
f Val
Gar
dena
.
6 © Cooper Perkins, Inc. 2010, 2011, 2012
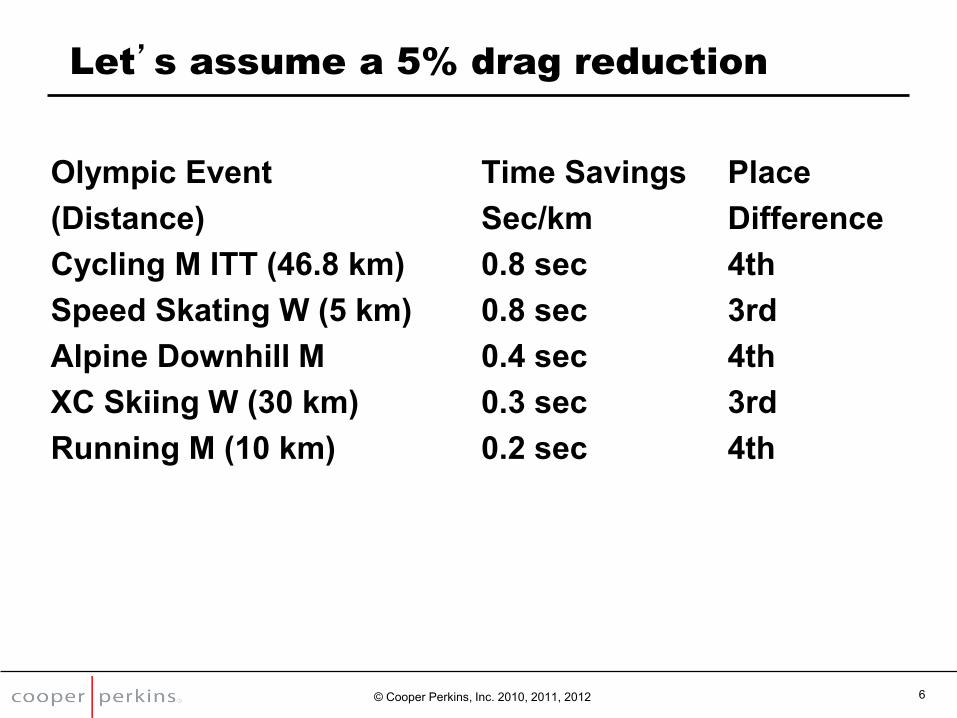
Let’s assume a 5% drag reduction
Olympic Event Time Savings Place (Distance) Sec/km Difference Cycling M ITT (46.8 km) 0.8 sec 4th Speed Skating W (5 km) 0.8 sec 3rd Alpine Downhill M 0.4 sec 4th XC Skiing W (30 km) 0.3 sec 3rd Running M (10 km) 0.2 sec 4th
Aerodynamics 101
The basics of flow
Kim B. Blair PHD Vice President
[email protected] +1 781.538.5536
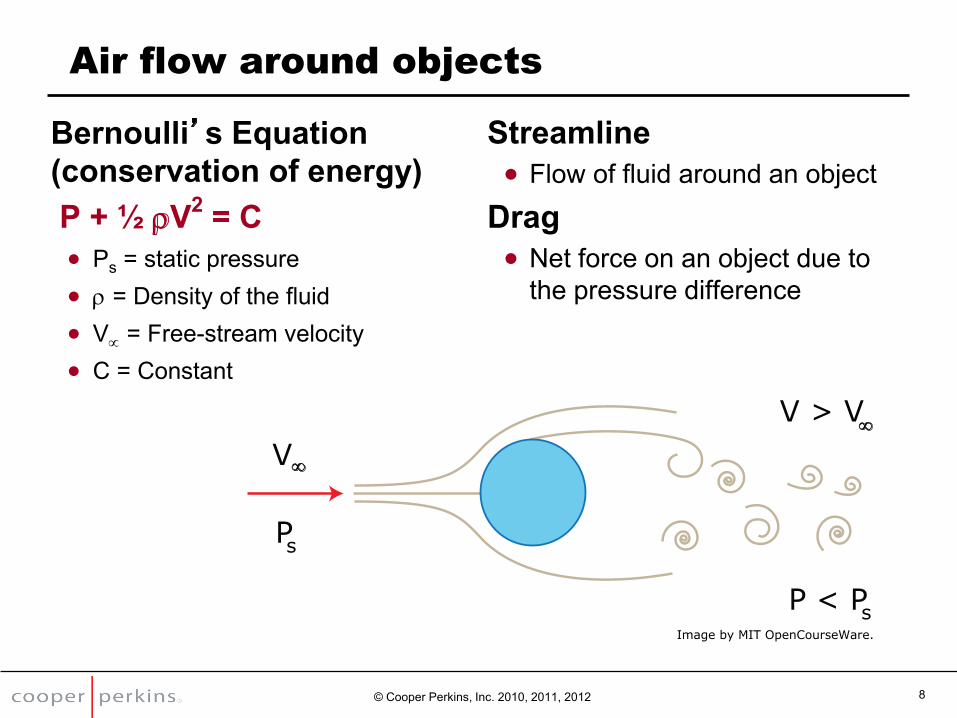
Air flow around objects
Bernoulli’
© Cooper Perkins, Inc. 2010, 2011, 2012 8
s Equation (conservation of energy)P + ½ rV2 = C Ps = static pressure r = Density of the fluid V = Free-stream velocity C = Constant
Streamline Flow of fluid around an object
Drag Net force on an object due to
the pressure difference
V∞
Ps
V > V∞
P < Ps Image by MIT OpenCourseWare.
9 © Cooper Perkins, Inc. 2010, 2011, 2012
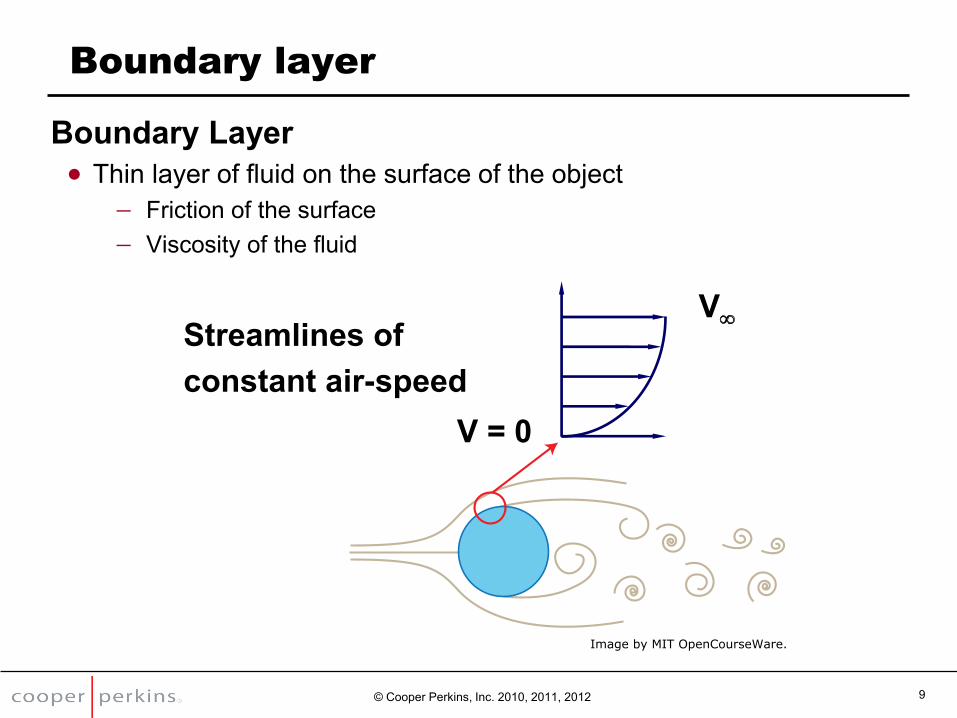
Boundary layer
Boundary Layer Thin layer of fluid on the surface of the object
Friction of the surface Viscosity of the fluid
V
V = 0
Streamlines of constant air-speed
Image by MIT OpenCourseWare.
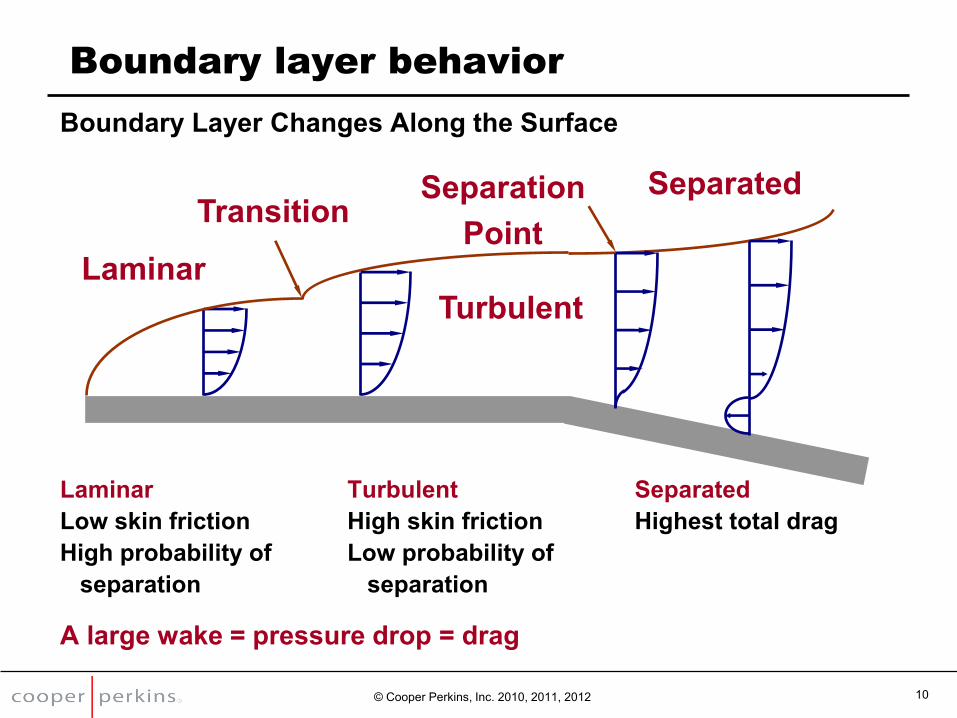
Boundary layer behavior
Boundary Layer Changes Along the Surface
Laminar Turbulent Separated Low skin friction High skin friction Highest total drag High probability of Low probability of separation separation
A large wake = pressure drop = drag
© Cooper Perkins, Inc. 2010, 2011, 2012 10
Transition
Laminar Turbulent
Separated Separation Point
11 © Cooper Perkins, Inc. 2010, 2011, 2012
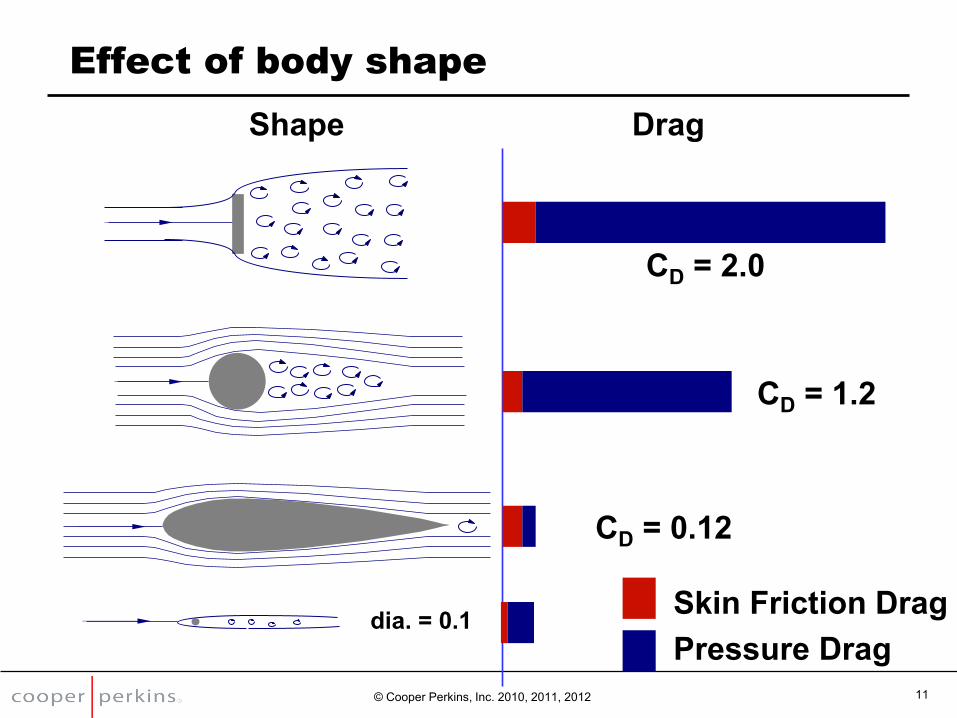
Effect of body shape
Shape Drag
Skin Friction Drag Pressure Drag
CD = 2.0
CD = 1.2
CD = 0.12
dia. = 0.1
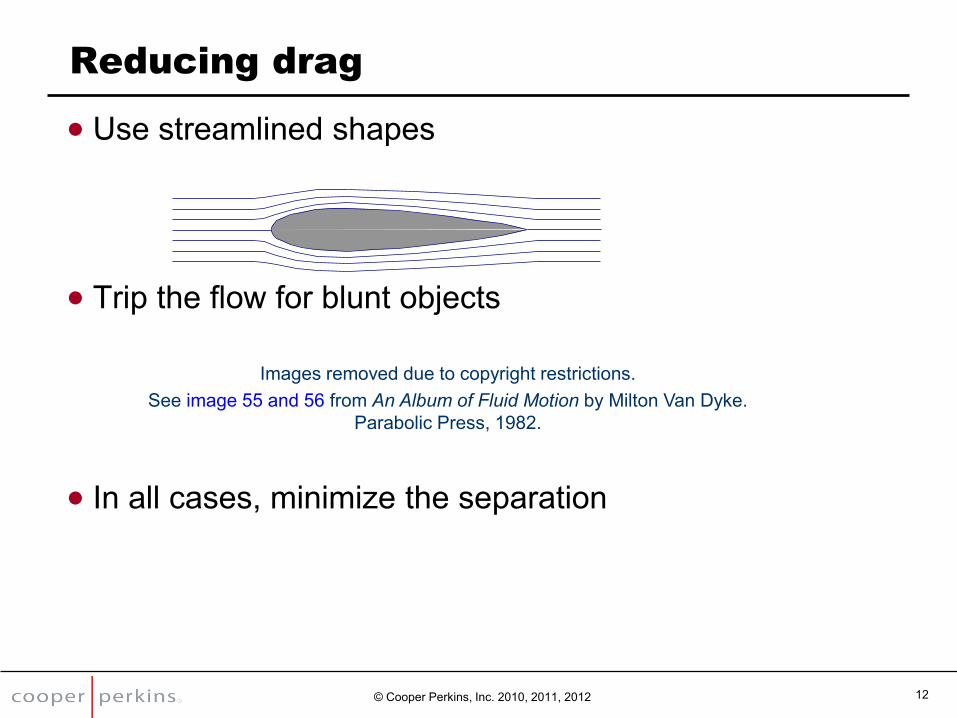
Reducing drag
Use streamlined shapes
Trip the flow for blunt objects
In all cases, minimize the separation
© Cooper Perkins, Inc. 2010, 2011, 2012 12
Images removed due to copyright restrictions. See image 55 and 56 from An Album of Fluid Motion by Milton Van Dyke.
Parabolic Press, 1982.
13 © Cooper Perkins, Inc. 2010, 2011, 2012
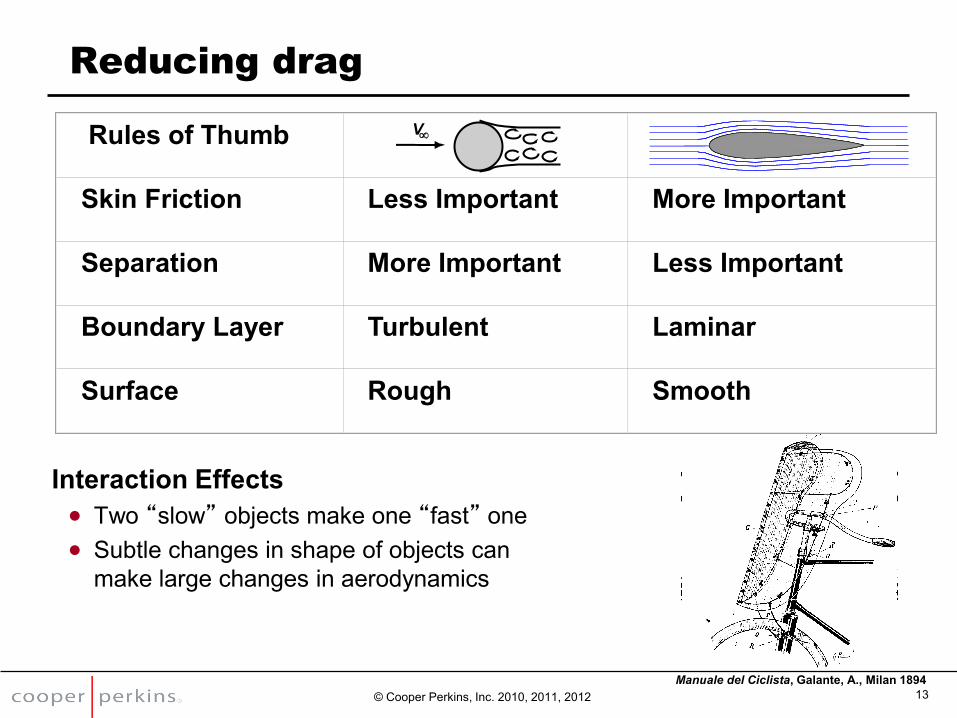
Reducing drag
Interaction Effects Two “slow” objects make one “fast” one Subtle changes in shape of objects can
make large changes in aerodynamics
Rules of Thumb
Skin Friction Less Important More Important
Separation More Important Less Important
Boundary Layer Turbulent Laminar
Surface Rough Smooth
Manuale del Ciclista, Galante, A., Milan 1894
V
15 © Cooper Perkins, Inc. 2010, 2011, 2012
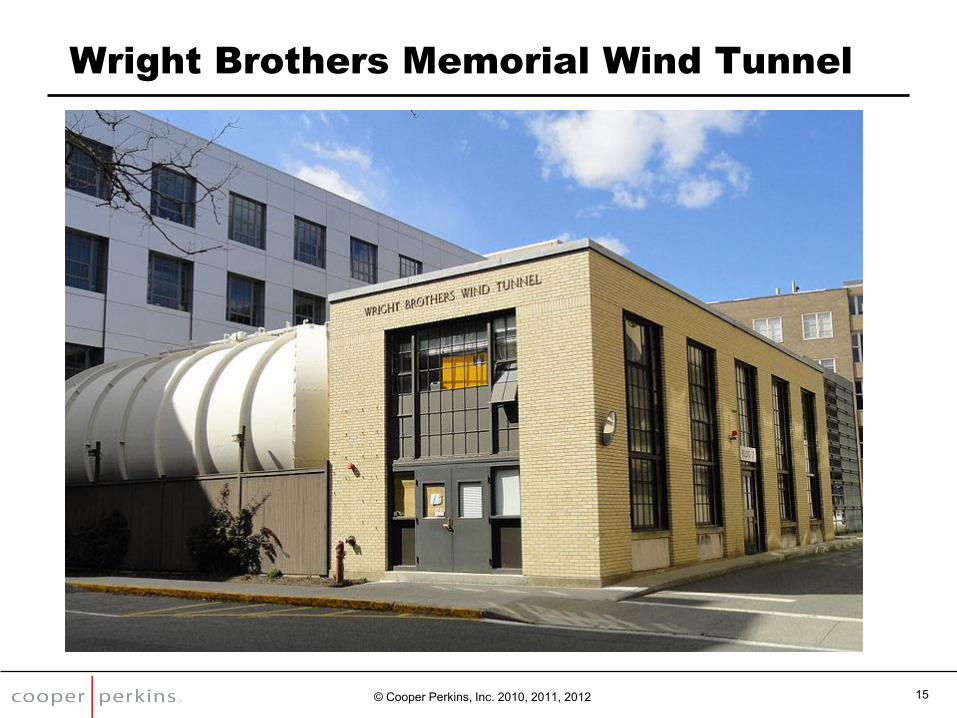
Wright Brothers Memorial Wind Tunnel
© Cooper Perkins, Inc. 2010, 2011, 2012 16
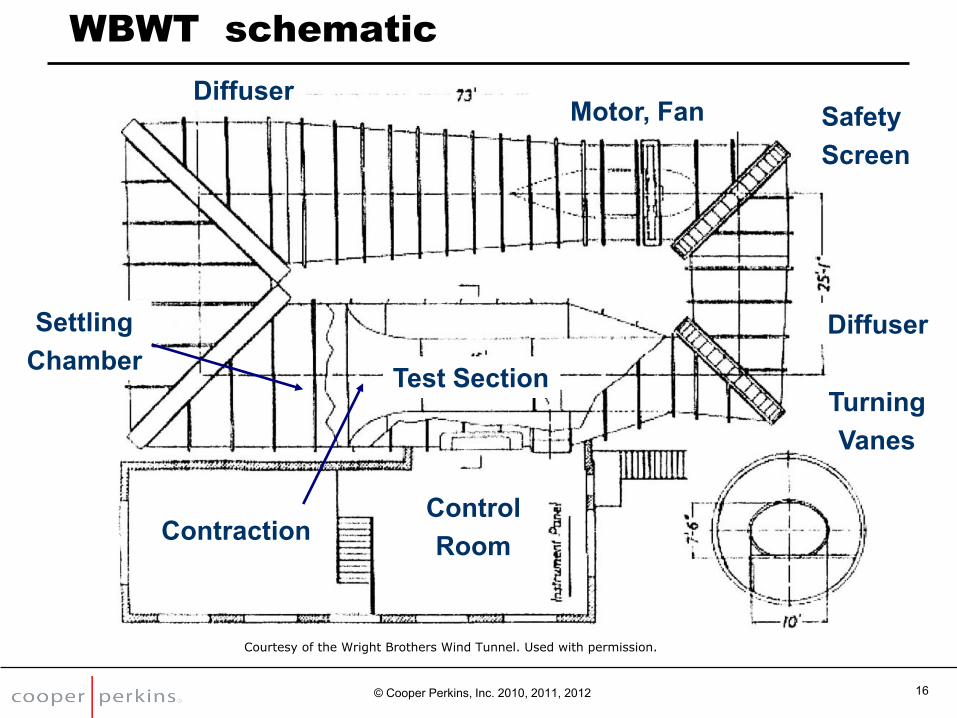
WBWT schematic
Test Section
Control Room
Turning Vanes
Diffuser
Safety Screen
Diffuser
Contraction
Settling Chamber
Motor, Fan
Courtesy of the Wright Brothers Wind Tunnel. Used with permission.
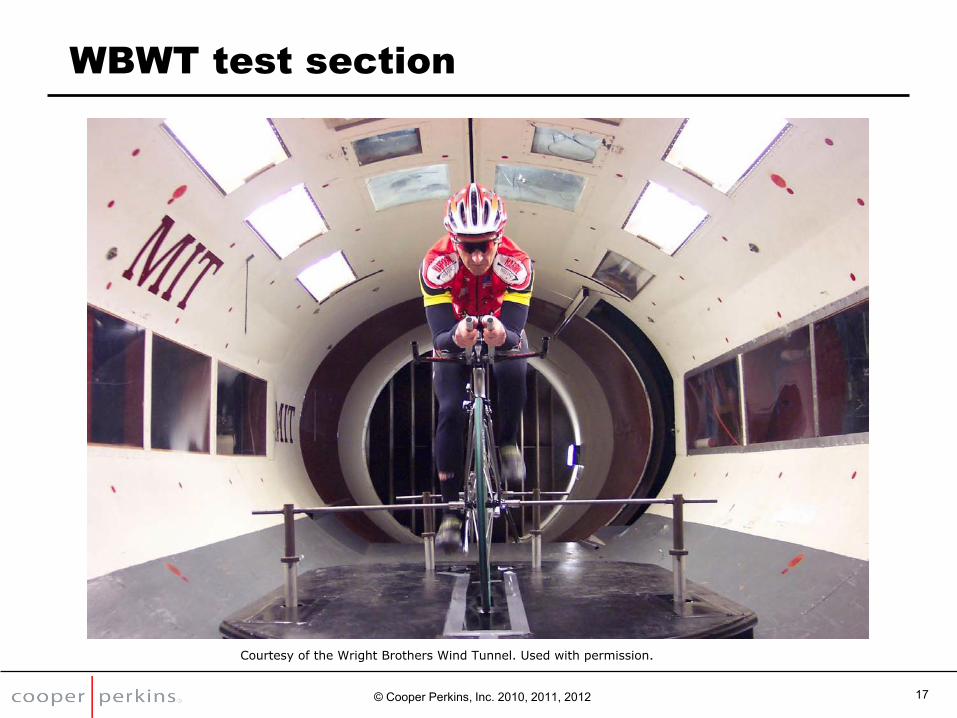
WBWT test section
© Cooper Perkins, Inc. 2010, 2011, 2012 17
Courtesy of the Wright Brothers Wind Tunnel. Used with permission.
18 © Cooper Perkins, Inc. 2010, 2011, 2012
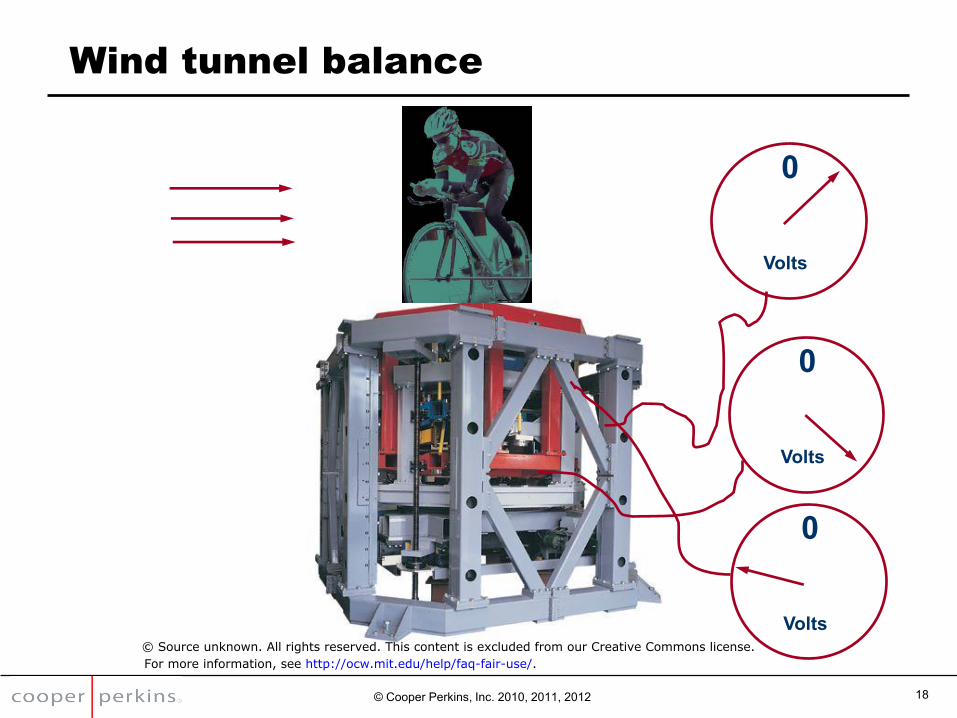
Wind tunnel balance
Volts
0
Volts
0
Volts
0
© Source unknown. All rights reserved. This content is excluded from our Creative Commons license.For more information, see http://ocw.mit.edu/help/faq-fair-use/.
Mounting the bike
Requirements Safety
Ease of rider access Interface to the balance
No other contacts Interface to the bike
Changes in bike alignment = changes in data Minimize airflow interference
Interaction of mount and bike Yaw capability
Crosswind study Ground plane
Avoid boundary layer build-up
© Cooper Perkins, Inc. 2010, 2011, 2012 19
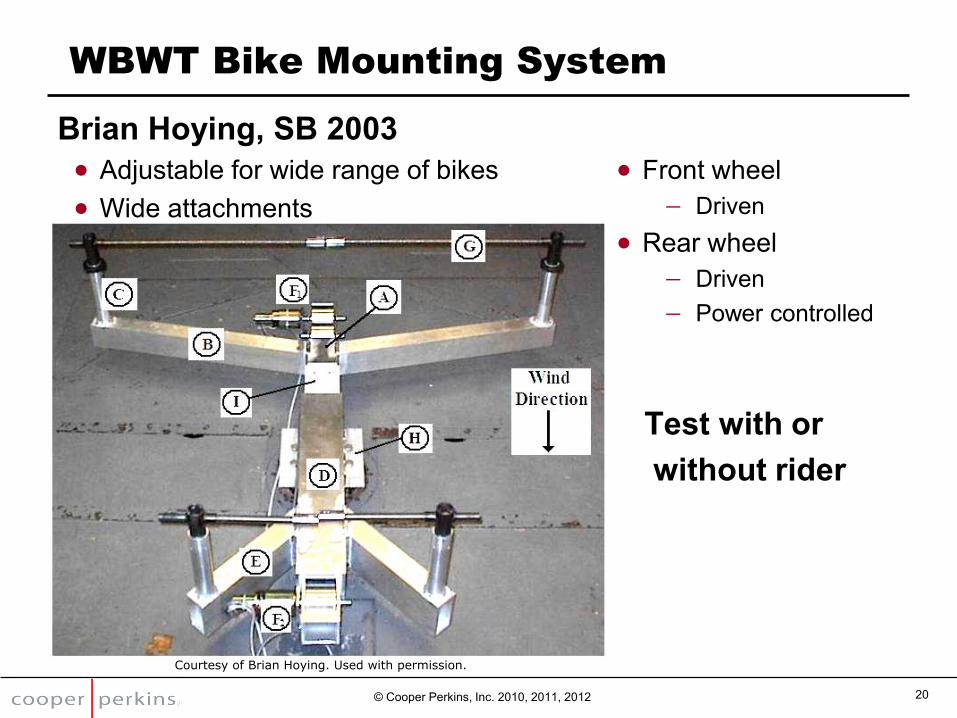
WBWT Bike Mounting System
Brian Hoying, SB 2003 Adjustable for wide range of bikes Front wheel Wide attachments Driven
Rear wheel Driven Power controlled
Test with or without rider
© Cooper Perkins, Inc. 2010, 2011, 2012 20
Courtesy of Brian Hoying. Used with permission.
21 © Cooper Perkins, Inc. 2010, 2011, 2012
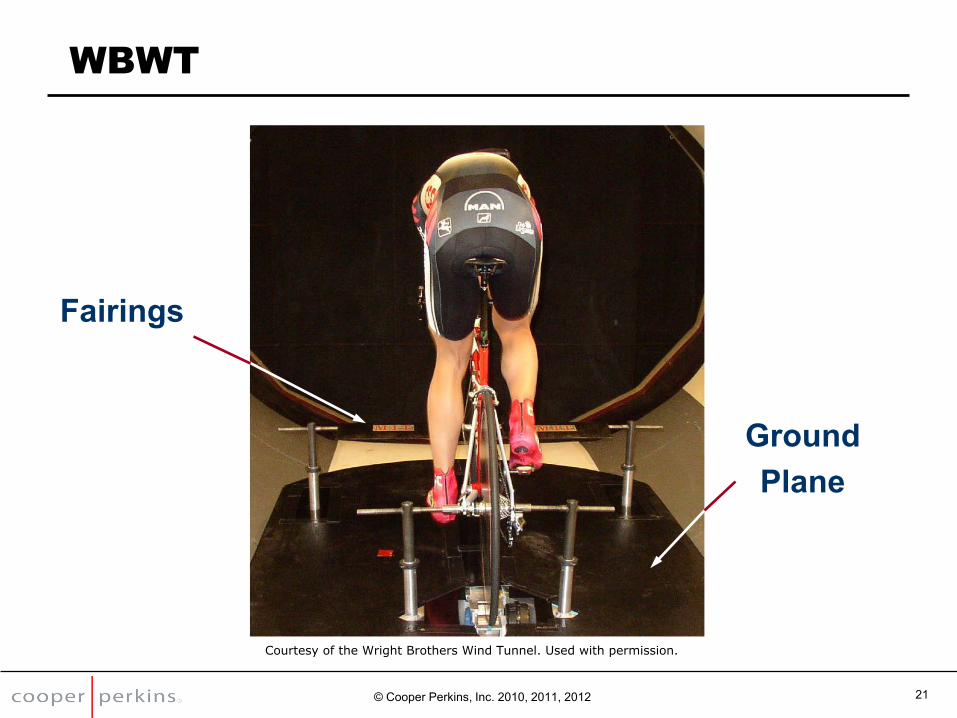
WBWT
Fairings
Ground Plane
Courtesy of the Wright Brothers Wind Tunnel. Used with permission.
The most important slides today!!!
Wind direction How fast do you ride a 40K on a windless flat course? How fast do you ride a 40K with a tailwind? How fast do you ride with a crosswind?
Conclusions?
© Cooper Perkins, Inc. 2010, 2011, 2012 22
23 © Cooper Perkins, Inc. 2010, 2011, 2012
The most important slides today!!!
Wind direction How fast do you ride a 40K on a windless flat course? How fast do you ride a 40K with a tailwind? How fast do you ride with a crosswind?
Conclusions? YOU (almost) ALWAYS “SEE” A HEADWIND
Apparent wind
24 © Cooper Perkins, Inc. 2010, 2011, 2012
The most important slides today!!!
Wind direction How fast do you ride a 40K on a windless flat course? How fast do you ride a 40K with a tailwind? How fast do you ride with a crosswind?
Conclusions? YOU (almost) ALWAYS “SEE” A HEADWIND
Apparent wind
YOUR ENERGY GOES INTO OVERCOMING THE APPARENT WIND
The wind the bicycle sees
The most important slides today!!!
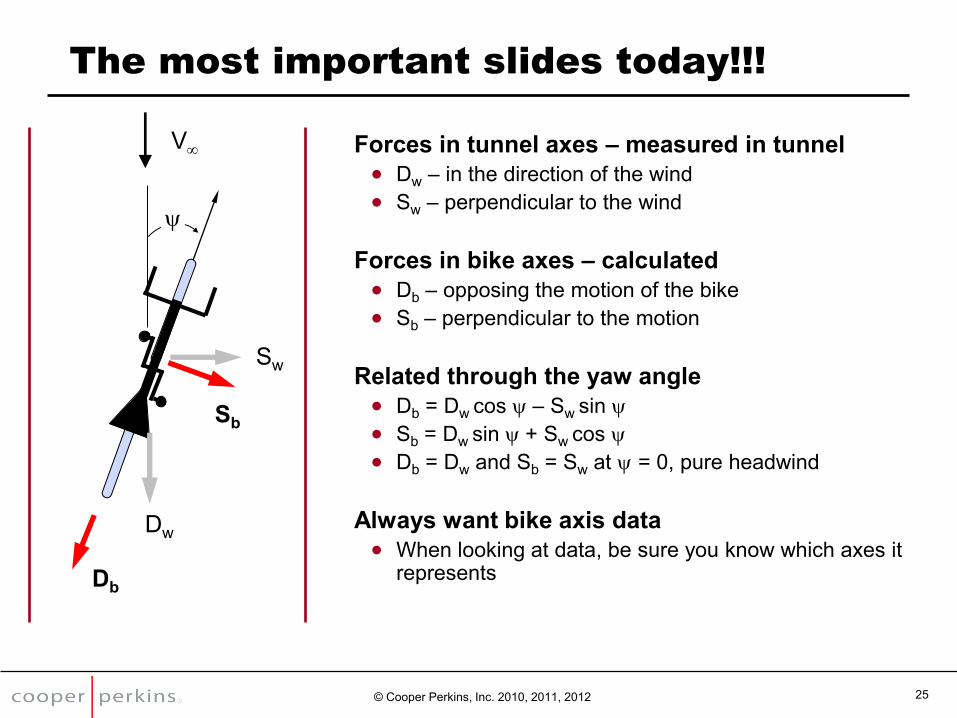
Forces in tunnel axes – measured in tunnel Dw – in the direction of the wind Sw – perpendicular to the wind
Forces in bike axes – calculated
Db – opposing the motion of the bike Sb – perpendicular to the motion
Related through the yaw angle
Db = Dw cos y – Sw sin y
S cos yw y b = D sin + Sw Db = Dw and Sb = S at yw = 0, pure headwind
Always want bike axis data
When looking at data, be sure you know which axes it represents
© Cooper Perkins, Inc. 2010, 2011, 2012 25
V
y
Sb
Dw
Db
Sw
26 © Cooper Perkins, Inc. 2010, 2011, 2012
The most important slides today!!!
Example: Disc Wheel at yaw angle in tunnel The wind “sees” the projection of the wheel in the tunnel
Dw for disc >> Dw for spoke wheel
Db for disc << Db for spoke wheel
Which wheel will reduce your TT time?
27 © Cooper Perkins, Inc. 2010, 2011, 2012
Data acquisition
Data acquisition and calculations 1000 Hz sampling, average over 30 or 60 seconds
Average over pedaling cycle Instantly reduce data
Change test plan as data is collected Efficient use of tunnel time
Convert to standard conditions Small variations in wind speed, air temperature and humidity =
small changes in results We are measuring small changes
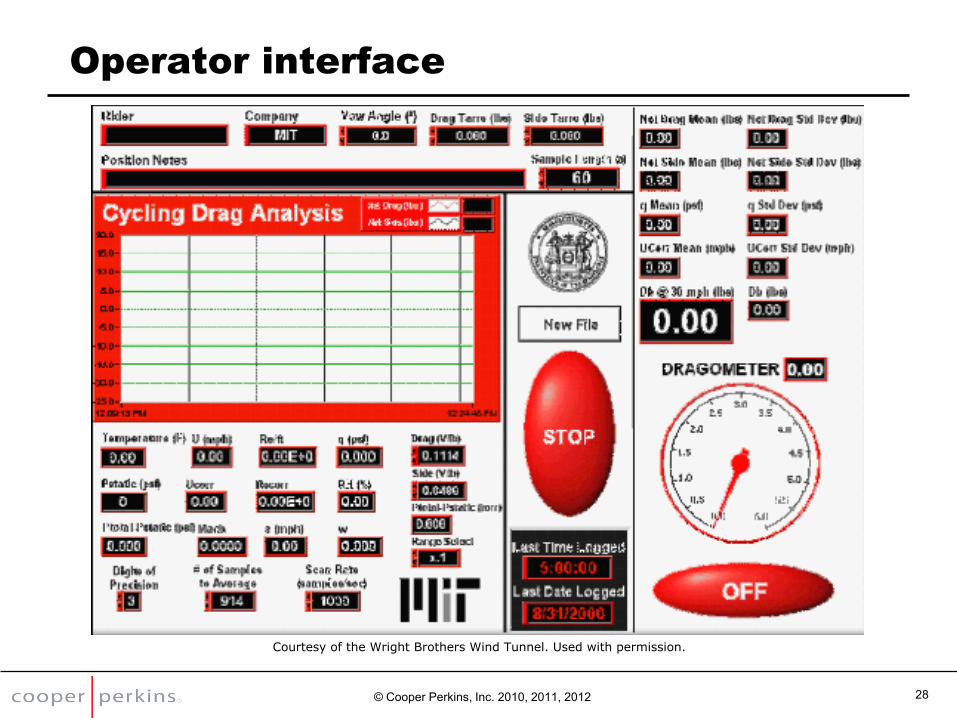
28 © Cooper Perkins, Inc. 2010, 2011, 2012
Operator interface
Courtesy of the Wright Brothers Wind Tunnel. Used with permission.
29 © Cooper Perkins, Inc. 2010, 2011, 2012
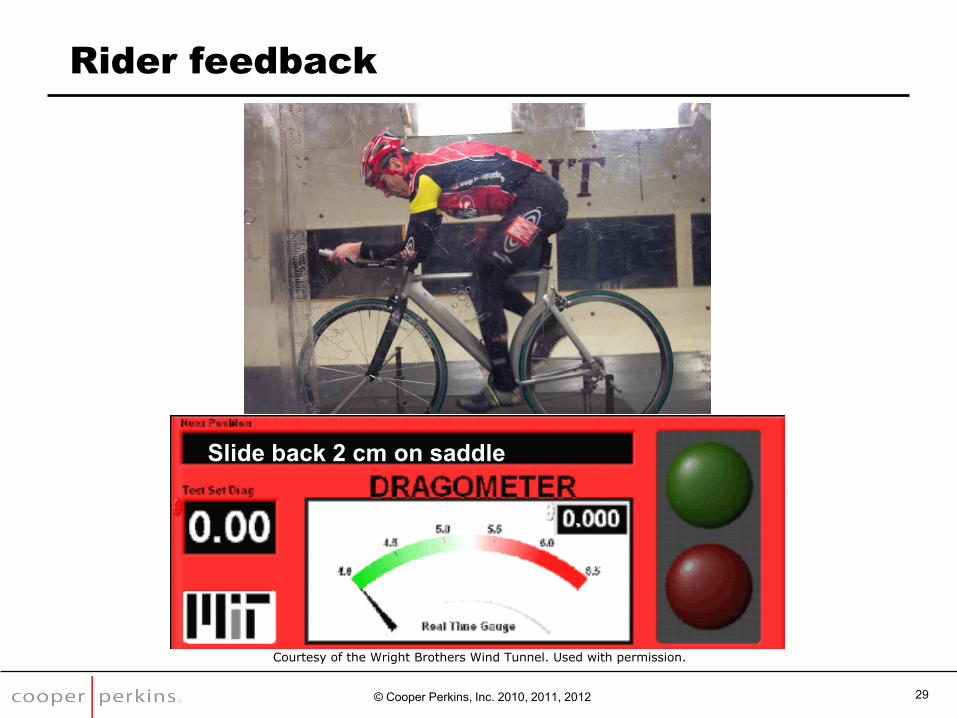
Rider feedback
Slide back 2 cm on saddle
Courtesy of the Wright Brothers Wind Tunnel. Used with permission.

A typical test
© Cooper Perkins, Inc. 2010, 2011, 2012 30
Courtesy of the Wright Brothers Wind Tunnel. Used with permission.
Wind Tunnel Test
Results
Equipment
Kim B. Blair PHD Vice President
[email protected] +1 781.538.5536
32 © Cooper Perkins, Inc. 2010, 2011, 2012
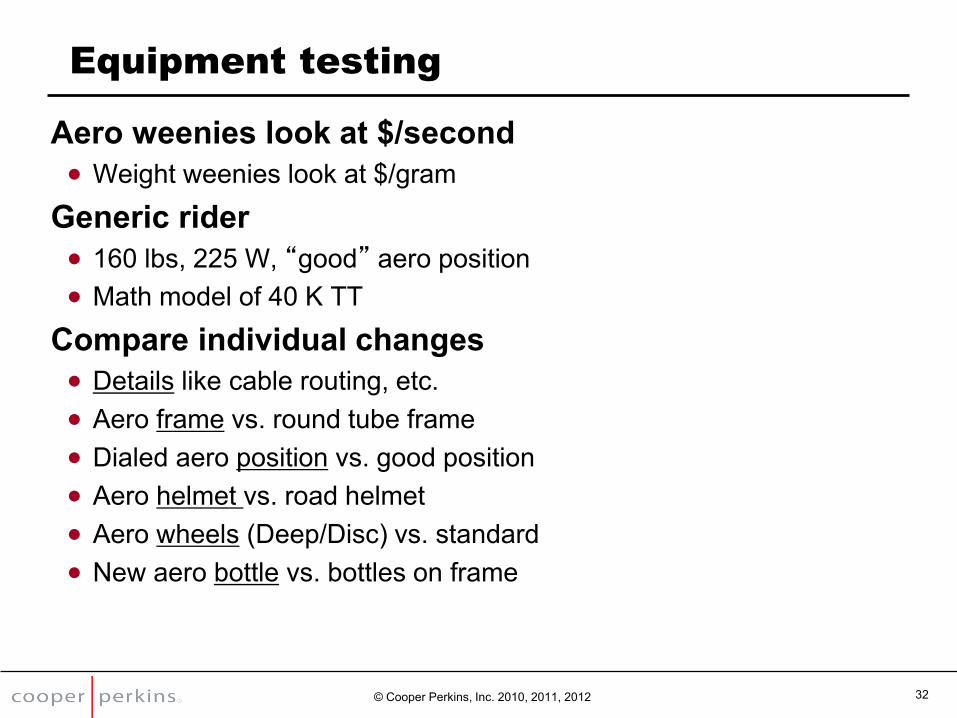
Equipment testing
Aero weenies look at $/second Weight weenies look at $/gram
Generic rider 160 lbs, 225 W, “good” aero position Math model of 40 K TT
Compare individual changes Details like cable routing, etc. Aero frame vs. round tube frame Dialed aero position vs. good position Aero helmet vs. road helmet Aero wheels (Deep/Disc) vs. standard New aero bottle vs. bottles on frame
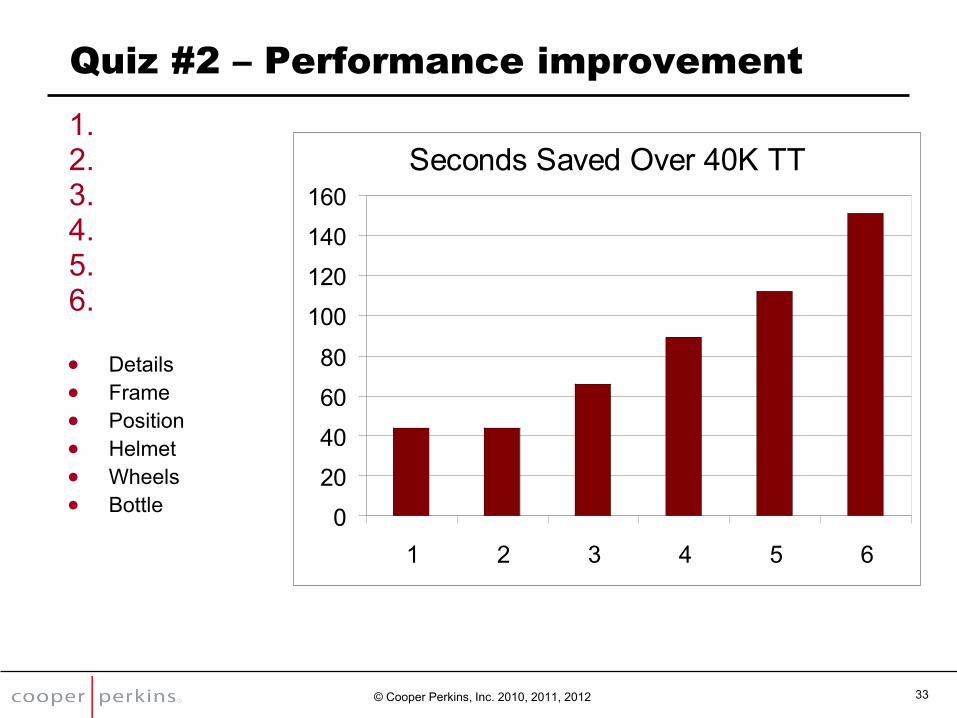
Quiz #2 – Performance improvement
1. 2. 3. 4. 5. 6.
Details Frame Position Helmet Wheels Bottle
© Cooper Perkins, Inc. 2010, 2011, 2012 33
Seconds Saved Over 40K TT
0
20
40
60
80
100
120
140
160
1 2 3 4 5 6
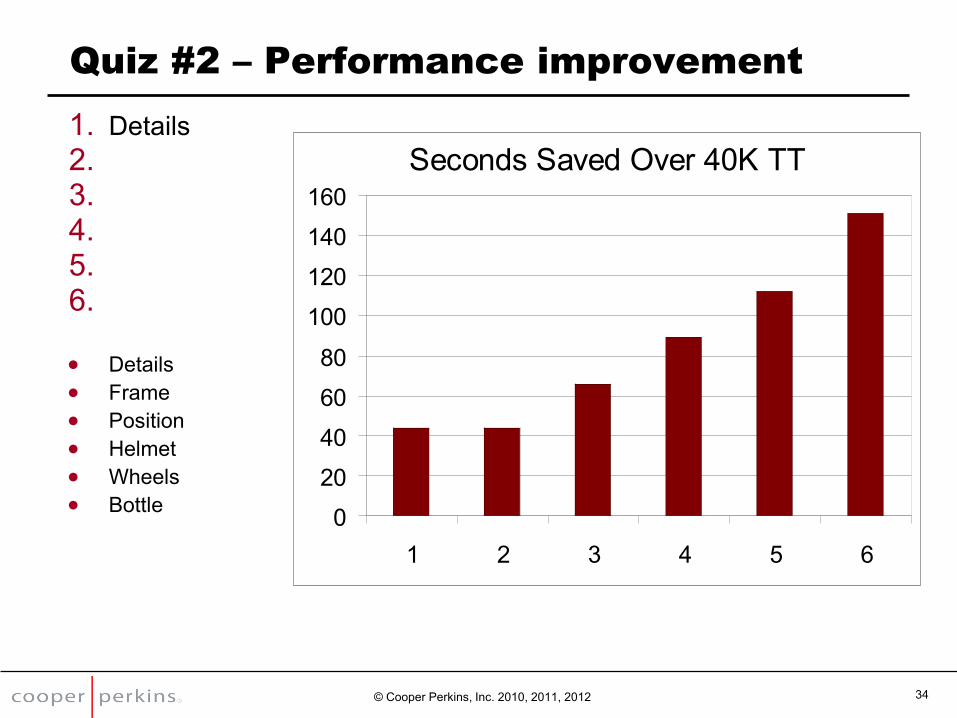
Quiz #2 – Performance improvement
1. Details 2. 3. 4. 5. 6.
Details Frame Position Helmet Wheels Bottle
© Cooper Perkins, Inc. 2010, 2011, 2012 34
Seconds Saved Over 40K TT
0
20
40
60
80
100
120
140
160
1 2 3 4 5 6
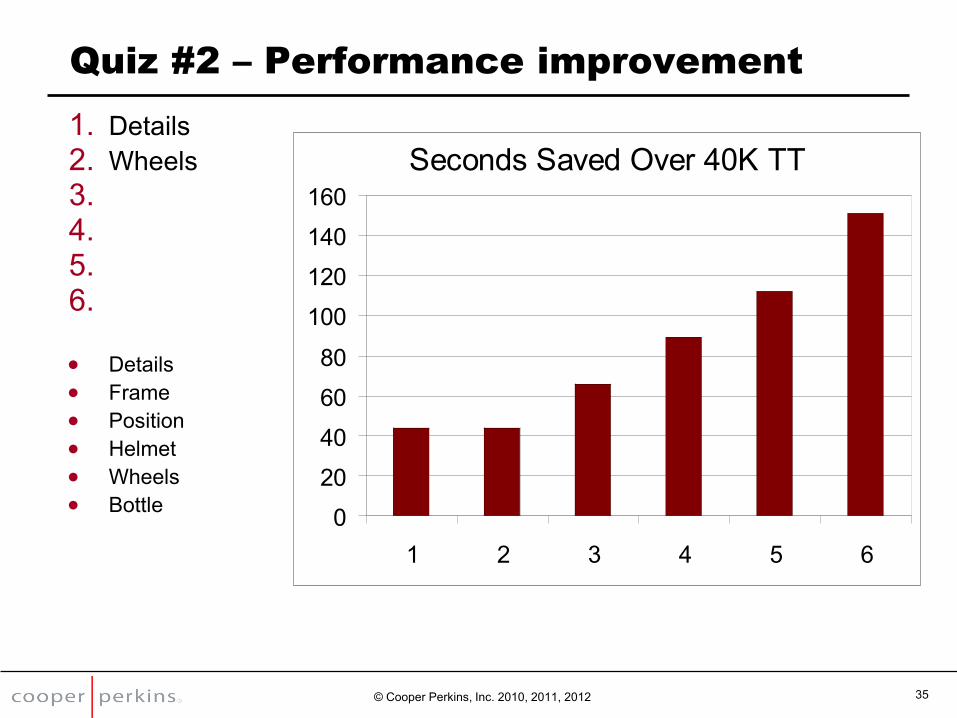
Quiz #2 – Performance improvement
1. Details 2. Wheels 3. 4. 5. 6.
Details Frame Position Helmet Wheels Bottle
© Cooper Perkins, Inc. 2010, 2011, 2012 35
Seconds Saved Over 40K TT
0
20
40
60
80
100
120
140
160
1 2 3 4 5 6
36 © Cooper Perkins, Inc. 2010, 2011, 2012
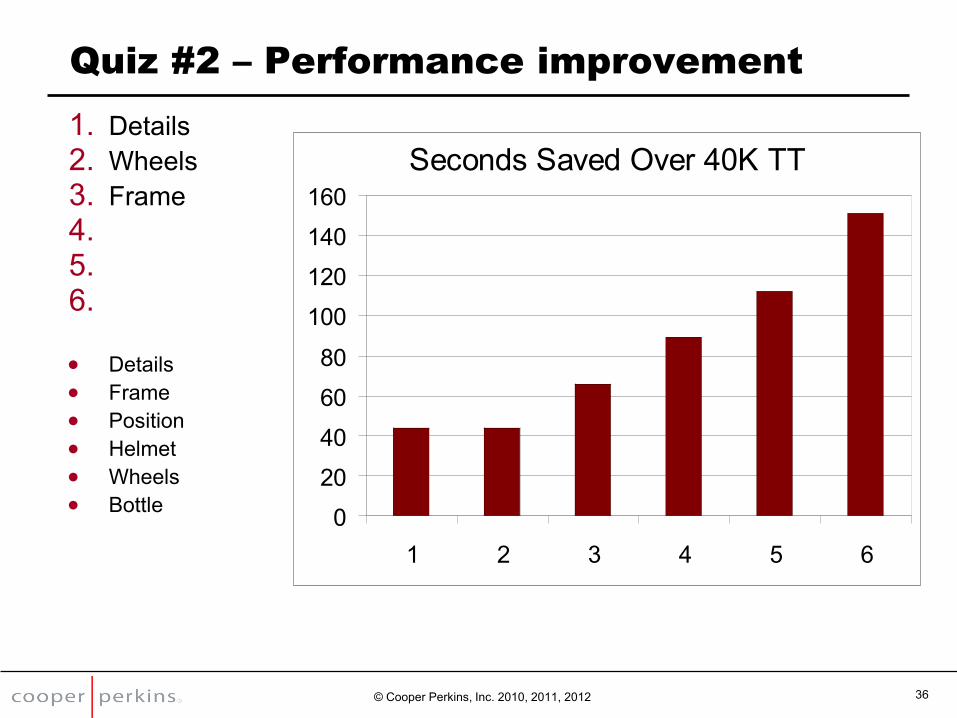
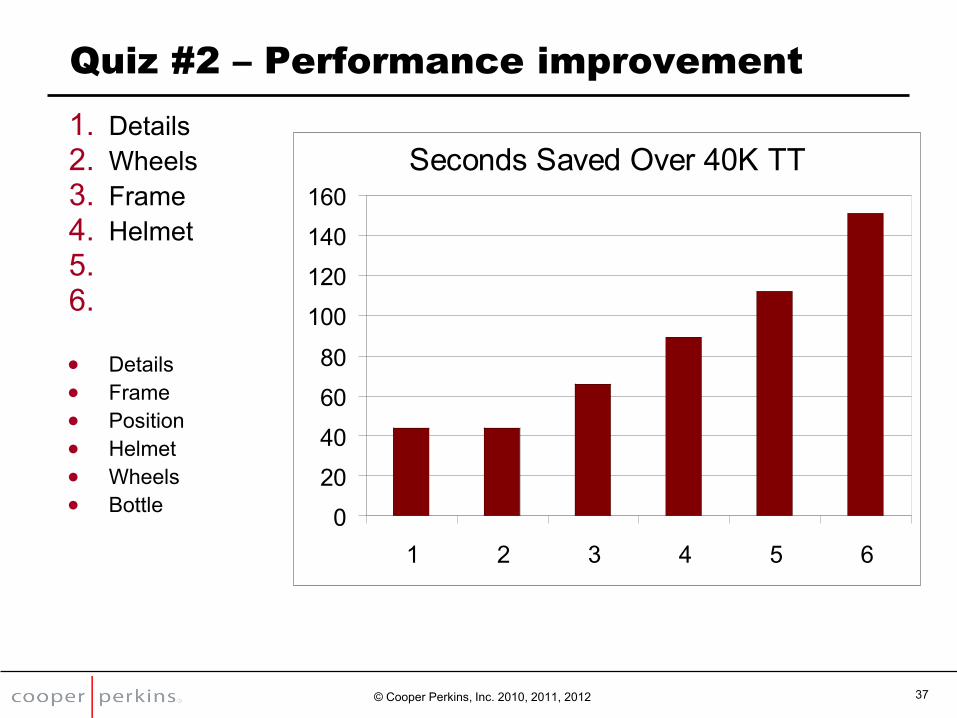
Quiz #2 – Performance improvement
1. Details 2. Wheels 3. Frame 4. 5. 6.
Details Frame Position Helmet Wheels Bottle
Seconds Saved Over 40K TT
0
20
40
60
80
100
120
140
160
1 2 3 4 5 6
37 © Cooper Perkins, Inc. 2010, 2011, 2012
Quiz #2 – Performance improvement
1. Details 2. Wheels 3. Frame 4. Helmet 5. 6.
Details Frame Position Helmet Wheels Bottle
Seconds Saved Over 40K TT
0
20
40
60
80
100
120
140
160
1 2 3 4 5 6
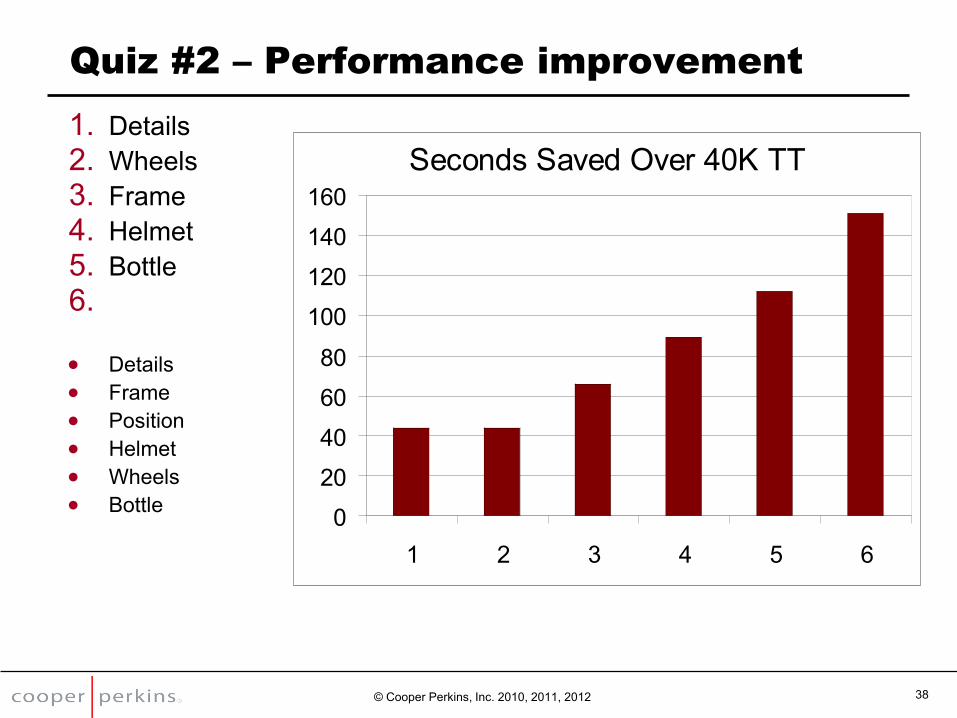
Quiz #2 – Performance improvement
1. Details 2. Wheels 3. Frame 4. Helmet 5. Bottle 6.
Details Frame Position Helmet Wheels Bottle
© Cooper Perkins, Inc. 2010, 2011, 2012 38
Seconds Saved Over 40K TT
0
20
40
60
80
100
120
140
160
1 2 3 4 5 6
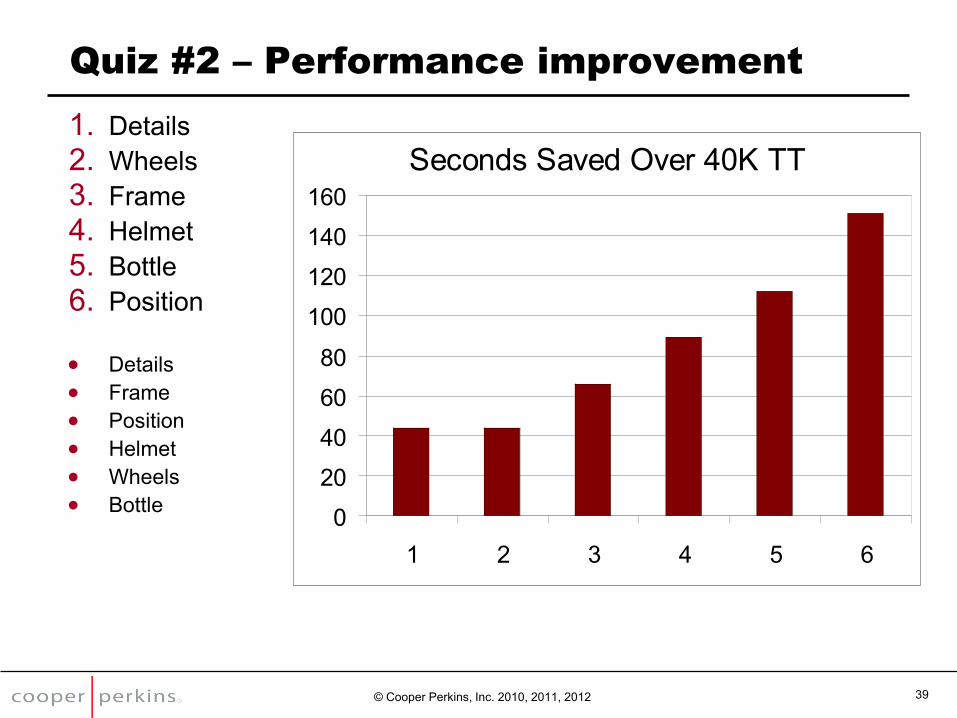
Quiz #2 – Performance improvement
1. Details 2. Wheels 3. Frame 4. Helmet 5. Bottle 6. Position
Details Frame Position Helmet Wheels Bottle
© Cooper Perkins, Inc. 2010, 2011, 2012 39
Seconds Saved Over 40K TT
0
20
40
60
80
100
120
140
160
1 2 3 4 5 6
40 © Cooper Perkins, Inc. 2010, 2011, 2012
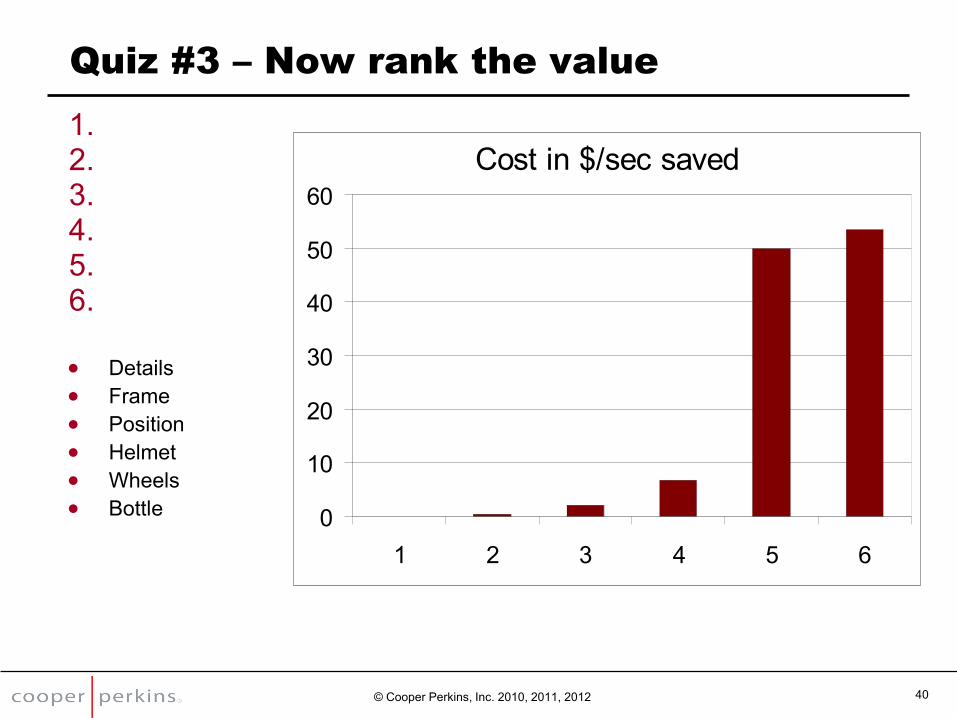
Quiz #3 – Now rank the value
1. 2. 3. 4. 5. 6.
Details Frame Position Helmet Wheels Bottle
Cost in $/sec saved
0
10
20
30
40
50
60
1 2 3 4 5 6
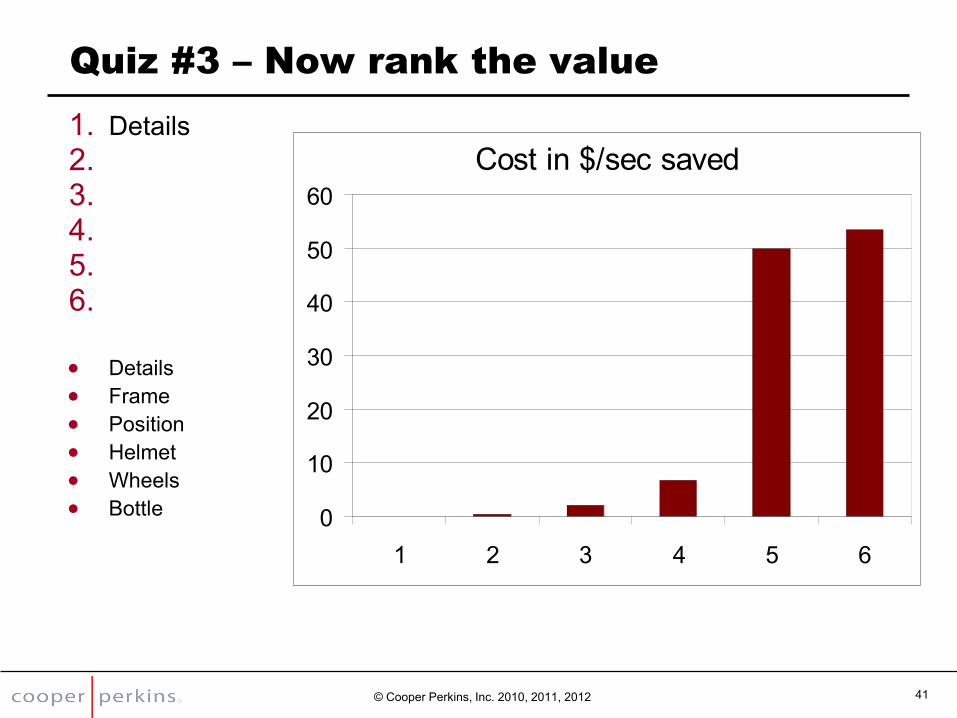
Quiz #3 – Now rank the value
1. Details 2. 3. 4. 5. 6.
Details Frame Position Helmet Wheels Bottle
© Cooper Perkins, Inc. 2010, 2011, 2012 41
Cost in $/sec saved
0
10
20
30
40
50
60
1 2 3 4 5 6
42 © Cooper Perkins, Inc. 2010, 2011, 2012
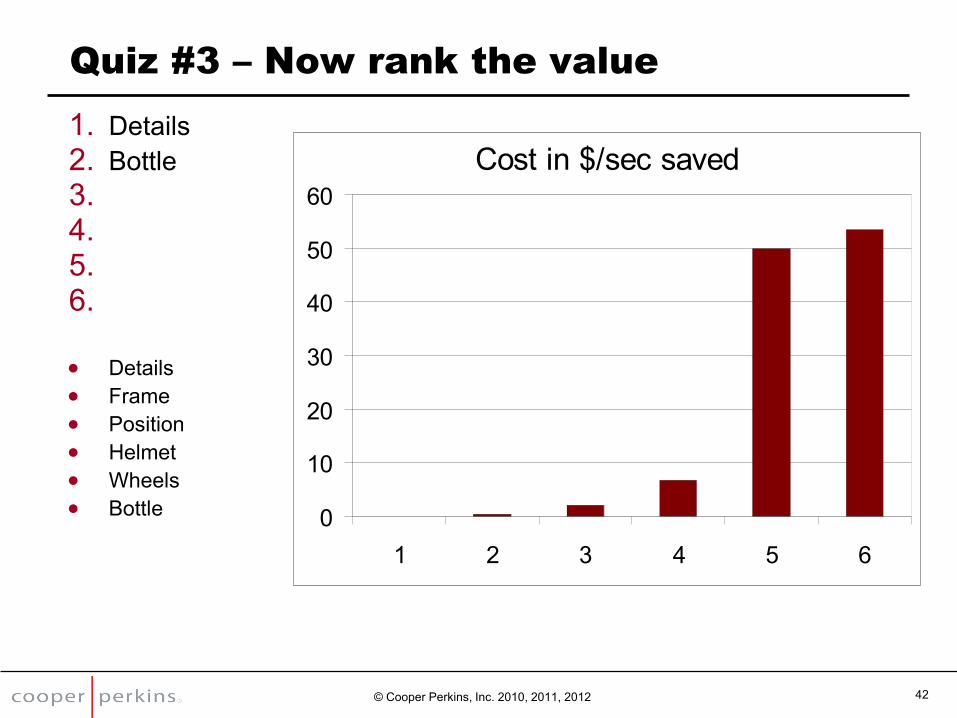
Quiz #3 – Now rank the value
1. Details 2. Bottle 3. 4. 5. 6.
Details Frame Position Helmet Wheels Bottle
Cost in $/sec saved
0
10
20
30
40
50
60
1 2 3 4 5 6
43 © Cooper Perkins, Inc. 2010, 2011, 2012
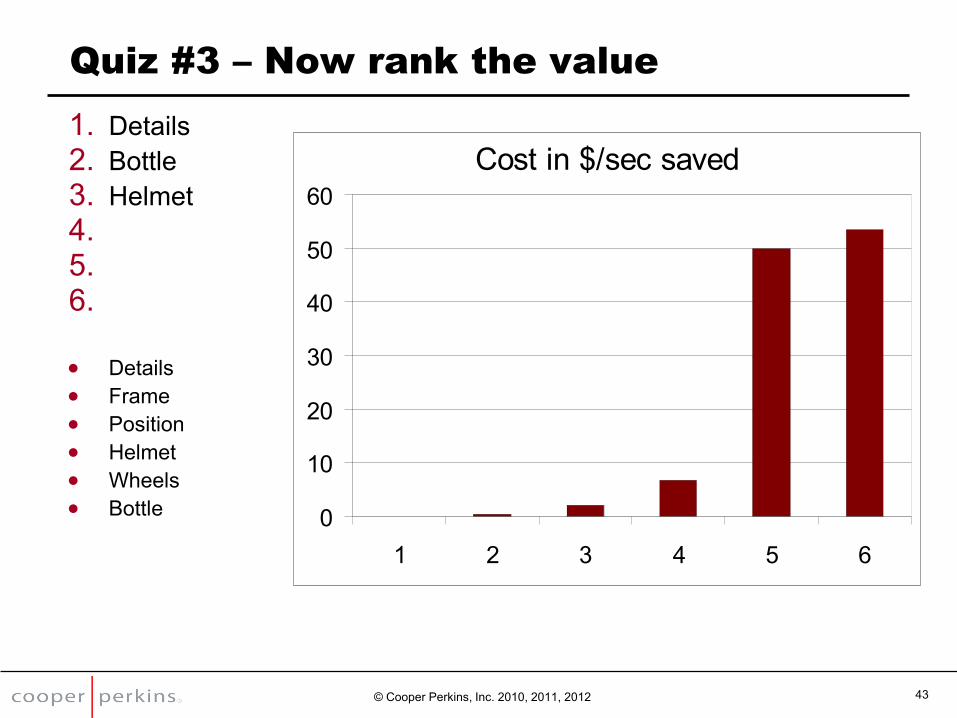
Quiz #3 – Now rank the value
1. Details 2. Bottle 3. Helmet 4. 5. 6.
Details Frame Position Helmet Wheels Bottle
Cost in $/sec saved
0
10
20
30
40
50
60
1 2 3 4 5 6
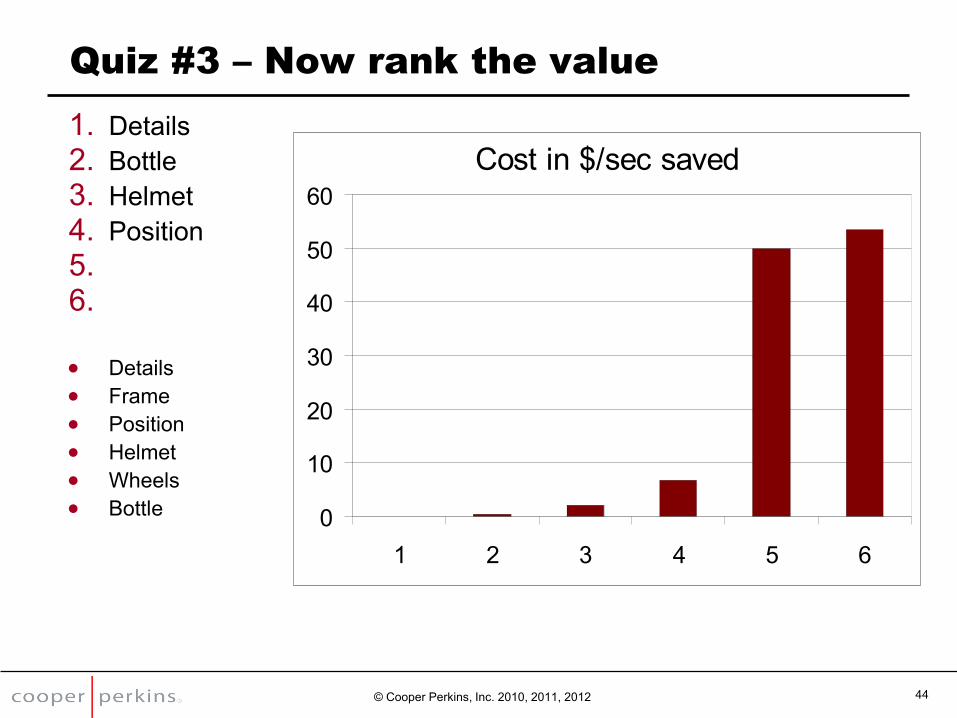
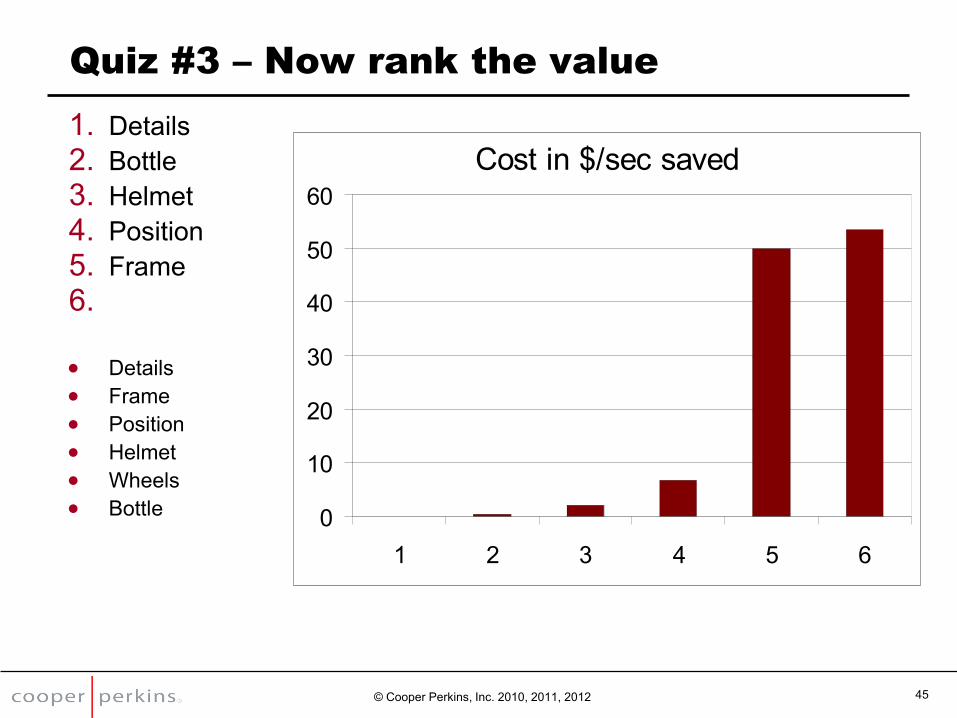
Quiz #3 – Now rank the value
1. Details 2. Bottle 3. Helmet 4. Position 5. 6.
Details Frame Position Helmet Wheels Bottle
© Cooper Perkins, Inc. 2010, 2011, 2012 44
Cost in $/sec saved
0
10
20
30
40
50
60
1 2 3 4 5 6
45 © Cooper Perkins, Inc. 2010, 2011, 2012
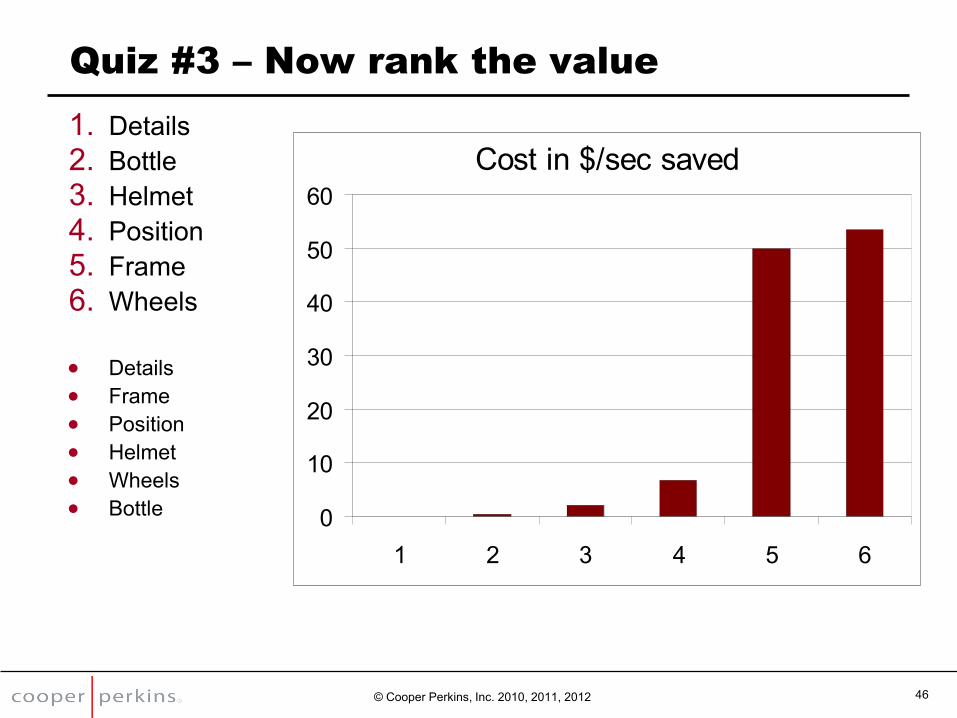
Quiz #3 – Now rank the value
1. Details 2. Bottle 3. Helmet 4. Position 5. Frame 6.
Details Frame Position Helmet Wheels Bottle
Cost in $/sec saved
0
10
20
30
40
50
60
1 2 3 4 5 6
46 © Cooper Perkins, Inc. 2010, 2011, 2012
Quiz #3 – Now rank the value
1. Details 2. Bottle 3. Helmet 4. Position 5. Frame 6. Wheels
Details Frame Position Helmet Wheels Bottle
Cost in $/sec saved
0
10
20
30
40
50
60
1 2 3 4 5 6
Wind Tunnel Results
Rider Position
Kim B. Blair PHD Vice President
[email protected] +1 781.538.5536
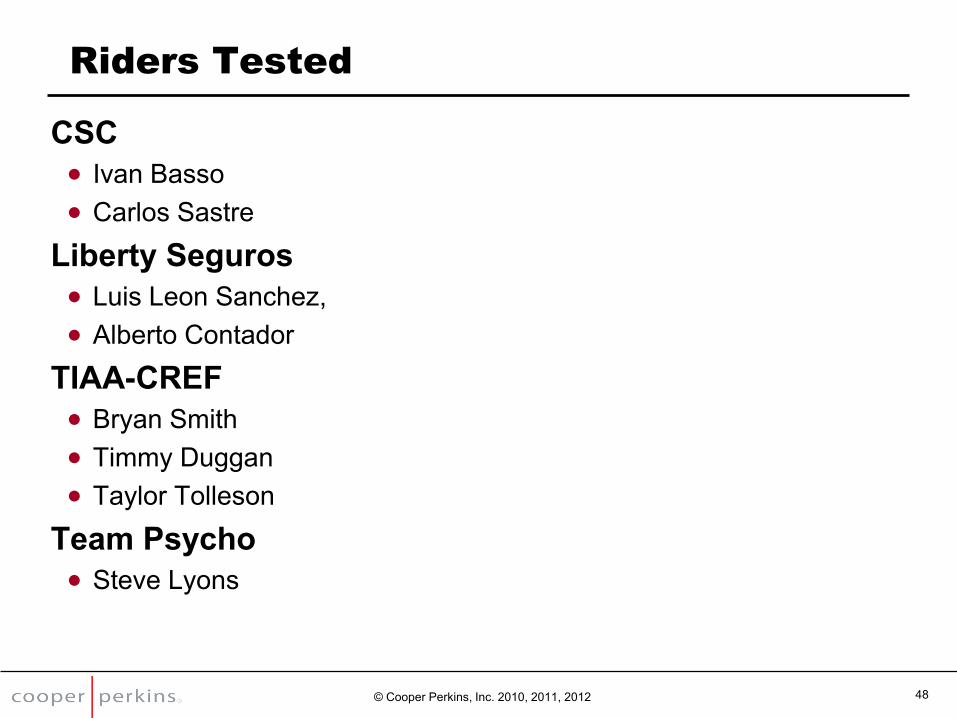
Riders Tested
CSC Ivan Basso Carlos Sastre
Liberty Seguros Luis Leon Sanchez, Alberto Contador
TIAA-CREF Bryan Smith Timmy Duggan Taylor Tolleson
Team Psycho Steve Lyons
© Cooper Perkins, Inc. 2010, 2011, 2012 48
Ivan Basso
Time in the tunnel 3.5 hours
Drag reduction 11%
Position changes Saddle up 1.5 cm Angled aerobars up 5 degrees from ground plane
© Cooper Perkins, Inc. 2010, 2011, 2012 49
50 © Cooper Perkins, Inc. 2010, 2011, 2012
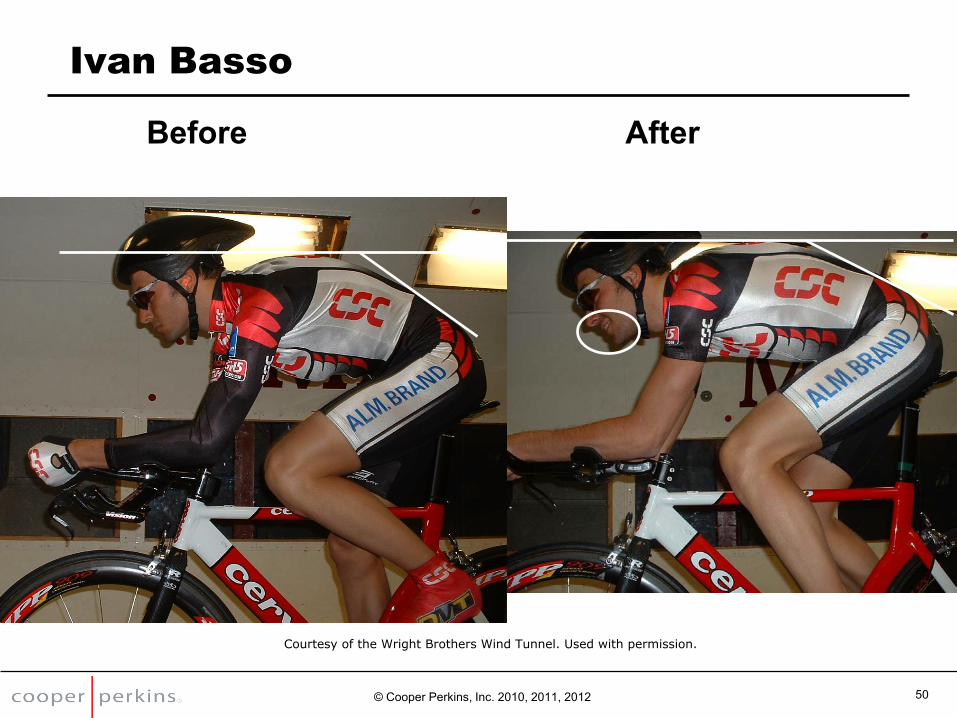
Ivan Basso
Before After
Courtesy of the Wright Brothers Wind Tunnel. Used with permission.
51 © Cooper Perkins, Inc. 2010, 2011, 2012
Ivan Basso
Cycling News: May 6, 2004 Riis told the Danish media that he expects that the results of the
test will enable Basso to improve his time trial by up to 3 minutes in a 40-50 kilometre race – an incredible 3-4 seconds per kilometre. "We can gain a lot of time through these tests."
2003 Final ITT Basso 22nd place
2004 Final ITT Basso 6th place Time difference within 2% of predicted improvement
2005 Dominated ITT events at 2005 Giro 2nd overall at the Tour de France
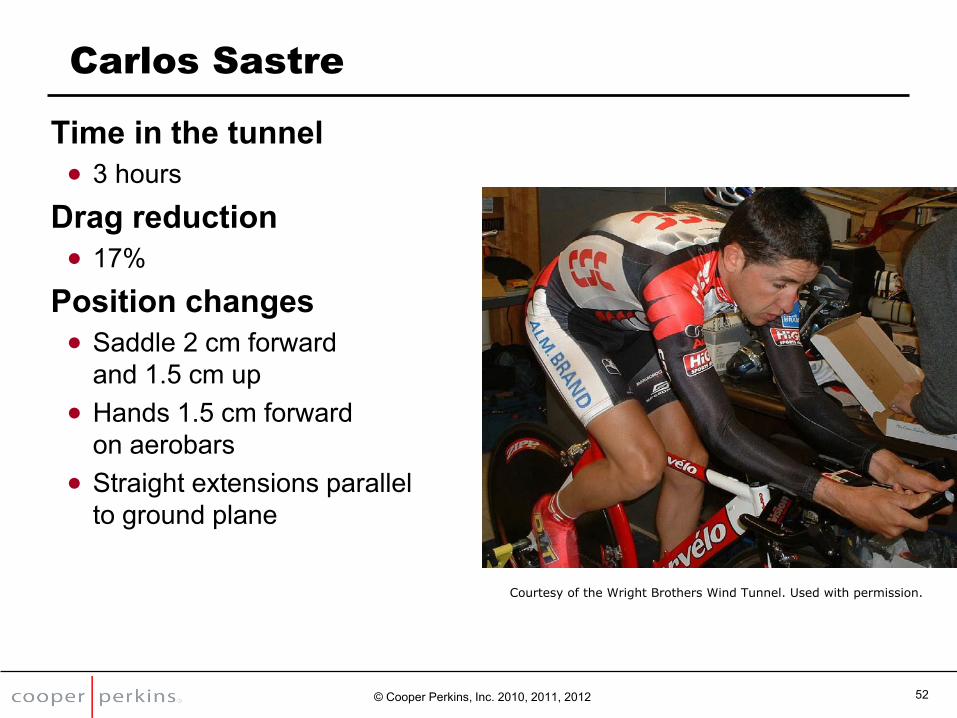
Carlos Sastre
Time in the tunnel 3 hours
Drag reduction 17%
Position changes Saddle 2 cm forward
and 1.5 cm up Hands 1.5 cm forward
on aerobars Straight extensions parallel
to ground plane
© Cooper Perkins, Inc. 2010, 2011, 2012 52
Courtesy of the Wright Brothers Wind Tunnel. Used with permission.
53 © Cooper Perkins, Inc. 2010, 2011, 2012
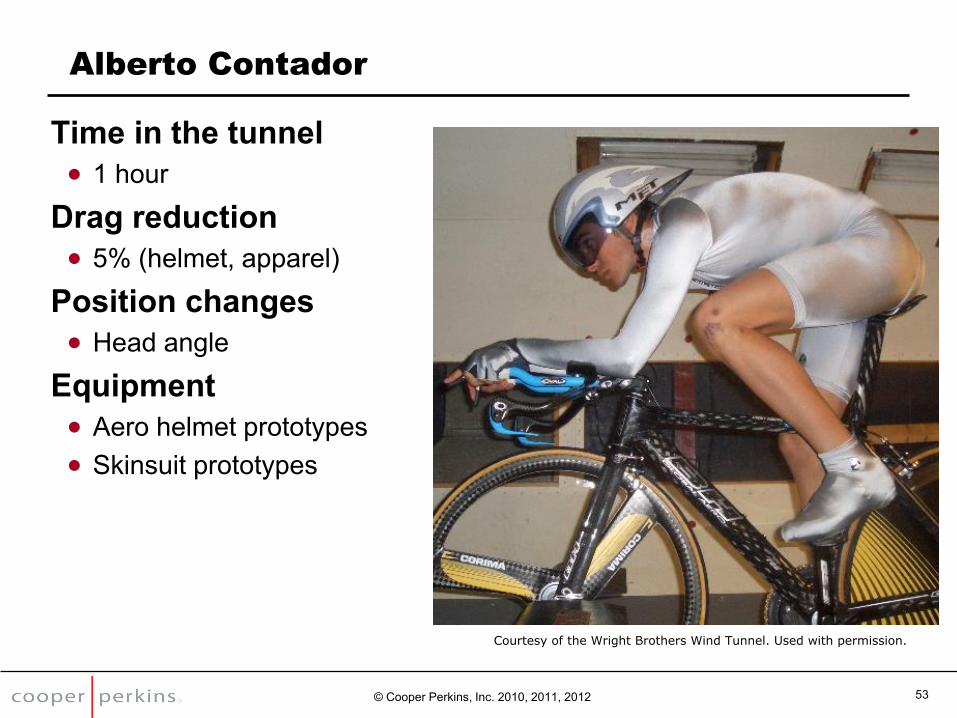
Alberto Contador
Time in the tunnel 1 hour
Drag reduction 5% (helmet, apparel)
Position changes Head angle
Equipment Aero helmet prototypes Skinsuit prototypes
Courtesy of the Wright Brothers Wind Tunnel. Used with permission.
54 © Cooper Perkins, Inc. 2010, 2011, 2012
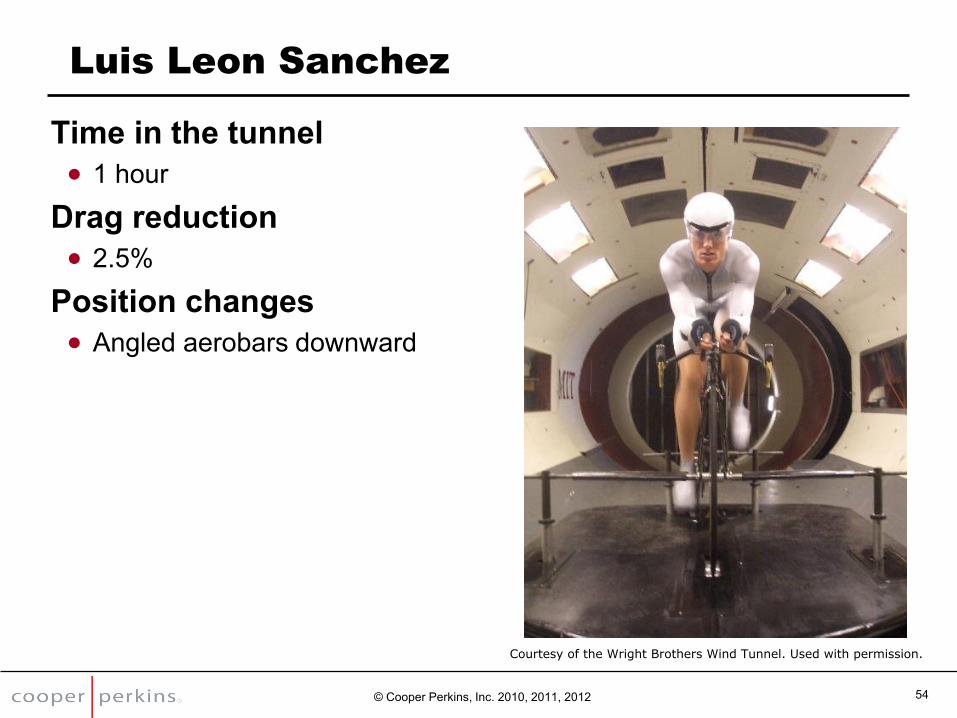
Luis Leon Sanchez
Time in the tunnel 1 hour
Drag reduction 2.5%
Position changes Angled aerobars downward
Courtesy of the Wright Brothers Wind Tunnel. Used with permission.
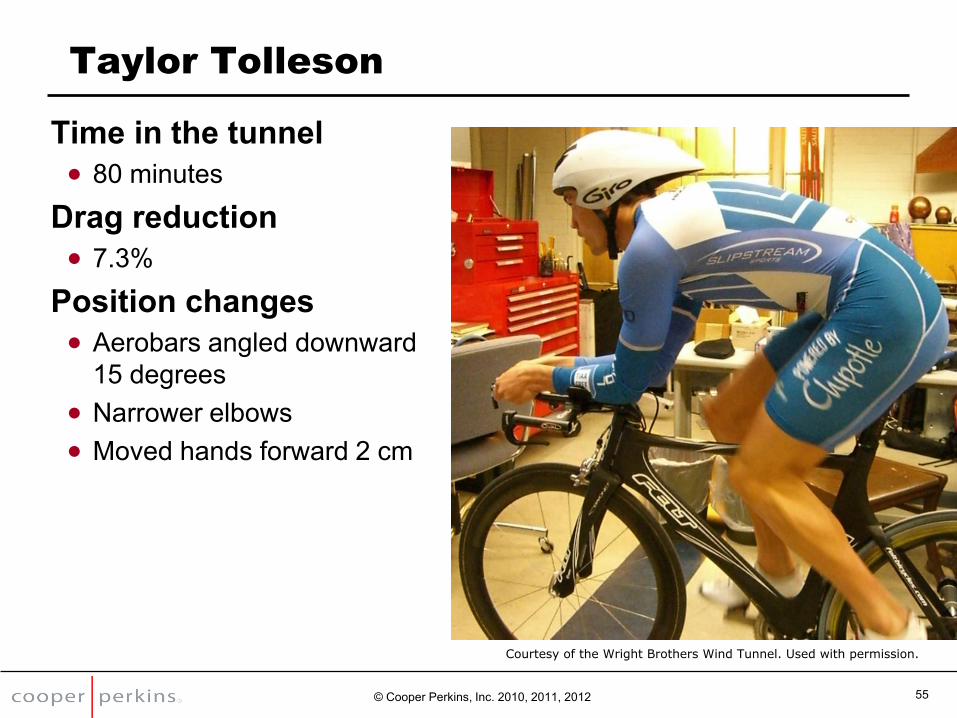
Taylor Tolleson
Time in the tunnel 80 minutes
Drag reduction 7.3%
Position changes Aerobars angled downward
15 degrees Narrower elbows Moved hands forward 2 cm
© Cooper Perkins, Inc. 2010, 2011, 2012 55
Courtesy of the Wright Brothers Wind Tunnel. Used with permission.
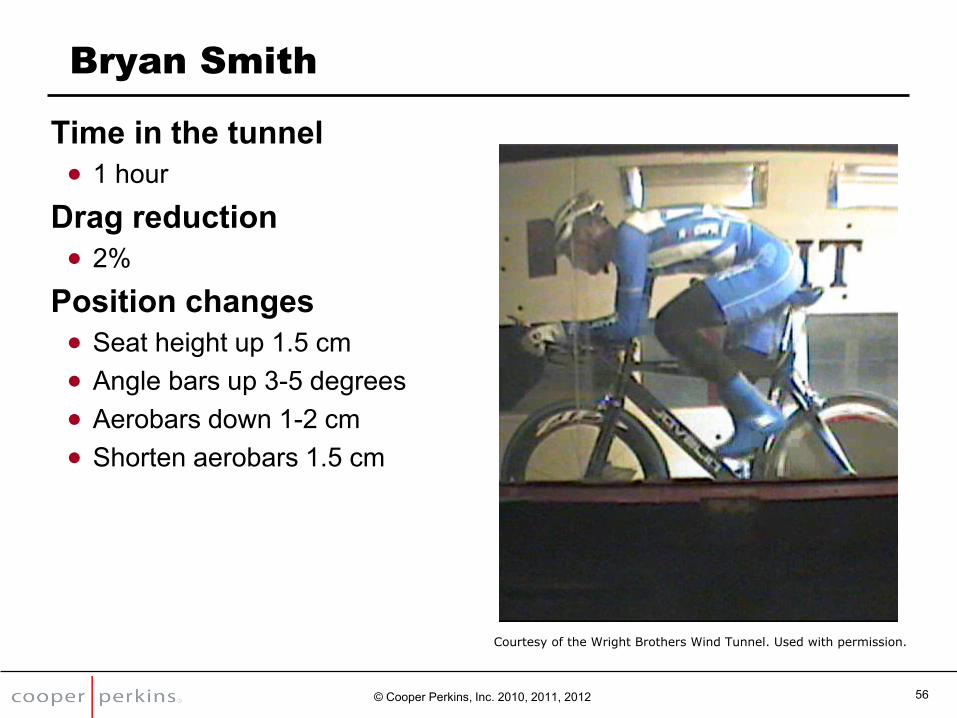
Bryan Smith
Time in the tunnel 1 hour
Drag reduction 2%
Position changes Seat height up 1.5 cm Angle bars up 3-5 degrees Aerobars down 1-2 cm Shorten aerobars 1.5 cm
© Cooper Perkins, Inc. 2010, 2011, 2012 56
Courtesy of the Wright Brothers Wind Tunnel. Used with permission.

57 © Cooper Perkins, Inc. 2010, 2011, 2012
Timmy Duggan
Time in the tunnel 1 hour
Drag reduction 12%
Position changes Slide back on saddle (~ 1 cm)
and rotate pelvis forward Bar angle up 5 deg Head looking down a bit (tail in air) Bar and seat height optimal
Image courtesy of Roxanne King.
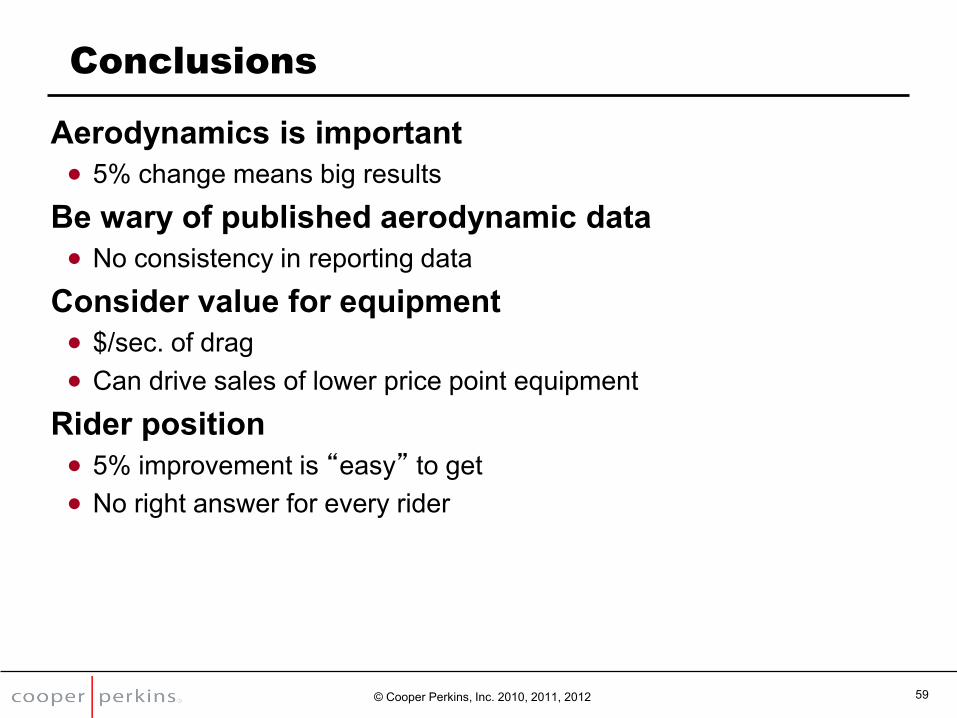
Conclusions
Aerodynamics is important 5% change means big results
Be wary of published aerodynamic data No consistency in reporting data
Consider value for equipment $/sec. of drag Can drive sales of lower price point equipment
Rider position 5% improvement is “easy” to get No right answer for every rider
© Cooper Perkins, Inc. 2010, 2011, 2012 59
MIT OpenCourseWarehttp://ocw.mit.edu ES.010 Chemistry of SportsSpring 2013 For information about citing these materials or our Terms of Use, visit: http://ocw.mit.edu/terms.