Embed Size (px)
Citation preview

CYCLES IN METABOLISM AND HEAT LOSS 0
James F. Annis, Samuel J. Troutman, and Paul Webb (
oA0 W
Distribution of this report is provided in the interest of
information exchange. Responsibility for the contentsresides in the author or organization that prepared it. n
Prepared under Contract No. NAS9-12683 byWebb Associates, Inc.
Yellow Springs, Ohio 45387
forNATIONAL AERONAUTICS AND SPACE ADMINISTRATION
https://ntrs.nasa.gov/search.jsp?R=19740017514 2018-07-04T05:41:11+00:00Z

TABLE OF CONTENTSpage
Introduction I
Description of the Experiments 3Suited quiet day routine 3Nude quiet day routine 4Stay awake day routine 5Fixed metabolism day routine 6
Description and Application of the Suit Calorimeter 7
Application of the Heat Balance Equation 10
Subjects 12
Methods 14
Experimental protocol 14Measurements 16
Instrumentation and Equipment 18.Indirect Calorimetry 18Direct Calorimetry 22
Water Cooling Garment 22Insulative Clothing Assembly 23
Hw. Computer . 25Water Loop Controller 26
Data Recording System 26Bicycle Ergometer 27Cardiotachometer System 28Weights and Measures 28Environmental Chamber 28Special Equipment for Nude Man Calorimetry 29
System Performance Analysis 29
Results 3024-Hour Totals 30Effects of the Suit Calorimeter 42Effects of Sleep 45Effects of Fixed Metabolism 48Summary of Results 54
Discussion 55
References 59
LIST OF TABLESTable # page
1 Physical Description of the Subjects 13
2 List of Measurements 17
3 Descriptive Data for the WCG's used in this Study 24
4 Summary of the 24-hour Heat Balance Measurements 34
5 Summary of the Respiratory Gas Exchange, Fluid Balance,& Food (Fuel) Balance Data over 24 Hours 35
6 Change in Body Temperatures (Tre, Tac, Ts) and Estimationof Heat Storage from Tb Calculations over 24 Hours 41
LIST OF FIGURESFig. # page
1 Block diagram of the suit calorimeter system 20
2 Block diagram of system components for the nude experiments 21
3 Bar chart comparing heat production and losses over 24 hours 32
4 Histographic presentation of heat loss pathway totals over24 hours expressed as percentages of heat production 33
5 Bar chart of the 24-hour fluid balance for each experiment 38
6 Graphic comparison of fuel deficits and average RER's over 24 hrs. 40
7 Line graph comparing M, EH, and Tre for subject SJT in the quiet day(suited) and nude quiet day experiments (hourly values) 43
8 Line graph comparing M, rH, and Tre for subject SA L in the quietday (suited) and nude quiet day experiments (hourly values) 44
9 Line graph comparing hourly values of M, EH, and Tre for subject SJTin the quiet and stay awake day experiments 46
10 Line graph comparing hourly values of M, EH, and Tre for subjectSAL in the quiet and stay awake day experiments 47
11 Line graph comparing hourly values of M, EH, and Tre for subjectSJT in the quiet and fixed metabolism experiments 49
12 Line graph comparing hourly values of M, EH, and Tre for subjectSAL in the quiet and fixed metabolism experiments 50
13 Line graph showing interrelationships of S and Tre for allexperiments on subject SJ'T 52
14 Line graph showing interrelationships of S and Tre for allexperiments on subject SAL 53
iv
CYCLES IN METABOLISM AND HEAT LOSS
James F. Annis, Samuel J. Troutman, and Paul Webb
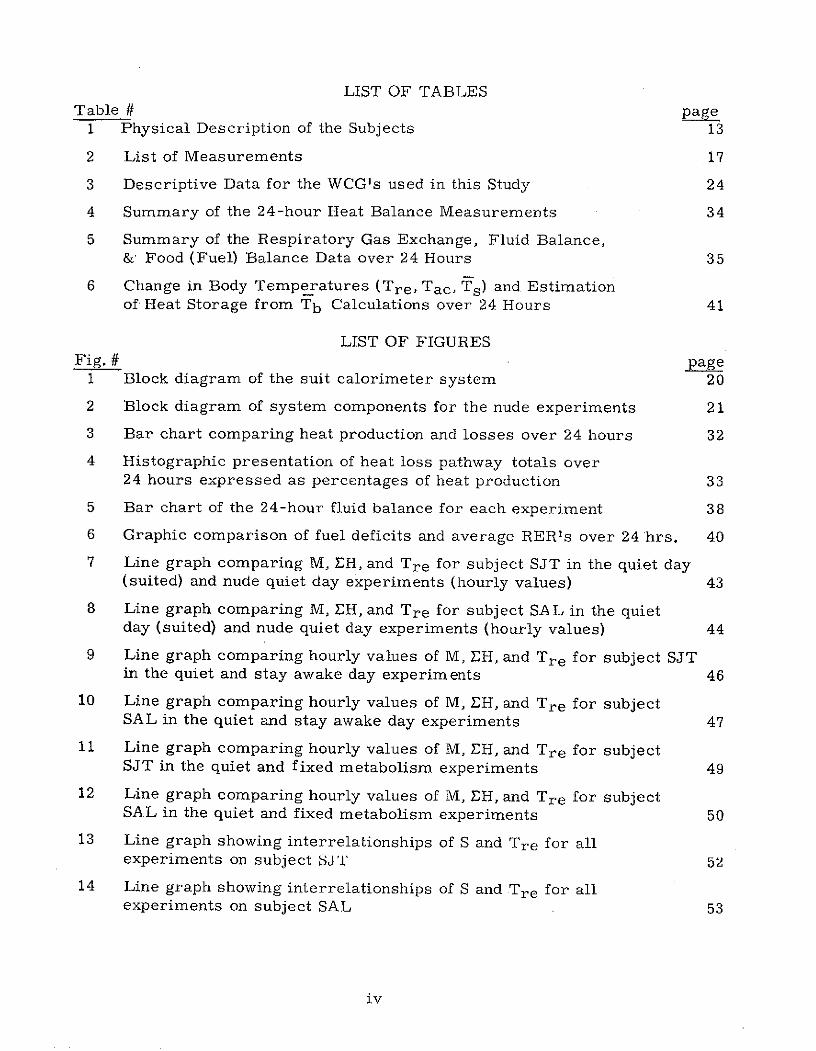
SUMMARY
Using calorimetric techniques, subjects' metabolism, thermoregulation,
and body temperatures were monitored continuously for 24-hour days, using
three types of experimental routines. A water cooling garment (WCG) was
used for direct calorimetry, while partitional calorimetry was used to
establish a non-suited comparison for one of the routines. In this replicated
routine, called the "quiet day," the subjects were sedentary throughout the
daytime hours and slept normally at night. Results indicate that the WCG
may act to reduce 24-hour total oxygen consumption (VO 2 ) or heat production,
possibly due to the lowered energy cost of thermoregulation.
Data were examined for effects of the different test routines on
circadian patterns in metabolism, thermoregulation, and body temperature.
Staying awake damped the magnitude of nocturnal change in metabolism,
heat loss, and body temperature without obliterating circadian rhythms.
Fixed metabolism further damped these responses. When metabolism was
elevated either by staying awake or by work, an energy imbalance resulted
at the end of the 24-hour measurement period. The imbalance indicated a
net surplus of heat produced. The amount was significant and appeared to be
directly related to activity level as well as to fuel intake deficits. Body
temperatures did not reflect these imbalances.
INTRODUCTION
The water cooled garment (WCG)--or liquid cooled garment (LCG),
as it is often called--is primarily a product of space technology. As long
ago as 1959 the possibility of using a water cooling garment for lunar
exploration was suggested by Billingham (1), but the first suits actually
developed were intended for use by RAF pilots. Space usage, when it came,
was strictly applied to the problem of removing excess metabolic heat from
thermally isolated (pressure suited) active astronauts. Because the energy
cost of work in full pressure suits is high, air cooling, such as was used in
early Gemini EVA, was not considered efficient enough for use by Apollo
astronauts during lunar exploration. The need to specify and build a space
qualifiable garment naturally resulted in investigations dealing with the
physiological aspects of water cooling, and physiological research was
initiated in a number of laboratories in the early 1960's. A useful review
of the work performed through 1970 was published by Nunneley (2).
In addition to its continuing use in space flight, the WCG is now being
applied as a thermoprotective device for industrial workers and divers,
and it is the central component of our suit calorimeter.
Regardless of application, certain aspects of the interrelationship
of human thermoregulatory mechanisms versus WCG function and operation
are still not well understood. In our laboratory, studies dealing with
metabolic time constants (3, 4, 5) and automatic control of water cooling
1.
using physiological feedback (6) ultimately led to the application of the
WCG-thermally isolated man complex to whole body calorimetry.
Historically, human (whole body) calorimeters were complex,
expensive, and difficult to operate. Often it was weeks before the results
of a given experiment were known. In our laboratory we have combined
continuous indirect calorimetry (VO2 measurement) and continuous direct
calorimetry using the WCG, and produced a more dynamic form of whole
body calorimetry. In 1972 we published the results of the first WCG
calorimeter experiments (7). In three experiments reported, accurate
(± < 1%) 24-hour heat balances were obtained on both inactive and active
men. Because of the continuous nature of the data, it was possible to
analyze transients in heat production and loss and to hypothesize about
circadian patterns in thermophysiological variables (8). For example,
is the diurnal-nocturnal pattern observed in rectal temperature merely
the result of phase shifts between heat production and heat loss rather
than day-night thermal or other more complex set-point changes, as has
been suggested by other investigators? How many of the patterns observed
in our recent study resulted from physiological forcing by the thermally
powerful WCG?
The purpose of the study reported here was to investigate the inter-
actions of cycles in metabolism, thermoregulation, and body temperature.,
and to determine the nature of the cycles when they are isolated--that is,
while one of the three is held constant. The principal objectives of the
study were to determine the circadian effects of metabolism of a greater
magnitude than previously studied, the effects of sleep, and the effects of
wearing a WCG.
2.

DESCRIPTION OF THE EXPERIMENTS
In order to fulfill the objectives of the study, four types of experiment
were completed, using two subjects; hence eight experiments comprise the
series analyzed. All experiments included a full 24-hour day of continuous
measurement plus an equilibration period, consisting of a 6 to 8-hour night
of sleep, during which the subject wore full instrumentation and slept in the
environmentally controlled chamber where the experiment took place. The
average elapsed time for each complete experiment was nearly 33 hours,
and in six of the eight experiments the WCG calorimeter was worn throughout.
All experiments included indirect calorimetric estimates of heat production
based upon continuous measurement of oxygen consumption (VO 2 ) and carbon
dioxide production (VCO 2 ). The following paragraphs describe the protocol
used in each of the four types of experiment.
Suited Quiet Day Routine
In the procedure we called the "quiet day" routine, the subject wore
the WCG calorimeter assembly for the entire test period. Following normal
awakening from the equilibration night of sleep, the subject spent the daytime
hours engaged in minimal activity--usually reading or watching television--
while remaining seated in the chamber. Since he was not required to remain
alert, dozing was allowed. When he felt ready for bedtime, he began a
second night of supine sleep. When he awoke the following morning (or at
the completion of 24 hours since arising the preceding day), the experiment
was terminated. All nourishment, which was freely available except when
it might interfere with the experiment routine, consisted of liquids--
3.

black coffee, cocoa, or a specially prepared dextrose solution containing
0.5 kcal/cc of the sugar and fresh lemon juice for flavoring. The weight,
temperature, calorie content, and time of each liquid food intake (Ilf)
were logged for future use in heat balance calculations. Body waste
functions were permitted as required by the subjects. Fortunately this
consisted only of urinary output (Ou), since the need for defecation did not
occur. Subjects had been advised to limit their diet to low bulk foods for
two days preceding an experiment, but no strict control was exercised.
Subjects' weights were obtained hourly except during sleep. Chamber
temperature was maintained at a constant 30 0 C level.
A semi-automatic mode of control of WCG inlet water temperature
(Twi) was selected for use in all suited experiments. The set point Twiwas based upon subject preference, and usually only two temperatures
were used--one for daytime and one for nightime. This approach to control,
we thought, would minimize the number of fluctuations in Twi observed when
complete automatic control schemes are employed. We believe that this
control procedure approximately matched basal metabolic rates (BMR)
for the subjects, and it served as the basis of comparison for the other
experiments.
Nude Quiet Day Routine
The protocol for the nude quiet day routine ("nude quiet") was similar
to the suited quiet day routine except that the WCG was not used. Body
coverage consisted of an athletic supporter and the required instrumentation
only. Since the WCG was not used, the heat loss quantities were determined
using partitional calorimetry techniques. Most of the environmental
descriptors required for partitional calorimetry were either measured
4.

during the experiments or had been determined previously for our chamber.
Chamber dry bulb temperatures (Tdb) were selected by the subject for his
comfort; frequent changes were discouraged. Normally the daytime temper-
atures remained constant at the selected level and a single, but slightly
warmer, environment was used while the subjects slept at night. Water
vapor pressures averaged 11-14 mm Hg and produced relative humidities
ranging from 40 to 50%.
Direct calculations of the radiant (R) and convective (C) heat exchange
using standard equations were not made in the analysis of these experiments,
since the exact influence of postural effects (seated in a chair or lying down
to sleep) on C and R was not known. Therefore heat exchange via these path-
ways was obtained using the Gagge method (9) of deriving the combined R & C
values. Storage (S) was assumed to be zero over the 24 hour test period.
Additional information about the method of calculation used is presented in
"Application of the Heat Balance Equation."
Because of the similarity in procedures, a comparison of the nude
quiet and the quiet day results permits conclusions to be drawn with regard to
possible effects of the WCG calorimeter upon metabolic rate, thermoregulation,
and body temperature over a 24-hour period.
Stay Awake Day Routine
In this type of experiment the procedures and instrumentation were
exactly the same as those used in the suited quiet day routine, except that
the subjects were not permitted to sleep during the 24-hour calorimetric
balance period. (Sleep was permitted during the equilibration night.) This
routine, entitled the "stay awake" day, when compared to the quiet day
experiments, demonstrates the effect of sleep on the three principal thermo-
regulatory responses of interest--metabolism, heat loss, and rectal
temperature.
5.
Fixed Metabolism Day Routine
In these experiments the subjects were required to maintain a fixed
activity level continuously for 24 hours; they are therefore entitled the "fixed
metabolism" days. The individual work rates were selected to produce an
oxygen consumption rate just in excess of the maximum level observed during
the quiet day routine. The objective was to keep the V0 2 constant within
± 10% of the selected target value. The activity level was largely self-paced
by visual monitoring of a continuous V0 2 analog signal produced by the MRM
(see "Instrumentation and Equipment"). In addition, observers reported
actual average minute V0 2 levels to the subject each 10 minutes of the 24 hours,
This form of control worked quite well, as subjects usually were able to meet
the ± 10% accuracy level. The principal form of activity was bicycle pedalling
(leg work) while seated in a comfortable chair positioned to the rear of the
ergometer. Mechanical or external work (W) was measured electromechan-
ically during one of these experiments. Subjects were permitted to engage
in other forms of activity, such as arm work or moving about the chamber,
but they were used sparingly since accuracy of control was more difficult.
The only schedule break in activity occurred during the hourly weight deter-
minations; unscheduled breaks for urination and for drinking were brief.
None of the breaks lasted more than 2 or 3 minutes, and the subject was
usually able to keep up his 10-minute oxveygen consumption total despite them.
By maintaining MR fixed, the goal of the fixed metabolism experiments
was to isolate heat production in order to determine the influence of this
component upon thermoregulation and body temperature.
6.

DESCRIPTION AND APPLICATION OF THE SUIT CALORIMETER
In all but the nude quiet day experiments, body heat balance was
determined by the use of our suit calorimeter, which was very similar to
the one described in a previous publication (7). Briefly, the suit calorimeter
consists of the following basic items: 1) apparatus for measuring V 0 2 and
VCO 2 simultaneously and continuously; 2) the WCG and its associated water
control and measurement devices; 3) an insulative clothing assembly; 4)
other measurements to complete the description of heat dissipation. Detailed
descriptions of the metabolism components of the calorimeter are given in
later sections of this report: see "Methods" and "Instrumentation and Equipment.'
At this time we will describe only how the suit calorimeter works.
The estimation of heat production, or indirect calorimetry, from VO 2
measurements is well known and need not be redescribed here. Since our
earlier study we have added the measurement of VC02; this data permits the
use of correct caloric equivalents of 02, since the time averaged respiratory
exchange ratio (RER) is known over a selected period of time. Determination
of urine urea nitrogen and other indices of protein metabolism were not made;
however, non-protein caloric equivalents of 02 were used in calculation of
heat production. If over a period of time the measured RER exceeded the
usually quoted limits of 0.7 to 1.0, the caloric equivalent of 02 for the
closest RER was used. The effects of these potential errors will be discussed
later (see "System Performance Analysis").
7.

The heart of the direct calorimetric measurement was the heat
removal (H w ) by the water in the WCG. The tubing network of the WCG
was worn directly on the skin in order to pick up and carry away metabolic
heat as soon as it was available at the surface of the body. Except for the
face, the soles of the feet, and the palms of the hands, the tubing covered
the entire body surface. The Hw was quantified from:
Hw = rhwc (Two - Twi) (1)
where rhw is the mass flow rate of water through the suit; c is the specific
heat of water; Two is the outlet water temperature; and Twi is the inlet
water temperature.
The insulative garment assembly was worn over the WCG in order to
limit heat exchange between the man-garment system and the chamber environ-
ment. To further minimize heat leakage, the chamber dry bulb temperature
(Tdb) was maintained at a constant 30 ±0.20 C. This temperature had been
determined empiricially to be the point at which the least heat exchange
occurred.(7). Because of the rather small maximum difference in temperature
at interfaces throughout the complete system, the heat leak in or out must
necessarily have been small. In this particular group of experiments the
largest gradient observed was approximately 50C between the skin and the
water and 2.5 0 C between the water and the chamber air.
Because it is subjectively pleasing and physiologically sound, evaporative
heat loss (HE) was allowed to continue fairly normally. The insulative garment
did not include a water impermeable layer; therefore insensible perspiration
which managed to diffuse or be wicked to the surface was evaporated to the
environment. The garments were not completely sealed; however, air
8.
passageways were blocked so that air motion under or within the clothing
layers was slight. Convective heat exchange (C) via this pathway is thought
to have been extremely small. Frank sweating never occurred even though
the subjects were active during the fixed metabolism day routine; they had
no need to sweat since sufficient cooling was furnished to satisfy this thermo-
regulatory response (7, 10). Evaporative weight loss, which was detected by
weight change, was corrected by a weight equivalent to the difference between
02 uptake and CO 2 production.
A small amount of heat exchange was associated with the ventilatory
flow of the metabolism measurement device (MRM). This flow furnished
breathing air and washed the facial area under a special mask. Any respira-
tory or facial evaporative loss was detected with the change in weight. Some
convective warming of the air, which was drawn from the 30 0 C chamber
atmosphere, did occur. By measuring the increase in air temperature across
the man and from knowledge of the fixed flow rate, the convective loss (C)
was calculated using the following relationship:
Crf = rhpc (Tex - Ta) (2)
where Crf is the convective heat exchange from respiration and the face;
rh is the mass flow rate of air; c is the specific heat of air; p is the density
of air; Tex is the temperature of the MRM exhaust air; and Ta is the temper-
ature of the ambient air in the chamber.
Chamber wall temperature (Tw) and the outer surface of the insulative
clothing assembly always ran very nearly the same, within about ± 0.1 0C.
Radiant heat exchange was probably small even though the radiant properties
of the two surfaces were different.
9.

Since both hot and cold liquids were consumed by the subjects,
heat given to or taken from the subjects to bring the liquid to body temper-
ature was taken into account in calculating heat balances. The heat exchange
of the man with the liquid food (±Hlf) was calculated as follows:
±Hlf = mlfc (Tre - Tlf) (3)
where mlf is the mass of the liquid (water-food); c is the specific heat of
water; Tre is the rectal temperature; and Tlf is the temperature of the
liquid food.
Application of the above mathematical relationships and the use of
symbols in calculating heat balances via the heat balance equation are
discussed in the following section.
APPLICATION OF THE HEAT BALANCE EQUATION
The body heat balance equation is the biologist's statement of the
First Law of Thermodynamics that describes the rate at which a body
generates and exchanges heat energy with its environment. Any net excess
or decrement in heat over a period of time is theoretically reflected in
measurable changes in body heat content, or storage (S). In its currently
approved form the equation is written as follows:
S = M ±E -(±W) ±R ± C ±K (4)
where S is the rate of storage of body heat (+ for net gain by body);
M is metabolic free energy production (always +); E is evaporative heat
transfer; W is work (+ for positive work against external forces); R is
radiant heat exchange(+ for net gain); C is convective heat transfer (+ for
net gain); and K is conductive heat transfer (+ for net gain). (11)
10.

In calorimetry, all terms of the equation but one are measured.
The unmeasured term is storage, which cannot be measured because mean
body temperature (Tb) cannot be reliably measured in living bodies.
Proportionality equations based upon discrete temperatures produce values
for Tb which are of questionable accuracy. It can be calculated as follows:
Tb = 0.67 Tc + 0.33 Tsk (5)
where Tc is core temperature and Tsk is mean skin temperature.
Only with accurate and complete whole body calorimetry can S be
estimated, and, as we shall discuss later, even this value may be in error.
In partitional calorimetry S is assumed to be zero, so that the more
difficult to measure (or calculate) components of the balance equation may
be lumped and obtained by subtraction. Hence the equation is satisfied by a
value for a combined R and C heat exchange. Because of measurement
complexity, convective and radiative heat transfer are combined and assigned
an amount of heat gain or loss (usually loss) required to produce an S of zero
for the time period studied. Since with nude resting men external work (W)
and conductive transfer (K) are assumed to be zero, the required measure-
ments are M and E. As stated earlier, we have chosen the Gagge (9)
technique of analyzing the partitional calorimetry experiments performed in
this study, although some of the variables required on calculation of R and C
were measured and were known for our chamber, e. g. air velocity. As a
result the form of heat balance equation adapted for the partitional calorimetry
data presented is as follows:
M = E + Crf ± Hlf + hr + c (Tsk -Ta Tw) + S (6)
Since S = 0, the equation may be rewritten:
Ta + Twhr + c (Tsk - at ) = M - (E + Crf ± Hlf) (7)
where hr + c is the coefficient of radiative and convective exchange.
11.

An average coefficient for each partitional calorimetry run was
derived using 24-hour average temperatures and 24-hour total heat exchange
values (right side of equation 3). In order to find the actual R + C value for
a given hour, the average coefficient obtained was multiplied by the actual
AT between skin and the mean air/wall temperature for that period. The
coefficient values obtained for our subjects compare favorably with published
values at equivalent air speeds (12). When hourly balances were calculated,
the hourly S values were not zero--only the 24-hour net cumulative S is
forced to equal zero. This technique permitted estimation of the cyclic
patterns of S over the experimental day.
The derivation of values and symbols especially adapted to the
calculation of heat balances in the suit calorimeter experiments has already
been discussed. There the standard heat balance equation (equation 4)
can be rewritten specifically to our case, as follows:
S = M - (HE + HW ± Hlf + Crf + W) (8)
In general, metric units have been used in presentation of the data
obtained in this study. All heat units are expressed in kilocalories (kcal).
Also, data is presented as 24-hour or as 1-hour totals or averages.
SUBJECTS
The two men used in these experiments are experienced test subjects
selected from our laboratory staff. Both are engineers, healthy, and moder-
ately fit, with a ' 0 2 -max ranging from 40 to 50 cc/kg. The principal
physical descriptors for the subjects are given in Table 1, below.
12.
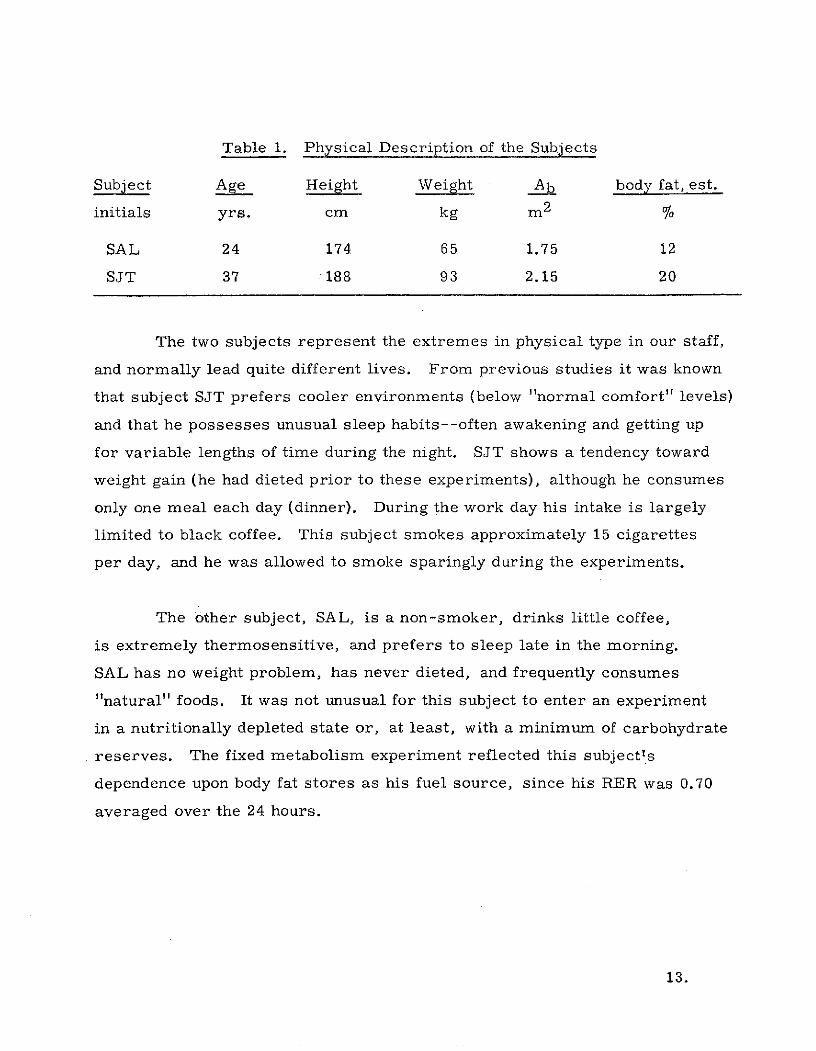
Table 1. Physical Description of the Subjects
Subject Age Height Weight Ab body fat, est.
initials yrs. cm kg m 2 %
SAL 24 174 65 1.75 12
SJT 37 188 93 2.15 20
The two subjects represent the extremes in physical type in our staff,
and normally lead quite different lives. From previous studies it was known
that subject SJT prefers cooler environments (below "normal comfort" levels)
and that he possesses unusual sleep habits--often awakening and getting up
for variable lengths of time during the night. SJT shows a tendency toward
weight gain (he had dieted prior to these experiments), although he consumes
only one meal each day (dinner). During the work day his intake is largely
limited to black coffee. This subject smokes approximately 15 cigarettes
per day, and he was allowed to smoke sparingly during the experiments.
The other subject, SAL, is a non-smoker, drinks little coffee,
is extremely thermosensitive, and prefers to sleep late in the morning.
SAL has no weight problem, has never dieted, and frequently consumes
"natural" foods. It was not unusual for this subject to enter an experiment
in a nutritionally depleted state or, at least, with a minimum of carbohydrate
reserves. The fixed metabolism experiment reflected this subject's
dependence upon body fat stores as his fuel source, since his RER was 0.70
averaged over the 24 hours.
13.

METHODS
Experimental Protocol
Although many aspects of the experimental protocol have already
been described, an overall view of how the experiments were conducted
has not been presented. The general protocol and procedures were the
same for all experiments.
The subjects reported to the laboratory approximately one hour
prior to their normal bedtime. During this period personal preparation
was done, e. g. application of ECG electrodes and insertion of the Tre probe.
At the same time the experiment monitor would precondition the chamber
and the WCG system and conduct pre-experiment instrumentation check-out
and calibration. When the subject entered the chamber, his nude weight was
immediately taken and logged, and, unless the experiment was a nude quiet
day routine, the dressing procedure followed. For the nude quiet days,
dressing consisted principally of applying a skin temperature harness.
The only differences in protocol between the nude quiet day experiments
and the suited runs were those aspects concerned with the operation of the suit
calourimeter system. In the suit calorimeter runs, after the nude weight was
taken, the pre-weighed WCG and insulative clothing assembly were donned.
After instrumentation hook-ups were completed, the subjects were again
weighed, fully instrumented and clothed. The elapsed time up to this point
averaged about an hour; the clock time was usually between 2300 and 2400
hours of the first night. Next, the subjects reclined (supine position) upon a
canvas stretcher cot within the chamber. The experiment clock was started
and all data except change in clothed body weight were monitored by an
14.

observer throughout the night. Since the night of sleep was merely an
equilibration period, the data will not be reported here.
Upon awakening in the morning, the subject was weighed. Following
urination and a liquid breakfast, at the succeeding even hour (0800 to 1000
local time) the 24-hour measurement day was started. Every hour on the
hour the subject was weighed. Change in weight each hour was corrected
for intake-output and CO2-02 weight differences and used in calculating
evaporative heat losses for the period. Except during sleep, this procedure
was applied throughout all experiments. Liquid intake and urination were
permitted as desired. Upon awakening after the second night of sleep, or at
the completion of the 24-hour measurement day, following a final clothed and
nude weight measurement, the experiment was terminated.
In the stay awake routine the procedures were very similar, except
that the subjects were not permitted to doze during the day or sleep during the
second night. Since the subjects were awake, their weights were taken hourly
throughout the second night.
During the fixed metabolism day, work was initiated at the beginning
of the 24-hour measurement period. Work, as judged from VO2 , was
continued at a constant rate throughout the day and second night until 24 hours
of activity were completed. As previously stated, the work rate for each
subject was selected to exceed his highest VO2 level during.his preceding
quiet day experiment.
15.
Measurements
The determination of body heat balances required quantification
of both heat production and heat exchange pathways. In the eight experiments
performed, eight general types of measurement were made, and these were
composed of 20 different measurements. All of these variables and their
symbols and derived values are listed in Table 2. Measurement types
numbered 1, 3, 4, 5, 7, and 8 and their specific measurements applied to all
experiments. Obviously type #2 and type #6 pertain only to experiments in
which the WCG was used, and experiments in which measurable external
work was performed, respectively. Sixteen specific measurements were
required for the nude quiet day experiments, in which the heat exchange was
obtained using partitional calorimetry techniques.
The first 11 specific variables listed in the table were automatically
logged at pre-selected time intervals by a specially designed data printing
system. These data points were usually printed every 10 minutes throughout
the experiment. The 16 individual skin temperatures (Tsk) sampled and the
mean skin temperature (Tsk) were printed separately. The hourly presen-
tation of most of the data used in this report represents either totals or
averages of the six individual print cycles per hour. All me asurements
that were not automatically printed wer reorded manually by observers
in an experiment log book. In one of the fixed metabolism runs, the external
work analog signal was recorded on a strip-chart recorder and this record
analyzed by planimetry in order to obtain hourly totals. Heart rate was
manually logged, either from a cardiotachometer reading or by counting
the audio output of an FM radio receiver. A description of the complete
measurement system aiU. thUe iindividual instrui..ent..s LUseU is giv en inl IIe
next section of this report.
16.

Table 2. List of Measurements
Measurement Measurements, Symbol Derived values Symbol
type specific
1. Respiratory oxygen consump- 0V2 heat production; M
exchange tion rate mass of 02 intake m0 2
carbon dioxide VCO 2 mass of CO 2 pro- mCO2production rate duced; respiratory
exchange ratio RERinlet water temp. Twi
2. W. C. G. outlet water temp. Two WCG heat removal Hwmass flow rate of
water ri w
skin temp. Tsk mean skin temp. Tsk3. Body rectal temp. Tre mean body temp.
temperatures auditory canal Tac Itemp.
4. Environmental dry bulb temp. Tdb water vapor pres- PH20conditions wet bulb temp. Twb ( sure; relative hu- %o RH
(chamber) wall temp. Tw midity; radiant & hc + rair velocity Va convective heat
exchange coefficientnude weight Wn evaporative heat loss HEclothed weight Wc
5. Body weight intake weight- Ilf food calories (kcal)change liquid
intake temp. - Tlf body heat loss (gain)liquid to food ±Hlf
output weight- Oururine
6. Work external work W M corrected for W
7. Other physio- heart rate HRlogical data
8. Other temper- ventilating air Tva respiratory and Crfatures temp. facial convective
exchange
17.
INSTRUMENTATION AND EQUIPMENT
The first requisite in performing human calorimetry is the development
of a measuring system capable of continuously monitoring those parameters
needed to obtain the calorimetric picture with a reasonable degree of accuracy
and reliability. We have over a period of several years designed and refined
such a measuring system, which is specific to the generation of physiologically
derived analog signals proportioned to produce the pertinent data in manageable
form. This system is presented in Figure 1 as a block diagram showing the
major components of our suit calorimeter and their interrrelationships.
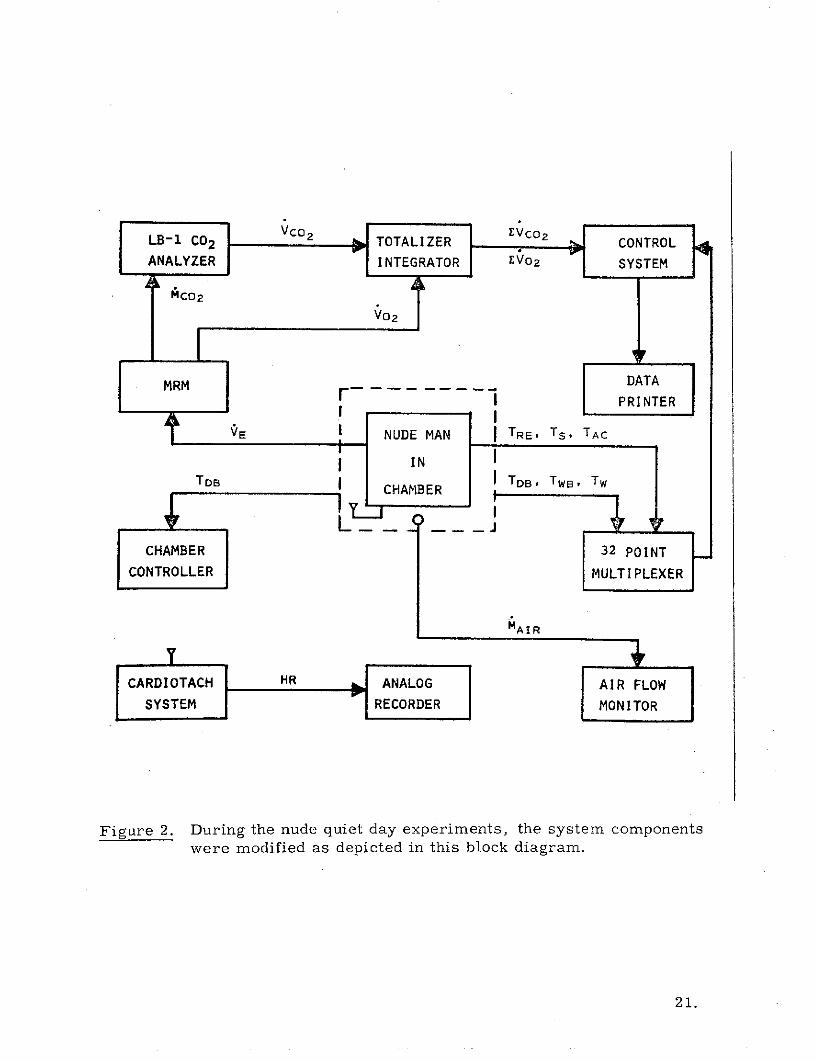
Figure 2 is a second block diagram showing an abbreviated system which was
used only in the nude man partitional calorimetry. These components--that is,
the water cooled suit and associated insulating garments, major control instru-
ments, monitoring equipment, and the environmental chamber--are described
in this section, and an estimation of the total system performance is given.
Indirect Calorimetry
The respiratory gas exchange was monitored continuously for oxygen
consumption and carbon dioxide production. This was accomplished by using
our Metabolic Rate Monitor, or MRM (13) for measuring oxygen consumption,
and a Beckman LB-1, Model 15-A infrared carbon dioxide analyzer for
carbon dioxide production.
Due to the requirement for CO2 analysis, the MRM was modified to
operate with a fixed ventilation rate of 85 liters/min. A fixed volume flow was
necessary to eliminate the possibility of servo tracking errors in the mixed
gas sample used for CO2 analysis. The full-scale range of the MRM in this
mode of operation was limited to a maximum of 1 liter/min, or approximately
18.

twice our expected level of operation. The subject's respiratory exchange
was from the volume of gas that passed over his face, similar to the operation
of a standard MRM. The oxygen sensor, located downstream from the man,
detected the depression in P0 2 from that of room air caused by the subject
and produced an electrical signal that was scaled to be proportional to oxygen
consumption (1 VDC = i liter/min) in standard liters per minute. This analog
signal was then used as an input to a totallizer-integrator (to be described
later in this section) for the purpose of obtaining a total of the oxygen consumed
for a predetermined period.
The analog of carbon dioxide production was obtained by continuously
sampling the MRM ventilation volume for the percentage of carbon dioxide.
The gas was sampled by pumping approximately 200 mi/min through the
Beckman LB-1 analyzer; thereby the increases in carbon dioxide content
could be detected, thus generating an electrical signal proportional to the
percentage of CO 2 . This signal was scaled (1 VDC = 1 liter/min) and used
as the input to a second totallizer-integrator for the purpose of totallizing
carbon dioxide production for a predetermined time period. As a validation,
the analyzer was calibrated using standard calibrating gases (±0.2%) prior
to a total system calibration.
The system calibrations of the MRM and LB-1 employed our standard
dilution technique, where a second gas, usually nitrogen, is metered into a
fixed ventilation volume, and in the case of oxygen, depresses the P0 2 and
simulates a man consuming oxygen. Using this technique, nitrogen was intro-
duced to calibrate the MRM and C02 was introduced for the calibration of the
LB-1. The CO 2 calibration also provided a calibration check on the oxygen
consumption response. This technique has a combined accuracy and repeata-
bility of ± 10 ml, based on the measurement of the dilution volumes. When
19.

Vo 2
TOTALIZER AClTDTVC02 INTEGRATOR
Vo2, 'VCo2, Hw
LB-1 C02 CONTROL DATAANALYZER SYSTEM PRINTER
Aco2 Txx
VEMRM [ 32 POINT
-I MULTIPLEXER
MAN IN T R E T S ' TAC
A WCG ANDTDB' TWB, TW
CLOTHINGTDB I TwII ASSEMBLY
TWI TwTwo
CHAMBER _ WATER LOOP
I CONTROLLER W I 'wo CONTROLLER
ERGOMETER
RECORDER
Figure 1. The block diagram shows the interrelationships of thecomponents of the suit calorimeter system used in theexperiments. Symbols are explained in the text.
20.
ANALYZER INTEGRATO I EI2 SYSTEMMVC02
MRM DATAR I PRINTER
VE NUDE MAN TRE. TS, TAC
INTDB CHAMBER TDB, TWB, TW
L _ _1
CHAMBER 32 POINT
CONTROLLER MULTI PLEXER
MAIR
CARDIOTACH HR ANALOG AIR FLOW
SYSTEM j RECORDER MONITOR
Figure 2. During the nude quiet day experiments, the system components
were modified as depicted in this block diagram.
21.
operated in the.fixed flow mode, the MRM has a predicted random error in
the indicated oxygen consumption of ±3%, whereas the combined inherent
random error of the LB-I is ± 1.5%. Based on repeated calibrations of our
analysis system, the estimated accuracy and repeatability of the indicated
oxygen consumption and carbon dioxide production levels was ±3%.
Direct Calorimetry
Water Cooling Garment.--Probably the most important component of
the suit calorimeter is the water cooling garment. Since good fit is important
and the subjects were very different in size, two individually tailored but
otherwise similar garments were constructed especially for this project.
After starting with commercially purchased dance leotards fabricated of
lightweight stretch nylon, we completed the full coverage garments by adding
gauntlets, stockings, and a head-shaped cap of similar material. To the
inner surface of the full garments a selected number of small silicone rubber
tubes (0.13 cm ID x 0.29 cmOD, JaBar Silicone Corp.) of known length were
sewn. ExcpI for rtention threads, +thei tubes were bare; they were Mani-
folded in groups of six to form five thermal compartments. The same total
number and length of tubes was used in both suits despite the difference in
sizes. This was accomplished by varying the space between tubes and by
making the course of a given tube more or less tortuous. The five individual
compartments were: head, upper torso, arms, hips, and legs. Flow direction
over the limbs was from distal to proximal. Tube density was proportioned
to approximate the underlying muscle mass. The larger distribution tubes
(0.47 cm ID x 0.79 cm OD) were made of polyvinyl chloride (Tygon, Norton Co.)
and were grouped for attachment to their respective inlet or outlet main
manifolds, which wcrcr located over the V wearer's lower abdominal area.
All of the flow in and out of the WCG's passed through these manifolds.
22.

Within each were positioned three matched thermistor beads (Yellow Springs
Instrument Co.) which sensed the inlet and outlet water temperatures
(Twi and Two respectively).
Each WCG was equipped with a full length torso front zipper and limb
zippers for ease of donning. Sixteen small disk thermistors (Y. S. I. #425)
which sensed skin temperature were attached to the inner surface of each WCG.
The individual thermistors were located so that Tsk was area weighted. Also
they were spaced midway between the small tubes to prevent undue direct cooling.
The distribution tubes were positioned to limit countercurrent heat exchange,
hence improving the effectiveness of the WCG. The completed garments
contained approximately 140 cc of water and weighed an average of 3.4 kg
with complete instrumentation. The subjects found these WCG t s extremely
comfortable to wear. The average flow rate used throughout all experiments
was 1.5 liters/min. Some specifications for the garments are given in Table 3.
Insulative clothing assembly. -- To limit thermal exchange between the
man-WCG complex and the environmental chamber in the suit calorimeter
experiments, an insulative clothing assembly was worn. The clothing layers
from the WCG outward were: 1) two-piece flocked cotton athletic warm-up
suit; 2) heavy woolen socks; 3) two-piece down-filled survival (Arctic) suit;
4) down-filled booties; 5) down-filled hood; 6) sheepskin shearling gloves.
All of the body garments were closed with drawstrings, elastic, knitted cuffs,
or Velcro closures to prevent air movement in and out of the clothing during
subject activity. Since the assembly did not include a water impermeable
layer, evaporative losses were allowed to continue normally. The entire
assembly weighed 3.3 kg and any moisture trapped in the layers during the
course of an eperiment was not detected as a weight change. The complete
23.

Table 3.
Descriptive Data for the WCG's Used in This Study
Cooling tubes* Distribution tubes Total WCG
leng. total small WCG large WCG flow propor-
No. tube leng. vol. leng. vol. leng. vol. tionCom- (m) (m) (cc) (m) (cc) (m) (cc) % of totalpartment
head** 12 0.5 6.0 12.7 3.2 60.7 3.2 60.7 23.3
arms 12 1.0 12.0 25.5 3.2 57.1 3.5 61.6 17.5
upperupper 12 1.0 12.0 25.5 1.7 29.3 1.6 27.8 14.4torso
hips 12 1.0 12.0 25.5 1.1 17.7 1.4 24.3 19.2
legs 24 1.0 24.0 50.i 3.5 61.9 3.4 59.2 25.7
The values were the same 'for both WCG's.
The same head cooler was used with both WCG's.
24.

suit calorimeter system, including the MRM mask and motor-blower,
added approximately 7.5 kg to the subject's nude weight.
H w computer. -- Specific to generating an electrical analog of the heat
being removed by the water cooled suit was the measurement of the mass flow
of water through the suit and the temperature difference between the inlet and
the outlet water temperatures. This was performed by a special Hw computer.
The mass flow rate was continuously measured with a turbine flowmeter
(Milliflow model FTM-10-LB, Flow Technology, Inc.), which produced a linear
pulse output over a flow range of 0.5-3.5 liters/min. The accuracy and repeat-
ability was established at ±0.7%, based on timed collections and volumetric
measurements. Temperatures were measured at the main suit manifolds,
which were specifically designed to provide good mixing, using a selected
pair of thermistors (Y. S. I. type #44003) matched to within ±0.020 C. These
thermistors were used as the two active elements of a bridge circuit, the
output of which was an electrical analog of the difference between Two and
Twi, and scaled to produce 1 VDC for each 'C differential. The responses
of the two thermistor probes were electrically phased to reduce the effects
of the suit water circulation time. The electrical output from the bridge
circuit and the flowmeter were then multiplied by an analog circuit
(Equation 1), the output being Hw, where 1 VDC was equal to 1 kcal/min.
This was then used to drive a third totallizer-integrator for totallizing the Hw
for discrete time periods. The Hw computer was calibrated by substituting
precision decade resistors for the matched thermistors and simulating temper-
ature differences over the 0 to 100 C delta while the flowmeter was in operation,
normally at 1.5 liters/min. The output was then calibrated to yield the correct
electrical analog. Tests of the Hw computer with the suit assembly resulted in
a random error of ± 1.5% (7).
25.
Water loop controller. -- Control of the inlet water temperature was
achieved using a proportional setpoint controller (7). The water temperature
was maintained with a pair of servo controlled bypass valves which allowed
a variable fraction of the water from thesuit to be cooled in a 50C water-to-
water heat exchanger, then re-mixed with the uncooled part and returned to the
suit. The water-to-water heat exchanger has a continuous cooling capacity of
12 kcals/min and a peak cooling rate of approximately 16 kcals/min. The 5°C
heat exchanger (PCC-34C, Blue M Corporation) was automatically controlled
to maintain its setpoint temperature.
Water was circulated through the suit and the temperature control
elements by a pump (Gelber, Model 12-41-303) driven by a universal electric
motor and coupled magnetically to the pumphead. The power to the motor
was regulated by a constant current source. Absolute constancy of the flow
rate was not required, since it was continuously measured by the flowmeter
described earlier.
Data Recording System
The physiological parameters that were continuously monitored were
reduced to digital form and printed automatically on a standard electric type-
writer modified to interface with our data conversion system. The data con-
version system is comprised of four basic sub-systems: the data printer, the
32-point multiplexer, the data control system, and the totallizer-integrators.
The data printer (typewriter) has solenoid actuated keys that are made
to function by the data control system, which controls the sequencing of all
data inputs, timing, and clock functions. Interfaced to this system is the3 2 -point multiplexer which selects all data inputs and controls the fields
26,
on the printout format. The multiplexer is designed to connect thermistors
(series 400, Y. S. I.) to an automatic bridge circuit with an accuracy of ±. 1C,
which generates an analog of the temperature being monitored. This analog is
converted to digital form and displayed on a digital voltmeter (Weston #1292)
held and printed in sequence. A secondary data capability is the input of the
totallizer-integrator to the data control system in digital form.
The totallizer-integrator (Acromag #1320, Acromag, Inc.) accepts an
analog DC input signal and produces output pulses at a rate proportional to
the input signal. These pulses are counted on an event counter (Newport model
6200) to produce the integral of the input signal versus time. We have calibrated
our system to produce one pulse for each 10 ml of oxygen consumption, and one
pulse for each 10 small calories of heat removal (hw). They are provided with
zero suppression to prevent noise from being totallized. The resulting accuracy
of these units was determined to be ±.5%.
Bicycle Ergometer
When there was an external work component, a modified Monark
bicycle ergometer was used to produce a continuous analog of the work
component. The modification consisted of the removal of the mechanical
brake (belt) and weighted pendulum from the large wheel. The brake was
then replaced with a generator (Bosch LJ/REG. 180/6/2500L3) with a belt
drive system attached to the rim of the large wheel. A constant current
source was applied to the generator stator and the generator output loaded
with a 1 ohm 50 watt reostat, which was adjusted to provide an analog of a
50 watt load. The bicycle ergometer was then calibrated, using a subject
as the prime mover, and the wattage output of the generator calibrated to
27.

the metabolic activity, using Astrand's calibration procedure (14). The
analog of the wattage was scaled so that 1 VDC was equal to 1 kcal/min
(69.767 watts). This analog was recorded on a Houston model 3000
analog recorder. The estimated repeatability of this calibration technique
was ± 1.5% of the indicated wattage.
Cardiotachometer System
The subject's heart rate was monitored continuously using a Biolink
telemetry system (#368, Biocom, Inc.) and displayed on a Biotachometer
(#4710, Biocom, Inc.).
Weights and Measures
The subject's liquid intake (food) and output (urine) were weighed on
a small 50-lb platform beam scale (model 51TX, Homs) located outside the
chamber. A Fairbanks model 5962 platform balance was located in the chamber
and used to measure the subject's weight. The combined accuracy of the
weighing system was evaluated to be ± 5 gms.
Environmental Chamber
Our environmental chamber is a semi-closed system with inside
dimensions of 2.4m x 2.6m x 2.5m; it has two large windows. The air
circuit is designed to allow new air from the outside environment to be
introduced at a rate of 500 liters/min to reduce the effects of CO 2 buildup;
the mean velocity of the recirculating air is maintained at approximately
35 fpm. Inside temperatures are controlled to within ±0. 10C of the setpoint,
using proportional control techniques. We routinely measured wet bulb (Twh)
and dry bulb (Tdb) temperatures of the chamber air, and three wall tempera-
tures (Tw)--low, mid, and high.
28.

Special Equipment for Nude Man Calorimetry
Figure 2 shows the abbreviated system used for nude man calorimetry.
The obvious components of the total system not included in this diagram are
those related directly to the suit calorimeter, with the exception of the air
velocity monitor (Hastings Precision Air Meter, model B-72), which was
used to determine the velocity profile around the nude man and for estimating
the combined heat losses to the chamber environment during calorimetry.
System Performance Analysis
The performance of the total system was considered with respect to
probable sources of error in the major components. Each component of the
system was analyzed separately, as stated in their descriptions, to determine
whether the probable system error was consistent with the objectives of the
experiments. This consisted of a tabulation of all known sources of error
represented by adjustment and calibration errors, approximations, and
input-output data errors.
In general, random errors are not additive; therefore, using the
square root of the sum of the squares of the individual errors plus the
refinement of cross-correlation functions, the probable error of the system
performance was estimated, using Equation 9:
l (Ael1+ (Ae2)+ (Ae3) 2 ++ (Aen)2 + A12AelZe 2 ++ AlnAelAenprobable 4
Allowing for the peak magnitude of the individual random errors for each sub-
system, the probable error in the total system performance was found to be
±2.4%.
29.

RESULTS
The presentation of the data obtainedin the eight experiments that
comprised this study is divided into two major sections. First we shall
examine the results of the full 24-hour day in terms of the components of
the heat balance equation and associated metabolic aspects. Second, an
analysis of the effects of the four different test routines and the resultant
effects upon circadian rhythms in heat production, thermoregulation, and
body temperature will be presented. The primary time block examined will
be one hour. Because of the limited number of experiments and lack of
repetitions, combined average response data are not given. The effect of
subject variability upon the patterns observed will be discussed. The great
number of data points obtained and the variety of measurements made
make statistical analysis very tempting; however, we have attempted to
avoid this by presenting data in its simplest forms. Rigorous mathematical
analysis of the periodic or cyclic phenomena observed is not warranted.
24-Hour Totals
In the analysis of the full 24-hour measurement day totals, the first
question asked was: did we obtain heat balances in our experiments; were there
matches or mismatches in calculated heat production and heat dissipation?
Was there a storage (S) change in any of the runs? Historically, except for
one questionable experiment, we had always seen balances over 24-hour
periods when a very similar suit calorimeter was used (7). The answer to
these queries is that we did not have balances in all of the experiments in
this series.
30.

Since there was no balance, we jumped to the conclusion that there
must be some error in our measurement systems. Either the direct or the
indirect calorimetry must be high or low. However, our post-experiment
analysis could uncover no errors that were out of line with the quoted system
error. Some hidden equipment malfunction that went undetected during an
experiment was ruled out, since an experiment that did not balance as expected
often was followed by one that did. Because of the automation in data handling,
we usually had an idea whether a heat balance was going to be achieved before
an experiment was completed. Using this foreknowledge, a particularly
thorough effort was made to check measurement systems immediately after
each run. Sometimes minor problems were uncovered, but if they meant
changes in caloric values, the corrections have been included in the final data
presented here. Mistakes in arithmetic were also found and corrected, but
still the mis-matches remained. Was there some logic to the pattern in mis-
matches? Answer: yes, there did seem to be. The possible explanations
and ramifications of this apparent paradox are reserved for the discussion
section of the report. Let us proceed to look at the data.
The 24-hour totals for the individual components of the heat balance
equation for the eight experiments are presented in Table 4. The data are
arranged according to experiment type and listed for each subject. The data
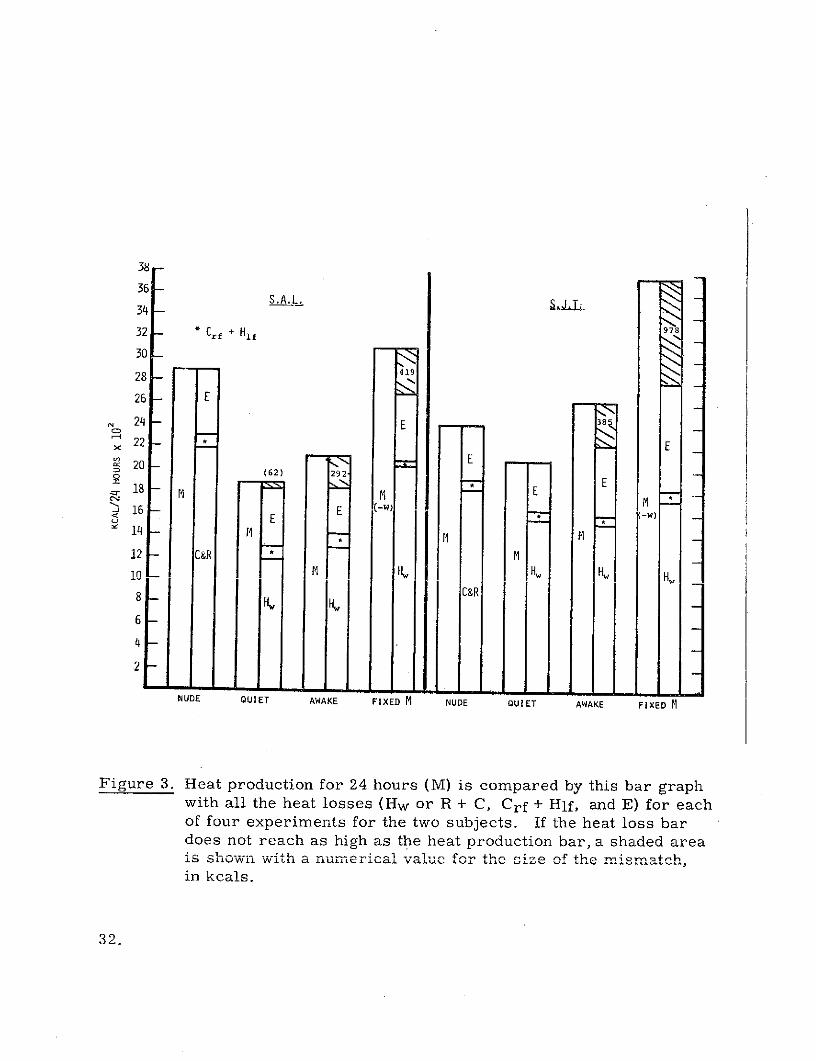
are again presented in histographic form in Figure 3. As is apparent from
both the table and the graph, reasonable heat balances were achieved in both
subjects in the quiet day runs. The 3.3% difference in direct versus indirect
calorimetry in subject SAL may largely be accounted for by the predicted
system error. The storage for the nude quiet day tests, as has been mentioned,
was assumed to be zero. Except for the insignificant difference in the quiet
day run on subject SJT, the storage changes in the suited experiments were.
always positive (increase in body heat content). The magnitude of the storage
31.
38
36
28
26 - E
, 24 E 38
3 22 - * H
S20 -(62) 292
18 M * E E
2 16 E-E
t 14 M M MH.w
8 H wC&R ,
NUDE QUIET AWAKE FIXED M NUDE QUIET AWAKE FIXED M
Figure 3. Heat production for 24 hours (M) is compared by this bar graphwith all the heat losses (Hw or R + C, Crf + Hlf, and E) for eachof four experiments for the two subjects. If the heat loss bardoes not reach as high as the heat production bar, a shaded area
is a1Win WII Inuin Lca.i valuc for t size of the mimatcnh,
in kcals.
32.

S.J.T. S.A.L. I00
APPARENT/ APPARENT90 S , STORAGE zH STORAGE 90
80 80 soo R+C R+C
o70 700 60 60
S50 50
10 10
Crf+ Hf
NUDE QUIET STAY FIXED NUDE QUIET STAY FIXEDQUIET AWAKE M QUIET AWAKE M
Figure 4. The individual heat loss pathways and their totals are plotted
as percentages of M to demonstrate how the subjects lost body
heat in the various experiments. Heat not accounted for isshown as apparent storage.
33.
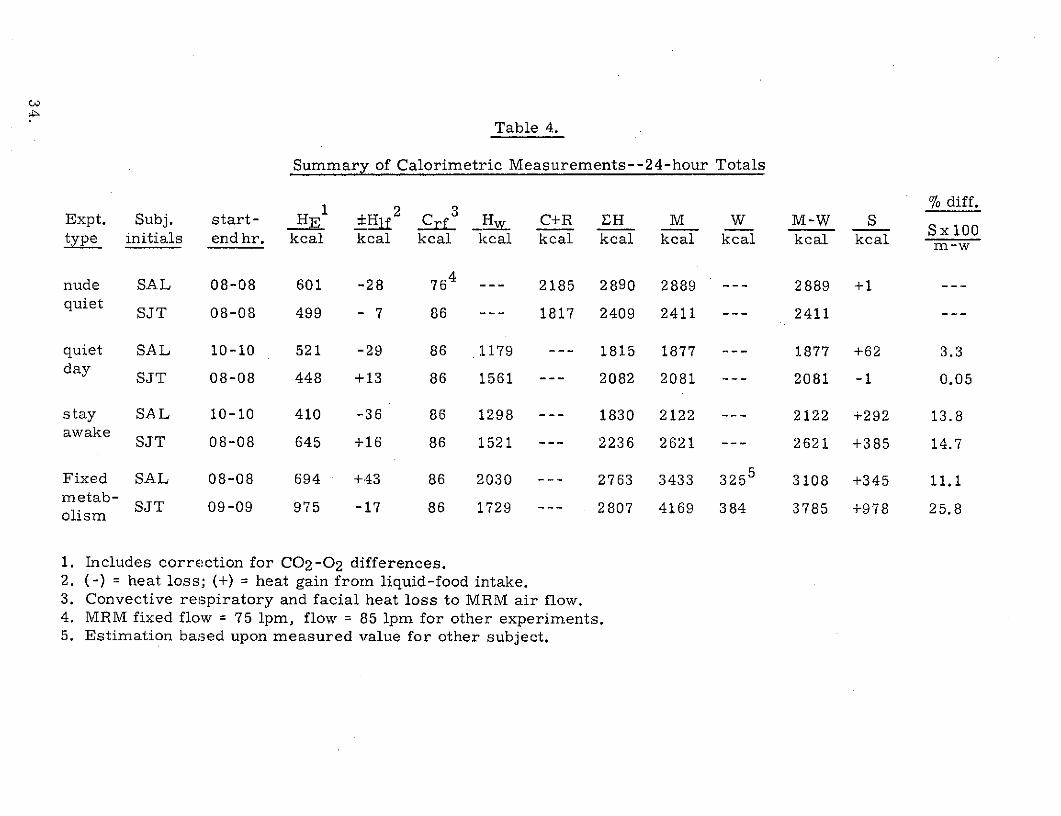
Table 4.
Summary of Calorimetric Measurements--24-hour Totals
% diff.Expt. Subj. start- HE 1 2 Crf _H w C+R EH M W M-W S Sxi00
Sx 100type initials end hr. kcal kcal kcal kcal kcal kcal kcal kcal kcal kcal m-w
nude SAL 08-08 601 -28 764 ---- 2185 2890 2889 --- 2889 +1 ---quiet SJT 08-08 499 - 7 86 --- 1817 2409 2411 --- 2411 ---
quiet SAL 10-10 521 -29 86 1179 --- 1815 1877 --- 1877 +62 3.3day SJT 08-08 448 +13 86 1561 --- 2082 2081 --- 2081 -1 0.05
stay SAL 10-10 410 -36 86 1298 --- 1830 2122 --- 2122 +292 13.8awake SJT 08-08 645 +16 86 1521 --- 2236 2621 --- 2621 +385 14.7
Fixed SAL 08-08 694 +43 86 2030 --- 2763 3433 3255 3108 +345 11.1metab- SJT 09-09 975 -17 86 1729 --- 2807 4169 384 3785 +978 25.8olism
1. Includes correction for C02-0 2 differences.2. (-) = heat loss; (+) = heat gain from liquid-food intake.3. Convective respiratory and facial heat loss to MRM air flow.4. MRM fixed flow = 75 1pm, flow = 85 Ipm for other experiments.5. Estimation based upon measured value for other subject.

Table 5.
Summary of Respiratory Gas Exchange, Fluid Balance, and Food Balance Data
24-Hour Totals
mCO2 liquid urine H2 0 3 food fuelExpt. Subj. V 2 mO2 mCO2 RER -m021 intake H20 2 output balance intake deficit 4
type initials liters liters gmins gms avg. gms gmins gms gms ±gms kcal kcal
nude SAL 590 499 843 977 .84 144 1638 359 1311 -350 1124 1765quiet SJT 488 470 638 921 .96 223 2730 308 3242 -1065 923 1488
quiet SAL 382 349 546 683 .91 137 1116 233 1669 -1218 543 1334day SJT 431 356 616 697 .83 81 2227 249 2531 -827 443 1638
stay SAL 443 346 634 677 .79 43 1143 251 1537 -850 459 1663awake SJT 546 442 780 866 .81 86 3338 313 3175 -636 716 1905
fixedfixmetab- SAL 729 508 1042 996 .70 -46 2953 366 3106 -984 988 2445metab- SJT 862 714 1233 1400 .83 167 3610 503 3755 -1322 1147 3022olism
1. Value used to adjust evaporative loss (HE).2. CHO/fat mixture from RER, protein metabolism based on estimated daily urine urea nitrogen.3. Includes corrected HE losses.4. Deficit = M - If.

had a direct relationship with the magnitude of M--that is, the large AS
occurred when the subjects had no sleep and/or worked continuously for
the day. More about this later.
Except for the presence or absence of the suit calorimeter, the pro-
tocol for the nude and suited quiet day experiments was very similar.
Therefore the depression in M during the suited experiments (shown in the
Figure) probably is significant, since the differences are larger than would
be expected from day to day variation. We feel that the sedating effect must
be associated with the suit calorimeter. The actual reductions amounted to
14% and 35% for subjects SJT and SAL respectively; for subject SAL, M during
the stay awake day in the calorimeter is even lower than during the nude quiet
day.
The external work (W) in the fixed metabolism experiments amounted
to approximately 10% of the total M. The values for subject SJT were measured,
while for SAL they were estimated from V0 2 level, body weight, and the value
measured for the other subject.
When the heat loss pathway quantities are presented as a percentage
of total M, as depicted in Figure 4, the relationship of "apparent" storage
with heat production is obvious. The pathway percentages are plotted
individually (except for Crf and Hlf), not cumulatively. The values for Crf
and Hlf and HE are very similar for both subjects in all of the experiments
and represent approximately 4% and 22% of the total heat loss (EH) respec-
tively. For subject SJT, the R + C loss of the nude quiet day is exactly the
same percentage as the Hw in the quiet day. Since evaporative loss was
permitted in the calorimeter, perhaps this is not surprising. Comparing the
same two experiments for subject SAL, it appears as if the reduction in Hw
in the quiet run is accounted for by the HE and the S.
36.

The 24-hour totals for the respiratory gas exchange and for fluid-
fuel balance data are presented in Table 5. The average RER values ranged
from .70 to .96, with the lower individual run values tending to occur during
the more active days. The type of response may be predicted under the cir-
cumstances of the tests. In all cases except one (fixed metabolism, SAL),the
mCO2 expired exceeded the m0 2 consumed. Using standard calculating
methods, it is easily seen that when RER is less than .73, the weight of 02
consumed will exceed the weight of CO 2 produced. The CO2-02 weight
differences are reflected in the HE values given in Table 4.
Subject fluid balances were always negative for the 24-hour period.
The values ranged from (-)350 gms to (-)1322 gms. Urine output was perhaps
somewhat elevated even during the nude quiet day experiments, particularly
for subject SJT. Some of the increase may have been due to the diuretic
effect of the coffee and/or cocoa consumed by the subjects. Metabolic water
(H2OM) production was in part estimated since the actual protein breakdown
was unknown. However, using subject mass and activity level adjustments
for 24-hour normals in urine urea nitrogen excretion, a small amount of
H20 M was included in the total as .having*come from protein sources.
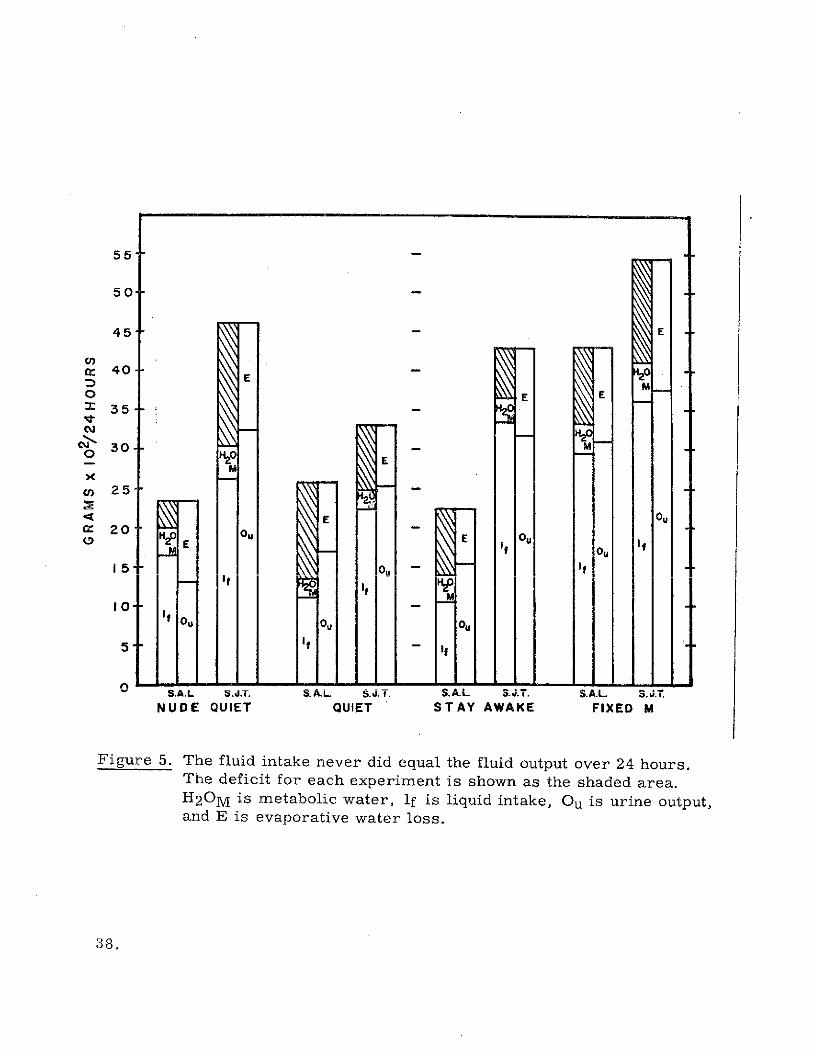
The fluid balance data is presented graphically in Figure 5. As can be seen
in the figure, the liquid intake on the average nearly equalled the urine output
alone. The deficit is shown as the shaded area in the figure.
In none of the experiments did the food calorie intake keep pace with
the metabolic demand. The fuel deficits are also given in Table 5. On the
average, approximately 30%0 of the energy demand was supplied from body
fuel stores. In two runs more than 2400 kcal deficits were incurred. At the
rate of 9.3 kcals/gm of fat, nearly 120 gms of fat breakdown may have occurred.
37.
55
50-
45- E
S40-E M
0 E E: 35",
*4 30-- M3 0 H20 MOE
M
cn 25
: 200 15 E Ou E O If[. ', oO
15 \ I I'If M
10 f Ou Ou - 0,5 If i u
S.A.L S.d.T. S.A.L. S.J.T. S.A.L S.j.T. S.A.L S.J.T.NUDE QUIET QUIET STAY AWAKE FIXED M
Figure 5. The fluid intake never did equal the fluid output over 24 hours.The deficit for each experiment is shown as the shaded area.H20M is metabolic water, if is liquid intake, Ou is urine output,and E is evaporative water loss.
38.

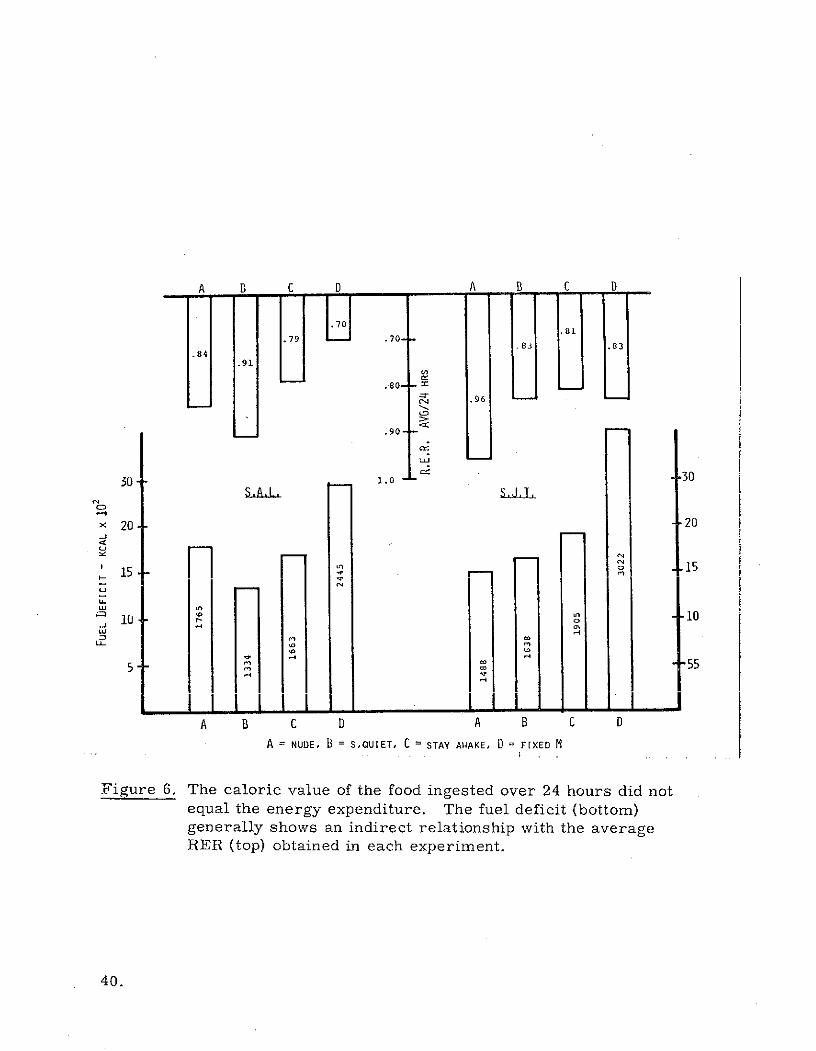
Most of the deficit supply apparently did come from fat, since a good correla-
tion between RER lowering and fuel deficit was shown in the data. This effect
can be seen in Figure 6. The one exception (fixed metabolism, SJT) may have
resulted from a better carbohydrate reserve status at the beginning of the
experiment.
The three principal body temperatures measured--Tre, Tac, and Tsk--
never were very different at the beginning and at the end of an experiment.
The values obtained are given in Table 6. The variation in Tre throughout
the day will be presented in later graphs, but hourly values for Tac and Tsk
will not be presented.. Generally the Tac's followed nicely the Tre in magni-
tude of change and pattern across the day. As would be expected, the response
time of Tac is shorter than that for Tre, and Tac usually ran approximately
0.1-0.20 C below Tre. Mean skin temperatures always ranged between 32 and
35 0 C in both suited and nude runs. Because skin temperatures are extremely
sensitive to environmental factors, it is doubtful if meaningful circadian
patterns are discernable in these experiments. The use of proportionality
equations in calculating Tb and the prediction of changes in S therefrom has
already been discussed. The changes in S based upon Tb changes across
the 24-hour period are also given in Table 6. The calculated values range
from +0.6 to +56.5 kcals for all eight runs. The range results from the use
of the.minimum and maximum weighting coefficients normally quoted in the
literature (see Table 6). The S obtained in this fashion has not been used to
"correct" the S values presented in this report, which are obtained calori-
metrically and are very much larger in several cases. Although the relatively
long test period may justify the use of aZTb, our general distrust of the
quantitative accuracy of this technique will not permit its use as a
"corrector."
39.
A B C D A B C D
.79 .70 1.83 .83
.84.91
.80-
.96
.90--
30 - 1.030
S20 - 20-J
S15 -- 15LiU-
5 1 -55
A B C D A B C D
A = NUDE, B = S,QUIET, C = STAY AWAKE, D = FIXED M
Figure 6. The caloric value of the food ingested over 24 hours did notequal the energy expenditure. The fuel deficit (bottom)generally shows an indirect relationship with the averageRER (top) obtained in each experiment.
40.

Table 6.
Experiment Start-End Body Temperatures
and Estimation of S from Tb
Expt. Subj. Tre Tac Ts Stype initials start end start end start end estimated range
°C 0C C ;C oC oC kcal
nude SAL 36.6 36.6 36.2 36.2 33.4 34.0 +3.2 - +10.7
quiet SJT 36.2 36.6 36.2 36.4 33.2 33.4 +0.6 - +14.7
quiet SAL 36.8 36.8 36.1 36.4 33.2 33.6 +7.1 - +9.4
day SJT 36.7 37.3 36.8 37.3 32.5 33.5 +45.9 - +56.5
stay SAL 37.1 37.3 37.0 37.1 33.8 34.1 +8.9 - +12.5awake SJT 37.3 37.3 37.2 37.2 34.0 33.7 -2.3 - -7.6
fixed SAL 37.0 37.5 36.9 36.5 33.5 33.5 +4.9 - +18.0metab- SJT 27.1 37.7 37.0 37.6 33.4 33.0 +20.8 - +38.6olism
Estimation of storage (S) range based upon following relationships:
Tb = 0.67 Tre + 0.33 T s
Tb = (0.90 Tre2 Tac ) + 0.10 Ts
S= ATb X m x C
41.

Effects of the Suit Calorimeter
One of the objectives of this study was to determine what effect, if
any, the WCG (or the control of the WCG) has on metabolic cycles. In order
to determine the answer to that question one must examine the interrelation-
ships of metabolism, thermoregulation, and body temperature obtained for
the nude quiet and the quiet day runs. The comparative plots for the hourly
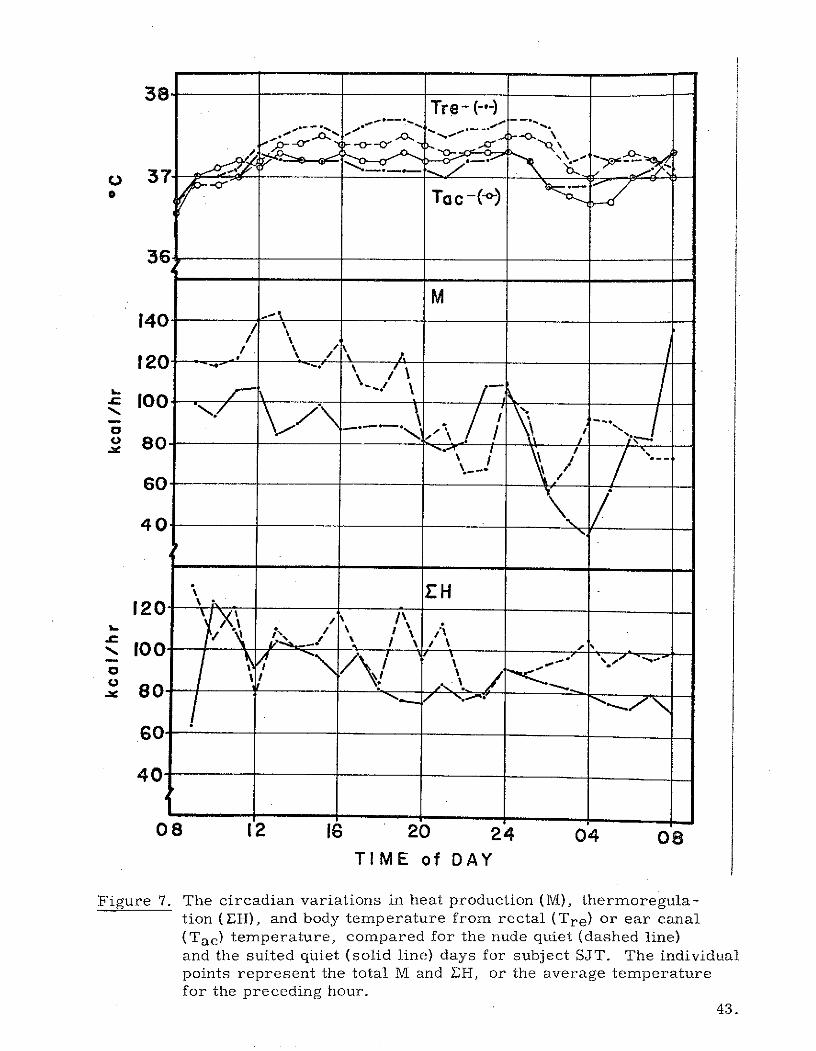
values of EH, M, and Tre for the two subjects are presented in Figures 7
and 8. The most clear effect noticed by examing the figures is that M was
lower for both subjects when the WCG was worn. As previously stated, the
percentage reduction amounts to 35% and 14% for subjects SAL and SJT
respectively. The reduction is most evident during the non-sleeping hours
of the day. In sleep the M differences are not large; however, the heat loss
(EH) remains high in the nude quiet runs. Body temperature as represented
by Tre appears to reflect the increased M when one is nude even though the
heat loss is increased in proportion to M. As already noted, the 24-hour
total M for the stay awake run for subject SAL was lower than his nude run,
even though he had no sleep. Perhaps the chamber was somewhat cool for
this man, hence an increased activity level was stimulated by the desire for
warmth. The subject reported no shivering; however, some 02 demand
may have resulted from increased muscle tension. This subject has rather
a low amount of subcutaneous fat insulaLion.
In addition to the general effect of the WCG on lowering M, the suit
calorimeter tended to reduce diurnal random fluctuations in both M and EH.
In other words, the WCG smooths the hunting aspects in both metabolism and
thermoregulation. The slowly responding Tre is not affected;the WCG has
no effect on its circadian pattern. The midday and midnight peaks in IVI
exhibited by subject SAL (Figure 8) during the suit run may be buried in the
elevated M during the nude experiment. The midnight peak in M is also present
in subject SJT on both nude and suited days.
42.
38Tre- (-*-)
o 370 Tc-(o-
36
M
140 /
1 \ /-- ' -- .. I
o H
1 80"*' I \ /-
so
tion (EH), and body temperature from rectal (Tre) or ear canal
and the suited quiet (solid line) days for subject SJT. The individual
43.
40
08 12 16 20 24 04 08TIME of DAY
Figure 7. The circadian variations in heat production (M), thermoregula-tion (XH), and body temperature from rectal (Tre) or ear canal(Tac) temperature, compared for the nude quiet (dashed line)and the suited quiet (solid line) days for subject SJT. The individualpoints represent the total M and EH, or the average temperaturefor the preceding hour.
43.

Tre -(-. ."_
T2 MI \
37 --------
-0036
160 t
140 - /:/, -! M
120 .
1.: 100
80 -
60
140120
I
100
80 ..... /
60
40
08 12 16 20 24 04 0
TIME of DAY
Figure 8. The same as Figure 7, p. 43, but for subject SAL.
44.
One hypothesis that occurs to us is that the properly controlled WCG
represents an ideal means for the body to lose heat produced without an
energy cost to the process. That is, the amount of energy which would typically
be required by the nude man to operate his thermoregulatory mechanisms is not
needed when he is wearing the WCG.
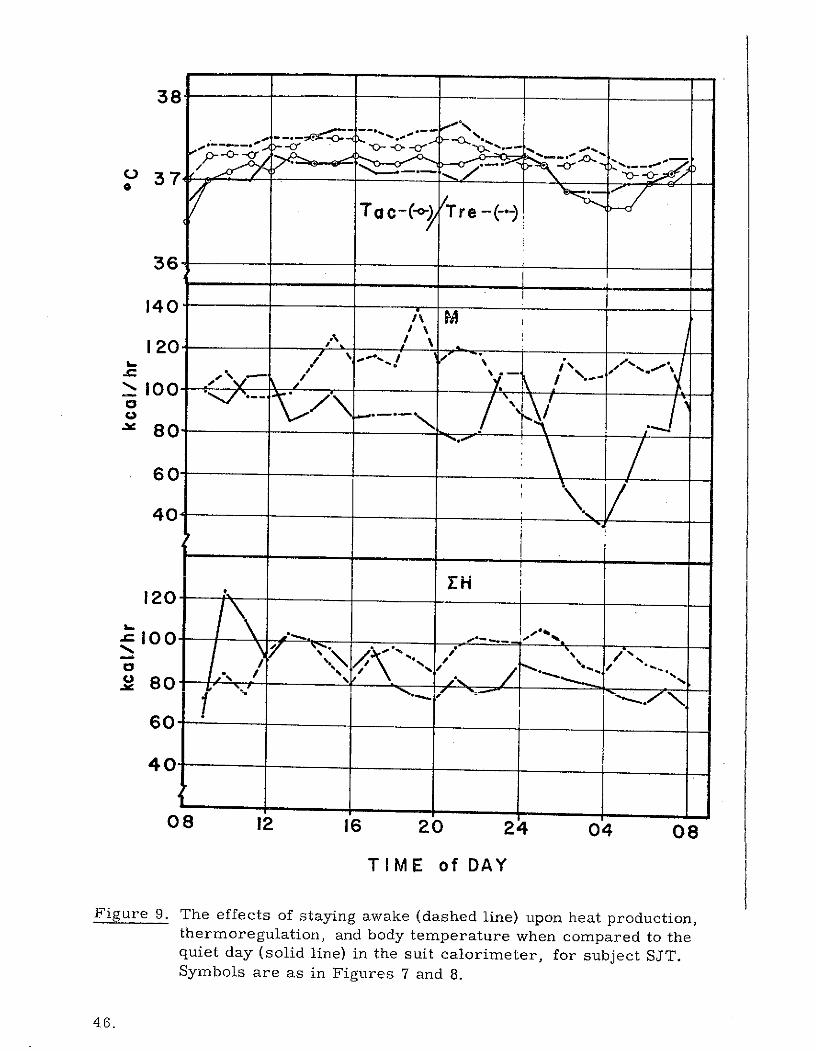
Effects of Sleep
In order to determine the effect of sleep on the three metabolic indicators
of choice (M, EH, and Tre), we can compare the results obtained in the quiet
day and the stay awake tests. The hourly value plots for the 24-hour measure-
ment periods are given in Figures 9 and 10. for subject SJT and subject SAL
respectively. The first and most obvious influence on metabolic patterns
induced by sleeplessness is the elevated M and EH during the night of the
stay awake experiments. It is interesting, however, that although the stay
awake nighttime M is elevated compared to quiet day sleeping, it is neverthe-
less somewhat lower than the daytime average for subject SJT and higher than
the daytime average for subject SAL. The higher daytime M for subject SJT
probably resulted from forced alertness and activity maintained by this sub-
ject with the knowledge that he must not sleep. His natural tendency for
nighttime alertness may have permitted a degree of relaxation not permitted
earlier in the day.
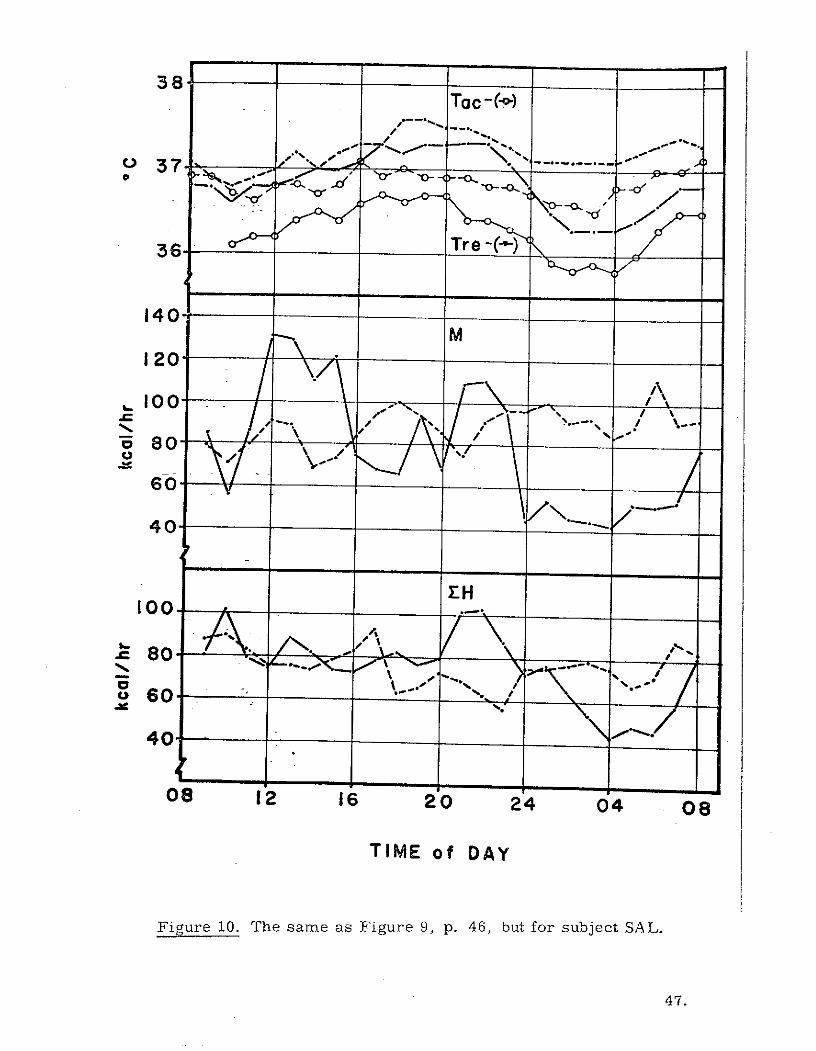
The normal depression of Tre from 2400 to 0400 hours is obviously
lessened by lack of sleep in the stay awake experiments. Tre drops during
the sleeping portion of the quiet day (2400-0400 hours) were 0.4 0 C and 1.0 0 C for
subject SJT and SAL respectively. With no sleep, the Tre drops for the same
period were only 0.1 0 C and 0.3 0 C. It appears as if the circadian pattern
described by Tre is, at least in part, a product of the interplay of M and DH.
Also, Tre tends to follow reversals in magnitudes of M and EH rather
45.
38
S3 .-.
Tac-( .- ) Tre-(-*-),
36
140
" 808 1 6 0 2
I A0
100
80
40
LH I120
80
60
40---
08 12 16 20 24 04 08
TIME of DAY
Figure 9. The effects of staying awake (dashed line) upon heat production,thermoregulation, and body temperature when compared to thequiet day (solid line) in the suit calorimeter, for subject SJT.Symbols are as in Figures 7 and 8.
46.
38To c - (-o0)
o 37
54% -140
120M
100
76 80
60
08 - - /'
08 12 16 20 24 04 08
TIME of DAY
Figure 10. The same as Figure 9, p. 46, but for subject SAL.
47.

faithfully, but its magnitude of change does not relate reliably to the magni-
tudes of changes in M and EH. Tre, therefore, is not a particularly accurate
indicator of body heat content. In this set of experiments,rates of change in
either M or EH seem to dictate Tre change, with slower rates of change showing
little or no effect on Tre. Again referring to figures 9 and 10, it will be seen
that over the same time period (2400-0400), when the subjects had no sleep,
the hourly total heat production exceeds heat loss in all but one hour, even
though Tre does decrease slightly. The pre-bedtime jump in M and EH
observed for both subjects during the quiet day was missing when no sleep
was allowed.
Hypotheses based upon two experiments are indeed tenuous.. However,
doing just that, we hypothesize that circadian patterns in both thermoregulation
and body temperature appear to be largely manifestations of activity level.
Interestingly, Tre defies this conclusion because Tre actually dips during
the sleepless nights even though hourly storage values were almost always
positive.
Effects of Fixed M
By holding M fixed for 24 hours continuously and comparing the impact
of this maneuver with a normal quiet day, one may draw conclusions about
the effect of heat production on cycles in heat loss and body temperature.
Such a comparison is given in Figures 11 and 12 for subject SJT and SAL
respectively.
The first impression obtained by looking at the data is that, despite
the fixed M, the EH and Tre continue to show a normal diurnal pattern, being
elevated only enough to account for the increased heat production. Although
48.

STre -(--)38
- -e -o- -0- - -0- - C
o .-
37 Tac-(-O)
36
160.
140 M
1 20
100
80
60
140TH I
I120
1 00 . . ""
80
60
08 12 16 20 24 04 08
TIME of DAY
Figure 11. The effects of fixed M (dashed lines) upon thermoregulationand body temperature, compared to the quiet (solid line) dayfor subject SJT. Symbols are as in preceding four figures.
49.

T re- -38-
37- -/ ---
140--
120UM
10 30
80
60
40
i40' .\ H - -H
1 1120 -0 v
008o -- --- ;711F -- I-"
6o0
40
08 12 16 20 24 04 08
TIME of DAY
Figure 12. The same as Figure 11, p. 49, but for subject SAL.
50.
EH tends to increase gradually throughout most of the day, it does not keep
pace with heat production. In fact, in one subject (SAL), the EH follows an
elevated but typical nighttime pattern. This picture is also true for this
subject t s Tre. All of this in the face of an apparently increasing heat storage.
The other subject, SJT, shows a rather large atypical jump in nighttime EH,
although it starts to decline prior to the 0900 end of the experiment. Unfortunately,
this subject (SJT) shows a very flat Tre circadian pattern in all of his runs.
Certainly in both men there is no indication in either EH or Tre of the ever
increasing heat storage that is apparent from the data. Obviously, cooling
potential was available to the men via the WCG. With an average AT between
Tsk and Tw of 4 0C, the WCG, in our experience, was capable of removing at
least 1.5 times the highest measured heat production rate. The overnight heat
production during the fixed metabolism day averaged 2.6 times that for the
sleeping portion of the quiet day for both subjects. The EH over the same
period does not keep pace, and averages only 1.7 times the sleep heat loss
rates. Meanwhile the Tre differences at night are not significantly increased
over the daytime differences between the fixed metabolism and the quiet days.
The somewhat random diurnal fluctuations in thermoregulation continued
even though heat production was very constant. Since the WCG parameters
were also stable (Twi and rh), the fluctuations in EH during the fixed metabolism
experiments were not forced. The body's thermoregulatory mechanisms
appear to retain heat or dump heat independently from S changes. Similarly,
Tre may reflect S changes, particularly if the rate of change is relatively
high, but continues to follow an offset circadian rhythm even though body heat
content (S) is ever increasing. This response is not strikingly obvious; however,
the reader may judge for himself by studying Figures 13 and 14 in which Tre
versus S values are plotted hourly for subject SJT and SAL respectively.
51.

80 - _FIXED M
80" -- 0
40 -
0 -4o co4
: _STAY AWAKE
40 /.../\ '0o.5
oQUIE
-40
- ".,. . . S.
.-. ----.---- s ' .
L 40 QUIET
NUDE QUIET
40-40I -.-----
0 4 8 12 16 20 24
HOURS
Figure 13. This graph compares the hourly changes in Tre (dashed line)and storage (S), (solid line), for subject SJT in the four differentexperiment routines. Note that the S values are not cumulative.Tre may follow the direction of S, hour by hour, but it does notrise steadily in those long periods when S is continually positive'and thus accumulates to a high storage level.
52.52.

FIXED M .5
0 V
.5
-- ,% ,.S" STAY AWAKE
o 40 / " '
o
w --40
- I .- -. 5. o
4- ... QUIET
840 2 620 2
-40
- NUDE QUIET I-
40
-40 -0 4 8 12 16 20 24
HOURS
Figure 14. The same as Figure 13, p. 52, but for subject SAL.
53.

Summary of Results
In summary, the following basic findings were made in this study:
1. An energy imbalance results when subjects remain awake or work
continuously for 24 hours.
2. The amount of the imbalance appears to be directly related to activity
level as well as to fuel intake deficits.
3. Body temperature, as indicated by Tre and Tac, does not reflect
these imbalances.
4. The WCG tends to lower metabolism and smooth thermoregulatory
fluctuations without destroying circadian patterns. It is possible that
the WCG may lower metabolism by reducing the energy cost of
thermoregulation.
.5 .ta-in awake endz ± dm ILIa g ilmUaiude of iiocurnal change in
metabolism, thermoregulation, and body temperature without
obliterating circadian rhythms.
6. When metabolism is elevated and fixed for a complete day, circadian
variations in thermoregulatory responses and body temperature
continue to be faintly visible.
54.

DISCUSSION
One purpose of the study was to see whether wearing the water
cooled garment as a calorimeter alters the normal responses of a subject
in some way. The answer seems to be yes. Both subjects in this study were
quieter, metabolically, wearing the suit than without it. This was shown in
Figures 7 and 8, in which both metabolic level and heat loss level were lower
and less variable in the quiet day (in the suit) than during the nude quiet day.
Along the same lines, in an earlier study (7) the same quiet day (in the suit)
procedure on two different men had shown that their heat production and heat
loss levels were phenomenally low--a daily metabolic turnover of only 1440 kcals.
Another purpose was to verify that the circadian cycles in M, EH, and
Tre that had been seen in the earlier study (8) would be found in the two new
subjects of the present study. They were, even though certain individualities
are evident, like the low variability of SJTts Tre curve.
The part of this study that was meant to modify circadian cycles of M,
EH, and Tre seemed to show that changing activity patterns--sleepless nights,
or continual work--not only produced the obligatory changes in M, but modified
EH and Tre patterns as well. When the subjects stayed awake for 24 hours,
the usual nocturnal fall in M was lessened, and the corresponding falls in EH
and Tre were much reduced, although not eliminated. Thus it seems fair to
say that activity is the important driver of these circadian rhythms, or,
conversely, that circadian cycles in EH and Tre are largely determined by
man's usual pattern of high M during the day and low M at night.
55.

So much for what we set out to show experimentally. As always,
however, something unexpected occurred, which is at least as interesting
as the results we expected. This was the observation that although heat
balances were again nearly perfect for the quiet day procedure, they seemed
to be enormously in error in both the stay awake and the fixed metabolism
procedures.
The imbalance was always in the direction of much more energy
being released from fuel (as evidenced by oxygen consumption and CO 2
production) than could be accounted for as heat loss in the calorimeter.
The first reaction to this was that there must be something wrong with
our methods. We are always critical of our own techniques, and compulsive
about calibrating and recalibrating. A series of searching critiques and re-
checks of equipment failed to provide evidence of measurement error
of any real significance.
Considering that the most likely error in indirect calorimetry might
have been the VO 2 measurement, we back-calculated that the instrument
error would have had to be approximately 140 cc/min or 23.5%. No such
error was found in the post-experiment calibration check. This held true
for all the experiments of the series in which positive energy balances were
obtained. It must also be remembered that both the subjects and the experi-
mentors were experienced in the measurement of V0 2 and the assessment
of exercise levels. Subject SJT normally averages approximately 350 cc/min
VO2 when seated quietly. Judging from the external work measured in his
fixed metabolism experiment, he was well above this level of V' 2 ; certainly
he was very close to the 600 cc/min target value, Why then the large imbal-
ance in some of the experiments? Perhaps instead of error in measurement
there was something wrong with our expectations.
56.
Another explanation was eliminated by the following argument.
If the imbalance were actually heat storage, but our many temperature
sensors somehow were in the wrong places to discover it, then how hot
should the subjects have become? To take the most dramatic case,.
subject SJT in his fixed metabolism run apparently stored 978kcals.
His body weight is 93 kg, so his mean body temperature should have risen
by 978/(93x0.83) = 12.670 C. It is hard to believe either that the skin probes,
rectal probe, and ear canal probe missed detecting such a change, or that
SJT would have been comfortable with a mean body temperature of, let's say,
470 C. The other possibility is that the "heat" was stored in some out-of-the
way corner, some distance from the temperature probes. This idea fails to
convince when numbers are used. Suppose this remote body mass has a high
specific heat--say 1.0, equal to water. And suppose it is as large a mass as
skeletal bone, about 15% of the total mass. In our example of 93 kg SJT and
the 978kcals, his skeletal mass is about 14kg, and its final temperature rise
would have been 978/(14x 1) = 69.860 C. Assuming an average initial tempera-
ture of 36 0 C, his final average skeletal temperature would have had to be
105.860 C. The final temperature would have had to be even higher in any
single organ, like the liver or the spleen.
So if the "storage" is not heat, then what sort of energy imbalance
can we be dealing with? We can only speculate. In general, there are
exothermic and endothermic processes, both in chemical reactions and in
thermodynamic events. Oxidation of fuels releases "free energy," but that
energy does not always have to appear as heat, even after allowing for
external mechanical work. Can the body store significant quantities of
potential energy, such as ATP or other energy-rich material? Our reading
suggests such storage is not large enough to account for what we observed.
Is the classical heat balance equation (Eq. 4, p. 10) good only under certain
circumstances?
57.

After we had erected as many hypotheses as the number of man-hours
we spent arguing (and that was more than a few), our present guess is that the
deficits in caloric intake in our experiments, which roughly correlate with the
imbalances, might be the cause of those imbalances. The idea led us to look
back over our own earlier studies in the days before we called the water cooled
garment a calorimeter. In many previous experiments (4), we had regularly
seen heat production exceed heat loss during 1-hour and 2-hour exercise periods.
Since no food was taken during those experiments, a fuel intake deficit was
present, meaning that fuel from body stores had to be mobilized.
In addition to reviewing our old experiments, we examined early
calorimetry data searching for similar imbalances when subjects were active
during a 24-hour measurement period. Fortunately we were able to obtain a
copy of Atwater and Benedict's respiration calorimeter study, published in 1903
(15). The 55 experiments reported represent a monumental effort involving a
high degree of complexity. When groups of similar experiments were averaged,
good energy balances were obtained. However, in one series of experiments
involving work (bicycle ergometer) and lasting at least 24 hours, where the
diet (largely fat) was also deficient, as was ours, imbalances occurred.
The energy estimated indirectly exceeded that measured directly; hence
energy storage in some form must have occurred. It could not be accounted
for by changes in body temperature. In one case the mis-match amounted
to nearly 670 kcals over 24 hours. Considering the similarities with our stay
awake and fixed metabolism experiments, their results are very interesting.
This hypothesis is easy enough to test. Experiments similar to those
reported here could be carried out, but with food intake carefully matched
to energy expenditure. Also, experiments could be done where food intake
58.

exceeded energy expenditure. In the first case, there should be little or no
imbalance, and in the second, if an imbalance appeared, it should be one
showing greater heat loss than heat production. Such experiments would
do much to enlarge our knowledge of metabolic processes and nutrition.
REFERENCES
1. Billingham, John. Heat exchange between man and his environment on
the surface of the moon. J. Brit. Interplanetary Soc. 17:297-300, 1959.
2. Nunneley, Sarah A. Water cooled garments: a review. Space Life
Sciences 2: 335-360, 1970.
3. Webb, Paul; and Annis, James F. Bio-thermal responses to varied work
programs in men kept thermally neutral by water cooled clothing.
NASA CR-739. National Aeronautics and Space Administration,Washington, D. C. , 1967.
4. Webb, Paul; Annis, James F.; and Troutman, Samuel J., Jr. Automatic
control of water cooling in space suits. NASA CR-1085. National
Aeronautics and Space Administration, Washington, D. C., 1968.
5. Webb, Paul; Troutman, Samuel J. , Jr.; and Annis, James F. Automatic
cooling in water-cooled space suits. Aerospace Med. 41:269-277, 1970.
6. Troutman, Samuel J. , Jr.; and Webb, Paul. Automatic control of water
cooled suits from differential temperature measurements. NASA CR-
86244. National Aeronautics and Space Administration, Washington,
D.C., 1969.
7. Webb, Paul; Annis, James F.; and Troutman, Samuel J. , Jr. Humancalorimetry with a water-cooled garment. J. Appl. Physiol. 32: 412-
418, 1972.
8. Webb, Paul. Metabolic heat balance data for 24-hour periods.Inter. J. Biometeor. 15: 151-155, 1971.
9. Gagge, A. P.; and Hardy, J. D. Thermal radiation exchange of the human
by partitional calorimetry. J. Appl. Physiol. 23: 248-258, 1967.
59.

10. Webb, Paul; and Annis, James F.; Cooling required to suppress sweatingduring work. J. Appl. Physiol. 25: 489-493, 1968.
11. Bligh, John; and Johnson, K. G. Glossary of terms for thermal physiology.J. Appl. Physiol. 35: 941-961, 1973.
12. Kerslake, D. McK. The Stress of Hot Environments. CambridgeUniversity Press, 1972.
13. Webb, Paul; and Troutman, Samuel J. , Jr. An instrument for continuousmeasurement of oxygen consumption. J. Appl. Physiol. 28: 867-871, 1970.
14. Astrand, Per-Olof. Work tests with the bicycle ergometer. (pamphlet)Monark-Crescent AB, Varberg, Sweden.
15. Atwater, W. O.; and Benedict, F. G. Experiments on the metabolism ofmatter and energy in the human body. U. S. Dept. of Agriculture,Office of Experiment Stations, Bulletin No. 136, 1903.
60.