Embed Size (px)
Citation preview
39899 Balentine Dr., Suite 200 | Newark, CA 94560 | 510.579.9174 | www.coronaenv.com
Coachella Valley Water District: Improvement District 8: Full-Scale Stannous Chloride Demonstration Results
Technical Memorandum
August 29, 2018
Prepared by Corona Environmental Consulting, LLC
CVWD Full-Scale Stannous Chloride Demonstration Results Page | i
Table of Contents Introduction ............................................................................................................................................ 1 Background ............................................................................................................................................. 2 Water Quality Objectives ......................................................................................................................... 2 Experimental Approach ........................................................................................................................... 3
Demonstration Objectives ................................................................................................................ 3 Objective 1: Demonstrate full-scale efficacy of stannous application followed by chlorination to achieve the water quality objectives at the compliance points .................................................... 3 Objective 2: Inform the fate of Sn, Cr(VI), and Cr from well head application through the distribution system ..................................................................................................................... 4 Objective 3: Confirm applied stannous dose ................................................................................ 7 Objective 4: Inform stannous stock solution efficacy over time in field storage conditions .......... 8
Sample Locations ............................................................................................................................. 8 Results ..................................................................................................................................................... 9
Objective 1: Demonstrate full-scale efficacy of stannous application followed by chlorination to achieve the water quality objectives at the compliance points .................................................. 10 Objective 2: Inform the fate of Sn, Cr(VI), and Cr from well head application through the distribution system ................................................................................................................... 13 Objective 3: Confirm applied stannous dose .............................................................................. 25 Objective 4: Inform stannous stock solution efficacy over time in field storage conditions ........ 26
Summary and Recommendations .......................................................................................................... 27 Important considerations for other utilities .................................................................................... 27
Sole supplier ............................................................................................................................. 27 Issues with dilution of stannous ................................................................................................ 27 Base preservation ..................................................................................................................... 27 Cold sensitivity .......................................................................................................................... 27
Conclusions ........................................................................................................................................... 28 Next steps ...................................................................................................................................... 28
CVWD Full-Scale Stannous Chloride Demonstration Results Page | ii
List of Figures Figure 1 ID-8 system map with sampling locations ...................................................................... 2
Figure 2 Map of the main flush location ..................................................................................... 5
Figure 3 Pilot unit set up for flush experiment sampling ............................................................. 6
Figure 4 Vacuum filtration of flush samples ................................................................................ 6
Figure 5 Solubility diagram for tin species ................................................................................... 8
Figure 6 CVWD full-scale demonstration timeline ..................................................................... 10
Figure 7 Total Sn downstream of each well during Sn feed ....................................................... 11
Figure 8 Cr(VI) downstream of each well prior to and during Sn feed ........................................ 12
Figure 9 Total Cr downstream of each well prior to and during Sn feed .................................... 12
Figure 10 Turbidity downstream of each well prior to and during Sn feed................................. 13
Figure 11 Time series of total Sn throughout the ID-8 distribution system ................................ 14
Figure 12 Total Sn box plot by sampling location during and post Sn feed ................................. 15
Figure 13 Time series of Cr(VI) throughout the ID-8 distribution system ................................... 16
Figure 14 Time series of total chromium throughout the ID-8 distribution system .................... 17
Figure 15 Total chromium box plot by sampling location during and post Sn feed .................... 17
Figure 16 Time series of free chlorine throughout the ID-8 distribution system ........................ 18
Figure 17 Turbidity box plot by sampling location during and post Sn feed ............................... 19
Figure 18 Total tin for pre-stannous and stannous flush experiments ....................................... 20
Figure 19 Cr(VI) for pre-stannous and stannous flush experiments ........................................... 21
Figure 20 Total chromium for pre-stannous and stannous flush experiments ........................... 21
Figure 21 Total iron for pre-stannous and stannous flush experiments ..................................... 22
Figure 22 Turbidity for pre-stannous and stannous flush experiments ..................................... 22
Figure 23 Storage tank 3602 draining results ............................................................................ 23
Figure 24 Storage tank 4711 draining results ............................................................................ 23
Figure 25 Total Sn and Cr concentrations found in various sections of the pipe via ICP-MS. ....... 24
Figure 26 SEM and EDS mapping of outer layer scale from ID-8 pipe sample. ............................ 25
Figure 25 Comparison of base and acid preserved tin samples ................................................. 25
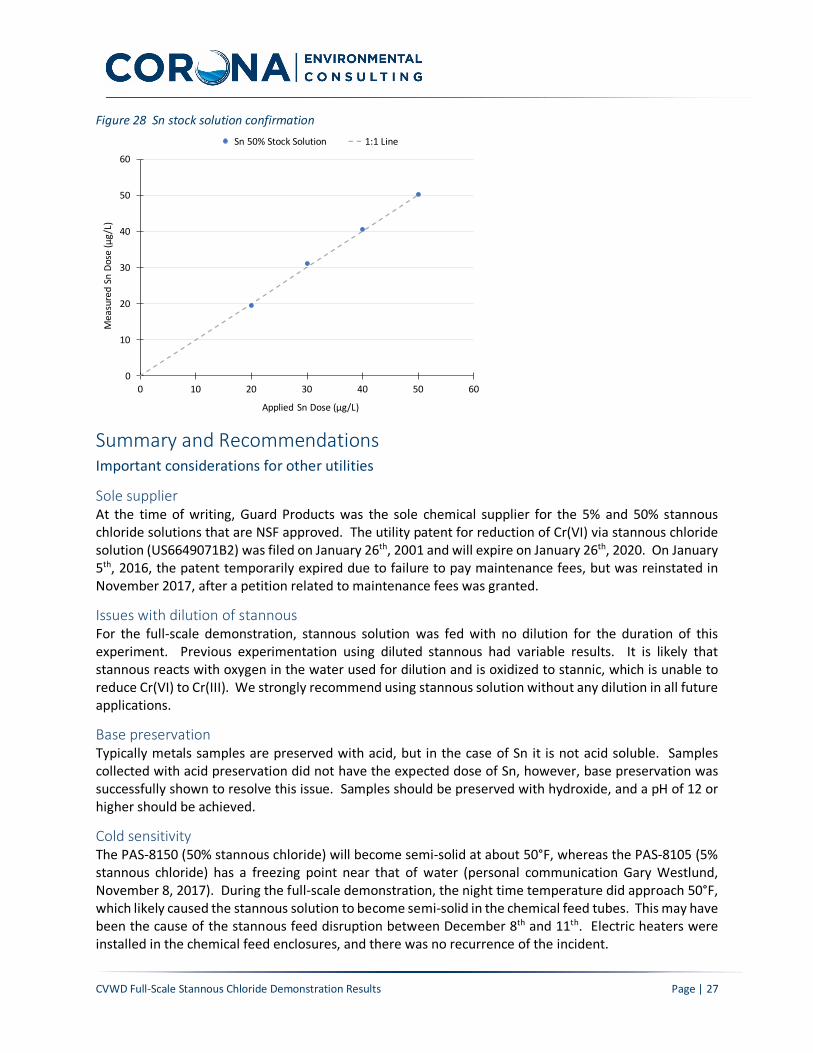
Figure 26 Sn stock solution confirmation .................................................................................. 27
CVWD Full-Scale Stannous Chloride Demonstration Results Page | iii
List of Tables Table 1 ID-8 system well production and Cr(VI) concentration summary .................................... 2
Table 2 Water quality objectives................................................................................................. 3
Table 3 Sample locations ............................................................................................................ 9
Table 4 Comparison of average measured vs. applied tin.......................................................... 26
CVWD Full-Scale Stannous Chloride Demonstration Results Page | 1
Introduction The Coachella Valley Water District (CVWD) has over 30 wells requiring treatment to comply with the remanded hexavalent chromium [Cr(VI)] MCL of 10 µg/L. Research has shown stannous chloride (SnCl2) is an effective reductant, converting Cr(VI) to trivalent chromium (Cr(III)). For use in drinking water, stannous chloride products must be certified to NSF Standard 60 which has a maximum use limit (MUL) of 0.63 mg/L as Sn for this chemical. Unlike other reductants, such as ferrous iron, it is not associated with aesthetic issues or limited by a Secondary MCL.
As an alternative to the traditional treatment approaches, stannous chloride can be used as a reductant to reduce Cr(VI) to Cr(III) to levels below the remanded 10 µg/L Cr(VI) MCL. Proposition 50-funded research demonstrated with an online Cr(VI) analyzer that stannous-facilitated chromium reduction is rapid, with complete reduction from Cr(VI) to Cr(III) occurring prior to the first sample time of six minutes1. The application of chlorine to a stannous treated sample showed that Cr(VI) remained below the remanded MCL of 10 µg/L for 120 hours, which was the duration of the experiment. Near complete reduction was also observed in a full-scale reduction coagulation filtration demonstration test for the Soquel Creek Water District. In this instance, all Cr(VI) samples collected immediately downstream of stannous injection were reported as non-detect2. Application of chlorine did result in increased Cr(VI), but all samples remained less than half of the original Cr(VI) concentration for the 22-minute duration of the experiment.
CVWD, in conjunction with Corona, performed comprehensive laboratory testing using water from ID-8’s Well 3408-1. Part of this testing included a study designed to investigate the potential for re-oxidation of Cr(III) to Cr(VI) in the presence of chlorine following stannous-facilitated chromium reduction. This phase of work is summarized in a Technical Memorandum titled Hexavalent Chromium Reoxidation Study, dated June 23, 2017. Results from these tests confirmed stannous chloride is an effective Cr(VI) reductant and doses greater than 0.3 mg/L-Sn maintained Cr(VI) below the remanded 10 µg/L MCL for a 15-day period. This study also showed that the rate of re-oxidation of Cr(III) to Cr(VI) is governed by the stannous dose and independent of chlorine doses up to 1.5 mg/L.
As a next step, CVWD conducted a full-scale demonstration using stannous chloride to achieve compliance with the remanded 10 µg/L Cr(VI) MCL at entry points to the ID-8 system. For this approach, three of the four wells (3408-1, 3409-2, and 3410-1) were equipped with stannous chloride feed facilities and supplied all water to the ID-8 system. The fourth well (3405-1) was not used during the demonstration. The chlorine was dosed at routine levels, after stannous chloride injection, to achieve detectable chlorine residuals throughout the distribution system which achieves average system levels of 0.3 mg/L and was also dosed at elevated levels close to 1.0 mg/L used at times in the distribution system. Flushing and tank draining were also conducted to determine if there was any accumulation of total tin (Sn) or total chromium (Cr) in the distribution system during the test period.
1 Gorman, C.; Seidel, C.; Henrie, T.; Plummer, S.; Townsend, E.B.; Samson, C.; Shimabuku, K., 2017. Strong Base Anion Exchange Treatment and Brine Minimization for Hexavalent Chromium Removal. California Water Service, Willows Proposition 50, Chapter 6(b), Grant Number P50-1110002-290.
2 Plummer, S., 2017. Ongoing Pilot Testing of Stannous Chloride to Meet Cr(VI) Compliance. CA-NV AWWA Annual Spring Conference. Anaheim, CA.
CVWD Full-Scale Stannous Chloride Demonstration Results Page | 2
Background CVWD operates an isolated distribution system identified as Improvement District No. 8 [ID-8, (PWSID CA3310048)] which is comprised of 4 wells. All 4 of the wells have Cr(VI) concentration over the MCL with water quality and site constraints making treatment cost prohibitive with approaches such as strong and weak base anion exchange and reduction coagulation filtration. The Cr(VI) concentrations of the ID-8 wells are listed in Table 1, along with production information.
Table 1 ID-8 system well production and Cr(VI) concentration summary
Well ID Design
Capacity (gpm)
Pump Test Capacity
(gpm) Utilization
Cr(VI) range 2012-2017
(µg/L)
Cr(VI) average 2012-2017
(µg/L) 3405-11 1500 940 52% 11-14 13
3408-1 1500 1493 43% 19-20 20
3409-2 1500 1860 26% 15-24 21
3410-1 2000 1975 32% 14-16 15 1 Well 3405-1 was inactivated on April 13, 2018.
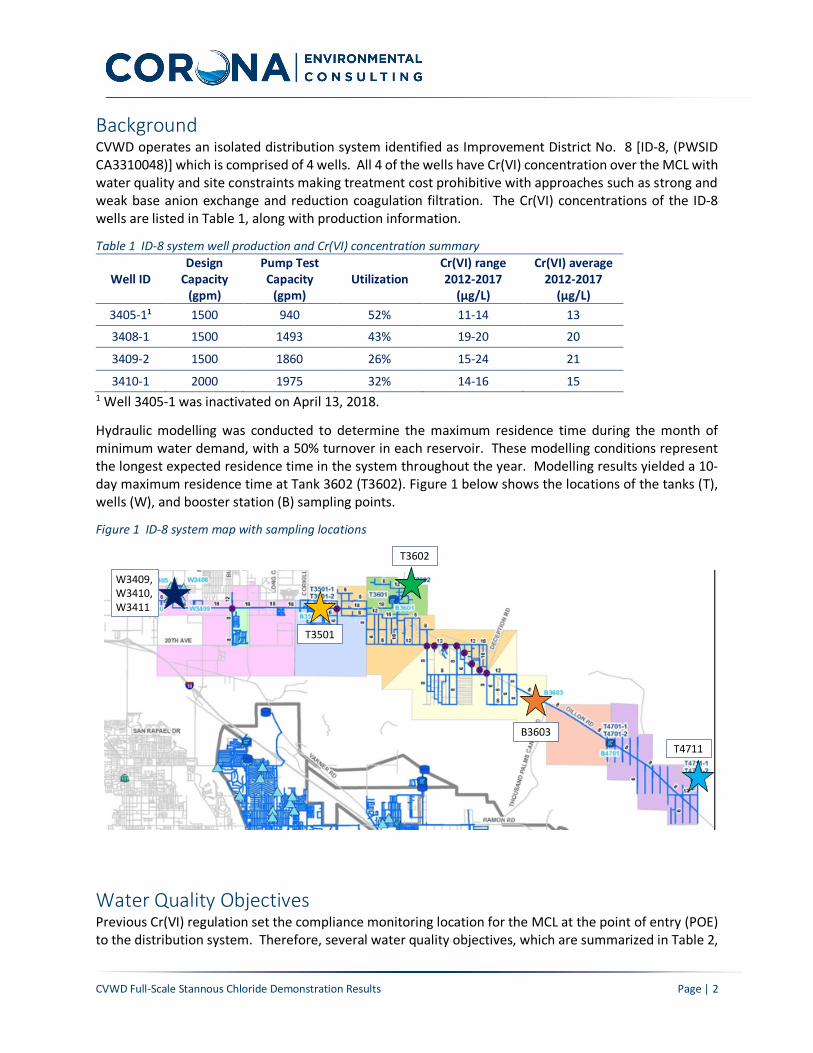
Hydraulic modelling was conducted to determine the maximum residence time during the month of minimum water demand, with a 50% turnover in each reservoir. These modelling conditions represent the longest expected residence time in the system throughout the year. Modelling results yielded a 10-day maximum residence time at Tank 3602 (T3602). Figure 1 below shows the locations of the tanks (T), wells (W), and booster station (B) sampling points.
Figure 1 ID-8 system map with sampling locations
Water Quality Objectives Previous Cr(VI) regulation set the compliance monitoring location for the MCL at the point of entry (POE) to the distribution system. Therefore, several water quality objectives, which are summarized in Table 2,
W3409,W3410,W3411
T3501
T3602
B3603T4711
CVWD Full-Scale Stannous Chloride Demonstration Results Page | 3
must be achieved at the POE(s). The previous Cr(VI) MCL of 10 µg/L, remanded on September 11, 2017, was selected as the Cr(VI) water quality goal. Total chromium and turbidity water quality goals were selected based on California’s 50 µg/L MCL and 5 NTU SMCL for these parameters, respectively. The water quality goal for total tin was established as 0.63 mg/L-Sn based on the NSF Standard 60 MUL.
In addition to testing this treatment method at the compliance points, this demonstration is a proactive investigation to evaluate water quality conditions within the distribution system. This full-scale demonstration assessed the extent to which Cr(VI) is reduced to Cr(III) by stannous and the extent of re-oxidation in the distribution system once chlorine is applied. As stated earlier, the fate of Sn [including stannous (Sn2+) and stannic (Sn4+)] and Cr in the ID-8 distribution system was also investigated to determine if any unintended consequences of stannous application, such as chromium accumulation in the distribution system, might occur.
Table 2 Water quality objectives Parameter Test objective Location Reason
Cr(VI) Less than or equal to 10 µg/L
POE at Wells 3408-1, 3409-2, and 3410-1
Remanded Cr(VI) MCL of 10 µg/L California Code of Regulations Title 22 §64431
Total Cr Less than or equal to 50 µg/L
POE at Wells 3408-1, 3409-2, and 3410-1
Total Cr MCL of 50 µg/L California Code of Regulations Title 22 §64431
Turbidity Less than or equal to 5 NTU
POE at Well s 3408-1, 3409-2, and 3410-1
Secondary MCL of 5 NTU California Code of Regulations Title 22 §64449
Sn Less than 0.63 mg/L as Sn
POE at Wells 3408-1, 3409-2, and 3410-1 NSF Standard 60 MUL
Experimental Approach Demonstration Objectives
Four specific objectives of the full-scale demonstration were developed and are provided below.
1. Demonstrate full-scale efficacy of stannous application followed by chlorination to achieve the water quality objectives at the compliance points
2. Inform the fate of Sn, Cr(VI), and Cr from the point of application at the well head through the distribution system
3. Confirm applied stannous dose 4. Inform stannous stock solution efficacy over time in field storage conditions
Objective 1: Demonstrate full-scale efficacy of stannous application followed by chlorination to achieve the water quality objectives at the compliance points Prior to starting the stannous feed, baseline data was collected for 3 weeks at the point of entry (post-treatment) of each well for the following parameters: Cr(VI), Cr, total metals, total Sn, pH, color, chlorine residual, turbidity, temperature, Langelier Saturation Index (LSI), and Aggressive Index (AI) to establish initial system conditions.
Once a baseline was established, stannous chloride was fed at each well location at an applied dose of 0.5 mg/L-Sn. The observation period was originally scheduled for 6 weeks but was extended to 10 weeks. During the 10-week stannous chloride feed test, the same water quality parameters from the baseline testing were collected at the POEs for each test condition, as specified below in Table 3. The water quality
CVWD Full-Scale Stannous Chloride Demonstration Results Page | 4
results at the POEs were then compared with the established water quality objectives and baseline data collected for these same locations.
The same water quality sampling protocol was repeated once the stannous feed was turned off following the 10-week observation period to evaluate how long tin and decreased chromium concentrations remained present at the same locations.
Objective 2: Inform the fate of Sn, Cr(VI), and Cr from well head application through the distribution system Evaluating the fate of Sn, Cr(VI), and Cr in the distribution system helps to identify any unintended consequences of stannous application. The bench scale results indicate that once the Cr(VI) is converted to Cr(III), it is not substantially re-oxidized if an adequate Sn dose is applied. Previous filtration tests performed at bench-scale indicated most of the Cr(III) and stannous are either dissolved or occur as 1 µm or smaller particulates that do not settle. The goal is to demonstrate if these observations are consistent at full-scale. As mentioned above, the observation period was originally scheduled for 6 weeks but was extended to 10 weeks. The additional 4-weeks were used to make observations at the highest residence time locations, T3602 and T4711, in the distribution system
Since stannous has been used as a corrosion inhibitor, the full-scale demonstration investigates how Sn interacts in the distribution system. It was unknown if Sn would plate out onto pipeline material, requiring time for Sn to reach equilibrium to achieve a consistent concentration in the distribution system. Previous full-scale demonstration testing in Soquel, CA showed no decrease in Cr and Sn at the end of a pipeline with a 22-minute travel time.
To meet Objective 2, two experiments were originally planned. Experiment 1 investigated the overall water quality changes in the distribution system (as opposed to the well site compliance points from Objective 1) from stannous application when compared to the pre-stannous application results. Experiment 2 evaluated possible Sn and Cr accumulation in the distribution system by looking at water quality during main flushing.
During the course of the demonstration, it became clear that Sn concentrations were decreasing from the point of application through to the end of the distribution system. Two additional experiments were developed to inform the fate of Sn in the distribution system. The first, experiment 3, evaluated changes in Sn and Cr concentrations during a rapid drain cycle of two tanks, and the second, experiment 4, investigated Sn and Cr in pipeline coatings harvested from the distribution system after the 10-week Sn application period. Detailed descriptions of these experiments are given below.
Experiment 1- Water quality in the distribution system Experiment 1 follows the same protocol as Objective 1 except for the inclusion of additional sample locations in the distribution system. Identical baseline and observation period data were collected at certain distribution system points and compared. In addition, the same water quality sampling protocol was repeated once the stannous feed is turned off after the 10-week observation period to evaluate how long Sn and reduced Cr remain in the distribution system at the selected sample locations.
Experiment 2- Water quality during main flushing Flushing is a normal maintenance activity in a water system. The ID-8 system has a routine valve exercise program and flushes the system as needed. The pipeline where the full-scale demonstration flushing was conducted is regularly flushed due to periodic sediment accumulation. The flush location is a hydrant on
CVWD Full-Scale Stannous Chloride Demonstration Results Page | 5
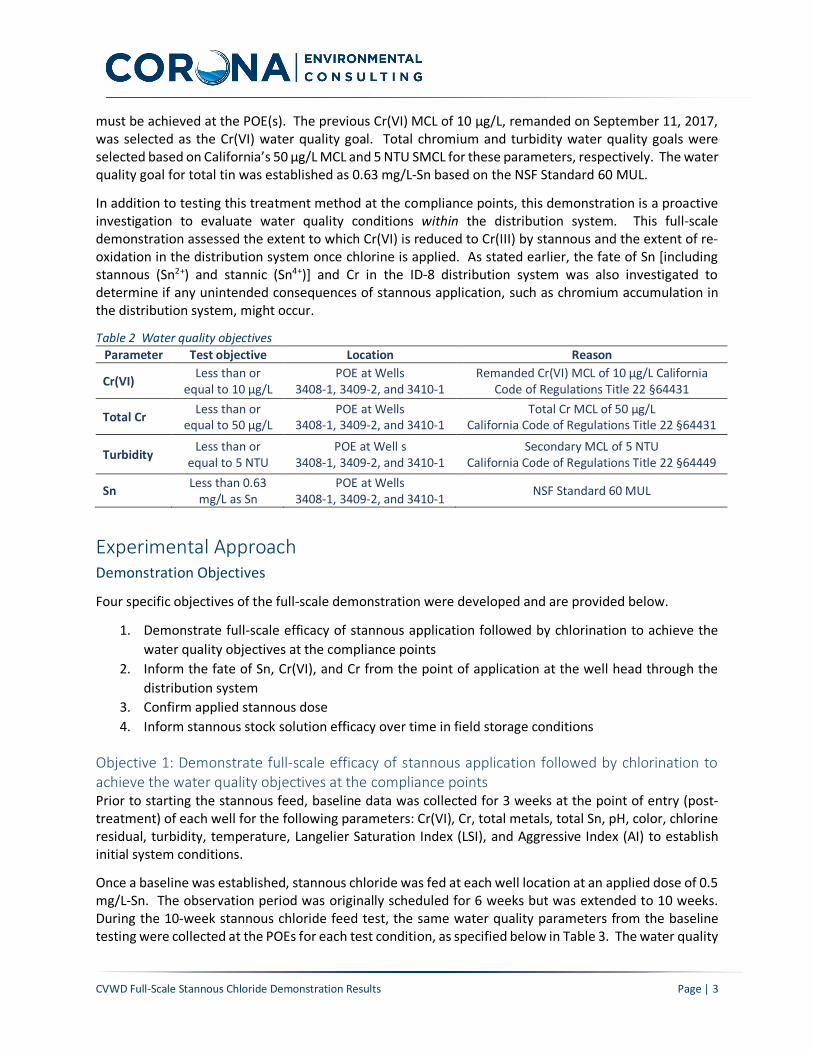
Quail Road at the midpoint between Lyons Blvd. and 16th Ave, in Sky Valley subdivision, as shown in Figure 2. The main is a 12-inch cement mortar lined steel (CML) that was installed in 1966.
Figure 2 Map of the main flush location
Three distribution system flushes are required to properly evaluate potential Sn and Cr particle accumulation throughout the duration of the proposed demonstration study. The first flush occurred immediately prior to the start of baseline sampling in July 2017. The second flush occurred once baseline conditions were established and just before the start of stannous chloride injection on November 29th, 2017. The final flush occurred on January 30th, 2018, just before the conclusion of the 10-week stannous feed observation period.
The main flushing was conducted according to the normal CVWD flushing protocol. No particular flushing velocity was targeted and the main was flushed for 10 minutes.
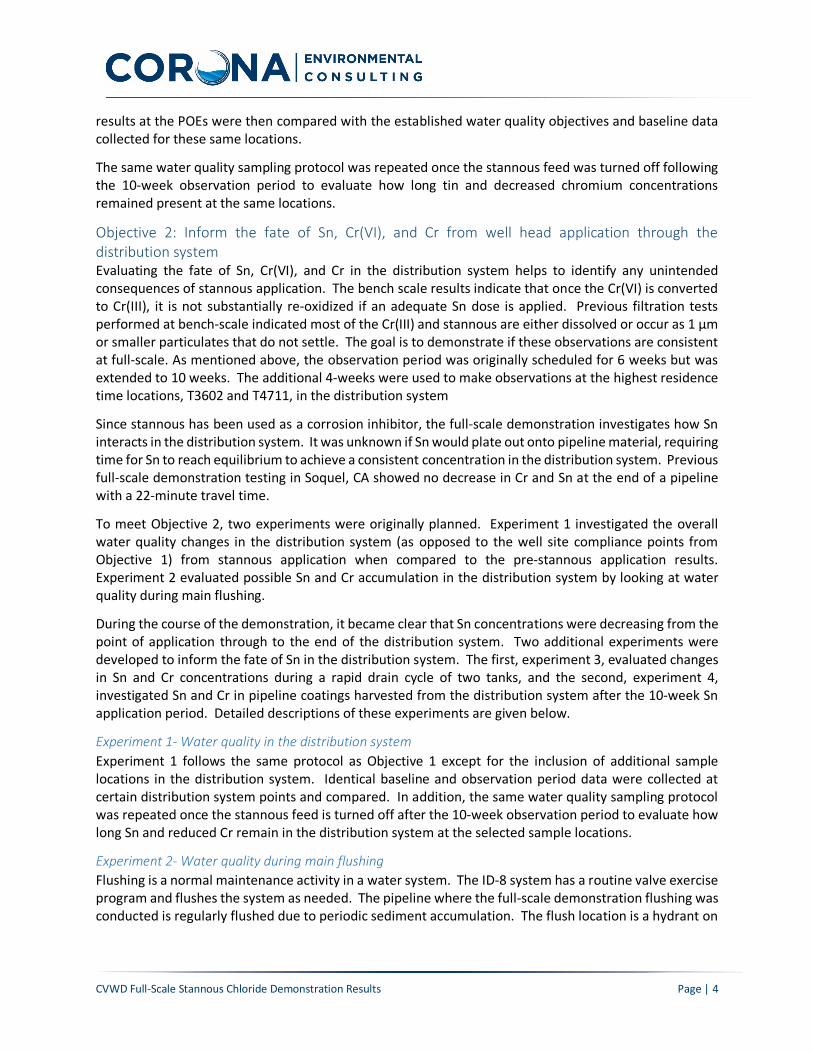
For the pre-stannous testing, a side stream of the water from the main flushing was routed through a cartridge filtration pilot unit constructed by Intuitech, LLC, shown in Figure 3. The pilot unit filtered the flush water through a 1 µm filter (particles 1 µm and smaller may not settle and are considered colloidal) and 0.35 µm filter (particles smaller than 0.45 µm are classified as dissolved; particles greater that 0.45 µm are classified as colloidal or particulate) in parallel. Unfortunately, a 0.45 µm filter is not available with the current pilot unit configuration, so a 0.35 µm filter will be used in its place. Samples will be collected from the following pilot unit locations: the pilot unit influent, the 1 µm filter effluent, and the 0.35 µm filter effluent.
CVWD Full-Scale Stannous Chloride Demonstration Results Page | 6
Figure 3 Pilot unit set up for flush experiment sampling
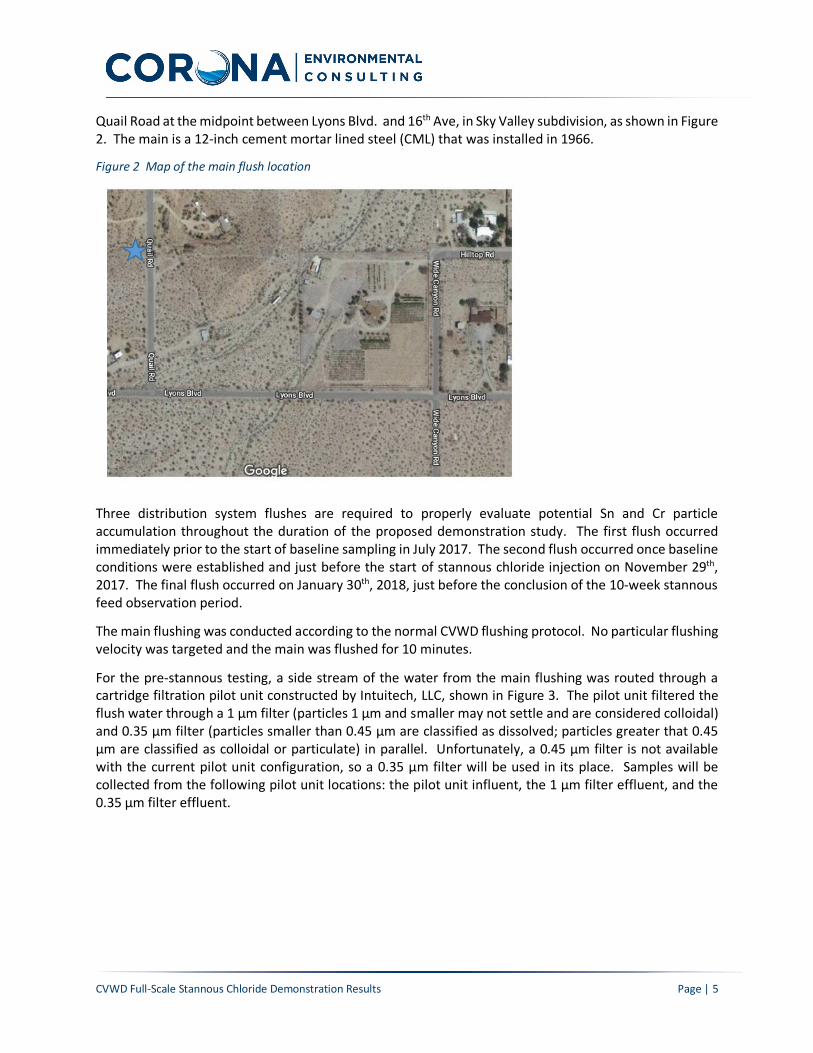
Unfortunately, prior to the stannous flush experiment on January 30th, 2018, the pilot unit was stolen, and flush samples were manually collected and filtered using a vacuum filter, as shown in Figure 4. As a result, a 0.45 µm filter paper was used in lieu of 0.35 µm due to availability.
Figure 4 Vacuum filtration of flush samples
All samples were collected in 1-liter cubitainers and water quality will be analyzed for Cr(VI), Cr, total metals, Sn, color, pH, Cl, turbidity, and temperature. This flushing schedule ensures that collected data from the pre- and post-stannous chloride feed periods are comparable. Five samples were collected during the 10-minute flush.
CVWD Full-Scale Stannous Chloride Demonstration Results Page | 7
Experiment 3- Tank draining During the course of the experiment it became clear that the Sn concentration was decreasing from the point of application to the end of the distribution system. This experiment was added to the original test protocol to assess if rapid tank draining could result in high concentrations of Sn and Cr leaving the tank. Accelerated drawdown of storage tanks 3602 and 4711 were conducted in January 2017. Depth dependent samples could not be collected due to OSHA restrictions on tank climbing.
Experiment 4- Pipeline coating investigation Similar to Experiment 3, the pipeline coating investigation was added to the original protocol. The goal is to determine if there is evidence of Sn and Cr coating of a main sample collected from the distribution system. A pipeline was harvested from Booster 3603 after the 10-week Sn application period. Samples from two layers of coating were collected and acid digested via EPA method 3050B for total metals analysis. Pipe scale was also examined by Scanning Electron Microscopy (SEM) and X-ray diffraction (XRD) to determine the mineralogical make up and surface morphology of the coating. This work was conducted by Dr. Haizhou Lui and John Orta, of the University of California, Riverside.
Objective 3: Confirm applied stannous dose Previous testing has indicated that the measured dose of Sn is consistently lower than the applied dose. The goal of this objective is to understand the mechanism of this difference and resolve it, if possible. Total tin measures all of the tin species including stannous (Sn2+) and stannic (Sn4+).
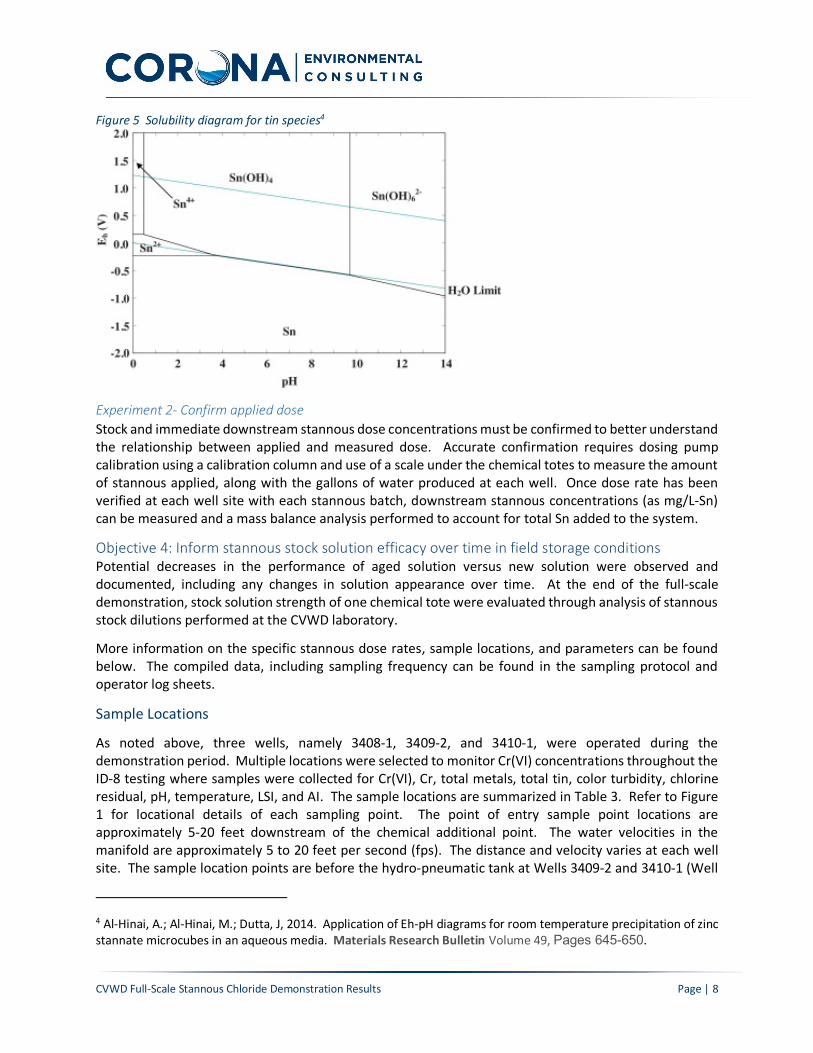
Experiment 1- Base preservation EPA Method 200.8 for metals analysis calls for acid preservation of the sample3. Initially, the contract laboratories sent acid preserved bottles for total tin analysis. Further investigation on the fundamental chemistry of tin indicated that, unlike most metals, tin is not acid soluble at pH 2 under most oxidation conditions, which means that tin could precipitate out on the sample bottle and result in less total tin being measure than expected. Refer to Figure 5, which shows the tin species under various Eh and pH conditions. Tin is, however, base soluble. An experiment was designed to compare the acid preservation of samples to the base preservation of samples when a known dose of stannous was applied.
3 Method 200.8 Determination of Trace Elements in Water and Wastes by Inductively Coupled Plasma – Mass Spectrometry https://www.epa.gov/sites/production/files/2015-06/documents/epa-200.8.pdf
CVWD Full-Scale Stannous Chloride Demonstration Results Page | 8
Figure 5 Solubility diagram for tin species4
Experiment 2- Confirm applied dose Stock and immediate downstream stannous dose concentrations must be confirmed to better understand the relationship between applied and measured dose. Accurate confirmation requires dosing pump calibration using a calibration column and use of a scale under the chemical totes to measure the amount of stannous applied, along with the gallons of water produced at each well. Once dose rate has been verified at each well site with each stannous batch, downstream stannous concentrations (as mg/L-Sn) can be measured and a mass balance analysis performed to account for total Sn added to the system.
Objective 4: Inform stannous stock solution efficacy over time in field storage conditions Potential decreases in the performance of aged solution versus new solution were observed and documented, including any changes in solution appearance over time. At the end of the full-scale demonstration, stock solution strength of one chemical tote were evaluated through analysis of stannous stock dilutions performed at the CVWD laboratory.
More information on the specific stannous dose rates, sample locations, and parameters can be found below. The compiled data, including sampling frequency can be found in the sampling protocol and operator log sheets.
Sample Locations
As noted above, three wells, namely 3408-1, 3409-2, and 3410-1, were operated during the demonstration period. Multiple locations were selected to monitor Cr(VI) concentrations throughout the ID-8 testing where samples were collected for Cr(VI), Cr, total metals, total tin, color turbidity, chlorine residual, pH, temperature, LSI, and AI. The sample locations are summarized in Table 3. Refer to Figure 1 for locational details of each sampling point. The point of entry sample point locations are approximately 5-20 feet downstream of the chemical additional point. The water velocities in the manifold are approximately 5 to 20 feet per second (fps). The distance and velocity varies at each well site. The sample location points are before the hydro-pneumatic tank at Wells 3409-2 and 3410-1 (Well
4 Al-Hinai, A.; Al-Hinai, M.; Dutta, J, 2014. Application of Eh-pH diagrams for room temperature precipitation of zinc stannate microcubes in an aqueous media. Materials Research Bulletin Volume 49, Pages 645-650.
CVWD Full-Scale Stannous Chloride Demonstration Results Page | 9
3408-1 has no hydro-pneumatic tank). For this experiment, no static mixers or reaction time pipelines or vessels were used.
Table 3 Sample locations Location I.D. Description
Downstream of chemical injection at wells 3408-1, 3409-2, and 3410-1 Dose and re-oxidation sampling, anticipated compliance points
Storage tank T3501-1 First of a series of storage tanks. Evaluate potential for re-oxidation to Cr(VI) or precipitation of Cr(III)
B3603 Single 8” transmission main on Dillion Rd. Representative of water entering the southwest portion of the system
Storage tank T4711-1 Terminal tank in the distribution system
Storage tank T3602-1 Representative of maximum residence time. Evaluate potential for re-oxidation to Cr(VI) or precipitation of Cr(III)
Results Results for the CVWD full-scale demonstration are detailed below by objective and test experiment. Baseline sampling of the ID-8 system prior to stannous addition was conducted over a 3-week period in August 2017. The start-up of treatment was delayed until November 29th, 2017, due to installation of approximately 20,000 feet of new 18-inch diameter main in September to October 2017. This caused the testing to occur during the season with the lowest demand and highest water age, which represents a worst-case scenario for Cr(VI) reoxidation. The full-scale demonstration concluded on January 31st, 2018 with post-stannous sampling through the end of February.
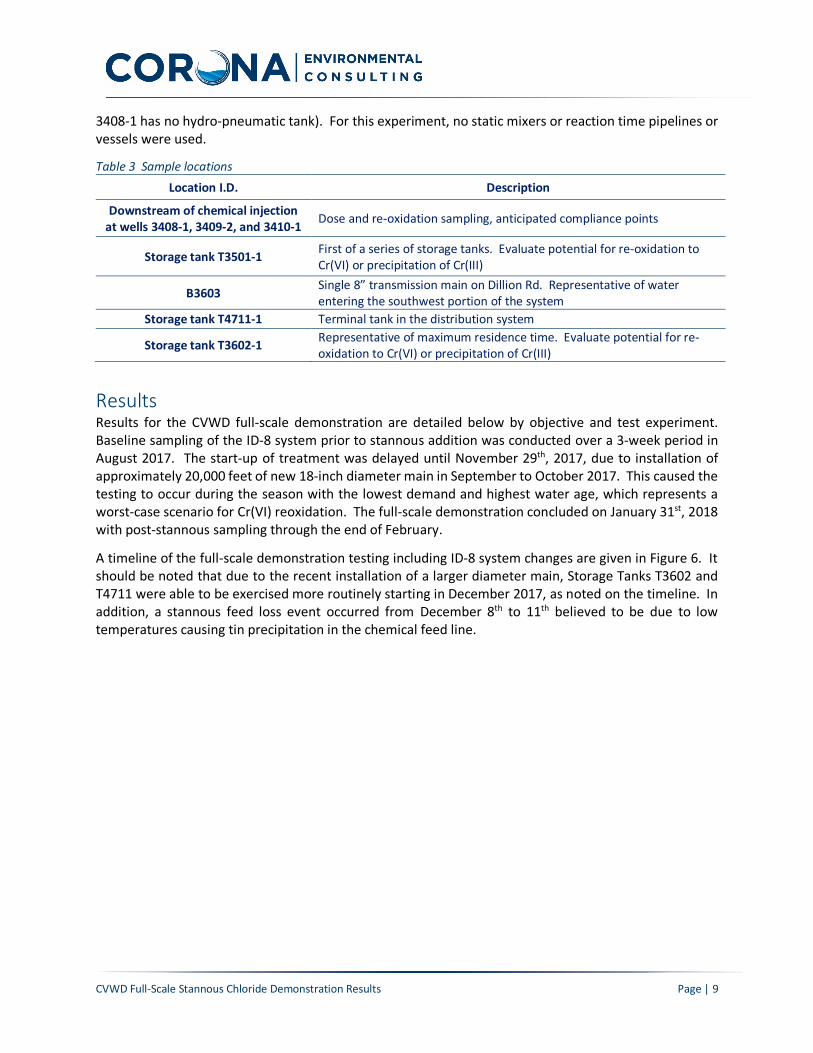
A timeline of the full-scale demonstration testing including ID-8 system changes are given in Figure 6. It should be noted that due to the recent installation of a larger diameter main, Storage Tanks T3602 and T4711 were able to be exercised more routinely starting in December 2017, as noted on the timeline. In addition, a stannous feed loss event occurred from December 8th to 11th believed to be due to low temperatures causing tin precipitation in the chemical feed line.
CVWD Full-Scale Stannous Chloride Demonstration Results Page | 10
Figure 6 CVWD full-scale demonstration timeline
Objective 1: Demonstrate full-scale efficacy of stannous application followed by chlorination to achieve the water quality objectives at the compliance points Box plots of total tin, Cr(VI), total chromium and turbidity results immediately downstream of stannous injection for Wells 3408-1, 3409-2, and 3410-1 are given below in Figure 7 to Figure 10, respectively. Side by side comparison of water quality data from baseline conditions and during stannous feed are shown in each figure.
A box plot is a statistical tool used to graphically present the range and distribution of data. As shown in the figure to the left, a box and whisker plot consists of a box which represents the interquartile range, or 50% of the data between the 25th and 75th percentile. The red hash mark denotes the median or middle value, and the black lines, ‘whiskers’, represent the upper and lower 20th percentile.
A wider distribution of data corresponds to a taller box, while a shorter box represents more consistent data. A long whisker, indicates the presence of a singular or few outlier(s).
0
0.2
0.4
0.6
0.8
1
1.2
1.4
1.6
1.8
2
8/1 9/1 10/1 11/1 12/1 1/1 1/31 3/3
Parameter(units)
SampleDate
StannousFeedLoss ExercisingofT3602andT4711
Full-scaleStannousFeed
Start-up
ChlorineDoseIncreased
ExercisingofT4711End
StannousFeed
BaselineSampling
CVWD Full-Scale Stannous Chloride Demonstration Results Page | 11
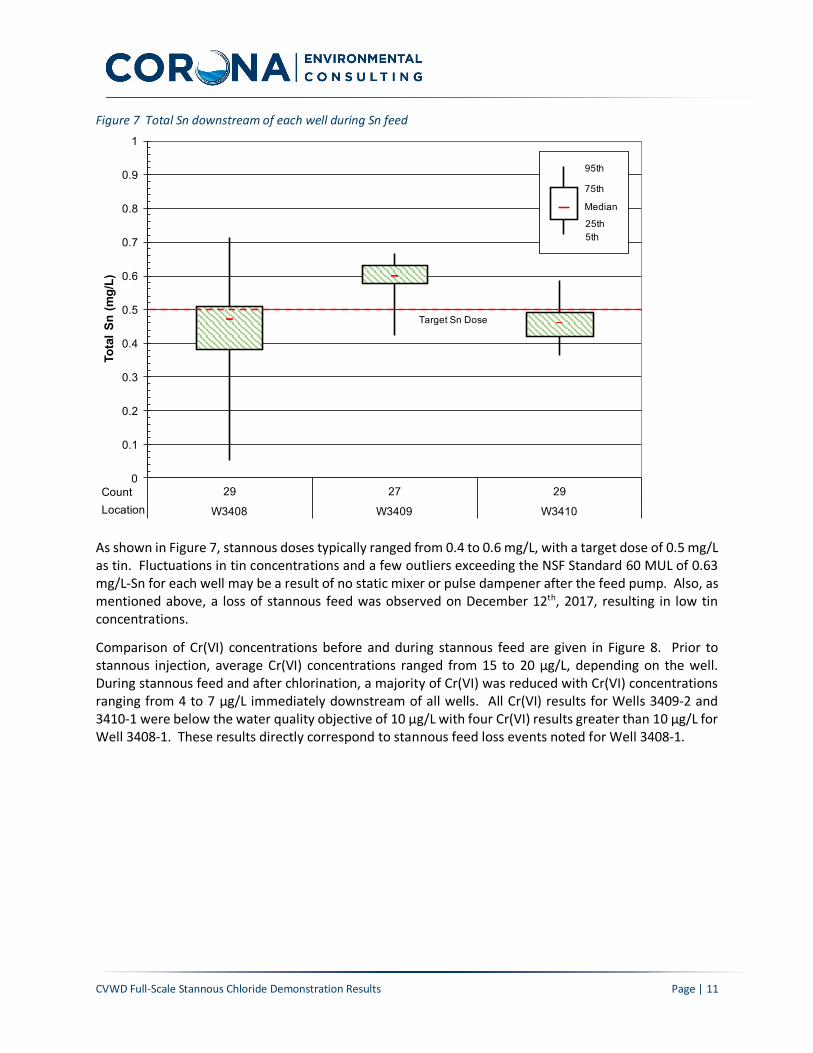
Figure 7 Total Sn downstream of each well during Sn feed
As shown in Figure 7, stannous doses typically ranged from 0.4 to 0.6 mg/L, with a target dose of 0.5 mg/L as tin. Fluctuations in tin concentrations and a few outliers exceeding the NSF Standard 60 MUL of 0.63 mg/L-Sn for each well may be a result of no static mixer or pulse dampener after the feed pump. Also, as mentioned above, a loss of stannous feed was observed on December 12th, 2017, resulting in low tin concentrations.
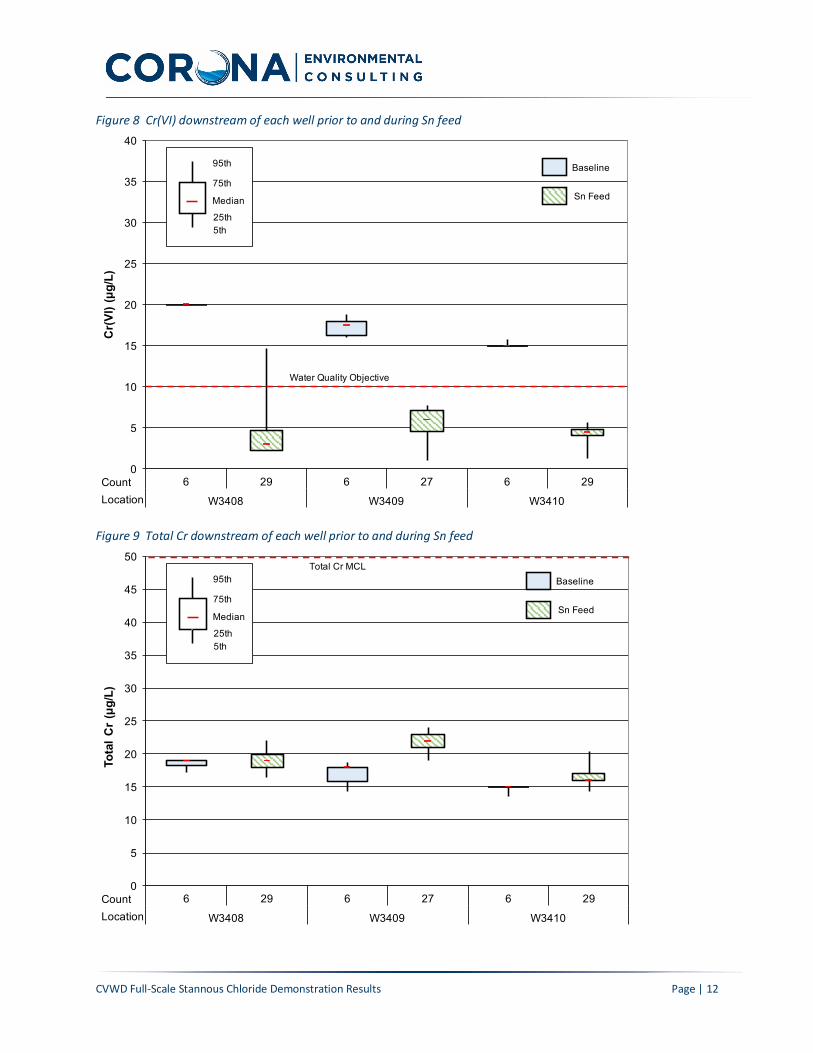
Comparison of Cr(VI) concentrations before and during stannous feed are given in Figure 8. Prior to stannous injection, average Cr(VI) concentrations ranged from 15 to 20 µg/L, depending on the well. During stannous feed and after chlorination, a majority of Cr(VI) was reduced with Cr(VI) concentrations ranging from 4 to 7 µg/L immediately downstream of all wells. All Cr(VI) results for Wells 3409-2 and 3410-1 were below the water quality objective of 10 µg/L with four Cr(VI) results greater than 10 µg/L for Well 3408-1. These results directly correspond to stannous feed loss events noted for Well 3408-1.
0
0.1
0.2
0.3
0.4
0.5
0.6
0.7
0.8
0.9
1
29 27 29
W3408 W3409 W3410
Tota
l Sn
(mg/
L)
5th25th
Median
75th
95th
CountLocation
Target Sn Dose
CVWD Full-Scale Stannous Chloride Demonstration Results Page | 12
Figure 8 Cr(VI) downstream of each well prior to and during Sn feed
Figure 9 Total Cr downstream of each well prior to and during Sn feed
0
5
10
15
20
25
30
35
40
6 29 6 27 6 29
W3408 W3409 W3410
Cr(
VI) (
µg/L
)
5th25th
Median
75th
95th
CountLocation
Baseline
Sn Feed
Water Quality Objective
0
5
10
15
20
25
30
35
40
45
50
6 29 6 27 6 29
W3408 W3409 W3410
Tota
l Cr
(µg/
L)
5th25th
Median
75th
95th
CountLocation
Baseline
Sn Feed
Total Cr MCL
CVWD Full-Scale Stannous Chloride Demonstration Results Page | 13
Total chromium results were consistent for each well, as depicted in Figure 9. No chromium was lost during stannous feed and variation in total chromium before and during stannous feed can be attributed to fluctuation in water quality and analytical error. All results were also well below the total chromium MCL of 50 µg/L.
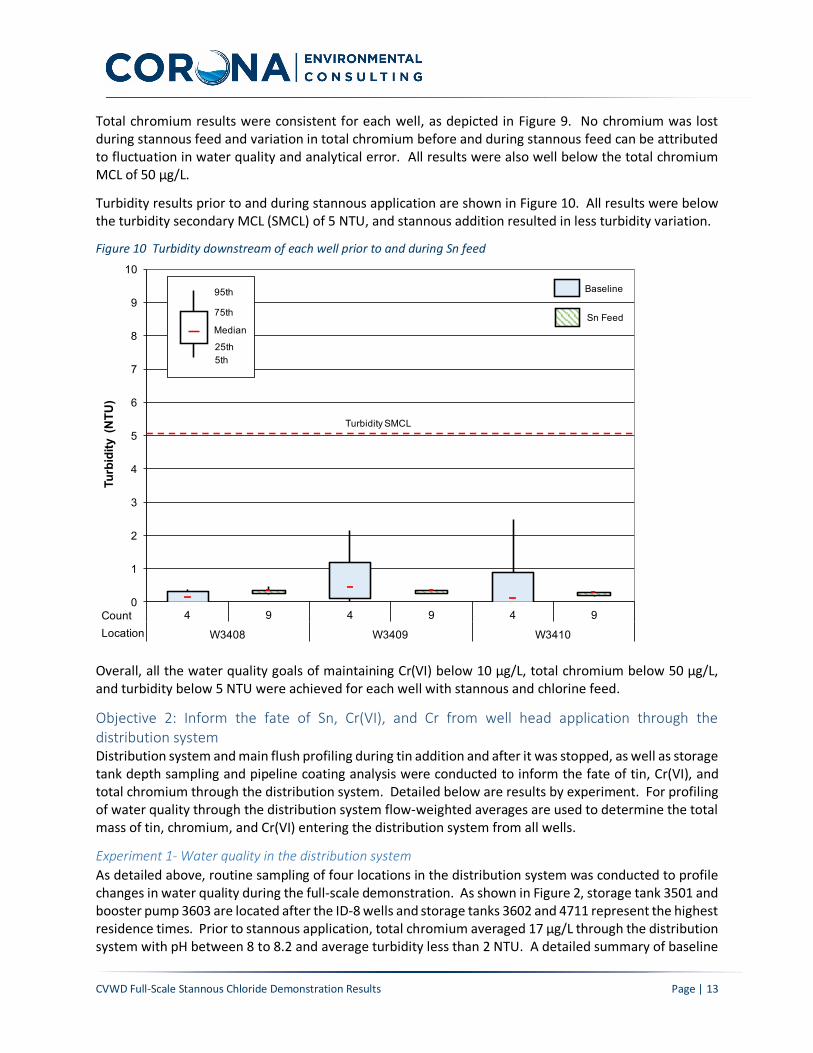
Turbidity results prior to and during stannous application are shown in Figure 10. All results were below the turbidity secondary MCL (SMCL) of 5 NTU, and stannous addition resulted in less turbidity variation.
Figure 10 Turbidity downstream of each well prior to and during Sn feed
Overall, all the water quality goals of maintaining Cr(VI) below 10 µg/L, total chromium below 50 µg/L, and turbidity below 5 NTU were achieved for each well with stannous and chlorine feed.
Objective 2: Inform the fate of Sn, Cr(VI), and Cr from well head application through the distribution system Distribution system and main flush profiling during tin addition and after it was stopped, as well as storage tank depth sampling and pipeline coating analysis were conducted to inform the fate of tin, Cr(VI), and total chromium through the distribution system. Detailed below are results by experiment. For profiling of water quality through the distribution system flow-weighted averages are used to determine the total mass of tin, chromium, and Cr(VI) entering the distribution system from all wells.
Experiment 1- Water quality in the distribution system As detailed above, routine sampling of four locations in the distribution system was conducted to profile changes in water quality during the full-scale demonstration. As shown in Figure 2, storage tank 3501 and booster pump 3603 are located after the ID-8 wells and storage tanks 3602 and 4711 represent the highest residence times. Prior to stannous application, total chromium averaged 17 µg/L through the distribution system with pH between 8 to 8.2 and average turbidity less than 2 NTU. A detailed summary of baseline
0
1
2
3
4
5
6
7
8
9
10
4 9 4 9 4 9
W3408 W3409 W3410
Turb
idity
(N
TU)
5th25th
Median
75th
95th
CountLocation
Baseline
Sn Feed
Turbidity SMCL
CVWD Full-Scale Stannous Chloride Demonstration Results Page | 14
water quality through the distribution system is given in Appendix A. Results during stannous application and after it was stopped are detailed below by parameter.
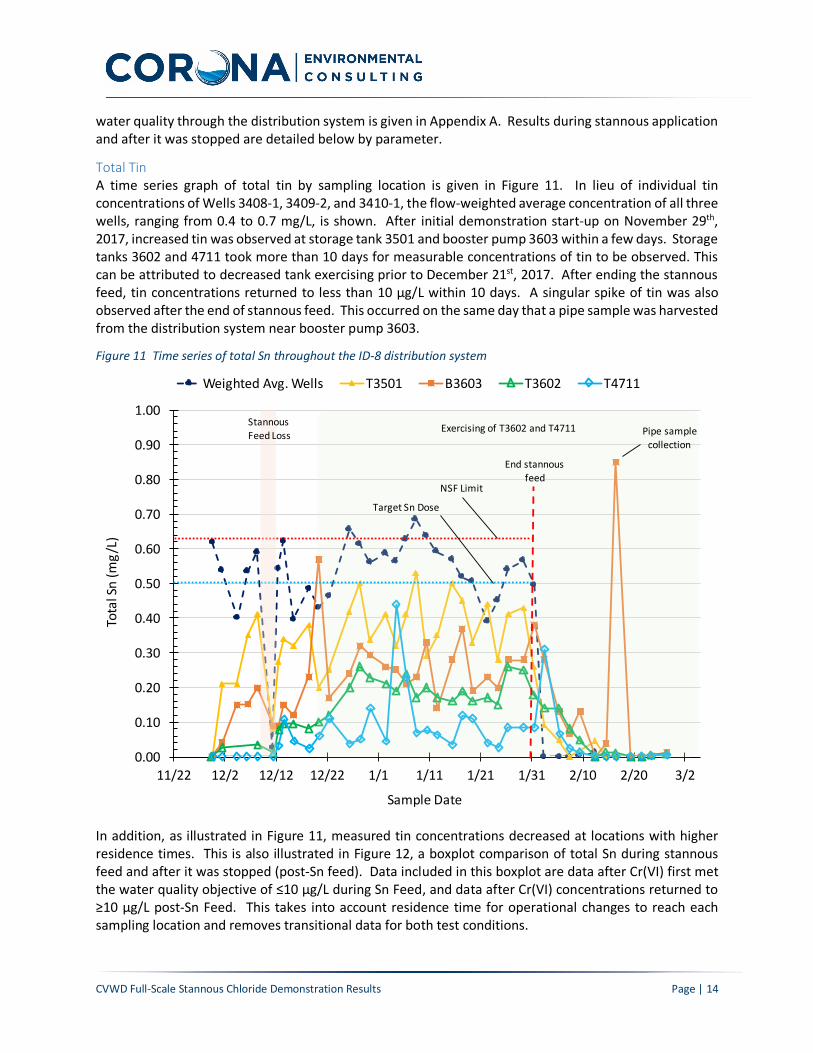
Total Tin A time series graph of total tin by sampling location is given in Figure 11. In lieu of individual tin concentrations of Wells 3408-1, 3409-2, and 3410-1, the flow-weighted average concentration of all three wells, ranging from 0.4 to 0.7 mg/L, is shown. After initial demonstration start-up on November 29th, 2017, increased tin was observed at storage tank 3501 and booster pump 3603 within a few days. Storage tanks 3602 and 4711 took more than 10 days for measurable concentrations of tin to be observed. This can be attributed to decreased tank exercising prior to December 21st, 2017. After ending the stannous feed, tin concentrations returned to less than 10 µg/L within 10 days. A singular spike of tin was also observed after the end of stannous feed. This occurred on the same day that a pipe sample was harvested from the distribution system near booster pump 3603.
Figure 11 Time series of total Sn throughout the ID-8 distribution system
In addition, as illustrated in Figure 11, measured tin concentrations decreased at locations with higher residence times. This is also illustrated in Figure 12, a boxplot comparison of total Sn during stannous feed and after it was stopped (post-Sn feed). Data included in this boxplot are data after Cr(VI) first met the water quality objective of ≤10 µg/L during Sn Feed, and data after Cr(VI) concentrations returned to ≥10 µg/L post-Sn Feed. This takes into account residence time for operational changes to reach each sampling location and removes transitional data for both test conditions.
0.00
0.10
0.20
0.30
0.40
0.50
0.60
0.70
0.80
0.90
1.00
11/22 12/2 12/12 12/22 1/1 1/11 1/21 1/31 2/10 2/20 3/2
TotalSn(m
g/L)
SampleDate
WeightedAvg.Wells T3501 B3603 T3602 T4711
Endstannousfeed
NSFLimit
TargetSn Dose
StannousFeedLoss
ExercisingofT3602andT4711 Pipesamplecollection
CVWD Full-Scale Stannous Chloride Demonstration Results Page | 15
Figure 12 Total Sn box plot by sampling location during and post Sn feed
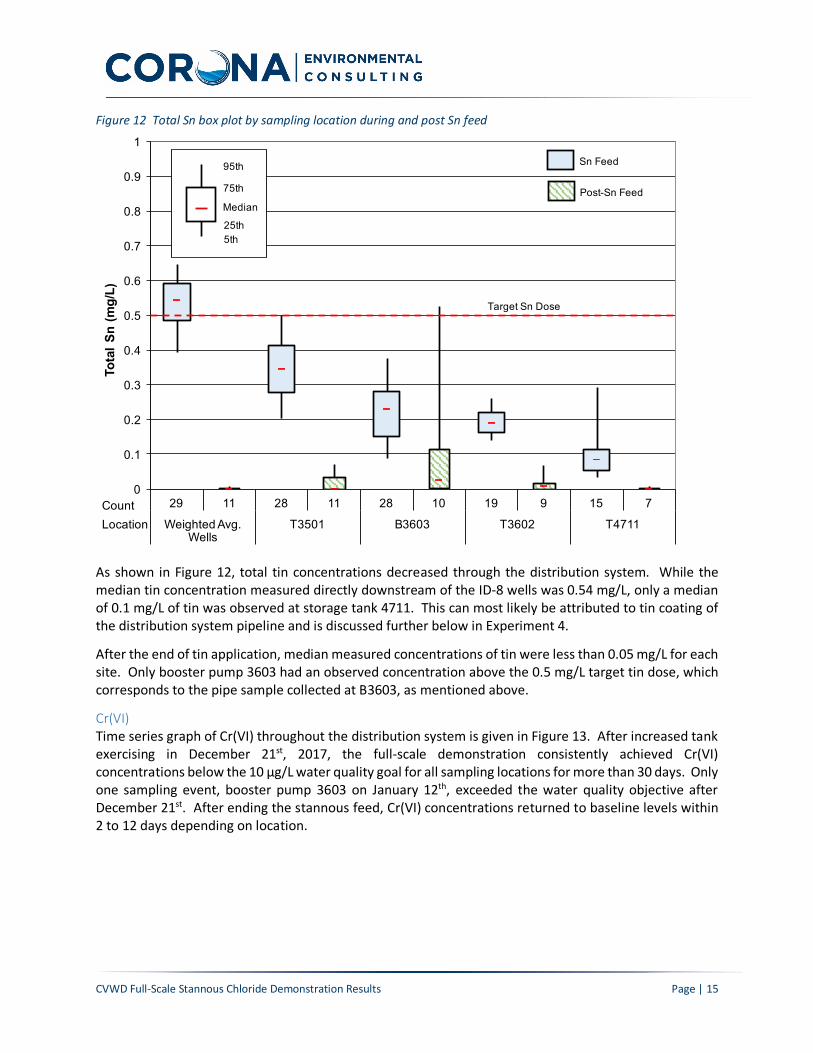
As shown in Figure 12, total tin concentrations decreased through the distribution system. While the median tin concentration measured directly downstream of the ID-8 wells was 0.54 mg/L, only a median of 0.1 mg/L of tin was observed at storage tank 4711. This can most likely be attributed to tin coating of the distribution system pipeline and is discussed further below in Experiment 4.
After the end of tin application, median measured concentrations of tin were less than 0.05 mg/L for each site. Only booster pump 3603 had an observed concentration above the 0.5 mg/L target tin dose, which corresponds to the pipe sample collected at B3603, as mentioned above.
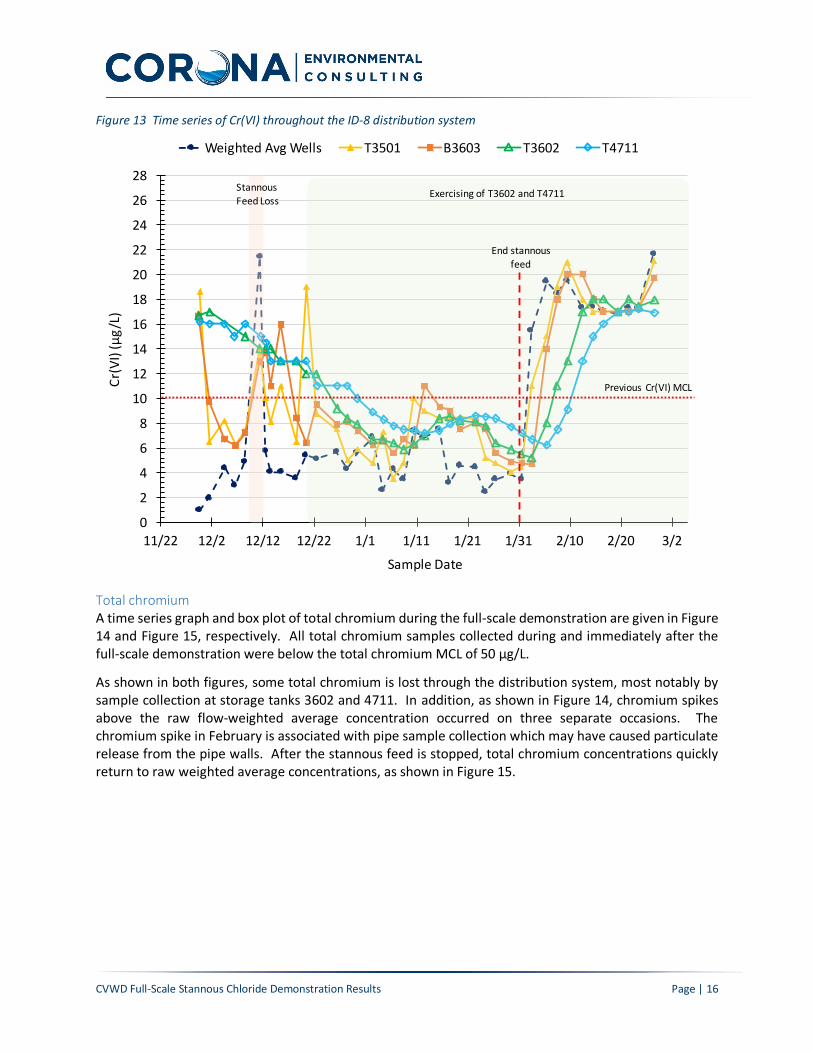
Cr(VI) Time series graph of Cr(VI) throughout the distribution system is given in Figure 13. After increased tank exercising in December 21st, 2017, the full-scale demonstration consistently achieved Cr(VI) concentrations below the 10 µg/L water quality goal for all sampling locations for more than 30 days. Only one sampling event, booster pump 3603 on January 12th, exceeded the water quality objective after December 21st. After ending the stannous feed, Cr(VI) concentrations returned to baseline levels within 2 to 12 days depending on location.
0
0.1
0.2
0.3
0.4
0.5
0.6
0.7
0.8
0.9
1
29 11 28 11 28 10 19 9 15 7
Weighted Avg. Wells
T3501 B3603 T3602 T4711
Tota
l Sn
(mg/
L)
5th25th
Median
75th
95th
CountLocation
Sn Feed
Post-Sn Feed
Target Sn Dose
CVWD Full-Scale Stannous Chloride Demonstration Results Page | 16
Figure 13 Time series of Cr(VI) throughout the ID-8 distribution system
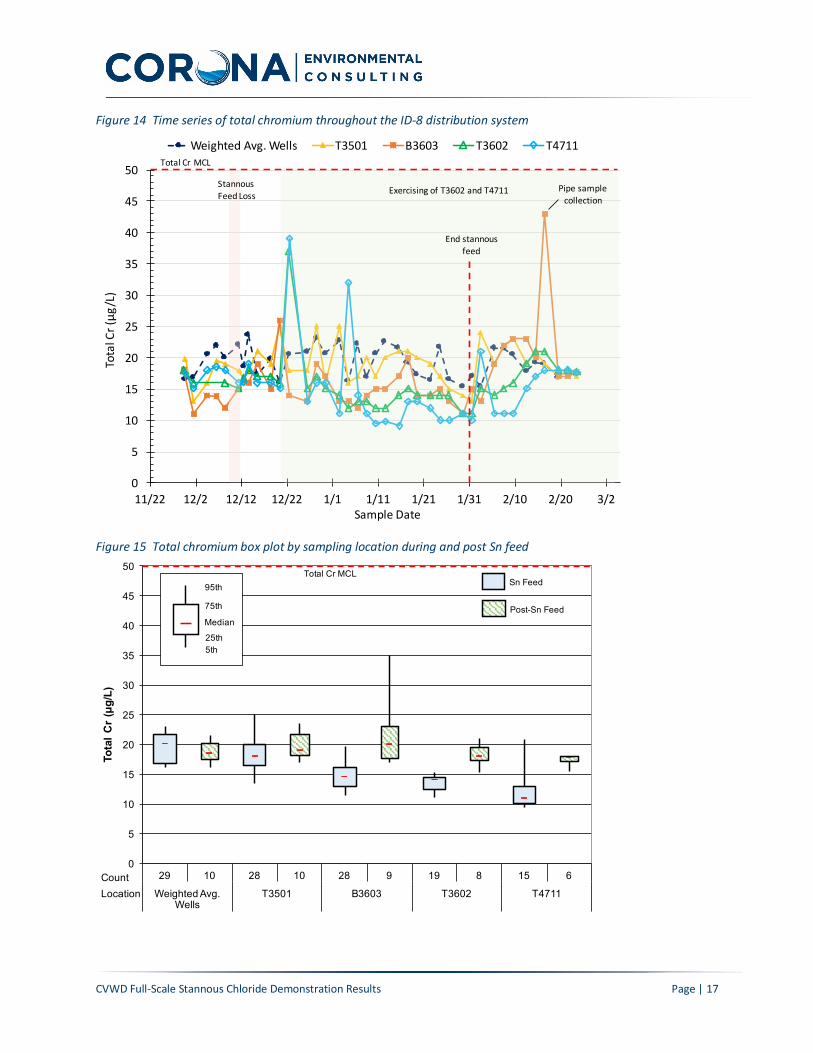
Total chromium A time series graph and box plot of total chromium during the full-scale demonstration are given in Figure 14 and Figure 15, respectively. All total chromium samples collected during and immediately after the full-scale demonstration were below the total chromium MCL of 50 µg/L.
As shown in both figures, some total chromium is lost through the distribution system, most notably by sample collection at storage tanks 3602 and 4711. In addition, as shown in Figure 14, chromium spikes above the raw flow-weighted average concentration occurred on three separate occasions. The chromium spike in February is associated with pipe sample collection which may have caused particulate release from the pipe walls. After the stannous feed is stopped, total chromium concentrations quickly return to raw weighted average concentrations, as shown in Figure 15.
0
2
4
6
8
10
12
14
16
18
20
22
24
26
28
11/22 12/2 12/12 12/22 1/1 1/11 1/21 1/31 2/10 2/20 3/2
Cr(VI)(µg/L)
SampleDate
WeightedAvgWells T3501 B3603 T3602 T4711
Endstannous
feed
PreviousCr(VI)MCL
Stannous
FeedLossExercisingofT3602andT4711
CVWD Full-Scale Stannous Chloride Demonstration Results Page | 17
Figure 14 Time series of total chromium throughout the ID-8 distribution system
Figure 15 Total chromium box plot by sampling location during and post Sn feed
0
5
10
15
20
25
30
35
40
45
50
11/22 12/2 12/12 12/22 1/1 1/11 1/21 1/31 2/10 2/20 3/2
TotalCr(µg
/L)
SampleDate
WeightedAvg.Wells T3501 B3603 T3602 T4711
Endstannousfeed
TotalCrMCL
StannousFeedLoss ExercisingofT3602andT4711 Pipesample
collection
0
5
10
15
20
25
30
35
40
45
50
29 10 28 10 28 9 19 8 15 6
Weighted Avg. Wells
T3501 B3603 T3602 T4711
Tota
l Cr
(µg/
L)
5th25th
Median
75th
95th
CountLocation
Sn Feed
Post-Sn Feed
Total Cr MCL
CVWD Full-Scale Stannous Chloride Demonstration Results Page | 18
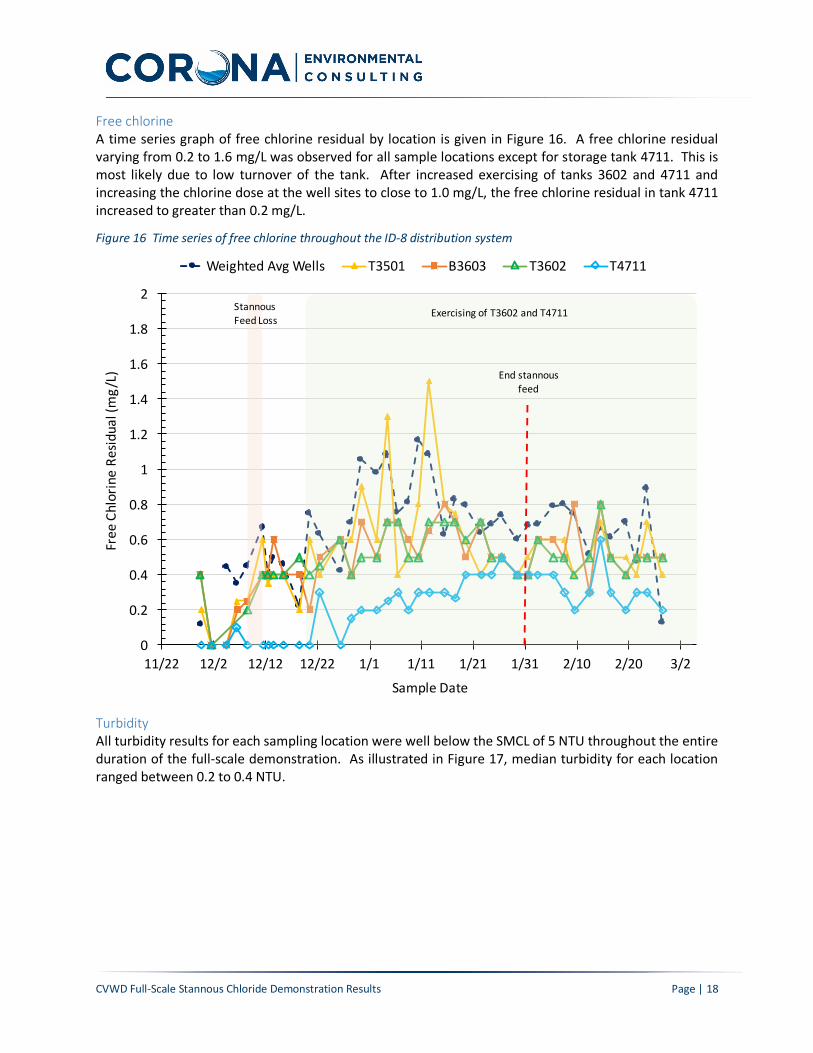
Free chlorine A time series graph of free chlorine residual by location is given in Figure 16. A free chlorine residual varying from 0.2 to 1.6 mg/L was observed for all sample locations except for storage tank 4711. This is most likely due to low turnover of the tank. After increased exercising of tanks 3602 and 4711 and increasing the chlorine dose at the well sites to close to 1.0 mg/L, the free chlorine residual in tank 4711 increased to greater than 0.2 mg/L.
Figure 16 Time series of free chlorine throughout the ID-8 distribution system
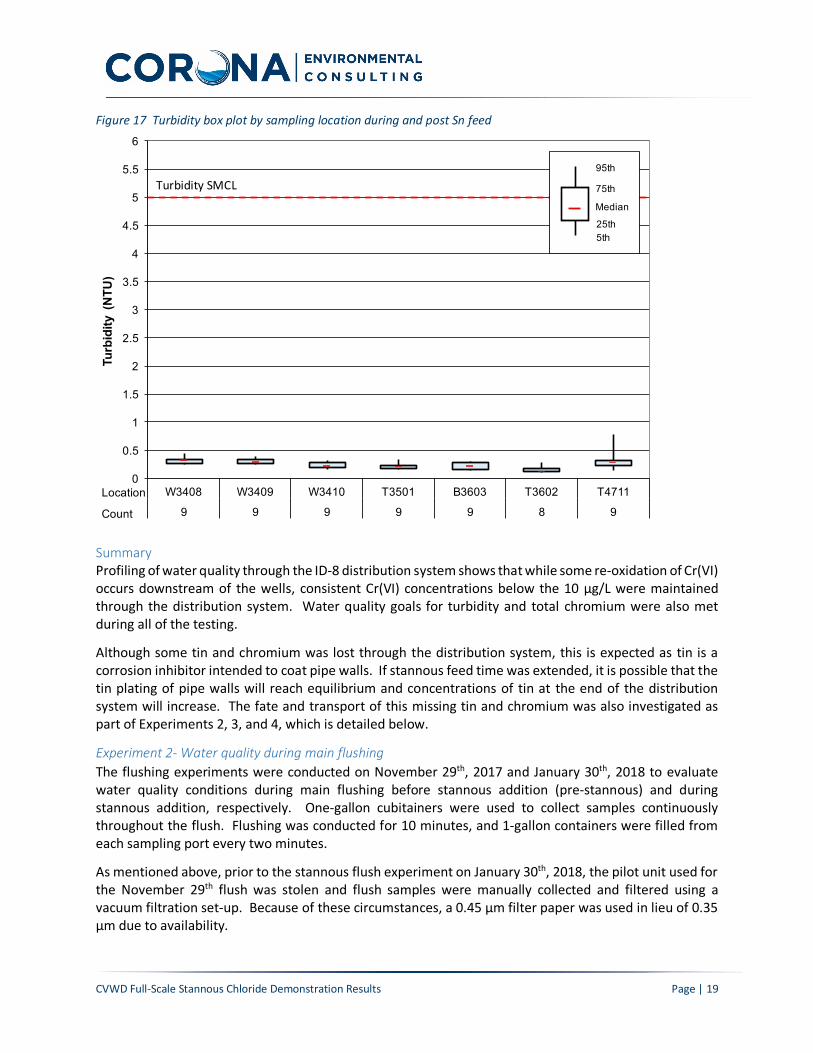
Turbidity All turbidity results for each sampling location were well below the SMCL of 5 NTU throughout the entire duration of the full-scale demonstration. As illustrated in Figure 17, median turbidity for each location ranged between 0.2 to 0.4 NTU.
0
0.2
0.4
0.6
0.8
1
1.2
1.4
1.6
1.8
2
11/22 12/2 12/12 12/22 1/1 1/11 1/21 1/31 2/10 2/20 3/2
FreeChlorineRe
sidual(mg/L)
SampleDate
WeightedAvgWells T3501 B3603 T3602 T4711
Endstannousfeed
StannousFeedLoss
ExercisingofT3602andT4711
CVWD Full-Scale Stannous Chloride Demonstration Results Page | 19
Figure 17 Turbidity box plot by sampling location during and post Sn feed
Summary Profiling of water quality through the ID-8 distribution system shows that while some re-oxidation of Cr(VI) occurs downstream of the wells, consistent Cr(VI) concentrations below the 10 µg/L were maintained through the distribution system. Water quality goals for turbidity and total chromium were also met during all of the testing.
Although some tin and chromium was lost through the distribution system, this is expected as tin is a corrosion inhibitor intended to coat pipe walls. If stannous feed time was extended, it is possible that the tin plating of pipe walls will reach equilibrium and concentrations of tin at the end of the distribution system will increase. The fate and transport of this missing tin and chromium was also investigated as part of Experiments 2, 3, and 4, which is detailed below.
Experiment 2- Water quality during main flushing The flushing experiments were conducted on November 29th, 2017 and January 30th, 2018 to evaluate water quality conditions during main flushing before stannous addition (pre-stannous) and during stannous addition, respectively. One-gallon cubitainers were used to collect samples continuously throughout the flush. Flushing was conducted for 10 minutes, and 1-gallon containers were filled from each sampling port every two minutes.
As mentioned above, prior to the stannous flush experiment on January 30th, 2018, the pilot unit used for the November 29th flush was stolen and flush samples were manually collected and filtered using a vacuum filtration set-up. Because of these circumstances, a 0.45 µm filter paper was used in lieu of 0.35 µm due to availability.
0
0.5
1
1.5
2
2.5
3
3.5
4
4.5
5
5.5
6
W3408 W3409 W3410 T3501 B3603 T3602 T4711
9 9 9 9 9 8 9
Turb
idity
(N
TU)
5th25th
Median
75th
95th
Location
Count
TurbiditySMCL
CVWD Full-Scale Stannous Chloride Demonstration Results Page | 20
During the pre-stannous flushing event, it should also be noted that during the first 2 minutes of flushing, some red coloration was observed for the 0.35 µm filtered sample. The last pilot testing conducted with the pilot unit used both stannous and ferrous as a reductant. Although the unit was flushed at the end of the previous experiments and the filter was physically cleaned and replaced on November 29th, it appears that there may have been some contamination in the first two minutes of sampling.
Main flushing results by analyte are detailed below. Results for all metals during both flush events are detailed in Appendix B.
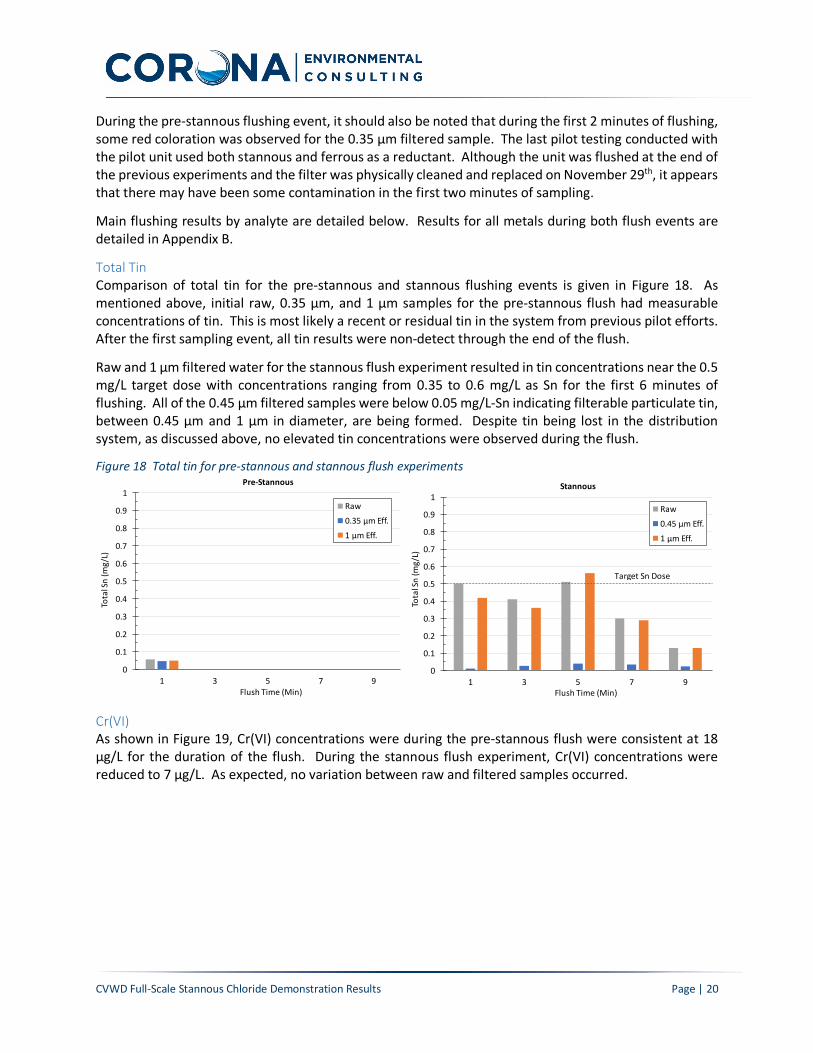
Total Tin Comparison of total tin for the pre-stannous and stannous flushing events is given in Figure 18. As mentioned above, initial raw, 0.35 µm, and 1 µm samples for the pre-stannous flush had measurable concentrations of tin. This is most likely a recent or residual tin in the system from previous pilot efforts. After the first sampling event, all tin results were non-detect through the end of the flush.
Raw and 1 µm filtered water for the stannous flush experiment resulted in tin concentrations near the 0.5 mg/L target dose with concentrations ranging from 0.35 to 0.6 mg/L as Sn for the first 6 minutes of flushing. All of the 0.45 µm filtered samples were below 0.05 mg/L-Sn indicating filterable particulate tin, between 0.45 µm and 1 µm in diameter, are being formed. Despite tin being lost in the distribution system, as discussed above, no elevated tin concentrations were observed during the flush.
Figure 18 Total tin for pre-stannous and stannous flush experiments
Cr(VI) As shown in Figure 19, Cr(VI) concentrations were during the pre-stannous flush were consistent at 18 µg/L for the duration of the flush. During the stannous flush experiment, Cr(VI) concentrations were reduced to 7 µg/L. As expected, no variation between raw and filtered samples occurred.
0
0.1
0.2
0.3
0.4
0.5
0.6
0.7
0.8
0.9
1
1 3 5 7 9
TotalSn(m
g/L)
FlushTime(Min)
Raw0.35µmEff.1µmEff.
Pre-Stannous
0
0.1
0.2
0.3
0.4
0.5
0.6
0.7
0.8
0.9
1
1 3 5 7 9
TotalSn(m
g/L)
FlushTime(Min)
Raw0.45µmEff.1µmEff.
Target SnDose
Stannous
CVWD Full-Scale Stannous Chloride Demonstration Results Page | 21
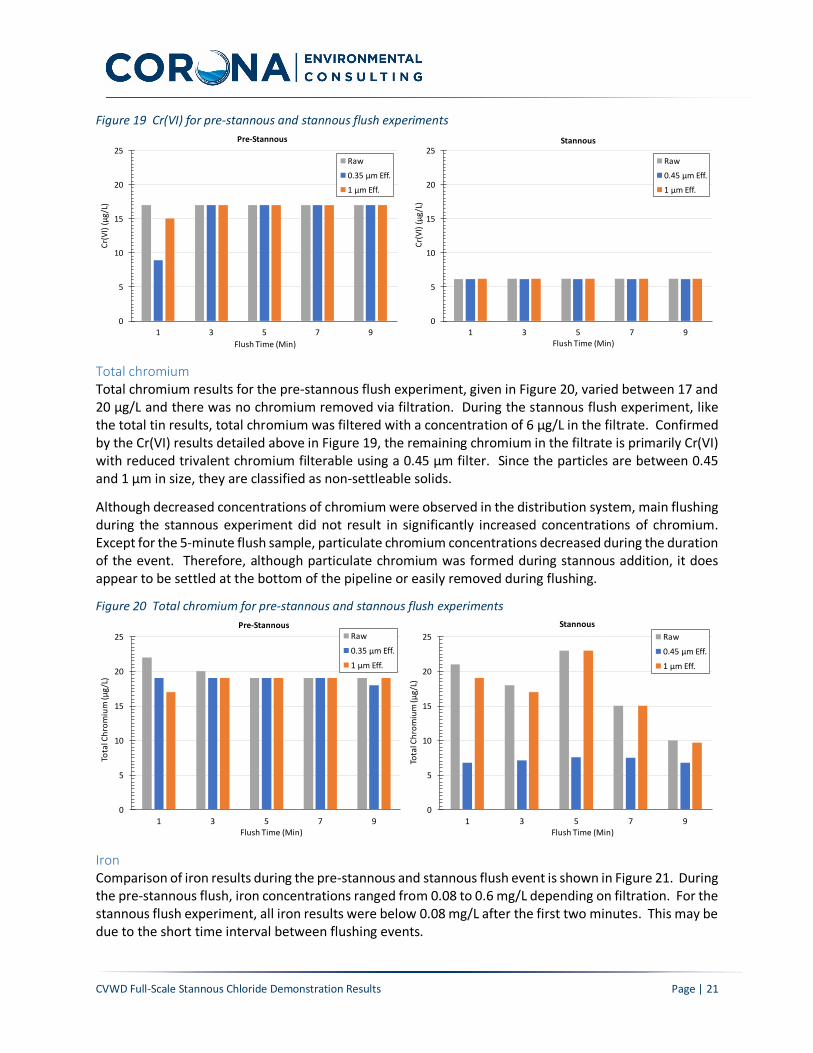
Figure 19 Cr(VI) for pre-stannous and stannous flush experiments
Total chromium Total chromium results for the pre-stannous flush experiment, given in Figure 20, varied between 17 and 20 µg/L and there was no chromium removed via filtration. During the stannous flush experiment, like the total tin results, total chromium was filtered with a concentration of 6 µg/L in the filtrate. Confirmed by the Cr(VI) results detailed above in Figure 19, the remaining chromium in the filtrate is primarily Cr(VI) with reduced trivalent chromium filterable using a 0.45 µm filter. Since the particles are between 0.45 and 1 µm in size, they are classified as non-settleable solids.
Although decreased concentrations of chromium were observed in the distribution system, main flushing during the stannous experiment did not result in significantly increased concentrations of chromium. Except for the 5-minute flush sample, particulate chromium concentrations decreased during the duration of the event. Therefore, although particulate chromium was formed during stannous addition, it does appear to be settled at the bottom of the pipeline or easily removed during flushing.
Figure 20 Total chromium for pre-stannous and stannous flush experiments
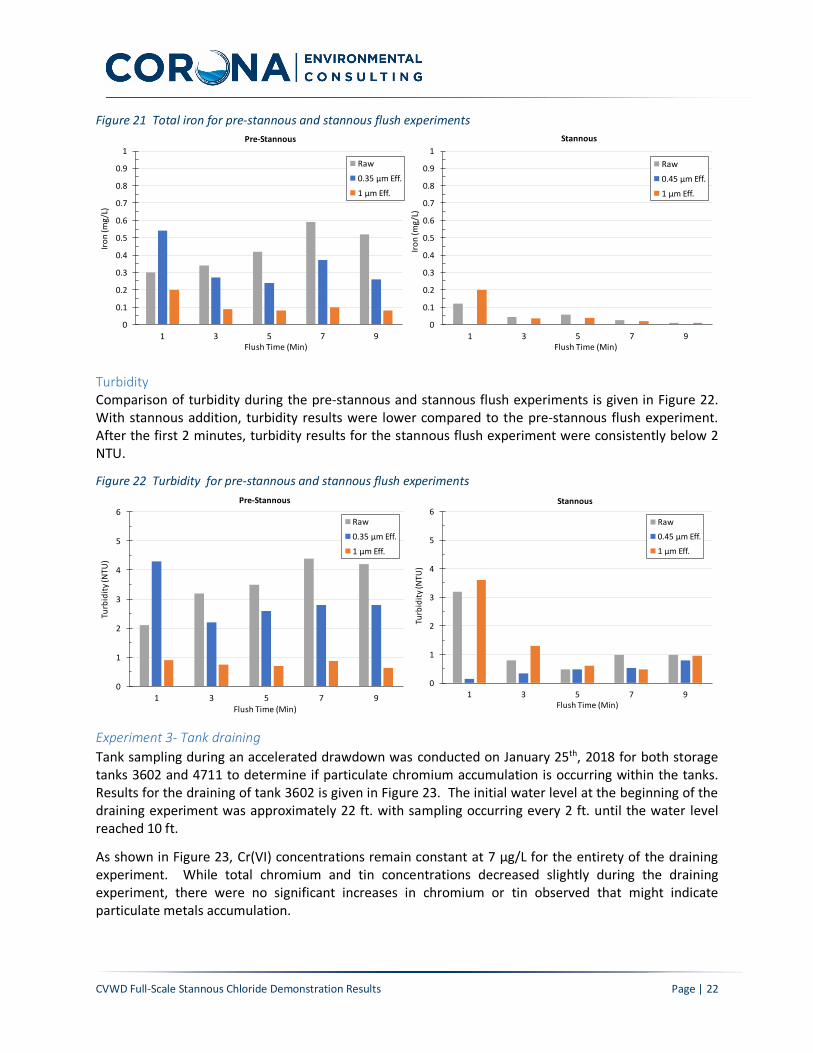
Iron Comparison of iron results during the pre-stannous and stannous flush event is shown in Figure 21. During the pre-stannous flush, iron concentrations ranged from 0.08 to 0.6 mg/L depending on filtration. For the stannous flush experiment, all iron results were below 0.08 mg/L after the first two minutes. This may be due to the short time interval between flushing events.
0
5
10
15
20
25
1 3 5 7 9
Cr(VI)(µg/L)
FlushTime(Min)
Raw0.35µmEff.1µmEff.
Pre-Stannous
0
5
10
15
20
25
1 3 5 7 9
Cr(VI)(µg/L)
FlushTime(Min)
Raw0.45µmEff.1µmEff.
Stannous
0
5
10
15
20
25
1 3 5 7 9
TotalChrom
ium(µg/L)
FlushTime(Min)
Raw0.35µmEff.1µmEff.
Pre-Stannous
0
5
10
15
20
25
1 3 5 7 9
TotalChrom
ium(µg/L)
FlushTime(Min)
Raw0.45µmEff.1µmEff.
Stannous
CVWD Full-Scale Stannous Chloride Demonstration Results Page | 22
Figure 21 Total iron for pre-stannous and stannous flush experiments
Turbidity Comparison of turbidity during the pre-stannous and stannous flush experiments is given in Figure 22. With stannous addition, turbidity results were lower compared to the pre-stannous flush experiment. After the first 2 minutes, turbidity results for the stannous flush experiment were consistently below 2 NTU.
Figure 22 Turbidity for pre-stannous and stannous flush experiments
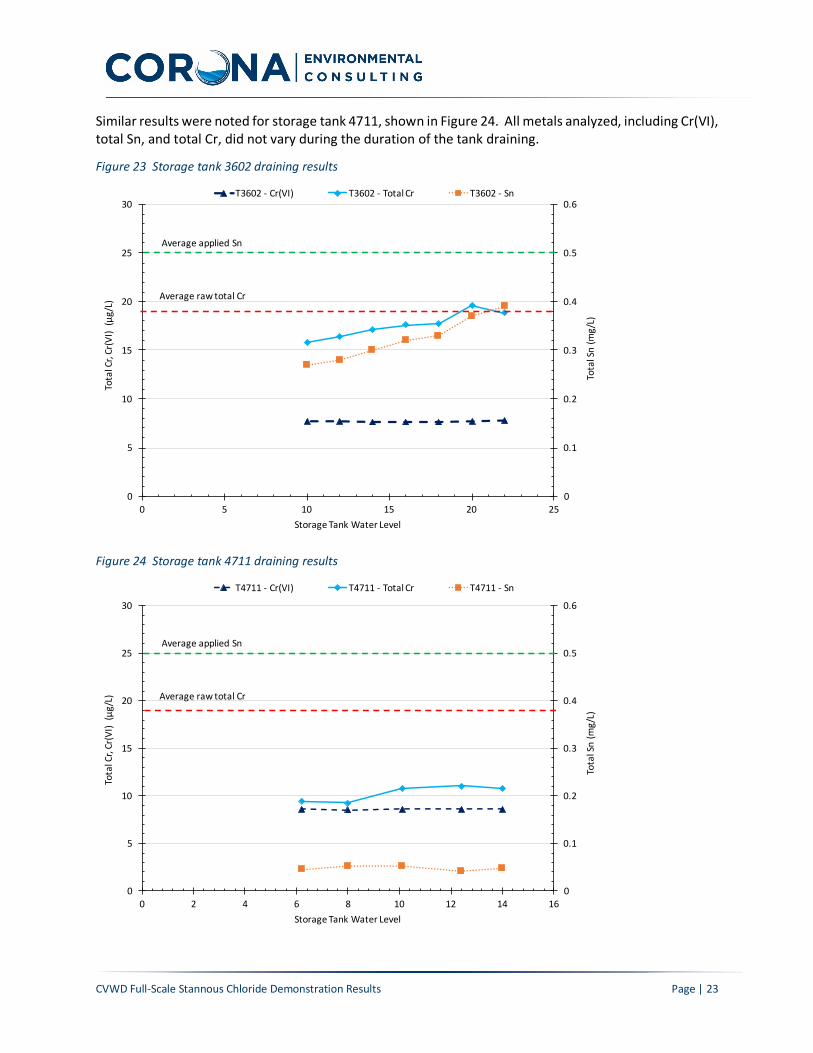
Experiment 3- Tank draining Tank sampling during an accelerated drawdown was conducted on January 25th, 2018 for both storage tanks 3602 and 4711 to determine if particulate chromium accumulation is occurring within the tanks. Results for the draining of tank 3602 is given in Figure 23. The initial water level at the beginning of the draining experiment was approximately 22 ft. with sampling occurring every 2 ft. until the water level reached 10 ft.
As shown in Figure 23, Cr(VI) concentrations remain constant at 7 µg/L for the entirety of the draining experiment. While total chromium and tin concentrations decreased slightly during the draining experiment, there were no significant increases in chromium or tin observed that might indicate particulate metals accumulation.
0
0.1
0.2
0.3
0.4
0.5
0.6
0.7
0.8
0.9
1
1 3 5 7 9
Iron(m
g/L)
FlushTime(Min)
Raw0.45µmEff.1µmEff.
Stannous
0
0.1
0.2
0.3
0.4
0.5
0.6
0.7
0.8
0.9
1
1 3 5 7 9
Iron(m
g/L)
FlushTime(Min)
Raw0.35µmEff.1µmEff.
Pre-Stannous
0
1
2
3
4
5
6
1 3 5 7 9
Turbidity
(NTU
)
FlushTime(Min)
Raw0.35µmEff.1µmEff.
Pre-Stannous
0
1
2
3
4
5
6
1 3 5 7 9
Turbidity
(NTU
)
FlushTime(Min)
Raw0.45µmEff.1µmEff.
Stannous
CVWD Full-Scale Stannous Chloride Demonstration Results Page | 23
Similar results were noted for storage tank 4711, shown in Figure 24. All metals analyzed, including Cr(VI), total Sn, and total Cr, did not vary during the duration of the tank draining.
Figure 23 Storage tank 3602 draining results
Figure 24 Storage tank 4711 draining results
0
0.1
0.2
0.3
0.4
0.5
0.6
0
5
10
15
20
25
30
0 5 10 15 20 25
TotalSn(m
g/L)
TotalCr,Cr(VI)(µ
g/L)
StorageTankWaterLevel
T3602- Cr(VI) T3602- TotalCr T3602- Sn
Average rawtotalCr
Average appliedSn
0
0.1
0.2
0.3
0.4
0.5
0.6
0
5
10
15
20
25
30
0 2 4 6 8 10 12 14 16
TotalSn(m
g/L)
TotalCr,Cr(VI)(µ
g/L)
StorageTankWaterLevel
T4711- Cr(VI) T4711- TotalCr T4711- Sn
Average rawtotalCr
Average appliedSn
CVWD Full-Scale Stannous Chloride Demonstration Results Page | 24
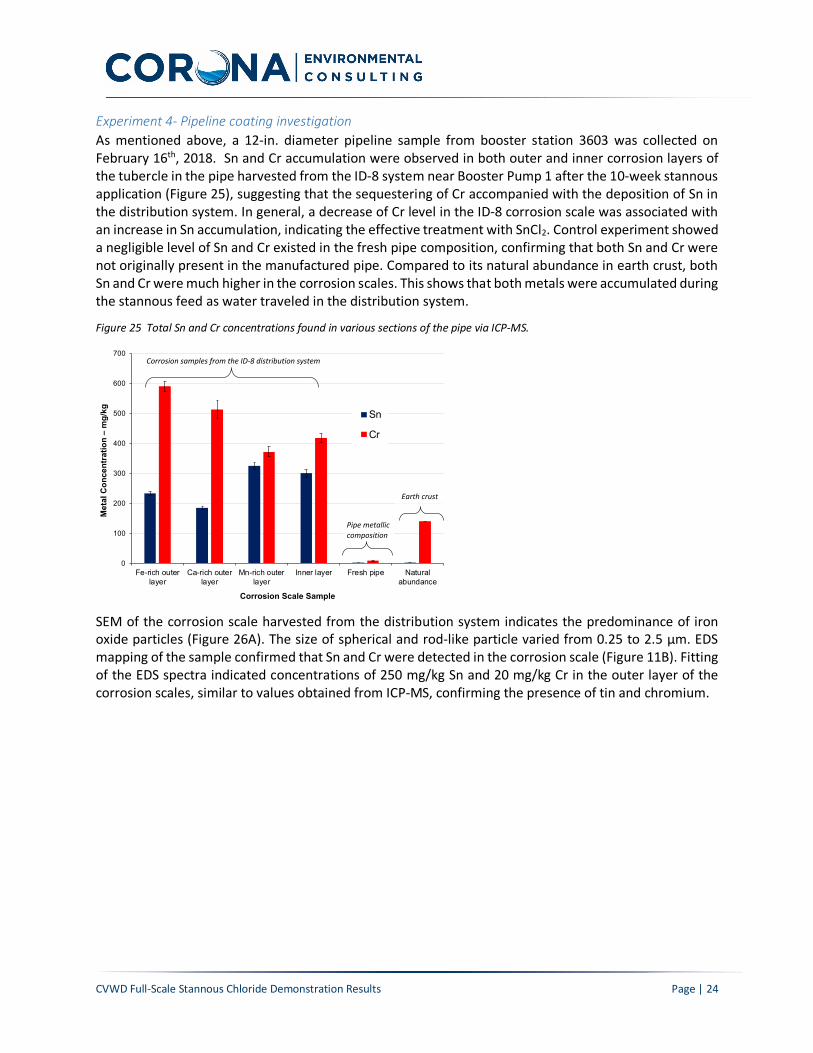
Experiment 4- Pipeline coating investigation As mentioned above, a 12-in. diameter pipeline sample from booster station 3603 was collected on February 16th, 2018. Sn and Cr accumulation were observed in both outer and inner corrosion layers of the tubercle in the pipe harvested from the ID-8 system near Booster Pump 1 after the 10-week stannous application (Figure 25), suggesting that the sequestering of Cr accompanied with the deposition of Sn in the distribution system. In general, a decrease of Cr level in the ID-8 corrosion scale was associated with an increase in Sn accumulation, indicating the effective treatment with SnCl2. Control experiment showed a negligible level of Sn and Cr existed in the fresh pipe composition, confirming that both Sn and Cr were not originally present in the manufactured pipe. Compared to its natural abundance in earth crust, both Sn and Cr were much higher in the corrosion scales. This shows that both metals were accumulated during the stannous feed as water traveled in the distribution system.
Figure 25 Total Sn and Cr concentrations found in various sections of the pipe via ICP-MS.
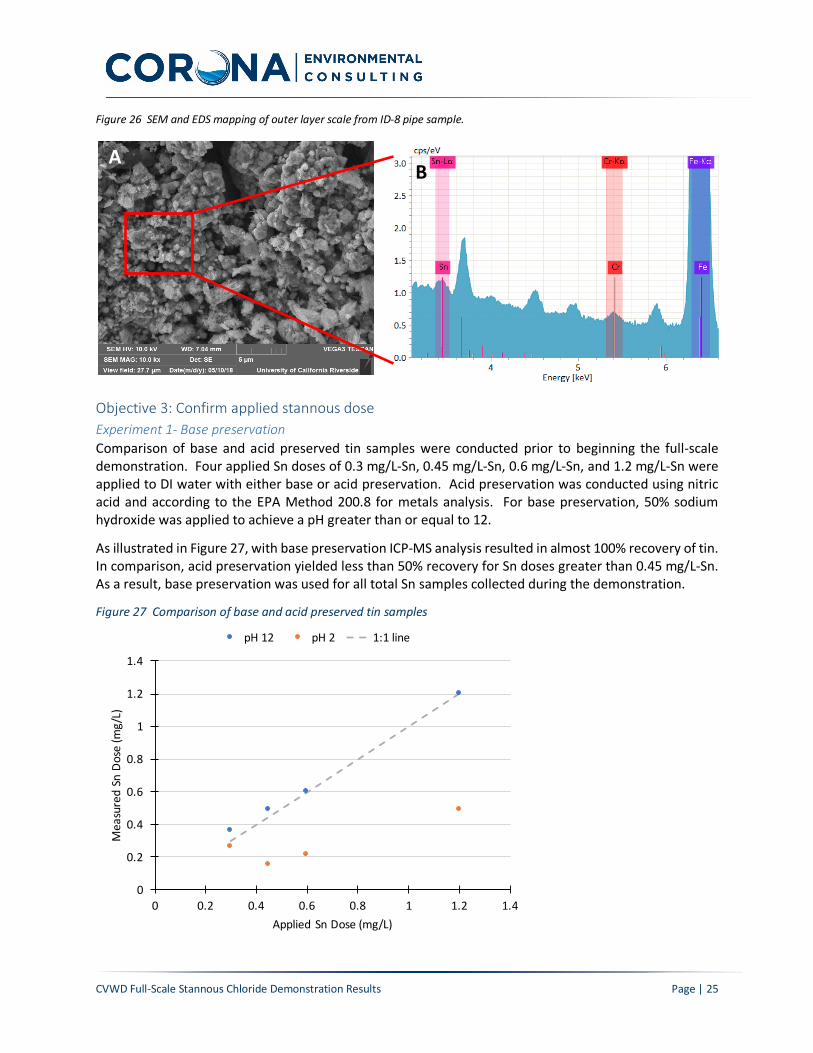
SEM of the corrosion scale harvested from the distribution system indicates the predominance of iron oxide particles (Figure 26A). The size of spherical and rod-like particle varied from 0.25 to 2.5 µm. EDS mapping of the sample confirmed that Sn and Cr were detected in the corrosion scale (Figure 11B). Fitting of the EDS spectra indicated concentrations of 250 mg/kg Sn and 20 mg/kg Cr in the outer layer of the corrosion scales, similar to values obtained from ICP-MS, confirming the presence of tin and chromium.
0
100
200
300
400
500
600
700
Fe-rich outerlayer
Ca-rich outerlayer
Mn-rich outerlayer
Inner layer Fresh pipe Naturalabundance
Met
al C
once
ntra
tion
‒ m
g/kg
Corrosion Scale Sample
Sn
Cr
Corrosion samples from the ID-8 distribution system
Pipe metallic composition
Earth crust
CVWD Full-Scale Stannous Chloride Demonstration Results Page | 25
Figure 26 SEM and EDS mapping of outer layer scale from ID-8 pipe sample.
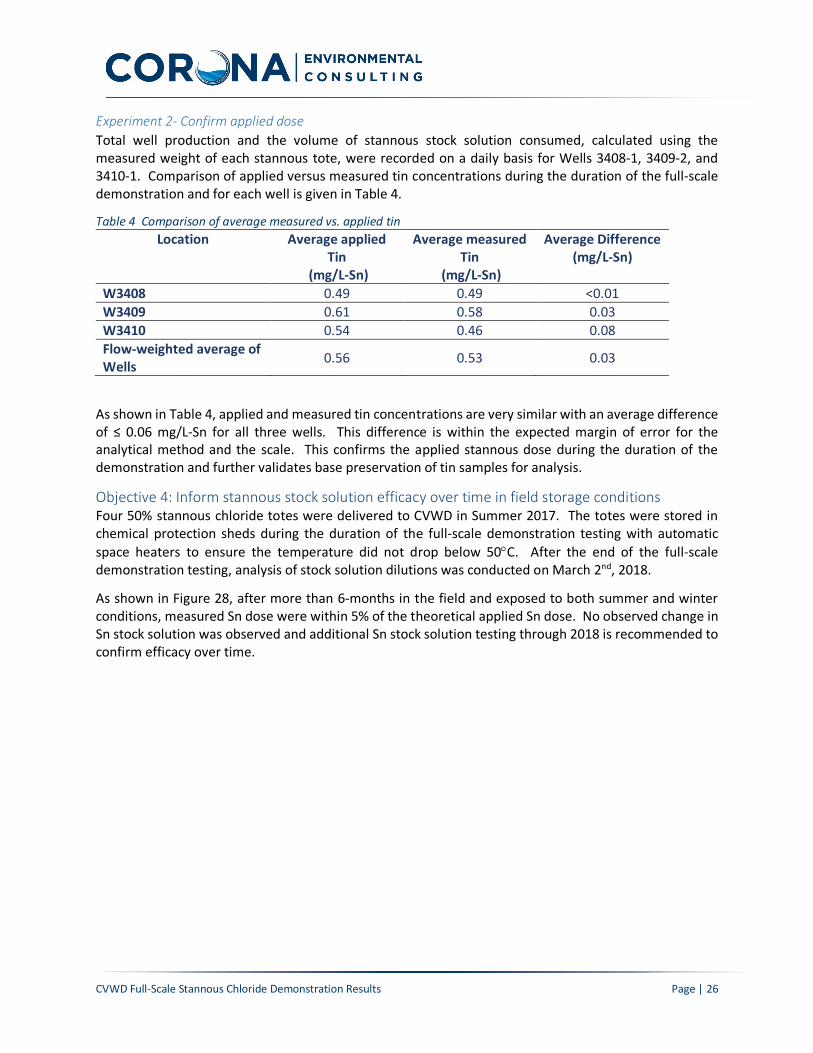
Objective 3: Confirm applied stannous dose Experiment 1- Base preservation Comparison of base and acid preserved tin samples were conducted prior to beginning the full-scale demonstration. Four applied Sn doses of 0.3 mg/L-Sn, 0.45 mg/L-Sn, 0.6 mg/L-Sn, and 1.2 mg/L-Sn were applied to DI water with either base or acid preservation. Acid preservation was conducted using nitric acid and according to the EPA Method 200.8 for metals analysis. For base preservation, 50% sodium hydroxide was applied to achieve a pH greater than or equal to 12.
As illustrated in Figure 27, with base preservation ICP-MS analysis resulted in almost 100% recovery of tin. In comparison, acid preservation yielded less than 50% recovery for Sn doses greater than 0.45 mg/L-Sn. As a result, base preservation was used for all total Sn samples collected during the demonstration.
Figure 27 Comparison of base and acid preserved tin samples
AB
0
0.2
0.4
0.6
0.8
1
1.2
1.4
0 0.2 0.4 0.6 0.8 1 1.2 1.4
MeasuredSnDose(m
g/L)
Applied SnDose(mg/L)
pH12 pH2 1:1line
CVWD Full-Scale Stannous Chloride Demonstration Results Page | 26
Experiment 2- Confirm applied dose Total well production and the volume of stannous stock solution consumed, calculated using the measured weight of each stannous tote, were recorded on a daily basis for Wells 3408-1, 3409-2, and 3410-1. Comparison of applied versus measured tin concentrations during the duration of the full-scale demonstration and for each well is given in Table 4.
Table 4 Comparison of average measured vs. applied tin Location Average applied
Tin (mg/L-Sn)
Average measured Tin
(mg/L-Sn)
Average Difference (mg/L-Sn)
W3408 0.49 0.49 <0.01 W3409 0.61 0.58 0.03 W3410 0.54 0.46 0.08 Flow-weighted average of Wells 0.56 0.53 0.03
As shown in Table 4, applied and measured tin concentrations are very similar with an average difference of ≤ 0.06 mg/L-Sn for all three wells. This difference is within the expected margin of error for the analytical method and the scale. This confirms the applied stannous dose during the duration of the demonstration and further validates base preservation of tin samples for analysis.
Objective 4: Inform stannous stock solution efficacy over time in field storage conditions Four 50% stannous chloride totes were delivered to CVWD in Summer 2017. The totes were stored in chemical protection sheds during the duration of the full-scale demonstration testing with automatic space heaters to ensure the temperature did not drop below 50°C. After the end of the full-scale demonstration testing, analysis of stock solution dilutions was conducted on March 2nd, 2018.
As shown in Figure 28, after more than 6-months in the field and exposed to both summer and winter conditions, measured Sn dose were within 5% of the theoretical applied Sn dose. No observed change in Sn stock solution was observed and additional Sn stock solution testing through 2018 is recommended to confirm efficacy over time.
CVWD Full-Scale Stannous Chloride Demonstration Results Page | 27
Figure 28 Sn stock solution confirmation
Summary and Recommendations Important considerations for other utilities
Sole supplier At the time of writing, Guard Products was the sole chemical supplier for the 5% and 50% stannous chloride solutions that are NSF approved. The utility patent for reduction of Cr(VI) via stannous chloride solution (US6649071B2) was filed on January 26th, 2001 and will expire on January 26th, 2020. On January 5th, 2016, the patent temporarily expired due to failure to pay maintenance fees, but was reinstated in November 2017, after a petition related to maintenance fees was granted.
Issues with dilution of stannous For the full-scale demonstration, stannous solution was fed with no dilution for the duration of this experiment. Previous experimentation using diluted stannous had variable results. It is likely that stannous reacts with oxygen in the water used for dilution and is oxidized to stannic, which is unable to reduce Cr(VI) to Cr(III). We strongly recommend using stannous solution without any dilution in all future applications.
Base preservation Typically metals samples are preserved with acid, but in the case of Sn it is not acid soluble. Samples collected with acid preservation did not have the expected dose of Sn, however, base preservation was successfully shown to resolve this issue. Samples should be preserved with hydroxide, and a pH of 12 or higher should be achieved.
Cold sensitivity The PAS-8150 (50% stannous chloride) will become semi-solid at about 50°F, whereas the PAS-8105 (5% stannous chloride) has a freezing point near that of water (personal communication Gary Westlund, November 8, 2017). During the full-scale demonstration, the night time temperature did approach 50°F, which likely caused the stannous solution to become semi-solid in the chemical feed tubes. This may have been the cause of the stannous feed disruption between December 8th and 11th. Electric heaters were installed in the chemical feed enclosures, and there was no recurrence of the incident.
0
10
20
30
40
50
60
0 10 20 30 40 50 60
MeasuredSnDose(µg/L)
AppliedSnDose(µg/L)
Sn50%StockSolution 1:1Line

CVWD Full-Scale Stannous Chloride Demonstration Results Page | 28
Conclusions The full-scale demonstration of stannous chloride treatment to reduce hexavalent chromium to trivalent chromium was overall successful. The water quality goals were met on average for a period of four weeks at all sampling locations. Hexavalent chromium concentrations were maintained below the previous MCL of 10 µg/L throughout the distribution system in the presence of free chlorine. Summary of ID-8 system water quality during the full-scale demonstration is given in Table 5. While some Cr(VI) reoxidation occurred downstream of the POEs, the reoxidation reaction was complete by the first sample location in the distribution system, Tank 1. Water quality goals for turbidity and total Cr were also met for the entire duration of testing and no changes in pH or temperature were observed.
Table 5 Average ID-8 distribution system water quality during demonstration testing Sample Location
Sn (mg/L)
Cr(VI) (µg/L)
Total Cr (µg/L)
Turbidity (NTU)
pH (S.U.)
Temperature (°C)
HPC (CFU/mL)
Weighted Avg. Wells
0.52 ± 0.12 (29)
5.0 ± 3.5 (29)
19.5 ± 2.6 (29)
0.27 ± 0.11 (9)
7.9 ± 0.3 (24)
25.3 ± 1.6 (24) <1 (24)
Tank 1 0.35 ± 0.10 (28)
7.7 ± 3.2 (28)
18.5 ± 3.2 (28)
0.22 ± 0.07 (9)
8.0 ± 0.2 (24)
25.3 ± 1.5 (24)
399 ± 296 (9)
Booster Pump 1
0.23 ± 0.11 (28)
8.2 ± 2.7 (28)
15.1 ± 3.1 (28)
0.22 ± 0.07 (9)
8.0 ± 0.2 (24)
24.5 ± 1.2 (24) 2 ± 2 (9)
Tank 2 0.19 ± 0.04 (19)
7.2 ± 1.2 (19)
13.6 ± 1.5 (19)
0.16 ± 0.08 (8)
8.0 ± 0.1 (17)
22.3 ± 1.3 (17) <1 (6)
Tank 3 0.11 ± 0.10 (15)
8.1 ± 0.8 (15)
12.8 ± 5.7 (15)
0.34 ± 0.26 (9)
8.1 ± 0.2 (15)
22.5 ± 1.3 (15) 1 ± 0.4 (5)
While Sn and Cr concentrations decreased with increased distance from the POEs, this was anticipated as Sn is a corrosion inhibitor intended to coat pipe walls. If the demonstration period was extended, it is possible that Sn plating of pipe walls would reach equilibrium and concentrations of Sn and Cr at the end of the distribution system would match that measured at the POEs. Main flushing at the end of the demonstration near Tank 3 resulted in no increased Sn or Cr, indicating metals are not readily released from pipe walls during flushing events. Pipe section analysis confirmed that Sn was deposited onto the inner pipe walls and incorporated into the corrosion products.
Next steps
The full-scale demonstration met water quality goals and objectives for the project. Corona recommends CVWD analyze total metals, including Sn and Cr levels, found in sediments removed from ID8 tanks during the next tank cleaning to characterize the sediments prior to disposal. CVWD should continue working with DDW staff during the development of a new Cr(VI) MCL to include stannous addition as an approved technology for reducing Cr(VI) levels in drinking water.
Upon establishment of a new Cr(VI) MCL, Corona recommends CVWD pursue full scale stannous addition permitting with DDW to reduce Cr(VI) levels in any wells impacted by the new MCL. Concurrent with any implementation of stannous addition, Corona recommends monitoring of potential accumulation and release of chromium in the distribution system under different operational scenarios. Special monitoring performed during any interruptions in Sn and chlorine addition and during scour flow events can assist with full-scale implementation. This monitoring may help answer outstanding research questions and provide additional operating information but are not required for the DDW permitting process.