Embed Size (px)
Citation preview
CVD in CKD::::Asian Experience
CVD in CKD::::Asian Experience
KDIGO-CVD Conference2010.10.29. London, UKKDIGO-CVD Conference2010.10.29. London, UK
Asian ExperienceAsian Experience
Kunitoshi IsekiDialysis Unit, University Hospital of The Ryukyus,
Okinawa, Japan
Kunitoshi IsekiDialysis Unit, University Hospital of The Ryukyus,
Okinawa, Japan
1. General Japanese population
Prevalence of “lifestyle related disease”
Trends of BMI & proteinuria among screened subjects
Studies on CKD vs. CVD
eGFR, proteinuria, and underlying kidney disease
2. ESRD population: demographics
The Japanese Society for Dialysis Therapy (JSDT) registry
Underlying kidney disease, age, gender
Contents of the PresentationContents of the Presentation
Underlying kidney disease, age, gender
Causes of death: GP vs. ESRD
3. Factors related to increased mortality risk among ESRD patients
Pre-HD blood pressure & pulse rate
RAS vs. non-RAS drugs
Treatment of hypertension: ongoing RCT
4. Asian Forum of CKD Initiative (ACKDI)
Pan Asian CKD registry
Rapid increase in ESRD patients in China
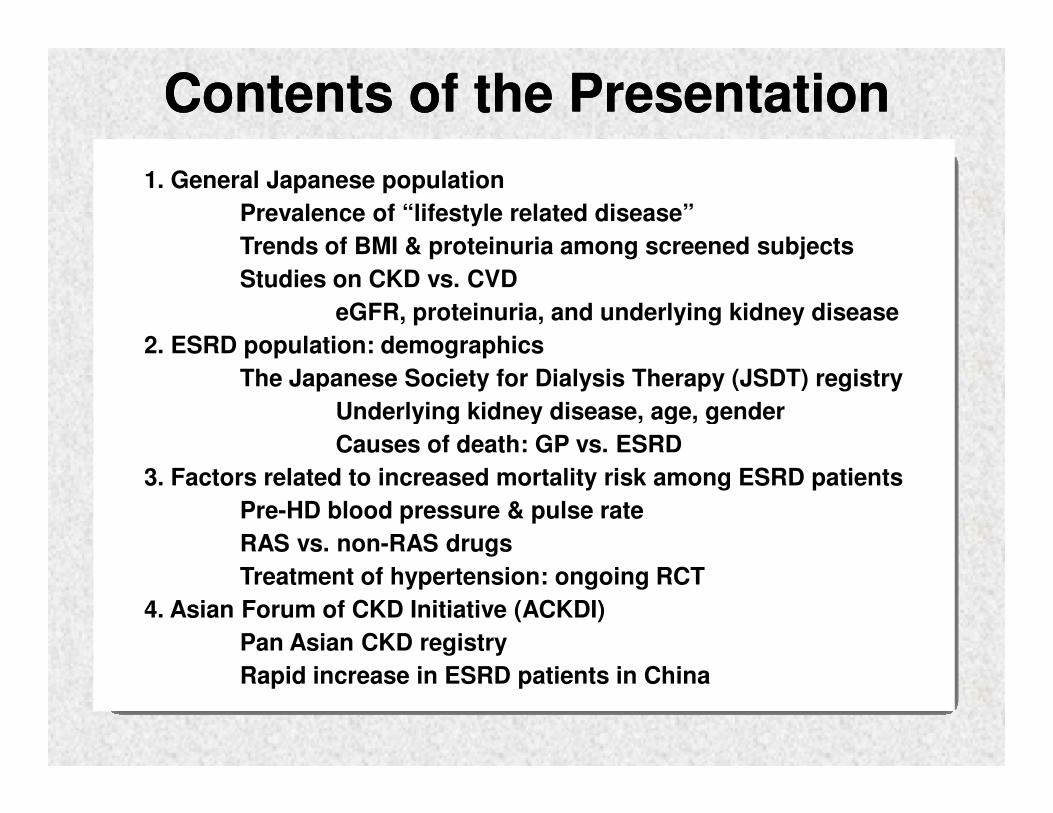
Lifestyle related diseaseLifestyle related disease
3,500
740
880
600
1,100
Hypertension
DM
Pre-DM
Dyslipidemia
Obesity 1,100
500
30~~~~50
1,330
X10,000
Obesity
Hyperuricemia
Gout
CKD
Japanese eGFR formula
Matsuo S et al. Am J Kidney Dis 53:982-992, 2009
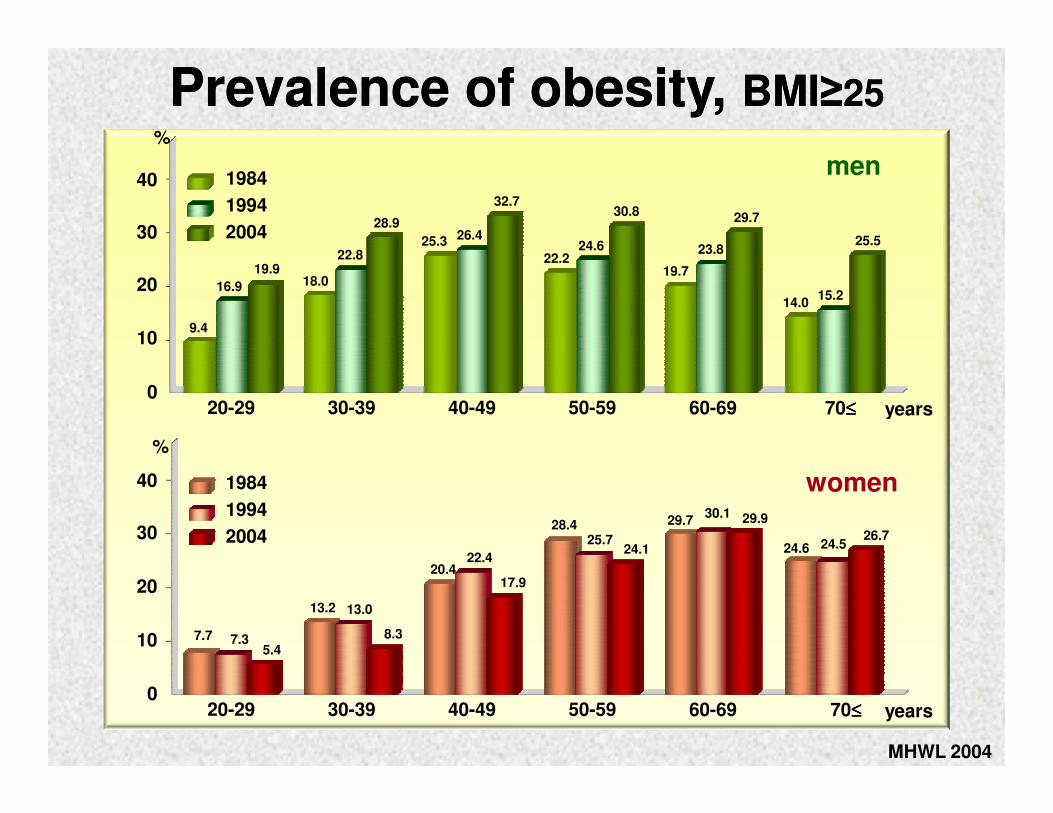
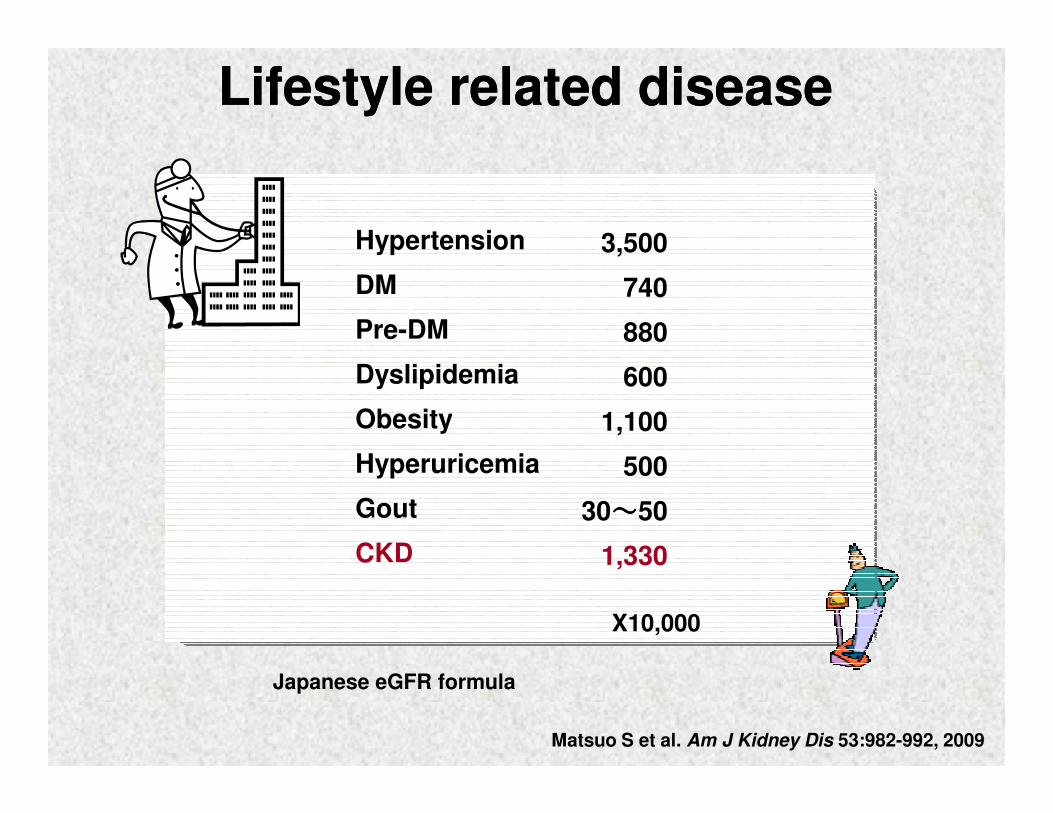
20-29 30-39 40-49 50-59 60-69 70≤≤≤≤ years0
10
20
30
40
%
men1984
1994
2004
16.9
19.918.0
22.8
28.9
25.3 26.4
32.7
22.224.6
30.8
19.7
23.8
29.7
25.5
15.214.0
9.4
Prevalence of obesity, Prevalence of obesity, BMIBMI≥≥2525
MHWL 2004
20-29 30-39 40-49 50-59 60-69 70≤≤≤≤ years0
10
20
30
40
%
women1984
1994
2004
7.7 7.35.4
13.2 13.0
8.3
20.422.4
17.9
28.425.7
24.1
29.7 29.930.1
26.724.6 24.5
20-29 30-39 40-49 50-59 60-69 70≤≤≤≤ years
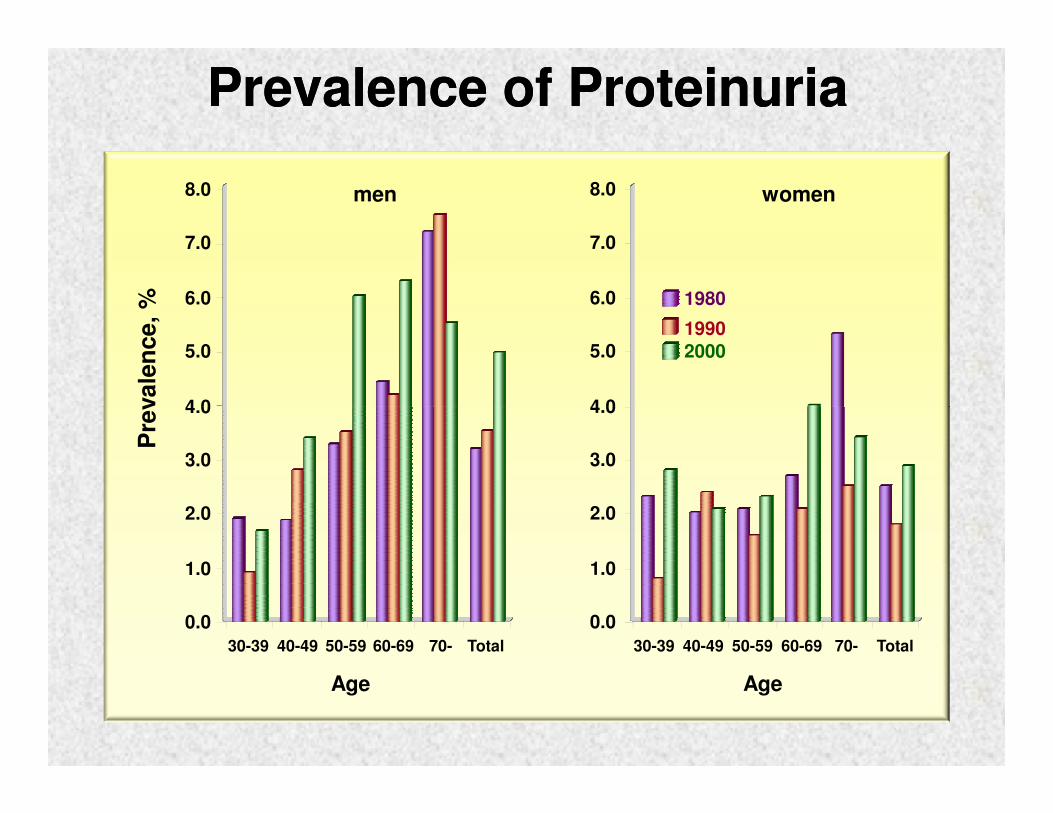
4.0
5.0
6.0
7.0
8.0
1980
1990
2000
4.0
5.0
6.0
7.0
8.0
Pre
vale
nce,
%
Prevalence of ProteinuriaPrevalence of Proteinuria
men women
0.0
1.0
2.0
3.0
4.0
30-39 40-49 50-59 60-69 70- Total30-39 40-49 50-59 60-69 70- Total
0.0
1.0
2.0
3.0
4.0
Pre
vale
nce,
%
Age Age
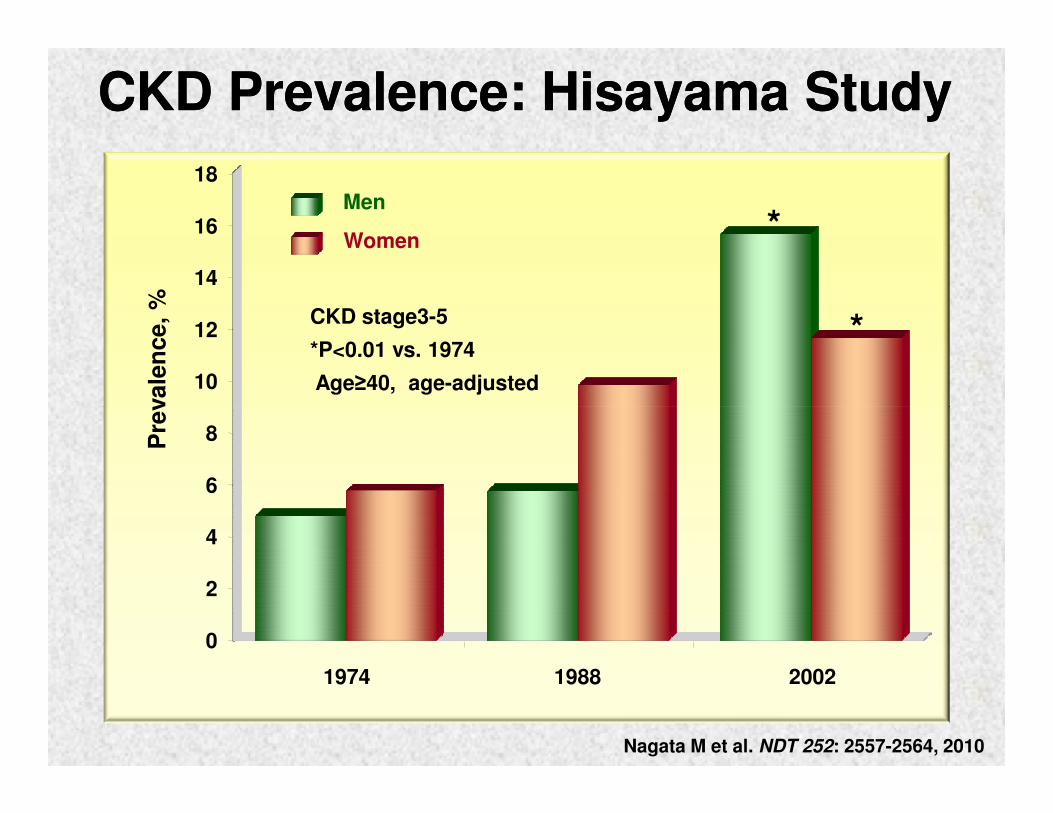
CKD Prevalence: Hisayama StudyCKD Prevalence: Hisayama Study
Men
Women
CKD stage3-5
*P<0.01 vs. 1974
Age≥40, age-adjusted*
*
*
Pre
vale
nce,
%
10
12
14
16
18
Nagata M et al. NDT 252: 2557-2564, 2010
1974 1988 2002
Pre
vale
nce,
%
0
2
4
6
8
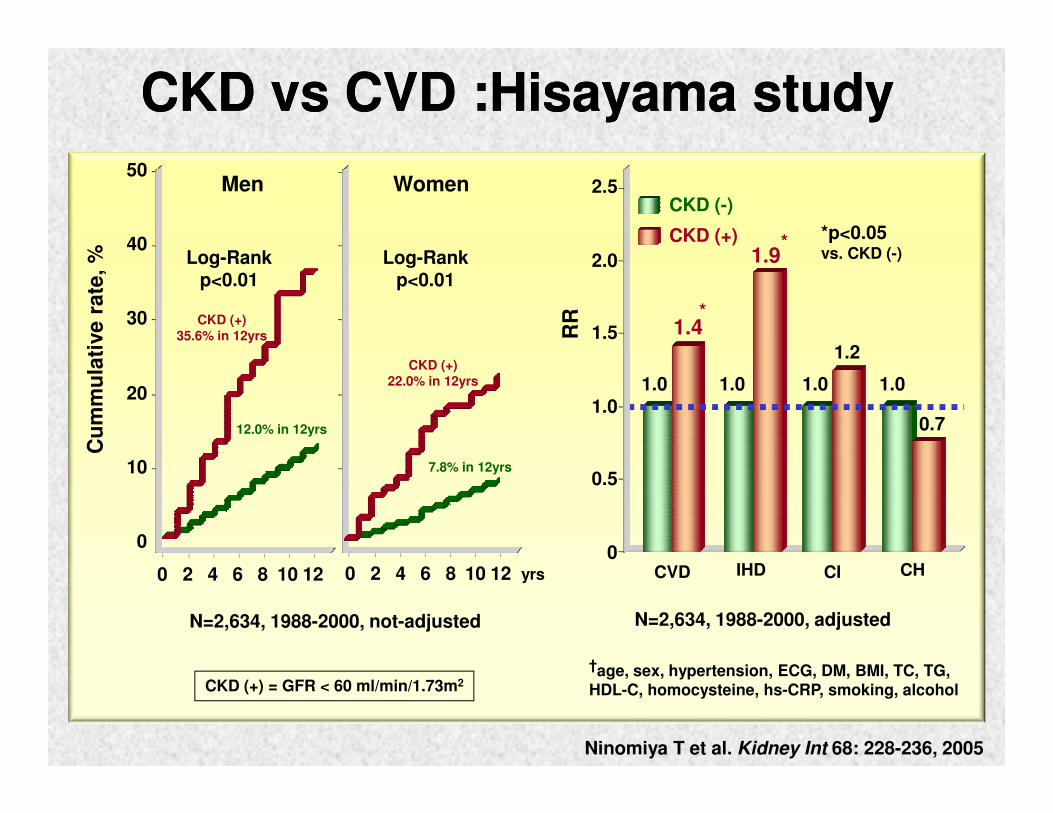
Men Women
Log-Rank p<0.01
Cu
mm
ula
tive r
ate
, % Log-Rank
p<0.01
CKD (+)
35.6% in 12yrs
CKD (+)
22.0% in 12yrs
*p<0.05 vs. CKD (-)
CKD (-)
RR
1.0
1.5
2.0
2.5
1.01.0
1.4
1.0
1.9
1.0
1.2
*
*CKD (+)
50
40
30
20
CKD vs CVD :Hisayama studyCKD vs CVD :Hisayama study
Ninomiya T et al. Kidney Int 68: 228-236, 2005
0 2 4 6 8 10 12
Cu
mm
ula
tive r
ate
, %
yrs
12.0% in 12yrs
7.8% in 12yrs
†age, sex, hypertension, ECG, DM, BMI, TC, TG, HDL-C, homocysteine, hs-CRP, smoking, alcohol
0
0.5
1.0
CVD IHD CI
0.7
CH
CKD (+) = GFR < 60 ml/min/1.73m2
10
0
0 2 4 6 8 10 12
N=2,634, 1988-2000, not-adjusted N=2,634, 1988-2000, adjusted
10
15
20
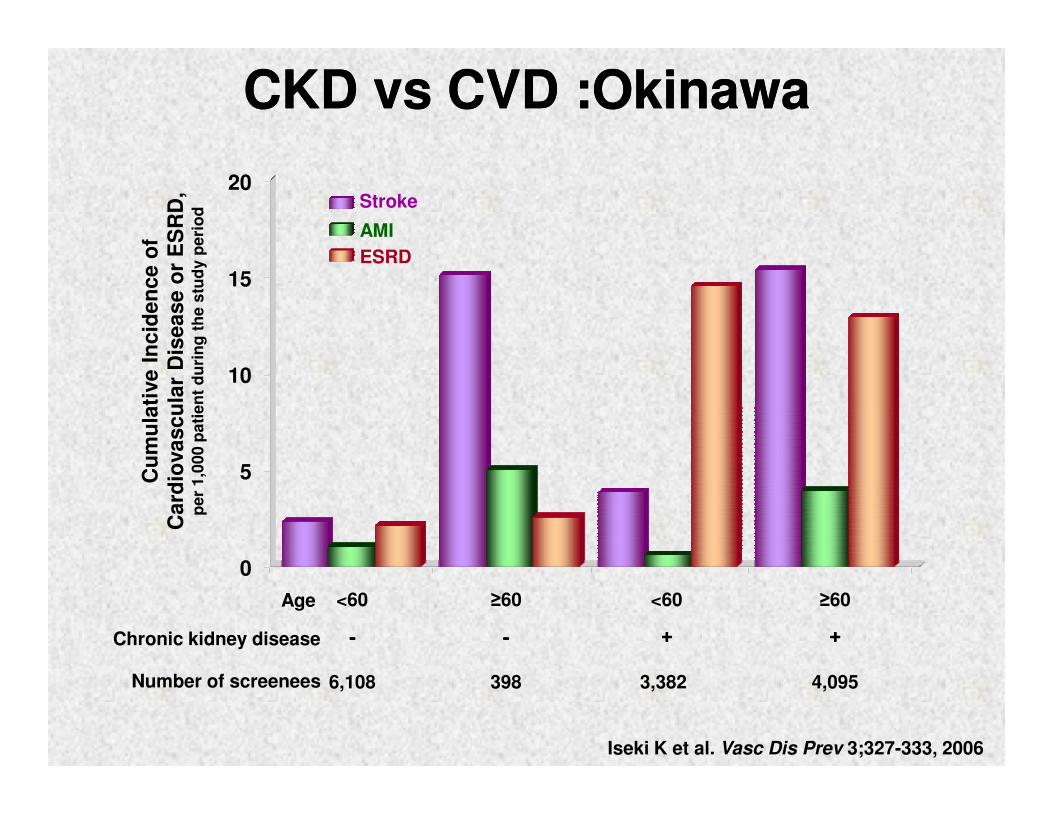
AMI
ESRD
CKD vs CVD :OkinawaCKD vs CVD :OkinawaC
um
ula
tive I
ncid
en
ce o
f C
ard
iovascu
lar
Dis
ease o
r E
SR
D,
pe
r 1
,00
0 p
ati
en
t d
uri
ng
th
e s
tud
y p
eri
od
Stroke
0
Iseki K et al. Vasc Dis Prev 3;327-333, 2006
<60 ≥60Age
Chronic kidney disease
6,108 398 3,382 4,095
<60 ≥60
Number of screenees
++++---- ++++----
Cu
mu
lati
ve I
ncid
en
ce o
f C
ard
iovascu
lar
Dis
ease o
r E
SR
D,
pe
r 1
,00
0 p
ati
en
t d
uri
ng
th
e s
tud
y p
eri
od
5
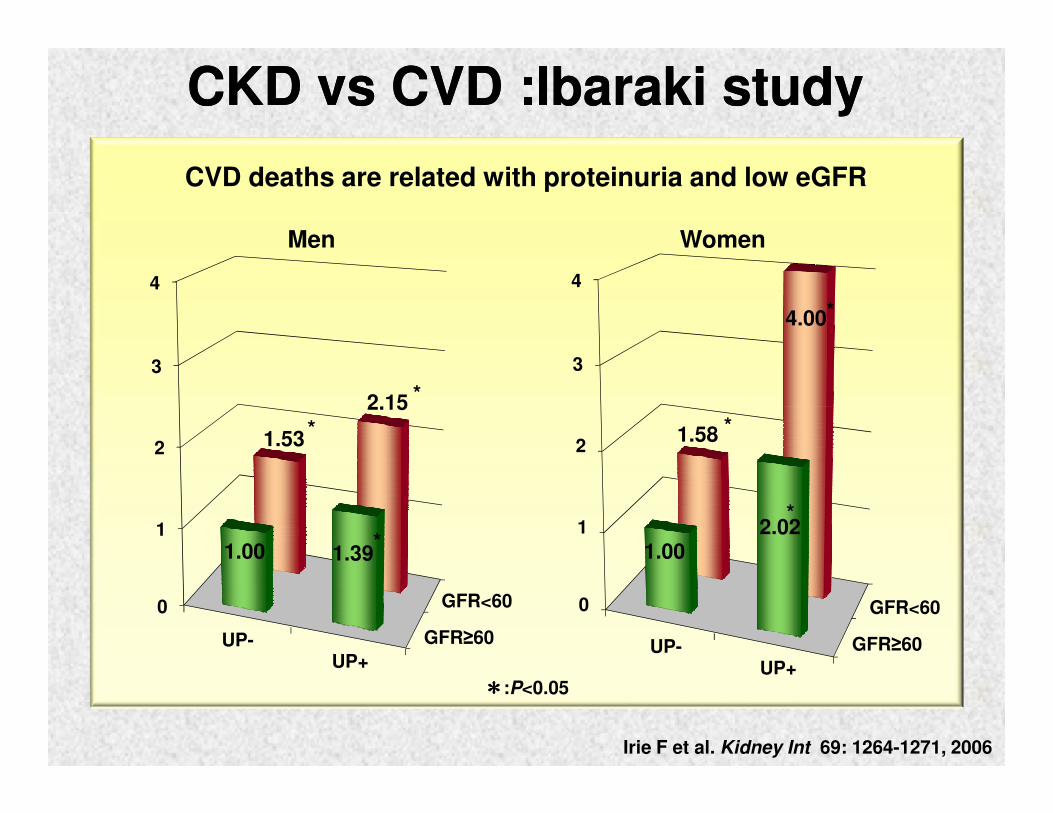
CVD deaths are related with proteinuria and low eGFR
Men Women
CKD vs CVD :Ibaraki studyCKD vs CVD :Ibaraki study
3
4
3
4
2.15 *
4.00*
Irie F et al. Kidney Int 69: 1264-1271, 2006
UP-UP+
GFR≥60
GFR<600
1
2
0
1
2
UP-UP+
GFR≥60
GFR<60
1.53
2.15
1.00 1.39
*
*
1.58
1.002.02
*
*
****:P<0.05
NH
O
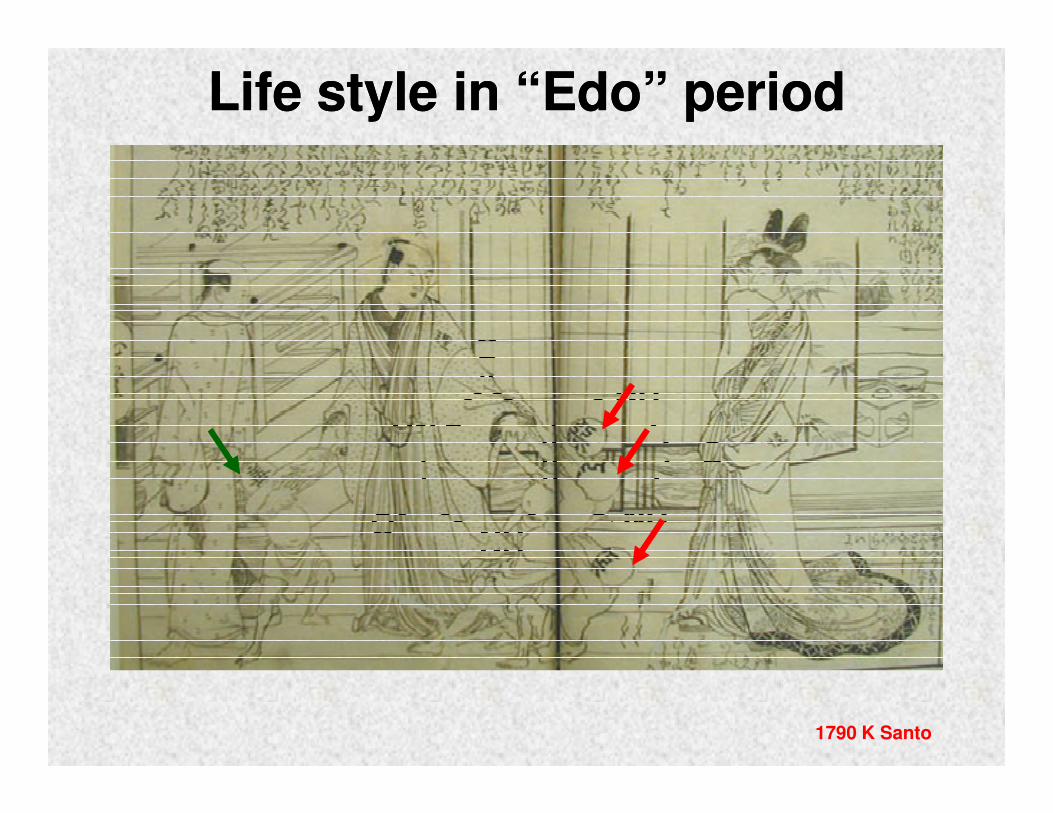
Life style in “Edo” periodLife style in “Edo” period
O
HNzzzz
NHNH
NH
O
1790 K Santo
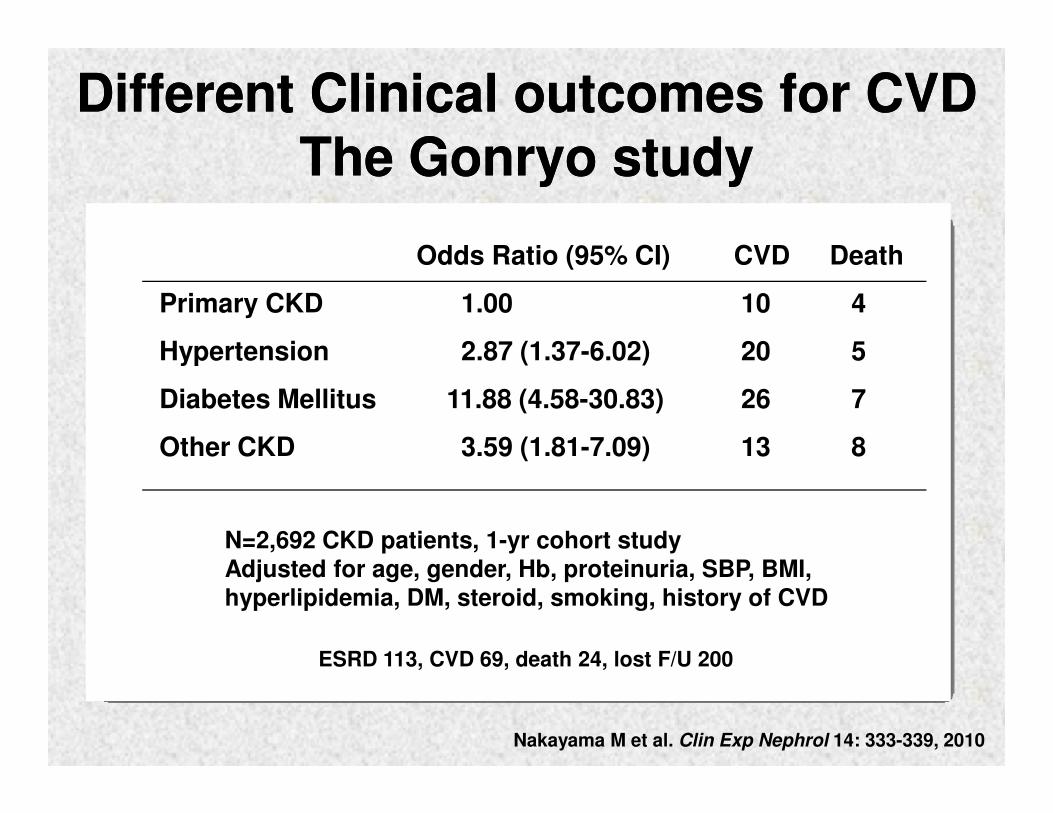
Odds Ratio (95% CI) CVD Death
Primary CKD 1.00 10 4
Hypertension 2.87 (1.37-6.02) 20 5
Diabetes Mellitus 11.88 (4.58-30.83) 26 7
Different Clinical outcomes for CVDDifferent Clinical outcomes for CVDThe Gonryo studyThe Gonryo study
Nakayama M et al. Clin Exp Nephrol 14: 333-339, 2010
N=2,692 CKD patients, 1-yr cohort studyAdjusted for age, gender, Hb, proteinuria, SBP, BMI, hyperlipidemia, DM, steroid, smoking, history of CVD
Diabetes Mellitus 11.88 (4.58-30.83) 26 7
Other CKD 3.59 (1.81-7.09) 13 8
ESRD 113, CVD 69, death 24, lost F/U 200
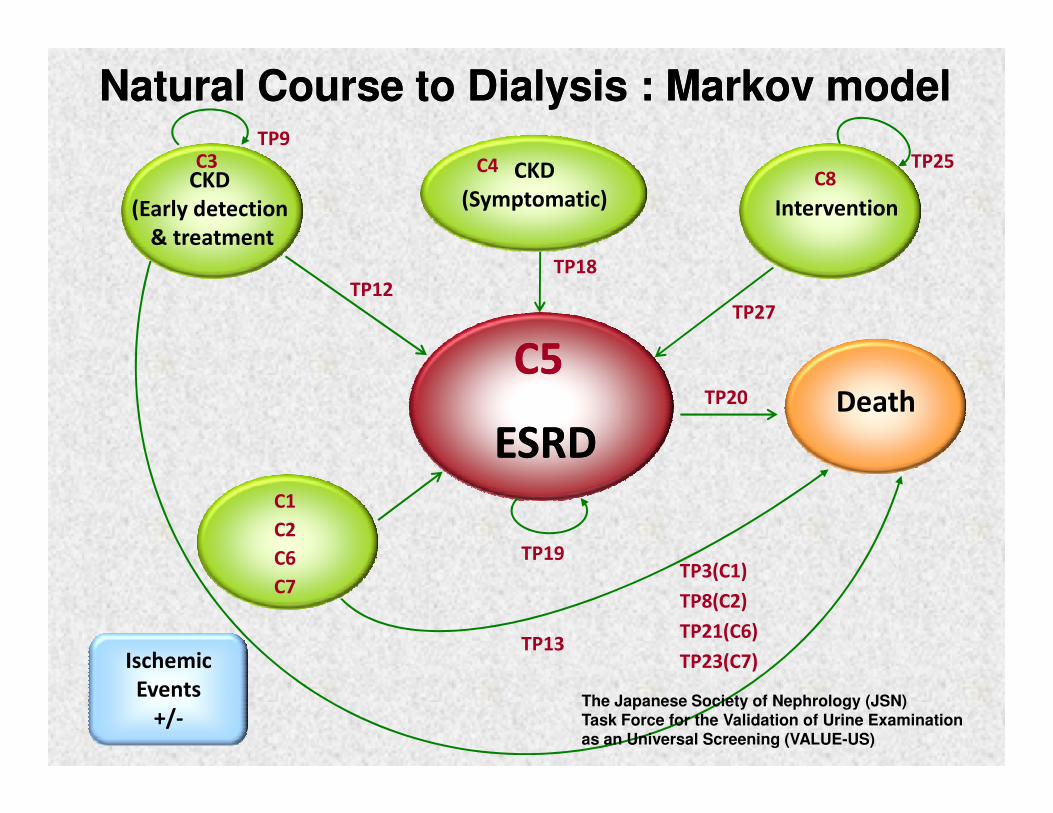
TP12TP18
TP20
TP27
C3 C4
C5C5
C8
TP9TP25
Death
CKD
(Early detection
& treatment
CKD
(Symptomatic) Intervention
Natural Course to Dialysis : Markov modelNatural Course to Dialysis : Markov model
TP20
TP21(C6)TP13
TP8(C2)
TP3(C1)
C1
TP23(C7)
C2
C6
C7
TP19
Death
ESRDESRD
Ischemic
Events
+/-The Japanese Society of Nephrology (JSN) Task Force for the Validation of Urine Examination as an Universal Screening (VALUE-US)
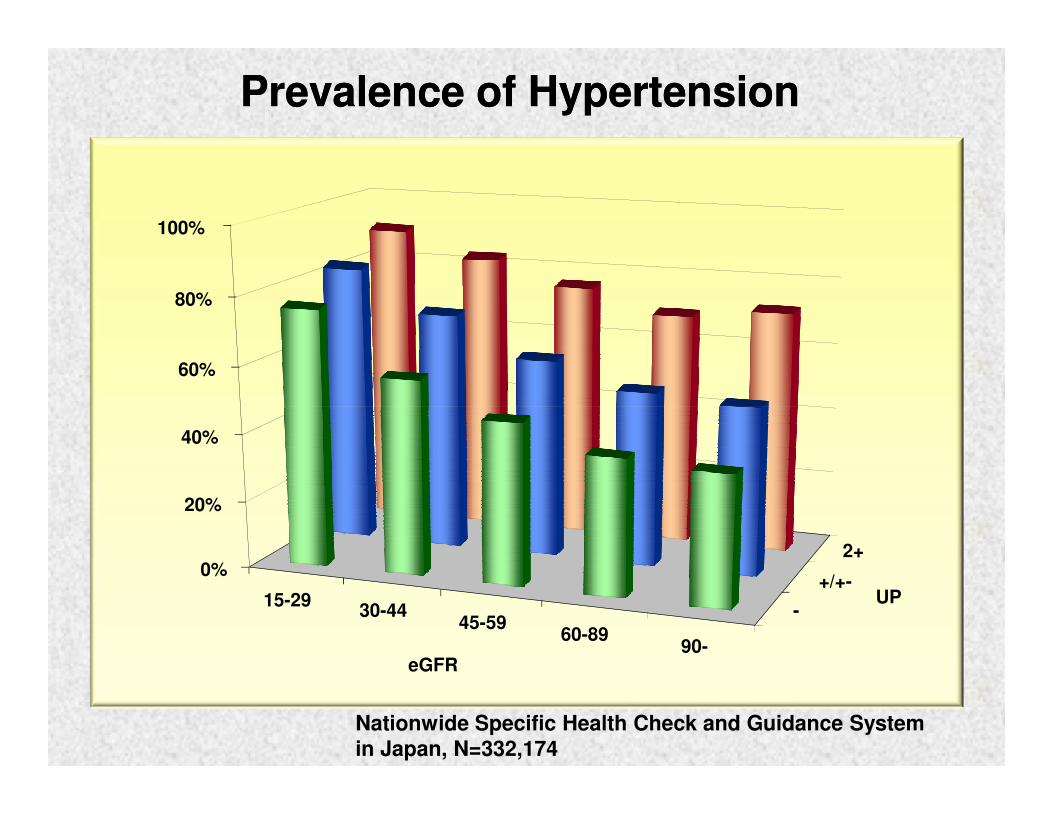
Prevalence of Hypertension Prevalence of Hypertension
60%
80%
100%
Nationwide Specific Health Check and Guidance System in Japan, N=332,174
15-2930-44
45-5960-89
90-
-
+/+-
2+0%
20%
40%
eGFR
UP
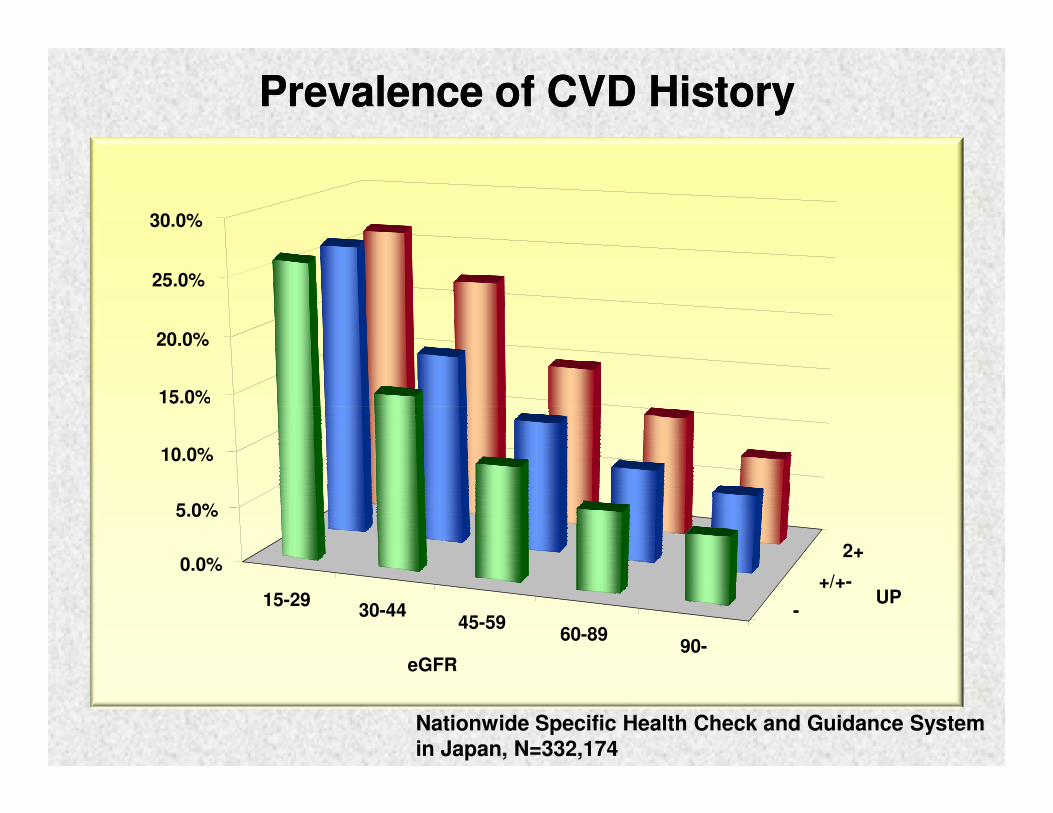
15.0%
20.0%
25.0%
30.0%
Prevalence of CVD HistoryPrevalence of CVD History
0.0%
5.0%
10.0%
15.0%
-
+/+-
2+
UP15-2930-44
45-5960-89
90-eGFR
Nationwide Specific Health Check and Guidance System in Japan, N=332,174
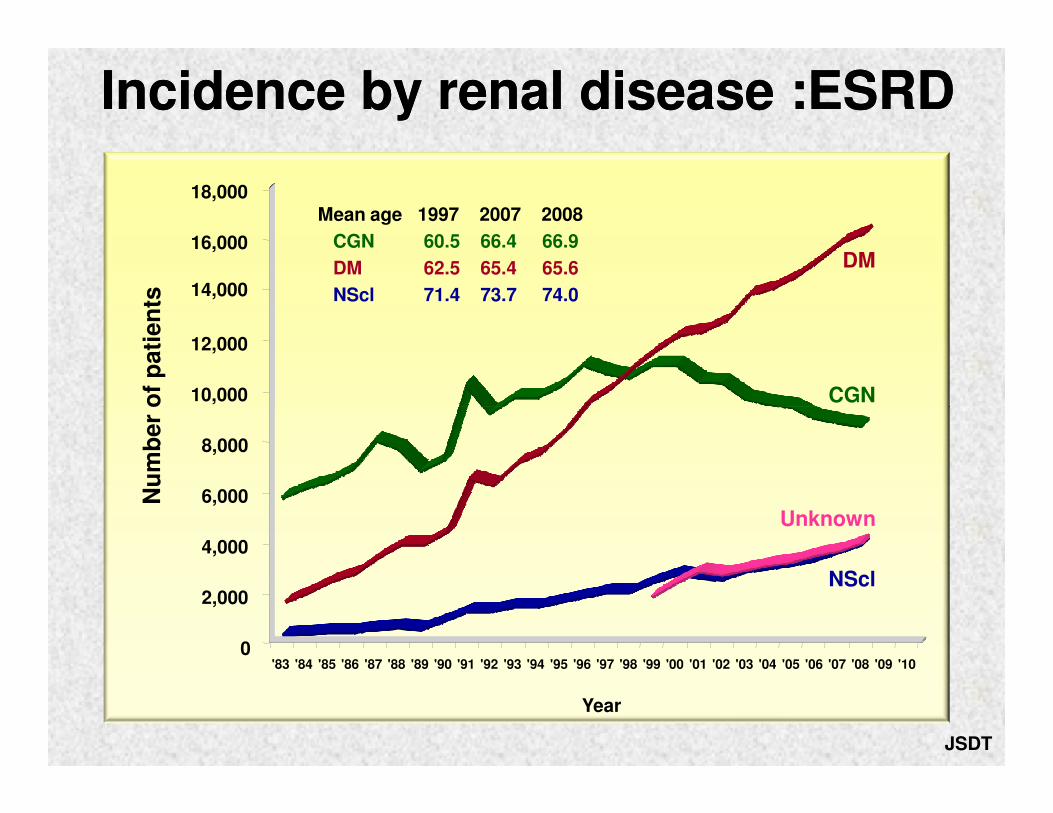
Incidence by renal disease :ESRDIncidence by renal disease :ESRDN
um
ber
of
pati
en
ts
12,000
16,000
CGN
DM
18,000
Mean age 1997 2007 2008
CGN 60.5 66.4 66.9
DM 62.5 65.4 65.6
NScl 71.4 73.7 74.0
10,000
14,000
JSDT
Year
Nu
mb
er
of
pati
en
ts
0
2,000
4,000
6,000
8,000
'83 '84 '85 '86 '87 '88 '89 '90 '91 '92 '93 '94 '95 '96 '97 '98 '99 '00 '01 '02 '03 '04 '05 '06
NScl
Unknown
'07 '08 '09 '10
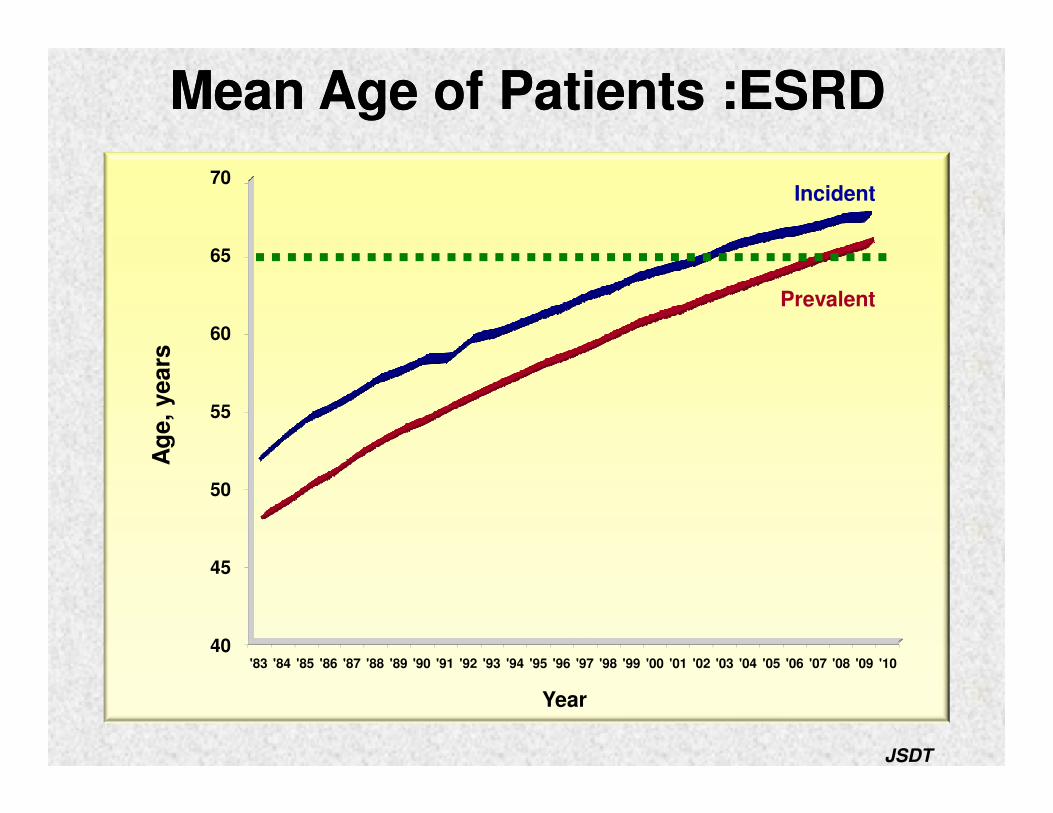
Mean Age of Patients :ESRDMean Age of Patients :ESRDA
ge,
years
Incident
Prevalent
55
60
65
70
Year
JSDT
Ag
e,
years
40
45
50
55
'83 '84 '85 '86 '87 '88 '89 '90 '91 '92 '93 '94 '95 '96 '97 '98 '99 '00 '01 '02 '03 '04 '05 '06 '07 '08 '09 '10
per
millio
n p
op
ula
tio
n
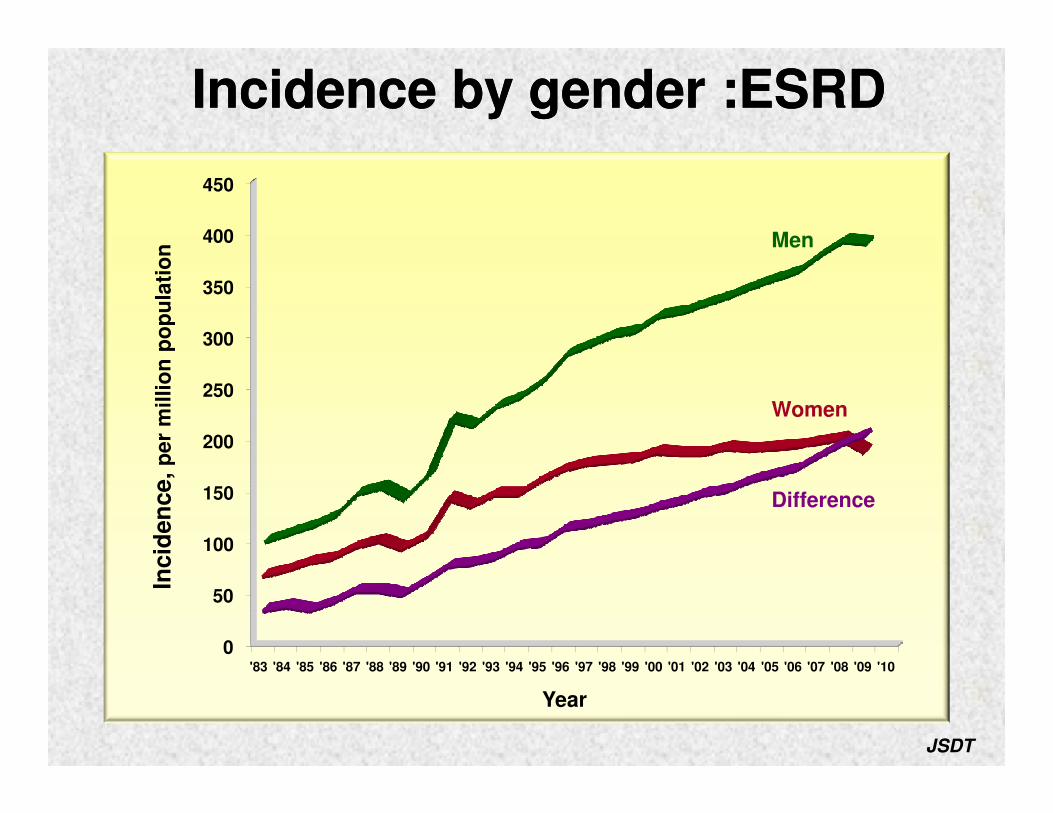
Incidence by gender :ESRDIncidence by gender :ESRD
Men
Women250
300
350
400
450In
cid
en
ce,
per
millio
n p
op
ula
tio
n
JSDT
Women
Difference
0
50
100
150
200
'83 '84 '85 '86 '87 '88 '89 '90 '91 '92 '93 '94 '95 '96 '97 '98 '99 '00 '01 '02 '03 '04 '05 '06 '07 '08 '09 '10
Year
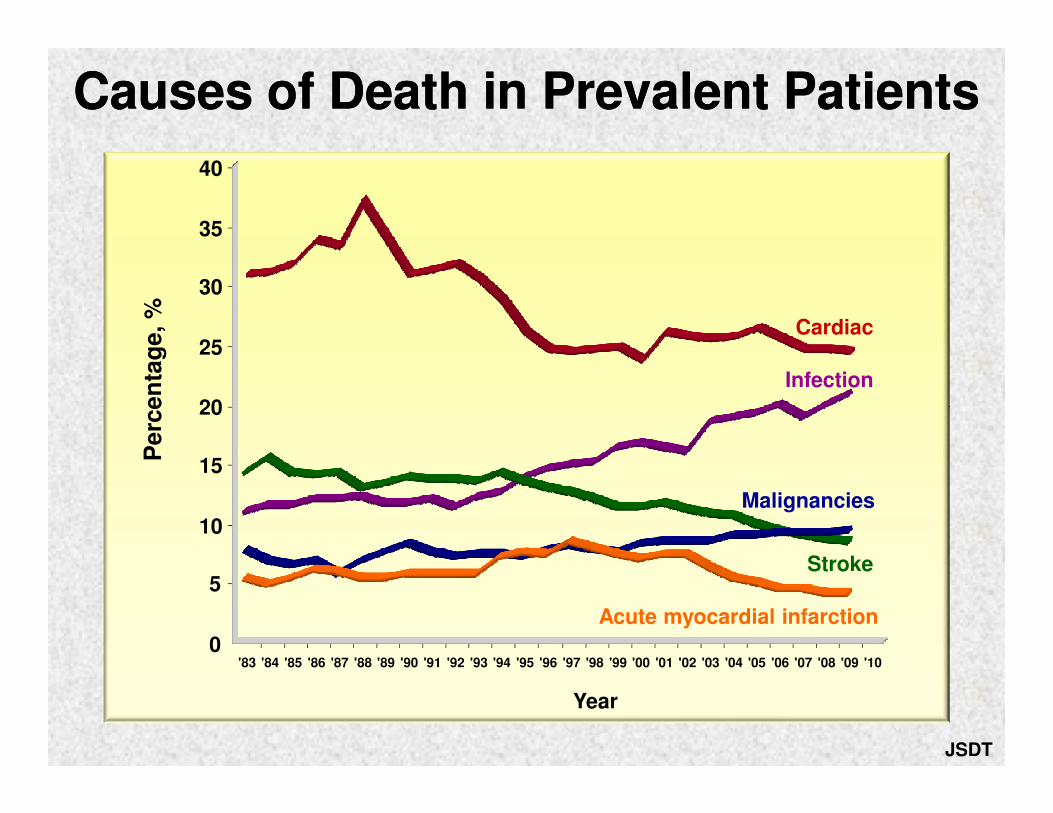
Causes of Death in Prevalent PatientsCauses of Death in Prevalent PatientsP
erc
en
tag
e,
%
Cardiac
Infection
20
25
30
35
40
JSDT
Year
Perc
en
tag
e,
%
Stroke
Malignancies
Acute myocardial infarction
0
5
10
15
20
'83 '84 '85 '86 '87 '88 '89 '90 '91 '92 '93 '94 '95 '96 '97 '98 '99 '00 '01 '02 '03 '04 '05 '06 '07 '08 '09 '10
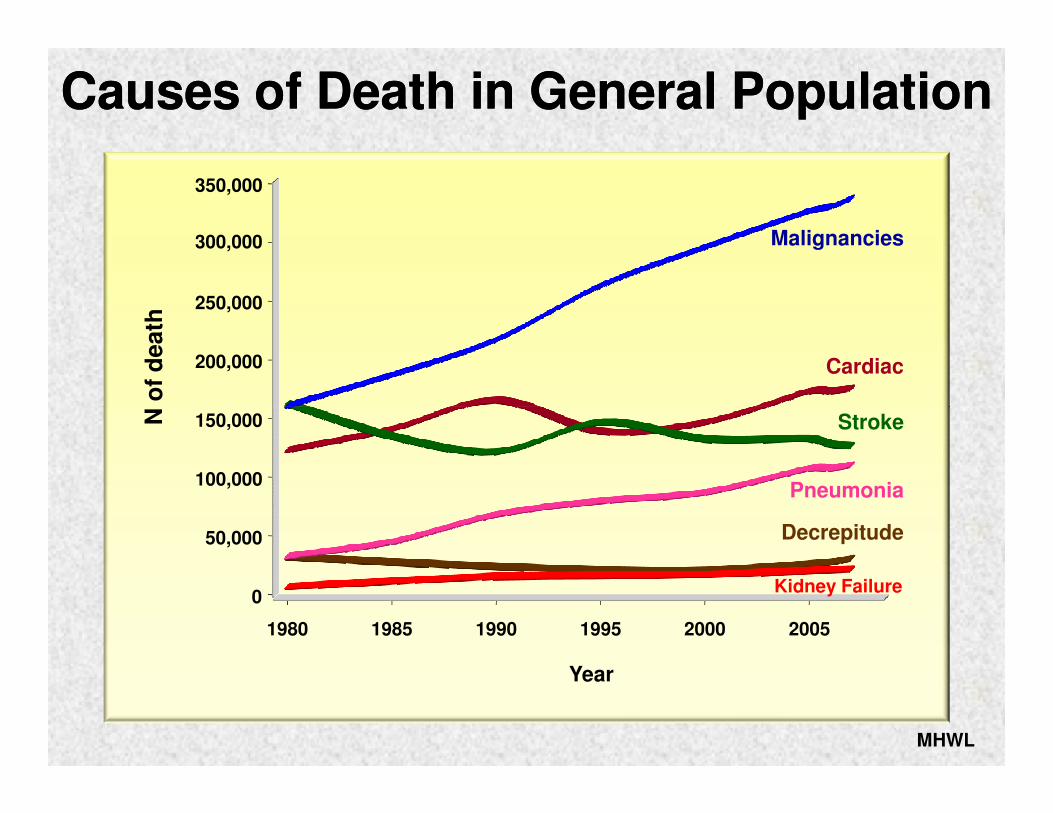
Causes of Death in General PopulationCauses of Death in General PopulationN
of
death
Cardiac
Malignancies
200,000
250,000
300,000
350,000
Year
N o
f d
eath
Stroke
0
50,000
100,000
150,000
1980 1985 1990 1995 2000 2005
Pneumonia
Kidney Failure
Decrepitude
MHWL
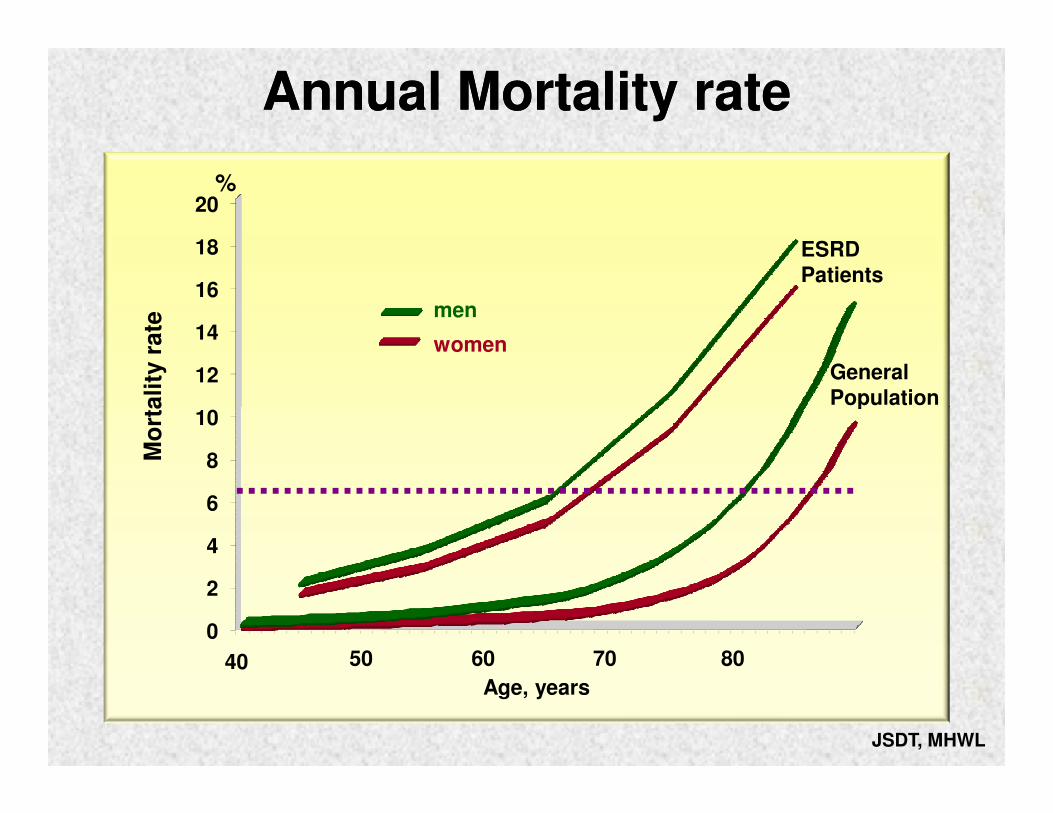
Annual Mortality rateAnnual Mortality rate
%
10
14
16
18
20
women
men
ESRDPatients
General Population
12
Mo
rtali
ty r
ate
0
2
4
6
8
10
40 50 60 70 80
Population
Age, years
Mo
rtali
ty r
ate
JSDT, MHWL
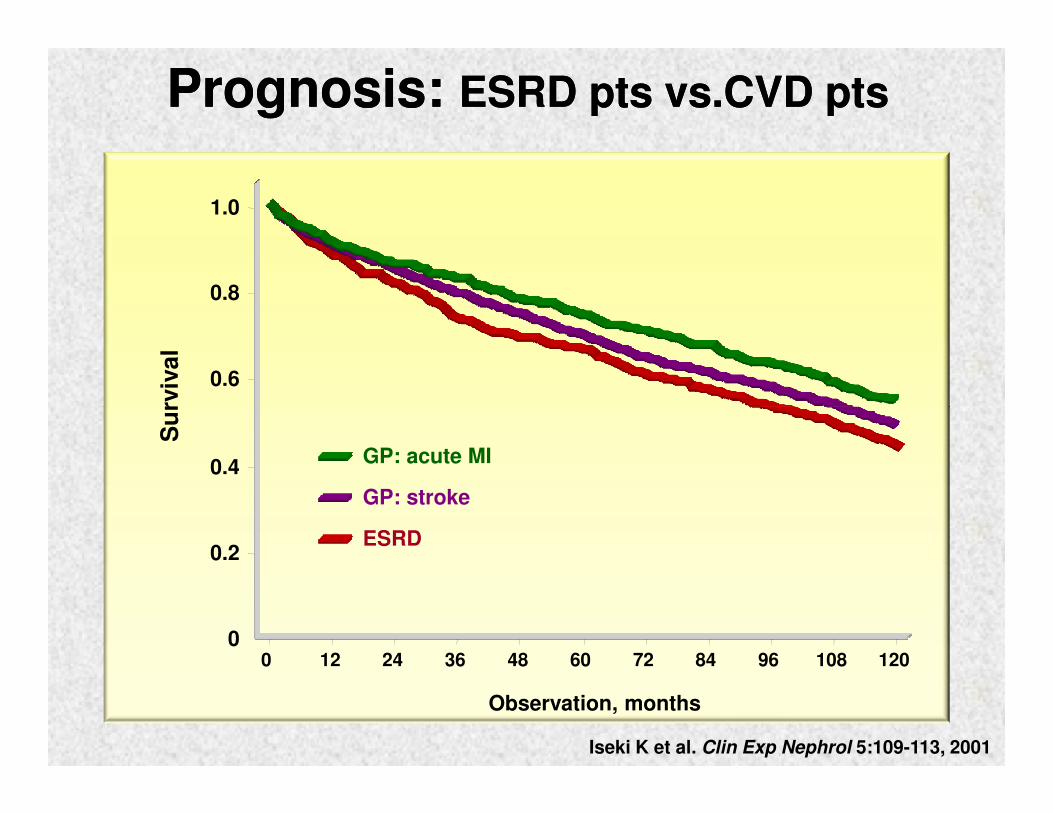
Prognosis: Prognosis: ESRD pts vs.CVD ptsESRD pts vs.CVD pts
Su
rviv
al
0.6
0.8
1.0
Observation, months
Iseki K et al. Clin Exp Nephrol 5:109-113, 2001
Su
rviv
al
0
0.2
0.4
0 12 24 36 48 60 72 84 96 108 120
GP: acute MI
GP: stroke
ESRD
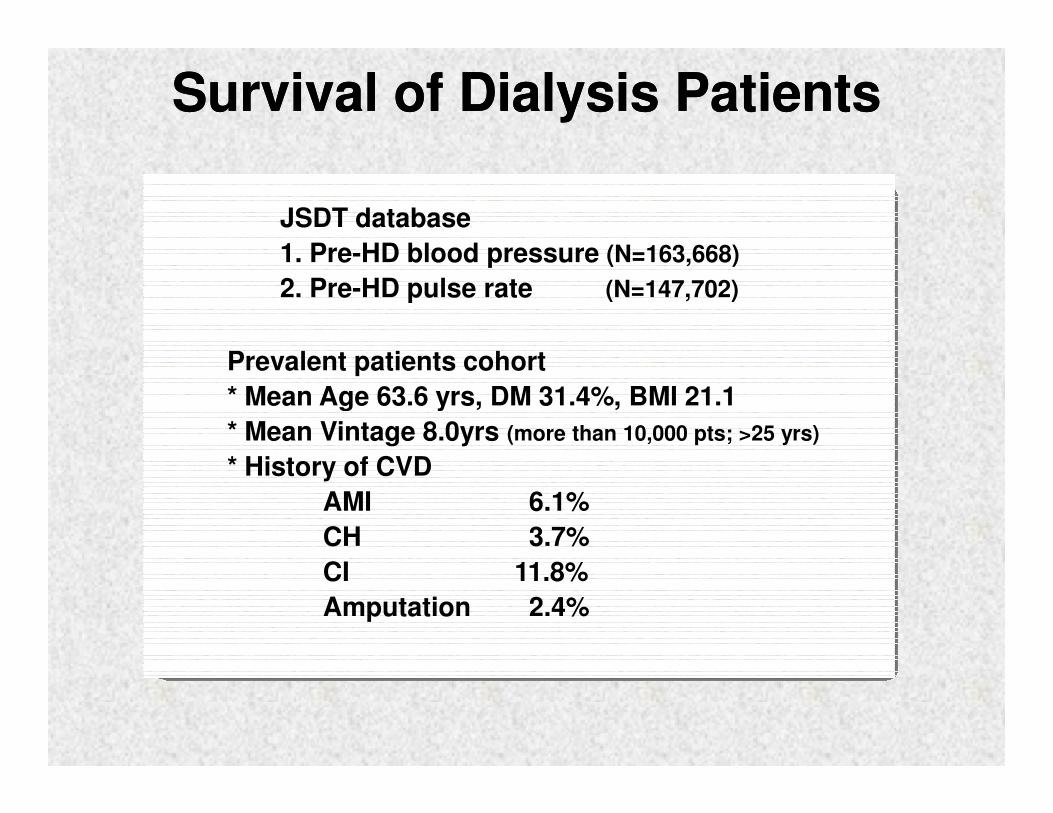
Survival of Dialysis PatientsSurvival of Dialysis Patients
JSDT database
1. Pre-HD blood pressure (N=163,668)
2. Pre-HD pulse rate (N=147,702)
Prevalent patients cohort
* Mean Age 63.6 yrs, DM 31.4%, BMI 21.1* Mean Age 63.6 yrs, DM 31.4%, BMI 21.1
* Mean Vintage 8.0yrs (more than 10,000 pts; >25 yrs)
* History of CVD
AMI 6.1%
CH 3.7%
CI 11.8%
Amputation 2.4%
Ad
juste
d o
dd
s r
ati
o (
95%
CI)
2
3
4
5
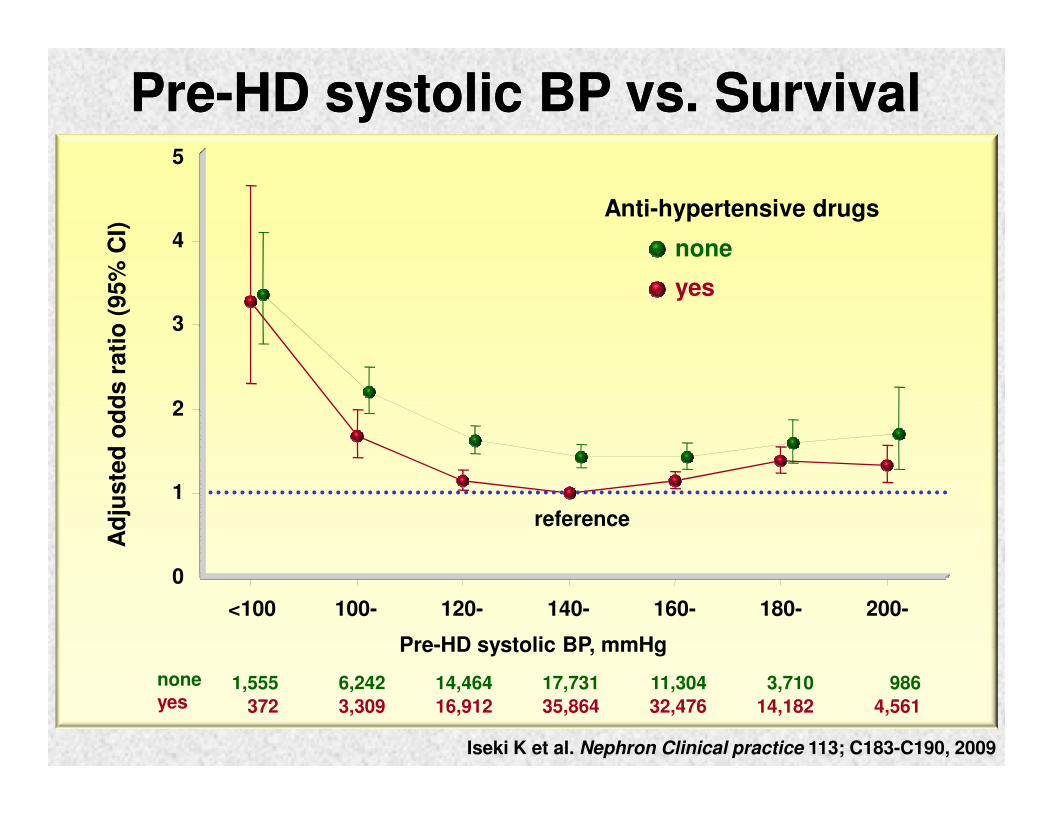
none
yes
Anti-hypertensive drugs
PrePre--HD systolic BP vs. SurvivalHD systolic BP vs. SurvivalA
dju
ste
d o
dd
s r
ati
o (
95%
CI)
<100 100- 120- 140- 160- 180- 200-
Pre-HD systolic BP, mmHg
0
4,56114,18232,47635,86416,9123,309372
9863,71011,30417,73114,4646,2421,555none
yes
1
2
reference
Iseki K et al. Nephron Clinical practice 113; C183-C190, 2009
2
3
Anti-hypertensive drugs
Ad
juste
d o
dd
s r
ati
o (
95%
CI)
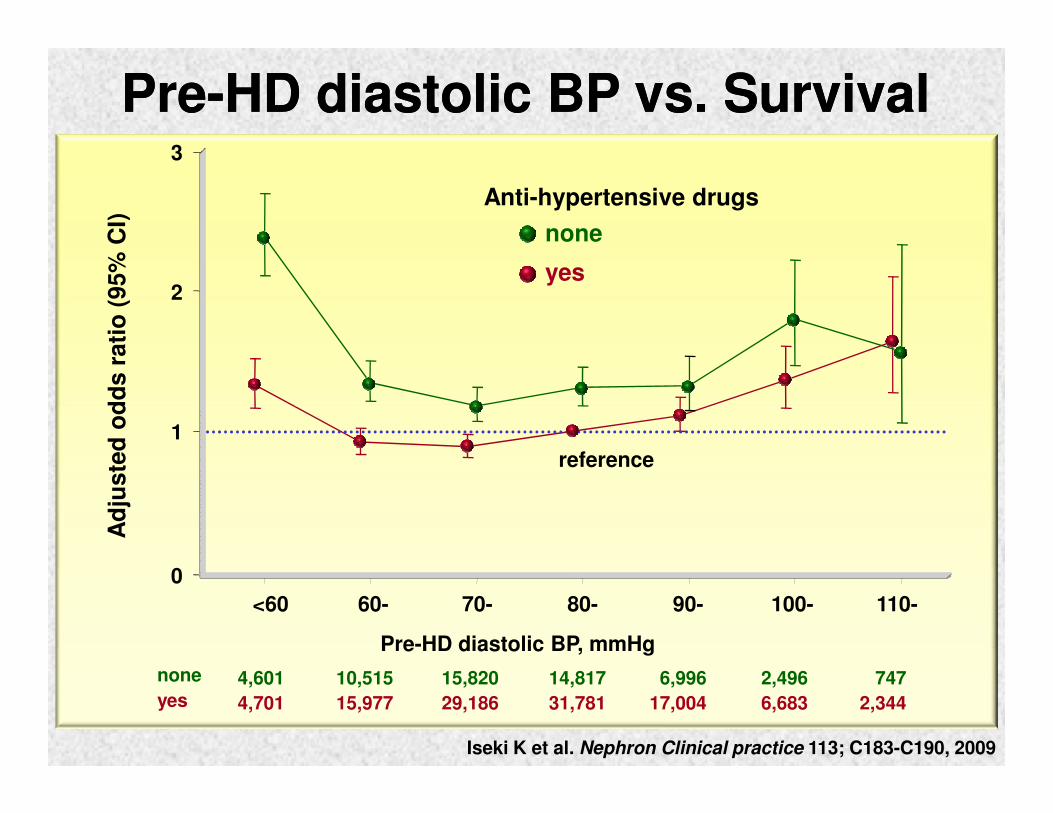
PrePre--HD diastolic BP vs. SurvivalHD diastolic BP vs. Survival
none
yes
Pre-HD diastolic BP, mmHg
<60 60- 70- 80- 90- 100- 110-
2,3446,68317,00431,78129,18615,9774,701
7472,4966,99614,81715,82010,5154,601none
yes
0
1
reference
Ad
juste
d o
dd
s r
ati
o (
95%
CI)
Iseki K et al. Nephron Clinical practice 113; C183-C190, 2009
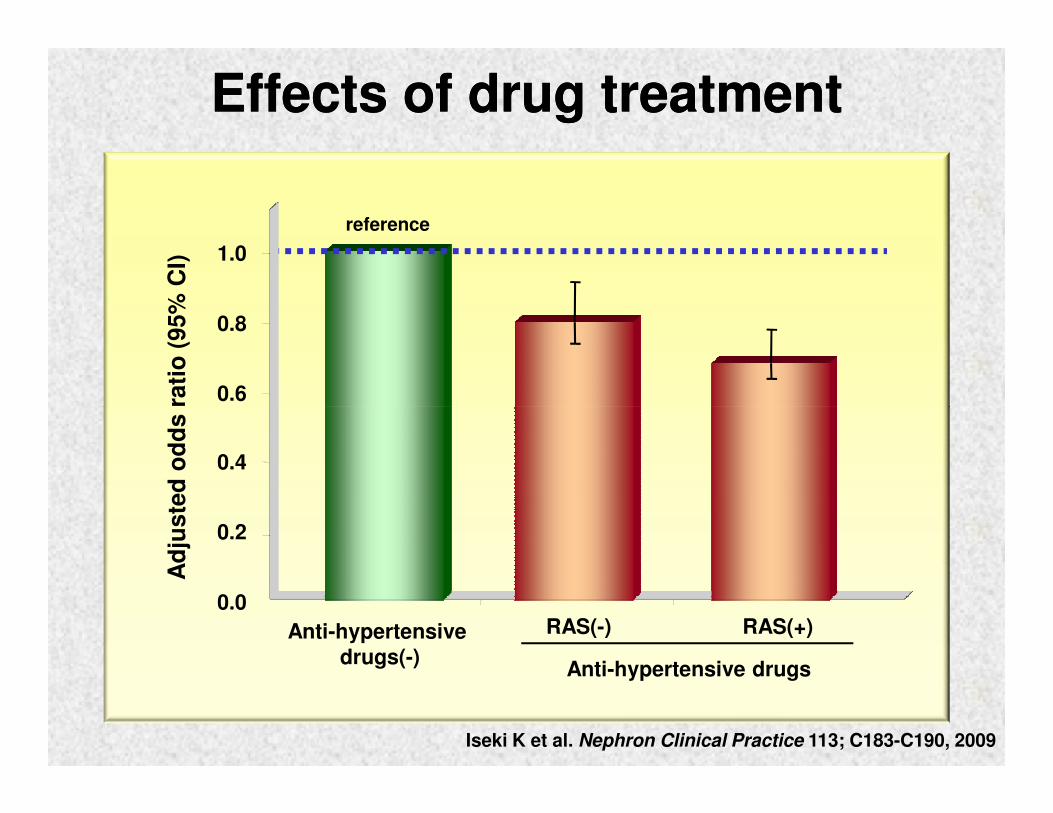
Effects of drug treatmentEffects of drug treatment
0.6
0.8
1.0
reference
Ad
juste
d o
dd
s r
ati
o (
95%
CI)
Iseki K et al. Nephron Clinical Practice 113; C183-C190, 2009
0.0
0.2
0.4
RAS(-) RAS(+)Anti-hypertensivedrugs(-)
Anti-hypertensive drugs
Ad
juste
d o
dd
s r
ati
o (
95%
CI)
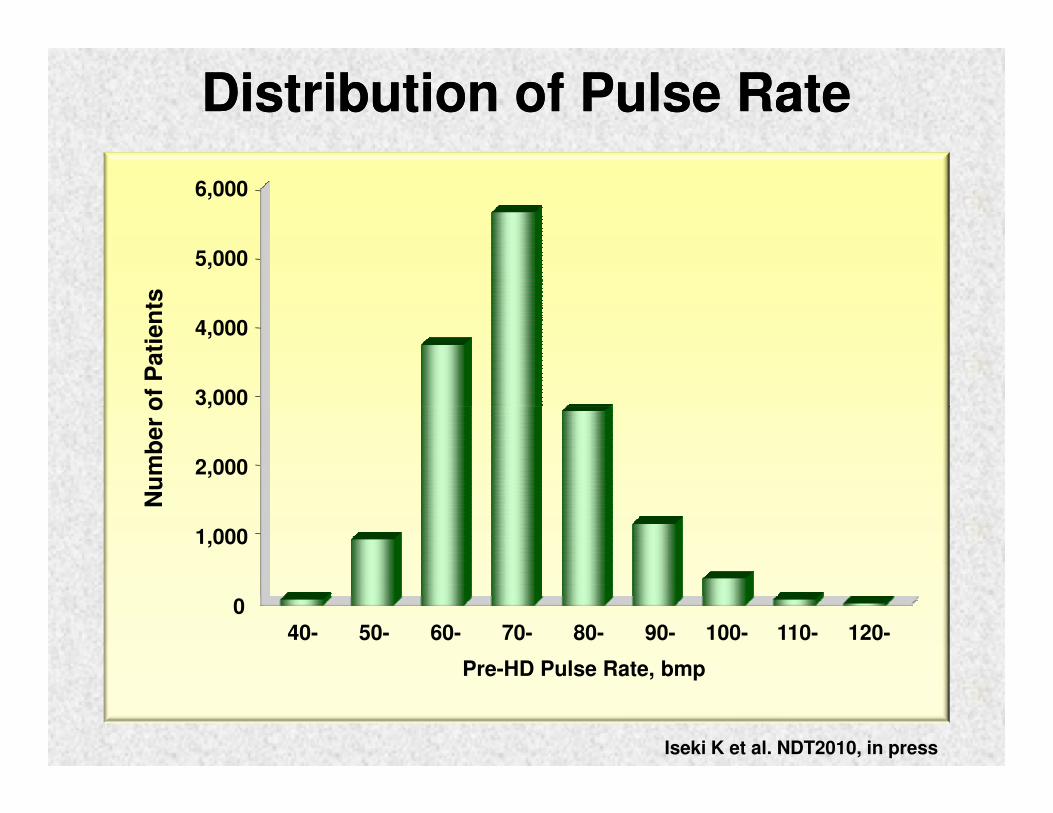
Nu
mb
er
of
Pati
en
ts
Distribution of Pulse RateDistribution of Pulse Rate
3,000
4,000
5,000
6,000
Pre-HD Pulse Rate, bmp
Nu
mb
er
of
Pati
en
ts
2,000
3,000
0
1,000
40- 50- 60- 70- 80- 90- 100- 110- 120-
Iseki K et al. NDT2010, in press
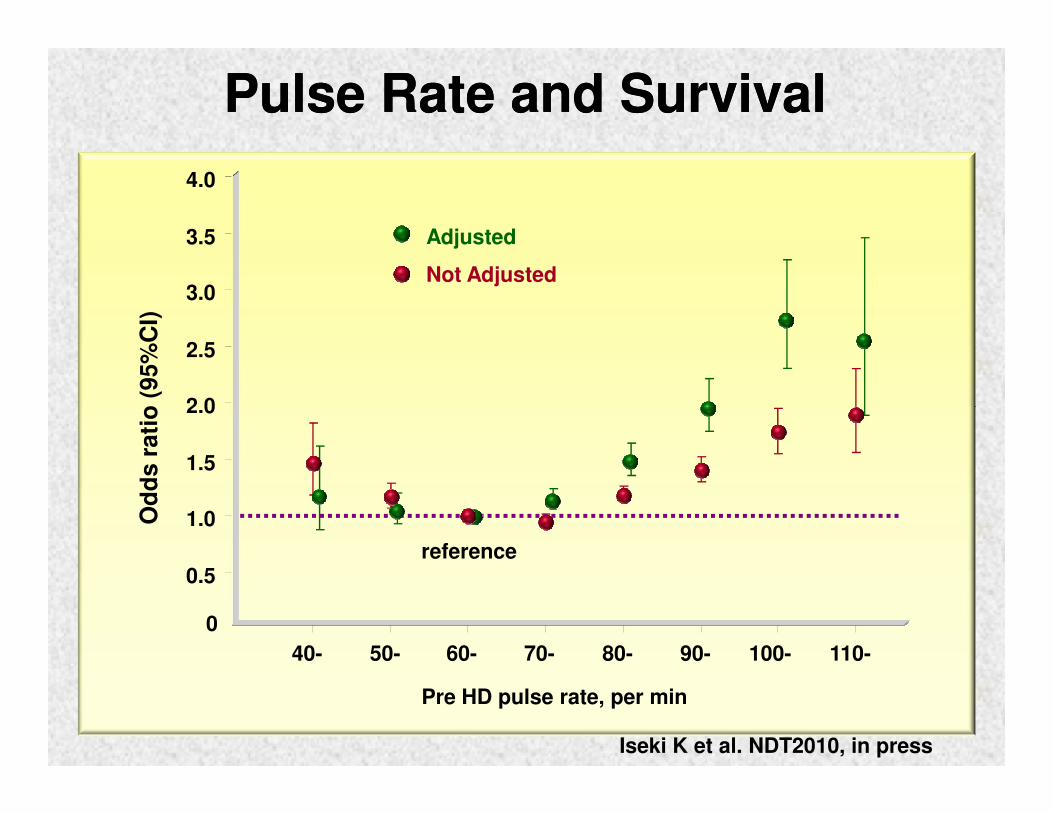
2.0
2.5
3.0
3.5
4.0
Adjusted
Not Adjusted
Od
ds r
ati
o (
95%
CI)
Pulse Rate and SurvivalPulse Rate and Survival
Pre HD pulse rate, per min
0.5
1.0
1.5
2.0
40- 50- 60- 70- 80- 90- 100- 110-
reference
0
Od
ds r
ati
o (
95%
CI)
Iseki K et al. NDT2010, in press

OCTOPUS
Olmesartan Clinical Trial in OkinawanPatients Under OKIDS
Cochran Renal Group
www.cochran-renal.org
CRG010600030
OCTOPUS
Iseki K et al. Clin Exp Nephrol 13; 145-151, 2009
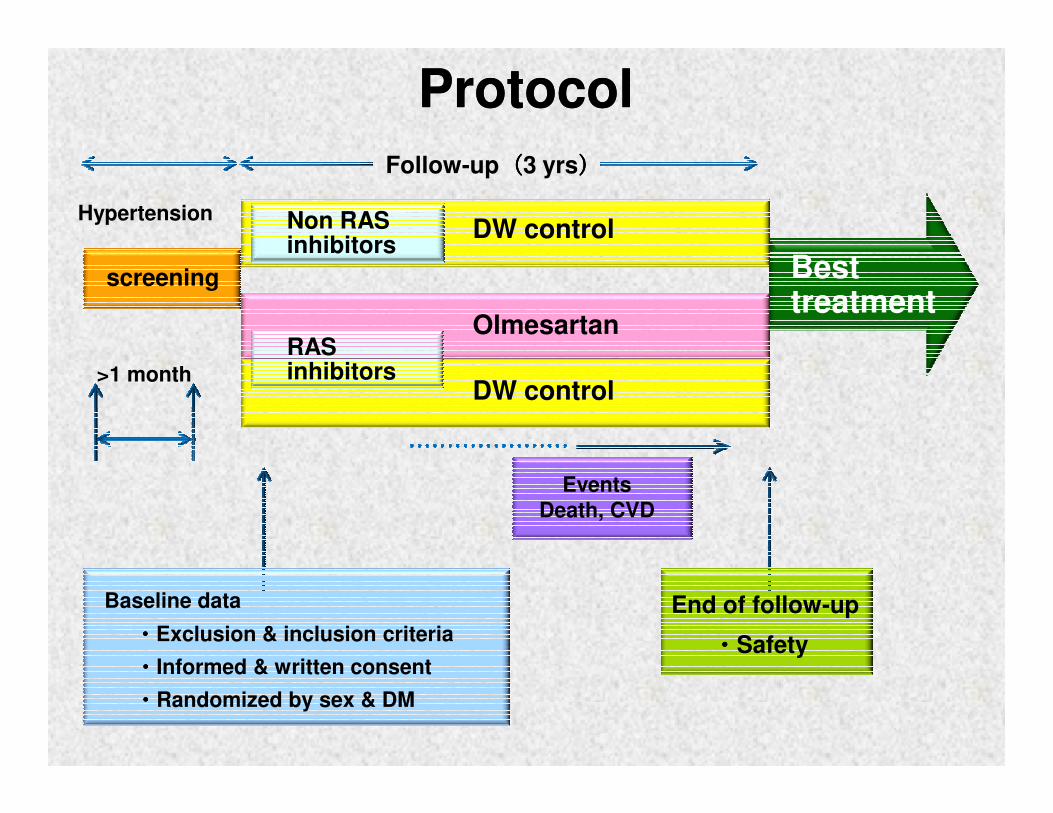
ProtocolProtocol
DW control
Olmesartan
>1 monthDW control
Best treatment
Non RAS inhibitors
RAS inhibitors
Hypertension
screening
Follow-up((((3 yrs))))
Baseline data
・・・・Exclusion & inclusion criteria
・・・・Informed & written consent
・・・・Randomized by sex & DM
End of follow-up
・・・・Safety
EventsDeath, CVD
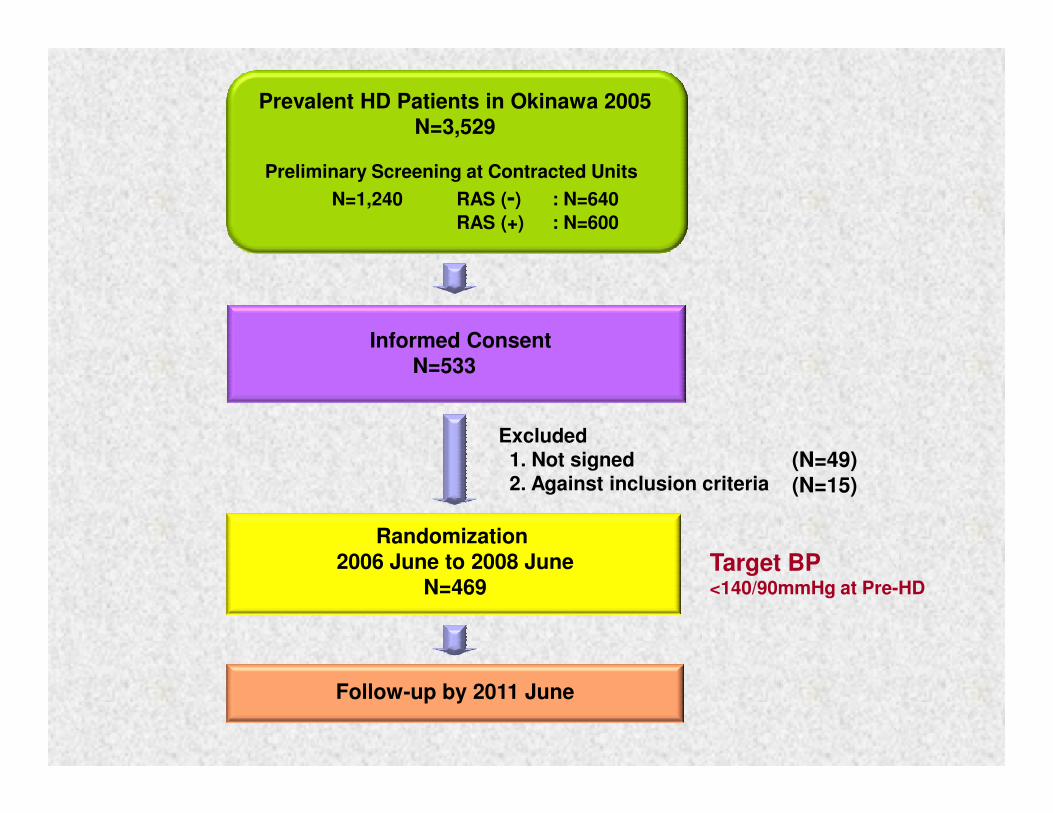
Prevalent HD Patients in Okinawa 2005N=3,529
Preliminary Screening at Contracted Units
N=1,240 RAS (-) : N=640
RAS (+) : N=600
Informed ConsentN=533
Randomization 2006 June to 2008 June
N=469
Follow-up by 2011 June
Excluded1. Not signed2. Against inclusion criteria
(N=49)(N=15)
Target BP<140/90mmHg at Pre-HD
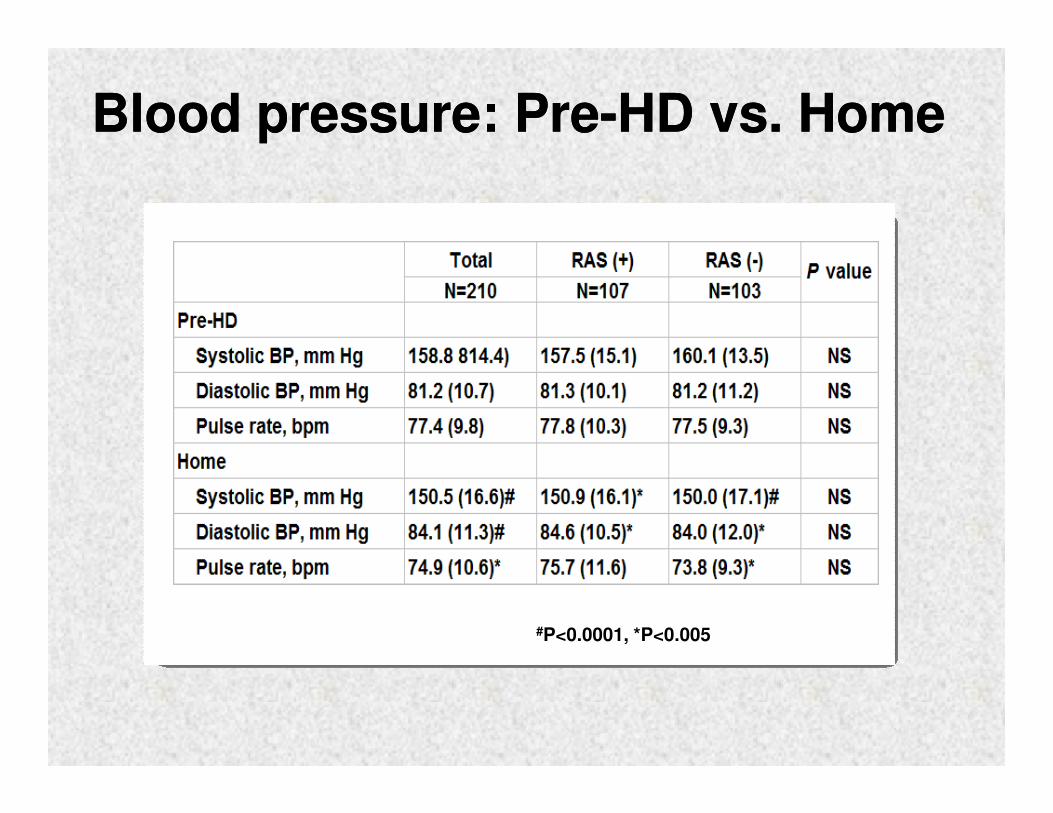
Blood pressure: PreBlood pressure: Pre--HD vs. HomeHD vs. Home
#P<0.0001, *P<0.005
Co-chairs: Kunitoshi Iseki, Vivekanand Jha
WG 2, Pan Asian CKD WG 2, Pan Asian CKD RegistryRegistry
Co-chairs: Kunitoshi Iseki, Vivekanand Jha
Members : Evan Lee, Jafar H Tazeen,
Lynn A Gomez, Randal Faull,
Zaki Morad, T Criang, Chin Ho Jun,
Toshiaki Monkawa, Vlado Perkovic
To provide concrete data of CKD registry on
Aim of the Pan Asian Aim of the Pan Asian RegistryRegistry
To provide concrete data of CKD registry on
prevalence, incidence based on the sources,
collecting method (proteinuria, Albuminuria, eGFR)
• regional difference
• set-up outcome variables
• find unique problems in Asian countries
• What are the key outcomes of CKD?
Questions addressed Questions addressed with the registrywith the registry
• What are the key outcomes of CKD?
Risk of CVD and mortality with CKD;
may be different among Asians
Prevalence of IgA GN;
vary by ethnic background and geographical area
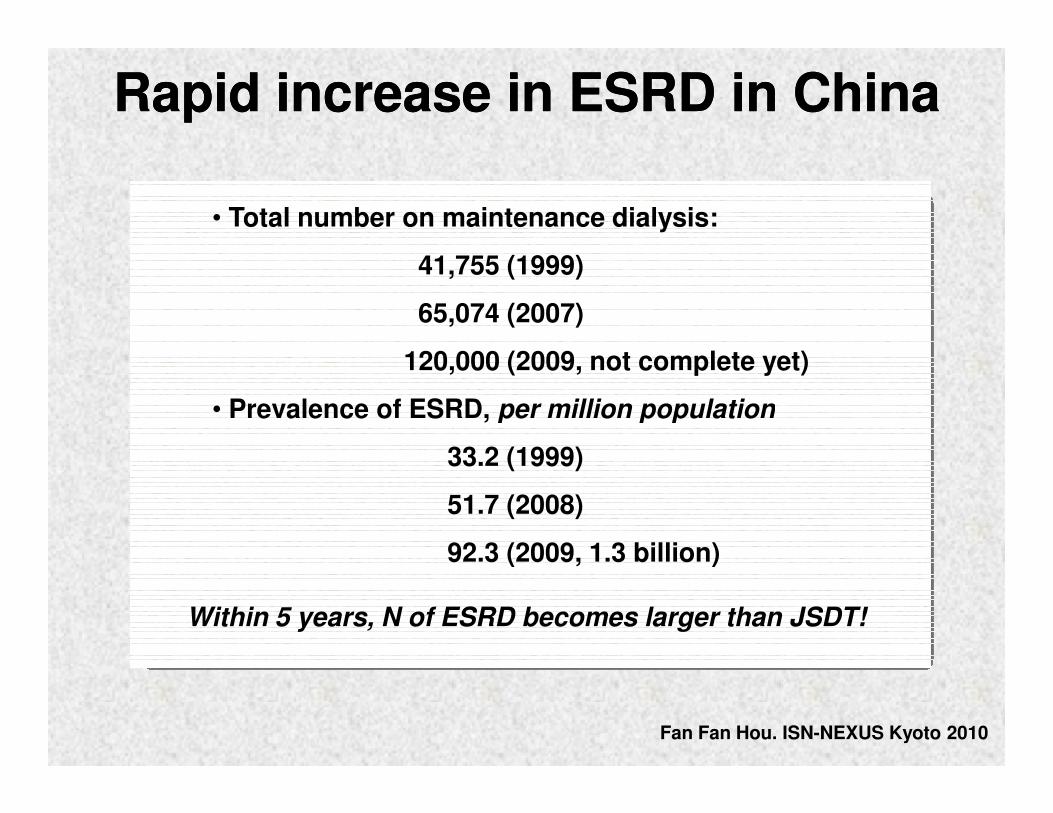
Rapid increase in ESRD in ChinaRapid increase in ESRD in China
• Total number on maintenance dialysis:
41,755 (1999)
65,074 (2007)
120,000 (2009, not complete yet)
• Prevalence of ESRD, per million population• Prevalence of ESRD, per million population
33.2 (1999)
51.7 (2008)
92.3 (2009, 1.3 billion)
Fan Fan Hou. ISN-NEXUS Kyoto 2010
Within 5 years, N of ESRD becomes larger than JSDT!
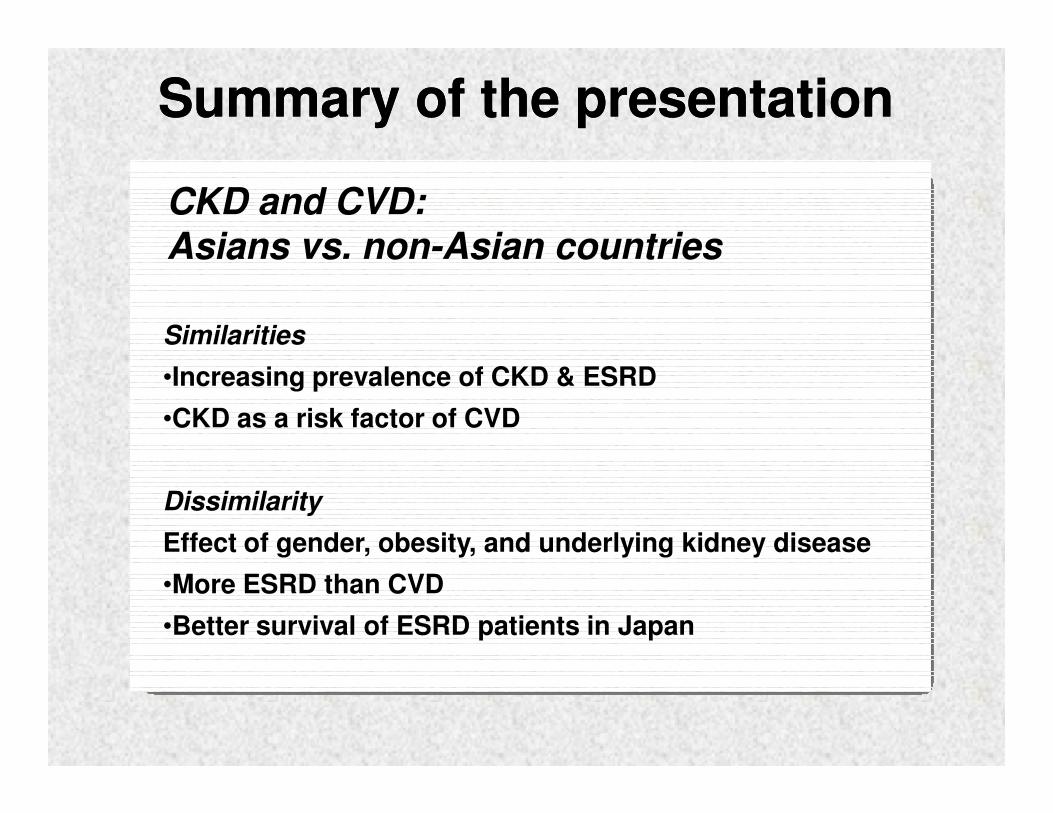
Similarities
•Increasing prevalence of CKD & ESRD
•CKD as a risk factor of CVD
Summary of the presentationSummary of the presentation
CKD and CVD:
Asians vs. non-Asian countries
•CKD as a risk factor of CVD
Dissimilarity
Effect of gender, obesity, and underlying kidney disease
•More ESRD than CVD
•Better survival of ESRD patients in Japan